the Creative Commons Attribution 4.0 License.
the Creative Commons Attribution 4.0 License.
 | 06 Feb 2025
Field intercomparison of ice nucleation measurements: the Fifth International Workshop on Ice Nucleation Phase 3 (FIN-03)
Jessica A. Mirrielees
Sarah Suda Petters
Daniel J. Cziczo
Markus D. Petters
Heinz G. Bingemer
Thomas C. J. Hill
Karl Froyd
Sarvesh Garimella
A. Gannet Hallar
Ezra J. T. Levin
Ian B. McCubbin
Anne E. Perring
Christopher N. Rapp
Thea Schiebel
Jann Schrod
Kaitlyn J. Suski
Daniel Weber
Martin J. Wolf
Maria Zawadowicz
Jake Zenker
Ottmar Möhler
Sarah D. Brooks
The third phase of the Fifth International Ice Nucleation Workshop (FIN-03) was conducted at the Storm Peak Laboratory in Steamboat Springs, Colorado, in September 2015 to facilitate the intercomparison of instruments measuring ice-nucleating particles (INPs) in the field. Instruments included two online and four offline measurement systems for INPs, which are a subset of those utilized in the laboratory study that comprised the second phase of FIN (FIN-02). The composition of the total aerosols was characterized using the Particle Analysis by Laser Mass Spectrometry (PALMS) and Wideband Integrated Bioaerosol Sensor (WIBS) instruments, and aerosol size distributions were measured by a laser aerosol spectrometer (LAS). The dominant total particle compositions present during FIN-03 were composed of sulfates, organic compounds, and nitrates, as well as particles derived from biomass burning. Mineral-dust-containing particles were ubiquitous throughout and represented 67 % of supermicron particles. Total WIBS fluorescing particle concentrations for particles with diameters of > 0.5 µm were 0.04 ± 0.02 cm−3 (0.1 cm−3 highest; 0.02 cm−3 lowest), typical of the warm season in this region and representing ≈ 9 % of all particles in this size range as a campaign average.
The primary focus of FIN-03 was the measurement of INP concentrations via immersion freezing at temperatures > −33 °C. Additionally, some measurements were made in the deposition nucleation regime at these same temperatures, representing one of the first efforts to include both mechanisms within a field campaign. INP concentrations via immersion freezing agreed within factors ranging from nearly 1 to 5 times on average between matched (time and temperature) measurements, and disagreements only rarely exceeded 1 order of magnitude for sampling times coordinated to within 3 h. Comparisons were restricted to temperatures lower than −15 °C due to the limits of detection related to sample volumes and very low INP concentrations. Outliers of up to 2 orders of magnitude occurred between −25 and −18 °C; a better agreement was seen at higher and lower temperatures. Although the 5–10 factor agreement of INP measurements found in FIN-03 aligned with the results of the FIN-02 laboratory comparison phase, giving confidence in progress of this measurement field, this level of agreement still equates to temperature uncertainties of 3.5 to 5 °C that may not be sufficient for numerical cloud modeling applications that utilize INP information.
INP activity in the immersion-freezing mode was generally found to be an order of magnitude or more, making it more efficient than in the deposition regime at 95 %–99 % water relative humidity, although this limited data set should be augmented in future efforts.
To contextualize the study results, an assessment was made of the composition of INPs during the late-summer to early-fall period of this study inferred through comparison to existing ice nucleation parameterizations and through measurement of the influence of thermal and organic carbon digestion treatments on immersion-freezing ice nucleation activity. Consistent with other studies in continental regions, biological INPs dominated at temperatures of > −20 °C and sometimes colder, while arable dust-like or other organic-influenced INPs were inferred to dominate below −20 °C.
- Article
(3470 KB) - Full-text XML
-
Supplement
(13076 KB) - BibTeX
- EndNote


Atmospheric ice nucleation is one of the least certain aerosol–cloud interactions influencing climate (Kanji et al., 2017). Particles that physically catalyze freezing, known as ice-nucleating particles (INPs) (Vali et al., 2015), are found in the atmosphere in concentrations that span many orders of magnitude, ranging from 10−3 L−1 or fewer at −5 °C to 1000 L−1 or greater at −35 °C (Petters and Wright, 2015). INP number concentrations typically increase exponentially with every degree of supercooling below 0 °C. However, chemical composition plays an important role in determining if, and at what temperature, individual particles may serve as INPs (Murray et al., 2012). INPs initiate the formation of ice in cold and mixed-phase clouds and in turn influence their physical and optical properties. An increase in INP concentration over a geographic area may increase the frequency of glaciated clouds at a constant temperature, which, in turn, increases precipitation and decreases cloud lifetime (Lohmann and Feichter, 2005). Nevertheless, INP impacts on clouds simulated in global climate models are highly sensitive to how the aerosol's ability to nucleate ice is parameterized (Boucher et al., 2013). Parameterizations can only be as accurate as the measurements on which they are based (e.g., Knopf et al., 2021).
Measurements of atmospheric INPs remain challenging due to the difficulty representing the physical processes involved in ice nucleation instruments. At temperatures below ≈ −38 °C, micrometer-sized diluted water droplets spontaneously freeze due to homogeneous freezing nucleation. Homogeneous freezing nucleation is well understood and included in most cloud formation models. However, at temperatures between 0 and −38 °C, freezing requires INPs to facilitate nucleation through a heterogeneous nucleation mechanism (Kanji et al., 2017; Murray et al., 2012; Vali, 1985). Nucleation is hypothesized to proceed through (1) immersion freezing, which occurs when an INP embedded within a water droplet enters a cooler environment and nucleates an ice crystal; (2) condensation freezing, which occurs when freezing ensues as an aqueous droplet condenses on the surface of an aerosol particle; (3) contact freezing, which occurs when an aerosol in contact with a water droplet surface initiates freezing (Durant and Shaw, 2005; Fornea et al., 2009); and (4) deposition nucleation, which is thought to occur through the direct deposition of water vapor on an INP surface. Of these mechanisms, immersion-freezing nucleation is thought to be the most active heterogeneous nucleation process in the atmosphere, though there is considerable disagreement in the literature about the relative importance of other mechanisms (Kanji et al., 2017; Ullrich et al., 2017). When the ambient humidity is below water saturation, nucleation can occur via the deposition of water from the vapor phase. In some cases, this behavior may be ascribable instead to water condensation in pores and cavities in aerosols facilitating freezing through a non-deposition mechanism (Marcolli, 2014; Wagner et al., 2016). However, this process is unlikely to be of importance at temperatures of > −38 °C (David et al., 2020), which are the focus of this study. We will thus refer to ice nucleation at > −38 °C and below water saturation as happening within the “deposition regime”. The study of the efficiency of the deposition nucleation process in comparison to immersion freezing has been limited for natural INPs.
Ice nucleation measurements have been made with instruments designed and built by individual scientists and more recently with commercial instruments. The ice nucleation community has a history of collaborating to address instrument performance and inconsistencies through participating in instrument intercomparisons in which the custom-built instruments were operated side by side to evaluate the instrument response to the same aerosol populations. Ice nucleation workshops have a history dating back to 1967, with repetitions occurring in 1970, 1976, and 2007 (DeMott et al., 2011). These exercises were repeated; however, this was not due to a difference in goals but due to the development and improvement of new ice nucleation instrumentation and a focus on a better characterization of heterogeneous ice nucleation processes. An additional factor that has motivated formal and informal instrument intercomparisons is the growing recognition of the importance of having coordinated detailed aerosol characterizations and better instruments to provide that information (e.g., Coluzza et al., 2017; DeMott et al., 2011, 2018; Knopf et al., 2021; Brasseur et al., 2022; Lacher et al., 2024). To compare concentrations and compositions of INPs, a three-part workshop series, the Fifth International Ice Nucleation Workshop, or FIN was held in 2014–2015. The first two phases were held at the Karlsruhe Institute of Technology's Aerosol Interaction and Dynamics in the Atmosphere (AIDA) facility. FIN-01 focused on the determination of the composition of INPs by mass spectroscopy (Shen et al., 2024), while FIN-02 entailed a laboratory ice nucleation instrument comparison (DeMott et al., 2018). FIN-03, the mountaintop field intercomparison of ice nucleation instruments is the focus of this work. While laboratory experiments can easily provide broad concentration ranges of particles of specific types for testing, and measurements in the ambient atmosphere are the ultimate application of INP measuring systems, the ambient atmosphere presents the most challenging measurement scenario due to INP concentrations that are sometimes very low and a host of potential INP source compositions.
Ice nucleation measurements have experienced a renaissance in the past decade, resulting in a proliferation of both the number of custom-built instruments and a diversification of the measurement techniques employed (Zenker et al., 2017; DeMott et al., 2018, Möhler et al., 2021). Participation in FIN-02 was twice that of the previous formal international workshop intercomparison (the International Workshop on Comparing Ice Nucleation Measuring Systems or ICS-2007) held at the (AIDA) facility in 2007 (Jones et al., 2011; Kanji et al., 2011). During FIN-02, online and offline instruments sampling the same population of aerosolized particles reported INP concentrations that generally agreed within 1 order of magnitude across a broad temperature range. Agreement was best in tests of immersion freezing on soils, dust, and bacteria but spanned up to 2 orders of magnitude (or 3 °C in temperature for the same active site density) for illite NX and K-feldspar (DeMott et al., 2018). While relatively good agreement in the laboratory between different measurement methods during FIN-02 represented significant progress for the atmospheric ice nucleation community, intercomparisons in ambient atmospheric settings are more difficult due to lower typical INP concentrations (Lacher et al., 2018) and variations in the chemistry and size of source aerosol and INPs (DeMott et al., 2017; Knopf et al., 2021; Lacher et al., 2024; Brasseur et al., 2022).
To evaluate how a suite of instruments operating collectively performs under the greater measurement challenges of the field setting, FIN-03 was conducted from 12 to 28 September 2015 at the Storm Peak Laboratory (SPL) in Steamboat Springs, CO, USA (elevation of 3220 m m.s.l., mean sea level). Unlike the closure studies of Knopf et al. (2021) and the similar comparative sampling studies of Lacher et al. (2024), both of which occurred in regions surrounded by agricultural activities and possible nearby urban influences, or the study of Brasseur et al. (2022) that was focused on a boreal forest, this remote continental mountaintop site provided the opportunity to sample regional and long-range INP sources within the boundary layer and free troposphere. The site is typically in the free troposphere during the nighttime and early morning and in the boundary layer from the late morning to early evening, although the topography and wind direction influence this timing (Collaud Coen et al., 2018). When in the free troposphere, the site is more likely to reflect influences by the regional or long-range transport of aerosols. For example, during FIN-03, a variety of air masses were sampled and sensed by aerosol instruments, including ones passing over phosphate mines in Idaho (on 18 and 20 September) and mined deposits of rare-earth metals at Mountain Pass, CA (on 27 September) (Zawadowicz et al., 2017). When the convective boundary layer height reaches the elevation of the laboratory, the site is likely to be more impacted by local/regional aerosol sources. Additionally, meteorological transitions can occur (e.g., frontal boundary passage and wind direction shifts), driving changes in aerosol sources that may indirectly occur in response to those changes (e.g., biological aerosols, carbonaceous particles from biomass burning, and mineral/soil dust). While the constantly fluctuating environmental conditions during FIN-03 added an additional challenge to the intercomparison, they also provided a realistic setting for atmospheric INP measurements. In addition to adding challenges, conducting the intercomparison in the presence of complex aerosols in the field provided the opportunity to survey the instrument response to various particle sources.
Participation in FIN-03 included online continuous flow diffusion chambers (CFDCs) and aerosol collections for offline INP measurements, representing a subset of the instruments that operated in FIN-02 (DeMott et al., 2018). Online instruments have the advantage that the aerosol being evaluated as INPs remains free-floating and unaltered, never touching a substrate or requiring the shipment of samples to a laboratory. Online techniques can also monitor INP concentration changes occurring over short timescales. Nevertheless, they are limited in the thermodynamic conditions that can be represented over a given time frame, and they are limited by volume sampling rates in assessing the low concentrations of INPs at modest supercooling. Offline techniques, i.e., those in which samples are collected in the field and subsequently processed in the laboratory, provide the opportunity to capture large sample volumes (albeit over longer timescales) and consequently assess a wider temperature range of INP activation properties.
Since aerosol physical and chemical properties strongly influence their ability to activate as INPs (Hoose and Möhler, 2012; Kanji et al., 2017; Murray et al., 2012), measurements of particle sizes and composition (see Sect. 2) were included to lend context to the variable composition of aerosols and evaluate their potential role in ice nucleation activity. Rather than use these data for attempting closure, FIN-03 focused on using data to constrain existing parameterizations to diagnose INP compositions during the study period. Also, in contrast to other recent studies, special effort was made to characterize deposition nucleation activity in addition to immersion freezing.
2.1 Aerosol property measurements
Measurements of aerosol physical, chemical, and biological particle properties were made during FIN-03 to provide context to INP measurements. Sampling manifolds, which draw air into SPL from outdoors at high flow, are as follows: inlets were located in each of the two wings of the SPL that frame the living area, referred to as the “instrument” laboratory (facing north) and the “chemistry” laboratory (facing south). The “original” inlet system in the instrument laboratory (Hallar et al., 2011; Petersen et al., 2019) feeds a nephelometer (see below) and a standard suite of aerosol instruments (not operational for FIN-03). This 15 cm diameter aluminum inlet rises 4 m above the roofline. At ≈ 1 m inside the laboratory, it transitions to a 15 cm horizontal manifold. With a flow of ≈ 500 L min−1, aerosol transmission calculations have characterized the system to have a 50 % upper-particle-size cut-off at an aerodynamic diameter of 5 µm (Hallar et al., 2011). The “new” inlet system consists of two identical stainless-steel, turbulent flow, and ground-based inlets described by Petersen et al. (2019), which are straight and enter the laboratory vertically. One is in the SPL instrument laboratory, and one is in the chemistry laboratory. These inlets extend 10 m above the laboratory roof and have been demonstrated to have 50 % upper-particle-size cut-offs at an aerodynamic diameter of approximately 13 µm for a wind speed of 0.5 m s−1. Additional computational fluid dynamics simulations suggest that this size cut-off remains above 5 µm, even for exterior wind speeds up to 15 m s−1 (Petersen et al., 2019), which is higher than that achieved at any time during FIN-03 sampling. Little bias was seen in ambient aerosol sampling between the original inlet system and the new turbulent-flow-based inlets based on the metric of total aerosol scattering (Petersen et al., 2019). Flow rates and transfer lines to individual instruments are described after the aerosol property measurements are introduced (see the conclusion of this section).
A laser aerosol spectrometer (LAS; model 3340, TSI Inc., St. Paul, MN, USA) was used to measure the aerosol size distribution over the diameter range of 0.089–10 µm. Aerosols were assumed to be dry, based on the relative humidity always remaining below 30 % when measured from its sample line. The sample was drawn at 0.1 L min−1, and sampling was done from the turbulent-flow inlet system located in the SPL chemistry laboratory, as described further below. Size calibrations were performed using polystyrene latex spheres (PSLs; Duke Scientific). PSL diameters were converted to ammonium-sulfate-equivalent diameters using the Mie theory (Froyd et al., 2019). Particle concentrations are reported as a function of the equivalent ammonium sulfate diameter. Volume and surface area distributions are derived assuming spherical particles. Number concentrations and surface areas, further informed by aerosol composition measurements, allow for a connection to INP concentration predictions, and this information is used herein to diagnostically infer mineral and soil dust influences on INPs during the study. We will particularly reference the parameterizations of Niemand et al. (2012) that link mineral surface area to INP concentrations and of DeMott et al. (2015) that link dust number concentrations at sizes larger than 0.5 µm to INP concentrations.
Measurements using a three-wavelength integrating nephelometer (TSI; model 3563; Shoreview, MN) also provided information on aerosol distributions via their optical properties. This nephelometer is part of the National Oceanic and Atmospheric Administration Federated Aerosol Network (Andrews et al., 2019). The nephelometer splits scattered light into red (700 nm), green (550 nm), and blue (450 nm) wavelengths. Impactors to cut aerosols at aerodynamic sizes below 1 and 10 µm are alternately used upstream of the air flowing into the instrument. The nephelometer sampled within the original inlet in the SPL instrument laboratory. A blunt tap from this original SPL inlet manifold provided air samples to the nephelometer system via 1′′ (2.54 cm) inner diameter conductive tubing.
The Particle Analysis by Laser Mass Spectrometry (PALMS) instrument performed measurements of the composition of 0.2 to 3.0 µm aerosol particles. The PALMS instrument was designed and operated by the National Oceanic and Atmospheric Administration (NOAA), as described in Thomson et al. (2000). Particles are sampled, focused, and accelerated via an aerodynamic lens inlet (Schreiner et al., 2002) before passing into a vacuum chamber, where they successively pass through two continuous-wave-detection laser beams (532 nm Nd:YAG) and scatter light. Vacuum aerodynamic diameter is determined based on the transit time. The detection signal triggers an ArF excimer laser that emits a 193 nm pulse to simultaneously ablate and ionize single particles. The resulting ions are analyzed with a unipolar time-of-flight mass spectrometer, which allows polarity switching during the particle flight, thereby producing positive- or negative-ion mass spectra for individual particles. PALMS spectra are classified into compositional categories, and fractions are averaged over 5 min sample periods. Number, surface area, and mass concentration products for the different particle types are generated by combining the PALMS size-dependent fractional composition data with absolute particle concentrations measured by the LAS instrument (Froyd et al., 2019, 2022). When PALMS compositional concentrations are referenced in the results of FIN-03 aerosol compositions in Sect. 3.2, they have been determined by these methods.
The NOAA Wideband Integrated Bioaerosol Sensor, model 4A (WIBS-4A; Droplet Measurement Technologies, Longmont, CO), was used to detect the fluorescent properties of individual particles and assess the presence of biological particles. Measurements are presumed to characterize dry particles. The WIBS-4A is described in detail elsewhere (Gabey et al., 2010; Kaye et al., 2005; Perring et al., 2015) and is only briefly summarized here. As described in Zawadowicz et al. (2019), the gain for the WIBS-4A used at SPL was set to detect and classify particles between 0.4 and 10 µm. First, the optical diameter of particles entering the detection cavity is determined by light scattered during transit through a 635 nm laser beam. This signal triggers the sequential firing of two xenon flash lamps filtered to produce narrow excitation wavebands centered at 280 and 370 nm. The resulting fluorescence is detected by two wideband photomultiplier detectors observing 310–400 and 420–650 nm. Fluorescing particles were categorized according to the intensity of the signal in each of the three channels (channel A excitation at 280 nm, emission at 310–400 nm; channel B excitation at 280 nm, emission at 420–650 nm; channel C excitation at 370 nm, emission at 420–650 nm). Particles for which the measured emission intensity in only one channel met the threshold (such that the signal intensity exceeded the value equal to 3 standard deviations above the mean) were assigned Type A, B, or C, and particles for which the measured emission intensity in two or more channels met the threshold were assigned types AB, AC, BC, or ABC (Perring et al., 2015). The interpretation of particle composition according to the seven WIBS-4A channels is not straightforward, as many fluorophores are active in each channel, including non-biological components (Perring et al., 2015; Pöhlker et al., 2012). Channel A fluorophores include biological components such as tryptophan and phenylalanine, as well as nonbiological components which interfere with the determination of biological content, including polycyclic aromatic hydrocarbons (PAHs) (pyrene, naphthalene, and phenanthrene). Biological fluorophores, which produce a signal in channel C, include the reduced form of nicotinamide adenine dinucleotide (NADH), nicotinamide adenine dinucleotide phosphate (NADPH), and riboflavin, and the potential non-biological interference in channel C may result from the presence of humic acid in aerosol particles. Channel B fluorophores are not generally considered to be biological in nature, though riboflavin and dry cellulose both produce signals in this channel.
We report WIBS-4A channel data herein under these noted caveats and further utilize these data to explore links to immersion-freezing biological INP concentrations, as has been done in some previous efforts. Tobo et al. (2013) previously reported relations of biological INPs acting in the immersion-freezing mode (measured by the Colorado State University (CSU) CFDC) to fluorescent biological aerosol particles (FBAPs) at sizes of > 0.5 µm measured in the understory of a ponderosa pine forest in Colorado. In that work, an ultraviolet aerodynamic particle sizer (UV-APS) with an excitation wavelength at 355 nm and emission wavelengths of 420–575 nm was used as a reference for FBAP concentrations. Due to differences between excitation and emission wavelengths, UV-APS measurements correspond most closely with type C particles detected by the WIBS-4A (Healy et al., 2014). Consequently, a conservative or “low” estimate of FBAPs for use in the parameterization of Tobo et al. (2013) that we employ herein uses the sum of C, AC, BC, and ABC particles. A “high” estimate of FBAPs for this parameterization has also been used by Twohy et al. (2016) for considering all non-B-only particles (A, AB, ABC, AC, BC, and C). We will use both definitions in our presented results and partly justify the higher estimate because the CSU-CFDC assuredly does not capture all biological INPs due to the use of the upstream impactor (see below). A final class of particles defined by WIBS-4A data for the relation to immersion-freezing INPs is denoted as FP3 particles (Wright et al., 2014). FP3 particles are particles that show strong emission in the 310 to 400 nm spectral band when excited by 280 nm light (A type) but are only weakly represented as B and C types. A threshold of 1900 arbitrary fluorescence units in the 310 to 400 nm band is used to denote FP3 particles (Wright et al., 2014). FP3 particles have been connected to immersion-freezing INP concentrations in multiple environments (Wright et al., 2014; Suski et al., 2018; Cornwell et al., 2023).
Flow rates and transfer lines to each instrument are summarized as follows. The PALMS, LAS, and WIBS-4A sampled from the SPL turbulent-flow inlet stack at 0.75, 0.1, and 0.3 vlpm (volumetric liters per minute), respectively, via a common 0.19′′ (0.4826 cm) inner diameter aluminum tube. The total flow was held at 1.2 vlpm, using a variable dump flow, and the line was split into multiple 0.115′′ (0.2921 cm) outer diameter stainless-steel tubing sections connecting to each instrument. All tubing junctions employed Y splitters, and all reducing fittings were internally beveled to prevent impaction losses. Sample lines were not actively dried, but relative humidity was < 30 % in LAS and WIBS-4A. For the LAS instrument, the theoretical transmission of the inlet system was 98 %, 84 %, and 57 % for 1, 3, and 5 µm aerodynamic diameter particles, respectively, with gravitational settling being the dominant loss process. Transmission to WIBS-4A for the same sizes was 99 %, 90 %, and 76 %. Size distributions were not corrected for transmission losses.
2.2 INP measurement methods
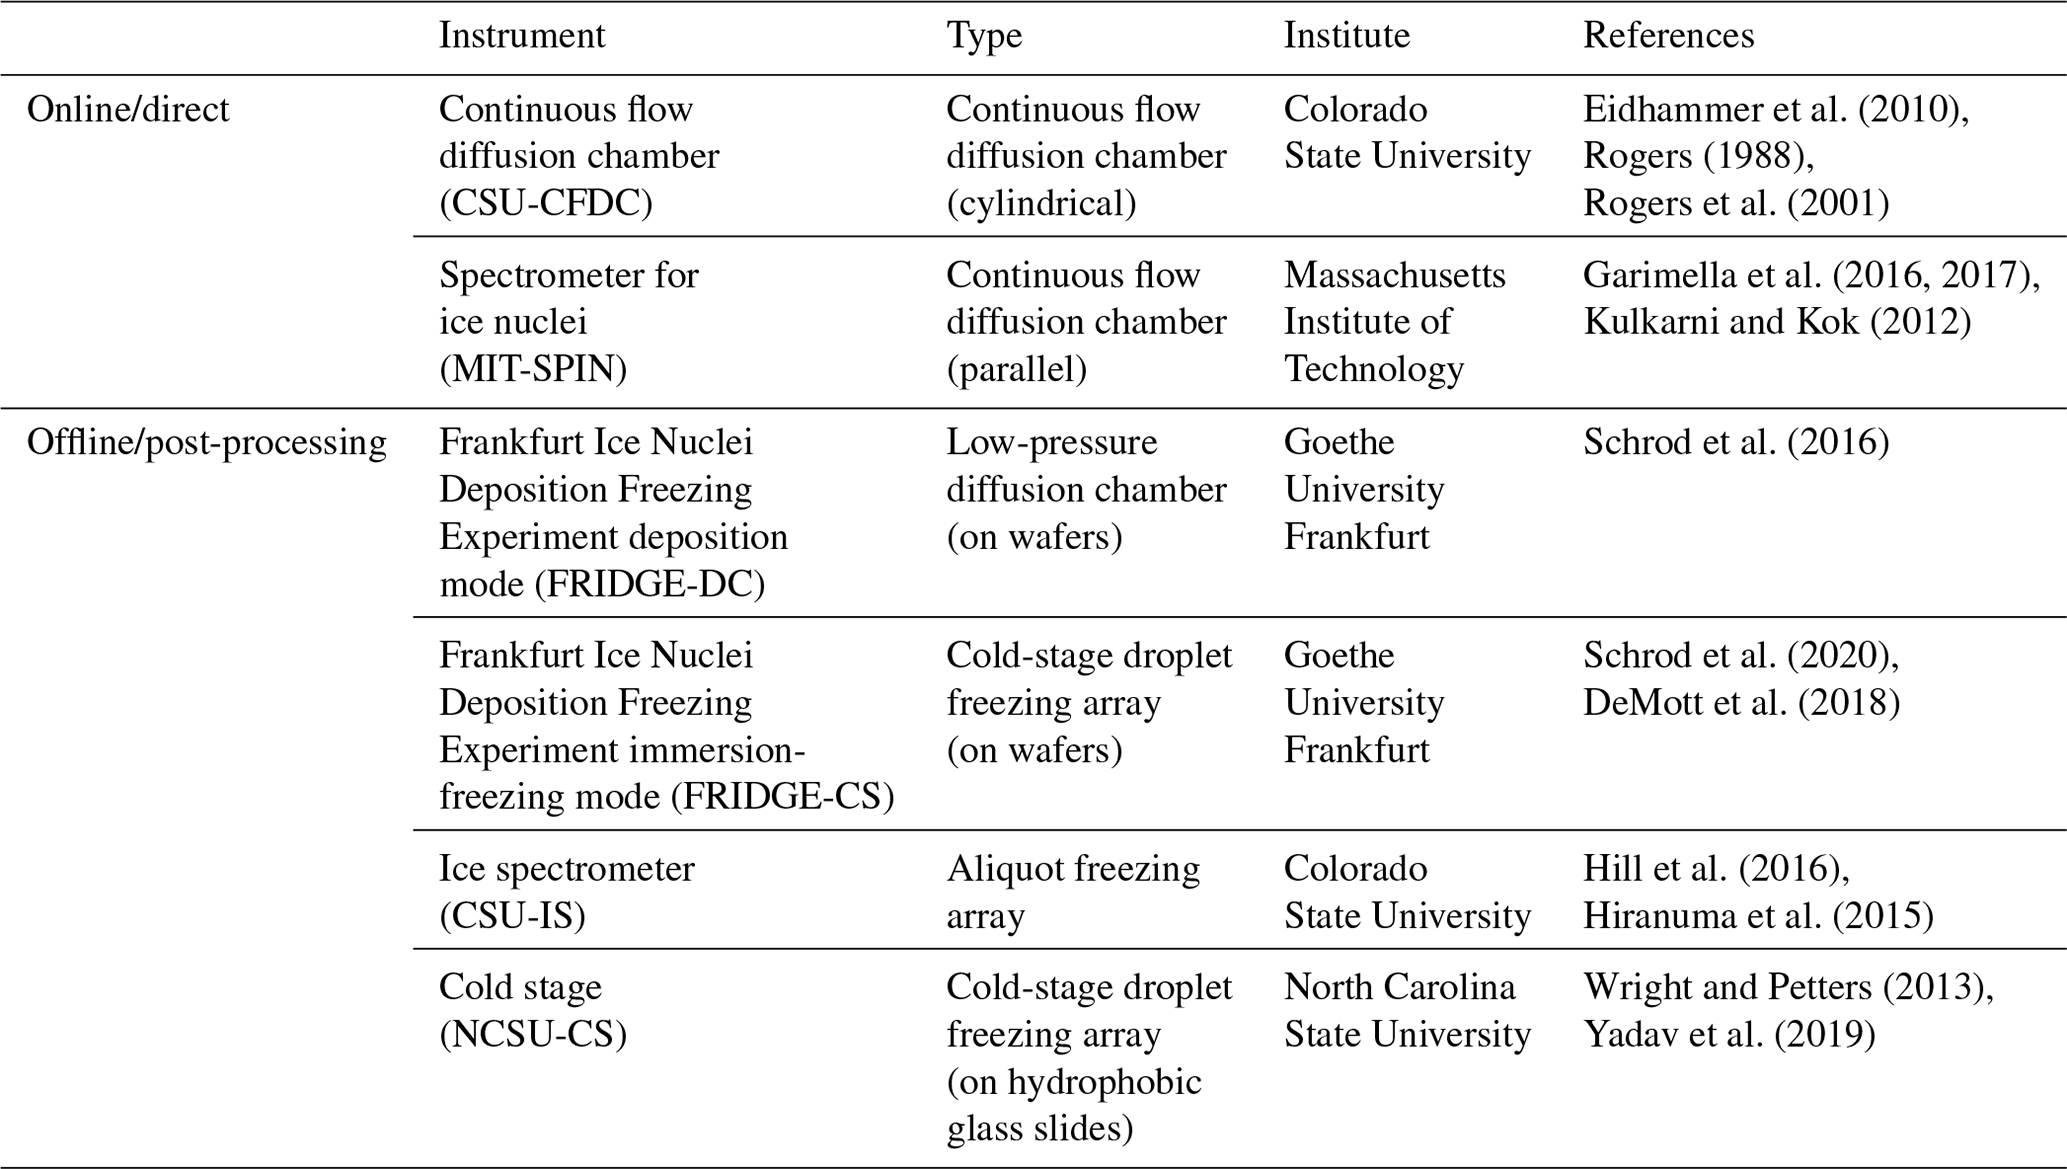
All specific instruments used in FIN-03 were also used in the FIN-02 laboratory campaign. A summary listing of all ice nucleation instruments utilized in FIN-03 is provided in Table 1. Detailed operating principles, the siting of samplers (rooftop versus within SPL), and experimental methods for each instrument follow below. In this work, we will refer to the FIN-03 “intercomparison period” to define the times that all INP instruments co-sampled air with substantial temporal overlap for direct comparison. This means that on a given day, a sample was fully collected within the comparison time unit of 3 h (informed by aerosol data, as discussed later) or overlapped the comparison period if the collection time was somewhat longer. Other times of sampling by the different instrument groups were devoted to special science investigations only partly covered herein.
2.2.1 Online INP measurements
Two online instruments participated in intercomparison experiments in FIN-03. We describe the basic design and operating principles and procedures, sampling inlets, measurement uncertainties and correction for false counting issues, and any special studies reported herein for the CFDC instruments from CSU and the Massachusetts Institute of Technology (MIT). A third CFDC from Texas A&M University was used primarily for special studies to develop the depolarization detection of ice, as already reported (Zenker et al., 2017).
The CSU-CFDC
This online INP instrument has the most established history as an online technique for activating and counting INPs. The CSU-CFDC operating principles are described in prior works (Rogers, 1988; Rogers et al., 2001; Eidhammer et al., 2010). Application and considerations for interpreting data have been described by DeMott et al. (2018). The CSU-CFDC is composed of nested cylindrical copper walls that are chemically ebonized to be hydrophilic so that they can be evenly coated with ice. The chamber is divided into two sections vertically. For FIN-03, the CSU-CFDC was operated to establish a temperature gradient between the colder (inner) and warmer (outer) ice walls in the upper ≈ 50 cm “growth” section to produce either water-subsaturated or water-supersaturated conditions at various temperatures within a central lamina. Aerosol particles were directed into that central lamina. For the flow rates used (10 vlpm total flow; 1.5 vlpm sample flow), the residence time was ≈ 5 s in the growth region. Ice crystals forming on INPs in the growth section continued to grow for ≈ 2 s in the lower ≈ 35 cm “evaporation” section of the chamber, where the outer wall temperature was adjusted to be at an equivalent temperature to the inner (cold) wall to promote the evaporation of liquid drops. When operating in the water-supersaturated regime, water relative humidity was controlled to be nominally at 105 % during FIN-03 to stimulate droplet growth and subsequent freezing for the best comparison to offline immersion-freezing methods. For probing ice nucleation in the deposition nucleation regime, relative humidity (RH) was controlled to ≈ 95 %. The temperature uncertainty is ±0.5 °C at the reported CSU-CFDC lamina processing temperature, and relative humidity uncertainty depends inversely on temperature, as discussed by DeMott et al. (2018), which is estimated, for example, as 2.4 % for a lamina RH of 105 % at −25 °C. Processing temperatures spanned −15 to −32 °C during FIN-03.
The CSU-CFDC sampled from one of the turbulent-aerosol inlet ports located in the SPL instrument laboratory. The connection was via 0.19′′ (0.4826 cm) inner diameter conductive tubing. Prior to entering the CFDC, aerosol was further dried using two inline diffusion driers and then size-limited using dual single-jet impactors that achieve a 50 % upper-particle-size cut-off at an aerodynamic diameter of 2.5 µm. This limitation on aerosol sizes helps to remove ambiguity when distinguishing ice crystals at ≈ 4 µm sizes from aerosol particles using an optical particle counter at the CSU-CFDC outlet. Counts greater than this size divided by the sample volume define INP concentrations.
The uncertainty in the calculation of INP concentrations must account for background counts that can occur due to the ejection of frost emanating from interior surfaces of the CSU-CFDC over operational periods. We follow Levin et al. (2019) in this regard. Frost corrections are defined via the use of time intervals sampling ambient air through a high-efficiency particulate air (HEPA) filter. A typical daily cycle at each temperature point was to bookend 10 min ambient air sampling with 5 min filter periods. Sample data were background-corrected by subtracting the interpolated filter period concentration before and after each sampling period. Background-corrected data were then averaged to ≈ 5 min sampling times to increase statistical confidence. Poisson counting errors during filtered and ambient sampling periods were added in quadrature, and INP concentrations were judged to be statistically significant at the 95 % confidence level if they were greater than 1.64 times this combined INP error (one-tailed z test). Interior inlet tubing losses are not considered in the reported INP data because they have been estimated at 10 % or less in the past. INP concentration correction underestimates inferred (by a factor of 3) to be due to aerosols spreading outside of the lamina during measurements specifically of mineral dust INPs (DeMott et al., 2015) are not generally applied to the data herein, though this is discussed regarding the intercomparison results and INP parameterizations in this paper.
An aerosol concentrator (MSP; model 4240) was used at selected times during FIN-03 to improve sampling statistics in the same manner as described in previously published studies (Tobo et al., 2013; Suski et al., 2018; Cornwell et al., 2019). The aerosol concentrator was positioned open to the air on the roof of the instrument laboratory room (covered and not used during rainfall), with a short 0.19′′ (0.4826 cm) inner diameter copper line containing the concentrated aerosol entering the laboratory vertically from about 3 m above the CFDC. Concentration factors for INPs can vary, depending on the ambient INPs present in a given environment. These were evaluated in the same manner as in Tobo et al. (2013), leading to an average increase in INPs by 90 times (±45) during the operation of the aerosol concentrator compared to ambient inlet periods during this study (not shown here because analysis repeats the efforts referenced above). A three-way manual stainless-steel valve was used to direct sample air to the CSU-CFDC from either the turbulent-flow inlet or the aerosol concentrator.
Supplemental studies with the CSU-CFDC reported herein used a high-temperature heating tube (Suski et al., 2018) placed in-line, following the three-way valve for removing aerosol organics prior to INP measurements. The use of a tube heater upstream of the CSU-CFDC to expose single particles to 300 °C is intended to isolate the action of total organic versus inorganic INPs via the comparison of ambient versus heat-treated particle streams. Simultaneous measurements of heated and unheated aerosol streams are not possible with a single CFDC, so sampling was conducted by alternating the channel chosen following a flow splitter during subsequent 10 min periods and ignoring aerosol changes that rarely occurred over such times.
The MIT Spectrometer for Ice Nuclei (SPIN)
The MIT-SPIN (Droplet Measurement Technologies, Boulder, CO), a commercially produced parallel-plate CFDC, also sampled during FIN-03. Measurements were focused on ice nucleation below water saturation for FIN-03. Operating principles are described in Garimella et al. (2016, 2017). SPIN consists of two flat walls separated by 1.0 cm and coated in approximately 1.0 mm of ice. Aerosol particles are fed into the chamber in a laminar flow of about 1.0 L min−1 and are constrained to the centerline with a sheath flow of about 9.0 L min−1. The temperature and relative humidity that the aerosol lamina experiences were controlled by varying the temperature gradient between the two iced walls (Kulkarni and Kok, 2012). After exiting the nucleation chamber, the particles enter SPIN's optical particle counter, which sizes aerosol on a particle-by-particle basis for diameters between 0.2 and 15 µm. The temperature uncertainty was 0.5 °C. For the lamina RH conditions below 100 % used in FIN-03, the RH uncertainties were 0.7 %, 1.3 %, and 1.7 % at −20, −25, and −30 °C, respectively.
The MIT-SPIN sampled from one of the turbulent-flow inlet systems located within the SPL aerosol chemistry laboratory. It was connected to the inlet system port with a short section of 0.19′′ (0.4826 cm) inner diameter conductive tubing.
Data processing for SPIN, including the definition of uncertainties, was performed following similar procedures as used for the CSU-CFDC instrument, with a few distinctions. A cut size for potential ice particles was set to 5 µm diameter. A low-pass filter was applied next to remove all 1 Hz data that exceeded a total of 3 counts s−1, as recommended by Richardson et al. (2007) to reduce frost background noise that equated to INP concentrations larger than about 200 L−1 (> 2 standard deviations above mean values discussed later) for the SPIN sampling flow rate. A depolarization filter was next applied to isolate particle data specific to ice using 1 Hz averaged backscattering data from SPIN's optical particle counter, with instrument-specific values of 3.5 and −0.25 for the log 10(size) and log 10(S1/P1) measurements, respectively (Garimella et al., 2016). Ice particle data were then converted from counts per second to the number density per volume of sample flow (L−1). Frost ejected from the plates of the SPIN chamber beyond that removed by the low-pass filter was characterized using particle-free sampling periods when the sample flow was diverted through a HEPA filter by an automated three-way valve. A linear interpolation of the filter period INP concentrations was used to approximate background frost concentrations throughout the measurement period (a minimum of 4; 5 min filter periods for each set point temperature within a 2–3 h period) and smoothed using a 5 min moving average. Sample data were background-frost-corrected by subtracting this smoothed background frost density from the total number density in each 5 min sample period. Finally, a SPIN-specific particle concentration correction factor of 1.4 is applied to account for non-ideal instrument behavior (e.g., out-of-lamina particles), resulting in underestimation of INPs as described by Garimella et al. (2017). As the field measurements from this study predate the laboratory experiments performed to determine SPIN uncertainties, the minimum reported correction factor was selected to remain conservative in reported measurements.
As for the CSU-CFDC, an estimation of the INP concentration measurement error for the MIT-SPIN assumed that the background-corrected INP concentration follows a Poisson distribution. Then, the Poisson error for the INP and background frost concentrations was defined as the square root of the sample mean. The significance test statistic was defined by the quadrature sum of counting errors multiplied by the z score for a one-tailed z test at the 95 % confidence interval. INP measurements were deemed statistically significant if the mean INP concentration was greater than this test statistic.
2.2.2 Offline INP measurements
Offline methods have undergone many improvements in recent years and have been successfully used in a complementary manner for comparison to online methods in other recent intercomparisons (DeMott et al., 2017, 2018; Hiranuma et al., 2015; Wex et al., 2015; Knopf et al., 2021; Brasseur et al., 2022; Lacher et al., 2024). In FIN-03, particles were collected from the air using liquid impingers and filter samplers. Impinger liquid and water suspensions created from immersed filters were analyzed for the immersion freezing of the distributed droplet volumes using the North Carolina State University Cold Stage (Wright et al., 2013), the CSU Ice Spectrometer (Hiranuma et al., 2015; DeMott et al., 2018), and the FRankfurt Ice Nuclei Deposition FreezinG Experiment (FRIDGE) instrument (Schrod et al., 2016). All measurements were made off-site after the return of impinger liquid and filters to the participant institutions, as done in most intercomparisons of this type. The handling of samples regarding each instrument is mentioned below.
The North Carolina State University Cold Stage (NCSU-CS)
The North Carolina State University Cold Stage (NCSU-CS) has been previously described by Wright and Petters (2013) and Hader et al. (2014). Procedures used for collecting immersion-freezing spectra are described below and by Yadav et al. (2019). During FIN-03, filter samples, impinger samples, and precipitation samples were collected for analysis using the NCSU-CS. For the intercomparison, the filter and impinger results are considered. Filter samples were collected from the roof of Storm Peak Lab for 3–4 h twice daily using 47 mm Nuclepore polycarbonate filters (0.2 µm pore size) housed in an open-faced stainless-steel filter holder operated at 14 L min−1 (at altitude) or ≈ 9 L min−1 at the standard temperature and pressure (STP) conditions of 1013 mb and 0 °C. Filter holders were directed downward and sheltered from precipitation by a large inverted metal bowl. Images are shown in Sect. S1 in the Supplement. Each filter was resuspended in 6 mL prefiltered high-performance liquid chromatography (HPLC)-grade ultrapure water. Impinger samples were collected directly into ultrapure water using a glass bioaerosol impinger (SKC, Inc.), as described by Hader et al. (2014) and DeMott et al. (2018). The impinger jets air at 10.6 L min−1 (≈ 7 L min−1 STP) into a 20 mL water reservoir, impacting 80 % of particles that are ≥ 200 nm in diameter and ≈ 100 % of particles that are ≥ 1 µm (Willeke et al., 1998). Impinger samples were collected in the same manner as was done for all shared liquid samples for the FIN-02 intercomparison (DeMott et al., 2018), except that Teflon tape replaced the stopcock grease to seal the impinger glass lid to prevent jamming. Water evaporating from the reservoir was replaced hourly; the impinger was in a rooftop shelter, with its inlet extending horizontally through a hole in the shelter wall into the open air at a height of ≈ 6 ft (1.83 m) below the position of filter sampling units that were mounted on an outside railing. Water used on-site was filtered (0.2 µm) Milli-Q water. All samples were stored at −20 °C on-site, shipped on dry ice, and then stored at −80 °C until analysis at NCSU.
Freezing statistics for each liquid sample were acquired by pipetting an array of approximately 256 droplets of 1 µL ± 0.88 % volume on four hydrophobic glass slides under dry N2 gas. The temperature was ramped at a rate of −2 °C min−1, and freezing was detected at a temperature resolution of 0.17 °C (every 5 s) using charge-coupled device (CCD) camera images collected from an optical microscope. Temperature uncertainty based on repeatability of homogeneous freezing tests is 0.1 °C (Hiranuma et al., 2015). Except for pure dust samples, the dependence of the population median freezing temperature on cooling temperature is less than 1 °C per decade in the cooling rate, including measurements of ambient INPs (Wright et al., 2013). A decade in the cooling rate is much larger than the variations in the cooling rate used by instruments in FIN-03 (−0.33 to 2 °C min−1). The expected shift in INP spectra due to the variability in the cooling rate is much less than the total uncertainty, and thus, corrections for the cooling rate are not further considered here. The concentration of ice nuclei at temperature T per unit volume of liquid is given by Vali (1971) as follows:
where funfrozen is the fraction of unfrozen droplets at T, and Vdrop is the population median droplet volume. The concentration of ice-nucleating particles (INPs) in the atmosphere is given by
where f accounts for any serial sample dilutions with pure water used to focus measurements within different temperature ranges, Vliquid is the liquid suspension sample volume, and Vair is the volume of air sampled (flow rate at STP × duration). The high-temperature-resolution freezing data were collected 3× per sample, and funfrozen was binned into 1 °C intervals for spectral calculations. Confidence intervals reported in archived data were given as ±2 standard deviations of the mean temperature uncertainty in the measurements (typically 0.5 to 1 °C). We will refer to the processed filter samples as NCSU-CS(F) and processed impinger samples as NCSU-CS(I). Note that filter samples were more concentrated by a factor of ≈ 5 due to the greater Vliquid used in the impinger for the stated air collection volumes. Thus, the filter technique is more sensitive and has a lower limit of detection (LOD). The precise ratio for a specific experimental period depended on the exact sampling times of the filter and impinger and the exact number of droplets analyzed for the filter, impinger sampling, averaging across repeats, and binning into 1° intervals. For this reason, the ratio of the LOD for the averaged samples may differ slightly from this estimate.
As for all INP samples in FIN-03, “blanks” were collected for each of the NCSU-CS sample types. The normal procedure for most blank filter assessments in the field is to momentarily expose a clean filter to flow in a collection unit. In the spirit of procedural testing that typifies workshops like FIN-03, a different method was trialed by the NCSU group. In total, 10 filter “blanks” were specially collected on days during FIN-03 by placing a 0.2 µm pore size filter as a backing filter onto an 0.05 µm pore size filter in a secondary filter unit that was exposed to the same total ambient flow conditions as the primary INP filter unit. This 0.2 µm filter was processed the same as the primary INP filter (rinsed in 6 mL ultrapure water), and freezing results were presumed to provide a quite conservative estimate of filter background INPs. It was indeed found that the number of INPs per blank filter in these collections was much higher than for standard blank filter method used by the other groups. The results from 10 blank filters were averaged across the processed temperature range, and an upper confidence limit of 1 °C was defined. All INP concentration results for each ambient filter were rejected if they fell below this upper confidence bound in any given temperature bin. In sum, 20 % of the original measurement points based on filter collections were removed from measurement intercomparisons by this blanking operation. Impinger blanks were collected via the separation of some water from the pure-water storage container each time the impinger unit was filled with pure water to begin an air sampling period. Thus, blanks were specific to each ambient impinger sample. The same 1 °C upper confidence bound that characterizes NCSU-CS measurements was applied in each case to identify sample temperature points where the liquid suspension INPs fell below the upper confidence limit of the impinger blanks. These were removed from intercomparisons.
CSU Ice Spectrometer (CSU-IS)
The CSU-IS also post-processed particles sampled onto filters during FIN-03. This instrument has been described in Hiranuma et al. (2015) and Suski et al. (2018). Samples were collected for approximate periods of 4 h for intercomparison periods (longer for overnight samples and not part of the intercomparison) using pre-cleaned 47 mm polycarbonate Nuclepore filters with 0.2 µm pore diameter (Suski et al., 2018) mounted in disposable sterile open-faced and face-up holders (Nalgene), with a typical sample flow rate of 14.9 L min−1 (ambient) and 9.5 L min−1 (STP). Filters were collected on the same exterior laboratory roof railing as the NCSU filters and were approximately 2 m apart. All filter samples were frozen following collection and stored at −20 °C before transit on dry ice and storage again at −20 °C until processing at the CSU laboratory. Pre-sterilization procedures and overall clean protocols for preparation and handling of filters are detailed in Suski et al. (2018) and Barry et al. (2021b). Particle re-suspension was done through shaking filters in sterile 50 mL Falcon polypropylene tubes for 20 min (Corning Life Sciences) with 6–10 mL of 0.02 µm pore diameter filtered deionized water. Further 20-fold dilutions using filtered water were made as needed to permit the measurement of freezing spectra to the low-temperature limit of operation of the CSU-IS.
Immersion-freezing INP temperature spectra were obtained by distributing 24–32 aliquots of 50 µL particle suspensions into the sterile 96-well PCR trays that mount in the CSU-IS. Other wells were filled with serial dilution samples and pure water. The cooling rate was −0.33 °C min−1. Frozen wells were counted at 0.2–1 °C degree intervals to a limit of about −28 °C, and cumulative numbers of INPs per milliliter of the suspension estimated using Eq. (1). Conversion to ambient air concentration at standard temperature and pressure conditions or per standard liter (sL−1) was made based on distributed suspension volume and the total air volumes collected (Eq. 2). Several filter blanks were collected during FIN-03, and one was tested and used to obtain background INP numbers per filter. Blank INPs were found to account for < 5 % of INPs at −20 and −25 °C, and thus corrections were ignored. Binomial sampling confidence intervals (95 %) were derived for INP concentrations following Agresti and Coull (1998). The temperature uncertainty in the INP measurements is ±0.2 °C (Hiranuma et al., 2015).
As a supplemental contribution to FIN-03, portions of IS aerosol suspensions were set aside (e.g., suspensions of 6 to 8 mL can serve up to three or more IS aliquot fills) for treatments to proximally isolate total biological, other organic, and inorganic contributions to measured immersion-freezing INP concentrations. To assess the removal of heat-labile INP entities, a 2 mL aliquot of the suspension was re-tested in the IS after heating to 95 °C for 20 min (McCluskey et al., 2018). To attempt to remove all organic INPs, 1 mL of 30 % H2O2 was added to a 2 mL aliquot of the suspension, and the mixture was heated to 95 °C for 20 min, while illuminated with UV-B fluorescent bulbs to generate hydroxyl radicals (residual H2O2 is then removed using catalase) (Suski et al., 2018). The INPs were again assessed for freezing spectra in the IS. Herein we describe a subset of samples collected on 15, 23, and 25 September that was subjected as IS suspensions to the two treatments. The interpretation of the data from exposure of particle suspensions to 95 °C is that the reduction in INP concentrations under thermal treatment is a proxy for the concentration of biological (proteinaceous and microbial) INPs which have been eliminated or deactivated through treatment. A strong reduction in INP activity observed after peroxide treatment indicates dominant organic INP populations, whereas a lack of response to this treatment is assumed to indicate that inorganic INPs such as mineral dust dominate non-heat-labile INPs. This assessment for bulk suspensions of particles could be directly compared to measurements of 300 °C heat-treated single particles in the online CSU-CFDC measurements on these same days, providing a more insightful investigation of INP compositions.
Taken together, such treatment studies show the general utility for estimating the biological contributions to INPs, overall organic contributions, and the importance of inorganic contributions, as done for a variety of locations (McCluskey et al., 2018; Suski et al., 2018; Barry et al., 2021a; Knopf et al., 2021; Testa et al., 2021). However, we note that not all biological materials may be completely denatured or removed by heat (Testa et al., 2021; Daily et al., 2022; Alsante et al., 2023) and that not all organics may be removed by peroxide. For example, denaturation is the disruption of a higher order (secondary, tertiary, and quaternary structure) in a protein which leads to a loss or lessening of function. Simpler proteins or peptides, such as glutathione, have no higher-order structure and thus cannot be denatured (Alsante et al., 2023). Consequently, estimates of biological contributions to INPs based on these treatments may be considered the lower limits for the FIN-03 samples analyzed.
FRIDGE cold stage and deposition nucleation measurements
The FRIDGE instrument can operate as a low-temperature cold chamber or low-temperature and low-pressure diffusion chamber device for measuring the concentration of INPs by two independent methods. These methods are (a) a droplet freezing assay on a cold stage (hereafter FRIDGE-CS; Schrod et al., 2020; DeMott et al., 2018; Hiranuma et al., 2015) that addresses immersion freezing similarly to the NCSU-CS and the CSU-IS and (b) the diffusion chamber method (hereafter FRIDGE-DC) that addresses the deposition nucleation and condensation freezing modes introduced in Schrod et al. (2016) and is the standard method for operating the FRIDGE device (e.g., DeMott et al., 2018). The ice nucleation analysis is performed inside the FRIDGE instrument for both methods, yet the sampling process, addressed nucleation modes, and the specific analytical procedures differ as described below.
For the FRIDGE-CS method, aerosol particles were sampled via a short 1/4′′ (0.635 cm) conductive tube from the shared turbulent-flow aerosol inlet in the SPL instrument laboratory on Teflon membrane filters (Fluoropore polytetrafluoroethylene (PTFE); 47 mm, 0.2 µm; Merck Millipore Ltd.). The sampling duration ranged from 50 to 240 min, resulting in air volumes between 250 and 1000 sL−1. The particles were extracted in 10 mL deionized water by shaking. Approximately 150, 0.5 µL droplets from that solution were pipetted onto a clean silanized silicon wafer on the cold stage of the FRIDGE instrument and cooled by −1 °C min−1 at ambient pressure. A CCD camera detects freezing events and counts the number of frozen droplets as a function of temperature. This process is repeated with fresh droplets and fresh substrates until approx. 1000 droplets are attained. The INP number concentration is derived using Eqs. (1) and (2), as for the NCSU-CS and CSU-IS. An upper bound on temperature uncertainty is estimated as ± 0.5 °C. Binomial sampling confidence intervals (95 %) were derived for INP concentrations as done for the CSU-IS, following Agresti and Coull (1998). Pure water and suspensions of blank filters in pure water showed no freezing at temperatures of > −20 °C and a contribution of no more than 15 % toward total INPs at −29 °C, which is the lowest temperature for which data are reported herein. Consequently, corrections were ignored for this intercomparison.
For the FRIDGE-DC measurements, particles were collected using an electrostatic aerosol collector (EAC) (Schrod et al., 2016) that was connected to the same aerosol flow inlet via a short 1/4′′ (0.635 cm) conductive tube. Within the EAC, aerosol particles are electrostatically precipitated onto silicon wafers, which are used as sample substrates. After sampling is completed, the analysis at select pairs of temperature and relative humidity set points follow in a separate step. For that reason, the wafer was placed on the cold stage inside the diffusion chamber. The chamber was evacuated, and the temperature was set to the first-analysis temperature. In a second, much larger, volume, pure water vapor was regulated by pressure control to the desired supersaturation. Once the water vapor diffuses into the chamber, ice forms on the activated INPs, and a CCD camera is used to record and count the emerging ice crystals that appear as bright objects. It is assumed that one ice crystal represents one INP. The water vapor atmosphere and thus the growth of ice crystals is maintained for up to 100 s until the valve to the water vapor source is closed and the chamber is evacuated again. The process is repeated at increasing humidity first, and then at a progressively lower temperatures. At the SPL, samples were taken with the EAC for 50, 75, and 120 min, resulting in volumes of approximately 64–150 sL. The samples were analyzed by default at −20, −25, and −30 °C and 95 %, 99 % and 102 % water saturation. In addition, a few samples were analyzed at −15 °C. This was a supplemental contribution by the FRIDGE group for a comprehensive analysis of INP activation in the deposition regime and for a comparison to online data collected for some days in this regime. Temperature uncertainty is the same as for the FRIDGE-CS method. RH uncertainty is ±2 %, based on observing visible condensation on particles at 100 % RH. The INP concentration uncertainties are given as binomial confidence limits, similar to the CSU-IS.
2.3 INP processing and sampling strategies
As a campaign strategy, samples were collected over different time periods in the day to reflect the varied weather conditions and aerosol populations arriving at the mountain laboratory. For intercomparison, a select number of 3 to 4 h sampling periods were allocated in which online instruments nominally operated at a few predesignated temperature and relative humidity ranges, while samples were collected continuously for offline analysis. While aerosol conditions can change within a 4 h time frame, this was agreed upon as a minimal reasonable period for comparability to obtain statistically reliable results. Similar sampling strategies have been employed in past intercomparisons (DeMott et al., 2017; Knopf et al., 2021). Overall, measurements were conducted over a wide range of temperatures (−7 to −34 °C) in the heterogeneous ice nucleation regime.
3.1 Meteorological context
Weather conditions during FIN-03 were characterized using auxiliary measurements. Weather data (temperature, humidity, winds, and pressure) were obtained for the Storm Peak Laboratory through the MesoWest (https://mesowest.utah.edu/cgi-bin/droman/meso_base_dyn.cgi?stn=STORM, last access: 9 November 2020) Mesonet (STORM site) and supplemented with measurements from instruments operated at the SPL through the Western Regional Climate Center (WRCC) (https://wrcc.dri.edu/weather/strm.html, last access: 9 November 2020) for the 2 d that were absent in the MesoWest record. The air temperature, relative humidity, and barometric pressure time series are shown in Fig. 1a, b, and c, respectively. Precipitation was measured via a rain gauge at the Storm Peak Laboratory provided by NCSU. The precipitation rate was calculated from the quotient of precipitation (in millimeters) and time collected (in hours), as shown in Fig. 1d. Back-trajectories for all the sampling days in FIN-03 are reported by Zawadowicz et al. (2017), showing 72 h air mass transits from regions that included southern California, Washington State, and eastern Nebraska.
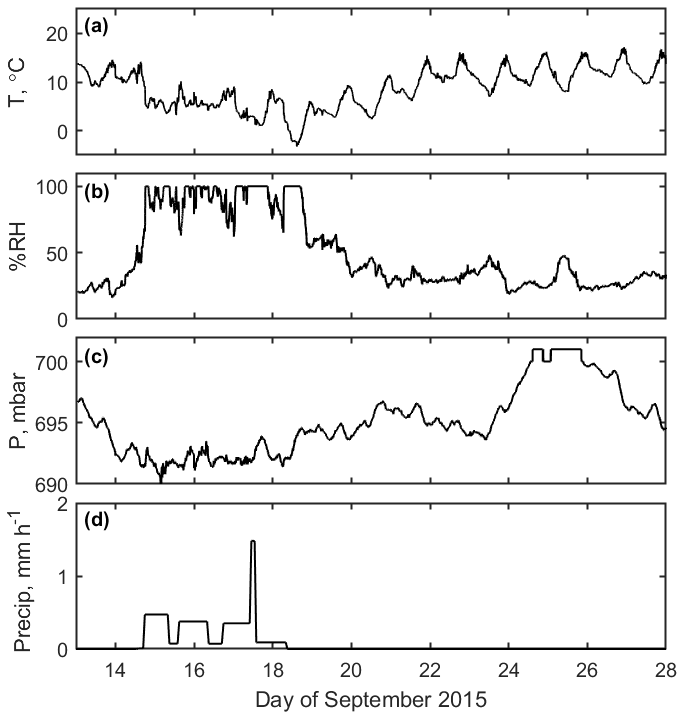
Figure 1Weather conditions over the course of FIN-03, including (a) air temperature, (b) relative humidity, (c) barometric pressure, and (d) precipitation rate.
Relatively warm and dry conditions were observed initially at the Storm Peak Laboratory. Clear skies on 11 and 12 September 2015 gave way to clouds and haze on 13 September. Cooler temperatures, lower barometric pressure, and higher relative humidity (generally above > 70 %) accompanied rainfall on 14 September. This was followed by continued rain on 15 September; intermittent rain and short periods of hail on 16 September; a mixture of rain, snow, and sleet on 17 September; and snow on 18 September. The next and longest period in the study, 19–28 September, was marked by an increase in temperature, an increase in barometric pressure, lower relative humidity, and a lack of precipitation. More detailed weather records including daily photographs and a summary of human-produced daily observations are summarized in Sect. S1. Daily wind rose plots are provided in Fig. S1 in the Supplement.
3.2 Aerosol context
3.2.1 Aerosol size distribution and surface area
The time series of aerosol size distribution measured by the LAS (in 3 h means) is shown in Fig. 2a. The maximum and minimum total LAS concentrations were 706 and 74 cm−3, respectively, and the mean and standard deviation of the total LAS concentration throughout FIN-03 were 410 and 138 cm−3, respectively. The highest total LAS concentration recorded during FIN-03 (706 cm−3) occurred in the early hours on 25 September. Elevated aerosol concentration (at least 1 standard deviation above the mean) was also observed during midday on 13 September, before and during midday on 14 September, before midday on 25 September, in the afternoon on 26 September, and around midday on 27 September.
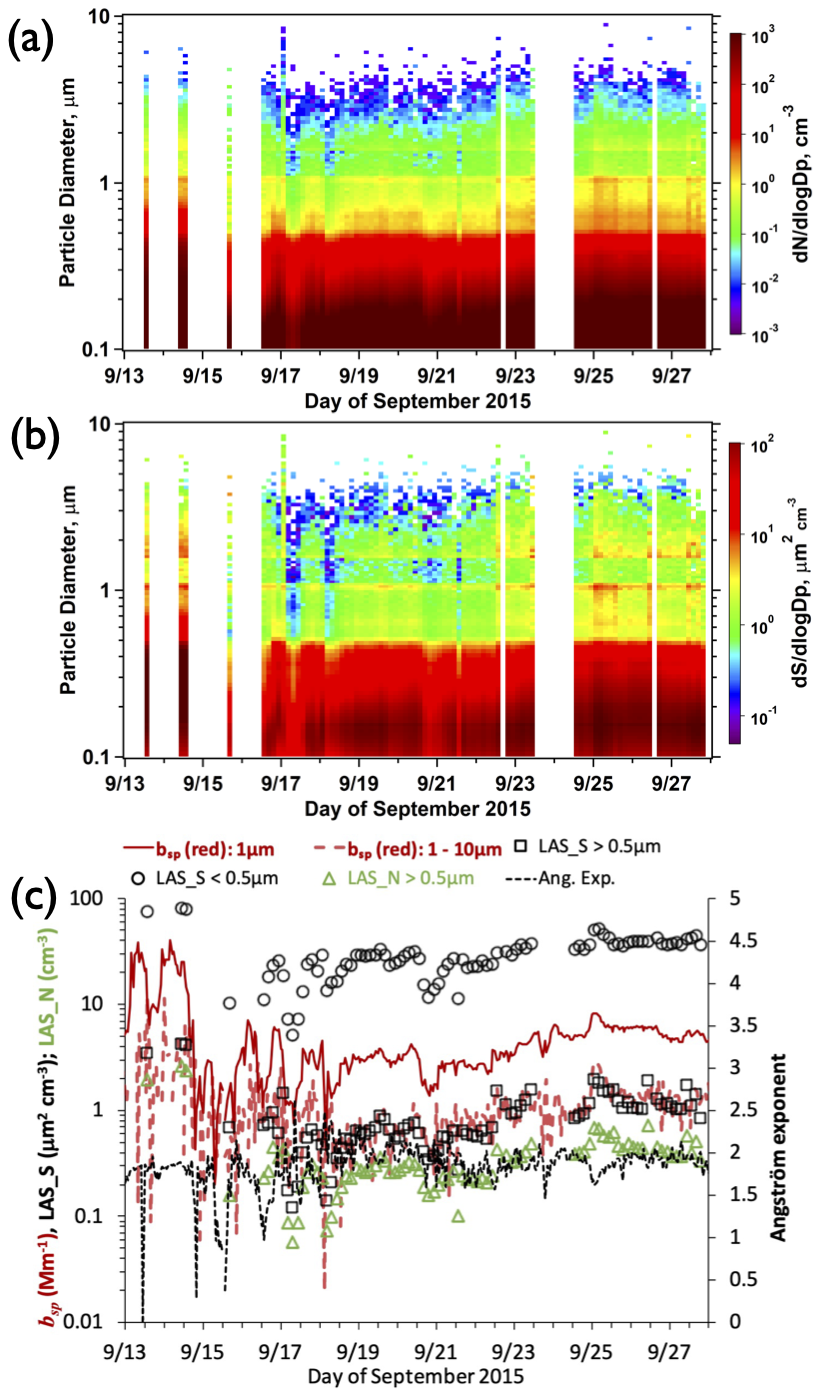
Figure 2The time series of the dry particle number concentration distribution (ambient conditions and not STP) measured by the laser aerosol spectrometer (LAS) in panel (a) is shown as 3 h means at ambient pressure. The time series of the particle surface area distribution is in panel (b). (c) The timeline of nephelometer scattering (1 h data) in the red channel for < 1, and 1–10 µm size ranges, 3 h LAS number concentration > 0.5 µm, 3 h LAS surface area at sizes below and above 0.5 µm, and Angström exponent (dashed; right axis).
The timeline of LAS aerosol surface area in Fig. 2b emphasizes that the surface area was predominately at submicron throughout the study, with a mode at about 0.16 µm. This is important to note, in combination with chemical composition information discussed in Sect. 3.2.2, because it is relevant to understanding the likely sizes and surface areas of INPs. We will revisit the surface area of INPs for use in parameterizations in a later section. Quantitative timelines of the LAS surface area above and below 0.5 µm are shown in Fig. 2c. The surface area above 0.5 µm is about a factor of 30 lower than that below this size over most of the study period. Also shown in Fig. 2c is the nephelometer scattering (bsp) in the red channel (700 nm), showing a dominant contribution when the upstream impactor was set to 1 µm (aerodynamic) and a much lower level of 1–10 µm scattering. This scattering from coarse-mode particles is consistent with, and trends with, the LAS surface area in the supermicron regime, while the Angström exponent (calculated using red and blue channels) being close to 2 (small-particle dominance) throughout the study is consistent with the dominance of submicron contributions to the total surface area. Figure 2 also emphasizes that the lowest aerosol concentrations and surface areas occurred during varied times in the wet period of the study from midday on 14 September through 17 September. Finally, adjacent 3 h periods rarely showed surface area changes of more than a factor of 2 in the size range > 0.5 µm and were usually within 10 %–20 %. Large differences across 3 h periods were less frequent for the surface area at smaller sizes. These factors confirm the validity of the selected intercomparison time periods.
3.2.2 Aerosol composition
The number concentration of aerosol particles from 0.2 to 3 µm, with characteristic spectra belonging to eight composition categories (sulfate/organic/nitrate, biomass burning, elemental carbon, sea salt, mineral dust, meteoric, alkali salt, and fuel oil combustion), and the number concentration of unclassified aerosol particles by the PALMS were assessed for 3 h averages through the FIN-03 period. For simplicity, four of these categories (elemental carbon, meteoric, alkali salt, and fuel oil combustion) were combined into a category called “other” due to the low concentration of particles in each of these categories, resulting in six total classifications (SulfOrgNit = sulfates/organics/nitrates; Biomass Burning = products of biomass burning, sea salt, mineral dust, other minor types, and unclassified), as shown in Fig. 3a. The 3 h averages of the number fractions of each particle type were also calculated as the fraction of the total aerosol number concentration measured by the PALMS in each of the six classifications, as shown in Fig. 3b. The dominant categories throughout the FIN-03 campaign were Biomass Burning (mean 26 ± 43 cm−3; maximum 177 cm−3), SulfOrgNit (mean 22 ± 13 cm−3; maximum 48 cm−3), and mineral dust (mean 3 ± 11 cm−3; maximum 55 cm−3). The mineral dust type also includes soil particles (crustal species mixed with organic material) (Zawadowicz et al., 2019). The highest total particle number concentration measured by the PALMS (218 cm−3) occurred on 14 September (of which 177 cm−3 consisted of biomass burning and 34 cm−3 consisted of sulfates/organics/nitrates). This biomass burning plume impacted the site for several hours. Mineral/soil dust particles were ubiquitous throughout the study, with a concentration of 0.128 ± 0.446 cm−3 (median and interquartile range). Anomalous concentrations of > 10 cm−3 that were observed for a few 5 min sample periods on 15 September are likely due to road dust emitted from the site. Dust concentrations were < 1 cm−3 for 90 % of the PALMS samples. Mineral/soil dust represented a median of 0.3 % of particles in the > 0.2 µm size range, increasing to 23 % and 67 % for > 0.5 and > 1.0 µm particles (Fig. 4a). Similarly, mineral dust contributions to the total surface area are inconsequential for the total aerosol surface area (Fig. 4b) but dominate in the coarse-mode regime for the study (Fig. 4c). We revisit this result in discussions of parameterization of INPs in Sect. 3.5.
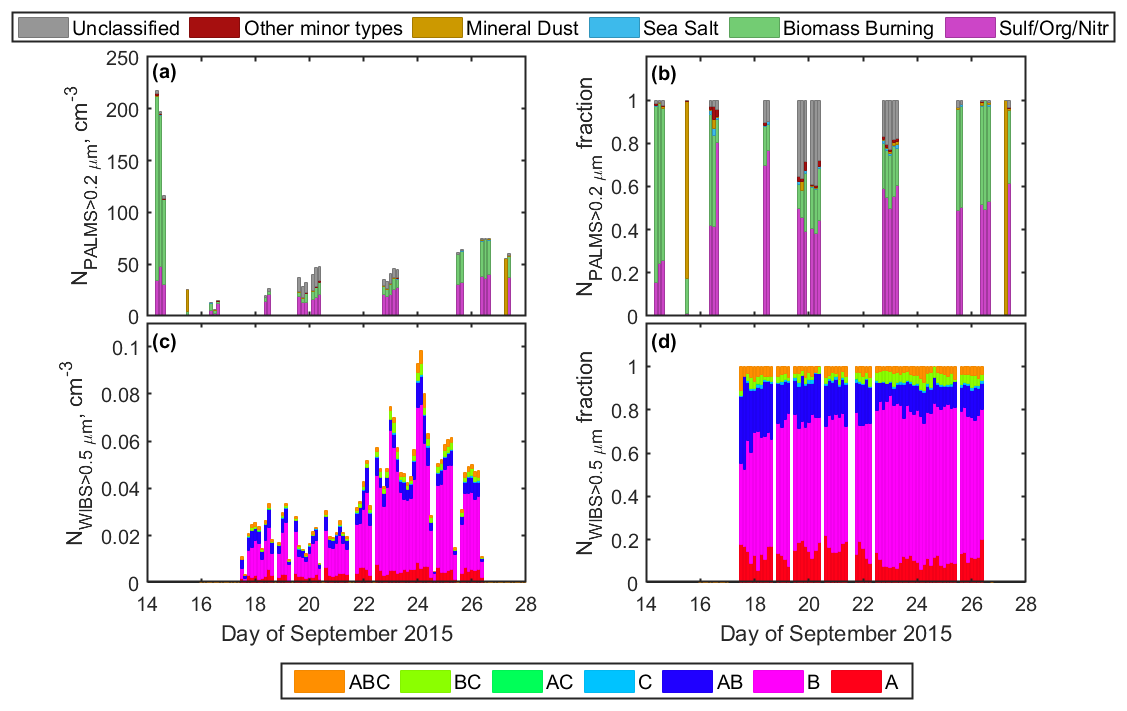
Figure 3Panels (a) and (b) show the aerosol particle number (ambient conditions and not STP) and relative fractions (by cumulative count at all sizes) of each of the six PALMS compositional particle types for the 3 h periods during which PALMS was used to sample ambient air. Panels (c) and (d) show the aerosol particle number concentration and relative fractions (by count) of particles with diameters of > 0.5 µm in each of the channels (A, B, AB, C, AC, BC, and ABC, which are described in Perring et al., 2015) over the course of the FIN-03 field campaign.
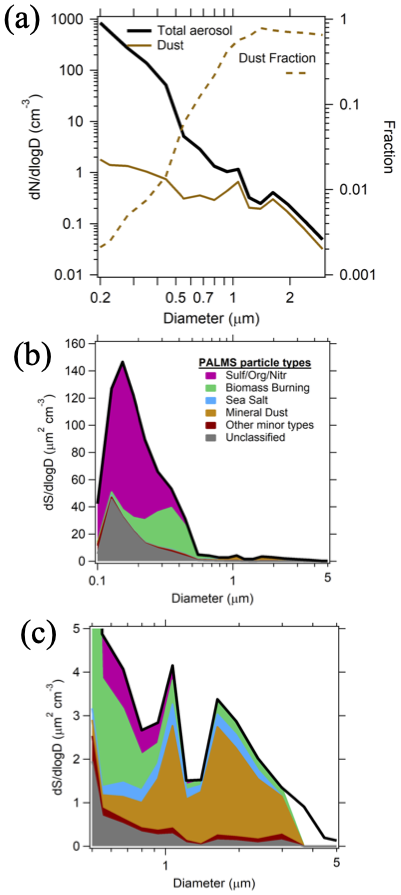
Figure 4(a) Total aerosol versus mineral/soil dust (ambient) number size distribution and dust fraction interpreted from PALMS and LAS data at all times for which PALMS was sampling during FIN-03. (b) Surface area distribution differentiated for PALMS compositional types during the same sampling times. (c) Expanded plot from panel (b) for the coarse-mode size range to emphasize progressive dominance of dust components at diameters > 0.5 µm.
The daily average number concentration of fluorescing aerosol particles corresponding with each of the seven WIBS-4A types, with diameters of > 0.5 µm, is shown in Fig. 3c, and the daily average number fraction of each WIBS-4A type is shown in Fig. 3d. The dominant types of fluorescent aerosol particles throughout the FIN-03 field campaign were types B, AB, and A, which, on average, accounted for 63.2 ± 8.7 %, 16.0 ± 6.3 %, and 12.5 ± 3.9 % of the particles detected by the WIBS, respectively.
In contrast with the daily average number fraction in each PALMS category, the relative contributions of each of the seven WIBS-4A particle types did not vary much over the course of the study when the WIBS-4A was operational, with perhaps the exception that type AB decreased in prevalence from 18 September (42.9 %) to 21 September (10.1 %). A modest trend occurred from lower total fluorescing particle concentrations (0.02 to 0.04 cm−3 at the STP) from 17 September through 21 September to higher concentrations (0.07 to 0.15 cm−3 at STP) from 22 September through 26 September. WIBS-4A data were not collected on 13–16 September or on 27 September. The first period was somewhat critical to evaluating INP relations to bioaerosols, so we note this caveat in advance here. Time-resolved size distributions for each WIBS-4A channel, as well as the total particle concentration measured across these seven channels, are shown in Fig. S2. FBAP assignments related to INP predictions will be discussed in Sect. 3.5.
3.3 Immersion-freezing measurements
A summary of the number concentrations of immersion-freezing INPs (NINP) over the course of the field campaign for all measurements averaged at 1° temperature intervals for each instrument is shown in Fig. 5. The concentration of INPs detected over this range spanned 5 orders of magnitude (0.01 to 160 L−1). Only two sets of instruments were able to explore the temperature regimes of −30 °C and colder due to their design to permit operation there or to explore the temperature regimes warmer than −15 °C due to detection limits (controlled by the sample volume and drop size used for immersion freezing). At any one temperature, differences of up to a little more than 1 order of magnitude are apparent in comparing average data from individual methods, mirroring results presented in previous laboratory and field studies (Hiranuma et al., 2015; DeMott et al., 2017, 2018; Knopf et al., 2021; Brasseur et al., 2022; Lacher et al., 2024).
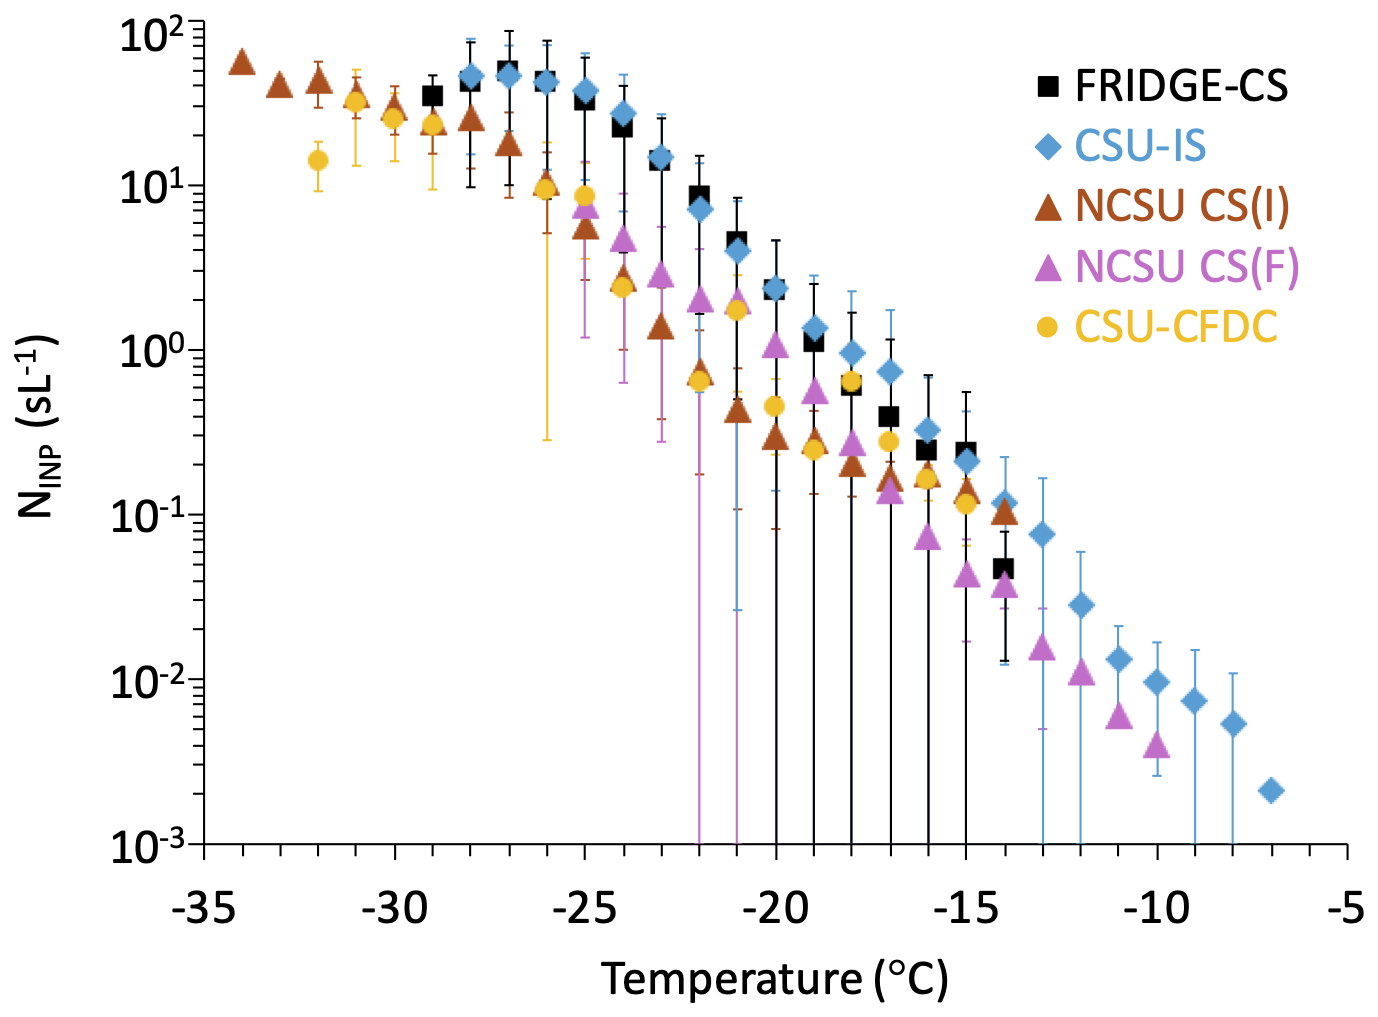
Figure 5Campaign average immersion-freezing INP concentrations (sL−1) in 1 °C bins for instruments participating in intercomparison studies. Error bars represent 1 standard deviation in the measurement means collected at the specified temperature and not measurement uncertainties. The error bars strike the lower axis when the standard deviation has exceeded the means. The times over which the INP concentration has been averaged for each instrument are explained in the text.
As expected, a trend of increasing NINP values with decreasing temperature was observed for FRIDGE-CS, CSU-IS, NCSU-CS (I and F), and CSU-CFDC. Incremental changes in NINP values with decreasing temperature were similar for all measurements that spanned a broad temperature range. The dependence of NINP values on temperature is nearly log-linear from −10 to −27 °C, except, perhaps, for a steepening of slope from −20 to −25 °C and some lowering of the slope below this temperature. This comparability of contrasts with an apparently increasing high bias of the droplet suspension freezing measurements versus CFDC measurements during comparable sampling at various surface sites (non-mountaintop or free troposphere) found in DeMott et al. (2017) but agrees with FIN-02 laboratory studies (DeMott et al., 2018) and recent atmospheric studies at Puy de Dôme (Lacher et al., 2024). The INP concentration variability at single temperatures, reflected in Fig. 5 as a standard deviation of the bin means, is likely due to variations in aerosol properties affecting INPs in response to production and scavenging processes upstream of the site. Nevertheless, generally higher NINP measurements were obtained with the FRIDGE-CS and the CSU-IS than the CSU-CFDC and NCSU-CS(F) and NCSU-CS(I) analyses. Such biases in other studies have been attributed to different efficiencies in the sampling of the largest particles (e.g., Lacher et al., 2024; Cornwell et al., 2023), but the collection methods for offline measurements in this study were substantially similar, as discussed further below. Hence, we cannot attribute measurement differences to a systematic source. The comparability of impinger versus filter sampling methods for immersion-freezing measurements via the NCSU-CS mirrors the findings in DeMott et al. (2017), suggesting that particle removal from filters can be highly effective for immersion-freezing measurements of ambient particles.
To view the data in a more complete manner over the entire project, we explore direct comparisons of different instrument results as scatterplots and measurement ratios on temporal bases. First, in Fig. 6, we show a commonly used representation of large INP project data as INP concentrations for four instruments versus one other and segregate the data into broad 4 °C temperature ranges. The data used for normalization were from the CSU-IS, though we might have used any other. Linear regressions were plotted in Fig. 6 to show the overall average differences between measurements that are already evident in Fig. 5. Figure 6a thereby demonstrates the generally good correspondence between the NCSU-CS data of both types and the CSU-CFDC data that measure factors of 5 to 8 lower INP concentrations on average compared to the CSU-IS, as well as the closer correspondence of the FRIDGE-CS (22 % lower) and CSU-IS data. The greatest variations in INP concentrations over the course of the project were focused in the −20 to −25 °C temperature regime (Fig. 6b), where variations reached nearly 2 orders of magnitude. This is not an uncommon observation and is also seen in Lacher et al. (2024). What is surprising, but not easily understood yet, is the fact that all measurement methods could at times measure equivalently to or more than the CSU-IS.

Figure 6(a) INP concentrations for all intercomparison measurement points of FIN-03 from the FRIDGE-CS, NCSU-CS(I), NCSU-CS(F), and CSU-CFDC compared to the INP concentrations from the CSU-IS measurements. Linear regressions with zero intercepts are color-coded for each, having slopes of 0.78, 0.19, 0.13, and 0.16 for the FRIDGE-CS, NCSU-CS(I), and CSU-CFDC, respectively. (b) The same data are color-coded for different temperature ranges in degrees Celsius, and the 1:1 relation is shown. Errors are confidence intervals for FRIDGE-CS, CSU-CFDC, and CSU-IS data. These are not shown for the NCSU-CS data since these are given as temperature errors and would need interpolation to plot as NINP errors.
Temporal data provided further descriptions of the instrument comparability. Immersion-freezing NINP values in 1 °C bins were compared for the periods of the day broken into 3 h intervals in the time series of Fig. 7. While absolute INP concentration magnitudes differ, it is not difficult to see the comparability of general trends amongst the data sets, although with episodic discrepancies that will be discussed further below. For example, all methods measure higher INP concentrations early in the study, have a low point around 18 September, and build up again toward the end of the study. INP concentrations at temperatures of > −20 °C were at a maximum during the precipitation period, as might be expected for rainfall production of biological INPs (Huffman et al., 2013; Mignani et al., 2021; Testa et al., 2021; Cornwell et al., 2023), while the strongest differences between the concentrations of INPs active at higher and lower temperatures occurred for all instrumental measurements during the period of warming under high pressure later in the study. The latter observation might be expected for a strong contribution of dust-like INPs with a steeper . These positive points suggest that the instruments were measuring the same INP cycles as also seen in the study of Lacher et al. (2024) (compare their Fig. 4).
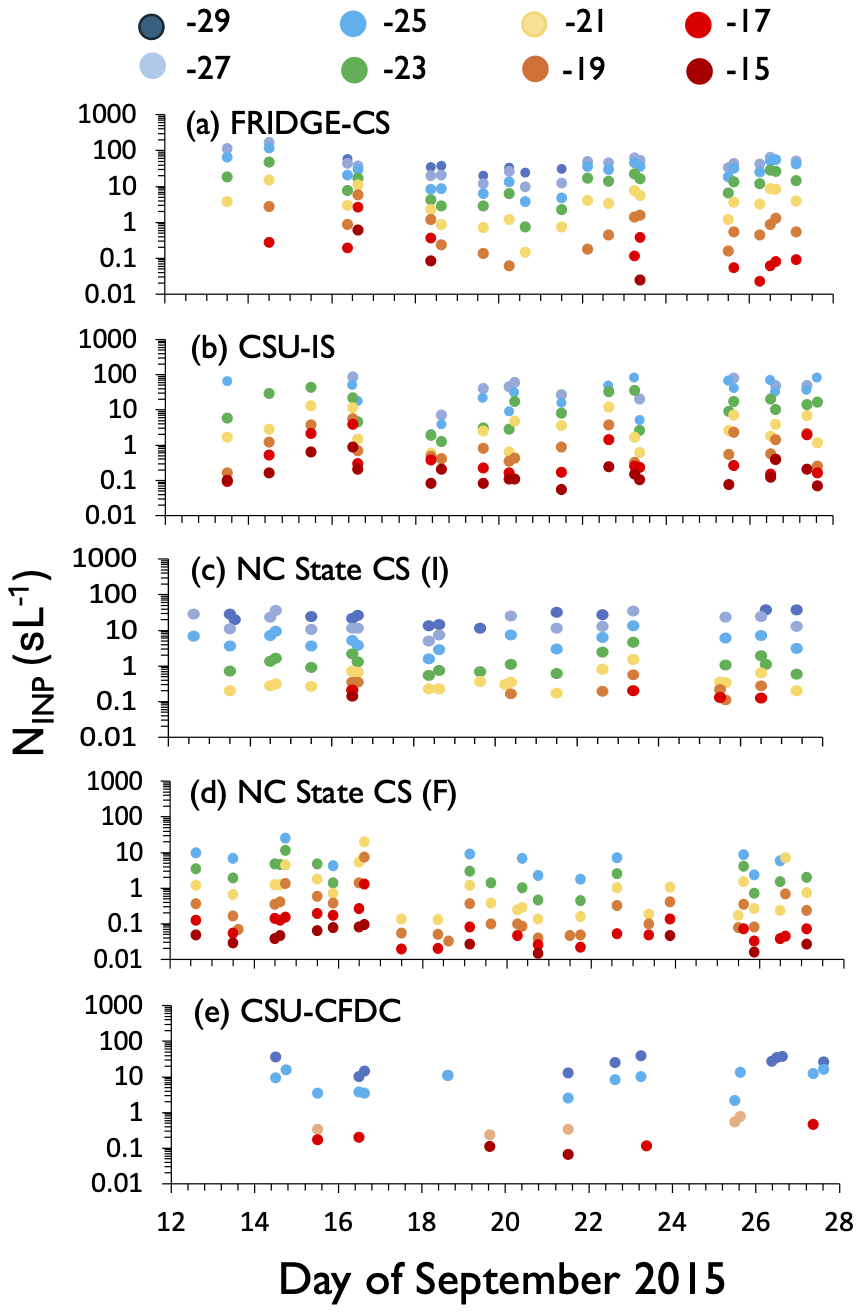
Figure 7Time series of immersion-freezing-mode INP concentrations (sL−1) measured during intercomparison periods by (a) the FRIDGE-CS, (b) the CSU-IS, (c) the NC State CS(I), (d) the NC State CS(F), and (e) the CSU-CFDC. An additional data point from the MIT-SPIN is shown as a square data point in the CSU-CFDC panel. Note that data for the CFDC are plotted only for the most common temperatures of −30, −25, −20, and −15 °C. INP concentrations shown in this figure are those measured within 3 h blocks of time but may capture longer or shorter time periods, depending on the specific instrument sampling time that overlapped these periods.
Periods of agreement and discrepancy are clearer in examining the ratios of time-matched and temperature-matched 3 h immersion NINP values that were calculated for each pair of instruments, as shown in Fig. 8. Numbers of overlapping measurement periods, their geometric means, standard deviations, and normal 95 % confidence intervals of all ratios (all times and temperatures) plotted in each panel of Fig. 8 are documented in Table 2. Reiterating what is apparent from campaign-wide results in Figs. 5 and 6, Fig. 8 indicates that the best agreement for short-term periods throughout the study was observed between the FRIDGE-CS and the CSU-IS in which only 4 out of 146 3 h, time- and temperature-matched NINP values (3 %) did not agree within an order of magnitude. Nevertheless, discrepancies of a few times to several times did occur from 16 September onward, focused most often at > −22 °C. These biases flipped in both directions, with the CSU-IS measuring higher from 19 to 22 September and the FRIDGE-CS higher at some other times, notably on 16, 23, and 26 September. None of these periods were distinguished in any discernible manner by weather or aerosol properties. For example, LAS and PALMS concentrations were no more than 20 % different from the FIN-03 campaign means during any of these periods. Aerosol surface areas were about a factor of 2 lower overall during 19 to 22 September than for the period after 23 September (Fig. 2), which does not imply a special sampling bias for larger particles for the IS filter that was open to the air, which is a point we will discuss further below.
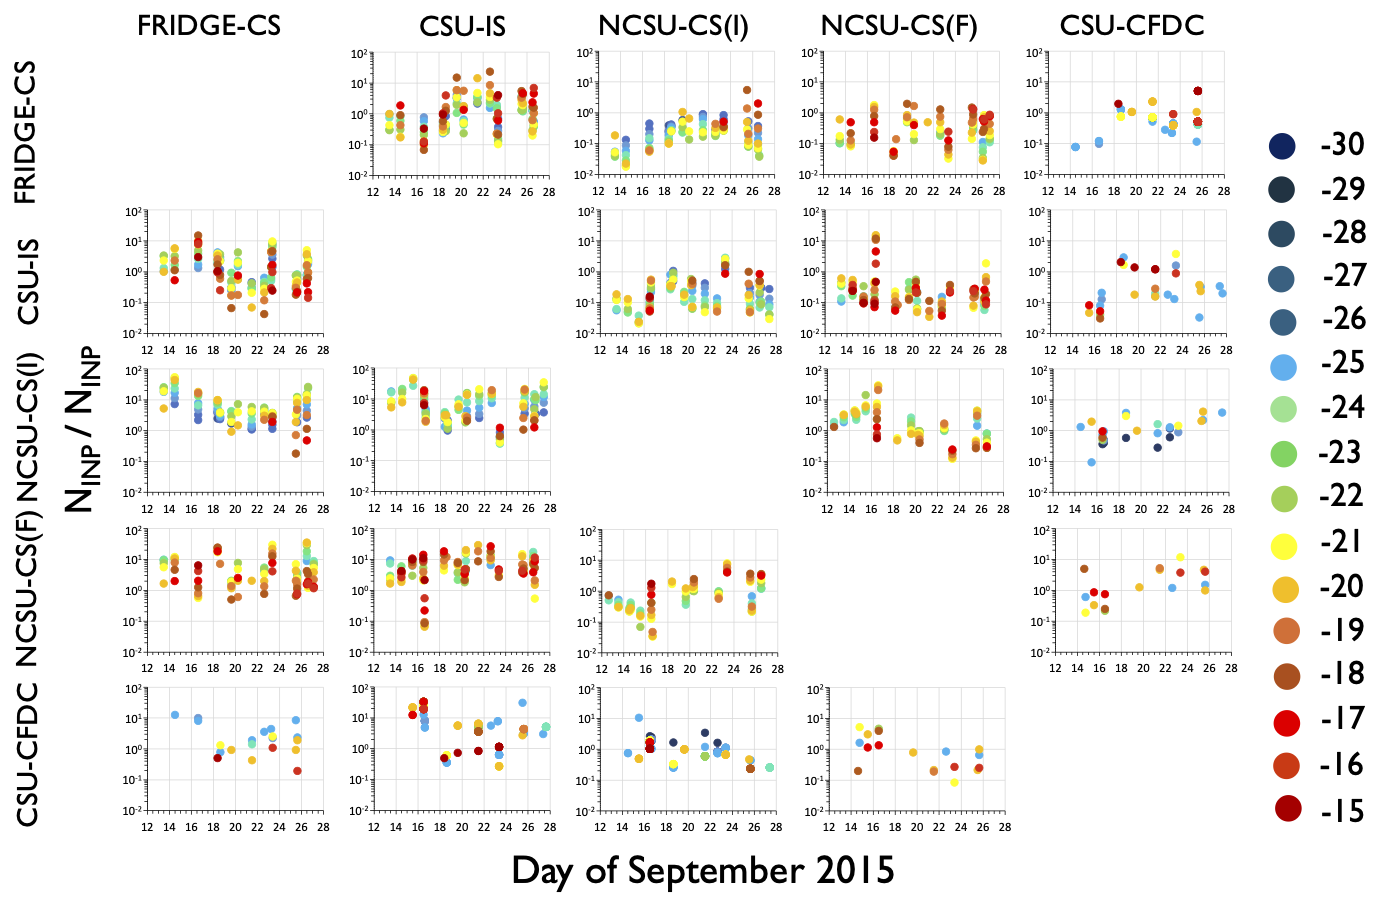
Figure 8Ratios of the immersion-freezing INP concentrations measured by each instrument to the immersion INP concentrations measured by every other instrument (3 h averages). Each instrument (FRIDGE, CSU-IS, NC State-CS(I), NC State-CS(F), and CSU-CFDC) is represented by one of the five columns, as well as one of the five rows.
Table 2Count number, geometric mean, standard deviation (SD), and 95 % normal confidence intervals (CIs) for the NINP ratio data of Fig. 8 in the main paper, including all temperature points. As for that figure, the numerator instrument is on the upper horizontal scale, and denominator instrument is listed on the vertical scale.
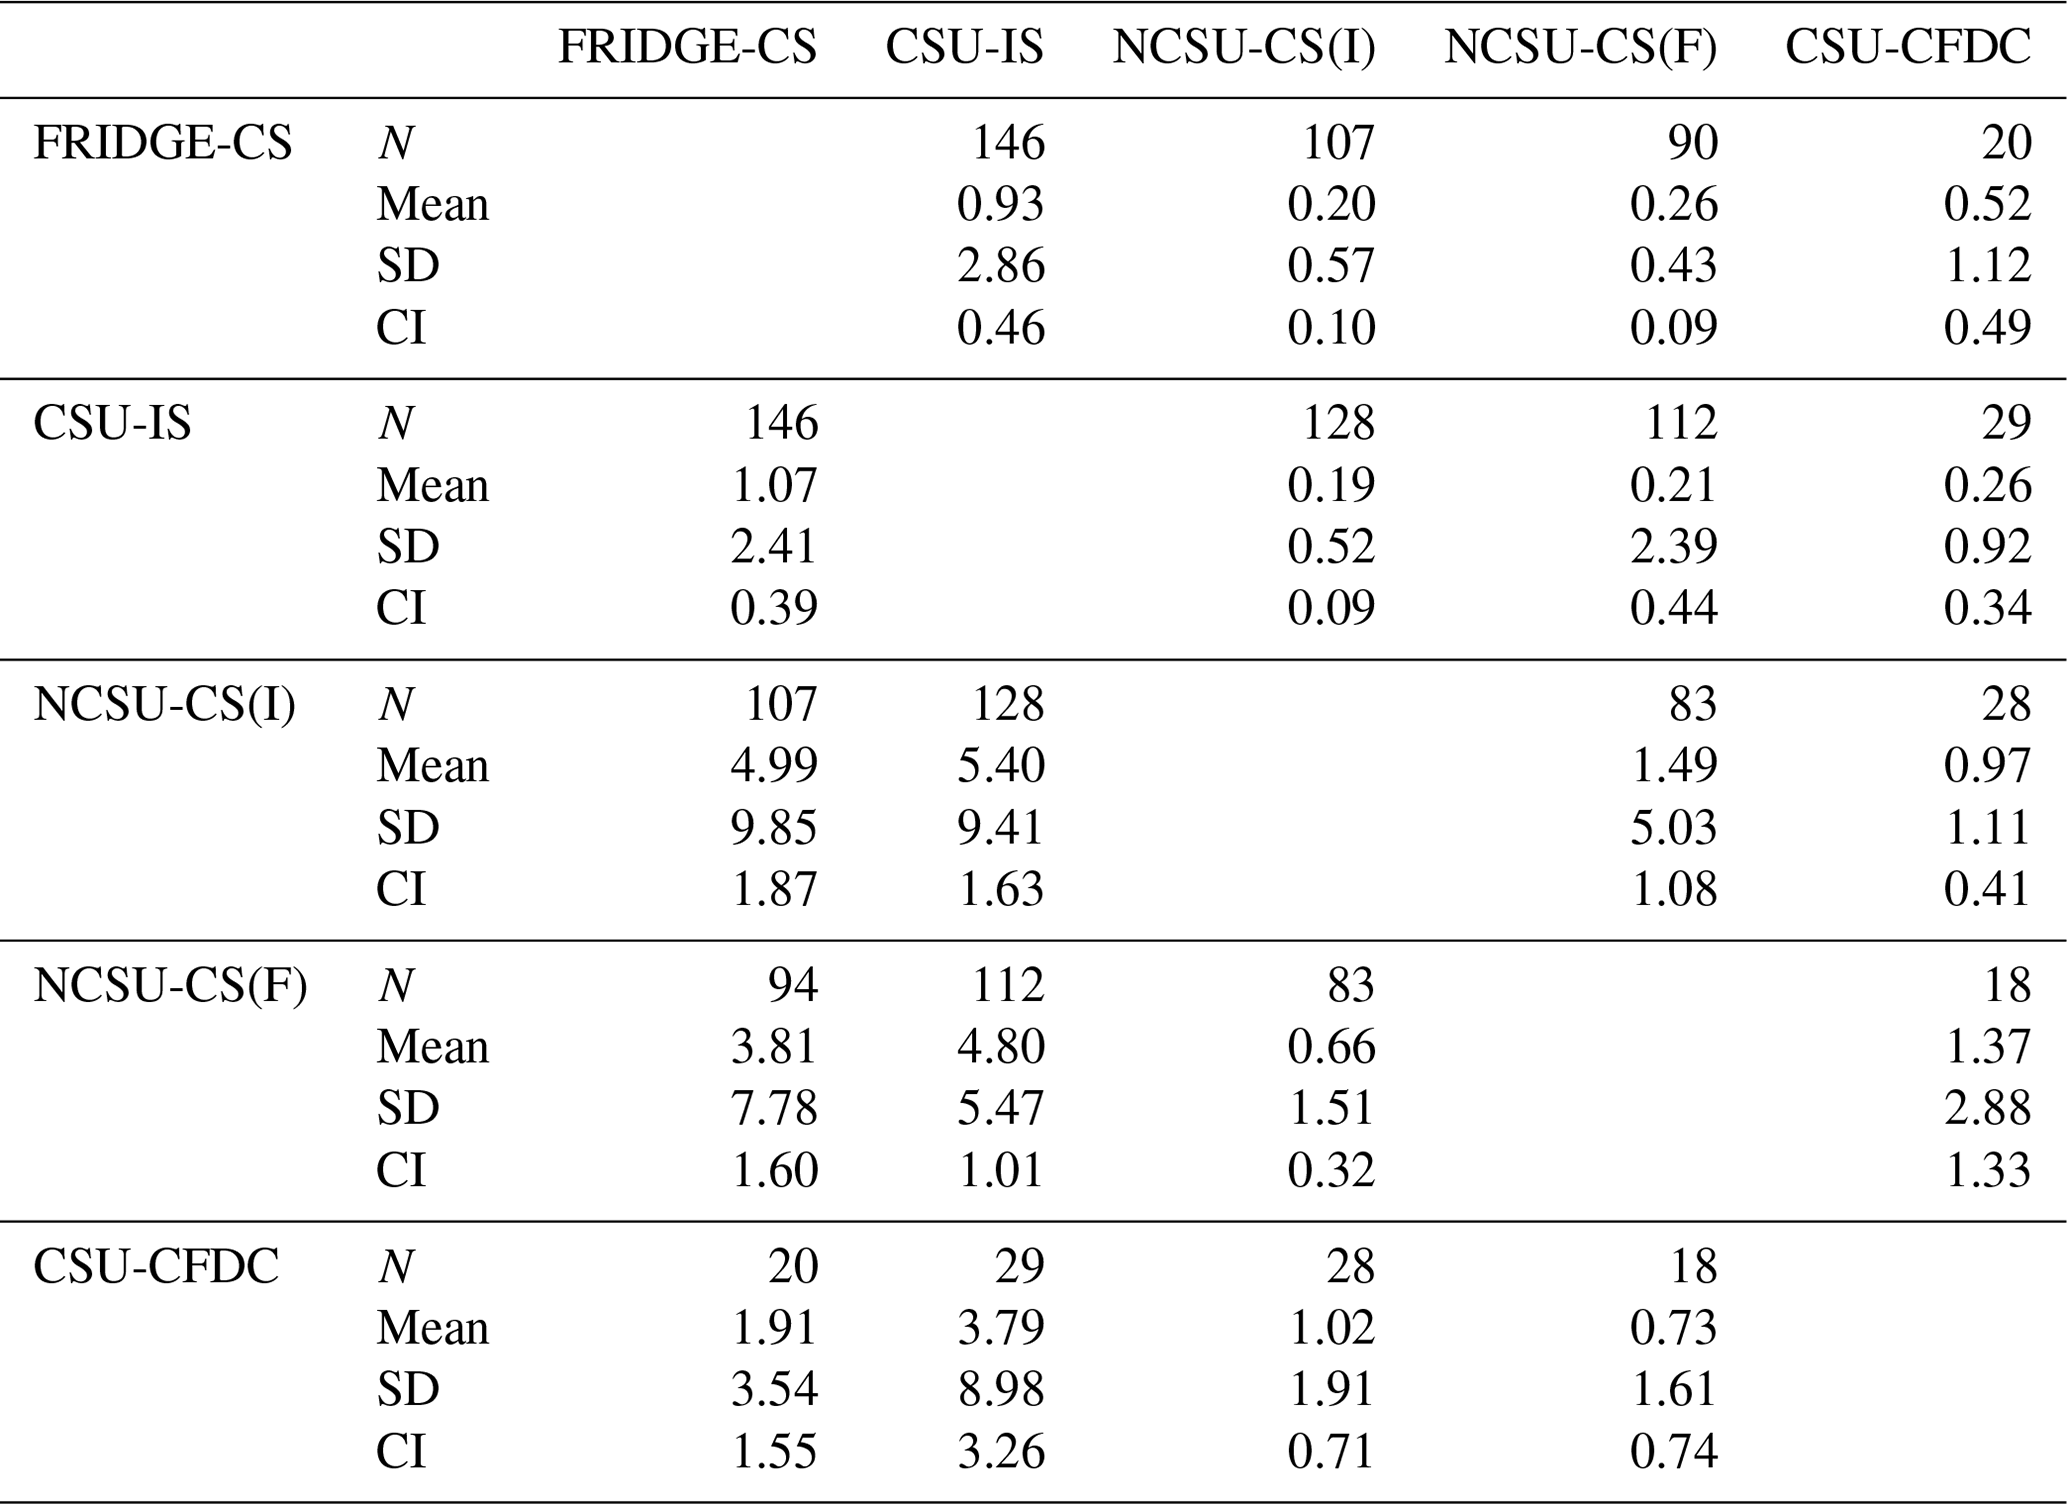
Both FRIDGE-CS and CSU-IS showed high bias from a few to more than 10 times versus NCSU-CS(I) or CS(F), primarily at processing temperatures below −20 °C, whereas ratios closer to 1 indicated much better agreement at > −20 °C later in the study. The poorest agreement overall was observed for the CSU-IS compared to the NCSU-CS(I), a combination for which 26 out of 128 (20 %) immersion NINP means did not agree within an order of magnitude. Agreement between FRIDGE-CS and NCSU-CS(I) was only slightly better, as 15 out of 107 (14 %) time-matched NINP means did not agree within an order of magnitude. Larger than order-of-magnitude discrepancies at lower temperatures were markedly present on 13, 14, 23, and 26 September. Based on PALMS data, 14 September was richer in compounds from biomass burning, poorer in sulfates, organics, and nitrates, and slightly poorer in mineral dust than average, as discussed in Sect. 3.2. The concentration of > 0.5 µm particles measured by the LAS during this time was also relatively high (2.5 cm−3 compared to the campaign mean 0.45 ± 0.62 cm−3). However, the 14 September data are not markedly distinguished overall in the timeline of all INP measurements in Fig. 7, so perturbations to the composition and concentrations of all particle sizes due to the biomass burning event did not appear to especially perturb the INP populations. We have already noted that 23 and 26 September had aerosol populations that were not very different from the project mean on those days.
The CSU-CFDC INP measurements generally agreed with the other measurements within an order of magnitude for data collected on the same day and temperature, except a particularly low bias versus the CSU-IS at higher temperatures on 16 September (rain and hail days) and at lower temperatures on the 25 September. Nevertheless, its measurements of INP concentration had the best agreement with all methods overall for temperatures of > −20 °C, although for the most limited number of matches (18 of 29). CSU-CFDC INP concentrations also tended to be lower than those from the FRIDGE-CS and CSU-IS at temperatures below −20 °C. A similar divergence in online versus offline NINP measurements in this temperature range was reported by DeMott et al. (2017) for ground-based sampling, with online measurements tending to measure progressively lower INPs than offline integrated filter or impinger collections at below −20 °C approaching 1 order of magnitude below −25 °C. At the Puy de Dôme mountain station (Lacher et al., 2024), only modest and insignificant underestimates were made by the CSU-CFDC (also using 2.5 µm and using the impactor) versus offline INP concentrations when all measurements were made from a PM10 inlet. CSU-CFDC INP measurements were comparable on average with measurements from the NCSU-CS(I) and NCSU-CS(F), consistent with the mean results shown in Fig. 5.
Comparing the timeline of the ratios of NCSU-CS(I) to NCSU-CS(F), only 3 out of 83 (3.6 %) of the INP concentrations obtained through analysis by the identical offline apparatus differed by more than an order of magnitude.
Despite the discrepancies noted in the time- and temperature-matched data, a more positive message from the intercomparison is that the mean NINP values reported by different instruments for all temperature conditions taken together generally fell well within a span of 1 order of magnitude. Figure S3 (values provided in Table 3) shows the percent of immersion INP measurements in which all instrument pairs agreed within 1 order of magnitude. This is also consistent with the representation shown in Fig. 6 for which linear regressions imply that the CSU-IS measured NINP values that are a factor of 1.4 to 8 times higher than other methods. Similarly, and importantly, the geometric mean ratios for Fig. 8 listed Table 2 were below a factor of about 5 in all cases. This level of agreement compares well with the findings from FIN-02 for which the immersion NINP values measured by several online and offline instruments agreed within an order of magnitude. This is encouraging, given that FIN-02 was a laboratory intercomparison on single composition aerosol samples consisting of particles with diameters of < 2 µm, whereas FIN-03 was a field campaign in which temporal changes in the concentration, size distribution, and composition of INPs at the Storm Peak Laboratory were all potential factors. This level of correspondence shows that field data can be collected with nearly the same level of accuracy as laboratory experiments. While also mimicking the results of DeMott et al. (2017) for a smaller instrument comparison exercise, the agreement was quite similar to that found in another recent intercomparison, where INP concentrations measured by multiple systems were found to match within a factor of 5 (Lacher et al., 2024).
Table 3Percent agreement within 1 order of magnitude of NINP values at all times and for all temperatures.
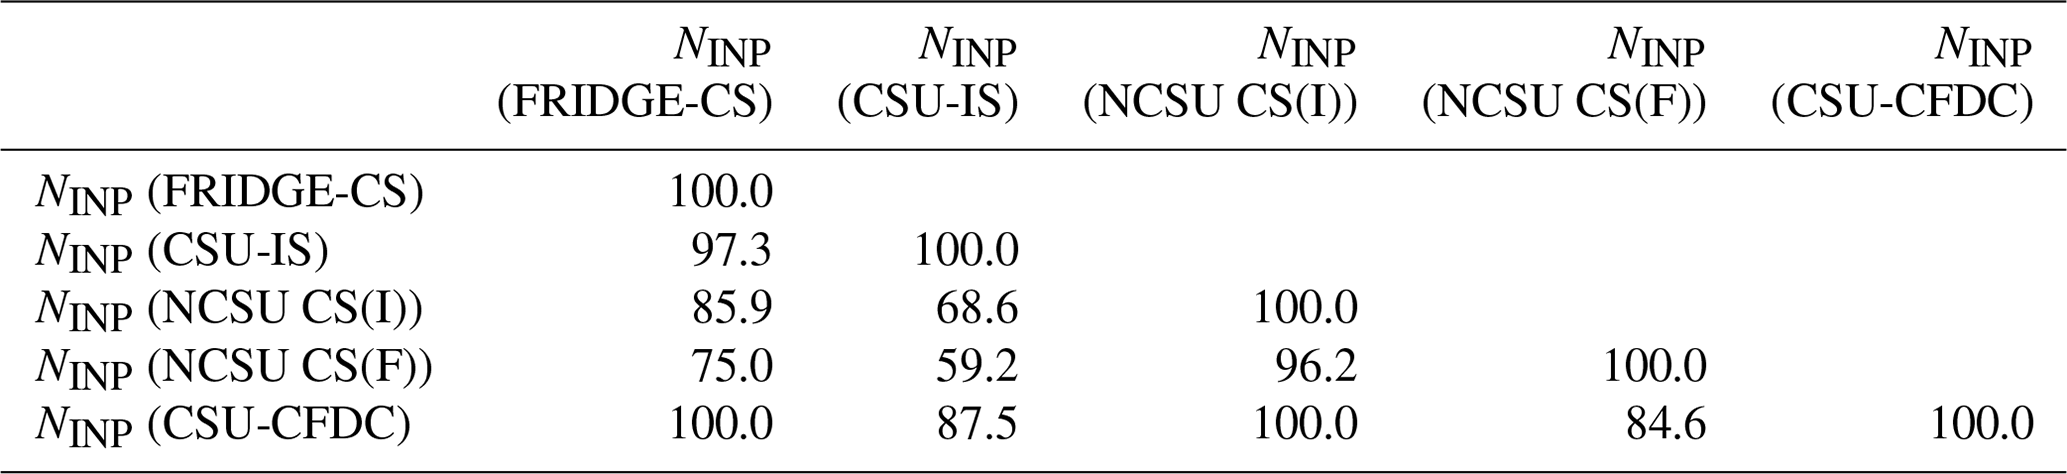
A possible explanation for the NINP measurement discrepancies that has been tendered in other intercomparison campaigns sampling ambient air is that INPs are highly sensitive to the size range of collected aerosol, and systematic size-dependent differences in collection efficiencies vary for different collection types (DeMott et al., 2017; Knopf et al., 2021; Lacher et al., 2024). For example, Lacher et al. (2024) found significant underestimates of INPs in both online and offline methods measuring from the PM10 inlet versus offline measurements from filter collections made on the laboratory rooftop. In this study, as we have noted above, a similarly consistent difference between the rooftop versus the laboratory or between online and offline measurements is not found. FRIDGE-CS INP concentration measurements from the turbulent-flow inlet and CSU-IS INP concentration measurements from the rooftop filter agreed within an average of about 30 % over the course of the study. The CSU-CFDC INP measurements that were limited and thus biased by its upstream total particle impactor (at 2.5 µm) agreed well on average with the NCSU(F) and (I) measurements, although we may note that if the CSU-CFDC data had been corrected for the instrumental loss of particles “out-of-lamina” as found for measurements on mineral dust (DeMott et al., 2015), then the INP concentration results would have been within a factor of 2 of the CSU-IS and FRIDGE-CS data. Larger particles do tend to have a higher likelihood of containing ice nucleation sites, so biases in their collection can lead to sometimes large differences in assessed INP concentrations (Mason et al., 2016). Disaggregation of the very largest collected particles when placed in water suspensions has also been implicated for discrepancies between different substrate collections (DeMott et al., 2017; Lacher et al., 2024). For example, if there are very large aggregates that are preferentially collected by one substrate versus another, disaggregation in water could lead to a high bias in ice nucleation sites that is effective at lower temperatures. There may have been additional line losses for the online instruments sampling from an inlet and using tubing to transfer particles, though these tend to be of minor influence at below the impactor size cut (Knopf et al., 2021). The impinger is known to be less efficient for small (< 200 nm) and large (> 10 µm) particle capture, but unless the relatively light to moderate wind conditions at the inlet during FIN-03 conferred some special bias, Hader et al. (2014) predict a 50 % capture efficiency at near 10 µm. The filter samplers on the rooftop should have been equivalent, with the only difference being the orientation of filters for the NCSU samples (mounted face-down). The size bias in this configuration is unknown. The FRIDGE filter should have captured particles with the same efficiency as the turbulent-flow inlet, since only a very short line connected the filter to the interior inlet structure in the laboratory. If very large INPs of > 13 µm were dominant by number amongst total INPs, which is unexpected, then the FRIDGE filter collection would have been expected to differ from the rooftop CSU-IS filter collections.
Besides size-dependent sampling biases, the fact that measurements of immersion-freezing INP concentrations from ambient air can be uncertain by up to 1 order of magnitude may result from unquantifiable random or non-random factors or, more likely, from quantifiable factors that were not fully controlled in this field study or easily controlled across investigating teams in general. Examples of known issues that were only documented after FIN-03 relate to inconsistency in sample materials or sample handling and storage (e.g., Barry et al., 2021b; Beall et al., 2020).
3.4 Relation of immersion-freezing INPs to aerosol properties
While establishing correlations between INPs and aerosol properties were not a focus of the intercomparison, the ancillary aerosol data did allow the inspection of some simple linear correlation analysis. This provides insight into the size range of greatest relevance for the INP intercomparison period. Throughout the campaign, a positive and significant trend between total LAS particle concentration (i.e., > 0.1 µm) and NINP values were observed for FRIDGE-CS (R = 0.55–0.74 and p < 0.05 for measurements at −28 °C < T < −15 °C), but no clear or statistically significant trend was observed between the total LAS particle concentration and the NINP values for the other four instruments (Fig. S4a). A greater number of significant positive trends were found between the concentration of particles with diameters of > 0.5 µm and NINP values. This was the case for the FRIDGE-CS (R = 0.54–0.94 and p < 0.05 for measurements at −28 °C < T < −19 °C), CSU-IS (R = 0.46–0.72 and p < 0.05 for measurements at −21 to −25 °C), NCSU CS(I) (R = 0.46–0.61 and p < 0.05 for measurements at −29 °C < T < −24 °C), and the NCSU CS(F) (R = 0.51–0.64 and p < 0.05 for measurements at −26 °C < T < −22 °C).
No consistent significant (p < 0.05) correlation was found between changes in composition (from the PALMS categories and WIBS-4A types) and immersion-freezing NINP values across the range of set point temperatures employed during FIN-03 (Fig. S4b).
3.5 Inferences to INP compositions during FIN-03
To provide a context for the discussed intercomparisons, and because this study provides data needed for testing the relevance of existing parameterizations of ice nucleation in regional and global climate models (Andreae and Rosenfeld, 2008; Morris et al., 2011; Seifert et al., 2011), we utilize some previously developed ice nucleation parameterizations for specific compositions to diagnose consistency or not with INP compositions in the high-altitude environment of FIN-03. We examine parameterizations for mineral dust INPs that have different links to larger-sized particle concentrations (DeMott et al., 2015) versus mineral dust surface area (Niemand et al., 2012) and biological INPs as linked to fluorescent particle concentrations (Tobo et al., 2013; Twohy et al., 2016). Hereafter we will refer to these parameterizations as DeMott 2015, Niemand 2012, and Tobo 2013. We also utilize a more direct method of probing INP compositions using the CSU-IS sample treatments discussed in Sect. 2.2.2 and the CSU-CFDC heat treatments of single particles discussed in Sect. 2.2.1. In relation to the latter investigations, we also introduce diagnostic tests of the arable soil dust INP parameterizations of Tobo et al. (2014).
Each of the above-noted deterministic parameterizations was used to predict NINP values at −30, −25, −20, and −15 °C using the equations and inputs described in Table 4 and summarized below. We do not attempt an analysis using stochastic parameterizations.
- 1.
DeMott 2015 is based on CSU-CFDC laboratory measurements of ice nucleation on mineral dust soil samples, as well as field data from situations dominated by mineral dust (i.e., dust plumes from major deserts), collected for CFDC operational conditions essentially the same as for this study (i.e., simulated immersion-freezing conditions at 105 % RH) (DeMott et al., 2015). For FIN-03, aerosol concentrations measured by the LAS (> 0.5 µm dry diameter) and converted to STP concentrations were used as the input for this parameterization for comparison to INP data that are also reported at STP concentrations. Predictions also depend on temperature (Table 4). Since PALMS data indicate that dust particles dominated the coarse mode only at sizes above 1 µm in diameter (Fig. 4), we first adjust the LAS data accordingly for the percentage of dust particles with diameters of > 0.5 µm as input to this parameterization, which we have already stated is 23 %. A correction factor (CF) of 3 was also applied (as indicated in Table 4), according to the results in DeMott et al. (2015), which showed that when applying the parameterization to represent immersion-freezing dust INP concentrations in a model or in comparison to other immersion-freezing methods, this CF is needed to account for CFDC underestimates of immersion-freezing INPs (see Sect. 2.2.1). The CF is applied in this case because calculations will be compared to the average NINP values from all measurements.
- 2.
The Niemand 2012 parameterization (Table 4) for mineral dust INPs is based entirely on laboratory measurements and incorporates measurements of temperature and particle surface area as the basis for prediction of INPs. It is especially important to limit the size range of aerosols for which this parameterization is applied because the total surface area was dominated by small particles in FIN-03. Therefore, with reference to Fig. 4, we will assume that all dust surface areas occupy sizes larger than 0.5 µm and represent 50 % of that surface area.
- 3.
As discussed earlier, we use two definitions of FBAPs at sizes larger than 0.5 µm and temperature to predict biological INP concentrations based on Tobo 2013, as defined in Sect. 2.1, presuming to bracket the low and high estimates of their links to INPs. We also explore links of higher-temperature freezing data (> −20 °C) to FP3 particles, using the same scalings of the relation between FP3 concentrations and INP concentrations as a function of temperature that were established by Cornwell et al. (2023) for a coastal California environment. While we have no reason to expect that these scaling factors listed in Table 4 are valid for the high-altitude continental environment of FIN-03, they are starting points to explore this additional link of certain FBAP particles to INPs.
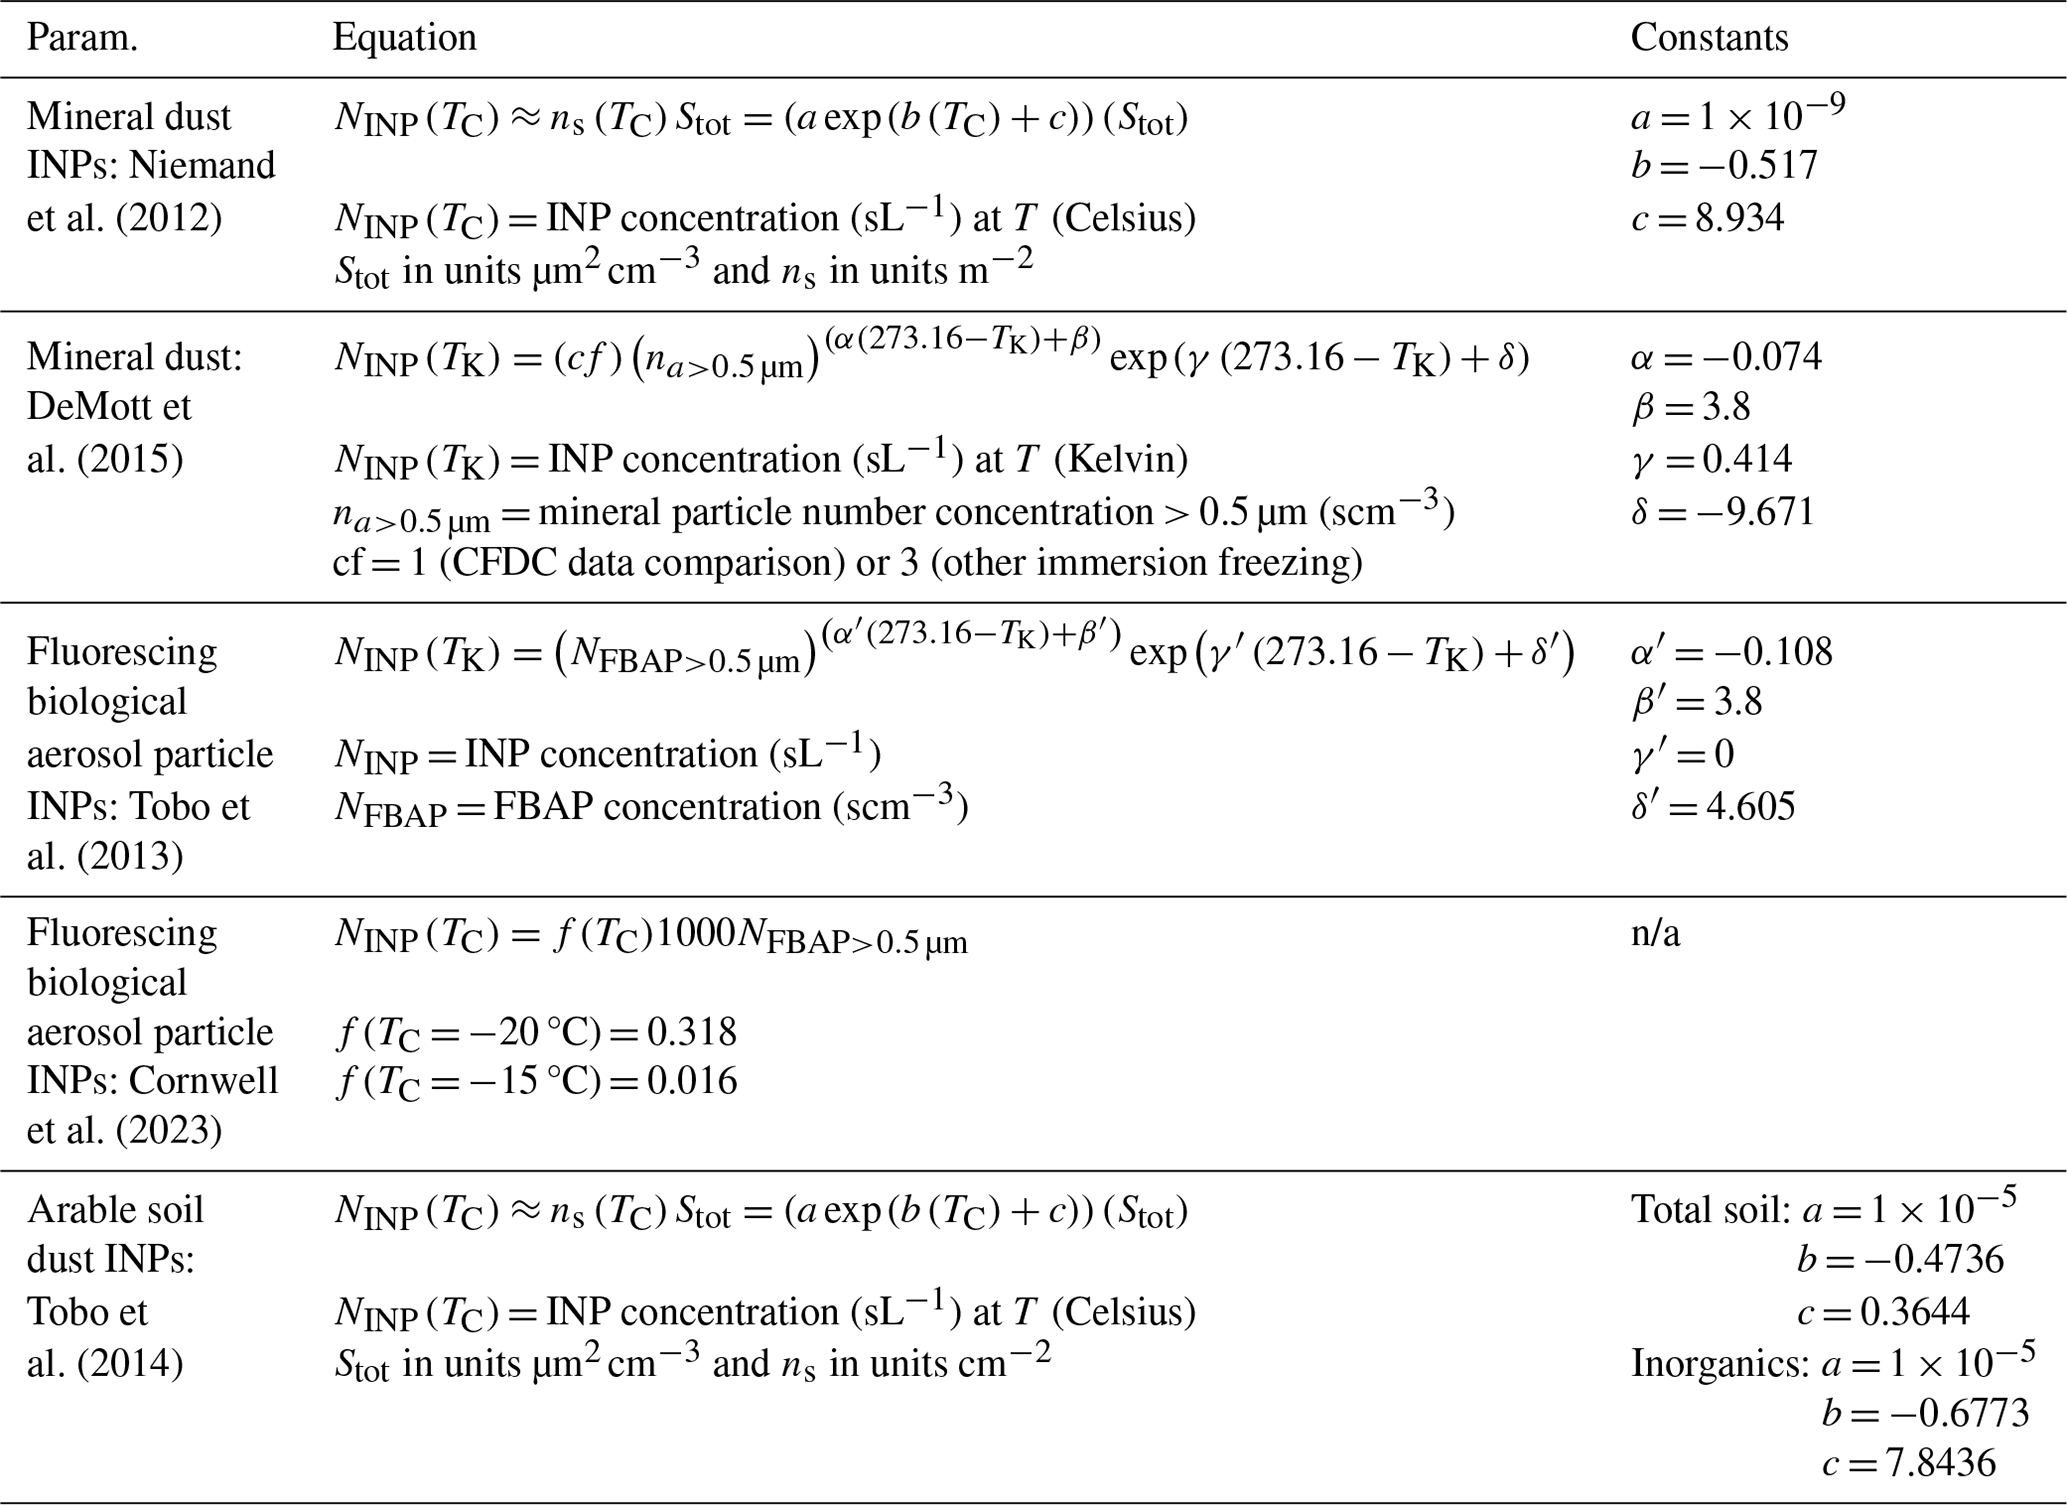
To compare these parameterized values with observations, overall mean observed immersion-freezing NINP values were calculated for each 3 h period based on all the available data from all the instruments. This was considered a reasonable approach since it factors in the inherent variability found between methods. Immersion-freezing NINP values were predicted for each parameterization using mean WIBS-4A and LAS concentrations (also at STP) that were collected during the coincident 3 h periods of time as the INP data. The observed and predicted immersion-freezing NINP values are plotted against each other in Fig. 9. Four temperatures of comparison (−15, −20, −25, and −30 °C) are presented in Fig. 9 for DeMott 2015, Niemand 2012, and Tobo 2013, while two temperatures of comparison (−15 and −20 °C) are used for links to FP3-based prediction of biological INPs. Temperatures are indicated via levels of shading of the data points.
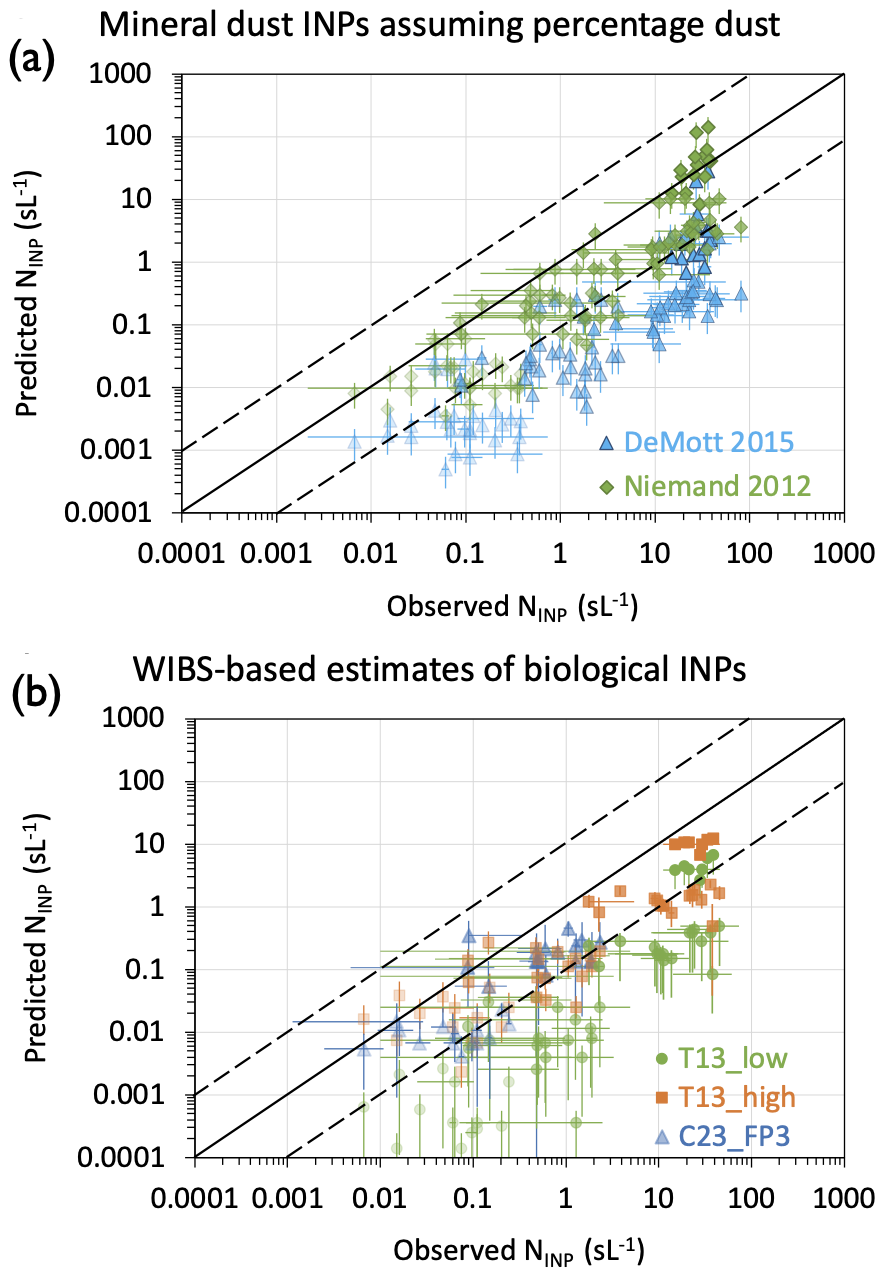
Figure 9(a) Comparison of mean observed NINP values (all-instrument average) and predicted NINP values calculated from DeMott et al. (2015) (DeMott 2015) and Niemand et al. (2012) (Niemand 2012) mineral dust INP parameterizations at temperatures −30, −25, −20, and −15 °C (gradations in shading from dark to light) for the PALMS-estimated percentages of the dust particle number and surface area at sizes above 0.5 µm. Mean NINP values are averaged over 3 h periods, and plotted uncertainties are standard deviations. Predicted NINP uncertainties are propagated based on 25 % uncertainty in the aerosol number and surface area concentrations. (b) Comparison of mean observed NINP values and predicted NINP values calculated from parameterizations linking to FBAP concentrations from Tobo et al. (2013) (T13_low and T13_high; see text for description) and from Cornwell et al. (2023) (C23_FP3), following the FP3 particle definition of Wright et al. (2014). Only −15 and −20 °C comparisons are shown for the FP3 prediction. The solid line in each plot is the 1:1 line, and the dashed lines represent an order of magnitude in both directions.
Using the constraint on mineral particles from the combination of PALMS and LAS data for the campaign average, predictions underestimate the mean NINP values at all temperatures (Fig. 9a). The Niemand 2012 surface-area-based INP estimates come modestly closer to observations, averaging 25 % of the total INP concentrations at all times and for all temperatures, while the DeMott 2015 predictions average 4 % of INP concentrations, with the large variability apparent. These results can be expected to be highly sensitive to the assessed average mineral particle fraction at sizes above 0.5 µm (varied over the study) and sensitive to whether particles that have a source from regional soils will be represented only by those with mineral content. Therefore, for comparison, parameterization results in Fig. S5 use the assumption that all particles at diameters exceeding 0.5 µm were dust particles. In this case, a somewhat unrealistic maximum assumption on soil dust numbers and surface area that considers all particles and compositions in this size range to be emanating from dust, Niemand 2012 estimates a dust source of 50 % and DeMott 2015 estimates 25 % of observed INPs on average. Thus, the predictions of the two parameterizations become more closely aligned for the assumption of more overall mineral dust particles in the size range larger than 0.5 µm. A discrepancy has been noted previously in applying these parameterizations to link to the aerosol model in an Earth system model for the Southern Ocean region (McCluskey et al., 2023). In that case, calculations were based on aerosol-model-derived dust distributions and occurred under very low dust loading scenarios in which neither parameterization has been firmly tested in the laboratory or field. Under both assumptions on the mineral particle number, since DeMott 2015 was developed based on CFDC measurements for particles of < 2.5 µm in the field and laboratory, a low bias compared to Niemand 2012 might be expected in comparison to average immersion-freezing data that includes larger particles.
The timeline of predicted NINP values for the two dust parameterizations in comparison to the mean observed NINP values is shown in Fig. 10 for the same temperatures used in Fig. 9. These analyses emphasize that (1) INP observations do not show a special enhancement during the biomass burning event at the start of FIN-03, and hence, a closer agreement of the dust parameterizations with observations at that time is likely an artifact of attributing dust-like INP activation properties to the dominant biomass burning compositions at that time. (2) The structure of the timeline of predicted NINP values resembles that of the observed NINP values only below −20 °C, as expected for a dominance of dust-like INPs. (3) The predictions fare less well in describing the observed INP populations at > −20 °C, which is where biological INPs may be expected to have greater influence. Thus, these analyses overall suggest the presence of a dust-like immersion-freezing INP type that is active at lower temperatures during FIN-03 but that the typical INP efficiency (INPs as a function of the dust concentration and temperature) attributed to mineral dust underestimates the freezing behavior of INPs overall during the period of study.
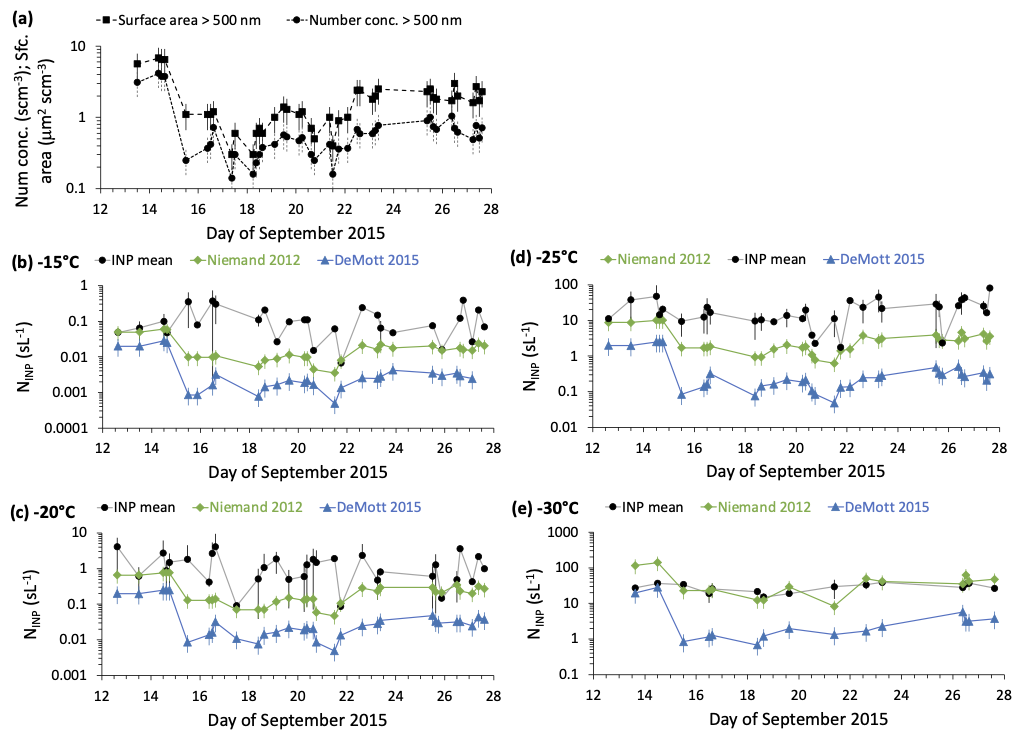
Figure 10Time series of aerosol number concentration and surface area (3 h averages at the STP) in panel (a). Observed mean measured immersion-freezing NINP values (INP mean) plotted with predicted NINP values from the mineral dust parameterizations of Niemand 2012 and DeMott 2015, as described in the main text (all 3 h averages at the STP), at temperatures of −15, −20, −25, and −30 °C in panels (b) to (e), respectively. Lines are intended only to connect data points and do not imply knowledge of the intermediate values. Uncertainties mark 1 standard deviation above and below the mean values of all parameters.
For FIN-03, the Tobo 2013 parameterization of biological INPs consistently underpredicted NINP values, independent of the WIBS FBAP definition used, which are denoted as T13_low and T13_high in the scatterplot comparison of measured versus predicted values (at all times and temperatures) in Fig. 9b and the timeline comparisons at −15 and −20 °C that are shown in Fig. 11. Figure 11 also shows the timeline of WIBS total fluorescent particle concentrations, the high- and low-FBAP concentrations, and FP3 concentrations. The higher-FBAP prediction of INPs falls much closer to the observations than the low-FBAP prediction in Fig. 9b and shares some proximal equivalence to observations at −15 to −20 °C at times. This result is like that found by Twohy et al. (2016) for air over the site where Tobo et al. (2013) collected their data, with the higher-FBAP estimate bounding the upper end of the measured immersion-freezing INP concentrations at temperatures of > −20 °C. Also notable in Figs. 9b and 11 is that the C13-FP3 INP concentration predictions filled a similar space to the T13_high estimates, coming closest together at −20 °C. While these results suggest that biological INP parameterizations can explain the higher-temperature INP concentrations observed during FIN-03, with caveats on the large and likely not fully quantifiable uncertainty in such predictions, the temporal analysis indicates that there is no consistent temporal agreement between predicted and measured INPs, even if different scaling factors were applied to the predictions. Predictions at −20 °C show better overall agreement, while those at −15 °C suggest that the Cornwell et al. (2023) scaling factor should be higher for the SPL site at the time of FIN-03 to better describe mean values of biological INP concentrations using the FP3 particle signal.
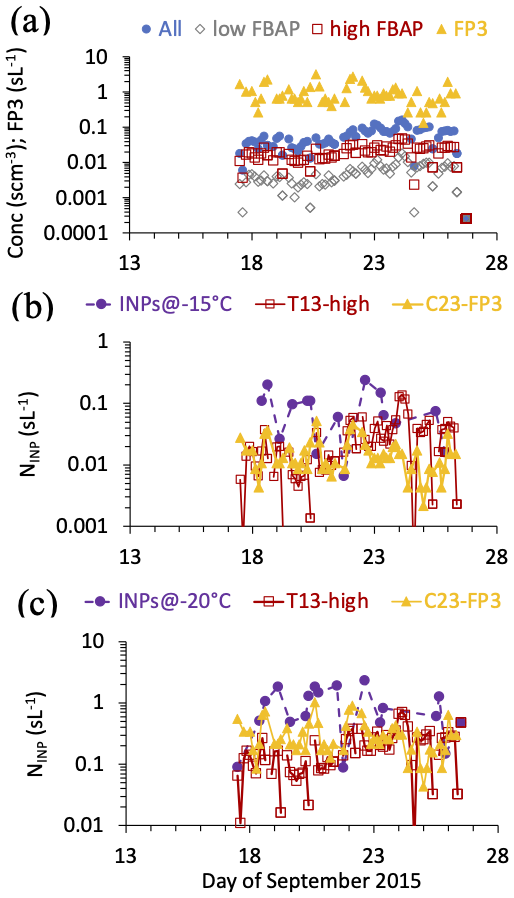
Figure 11(a) Timelines of WIBS-based fluorescent particle assignments (all fluorescing in any channel, with low and high FBAPs and FP3 particles), as defined in the text, during FIN-03. (b) INP-observed mean concentrations and biological INP parameterization predictions linked to high FBAPs, following Tobo et al. (2013) (T13_high), and FP3 particles, following Cornwell et al. (2023), are at −15 °C in panel (b) and −20 °C in panel (c).
The results of CSU-IS and CSU-CFDC treatments on INP concentrations measured for 3 (of 21 overall) intercomparison time periods are shown in Fig. 12 for an examination of the consistency with the results of the diagnostic parameterization analysis just discussed. In Fig. 12a–c, it is seen that thermal treatments indicated the strong contribution of the inferred biological INPs primarily at temperatures higher than about −20 °C but that the peroxide digestion of organic compounds lowered INP activity at all tested temperatures by an order of magnitude on average. Similar reductions in INPs measured for single particles by the CSU-CFDC following dry heating (Fig. 12d–e) demonstrate a strong consistency with the IS results for bulk immersion freezing on the dominance of organic INP compositions, even though the CSU-CFDC-measured unamended INP concentrations were always lower. The CSU-IS heat treatment results (Fig. 12a–c) suggest that biological INPs may have been ubiquitous during FIN-03 at temperatures above −20 °C, and even extended to lower temperatures at times, as indicated by the results from 25 September. This is broadly consistent with the parameterization results based on FBAP measurements, although the Tobo 2013 and FP3 parameterizations did not capture all the influence of apparent biological INPs during the study. Whether for size-limited values (< 2.5 µm) as in CSU-CFDC measurements or bulk aerosol collected for CSU-IS immersion-freezing measurements, the inferred INP compositions that were typically dominated by organics at temperatures of < −20 °C could reflect origins from arable soil dust (Testa et al., 2021) that surround the region of study. Biomass burning aerosols also have influence as organic INPs (Schill et al., 2020; Barry et al., 2021a). However, while biomass-burning-type particles were noted as a prevalent composition in FIN-03, these types of potential INPs likely cannot explain INP concentrations in FIN-03 because Barry et al. (2021a) showed that western US biomass burning INPs have active site densities about 3 orders of magnitude lower than those attributed to dust particles that also were ubiquitous at modest number concentrations during FIN-03. Furthermore, the strong biomass burning event noted on 14 September had only modest, if any, apparent impacts on INP concentrations despite greatly elevated aerosol concentrations and surface areas, as already mentioned above (Fig. 10).
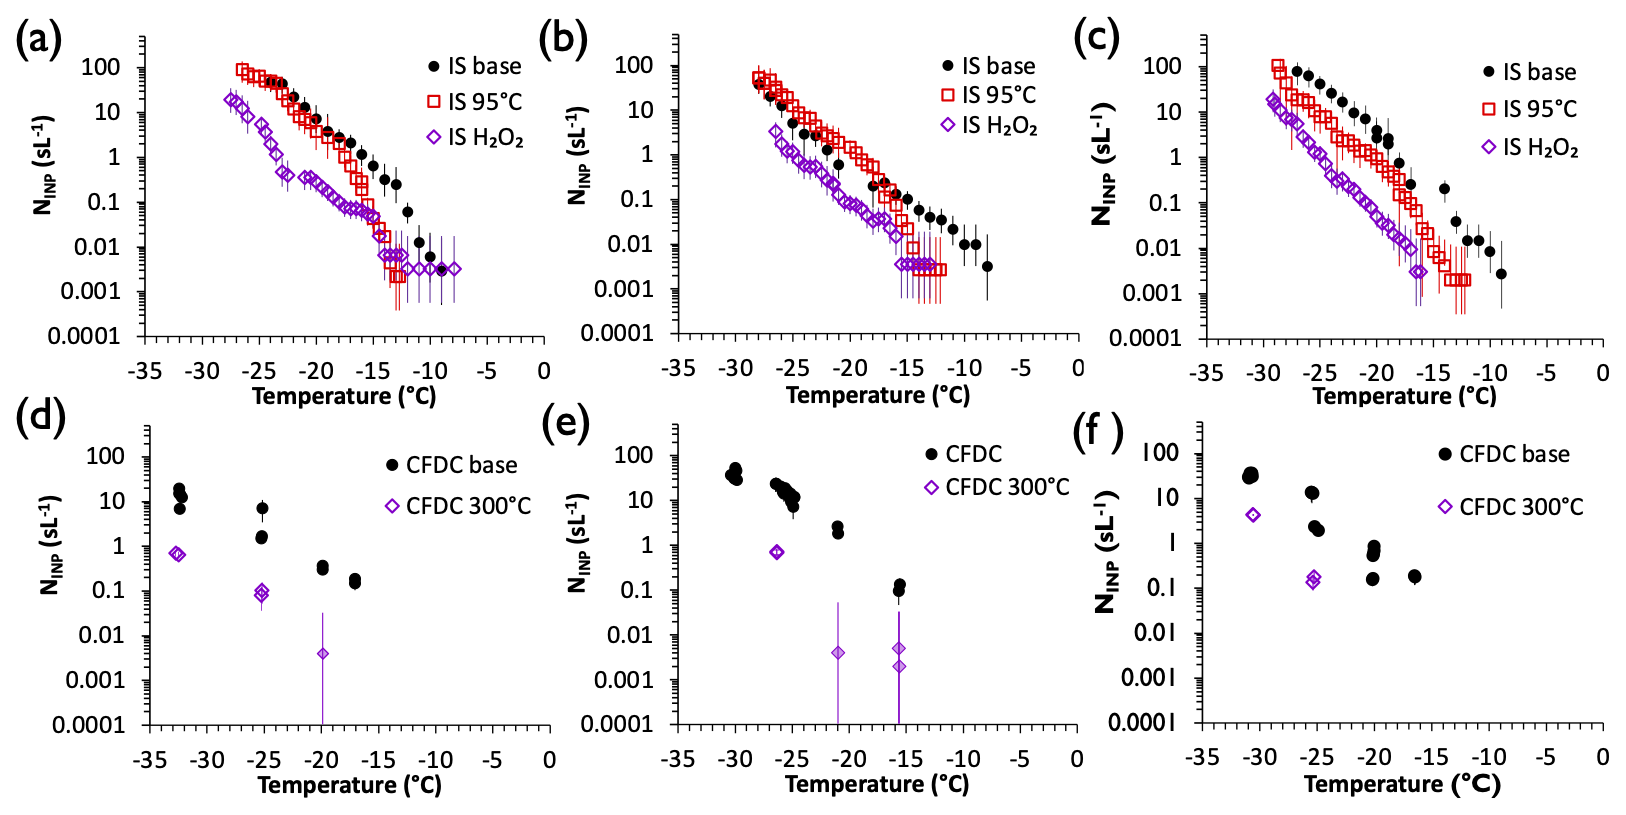
Figure 12Summary of treated IS filter suspensions using heat and peroxide (a, b, c) and dry-heat-treated CSU-CFDC single-particle data (d, e, f) for 15, 23, and 25 September (a–c and d–f, respectively). Error bars represent 95 % confidence intervals for individual experimental spectra for the CSU-IS and for individual CSU-CFDC measurements.
Finally, in Fig. 13, we address whether the treatment results support the conclusion of the diagnostic parameterization analysis suggesting that inorganic INPs (mineral particles in particular) were of minor influence during FIN-03. For this purpose, we introduce results for the parameterization of Tobo et al. (2014) (hereafter, Tobo 2014) for arable soil dust INPs listed in Table 4. Tobo 2014 parameterized the ice nucleation behavior of soil dust from Wyoming, which is regionally proximal to the FIN-03 site at the SPL, specifically using the CSU-CFDC dry-heat method at 300 °C to indicate organic versus inorganic INP contributions from such soil particles. A caveat is that their results were for dust generated in the laboratory and size-selected at 600 nm. This parameterization, like Niemand 2012, is based on the surface area of dust particles, and so we apply the same assumptions as before to restrict to the proportion of dust larger than 0.5 µm. Since the CSU-CFDC is also restricted to measuring INPs at diameters below 2.5 µm, we apply a correction factor to the surface area to account for the fact that the surface area below this size was 90 % of the project average total surface area. No significant impact of the treatments is assumed on aerosol concentrations or surface area at sizes above 0.5 µm in Fig. 13.

Figure 13(a) Comparison of all untreated CSU-CFDC data (black circles), cases after passing through the upstream 300 °C tube heater (purple diamonds), and calculations from the DeMott 2015 dust parameterization in (orange squares) and with CF = 1 as appropriate for a direct comparison to CSU-CFDC data (see the text). (b) The same exercise as in panel (a) but using predictions of total soil organic INP concentrations and inorganic INP concentrations within soil INPs from Tobo et al. (2014). (c) The same exercise but for all CSU-IS data and the cases with peroxide digestion. In this case, CF = 3 must be used in DeMott 2015, and the mineral dust INP prediction of Niemand 2012 is also shown.
Figure 13a and b focus on specific comparisons to CSU-CFDC data. In Fig. 13a, it is seen that INP concentrations predicted by the DeMott 2015 parameterization for sampling periods during the entire campaign show remarkable agreement with the 300 °C CSU-CFDC data on selected days when applying CF = 1 in the parameterization, as is appropriate for a direct comparison to CSU-CFDC instrument data that are uncorrected for the underestimates that led to selecting CF = 3 for atmospheric modeling studies. In Fig. 13b, it is shown that the Tobo 2014 parameterizations for untreated total soil dust and its inorganic remnants also give very good agreement with CFDC untreated and treated NINP data, supporting the likely important influence of such arable soil dust during FIN-03. We note that we have extrapolated that parameterization to a higher temperature limit of −15 °C instead of the −18 °C limit for the data used in formulating it. Predictions for untreated soils do not quite reach the level of the observed INPs, but this could be explained by the additional contribution of biological INPs that has already been discussed.
In Fig. 13c, direct comparisons of the Niemand 2012 and DeMott 2015 predictions for mineral dust INPs for the entire project are shown in comparison to the CSU-IS untreated and H2O2 treated data on selected days. The DeMott 2015 prediction of INP concentrations uses CF = 3 in this case, as appropriate. The same discrepancy between the DeMott 2015 and Niemand 2012 predictions, as already discussed regarding Fig. 9a, appears in this comparison. Nevertheless, it is seen that both parameterizations grossly underestimate untreated CSU-IS INP concentrations, and the treated CSU-IS results fall between the predicted values, agreeing better with the Niemand 2012 parameterization. One might wish to allude to the fact that the IS filters sample particle sizes to 10 µm and possibly larger that may have higher ice nucleation efficiencies, while the CSU-CFDC was restricted to sampling particles < 2.5 µm as a source for the lower DeMott 2015 estimate in comparison to CSU-IS data; we have already addressed that there was no general consistency in INP concentrations for methods that sampled similar size particles overall. The best that can be stated is that the parameterization exercises and treatment data strongly support that inorganic INPs had a weak influence during FIN-03 and that arable soil dust and biological INPs accounted for the strongest influences during sampling, akin to the findings of Testa et al. (2021).
3.6 Observations of INPs in the deposition nucleation regime
Measurements of deposition nucleation NINP values are summarized in Figs. 14 and 15. FRIDGE-DC nucleation substrates were collected for 1 to 5 periods on many days during FIN-03 and processed at 5° interval temperatures from −15 to −30 °C and for set point humidity of 95 % and 99 % RH (uncertainties to 2 %). Data collected at 102 % via the standard FRIDGE methods are not included herein. CSU-CFDC and MIT-SPIN deposition data were collected nominally at 95 % RH, with an uncertainty of about 2.5 % RH and at a range of temperatures on different days. Mean values and standard deviation error bars of the FRIDGE-DC data are shown in Fig. 14a, and median values of FRIDGE-DC NINP values (with interquartile values as error bars) are shown in Fig. 14b. Standard deviations were large over the course of the study for comprehensive FRIDGE-DC data when binned at 5° interval temperatures. Nevertheless, the average concentrations of deposition INPs measured by the FRIDGE-DC indicated a consistent factor of 3–5 increase between 95 % and 99 % RH over the range of temperatures investigated. NINP differences at the two RH values were slightly smaller for median values (Fig. 14b), and the median values are slightly lower than the means. Finally, FRIDGE-CS values are plotted in each panel of Fig. 14, indicating that FRIDGE-DC NINP concentrations averaged for 99 % RH are factors of 10 to 30 lower than average immersion-freezing NINP concentrations, depending on temperature.

Figure 14Summary of deposition mode NINP values (sL−1) as a function of temperature. In panel (a), mean FRIDGE-DC data at 95 % (open orange circles) and 99 % (open orange squares) RH are shown, along with the mean immersion-freezing data from the FRIDGE-CS (filled orange circles) and the mean for the few cases of statistically significant CSU-CFDC data (filled purple circle) at 95 % RH. Error bars are 1 standard deviation of the means. In panel (b), median FRIDGE-DC data are shown, and error bars for these are the 95 % confidence intervals. The significant CSU-CFDC measurement points at 95 % RH are also shown with their 95 % confidence intervals. Data measured at 95 % RH from the CSU-CFDC and MIT-SPIN that were positively valued, but failed significance testing is shown without errors as open purple and open blue circles, respectively.

Figure 15Time series of FRIDGE-CS (immersion freezing) and FRIDGE-DC (deposition) NINP values measured at (a) −20 °C and (b) −25 °C. Data are from individual filters or wafer collections, and error bars are 95 % confidence intervals.
Significant data for 1 d were obtained for the CSU-CFDC deposition measurements while using the aerosol concentrator on 14 September for three different time periods. These are averaged to create the only online data point represented as a mean in Fig. 14a. The individual period measurements from this day, with confidence intervals as errors, are shown for the CSU-CFDC in Fig. 14b. Thereby, it is seen that these measurements close to −25 °C agree very well with the mean FRIDGE deposition NINP values at −25 °C and 95 % RH. No measurements of significance were achieved with the MIT-SPIN when operating in the deposition regime. In fact, the most common CSU-CFDC and MIT-SPIN deposition nucleation NINP results were below instrument detection limits and did not meet the test for significance despite being positively valued, as shown for all periods from 6 common days of such observations represented in Fig. 14b. Understanding that these data represent a failure to collect statistically defensible data, the non-significant data generally scatter about the significant CSU-CFDC data and the FRIDGE-DC data at 95 % RH, with a higher bias for the MIT-SPIN data. This indicates the difficulty that online continuous flow instruments have in capturing low deposition NINP concentration data that fall below 1 sL−1 at most times when considering the FRIDGE-DC data as the standard. Higher sample volumes and limited background frost conditions are needed to sense these low atmospheric INP concentrations.
The time series of the FRIDGE-DC measurements at −20 and −25 °C is shown in Fig. 15. Deposition mode NINP values have been averaged over 3 h periods for this analysis. The FRIDGE immersion-freezing data are included in this figure to allow for direct comparison temporally. Immersion-freezing NINP values generally exceeded deposition mode NINP results when both types of measurements were collected by the two FRIDGE operational methods within the same period (or during adjacent time periods). This difference ranged from 0 to 2 orders of magnitude, with the largest differences seen at −25 °C, and a period of insignificant differences between the operational mode results was seen only from 18 to 22 September at −20 °C (Fig. 15a).
Based on these FRIDGE-CS and FRIDGE-DC results, immersion mode ice nucleation dominates most of the time at mixed-phase cloud temperatures. Nevertheless, deposition mode ice nucleation contributes modestly to the pool of INPs at mixed-phase cloud temperatures in the atmosphere and thus may be considered for parameterization in atmospheric models. The ability of online ice nucleation instruments to measure NINP values in the deposition mode in correspondence to offline measurements has not been confirmed due to the mentioned inability of the online instruments used in FIN-03 to capture the low deposition nucleation NINP concentrations. More work should be carried out on measurements of INPs in the deposition mode to understand their variabilities in time and their relation to INP size and composition, as well as to resolve if online measurements can be improved. For the time being, the substrate methods appear to be recommended for ambient atmospheric measurements in the realm below water saturation at mixed-phase cloud temperatures.
FIN-03 was an ice nucleation instrument intercomparison conducted in the challenging environment of the high-altitude mountaintop field setting. Two online systems (CSU-CFDC and MIT-SPIN) and three offline systems (FRIDGE, CSU-IS, and NCSU-CS) were represented in FIN-03. The immersion-freezing INP concentrations measured in FIN-03 by one or more instruments spanned a dynamic range of over 5 orders of magnitude (10−3 to ≈ 102 L−1) over the temperature range −34 to −7 °C. Intercomparisons for two or more measurements were made from −30 to −15 °C. Agreement within 1 order of magnitude in immersion-freezing NINP values was generally observed between all ice nucleation instruments measuring immersion INP concentrations at any given temperature if the measurement and sampling times were matched to within 3 h. Better than 1 order of magnitude agreement was found at temperatures lower than −25 °C and higher than −18 °C, with occasional deviations larger than an order of magnitude in the temperature range from −25 to −18 °C. A result that was always better than an approximate 5× factor agreement was found between average ratios of the NINP values measured by pairs of instruments at all times of sampling. We do not have a full understanding of what controls a better or worse agreement at different times or different temperatures, though some factors have been previously discussed in documenting FIN-02 laboratory studies (DeMott et al., 2018). In this study, there was some inference that the different filters and impinger used did not equally capture particles in all size ranges, which is something to improve on in future studies. A review of handling and storage protocols for consistency amongst groups could also help isolate the role of such factors. Given the constant changes in the concentration, size distribution, and composition of the ambient aerosol population, which are inevitable with any field campaign, the level of agreement found represents the state of the art, at least as judged based on recent laboratory and other field comparisons using similar instrumentation that appear to show factor of 5 agreements (e.g., Knopf et al., 2021; Brasseur et al., 2022; Lacher et al., 2024).
Although FIN-03 was not conducted as an aerosol/INP closure study per se, ancillary data on aerosol sizes and compositions, as recommended in more recent discussions of the need for true closure exercises (Knopf et al., 2021; Burrows et al., 2022), were purposefully collected for integration into analyses. This included explicit measurements of the aerosol size distribution and single-particle measurements of aerosol chemical and biological composition. These measurements allowed inferences to be made about INP compositions that provided the context for the period of study and established an example for future intercomparison and long-term measurement efforts. By comparing INP data to some current parameterizations describing biological, mineral, and soil dust INPs and additional direct investigations of INP composition via certain pre-treatments to remove biological and organic immersion-freezing INPs, these investigations revealed ubiquitous biological- and organic-influenced soil-dust-like INP influences at the high-altitude site that mimic those found over other continental regions (Knopf et al., 2021; Testa et al., 2021; Lacher et al., 2024), supporting the suggestion of Testa et al. (2021) that such INPs typify air over most arable landscapes. Biological INPs were indicated via selected immersion-freezing heat treatments to be dominant at > −20 °C, although they were of potential influence at all mixed-phase temperatures. Predictions of these that are based on parameterizations that utilize single-particle fluorescence data (Tobo et al., 2013; Wright et al., 2014; Cornwell et al., 2023) suggest the average utility of such parameterizations, but these were unable to predict the full temporal variation in biological INPs. This suggests that local variations in these INPs, which may in fact represent multiple biological particle types, represent an area that requires more effort. Based on relatively good consistency between predicted and measured mineral influences on immersion-freezing NINP concentrations, strictly mineral or other inorganic components of INPs were suggested to contribute modestly to the total INP concentrations at most times and at freezing temperatures probed during this study. As in most prior studies, the mineral influence became stronger at the lowest temperatures assessed. In contrast, it was found by comparison to a parameterization based on proximally regional soil particles that arable soil INPs likely explained the second most important contribution (behind biological INPs) of INPs during FIN-03, namely those emanating from other organic particle components that may have been internally mixed with minerals. Biomass burning influences were possible but appear to have not contributed greatly to the climatology of INPs during the study. It was critically important in arriving at these conclusions to have single-particle aerosol composition data from a mass spectrometer that could discern the sizes and fractional contribution of minerals and from a laser-based single-particle fluorescence measurement to estimate the biological character of particles. Nevertheless, there is a limit beyond the instrumentation complex utilized here in that INPs may always constitute a subset of the aerosol different in a composition and size compared to the predominant aerosol. This advancement may require improvement in methods that link INP and compositional measurements on single particles to specifically isolate these factors. Hence, a great amount of work is still needed to generally parameterize the mixed INP populations that may occur temporally in the atmosphere at higher-altitude sites like the SPL – or anywhere else – for that matter.
Importantly, FIN-03 included an assessment of the separate relative contributions of deposition and immersion-freezing INP concentrations, making it one of the few existing data sets of this kind. The offline FRIDGE-DC method was used to acquire comprehensive deposition NINP measurements in dependence on RH (95 % and 99 %), while the CSU-CFDC and MIT-SPIN instruments attempted focused deposition nucleation measurements at (nominally) 95 % RH on several days. The deposition INP concentration obtained by FRIDGE-DC increased from 95 % RH to 99 % RH on average by a factor of 3.3. Also, deposition NINP values were nearly always lower than immersion-freezing NINP values for the temperatures assessed. Deposition INP concentrations were at most times at 99 % RH (always at 95 % RH) were lower by an order of magnitude than immersion-freezing INP concentrations at −20 °C and by more than an order of magnitude at −25 °C. For the online instruments, only limited periods of deposition INP measurements with the CSU-CFDC achieved statistical significance. While these data were in good agreement with FRIDGE-DC data at −25 °C and 95 % RH, the most striking result was that all other measurement periods for the CSU-CFDC and MIT-SPIN gave measurements that were not significant at the 95 % confidence level. Thus, currently, offline methods for measuring deposition INPs appear to offer the best chance for success in measuring the lower concentrations of INPs that activate below water saturation in the mixed-phase temperature regime. It would be useful to make such assessments at a variety of sites to confirm the measurements made during FIN-03 on the relative contributions and the variability in INPs active in these conditions toward ice formation in clouds. Additional instrument developments for online measurements of these, and future, intercomparisons will be useful.
In summary, the agreements amongst instruments during FIN-03, within factors ranging from nearly 1 to up to 5 times on average between individual measurements and rarely exceeding 1 order of magnitude in short time periods, match those found in the FIN-02 laboratory studies. These represented state-of-the-art measurements at the time of FIN-03 and taken together with further improvements since this time as reflected in recent studies (Knopf et al., 2021; Brasseur et al., 2022; Lacher et al., 2024) demonstrate a steady improvement in the community's collective ability to detect and quantify atmospheric ice nucleation. There was not a clear divide between the ability of online and offline systems to measure immersion-freezing INP concentrations from the data collected in this study, although the need to carefully consider aerosol sampling efficiencies for different instruments was highlighted as a potential issue; this is one requiring close attention in future studies. In principle, both types of instruments show excellent promise for future field studies. For full-closure studies of ice nucleation by atmospheric aerosols, methods for identifying INP composition as demonstrated herein and recommended by other recent discussions in Knopf et al. (2021) and Burrows et al. (2022) are critical for understanding and improving INP measurements overall.
There is a clear need in the future to extend measurement comparisons to the atmospherically relevant and critically important temperature range higher than −15 °C. The low atmospheric number concentrations of INPs existing at times at these temperatures is a significant challenge and is reflected in this study by the inability to measure INP concentrations above the detection limits at the SPL site even for 3–4 h filter collections at temperatures higher than −7 °C. Longer sample times and higher-volume collections can improve this situation but introduce other technical challenges and do not appear possible for online instruments.
We also herein do not address the relevance of INP measurements overall for understanding ice formation in clouds, which is where secondary processes may come into play. This is an additional topic for critical investigation, given a degree of confidence now established in measuring INPs. However, the fact that correspondence between measurements within factors of 5–10 equates to 3.5 to 5 °C temperature uncertainties in the assessment of INPs is something that also deserves scrutiny from the cloud modeling community concerning if this is satisfactory; if not, what level of correspondence should the INP research community be seeking?
All data used for the figures in this paper can be accessed at https://doi.org/10.35097/eGhfvcOhsOyADZXN (DeMott et al., 2024). Original workshop data are available from the corresponding author on request.
The supplement related to this article is available online at: https://doi.org/10.5194/amt-18-639-2025-supplement.
PJD, JAM, and SDB wrote the paper with assistance from all teams and authors contributing information on instrument descriptions and comments on all results and conclusions, with contributions of some data analysis from JZ. PJD, EJTL, TS, KS, and TH provided data and analyses from the CSU-CFDC and IS instruments. DJC, MJW, SG, and MZ provided MIT-SPIN team measurements and analyses. MDP and SSP provided data and analysis for the NCSU-CS instrument. HGB, JS, and DW provided data and analyses for the FRIDGE instrument. AP provided data and analyses for the WIBS-4A. KF provided data and analyses for the LAS and PALMS. AGH and IM oversaw field operations, coordinated with visiting teams at the Storm Peak Laboratory, and provided nephelometer and meteorological measurements. PJD, DJC, and OM contributed to organize the campaign in connection with the other FIN activities.
The contact author has declared that none of the authors has any competing interests.
Publisher's note: Copernicus Publications remains neutral with regard to jurisdictional claims made in the text, published maps, institutional affiliations, or any other geographical representation in this paper. While Copernicus Publications makes every effort to include appropriate place names, the final responsibility lies with the authors.
This article is part of the special issue “Fifth International Workshop on Ice Nucleation (FIN)”. It is not associated with a conference.
We extend our special thanks to Romy Fösig (Ullrich) for assistance with data archiving.
This research has been supported by the National Science Foundation (grants nos. AGS-1339264, AGS-1358495, AGS-1450690, AGS-2131371); the U.S. Department of Energy Atmospheric System Research, an Office of Science, Office of Biological and Environmental Research program (grant no. DE-SC0014487); the Seventh Framework Programme, FP7 Cooperation (BACCHUS, grant no. 603445); the Deutsche Forschungsgemeinschaft (grant nos. BI 462/3-2, MO 668/4-1, and MO 668/4-2); and NOAA's Health of the Atmosphere Program and Atmospheric Composition and Climate Program.
This paper was edited by Mingjin Tang and reviewed by Gabor Vali and two anonymous referees.
Alsante, A. N., Thornton, D. C. O., and Brooks, S. D.: Ice nucleation catalyzed by the photosynthesis enzyme RuBisCO and other abundant biomolecules, Communications Earth & Environment, 4, 51, https://doi.org/10.1038/s43247-023-00707-7, 2023.
Agresti, A. and Coull, B. A.: Approximate is better than “exact” for interval estimation of binomial proportions, Am. Stat., 52, 119–126, https://doi.org/10.1080/00031305.1998.10480550, 1998.
Andreae, M. O. and Rosenfeld, D.: Aerosol-cloud-precipitation interactions. Part 1. The nature and sources of cloud-active aerosols, Earth-Sci. Rev., 89, 13–41, https://doi.org/10.1016/j.earscirev.2008.03.001, 2008.
Andrews, E., Sheridan, P. J., Ogren, J. A., Hageman, D., Jefferson, A., Wendell, J., Alástuey, A., Alados-Arboledas, L., Bergin, M., Ealo, M., Hallar, A. G., Hoffer, A., Kalapov, I., Keywood, M., Kim, J., Kim, S.-W., Kolonjari, F., Labuschagne, C., Lin, N.-H., Macdonald, A., Mayol-Bracero, O. L., McCubbin, I. B., Pandolfi, M., Reisen, F., Sharma, S., Sherman, J. P., Sorribas, M., and Sun, J.: Overview of the NOAA/ESRL Federated Aerosol Network, B. Am. Meteorol. Soc., 100, 123–135, https://doi.org/10.1175/BAMS-D-17-0175.1, 2019.
Daily, M. I., Tarn, M. D., Whale, T. F., and Murray, B. J.: An evaluation of the heat test for the ice-nucleating ability of minerals and biological material, Atmos. Meas. Tech., 15, 2635–2665, https://doi.org/10.5194/amt-15-2635-2022, 2022.
Barry, K. R., Hill, T. C. J., Levin, E. J. T., Twohy, C. H., Moore, K. A., Weller, Z. D., Toohey, D. W., Reeves, M., Campos, T., Geiss, R., Fischer, E. V., Kreidenweis, S. M., and DeMott, P. J.: Observations of ice nucleating particles in the free troposphere from western US wildfires, J. Geophys. Res.-Atmos., 126, e2020JD033752, https://doi.org/10.1029/2020JD033752, 2021a.
Barry, K. R., Hill, T. C. J., Jentzsch, C., Moffett, B. E., Stratmann, F., and DeMott, P. J.: Pragmatic protocols for working cleanly when measuring ice nucleating particles, Atmos. Res., 250, 105419, https://doi.org/10.1016/j.atmosres.2020.105419, 2021b.
Beall, C. M., Lucero, D., Hill, T. C., DeMott, P. J., Stokes, M. D., and Prather, K. A.: Best practices for precipitation sample storage for offline studies of ice nucleation in marine and coastal environments, Atmos. Meas. Tech., 13, 6473–6486, https://doi.org/10.5194/amt-13-6473-2020, 2020.
Boucher, O., Randall, D., Artaxo, P., Bretherton, C., Feingold, G., Forster, P., Kerminen, V.-M., Kondo, Y., Liao, H., Lohmann, U., Rasch, P., Satheesh, S. K., Sherwood, S., Stevens, B., and Zhang, X. Y.: Clouds and Aerosols, in: Climate Change 2013: The Physical Science Basis. Contribution of Working Group I to the Fifth Assessment Report of the Intergovernmental Panel on Climate Change, Cambridge, United Kingdom and New York, NY, USA, 571–658, https://doi.org/10.1017/CBO9781107415324.016, 2013.
Brasseur, Z., Castarède, D., Thomson, E. S., Adams, M. P., Drossaart van Dusseldorp, S., Heikkilä, P., Korhonen, K., Lampilahti, J., Paramonov, M., Schneider, J., Vogel, F., Wu, Y., Abbatt, J. P. D., Atanasova, N. S., Bamford, D. H., Bertozzi, B., Boyer, M., Brus, D., Daily, M. I., Fösig, R., Gute, E., Harrison, A. D., Hietala, P., Höhler, K., Kanji, Z. A., Keskinen, J., Lacher, L., Lampimäki, M., Levula, J., Manninen, A., Nadolny, J., Peltola, M., Porter, G. C. E., Poutanen, P., Proske, U., Schorr, T., Silas Umo, N., Stenszky, J., Virtanen, A., Moisseev, D., Kulmala, M., Murray, B. J., Petäjä, T., Möhler, O., and Duplissy, J.: Measurement report: Introduction to the HyICE-2018 campaign for measurements of ice-nucleating particles and instrument inter-comparison in the Hyytiälä boreal forest, Atmos. Chem. Phys., 22, 5117–5145, https://doi.org/10.5194/acp-22-5117-2022, 2022.
Burrows, S. M., McCluskey, C. S., Cornwell, G., Steinke, I., Zhang, K., Zhao, B., Zawadowicz, M., Raman, A., Kulkarni, G., China, S., Zelenyuk, A., and DeMott, P. J.: Ice-nucleating particles that impact clouds and climate: Observational and modeling research needs, Rev. Geophys., 60, e2021RG000745. https://doi.org/10.1029/2021RG000745, 2022.
Collaud Coen, M., Andrews, E., Aliaga, D., Andrade, M., Angelov, H., Bukowiecki, N., Ealo, M., Fialho, P., Flentje, H., Hallar, A. G., Hooda, R., Kalapov, I., Krejci, R., Lin, N.-H., Marinoni, A., Ming, J., Nguyen, N. A., Pandolfi, M., Pont, V., Ries, L., Rodríguez, S., Schauer, G., Sellegri, K., Sharma, S., Sun, J., Tunved, P., Velasquez, P., and Ruffieux, D.: Identification of topographic features influencing aerosol observations at high altitude stations, Atmos. Chem. Phys., 18, 12289–12313, https://doi.org/10.5194/acp-18-12289-2018, 2018.
Coluzza, I., Creamean, J., Rossi, M. J., Wex, H., Alpert, P. A., Bianco, V., Boose, Y., Dellago, C., Felgitsch, L., Fröhlich-Nowoisky, J., Herrmann, H., Jungblut, S., Kanji, Z. A., Menzl, G., Moffett, B., Moritz, C., Mutzel, A., Pöschl, U., Schauperl, M., Scheel, J., Stopelli, E., Stratmann, F., Grothe, H., and Schmale, D. G.: Perspectives on the Future of Ice Nucleation Research: Research Needs and Unanswered Questions Identified from Two International Workshops, Atmosphere, 8, 138, https://doi.org/10.3390/atmos8080138, 2017.
Cornwell, G. C., McCluskey, C. S., Levin, E. J. T., Suski, K. J., DeMott, P. J., Kreidenweis, S. M., and Prather, K. A.: Direct online mass spectrometry measurements of ice nucleating particles at a California coastal site, J. Geophys. Res.-Atmos., 124, 12157–12172, https://doi.org/10.1029/2019JD030466, 2019.
Cornwell, G. C., McCluskey, C. S., Hill, T. C. J., Levin, E. J. T., Rothfuss, N. E., Taia, S.-L., Petters, M. D., DeMott, P. J., Martin, A., Kreidenweis, S. M., Prather, K. A., and Burrows, S. M.: Bioaerosols are the dominant source of warm-temperature immersion-mode INPs and drive uncertainties in INP predictability in the ambient atmosphere, Science Advances, 9, eadg3715, https://doi.org/10.1126/sciadv.adg3715, 2023.
David, R. O., Fahrni, J., Marcolli, C., Mahrt, F., Brühwiler, D., and Kanji, Z. A.: The role of contact angle and pore width on pore condensation and freezing, Atmos. Chem. Phys., 20, 9419–9440, https://doi.org/10.5194/acp-20-9419-2020, 2020.
DeMott, P., Mirrielees, J., Suda Petters, S., Cziczo, D., Petters, M., Bingemer, H., Hill, T., Froyd, K., Garimella, S., Hallar, A. G., Levin, E., McCubbin, I., Perring, A., Rapp, C., Schiebel, T., Schrod, J., Suski, K., Weber, D., Wolf, M., Zawadowicz, M., Zenker, J., Möhler, O., and Brooks, S.: Dataset for the paper entitled: The Fifth International Workshop on Ice Nucleation Phase 3 (FIN-03): Field Intercomparison of Ice Nucleation Measurements, RADAR4KIT [data set], https://doi.org/10.35097/eGhfvcOhsOyADZXN, 2024.
DeMott, P. J., Mohler, O., Stetzer, O., Vali, G., Levin, Z., Petters, M. D., Murakami, M., Leisner, T., Bundke, U., Klein, H., Kanji, Z. A., Cotton, R. Jones, H., Petters, M. D., Prenni, A., Benz, S. Brinkmann, M., Rzesanke, D., Saathoff, H. Nicolet, M., Gallavardin, S., Saito, A., Nillius, B., Bingemer, H., Abbatt, J., Ardon, K., Ganor, E., Georgakopoulos, D. G., and Saunders, C.: Resurgence in ice nuclei measurement research, B. Am. Meteorol. Soc., 92, 1623–1635, https://doi.org/10.1175/2011BAMS3119.1, 2011.
DeMott, P. J., Prenni, A. J., McMeeking, G. R., Sullivan, R. C., Petters, M. D., Tobo, Y., Niemand, M., Möhler, O., Snider, J. R., Wang, Z., and Kreidenweis, S. M.: Integrating laboratory and field data to quantify the immersion freezing ice nucleation activity of mineral dust particles, Atmos. Chem. Phys., 15, 393–409, https://doi.org/10.5194/acp-15-393-2015, 2015.
DeMott, P. J., Hill, T. C. J., Petters, M. D., Bertram, A. K., Tobo, Y., Mason, R. H., Suski, K. J., McCluskey, C. S., Levin, E. J. T., Schill, G. P., Boose, Y., Rauker, A. M., Miller, A. J., Zaragoza, J., Rocci, K., Rothfuss, N. E., Taylor, H. P., Hader, J. D., Chou, C., Huffman, J. A., Pöschl, U., Prenni, A. J., and Kreidenweis, S. M.: Comparative measurements of ambient atmospheric concentrations of ice nucleating particles using multiple immersion freezing methods and a continuous flow diffusion chamber, Atmos. Chem. Phys., 17, 11227–11245, https://doi.org/10.5194/acp-17-11227-2017, 2017.
DeMott, P. J., Möhler, O., Cziczo, D. J., Hiranuma, N., Petters, M. D., Petters, S. S., Belosi, F., Bingemer, H. G., Brooks, S. D., Budke, C., Burkert-Kohn, M., Collier, K. N., Danielczok, A., Eppers, O., Felgitsch, L., Garimella, S., Grothe, H., Herenz, P., Hill, T. C. J., Höhler, K., Kanji, Z. A., Kiselev, A., Koop, T., Kristensen, T. B., Krüger, K., Kulkarni, G., Levin, E. J. T., Murray, B. J., Nicosia, A., O'Sullivan, D., Peckhaus, A., Polen, M. J., Price, H. C., Reicher, N., Rothenberg, D. A., Rudich, Y., Santachiara, G., Schiebel, T., Schrod, J., Seifried, T. M., Stratmann, F., Sullivan, R. C., Suski, K. J., Szakáll, M., Taylor, H. P., Ullrich, R., Vergara-Temprado, J., Wagner, R., Whale, T. F., Weber, D., Welti, A., Wilson, T. W., Wolf, M. J., and Zenker, J.: The Fifth International Workshop on Ice Nucleation phase 2 (FIN-02): laboratory intercomparison of ice nucleation measurements, Atmos. Meas. Tech., 11, 6231–6257, https://doi.org/10.5194/amt-11-6231-2018, 2018.
Durant, A. J. and Shaw, R. A.: Evaporation freezing by contact nucleation inside-out, Geophys. Res. Lett., 32, L20814, https://doi.org/10.1029/2005gl024175, 2005.
Eidhammer, T., DeMott, P. J., Prenni, A. J., Petters, M. D., Twohy, C. H., Rogers, D. C., Stith, J., Heymsfield, A., Wang, Z., Haimov, S., French, J., Pratt, K., Prather, K., Murphy, S., Seinfeld, J., Subramanian, R., and Kreidenweis, S. M.: Ice initiation by aerosol particles: Measured and predicted ice nuclei concentrations versus measured ice crystal concentrations in an orographic wave cloud, J. Atmos. Sci., 67, 2417–2436, https://doi.org/10.1175/2010JAS3266.1, 2010.
Fornea, A. P., Brooks, S. D., Dooley, J. B., and Saha, A.: Heterogeneous freezing of ice on atmospheric aerosols containing ash, soot, and soil, J. Geophys. Res.-Atmos., 114, D13201, https://doi.org/10.1029/2009jd011958, 2009.
Froyd, K. D., Murphy, D. M., Brock, C. A., Campuzano-Jost, P., Dibb, J. E., Jimenez, J.-L., Kupc, A., Middlebrook, A. M., Schill, G. P., Thornhill, K. L., Williamson, C. J., Wilson, J. C., and Ziemba, L. D.: A new method to quantify mineral dust and other aerosol species from aircraft platforms using single-particle mass spectrometry, Atmos. Meas. Tech., 12, 6209–6239, https://doi.org/10.5194/amt-12-6209-2019, 2019.
Froyd, K. D., Yu, P., Schill, G. P., Brock, C. A., Kupc, A., Williamson, C. J., Jensen, E. J., Ray, E., Rosenlof, K. H., Bian, H., Darmenov, A. S., Colarco, P. R., Diskin, G. S., Bui, T., and Murphy, D. M.: Dominant role of mineral dust in cirrus cloud formation revealed by global-scale measurements, Nat. Geosci., 15, 177–183, https://doi.org/10.1038/s41561-022-00901-w, 2022.
Gabey, A. M., Gallagher, M. W., Whitehead, J., Dorsey, J. R., Kaye, P. H., and Stanley, W. R.: Measurements and comparison of primary biological aerosol above and below a tropical forest canopy using a dual channel fluorescence spectrometer, Atmos. Chem. Phys., 10, 4453–4466, https://doi.org/10.5194/acp-10-4453-2010, 2010.
Garimella, S., Kristensen, T. B., Ignatius, K., Welti, A., Voigtländer, J., Kulkarni, G. R., Sagan, F., Kok, G. L., Dorsey, J., Nichman, L., Rothenberg, D. A., Rösch, M., Kirchgäßner, A. C. R., Ladkin, R., Wex, H., Wilson, T. W., Ladino, L. A., Abbatt, J. P. D., Stetzer, O., Lohmann, U., Stratmann, F., and Cziczo, D. J.: The SPectrometer for Ice Nuclei (SPIN): an instrument to investigate ice nucleation, Atmos. Meas. Tech., 9, 2781–2795, https://doi.org/10.5194/amt-9-2781-2016, 2016.
Garimella, S., Rothenberg, D. A., Wolf, M. J., David, R. O., Kanji, Z. A., Wang, C., Rösch, M., and Cziczo, D. J.: Uncertainty in counting ice nucleating particles with continuous flow diffusion chambers, Atmos. Chem. Phys., 17, 10855–10864, https://doi.org/10.5194/acp-17-10855-2017, 2017.
Hader, J. D., Wright, T. P., and Petters, M. D.: Contribution of pollen to atmospheric ice nuclei concentrations, Atmos. Chem. Phys., 14, 5433–5449, https://doi.org/10.5194/acp-14-5433-2014, 2014.
Hallar, A. G., Chirokova, G., McCubbin, I., Painter, T. H., Wiedinmyer, C., and Dodson, C.: Atmospheric bioaerosols transported via dust storms in the western United States, Geophys. Res. Lett., 38, L17801, https://doi.org/10.1029/2011GL048166, 2011.
Healy, D. A., Huffman, J. A., O'Connor, D. J., Pöhlker, C., Pöschl, U., and Sodeau, J. R.: Ambient measurements of biological aerosol particles near Killarney, Ireland: a comparison between real-time fluorescence and microscopy techniques, Atmos. Chem. Phys., 14, 8055–8069, https://doi.org/10.5194/acp-14-8055-2014, 2014.
Hill, T. C. J., DeMott, P. J., Tobo, Y., Fröhlich-Nowoisky, J., Moffett, B. F., Franc, G. D., and Kreidenweis, S. M.: Sources of organic ice nucleating particles in soils, Atmos. Chem. Phys., 16, 7195–7211, https://doi.org/10.5194/acp-16-7195-2016, 2016.
Hiranuma, N., Augustin-Bauditz, S., Bingemer, H., Budke, C., Curtius, J., Danielczok, A., Diehl, K., Dreischmeier, K., Ebert, M., Frank, F., Hoffmann, N., Kandler, K., Kiselev, A., Koop, T., Leisner, T., Möhler, O., Nillius, B., Peckhaus, A., Rose, D., Weinbruch, S., Wex, H., Boose, Y., DeMott, P. J., Hader, J. D., Hill, T. C. J., Kanji, Z. A., Kulkarni, G., Levin, E. J. T., McCluskey, C. S., Murakami, M., Murray, B. J., Niedermeier, D., Petters, M. D., O'Sullivan, D., Saito, A., Schill, G. P., Tajiri, T., Tolbert, M. A., Welti, A., Whale, T. F., Wright, T. P., and Yamashita, K.: A comprehensive laboratory study on the immersion freezing behavior of illite NX particles: a comparison of 17 ice nucleation measurement techniques, Atmos. Chem. Phys., 15, 2489–2518, https://doi.org/10.5194/acp-15-2489-2015, 2015.
Hoose, C. and Möhler, O.: Heterogeneous ice nucleation on atmospheric aerosols: a review of results from laboratory experiments, Atmos. Chem. Phys., 12, 9817–9854, https://doi.org/10.5194/acp-12-9817-2012, 2012.
Huffman, J. A., Prenni, A. J., DeMott, P. J., Pöhlker, C., Mason, R. H., Robinson, N. H., Fröhlich-Nowoisky, J., Tobo, Y., Després, V. R., Garcia, E., Gochis, D. J., Harris, E., Müller-Germann, I., Ruzene, C., Schmer, B., Sinha, B., Day, D. A., Andreae, M. O., Jimenez, J. L., Gallagher, M., Kreidenweis, S. M., Bertram, A. K., and Pöschl, U.: High concentrations of biological aerosol particles and ice nuclei during and after rain, Atmos. Chem. Phys., 13, 6151–6164, https://doi.org/10.5194/acp-13-6151-2013, 2013.
Jones, H. M., Flynn, M. J., DeMott, P. J., and Möhler, O.: Manchester Ice Nucleus Counter (MINC) measurements from the 2007 International workshop on Comparing Ice nucleation Measuring Systems (ICIS-2007), Atmos. Chem. Phys., 11, 53–65, https://doi.org/10.5194/acp-11-53-2011, 2011.
Kanji, Z. A., DeMott, P. J., Möhler, O., and Abbatt, J. P. D.: Results from the University of Toronto continuous flow diffusion chamber at ICIS 2007: instrument intercomparison and ice onsets for different aerosol types, Atmos. Chem. Phys., 11, 31–41, https://doi.org/10.5194/acp-11-31-2011, 2011.
Kanji, Z. A., Ladino, L. A., Wex, H., Boose, Y., Burkert-Kohn, M., Cziczo, D. J., and Krämer, M.: Overview of Ice Nucleating Particles, in: Ice Formation and Evolution in Clouds and Precipitation: Measurement and Modeling Challenges, edited by: Baumgardner, D., McFarquhar, G. M., and Heymsfield, A. J., Meteor. Mon., 58, 1.1–1.33, https://doi.org/10.1175/amsmonographs-d-16-0006.1, 2017.
Kaye, P. H., Stanley, W. R., Hirst, E., Foot, E. V., Baxter, K. L., and Barrington, S. J.: Single particle multichannel bio-aerosol fluorescence sensor, Opt. Express, 13, 3583–3593, https://doi.org/10.1364/OPEX.13.003583, 2005.
Knopf, D. A., Barry, K. R., Brubaker, T. A., Jahl, L. G., Jankowski, K. A. L., Li, J., Lu, Y., Monroe, L. W., Moore, K. A., Rivera-Adorno, F. A., Sauceda, K. A., Shi, Y., Tomlin, J. M., Vepuri, H. S. K., Wang, P., Lata, N. N., Levin, E. J. T., Creamean, J. M., Hill, T. C. J., China, S., Alpert, P. A., Moffet, R. C., Hiranuma, N., Sullivan, R. C., Fridlind, A. M., West, M., Riemer, N., Laskin, A., DeMott, P. J., and Liu, X.: Aerosol–Ice Formation Closure: A Southern Great Plains Field Campaign, B. Am. Meteorol. Soc., 102, E1952–E197, https://doi.org/10.1175/BAMS-D-20-0151.1, 2021.
Kulkarni, G. and Kok, G.: Mobile Ice Nucleus Spectrometer, Pacific Northwest National Laboratory, Richland, WA, 13 pp., https://doi.org/10.2172/1071991, 2012.
Lacher, L., DeMott, P. J., Levin, E. J. T., Suski, K. J., Boose, Y., Zipori, A., Hermann, E., Nicolas Bukowiecki, N., Steinbacher, M., Gute, E., Abbatt, J. P. D., Lohmann, U., and Kanji, Z. A.: Background free-tropospheric ice nucleating particle concentrations at mixed-phase cloud conditions, J. Geophys. Res.-Atmos., 123, 10506–10525, https://doi.org/10.1029/2018JD028338, 2018.
Lacher, L., Adams, M. P., Barry, K., Bertozzi, B., Bingemer, H., Boffo, C., Bras, Y., Büttner, N., Castarede, D., Cziczo, D. J., DeMott, P. J., Fösig, R., Goodell, M., Höhler, K., Hill, T. C. J., Jentzsch, C., Ladino, L. A., Levin, E. J. T., Mertes, S., Möhler, O., Moore, K. A., Murray, B. J., Nadolny, J., Pfeuffer, T., Picard, D., Ramírez-Romero, C., Ribeiro, M., Richter, S., Schrod, J., Sellegri, K., Stratmann, F., Swanson, B. E., Thomson, E. S., Wex, H., Wolf, M. J., and Freney, E.: The Puy de Dôme ICe Nucleation Intercomparison Campaign (PICNIC): comparison between online and offline methods in ambient air, Atmos. Chem. Phys., 24, 2651–2678, https://doi.org/10.5194/acp-24-2651-2024, 2024.
Levin, E. J. T., DeMott, P. J., Suski, K. J., Boose, Y., Hill, T. C. J., McCluskey, C. S., Schill, G. P., Rocci, K., Al-Mashat, H., Kristensen, L. J., Cornwell, G. C., Prather, K. A., Tomlinson, J. M., Mei, F., Hubbe, J., Pekour, M. S., Sullivan, R. J., Leung, L. R., and Kreidenweis, S. M.: Characteristics of ice nucleating particles in and around California winter storms, J. Geophys. Res.-Atmos., 124, 11530–11551, https://doi.org/10.1029/2019JD030831, 2019.
Lohmann, U. and Feichter, J.: Global indirect aerosol effects: a review, Atmos. Chem. Phys., 5, 715–737, https://doi.org/10.5194/acp-5-715-2005, 2005.
Marcolli, C.: Deposition nucleation viewed as homogeneous or immersion freezing in pores and cavities, Atmos. Chem. Phys., 14, 2071–2104, https://doi.org/10.5194/acp-14-2071-2014, 2014.
Mason, R. H., Si, M., Chou, C., Irish, V. E., Dickie, R., Elizondo, P., Wong, R., Brintnell, M., Elsasser, M., Lassar, W. M., Pierce, K. M., Leaitch, W. R., MacDonald, A. M., Platt, A., Toom-Sauntry, D., Sarda-Estève, R., Schiller, C. L., Suski, K. J., Hill, T. C. J., Abbatt, J. P. D., Huffman, J. A., DeMott, P. J., and Bertram, A. K.: Size-resolved measurements of ice-nucleating particles at six locations in North America and one in Europe, Atmos. Chem. Phys., 16, 1637–1651, https://doi.org/10.5194/acp-16-1637-2016, 2016.
McCluskey, C. S., Hill, T. C. J., Humphries, R. S., Rauker, A. M., Moreau, S., Strutton, P. G., Chambers, S. D., Williams, A. G., McRobert, I., Ward, J., Keywood, M. D., Harnwell, J., Ponsonby, W., Loh, Z. M., Krummel, P. B., Protat, A., Kreidenweis, S. M., and DeMott, P. J.: Observations of ice nucleating particles over Southern Ocean waters, Geophys. Res. Lett., 45, 11989–11997, https://doi.org/10.1029/2018GL079981, 2018.
McCluskey, C. S., Gettelman, A., Bardeen, C. G., DeMott, P. J., Moore, K. A., Kreidenweis, S. M., Hill, T. C. J., Barry, K. R., Twohy., C. H., Toohey, D. W., Rainwater, B., Jensen, J. B., Reeves, J. M., Alexander, S. P., and McFarquhar, G. M.: Simulating Southern Ocean aerosol and ice nucleating particles in the Community Earth System Model version 2, J. Geophys. Res.-Atmos., 128, e2022JD036955, https://doi.org/10.1029/2022JD036955, 2023.
Mignani, C., Wieder, J., Sprenger, M. A., Kanji, Z. A., Henneberger, J., Alewell, C., and Conen, F.: Towards parameterising atmospheric concentrations of ice-nucleating particles active at moderate supercooling, Atmos. Chem. Phys., 21, 657–664, https://doi.org/10.5194/acp-21-657-2021, 2021.
Möhler, O., Adams, M., Lacher, L., Vogel, F., Nadolny, J., Ullrich, R., Boffo, C., Pfeuffer, T., Hobl, A., Weiß, M., Vepuri, H. S. K., Hiranuma, N., and Murray, B. J.: The Portable Ice Nucleation Experiment (PINE): a new online instrument for laboratory studies and automated long-term field observations of ice-nucleating particles, Atmos. Meas. Tech., 14, 1143–1166, https://doi.org/10.5194/amt-14-1143-2021, 2021.
Morris, C. E., Sands, D. C., Bardin, M., Jaenicke, R., Vogel, B., Leyronas, C., Ariya, P. A., and Psenner, R.: Microbiology and atmospheric processes: research challenges concerning the impact of airborne micro-organisms on the atmosphere and climate, Biogeosciences, 8, 17–25, https://doi.org/10.5194/bg-8-17-2011, 2011.
Murray, B. J., O'Sullivan, D., Atkinson, J. D., and Webb, M. E: Ice nucleation by particles immersed in supercooled cloud droplets, Chem. Soc. Rev., 41, 6519–6554, https://doi.org/10.1039/C2CS35200A, 2012.
Niemand, M., Mohler, O., Vogel, B., Vogel, H., Hoose, C., Connolly, P., Klein, H., Bingemer, H., DeMott, P. J., Skrotzki, J., and Leisner, T.: A Particle-Surface-Area-Based Parameterization of Immersion Freezing on Desert Dust Particles, J. Atmos. Sci., 69, 3077-3092, https://doi.org/10.1175/jas-d-11-0249.1, 2012.
Perring, A. E., Schwarz, J. P., Baumgardner, D., Hernandez, M. T., Spracklen, D. V., Heald, C. L., Gao, R. S., Kok, G., McMeeking, G. R., McQuaid, J. B., and Fahey, D. W.: Airborne observations of regional variation in fluorescent aerosol across the United States, J. Geophys. Res.-Atmos., 120, 1153–1170, https://doi.org/10.1002/2014jd022495, 2015.
Petersen, R. C., Hallar, A. G., McCubbin, I. B., Ogren, J. A., Andrews, E., Lowenthal, D., Gorder, R., Purcell, R., Sleeth, D., and Novosselov, I.: Numerical, wind-tunnel, and atmospheric evaluation of a turbulent ground-based inlet sampling system, Aerosol Sci. Tech., 53, 712–727, https://doi.org/10.1080/02786826.2019.1602718, 2019.
Petters, M. D. and Wright, T. P.: Revisiting ice nucleation from precipitation samples, Geophys. Res. Lett., 42, 8758–8766, https://doi.org/10.1002/2015GL065733, 2015.
Pöhlker, C., Huffman, J. A., and Pöschl, U.: Autofluorescence of atmospheric bioaerosols – fluorescent biomolecules and potential interferences, Atmos. Meas. Tech., 5, 37–71, https://doi.org/10.5194/amt-5-37-2012, 2012.
Richardson, M. S., DeMott, P. J. Kreidenweis, S. M., Cziczo, D. J., Dunlea, E., Jimenez, J. L., Thompson, D. S., Ashbaugh, L. L., Borys, R. D., Westphal, D. S., Cassucio G. S., and Lersch, T. L.: Measurements of heterogeneous ice nuclei in the Western U.S. in springtime and their relation to aerosol characteristics, J. Geophys. Res., 112, D02209, https://doi.org/10.1029/2006JD007500, 2007.
Rogers, D. C.: Development of a continuous flow thermal gradient diffusion chamber for ice nucleation studies, Atmos. Res., 22, 149–181, https://doi.org/10.1016/0169-8095(88)90005-1, 1988.
Rogers, D. C., DeMott, P. J., Kreidenweis S. M., and Chen, Y.: A continuous flow diffusion chamber for airborne measurements of ice nuclei, J. Atmos. Ocean. Tech., 18, 725–741, https://doi.org/10.1175/1520-0426(2001)018<0725:ACFDCF>2.0.CO;2, 2001.
Schill, G. P., DeMott, P. J., Emerson, E. W., Rauker, A. M. C., Kodros, J. K., Suski, K. J., Hill, T. C. J., Levin, E. J. T., Pierce, J. R., Farmer, D. K., and Kreidenweis, S. M.: The contribution of black carbon to global ice nucleating particle concentrations relevant to mixed-phase clouds, P. Natl. Acad. Sci. USA, 117, 22705–22711, https://doi.org/10.1073/pnas.2001674117, 2020.
Schreiner, J., Voigt, C., Weisser, C., Kohlmann, A., Mauersberger, K., Deshler, T., Kröger, C., Rosen, J. Kjome, N., Larsen, N., Adriani, A., Cairo, F., Di Donfrancesco, G., Ovarlez, J., Ovarlez, H., and Dörnbrack, A.: Chemical, microphysical, and optical properties of polar stratospheric clouds, J. Geophys. Res., 107, 8313, https://doi.org/10.1029/2001JD000825, 2002.
Schrod, J., Danielczok, A., Weber, D., Ebert, M., Thomson, E. S., and Bingemer, H. G.: Re-evaluating the Frankfurt isothermal static diffusion chamber for ice nucleation, Atmos. Meas. Tech., 9, 1313–1324, https://doi.org/10.5194/amt-9-1313-2016, 2016.
Schrod, J., Thomson, E. S., Weber, D., Kossmann, J., Pöhlker, C., Saturno, J., Ditas, F., Artaxo, P., Clouard, V., Saurel, J.-M., Ebert, M., Curtius, J., and Bingemer, H. G.: Long-term deposition and condensation ice-nucleating particle measurements from four stations across the globe, Atmos. Chem. Phys., 20, 15983–16006, https://doi.org/10.5194/acp-20-15983-2020, 2020.
Seifert, P., Ansmann, A., Groß, S., Freudenthaler, V., Heinold, B., Hiebsch, A., Mattis, I., Schmidt, J., Schnell, F., Tesche, M., Wandinger, U., and Wiegner, M.: Ice formation in ash-influenced clouds after the eruption of the Eyjafjallajökull volcano in April 2010, J. Geophys. Res.-Atmos., 116, D00U04, https://doi.org/10.1029/2011JD015702, 2011.
Shen, X., Bell, D. M., Coe, H., Hiranuma, N., Mahrt, F., Marsden, N. A., Mohr, C., Murphy, D. M., Saathoff, H., Schneider, J., Wilson, J., Zawadowicz, M. A., Zelenyuk, A., DeMott, P. J., Möhler, O., and Cziczo, D. J.: Measurement report: The Fifth International Workshop on Ice Nucleation phase 1 (FIN-01): intercomparison of single-particle mass spectrometers, Atmos. Chem. Phys., 24, 10869–10891, https://doi.org/10.5194/acp-24-10869-2024, 2024.
Suski, K. J., Hill, T. C. J., Levin, E. J. T., Miller, A., DeMott, P. J., and Kreidenweis, S. M.: Agricultural harvesting emissions of ice-nucleating particles, Atmos. Chem. Phys., 18, 13755–13771, https://doi.org/10.5194/acp-18-13755-2018, 2018.
Testa, B., Hill, T. C. J., Marsden, N. A., Barry, K. R., Hume, C. C., Bian, Q., Uetake, J., Hare, H., Perkins, R. J., Möhler, O., Kreidenweis, S. M., and DeMott, P. J.: Ice nucleating particles in the boundary layer of the Sierras de Córdoba, Argentina, during the Cloud, Aerosol, and Complex Terrain Interactions experiment, J. Geophys. Res.-Atmos., 126, e2021JD03518, https://doi.org/10.1029/2021JD035186, 2021.
Thomson, D. S., Schein, M. E., and Murphy, D. M.: Particle analysis by laser mass spectrometry WB-57 instrument overview, Aerosol Sci. Tech., 33, 153–169, https://doi.org/10.1080/027868200410903, 2000.
Tobo, Y., Prenni, A. J., DeMott, P. J., Huffman, J. A., McCluskey, C. S., Tian, G. X., Pöhlker, C., Pöschl, U., and Kreidenweis, S. M.: Biological aerosol particles as a key determinant of ice nuclei populations in a forest ecosystem. J. Geophys. Res.-Atmos., 118, 10100–10110., https://doi.org/10.1002/jgrd.50801, 2013.
Tobo, Y., DeMott, P. J., Hill, T. C. J., Prenni, A. J., Swoboda-Colberg, N. G., Franc, G. D., and Kreidenweis, S. M.: Organic matter matters for ice nuclei of agricultural soil origin, Atmos. Chem. Phys., 14, 8521–8531, https://doi.org/10.5194/acp-14-8521-2014, 2014.
Twohy, C. H., McMeeking, G. R., DeMott, P. J., McCluskey, C. S., Hill, T. C. J., Burrows, S. M., Kulkarni, G. R., Tanarhte, M., Kafle, D. N., and Toohey, D. W.: Abundance of fluorescent biological aerosol particles at temperatures conducive to the formation of mixed-phase and cirrus clouds, Atmos. Chem. Phys., 16, 8205–8225, https://doi.org/10.5194/acp-16-8205-2016, 2016.
Ullrich, R., Hoose, C., Möhler, O., Niemand, M., Wagner, R., Höhler, K., Hiranuma, N., Saathoff, H., and Leisner, T.: A New Ice Nucleation Active Site Parameterization for Desert Dust and Soot, J. Atmos. Sci., 74, 699–717, https://doi.org/10.1175/jas-d-16-0074.1, 2017.
Vali, G.: Quantitative evaluation of experimental results on the heterogeneous freezing nucleation of supercooled liquids, J. Atmos. Sci., 28, 402–409, https://doi.org/10.1175/1520-0469(1971)028<0402:QEOERA>2.0.CO;2, 1971.
Vali, G.: Nucleation terminology, J. Aerosol Sci., 16, 575–576, https://doi.org/10.1016/0021-8502(85)90009-6, 1985.
Vali, G., DeMott, P. J., Möhler, O., and Whale, T. F.: Technical Note: A proposal for ice nucleation terminology, Atmos. Chem. Phys., 15, 10263–10270, https://doi.org/10.5194/acp-15-10263-2015, 2015.
Wagner, R., Kiselev, A., Möhler, O., Saathoff, H., and Steinke, I.: Pre-activation of ice-nucleating particles by the pore condensation and freezing mechanism, Atmos. Chem. Phys., 16, 2025–2042, https://doi.org/10.5194/acp-16-2025-2016, 2016.
Wex, H., Augustin-Bauditz, S., Boose, Y., Budke, C., Curtius, J., Diehl, K., Dreyer, A., Frank, F., Hartmann, S., Hiranuma, N., Jantsch, E., Kanji, Z. A., Kiselev, A., Koop, T., Möhler, O., Niedermeier, D., Nillius, B., Rösch, M., Rose, D., Schmidt, C., Steinke, I., and Stratmann, F.: Intercomparing different devices for the investigation of ice nucleating particles using Snomax® as test substance, Atmos. Chem. Phys., 15, 1463–1485, https://doi.org/10.5194/acp-15-1463-2015, 2015.
Willeke, K., Lin, X., and Grinshpun, S. A.: Improved Aerosol Collection by Combined Impaction and Centrifugal Motion, Aerosol. Sci. Tech., 28, 439–456, https://doi.org/10.1080/02786829808965536, 1998.
Wright, T. P. and Petters, M. D.: The role of time in heterogeneous freezing nucleation, J. Geophys. Res.-Atmos., 118, 3731–3743, https://doi.org/10.1002/jgrd.50365, 2013.
Wright, T. P., Petters, M. D., Hader, J. D., Morton, T., and Holder, A. L.: Minimal cooling rate dependence of ice nuclei activity in the immersion mode, J. Geophys. Res.-Atmos., 118, 10535–10543, https://doi.org/10.1002/jgrd.50810, 2013.
Wright, T. P., Hader, J. D., McMeeking, G. R., and Petters, M. D.: High Relative Humidity as a Trigger for Widespread Release of Ice Nuclei, Aerosol Sci. Tech., 48, i–v, https://doi.org/10.1080/02786826.2014.968244, 2014.
Yadav, S., Venezia, R. E., Paerl, R. W., and Petters, M. D.: Characterization of ice-nucleating particles over Northern India, J. Geophys. Res.-Atmos., 124, 10467–10482, https://doi.org/10.1029/2019JD030702, 2019.
Zawadowicz, M. A., Froyd, K. D., Murphy, D. M., and Cziczo, D. J.: Improved identification of primary biological aerosol particles using single-particle mass spectrometry, Atmos. Chem. Phys., 17, 7193–7212, https://doi.org/10.5194/acp-17-7193-2017, 2017.
Zawadowicz, M. A., Froyd, K. D., Perring, A. E., Murphy, D. M., Spracklen, D. V., Heald, C. L., Buseck, P. R., and Cziczo, D. J.: Model-measurement consistency and limits of bioaerosol abundance over the continental United States, Atmos. Chem. Phys., 19, 13859–13870, https://doi.org/10.5194/acp-19-13859-2019, 2019.
Zenker, J., Collier, K. N., Xu, G., Yang, P., Levin, E. J. T., Suski, K. J., DeMott, P. J., and Brooks, S. D.: Using depolarization to quantify ice nucleating particle concentrations: a new method, Atmos. Meas. Tech., 10, 4639–4657, https://doi.org/10.5194/amt-10-4639-2017, 2017.