the Creative Commons Attribution 4.0 License.
the Creative Commons Attribution 4.0 License.
 | 12 Nov 2025
Intercomparison of online and offline XRF spectrometers for determining the PM10 elemental composition of ambient aerosol
Laura Cadeo
Beatrice Biffi
Benjamin Chazeau
Cristina Colombi
Rosario Cosenza
Eleonora Cuccia
Manousos-Ioannis Manousakas
Kaspar R. Daellenbach
André S. H. Prévôt
Measuring the elemental composition of atmospheric particulate matter (PM) can provide useful information on the adverse effects of PM and facilitate the identification of emission sources. Carrying out these measurements at a high temporal resolution (1 h or less) allows describing the fast processes to which aerosol particles are subjected in the atmosphere, leading to a better characterization of the emissions. Energy dispersive X-ray fluorescence (ED-XRF) spectrometry is one of the most widespread techniques used to determine the elemental composition of PM. In recent years, new systems known as online XRF spectrometers have been developed to provide real-time measurements of the PM elemental concentration at a high temporal resolution. Among these advanced instruments, the Xact® 625i Ambient Metals Monitor by Cooper Environmental (USA) performs in situ automated measurements with a user-selected temporal resolution ranging from 15 to 240 min. In this study, an Xact® 625i monitor equipped with a PM10 inlet was deployed for nearly 6 months (July–December 2023) in Milan (Po Valley, Italy) at a monitoring station of the Lombardy Regional Agency for Environmental Protection (ARPA Lombardia). The instrument was configured to quantify 36 elements, ranging from Al to Bi, with 1 h temporal resolution in the PM10 fraction. The objective of the study was to verify the correct functioning of the instrument and to evaluate the quality and robustness of the data produced. Xact® 625i data were aggregated to 24 h daily means and then compared to 24 h PM10 filter data retrieved by ARPA Lombardia in the same station and analyzed offline for the elemental concentration with a benchtop ED-XRF spectrometer. The intercomparison focused on 16 elements (Al, Si, S, Cl, K, Ca, Ti, Cr, Mn, Fe, Ni, Cu, Zn, Br, Sr, and Pb) whose concentrations were consistently above their minimum detection limits (MDLs) for both online and offline techniques. The results of the intercomparison were satisfying, showing that the Xact® 625i elemental concentrations were highly correlated to the offline ED-XRF analyses (R2 ranging from 0.67 to 0.99 and slopes ranging from 0.79 to 1.3, with only a few elements showing slopes up to 1.70).
- Article
(2457 KB) - Full-text XML
-
Supplement
(1168 KB) - BibTeX
- EndNote


Measurement and quantification of the chemical composition of atmospheric particulate matter (PM) are key aspects of air quality monitoring. It has long been known that PM is associated with adverse impacts, which are influenced by the chemical composition of the particles. At the global scale, PM affects cloud formation and Earth's radiative budget (Fuzzi et al., 2015); at the local scale, its harmfulness on human health is of particular concern (Brunekreef and Holgate, 2002; Kelly et al., 2012; Rohr and Wyzga, 2012; Daellenbach et al., 2020). Therefore, it is important to achieve more detailed knowledge about which chemical components are responsible for these negative effects. Determining the composition of PM is also a fundamental step to perform source apportionment studies for the identification of the emission sources, which facilitate the implementation of mitigation strategies (WHO, 2013).
Although they generally do not contribute substantially to the mass of PM, trace elements, in particular metals, are of interest because they act as tracers for specific sources (Visser et al., 2015) and because some of them are associated with adverse health effects even at ambient level concentrations (Chen and Lippmann, 2009). The quantification of these elements in PM samples can be achieved through various techniques (see, e.g., Ogrizek et al., 2022), among the most widespread of which are energy dispersive X-ray fluorescence (ED-XRF) spectrometry, particle-induced X-ray emission (PIXE), and wet-chemistry inductively coupled plasma mass spectrometry (ICP-MS). All these methods require the collection of aerosol particles on filters, followed by laboratory analysis. ED-XRF is a non-destructive technique and does not require any sample pre-treatment (e.g., repeated analyses on the same sample and quantification of different chemical components in the same sample are possible), detects simultaneously multiple elements (20–30) with Z > 10 using an X-ray tube for irradiating the samples, and is typically operated using benchtop instruments. For decades, ED-XRF has been largely applied to aerosol analysis in research laboratories and in monitoring networks like the U.S. Environmental Protection Agency Chemical Speciation Network (https://www.epa.gov/amtic/chemical-speciation-network-csn-general-information, last access: 15 October 2025). One advantage of ED-XRF is that it is quite stable and does not require frequent calibrations; hence, it is suitable for automated spectrometer development.
PIXE analysis uses accelerated particles (often protons with energies of a few MeV) as the irradiation source, and it has been traditionally used to assess the elemental composition in aerosol filter samples (see, e.g., Lucarelli, 2020, and cited literature therein). Although more sensitive than ED-XRF, PIXE has some features in common with ED-XRF, such as the capability of providing quantitative information for elements with Z > 10 (both being based on fluorescence X-ray detection), sample pre-treatment being unnecessary, and their non-destructive character. While the need of an accelerator facility makes the beam-time availability for PIXE analysis a shortcoming, the existence of a very effective PIXE setup where a high number of filter samples can be robustly and effectively analyzed in short times helps a lot in large monitoring campaigns with many samples to be characterized. As an example, at the INFN-LABEC facility in Florence, Italy, the typical irradiation time for each daily aerosol sample is 45–60 s depending on the mass loading (vs. approximately 1 h per sample with ED-XRF), and, more interestingly, 1 h resolution samples can be analyzed in 1 min per spot (see, e.g., Calzolai et al., 2010, 2015; Lucarelli et al., 2011).
ICP-MS is a very sensitive and fast analytical technique for detecting trace and ultra-trace elements (> 50 elements simultaneously) in aerosol samples (see, e.g., Duarte et al., 2021); it is ideal for accurate quantification of heavy metals, which is performed on solubilized samples by strong acid digestion, thus requiring a time-consuming step, introducing a dependence on the extraction efficiency and possible sample contaminations, and destroying the filter sample. In addition, ICP-MS instruments need frequent calibrations and strict quality control checks to ensure stable and robust element detection. As far as aerosol source tracers are concerned, a major drawback of ICP-MS is the poor detection of elements like Si, which is a key tracer for mineral dust particles (see, e.g., Canepari et al., 2009; Niu et al., 2010).
It is well-known that the ED-XRF technique is characterized by higher minimum detection limits (MDLs) compared to ICP-MS (up to 2 orders of magnitude; see, e.g., Hyslop et al., 2024) and PIXE (up to 1 order of magnitude; see, e.g., Calzolai et al., 2008); this is a limiting factor when very low aerosol loadings or trace/ultra-trace elements are of interest, but, e.g., for source apportionment purposes, it has proved to be effective also when analyzing sub-daily samples or size-segregated samples (see, e.g., Bernardoni et al., 2011a, b). The filter type used for the aerosol samples also plays a role in the technique performance, as reported by previous literature works (see, e.g., Calzolai et al., 2008; Ogrizek et al., 2022). As far as low Z elements are concerned, especially for heavy loaded samples (Hyslop et al., 2024), a limitation of techniques based on the detection of fluorescence X-rays is the matrix effect, whereby emitted X-rays are reabsorbed by other particles in the sample matrix or are self-absorbed within single coarse particles (Hunter and Rhodes, 1972a, b; Van Grieken and Markowicz, 1993), thus leading to an underestimation of the low-Z elemental concentrations. However, these effects can be properly taken into account using correction factors that can be either experimentally retrieved (see, e.g., the use of particle-induced gamma-ray emission (PIGE) analysis jointly with PIXE (Ariola et al. 2002; Calzolai et al., 2014)) or obtained by theoretical calculations (see, e.g., Hunter and Rhodes, 1972a, b; Criss, 1976; Foster et al., 1996).
PM samples are usually collected by air quality monitoring networks with a temporal resolution ranging from 24 h to 1 week to ensure that enough PM mass is available for the analytical analysis, which is carried out in a laboratory. The elemental composition of PM is then obtained with a considerable time delay and at low temporal resolution. In recent years, there has been a growing interest in developing instruments for high-temporal-resolution measurements. Sampling at a high temporal resolution (1 h or less) allows capture of fast processes that aerosol particles are subjected to in the atmosphere and retrieval of information about the typical hours of activity of a certain source, leading to a better characterization of PM emissions. However, due to the short integration times, high-temporal-resolution measurements are often close to the MDL of the analytical techniques (Malaguti et al., 2015).
Regarding the ED-XRF method, new systems have been developed that are able to sample PM particles with a sub-hourly or hourly temporal resolution and to automatically measure their elemental concentration, providing near-real-time data access. These instruments are known as online XRF spectrometers and can be employed for long monitoring periods (months, years) at a site with the advantage of requiring limited maintenance. However, their high cost may prevent the simultaneous use of multiple devices at different sites or the investigation of different size classes (Furger et al., 2017). One of these advanced instruments is the Xact® 625i Ambient Metals Monitor by Cooper Environmental (USA), which performs in situ automated measurements of the elemental concentration of PM with a user-selected temporal resolution ranging from 15 to 240 min. During operation, remote access to the data is available, enabling continuous, near-real-time monitoring of the instrument and ambient metal concentrations. Although the Xact® instrument is currently one of the most widely used online ED-XRF analyzers, it is worth noting that other instruments with similar working principles are also available, such as the Horiba PX-375 ED-XRF monitor, whose setup and performance are described in detail in Asano et al. (2017) and Trebs et al. (2024).
The Xact® 625i and its forerunner versions have been successfully employed in several field studies in the past years, which compared its online measurements to daily samples analyzed with more established laboratory techniques (Bhowmik et al., 2022; Tremper et al., 2018; Furger et al., 2017; Park et al., 2014; U.S. EPA, 2012). Among these studies, only in Park et al. (2014) were the daily filters analyzed with the ED-XRF technique; in all the other cases, the elemental concentration of daily samples was retrieved with ICP-MS and ICP-OES (inductively coupled plasma optical emission spectrometry). In the latest cases, the comparison was then influenced by the different choice of the analytical technique. Moreover, in most of these studies, the experimental campaigns were carried out only for a few weeks/months, leading to a very limited number of points available for the intercomparison. An evaluation of the performances of Xact® 625i (compared with the ICP-MS technique) during different seasons was conducted only by Bhowmik et al. (2022), who conducted the field campaigns during summer (June–July) and winter (October–December) 2019 at two sites in Delhi.
In this study, an Xact® 625i monitor was deployed for nearly 6 months (July–December 2023) in Milan (Po Valley, Italy) at a monitoring station of the Lombardy Regional Agency for Environmental Protection (ARPA Lombardia), where air quality measurements are performed continuously. Xact® 625i hourly samples measured online with ED-XRF were compared to daily filters measured offline by ARPA Lombardia with a benchtop ED-XRF spectrometer in their laboratory. The goals of this paper are (1) to assess the online instrument performance in typical summer and winter elemental concentration ranges for PM10 collected at an urban background site in the Po Valley (Italy); (2) to evaluate the quality of the obtained data for the selected elements in relation to their MDLs; and (3) to quantify the data robustness based on intercomparison between Xact® 625i and elemental concentrations provided by a benchtop ED-XRF spectrometer.
2.1 Site characteristics
The field campaign was performed at the permanent station Milano Pascal of the ARPA Lombardia Air Quality Network from 6 July until 12 December 2023. This is an urban background site located in the eastern side of Milan, in the University campus area called “Città Studi” (45.478° N, 9.231° E; 122 ); the station is placed in a public park about 130 m from road traffic. The metropolitan city of Milan is the second most densely populated area in Italy (ca. 2300 inhabitants km−2, almost doubled by daily commuters) and is located in the Po Valley, a well-known European pollution hotspot. The site is characterized by wintertime episodes of high pollutant concentrations, due to emissions from a variety of sources (e.g., residential heating, traffic, and industries) and prolonged atmospheric stability conditions related to the presence of the mountain chains of the Alps and the Apennines (Vecchi et al., 2007, 2009). Moreover, in Milan, more than 80 % of the days in a year are characterized by wind speed lower than 2 m s−1 (Vecchi et al., 2019). The site is well-documented with respect to gas-phase pollutants (e.g., NOx, SO2, O3), PM10 and PM2.5 chemical characterization, and source apportionment (e.g., Amato et al., 2016; Altuwayjiri et al., 2021).
2.2 Xact® 625i
The Xact® 625i Ambient Metals Monitor (Cooper Environmental Services (CES), Beaverton, OR, USA) is an online energy dispersive XRF spectrometer, designed for continuous measurements of the elemental composition of ambient aerosol. The device operates using a reel-to-reel filter tape sampling technique, followed by the analysis of metals in the resulting PM spot through energy dispersive X-ray fluorescence (ED-XRF). Ambient air is drawn inside the instrument through a PM size-selective inlet, which was PM10 in this study, with a flow rate of 16.7 L min−1, and the PM is collected onto a Teflon filter tape. After each sampling interval is completed, the filter tape is automatically advanced to the XRF system, where the resulting PM deposit is irradiated with an X-ray tube (rhodium anode; max voltage: 50 kV; current: 1 mA) with three excitation conditions (see Table S1 in the Supplement), and the fluorescence X-rays are measured by a silicon drift detector (SDD). In the meantime, the next sample is collected on a clean spot of the filter tape, and the process is repeated during each sampling interval, which was set at 60 min for this study. The XRF spectra thus produced are automatically analyzed by a proprietary software for spectral analysis and elemental quantification, which is installed on the built-in computer. The software, through a linear least-squares deconvolution algorithm, fits each measured spectrum with a library of pure element reference spectra to obtain the concentration data for each calibrated element in ng m−3. Data can then be downloaded and monitored remotely with an internet connection. Sampling and XRF analysis are performed continuously and simultaneously, except for the time required for tape advancement (∼ 20 s). Quality assurance (QA) checks are performed every day at midnight for 30 min and consist of an energy calibration (using a rod coated with Cr and Nb) and an upscale measurement to monitor the stability of the instrument response (for Cr, Pb, and Cd). Therefore, the sample following midnight is collected with a sampling interval limited to 30 min (00:30–01:00 LT).
The instrument was located inside a temperature-controlled cabinet outside the ARPA Lombardia monitoring station. If any errors are detected during operation, the system halts sampling, ramps the X-rays down for safety, and displays the cause of the error. The instrument was configured to quantify 36 elements: Al, Si, P, S, Cl, K, Ca, Ti, V, Cr, Mn, Fe, Co, Ni, Cu, Zn, Ga, Ge, As, Se, Br, Rb, Sr, Y, Zr, Cd, In, Sn, Sb, I, Ba, Hg, Tl, Pb, and Bi; in addition, Nb was also detected for daily QA checks. Before the beginning of the experimental campaign, each of these elements was calibrated with a reference standard sample. For each element, 1σ interference-free MDLs (MDL1σ) for 1 h of sampling are reported in Table S2 in the Supplement, provided for Xact® 625i following the approach reported in Currie (1977). In XRF analyses, MDLs are inversely proportional to the square root of the irradiation time, which in the case of Xact® 625i corresponds to the sampling interval. Therefore, lower MDLs are reached for longer sampling durations.
2.3 Daily PM10 filter samples
Daily PM10 samples were collected on mixed cellulose ester membrane filters (47 mm diameter) with a SWAM Dual Channel Monitor (FAI Instruments, Rome, Italy) equipped with PM10 and PM2.5 inlets. The elemental composition of PM samples was determined offline by ED-XRF spectrometry in the laboratories of the Environmental Monitoring Sector of ARPA Lombardia. An Epsilon 4 spectrometer from Malvern Panalytical (Monza, Italy) was used for the ED-XRF analysis. Four different irradiation conditions, which are reported in Table S3 in the Supplement, were chosen to optimize the measurement of 19 elements, i.e., Al, Si, P, S, Cl, K, Ca, Ti, V, Cr, Mn, Fe, Ni, Cu, Zn, Br, Rb, Sr, and Pb. For these measurements, MDLs based on a 24 h sampling time were evaluated as 3 times the square root of the counts in the background below the peak of the element divided by the corresponding sensitivity in the blank filter (MDL3σ) (Jenkins et al., 1981; Lindgren, 2006) and are reported in Table S4 in the Supplement.
2.4 Data coverage
The Xact® 625i measurements started on 6 July 2023 16:00 LT (local time) and ended on 12 December 2023 22:00 LT. The sampling interval of the instrument was set to 1 h. During the summer, in July and August, Xact® 625i suffered from high temperatures during heat waves, causing the X-ray tube to reach temperatures above 45 °C. This led to automatic shutdowns of the measurements and to subsequent manual restarts, mostly performed remotely. The issue was mainly observed in the central hours of the day, from 13:00 to 16:00 LT. Nevertheless, it was still possible to attain a data coverage above 80 % for Xact® 625i data in the central hours of the day during summertime. As a precautionary measure to avoid heat damage to the X-ray tube, Xact® 625i was switched off from 12 to 24 August. During those days, a power failure in the ARPA Lombardia cabin caused also the interruption of daily measurements. Another power failure occurred from 22 October to 8 November, leading to a long pause of hourly measurements. The X-ray tube of Xact® 625i started malfunctioning on 6 December. The issue could not be resolved, and the X-ray tube had to be replaced, resulting in a premature end to the experimental campaign.
Overall, the Xact® 625i dataset consists of 2693 valid 1 h samples out of 3822 possible samples, attaining a coverage of 70 %. For the daily filters, the dataset consists of 149 samples out of 157 possible samples, reaching a coverage of 95 %. A timeline of the periods in which data are missing is reported for both hourly and daily measurements in Fig. S1 in the Supplement. A summary of the periods of interruption of the measurements lasting more than 12 h is reported in Table S5 in the Supplement. The number N of overlapping days with validated data is reported in Table 1 for each element considered for the intercomparison.
The Xact® 625i data, which were originally reported in LT, were synchronized to daily samples and expressed in UTC + 1 time zone.
2.5 Treatment of data below MDLs
Following the approach of Furger et al. (2017) and Tremper et al. (2018), for the intercomparison study presented here, the MDL3σ was considered also for Xact® 625i; indeed, the MDL3σ ensures high statistical confidence (99.7 %) and better comparability with previous literature works. Hereafter, MDL3σ will be referred to simply as MDL.
All the elements measured on the daily filters by offline ED-XRF have less than 35 % of their data points below their MDL. Among the elements detected by Xact® 625i, 13 of them (P, Co, Ga, Ge, Y, Cd, In, Sn, Sb, I, Hg, Tl, and Bi) have more than 90 % of their data points below the MDL; therefore, these elements were excluded from the intercomparison analysis. V and Rb have > 70 % of their data points below the MDL, leading to a less robust intercomparison with offline ED-XRF (see Fig. S2 in the Supplement). In Table S6 in the Supplement, the number of data points with concentrations above the MDL is reported for each element measured by Xact® 625i and by offline ED-XRF.
The intercomparison between Xact® 625i and daily PM10 elemental concentrations was finally performed on 16 elements (Al, Si, S, Cl, K, Ca, Ti, Cr, Mn, Fe, Ni, Cu, Zn, Br, Sr, and Pb), which were measured by both techniques and were consistently above their MDLs.
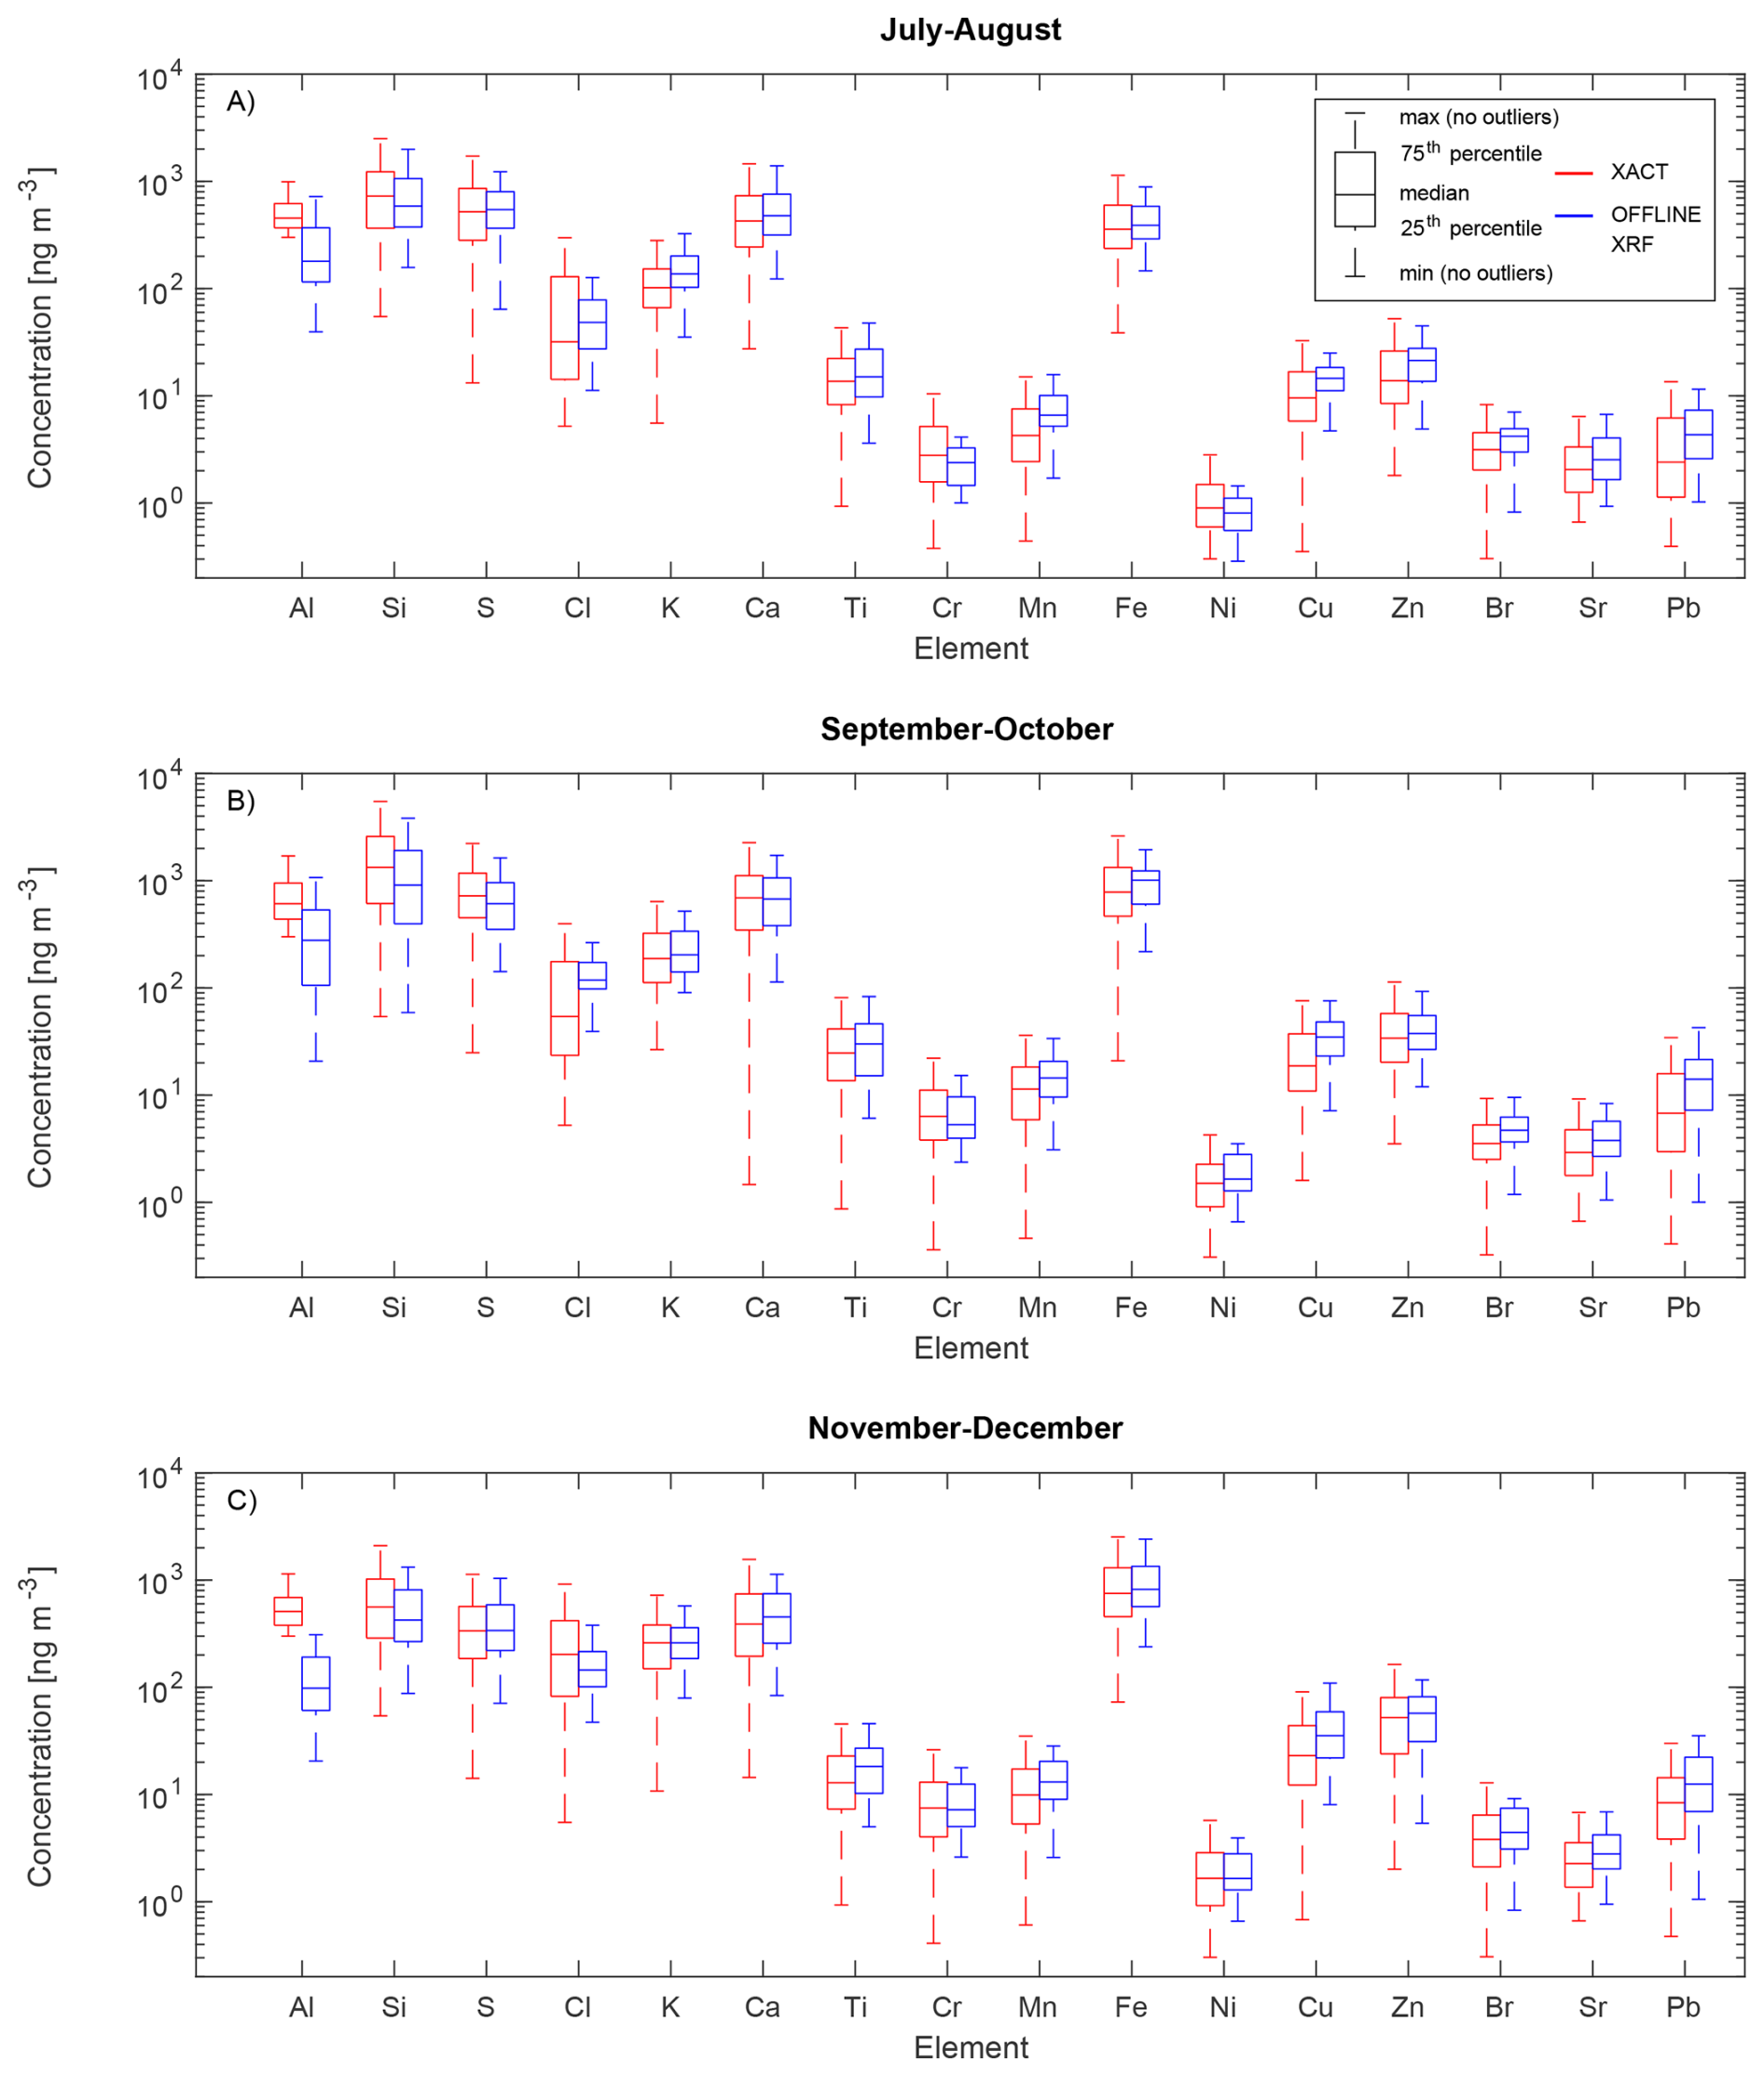
Figure 1Box plots of the concentrations for the elements considered for the intercomparison, measured hourly online (in red) and daily offline (in blue) during the experimental campaign in (a) July–August, (b) September–October, and (c) November–December. The bottom and top of each box are the 25th and 75th percentiles, respectively; the line in the middle of the box is the median; and the bottom and top whiskers are the minimum and maximum values, respectively.
3.1 Data overview
An overview of the data recorded during the experimental campaign is given in Fig. 1, taking into account all available valid data of the elements considered for the intercomparison. To account for seasonal differences in terms of meteorology and emissions, data were divided into three periods: July–August, September–October, and November–December. The basic statistics of the dataset, including the mean, median, standard deviations, and 25th and 75th percentiles, are reported in Table S7 in the Supplement. As previously mentioned, the Xact® 625i data coverage for July and August was impacted by the loss of data mainly related to the time interval 13:00–16:00 LT when hot temperatures caused the X-ray tube to switch off; therefore, the statistical robustness of the comparison is lower than in the other represented periods.
3.2 Intercomparison data analysis approach
For the intercomparison between the two methods, the Xact® 625i hourly data were averaged to 24 h to be comparable to the corresponding daily filter samples measured by offline ED-XRF. Every day, during QA checks performed from 00:00 to 00:30 LT, Xact® 625i generated one sample with a 30 min temporal resolution so that this sample could be added to the 23 hourly samples to calculate 24 h daily means. This procedure implicitly assumes that the half-hour sample collected during the first hour of sampling is representative of the entire hour. The hypothesis was tested conducting 23.5 h weighted means on a small number of samples, following the method of Furger et al. (2017). Tests showed a difference of less than 3 % between the 23.5 h weighted mean and the 24 h mean, which was then chosen as the calculation method. For this reason, the Xact® 625i data were aggregated to 24 h daily means.
As previously stated, during the campaign, summer days experienced heat waves, which caused Xact® 625i to stop during the central hours of the day, leading to missing data. For this reason, the data coverage of Xact® 625i was evaluated for each day of the experimental campaign. In order to avoid misestimation of daily Xact® 625i concentrations, days with less than 18 h of valid data (75 % coverage) were excluded from the intercomparison. In addition, Xact® 625i daily means were not calculated when more than 6 h of data were under the MDL for 1 day. In all comparisons, data under the MDL were replaced by 0.5 ⋅ MDL.
The comparisons between the daily PM10 elemental concentrations retrieved by ARPA Lombardia through offline ED-XRF and the daily means calculated from the Xact® 625i hourly data were carried out using the Deming regression (Deming, 1943). This regression approach minimizes the sum of distances between the regression line and the X and Y variables, considering the experimental uncertainties in both variables. For the offline ED-XRF measurements, the uncertainty included contributions of 5 % from calibration standard uncertainty (U.S. EPA, 1999) and, for each spectrum, the contribution of counting statistics and fitting errors. For the Xact® 625i measurements, the uncertainty included contributions of 5 % from calibration standard uncertainty (U.S. EPA, 1999) and an element-specific uncertainty derived from the spectral deconvolution calculated by the instrument software for each spectrum, which includes also the contribution of the flow and the sample deposit area. The mean relative uncertainties registered during the experimental campaign are reported for each element and for both online and offline methods in Table S8 in the Supplement.
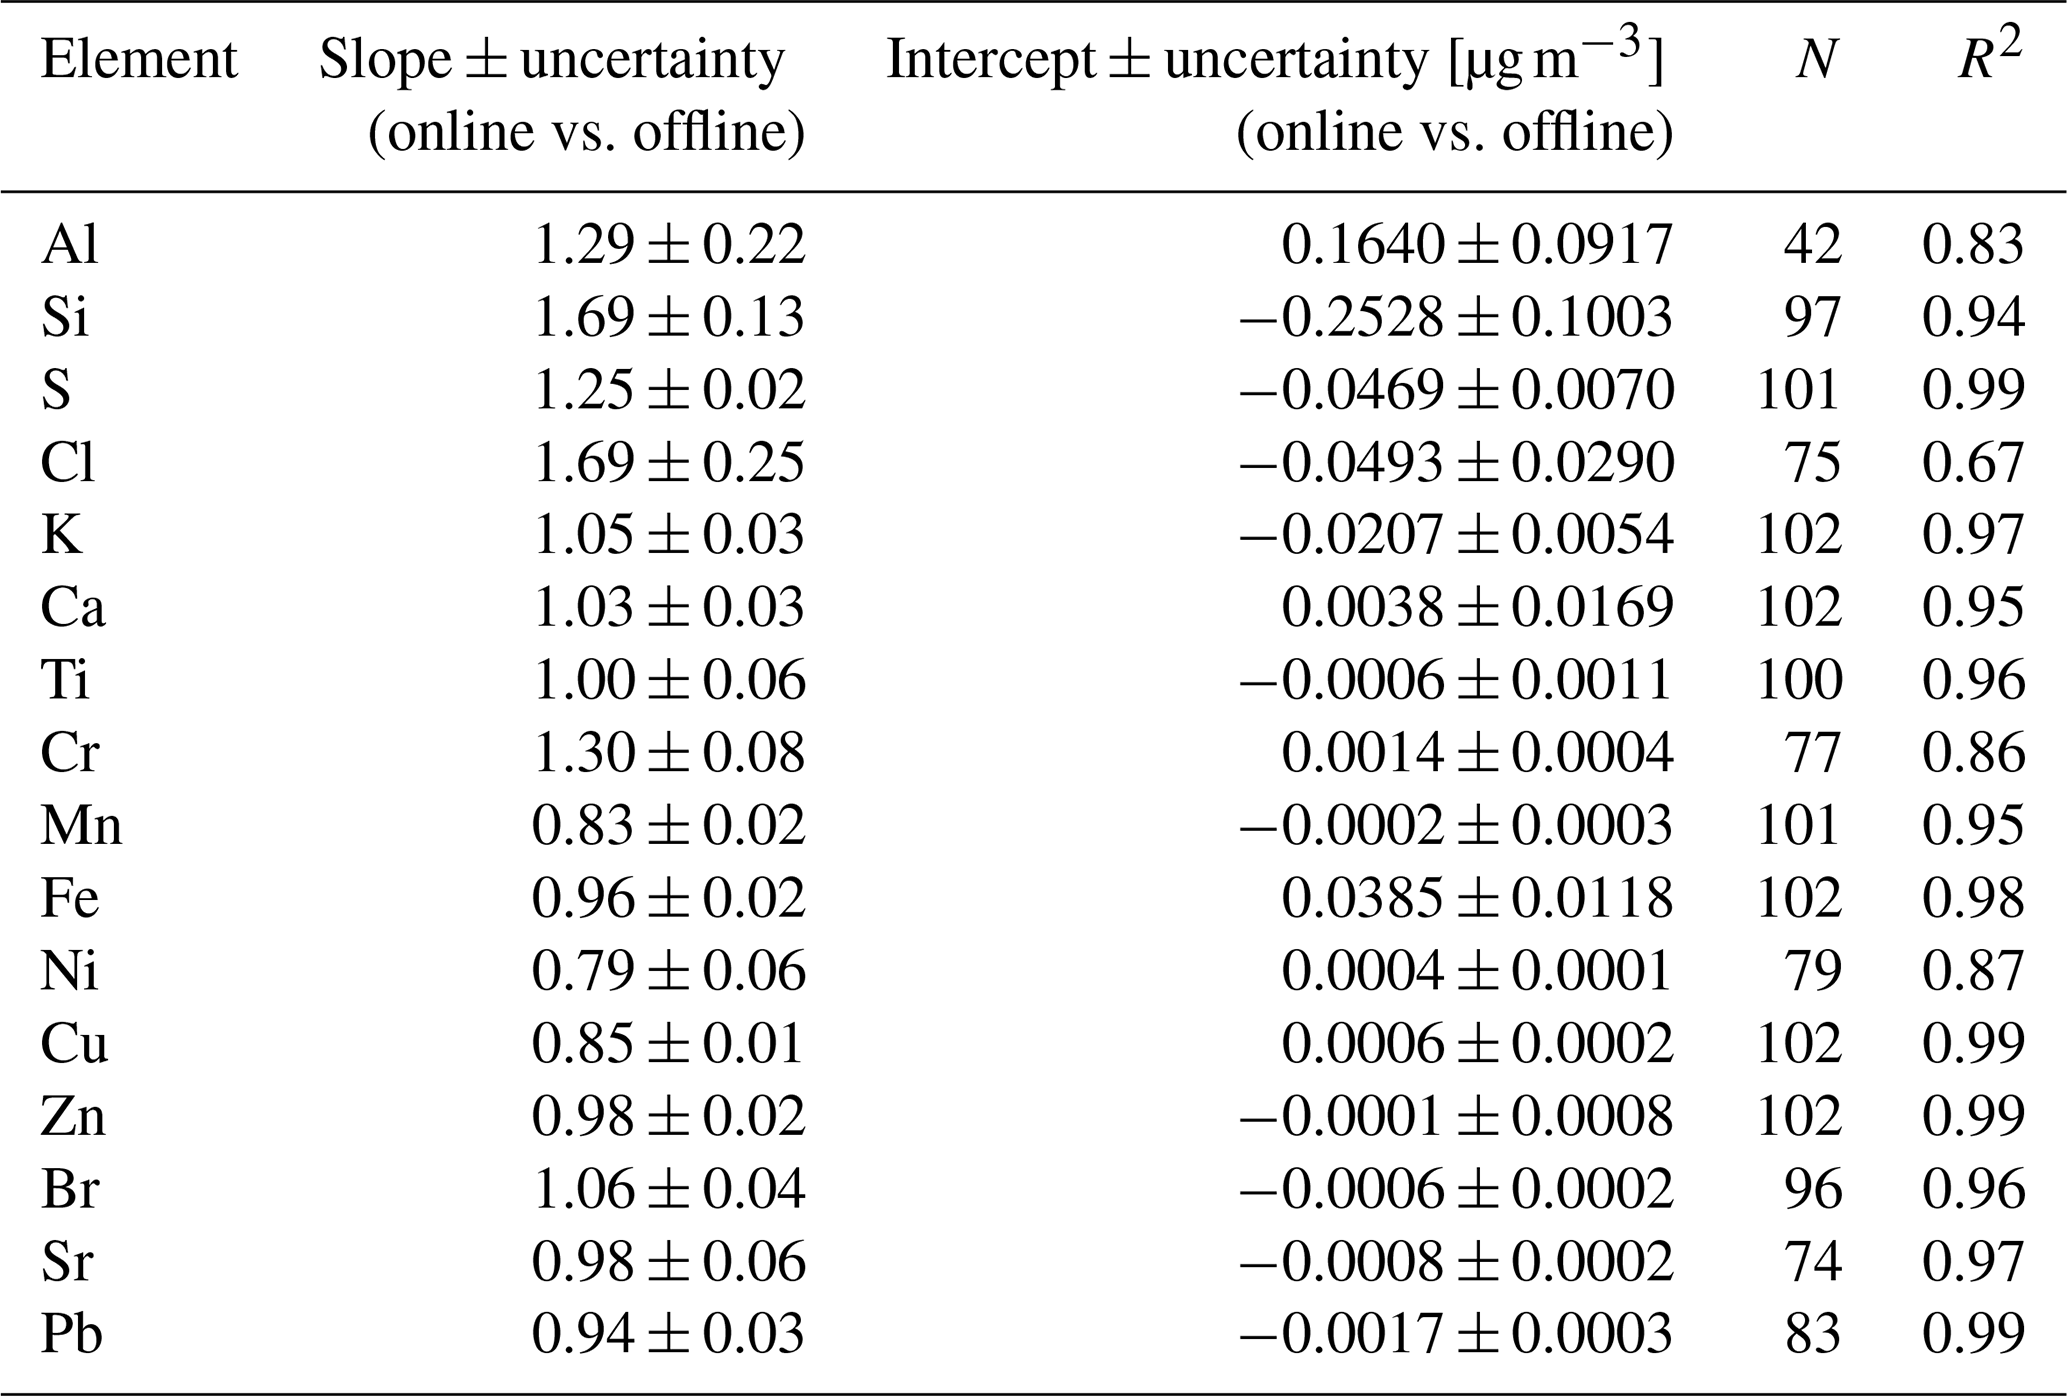
Table 1Deming regression results and coefficient of determination for the comparison between Xact® 625i (Y) and offline ED-XRF data (X). For each element, the number of points (N) available for the intercomparison is reported.
3.3 Intercomparison results
The results of the intercomparison between the PM10 elemental concentrations retrieved offline and online are reported in Table 1. The Deming regression parameters are reported along with their uncertainties and the coefficient of determination of the linear regression; the amount of data (N) considered for the comparison after data reduction is also reported.
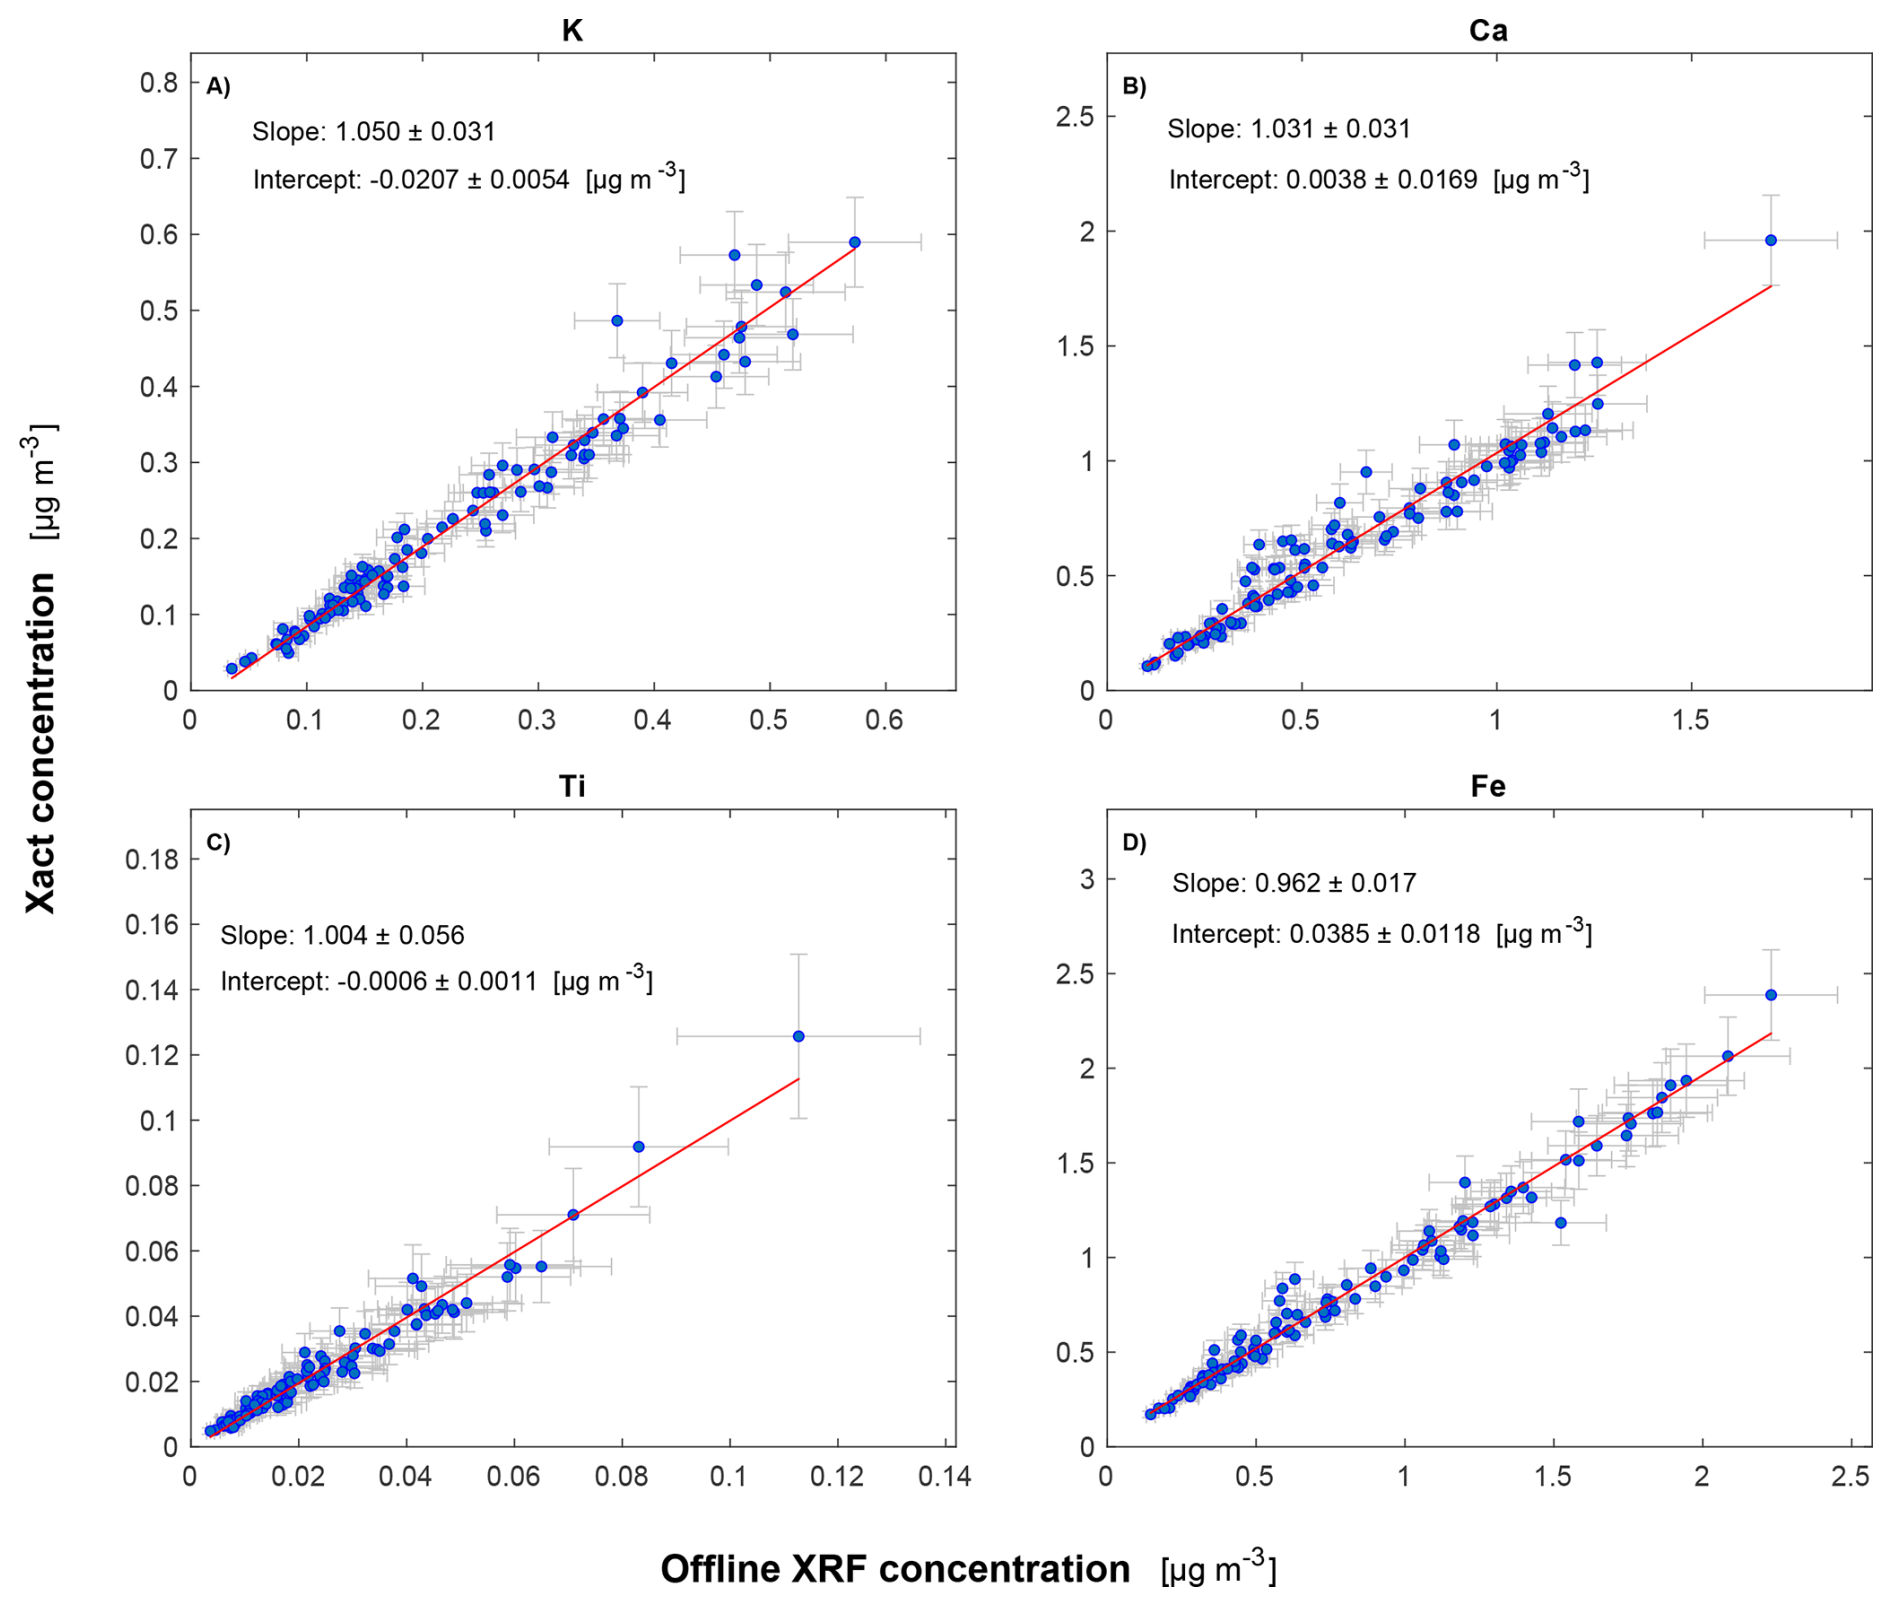
Figure 2Scatterplots of the intercomparison between Xact® 625i data and offline ED-XRF data for the elements K, Ca, Ti, and Fe of Group A. The error bars represent the mean experimental uncertainties reported in Table S8.
The scatterplots of the intercomparisons are presented in Figs. 2–5. The time plots of the time series obtained by the two measurements methods are reported in Figs. S3–S6 in the Supplement. The 16 selected elements are compared by dividing them into three groups based on data characteristics.
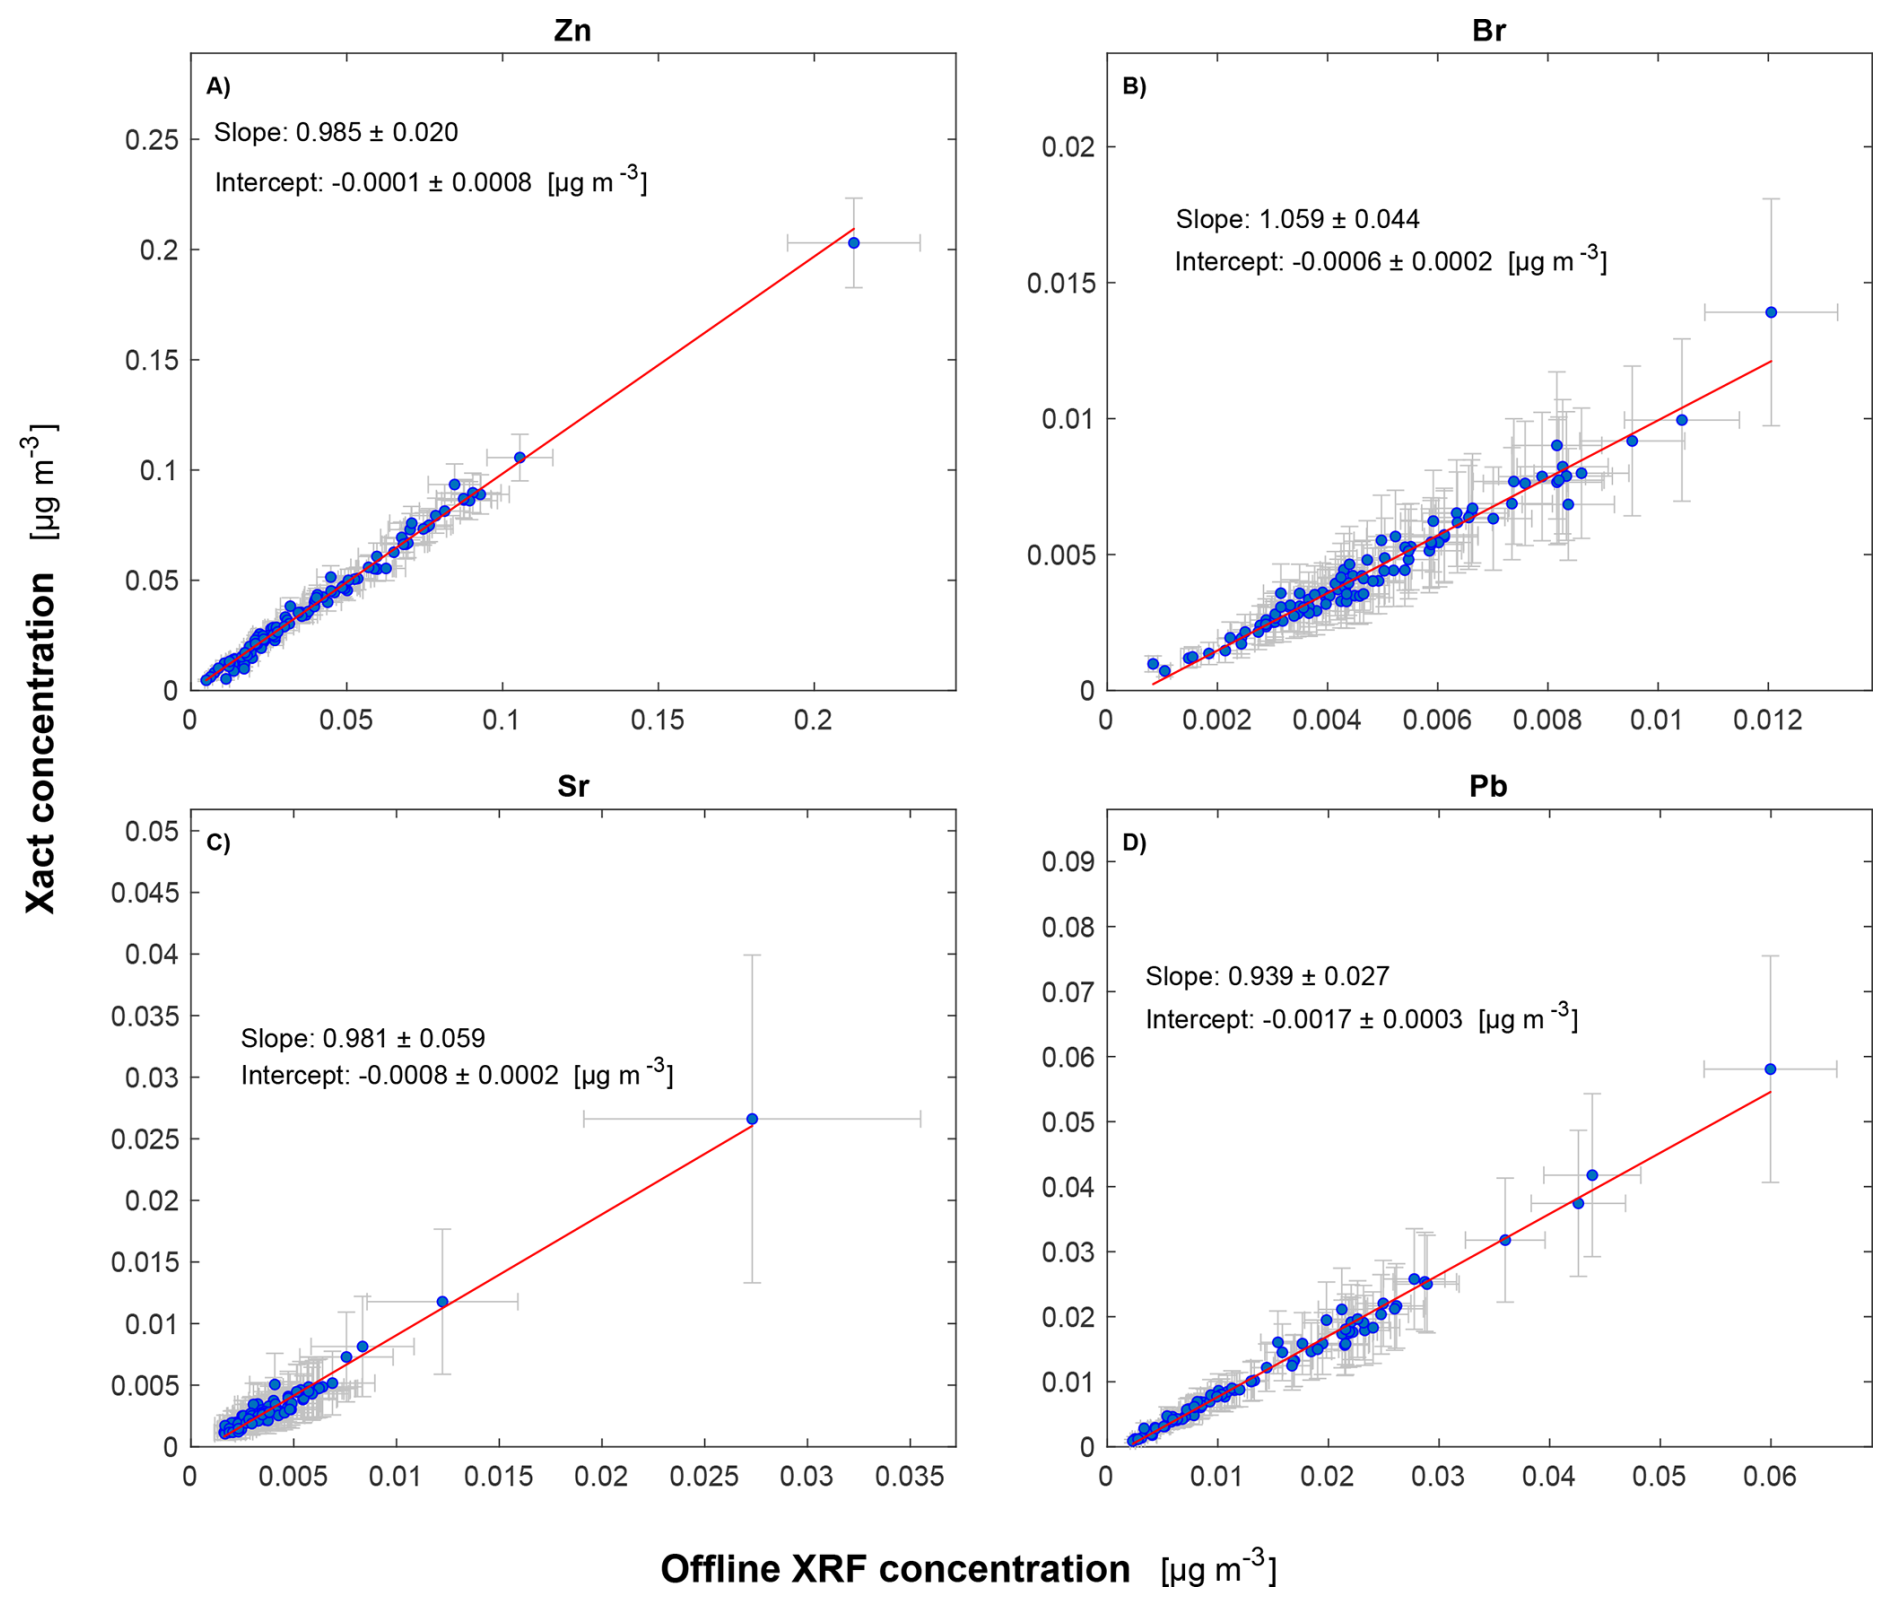
Figure 3Scatterplots of the intercomparison between Xact® 625i data and offline ED-XRF data for the elements Zn, Br, Sr, and Pb of Group A. The error bars represent the mean experimental uncertainties reported in Table S8.
The first group, Group A (Figs. 2 and 3), includes K, Ca, Ti, Fe, Zn, Br, Sr, and Pb. This group shows excellent correlation between the two measurements methods (R2 > 0.95) and is characterized by slopes compatible with unity within 3 times the uncertainty of the fitted slope (3σ). For Ca, Ti, and Zn also, the intercepts are compatible with 0 within 3σ. Among this group, K, Ca, Ti, Fe, and Zn are measured by Xact® 625i with relative uncertainties in the range 10 %–20 % (see Table S8). Br, Sr, and Pb are instead measured by Xact® 625i with a higher uncertainty, on average 30 %–50 % (see Table S8), and Sr and Pb hourly data are also more frequently under the MDL (20 % of data).
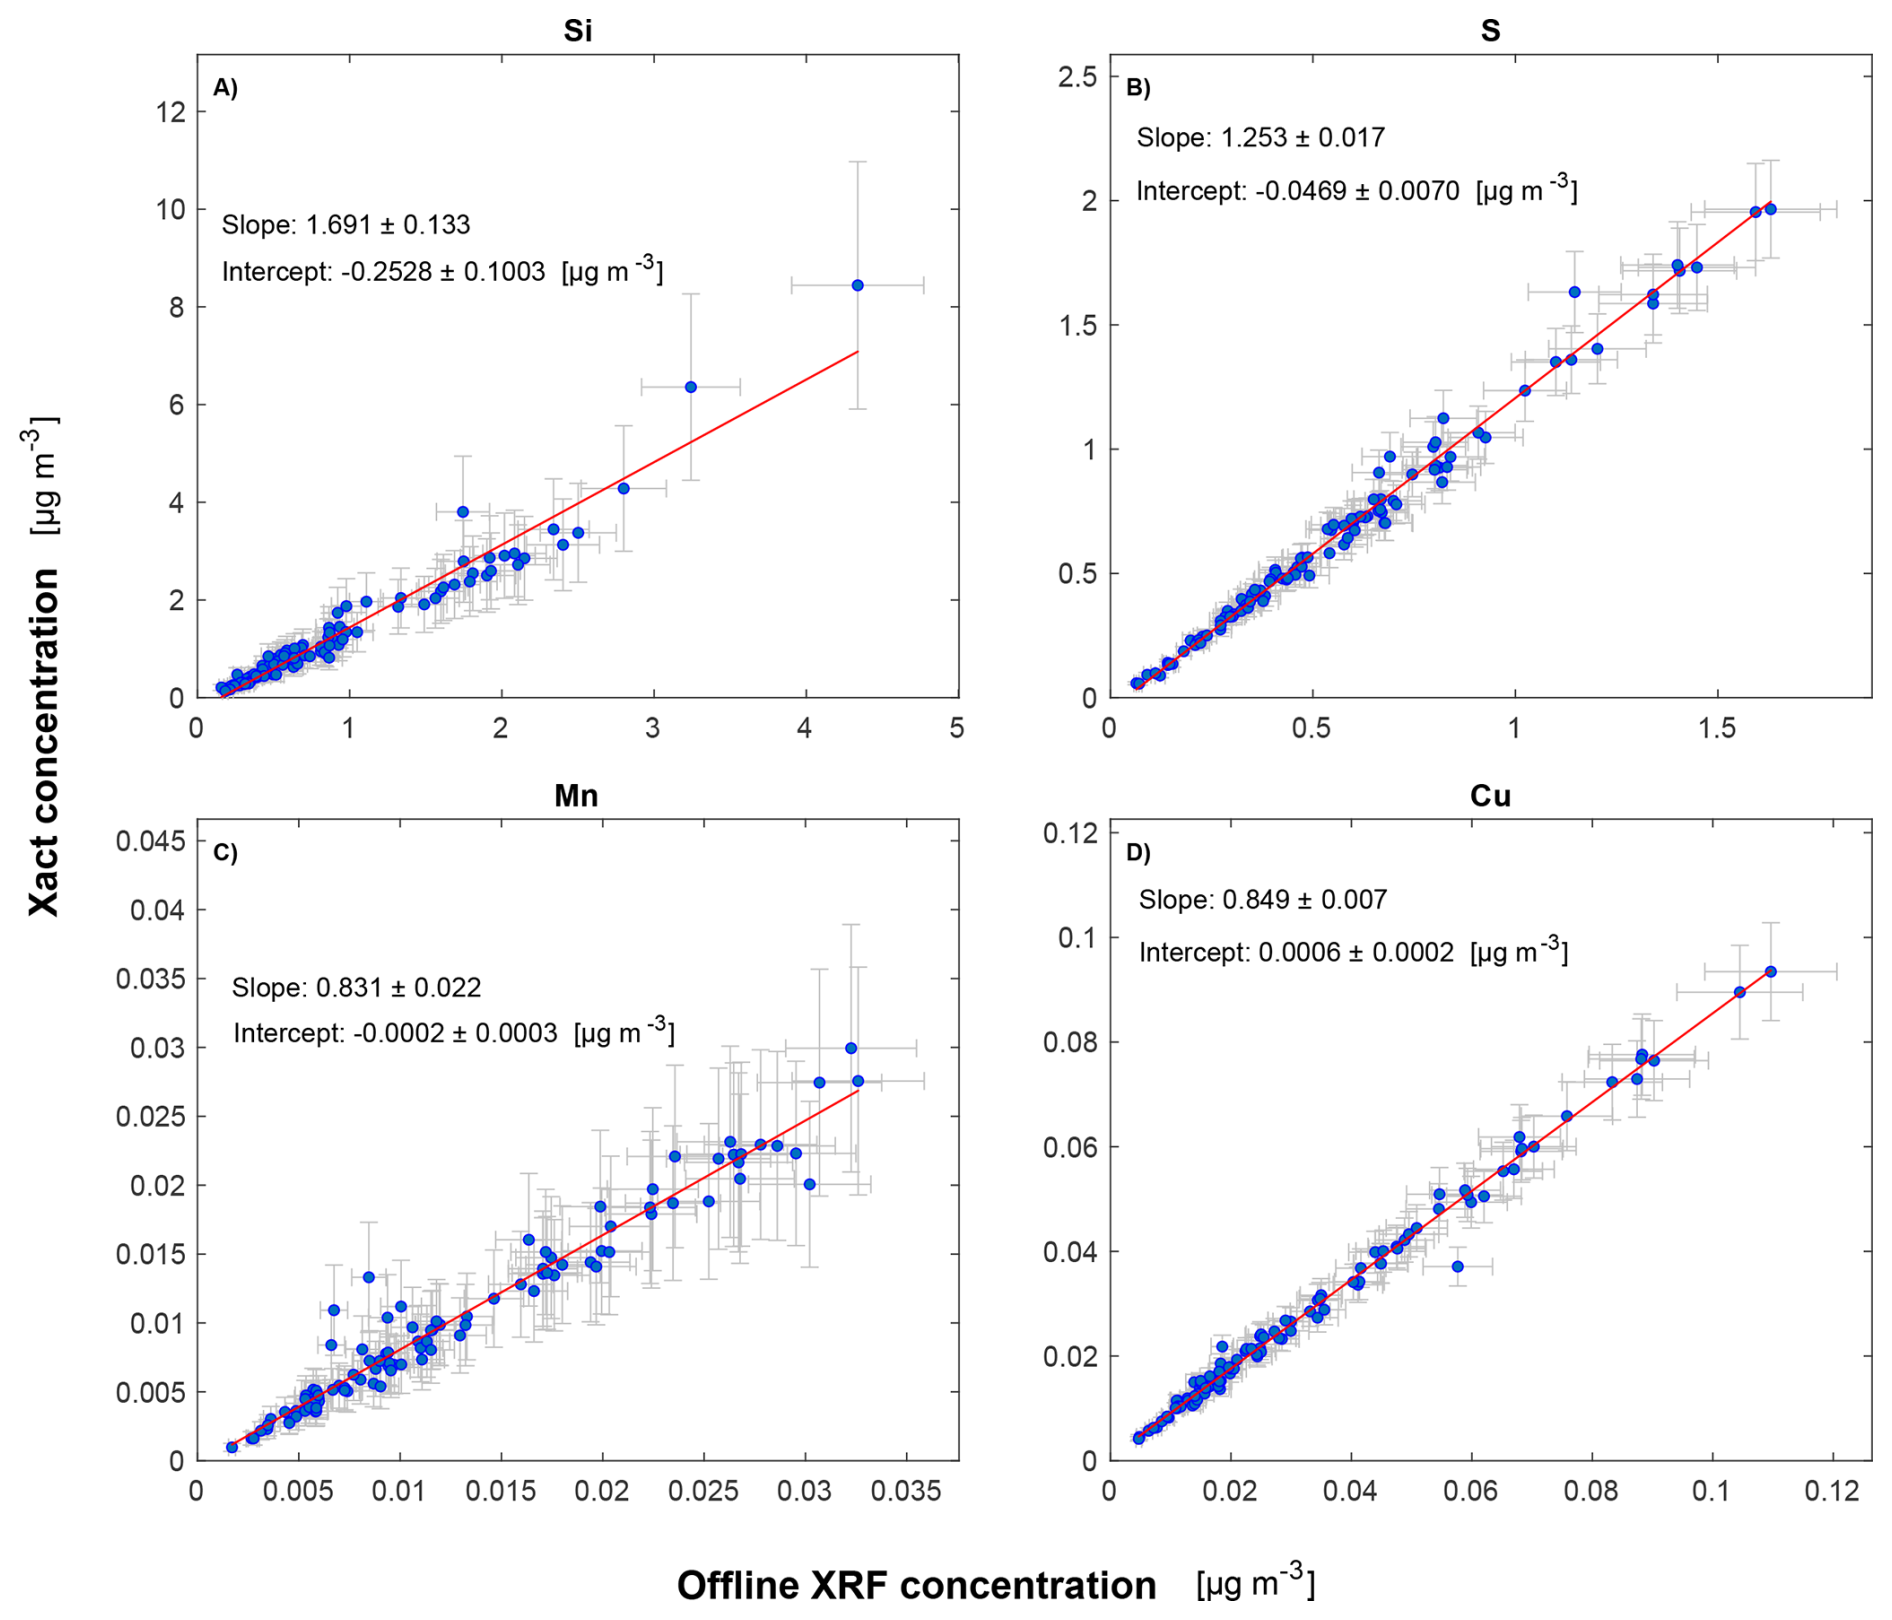
Figure 4Scatterplots of the intercomparison between Xact® 625i data and offline ED-XRF data for the elements of Group B: Si, S, Mn, and Cu. The error bars represent the mean experimental uncertainties reported in Table S8.
The second group, Group B (Fig. 4), consists of the elements Si, S, Mn, and Cu. This group is characterized by excellent correlation between the two measurements methods (R2 > 0.95), but, in contrast to Group A, the slopes of the regressions are not compatible with 1 within 3σ. Si and S are among the lightest elements measured by Xact® 625i and, along with Al, can be tricky to measure with ED-XRF because of absorption effects due to the presence of air in the irradiation chamber (e.g., as typically occurs in the XRF online measurements) and/or self-absorption inside the coarse particles themselves (Hunter and Rhodes, 1972a, b; Van Grieken and Markowicz, 1993); these effects can lead to an underestimation of low-Z element concentrations. Nevertheless, looking at the results for Al, Si, and S, absorption effects seem not to be the cause of the observed discrepancy, as the Xact® 625i data are typically higher than the offline ED-XRF analysis. Moreover, it should be noted that Si is detected by Xact® 625i with mean uncertainties of 30 %, while S is detected with mean uncertainties of 10 %. In the case of Mn and Cu, concentrations provided by Xact® 625i are constantly lower than the daily offline measurements by approximately 15 %.
A possible explanation for the observed discrepancies is related to the fact that, despite all samples being measured through the ED-XRF technique, the spectra analysis for quantitative analysis is different and – more importantly – the two instruments are not calibrated with the same set of certified standards, which can lead to different quantification of concentrations. However, the Xact® 625i data of the elements of this group can still be validated when compared to an offline measurement technique and used for high-temporal-resolution elemental concentration assessment, after harmonization of the datasets.
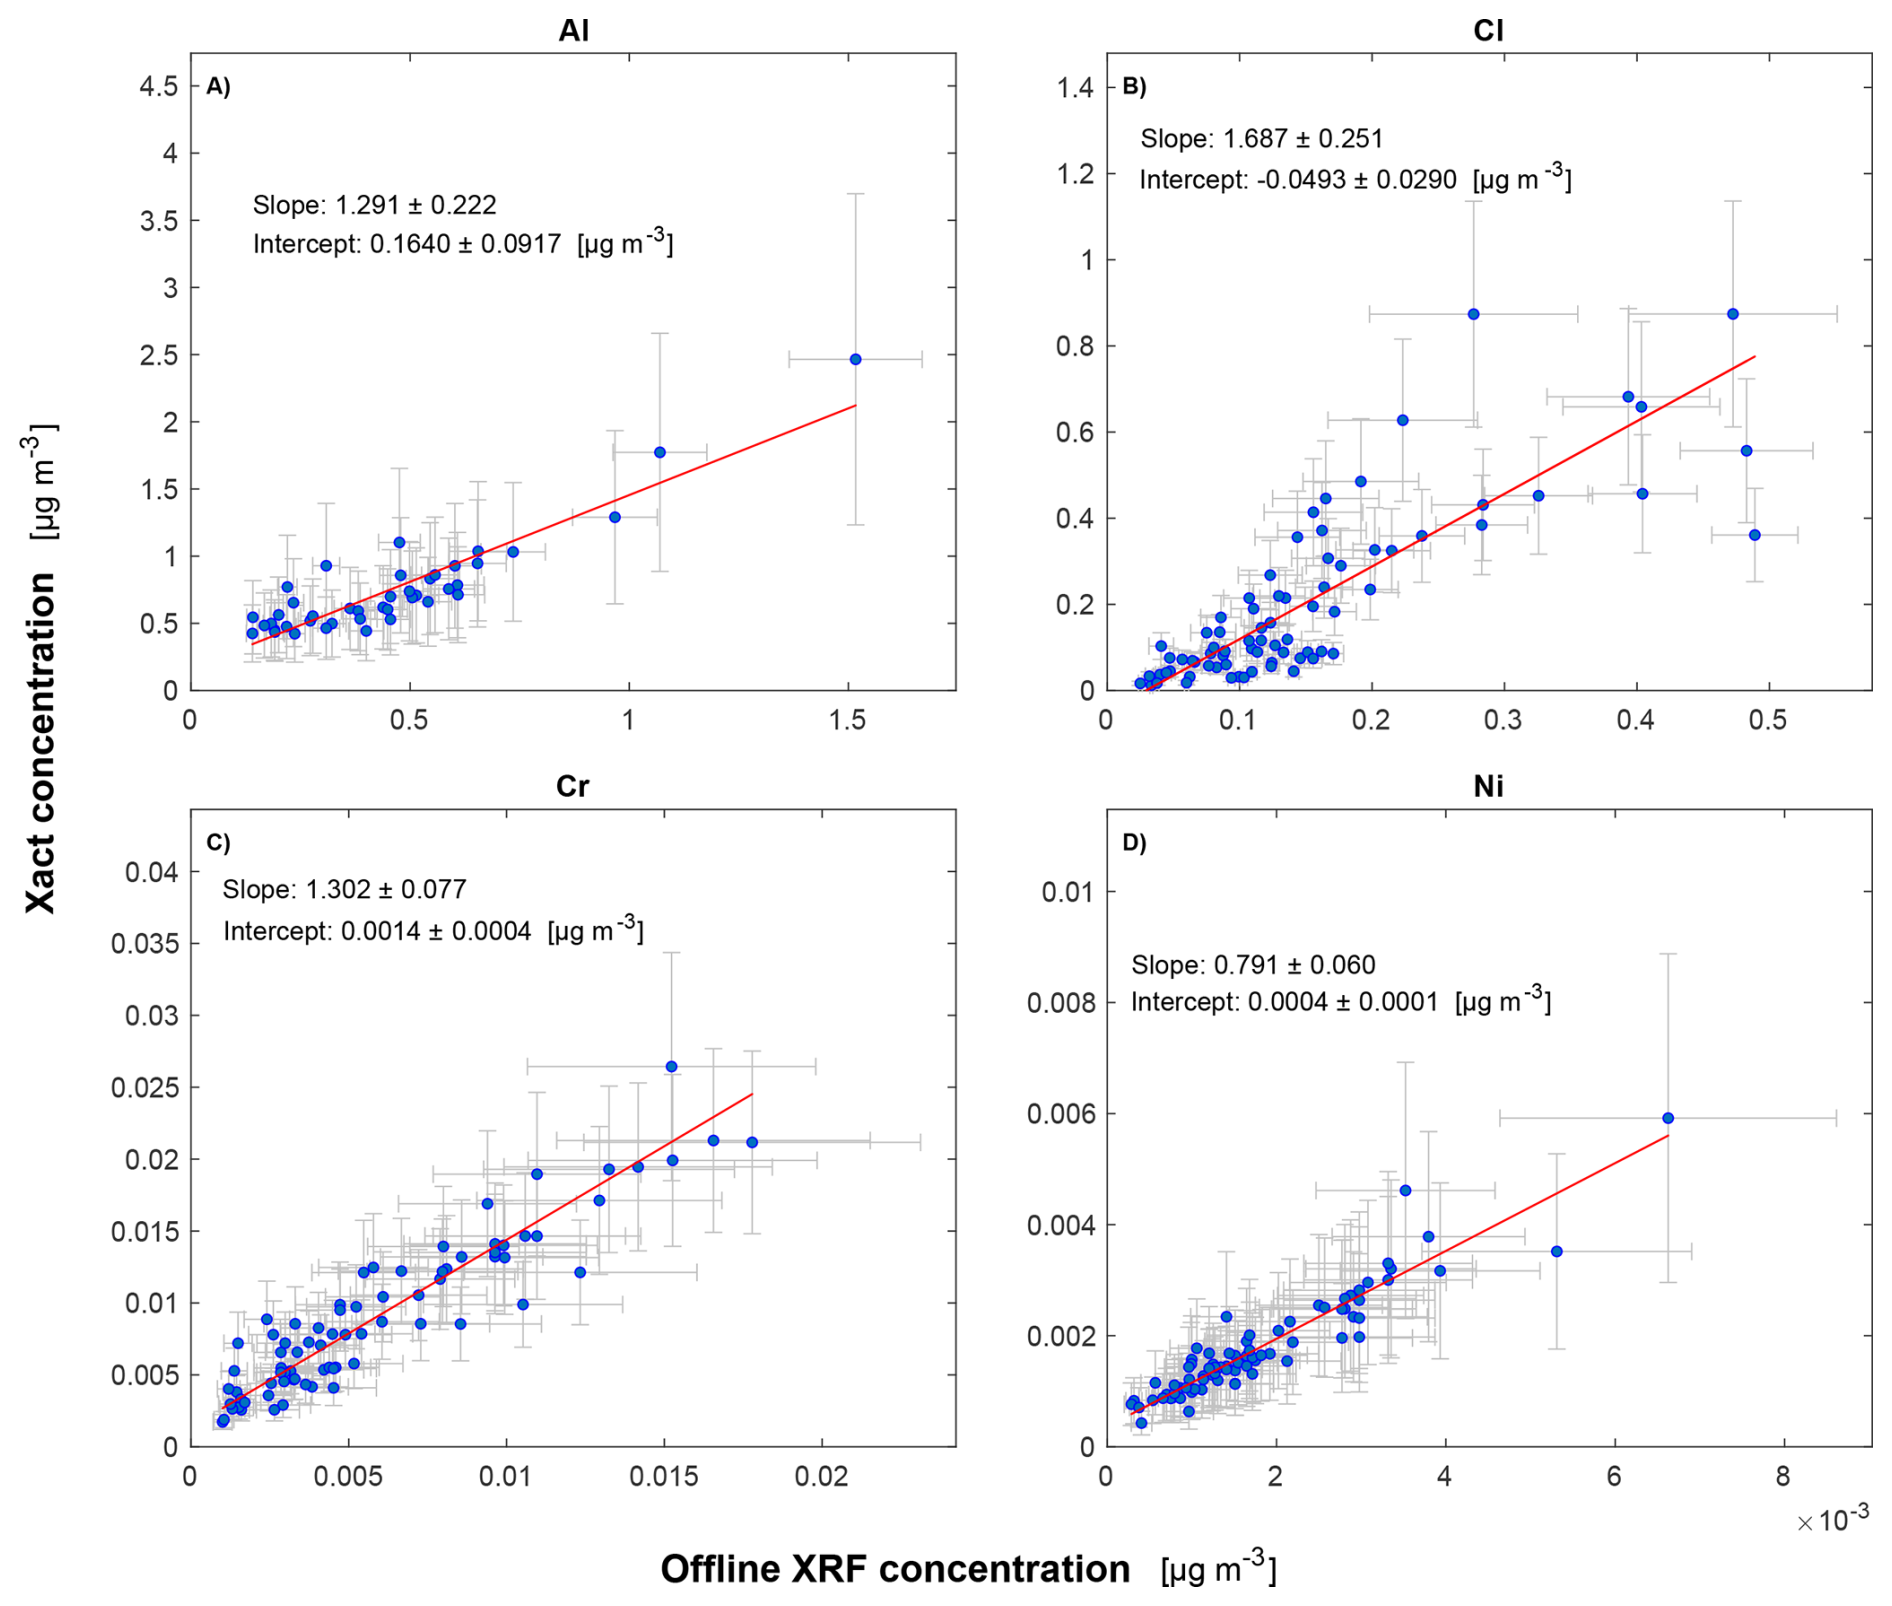
Figure 5Scatterplots of the intercomparison between Xact® 625i data and offline ED-XRF data for the elements of Group C: Al, Cl, Cr, and Ni. The error bars represent the mean experimental uncertainties reported in Table S8.
The third group of elements, Group C (Fig. 5), is composed of Al, Cl, Cr, and Ni. This group shows less comparability between the two methods, with R2 in the range of 0.67–0.87. Cl, Cr, and Ni are frequently close or under the MDL for both experimental techniques and are characterized by mean relative uncertainties in the range of 30 %–50 %. For these elements, the comparison could be improved by carrying out the Xact® 625i measurements on a 2 h timescale. Among the 16 elements evaluated for the intercomparison, Al is the one with the highest MDL for the Xact® 625i hourly measurements, and its hourly concentrations are under the MDL for nearly 35 % of data points, while Al offline data are always above the MDL. Al is also measured by Xact® 625i with mean uncertainties of 50 %. As can also be seen in Fig. S6a, the Xact® 625i time series of Al is characterized by a constant upward shift in background concentrations, which is not observed for the other elements. The measurement of Al with Xact® 625i is complicated by the fact that the instrument uses an Al filter to carry out the analysis, as reported in Table S1; another possible issue could be that the X-rays hit some internal parts of the instrument, causing a significant increase in the background. Al concentrations cannot thus be corrected in a reliable way, and further improvements in the instrument should be considered to enhance Al detection. In the case of Cl, which shows quite scattered data, concentrations obtained by Xact® 625i are on average higher than the ones measured offline on daily samples. This could be explained by the volatility of Cl. Xact® 625i ED-XRF measurements are performed immediately after the collection of the sample, while daily PM10 filters are stored in the sampler at the monitoring station for up to 2 weeks before being taken to the laboratory for the offline ED-XRF analysis.
The results of this study represent a significant step forward from Park et al. (2014), which is – as far as we know – the only previous study available in the literature presenting a comparison between Xact® hourly data and offline ED-XRF daily data. Park et al. (2014) conducted an experimental campaign with a forerunner version of Xact® (Xact® 620) in Gwangju, South Korea. The campaign was carried out during February 2011 and lasted only 1 month, focusing on the PM2.5 fraction. The Xact® 620 model was the first commercially available near-real-time ambient metal monitor; it was able to detect elements starting from K and had higher detection limits (details can be found in Park et al., 2014), required more manual intervention for calibration and quality assurance processes, and had a more basic interface with limited remote access capabilities. The daily filters were measured offline with an Epsilon 5 ED-XRF spectrometer (Malvern Panalytical). The study compared the online and offline concentrations of 12 elements (K, Ca, Ti, V, Mn, Fe, Ni, Cu, Zn, As, Ba, Pb), nine of which were also analyzed in our study. For the nine common elements (K, Ca, Ti, Mn, Fe, Ni, Cu, Zn, Pb), they observed a mean R2 of 0.89 and a slope of 1.31, with Xact® measurements on average 30 % higher than offline ED-XRF. In our study, for these nine elements, we found a much better correlation, with a mean R2 of 0.96 and slope of 0.94, which is closer to unity. Moreover, our study included seven elements (Al, Si, S, Cl, Cr, Br, Sr) that were not taken into account by Park et al. (2014), and the measurement campaign lasted for a longer period (6 months), giving more robustness to the results.
Overall, considering all 16 elements evaluated in this study, we found good correlation (mean R2 of 0.93) between the online and offline ED-XRF, with a mean slope of 1.11. The results are also in agreement with Tremper et al. (2018), who compared Xact® measurements to ICP-MS daily measurements at three sites in the United Kingdom. They observed a mean R2 of 0.93 and a slope of 1.07 for the elements As, Ba, Ca, Cr, Cu, Fe, K, Mn, Ni, Pb, Se, Sr, Ti, V, and Zn. In the study by Furger et al. (2017), they found instead that the elemental measurements by an Xact® 625i were, on average, 28 % higher than ICP-OES and ICP-MS measurements for S, K, Ca, Ti, Mn, Fe, Cu, Zn, Ba, and Pb.
A summary of previous literature studies and their characteristics is reported in Tables S9 and S10 in the Supplement. In these studies, several reasons for the differences observed between the Xact® data and the offline techniques are described, and some of them are shortly reported below. In general, as specified in Tremper et al. (2018), the measured elements are chosen to represent a range of source categories (i.e., regulatory, traffic, industry), plus the internal standard (Pd for Xact® 625 and Nb for Xact® 625i). The number of elements that are actually quantified and thus included in the intercomparison results for each study depends on the ambient air concentrations and thus the site and MDL of the techniques.
In the U.S. EPA (2012) work, intercomparison results are available only for six elements, as the others were under the MDL of ICP-MS analysis and/or Xact® measurements; weak regression parameters for Cu are explained by concentrations frequently close to the MDL of both techniques. In Furger et al. (2017), Xact® and ICP-MS data showed high linearity and little scatter in the regressions for the elements S, K, Ca, Ti, Mn, Fe, Cu, Zn, Ba, and Pb; the relative mean difference of 28 % they found was attributed to many possible causes such as differences in the inlets used for the Xact® instrument and the high-volume samplers for ICP-MS filter samples, a slightly different location of the samplers, possible calibration issues with the Xact® device for S, values next to MDLs for one or both techniques, XRF particle-size-dependent self-absorption effects for the lighter elements, and line interferences or contaminations during the ICP-MS digestion and analysis procedures. Tremper et al. (2018) and Bhowmik et al. (2022) both mentioned similar reasons for the differences observed between Xact® and ICP-MS filter data; in addition, blank filters were found to be variable, the standards used for Xact® calibration had a much higher concentration than ambient air, and the calibration matrix differed from the sample matrix.
This study was realized to evaluate the performances of an Xact® 625i online energy dispersive XRF spectrometer. Although X-ray fluorescence is notably less sensitive than other analytical techniques like ICP-MS, it is robust and stable; hence, online spectrometers can also be deployed in monitoring networks due to their easy use and low maintenance. Online spectrometers are still quite expensive, and only a reduced number of elements are detectable compared to, e.g., ICP-MS, but for source apportionment studies, the availability of high-resolution elemental composition is currently key to refined modeling applications. Indeed, the possibility of joining high-temporal-resolution elemental data, which provide details on temporal patterns, and low-temporal-resolution elemental data, which allow the detection of elemental tracers for specific sources, has already been proved to be effective for source apportionment studies (see, e.g., Crespi et al., 2016; Forello et al., 2019; Mooibroek et al., 2022).
A 6-month experimental campaign was carried out at the ARPA Lombardia monitoring station Milano Pascal (Milan, Italy) from July to December 2023. The instrument was configured to continuously measure 36 elements, ranging from Al to Bi, with 1 h temporal resolution. The measurement quality of Xact® 625i was tested by intercomparison with ED-XRF offline analyses on 24 h PM10 samples with a well-established benchtop spectrometer. Xact® 625i hourly data were aggregated to 24 h means and compared to daily PM10 data. The study focused on 16 elements that were measured by both techniques and were consistently above their MDLs (Al, Si, S, Cl, K, Ca, Ti, Cr, Mn, Fe, Ni, Cu, Zn, Br, Sr, and Pb).
Xact® 625i was found to be a highly reliable instrument, suitable for measurements of the elemental concentration of PM10 in summer and winter conditions at 1 h temporal resolution. Xact® 625i elemental concentrations were found to be highly correlated to the offline ED-XRF analyses of the daily samples (R2 in the range of 0.67–0.99), albeit with slopes ranging from 0.79 to 1.70. Elements were divided into three groups according to their characteristics. The first group, Group A (K, Ca, Ti, Fe, Zn, Br, Sr, and Pb), shows excellent correlation between the two measurement methods (R2 > 0.95) and slopes compatible with 1 (range of 0.94–1.06). Group B (Si, S, Mn, and Cu) is still characterized by excellent correlations between the two techniques, but the regression slopes are not compatible with 1. Xact® 625i performances are more critical for the elements of Group C (Al, Cl, Cr, and Ni). These elements are frequently under the MDL for one or both experimental techniques and show the worst correlations between the two methods (R2 ranging from 0.67 to 0.87). An issue of the Xact® 625i instrument is related to the quantification of Al, which is problematic such that the Al concentrations are basically not reliable.
Future work should include an intercomparison between an Xact® 625i and an offline ED-XRF spectrometer calibrated with the same certified standards in order to avoid biases linked to the calibration of the instruments. Moreover, it would be interesting to assess the reliability of Xact® 625i high-temporal-resolution measurements by comparing it to other instruments/techniques able to perform measurements of PM elemental concentration at high temporal resolution, like the Horiba PX-375 ED-XRF automatic sampler (Asano et al., 2017; Trebs et al., 2024).
The data in this paper are available at https://doi.org/10.5281/zenodo.17465290 (Vecchi and Daellenbach, 2025).
The supplement related to this article is available online at https://doi.org/10.5194/amt-18-6435-2025-supplement.
LC: Data curation, Formal analysis, Visualization, Investigation, Writing – original draft preparation, Writing – review and editing; BB: Data curation, Investigation, Writing – review and editing; BC: Data curation, Writing – review and editing; CC: Resources, Project administration, Writing – review and editing; RC: Investigation; EC: Investigation, Data curation, Validation, Writing – review and editing; MIM: Data curation, Investigation, Writing – review and editing; KRD: Resources, Validation, Writing – review and editing; ASHP: Project administration, Resources, Writing – review and editing; RV: Supervision, Validation, Writing – review and editing.
The contact author has declared that none of the authors has any competing interests.
Publisher's note: Copernicus Publications remains neutral with regard to jurisdictional claims made in the text, published maps, institutional affiliations, or any other geographical representation in this paper. While Copernicus Publications makes every effort to include appropriate place names, the final responsibility lies with the authors. Views expressed in the text are those of the authors and do not necessarily reflect the views of the publisher.
The Department of Physics of the University of Milan is acknowledged for the fellowship provided to Laura Cadeo.
This research has been supported by the Schweizerischer Nationalfonds zur Förderung der Wissenschaftlichen Forschung (grant no. PZPGP2_201992).
This paper was edited by Albert Presto and reviewed by two anonymous referees.
Altuwayjiri, A., Soleimanian, E., Moroni, S., Palomba, P., Borgini, A., De Marco, C., Ruprecht, A. A., and Sioutas, C.: The impact of stay-home policies during Coronavirus-19 pandemic on the chemical and toxicological characteristics of ambient PM2.5 in the metropolitan area of Milan, Italy, Sci. Total Environ., 758, 143582–143582, https://doi.org/10.1016/j.scitotenv.2020.143582, 2021.
Amato, F., Alastuey, A., Karanasiou, A., Lucarelli, F., Nava, S., Calzolai, G., Severi, M., Becagli, S., Gianelle, V. L., Colombi, C., Alves, C., Custódio, D., Nunes, T., Cerqueira, M., Pio, C., Eleftheriadis, K., Diapouli, E., Reche, C., Minguillón, M. C., Manousakas, M.-I., Maggos, T., Vratolis, S., Harrison, R. M., and Querol, X.: AIRUSE-LIFE+: a harmonized PM speciation and source apportionment in five southern European cities, Atmos. Chem. Phys., 16, 3289–3309, https://doi.org/10.5194/acp-16-3289-2016, 2016.
Ariola, V., Campajola, L., D'Alessandro, A., Del Carmine, P., Gagliardi, F., Lucarelli, F., Mandò, P. A., Marcazzan, G., Moro, R., Nava, S., Prati, P., Valli, G., Vecchi, R., Zucchiatti, A.: Aerosol characterisation in Italian towns by IBA techniques, Nucl. Instrum. Methods Phys. Res. B,, 190, 471–476, 2002.
Asano, H., Aoyama, T., Mizuno, Y., and Shiraishi, Y.: Highly Time-Resolved Atmospheric Observations Using a Continuous Fine Particulate Matter and Element Monitor, ACS Earth and Space Chemistry, 1, 580–590, https://doi.org/10.1021/acsearthspacechem.7b00090, 2017.
Bernardoni, V., Cuccia, E., Calzolai, G., Chiari, M., Lucarelli, F., Massabò, D., Nava, S., Prati, P., Valli, G., Vecchi, R.: ED-XRF set-up for size-segregated aerosol samples analysis, X-Ray Spectr., 40, 79–87, https://doi.org/10.1002/xrs.1299, 2011a.
Bernardoni, V., Vecchi, R., Valli, G., Piazzalunga, A., Fermo, P.: PM10 source apportionment in Milan (Italy) using time-resolved data, Sci. Total Environ., 409, 4788–4795, https://doi.org/10.1016/j.scitotenv.2011.07.048, 2011b.
Bhowmik, H. S., Shukla, A., Lalchandani, V., Dave, J., Rastogi, N., Kumar, M., Singh, V., and Tripathi, S. N.: Inter-comparison of online and offline methods for measuring ambient heavy and trace elements and water-soluble inorganic ions (, , , and C−) in PM2.5 over a heavily polluted megacity, Delhi, Atmos. Meas. Tech., 15, 2667–2684, https://doi.org/10.5194/amt-15-2667-2022, 2022.
Brunekreef, B. and Holgate, S. T.: Air pollution and health, Lancet, 360, 1233–1242, https://doi.org/10.1016/S0140-6736(02)11274-8, 2002.
Calzolai, G., Chiari, M., Lucarelli, F., Mazzei, F., Nava, S., Prati, P., Valli, G., and Vecchi, R.: PIXE and XRF analysis of particulate matter samples: an inter-laboratory comparison, Nucl. Instrum. Methods Phys. Res. B, 266, 2401–2404, https://doi.org/10.1016/j.nimb.2008.03.056, 2008.
Calzolai, G., Chiari, M., Lucarelli, F., Nava, S., and Portarena, S.: Proton induced γ-ray emission yields for the analysis of light elements in aerosol samples in an external beam set-up, Nucl. Instrum. Methods Phys. Res. B, 268, 1540–1545, https://doi.org/10.1016/j.nimb.2010.03.002, 2010.
Calzolai, G., Chiari, M., Lucarelli, F., Nava, S., Taccetti, F., Becagli, S., Frosini, D., Traversi, R., Udisti, R.: PIXE–PIGE analysis of size-segregated aerosol samples from remote areas, Nucl. Instrum. Methods Phys. Res. B, 318, 125–129, https://doi.org/10.1016/j.nimb.2013.05.097, 2014.
Calzolai, G., Lucarelli, F., Chiari, M., Nava, S., Giannoni, M., Carraresi, L., Prati, P., and Vecchi, R.: Improvements in PIXE analysis of hourly particulate matter samples, Nucl. Instrum. Methods Phys. Res. B, 363, 99–104, https://doi.org/10.1016/j.nimb.2015.08.022, 2015.
Canepari, S., Perrino, C., Astolfi, M. L., Catrambone, M., and Perret, D.: Determination of soluble ions and elements in ambient air suspended particulate matter: Inter-technique comparison of XRF, IC and ICP for sample-by-sample quality control, Talanta, 15, 77, 1821–9, https://doi.org/10.1016/j.talanta.2008.10.029, 2009.
Chen, L. C. and Lippmann, M.: Effects of metals within ambient air particulate matter (PM) on human health, Inhal. Toxicol., 21, 1–31, https://doi.org/10.1080/08958370802105405, 2009.
Crespi, A., Bernardoni, V., Calzolai, G., Lucarelli, F., Nava, S., Valli, G., and Vecchi, R.: Implementing constrained multi-time approach with bootstrap analysis in ME-2: An application to PM2.5 data from Florence (Italy), Sci. Total Environ., 541y, 502–511, https://doi.org/10.1016/j.scitotenv.2015.08.159, 2016.
Criss, J. W.: Particle size and composition effects in X-ray fluorescence analysis of pollution samples, Analytical Chemistry, 48, 179–186, 1976.
Currie, L.: Detection and quantification in X-ray fluorescence spectrometry, in: X-Ray fluorescence analysis of environmental samples, IX, edited by: Dzubay, T. G., Ann Arbor Science Publishers, 289–306, 1977.
Daellenbach, K. R., Uzu, G., Jiang, J., Cassagnes, L.-E., Leni, Z., Vlachou, A., Stefenelli, G., Canonaco, F., Weber, S., Segers, A., Kuenen, J. J. P., Schaap, M., Favez, O., Albinet, A., Aksoyoglu, S., Dommen, J., Baltensperger, U., Geiser, M., El Haddad, I., Jaffrezo J.-L., and Prévôt, A. S. H.: Sources of particulate-matter air pollution and its oxidative potential in Europe, Nature, 587, 414–419, https://doi.org/10.1038/s41586-020-2902-8, 2020.
Deming, W. E.: Statistical adjustment of data, John Wiley & Sons, New York; Chapman & Hall, London, 261 pp., 1943.
Duarte, R. M. B. O., Gomes, J. F. P., Querol, X., Cattaneo, A., Bergmans, B., Saraga, D., Villanueva, F.: Advanced instrumental approaches for chemical characterization of indoor particulate matter, Applied Spectr. Rev., 57, 705–745, https://doi.org/10.1080/05704928.2021.2018596, 2021.
Forello, A. C., Bernardoni, V., Calzolai, G., Lucarelli, F., Massabò, D., Nava, S., Pileci, R. E., Prati, P., Valentini, S., Valli, G., and Vecchi, R.: Exploiting multi-wavelength aerosol absorption coefficients in a multi-time resolution source apportionment study to retrieve source-dependent absorption parameters, Atmos. Chem. Phys., 19, 11235–11252, https://doi.org/10.5194/acp-19-11235-2019, 2019.
Foster, R. D., Read, M. L., and Usher, J. M.: Particle size and depth effect errors in the XRF determination of elements in aerosol collected onto filters, Health and Safety Laboratory, IS/96/03, 1996.
Furger, M., Minguillón, M. C., Yadav, V., Slowik, J. G., Hüglin, C., Fröhlich, R., Petterson, K., Baltensperger, U., and Prévôt, A. S. H.: Elemental composition of ambient aerosols measured with high temporal resolution using an online XRF spectrometer, Atmos. Meas. Tech., 10, 2061–2076, https://doi.org/10.5194/amt-10-2061-2017, 2017.
Fuzzi, S., Baltensperger, U., Carslaw, K., Decesari, S., Denier van der Gon, H., Facchini, M. C., Fowler, D., Koren, I., Langford, B., Lohmann, U., Nemitz, E., Pandis, S., Riipinen, I., Rudich, Y., Schaap, M., Slowik, J. G., Spracklen, D. V., Vignati, E., Wild, M., Williams, M., and Gilardoni, S.: Particulate matter, air quality and climate: lessons learned and future needs, Atmos. Chem. Phys., 15, 8217–8299, https://doi.org/10.5194/acp-15-8217-2015, 2015.
Hyslop, N. P., Rosales, C. M. F., Weber, F. X., Dombek, T. L., Levine, K. E., McWilliams, A. C., and Spada, N. J.: A comparison of XRF and ICP-MS for PM2.5 elemental analysis in the chemical speciation network, EM Magazine, 2024, https://aqrc.ucdavis.edu/sites/g/files/dgvnsk1671/files/inline-files/XRF-ICP Comparison PM2.5.pdf (last access: 29 October 2025), 2024.
Hunter, C. B. and Rhodes, J. R.: Particle size effects in X-ray emission analysis: formulae for continuous size distributions, X-Ray Spectr., 1, 107–111, 1972a.
Hunter, C. B. and Rhodes, J. R.: Particle size effects in X-ray emission analysis: Simplified formulae for certain practical cases, X-Ray Spectr., 1, 113–117, 1972b.
Jenkins, R., Gould, R. W., and Gedcke, D. (Eds.): Quantitative X-ray Spectrometry, Marcel Dekker Inc., https://doi.org/10.1201/9781482273380, 1981.
Kelly, F. J., Fuller, G. W., Walton, H. A., and Fussel, J. C.: Monitoring air pollution: Use of early warning systems for public health, Respirology, 17, 7–19, https://doi.org/10.1111/j.1440-1843.2011.02065.x , 2012.
Lindgren, E. S.: Energy Dispersive X-Ray Fluorescence Analysis, in: Encyclopedia of Analytical Chemistry, edited by: Meyers, R. A. and Grieken, R. E., John Wiley & Sons, https://doi.org/10.1002/9780470027318.a6806, 2006.
Lucarelli, F.: How a small accelerator can be useful for interdisciplinary applications: the study of air pollution, Eur. Phys. J. Plus, 135, 538, https://doi.org/10.1140/epjp/s13360-020-00516-3, 2020.
Lucarelli, F., Nava, S., Calzolai, G., Chiari, M., Udisti, R., and Marino, F.: Is PIXE still a useful technique for the analysis of atmospheric aerosols? The LABEC experience, X-Ray Spectrom., 40, 162–167, https://doi.org/10.1002/xrs.1312, 2011.
Malaguti, A., Mircea, M., La Torretta, T. M. G., Telloli, C., Petralia, E., Stracquadanio, M., and Berico, M.: Comparison of online and offline methods for measuring fine secondary inorganic ions and carbonaceous aerosols in the central mediterranean area, Aerosol Air Qual. Res., 15, 2641–2653, https://doi.org/10.4209/aaqr.2015.04.0240, 2015.
Mooibroek, D., Sofowote, U. M., and Hopke, P. K.: Source apportionment of ambient PM10 collected at three sites in an urban-industrial area with multi-time resolution factor analyses, Sci. Total Environ., 850, 157981, https://doi.org/10.1016/j.scitotenv.2022.157981, 2022.
Niu, J., Rasmussen, P. E., Wheeler, A., Williams, R., and Chénier, M.: Evaluation of airborne particulate matter and metals data in personal, indoor and outdoor environments using ED-XRF and ICP-MS and co-located duplicate samples, Atmos. Environ., 44, 235–245, https://doi.org/10.1016/j.atmosenv.2009.10.009, 2010.
Ogrizek, M., Kroflič, A., and Šala, M.: Critical review on the development of analytical techniques for the elemental analysis of airborne particulate matter, Trends Environ. Anal. Chem., 33, e00155, https://doi.org/10.1016/j.teac.2022.e00155, 2022.
Park, S. S., Cho, S. Y., Jo, M. R., Gong, B. J., Park, J. S., and Lee, S. J.: Field evaluation of a near-real time elemental monitor and identification of element sources observed at an air monitoring supersite in Korea, Atmos. Pollut. Res., 5, 119–128, https://doi.org/10.5094/APR.2014.015, 2014.
Rohr, A. C. and Wyzga, R. E.: Attributing health effects to individual particulate matter constituents, Atmos. Environ., 62, 130–152, https://doi.org/10.1016/j.atmosenv.2012.07.036, 2012.
Trebs, I., Lett, C., Krein, A., Matsumoto Kawaguchi, E., and Junk, J.: Performance evaluation of an online monitor based on X-ray fluorescence for detecting elemental concentrations in ambient particulate matter, Atmos. Meas. Tech., 17, 6791–6805, https://doi.org/10.5194/amt-17-6791-2024, 2024.
Tremper, A. H., Font, A., Priestman, M., Hamad, S. H., Chung, T.-C., Pribadi, A., Brown, R. J. C., Goddard, S. L., Grassineau, N., Petterson, K., Kelly, F. J., and Green, D. C.: Field and laboratory evaluation of a high time resolution x-ray fluorescence instrument for determining the elemental composition of ambient aerosols, Atmos. Meas. Tech., 11, 3541–3557, https://doi.org/10.5194/amt-11-3541-2018, 2018.
U.S. EPA: Determination of metals in ambient particulate matter using X-Ray Fluorescence (XRF) Spectroscopy, edited by: US-EPA (US Environmental Protection Agency), Cincinnati, OH 45268, USA, 1999.
U.S. EPA: Environmental Technology Verification Report – Cooper Environmental Services LLC Xact 625 Particulate Metals Monitor, EPA/600/R-12/680, National Service Center for Environmental Publications (NSCEP), https://archive.epa.gov/nrmrl/archive-etv/web/pdf/p100fk6b.pdf, last access: September 2012.
Van Grieken, R. E. and Markowicz, A. A. (Eds.): Handbook of X-Ray spectrometry: methods and techniques, Marcel Dekker Inc., ISBN 0-8247-8483-9, 1993.
Vecchi, R. and Daellenbach, K. R.: Intercomparison of online and offline XRF spectrometers for determining the PM10 elemental composition of ambient aerosol, Zenodo [data set], https://doi.org/10.5281/zenodo.17465290, 2025.
Vecchi, R., Marcazzan, G., and Valli, G.: A study on nighttime–daytime PM10 concentration and elemental composition in relation to atmospheric dispersion in the urban area of Milan (Italy), Atmos. Environ., 41, 2136–2144, https://doi.org/10.1016/j.atmosenv.2006.10.069, 2007.
Vecchi, R., Bernardoni, V., Fermo, P., Lucarelli, F., Mazzei, F., Nava, S., Prati, P., Piazzalunga, A., and Valli, G.: 4-hours resolution data to study PM10 in a “hot spot” area in Europe, Environ. Monit. Assess., 154, 283–300, https://doi.org/10.1007/s10661-008-0396-1, 2009.
Vecchi, R., Piziali, F. A., Valli, G., Favaron, M., and Bernardoni, V.: Radon-based estimates of equivalent mixing layer heights: A long-term assessment, Atmos. Environ., 197, 150–158, https://doi.org/10.1016/j.atmosenv.2018.10.020, 2019.
Visser, S., Slowik, J. G., Furger, M., Zotter, P., Bukowiecki, N., Canonaco, F., Flechsig, U., Appel, K., Green, D. C., Tremper, A. H., Young, D. E., Williams, P. I., Allan, J. D., Coe, H., Williams, L. R., Mohr, C., Xu, L., Ng, N. L., Nemitz, E., Barlow, J. F., Halios, C. H., Fleming, Z. L., Baltensperger, U., and Prévôt, A. S. H.: Advanced source apportionment of size-resolved trace elements at multiple sites in London during winter, Atmos. Chem. Phys., 15, 11291–11309, https://doi.org/10.5194/acp-15-11291-2015, 2015.
WHO: Review of evidence on health aspects of air pollution – REVIHAAP Project, technical report, WHO, Copenhagen, 2013.