the Creative Commons Attribution 4.0 License.
the Creative Commons Attribution 4.0 License.
 | 19 Nov 2025
First insights into deep convection by the Doppler velocity measurements of the EarthCARE Cloud Profiling Radar
Aida Galfione
Alessandro Battaglia
Bernat Puigdomènech Treserras
Pavlos Kollias
Convective updrafts and downdrafts play a vital role in Earth’s energy and water cycles by modulating vertical energy and moisture transport and shaping precipitation patterns. Despite their importance, the characteristics of convective motions and their relationship to the near-storm environment remain poorly constrained by observations.
Doppler radars, in principle, are able to measure the vertical air motion within clouds, thus providing critical insight into convective dynamics and enabling estimates of convective mass flux. The payload of the recently launched EarthCARE satellite mission includes a 94 GHz Cloud Profiling Radar (CPR) with Doppler capability. In this study, we present first-light CPR Doppler velocity observations in deep convective clouds. These early examples offer a first glimpse into the dynamic nature of cloud systems. The narrow footprint of the CPR helps reduce the impact of multiple scattering and non-uniform beam filling (NUBF) on the Doppler velocity measurements. However, the instrument’s low Nyquist velocity presents a significant challenge for recovering the true Doppler velocity profiles in deep convective systems.
The CPR Doppler velocity observations are expected to challenge traditional methodologies for identifying deep convective cores, which typically rely on reflectivity-based thresholds. We showcase examples that demonstrate the synergy between CPR Doppler velocity measurements and geostationary satellite observations, illustrating how their combined use can help capture the evolution of the convective lifecycle.
These results align with EarthCARE’s broader mission objectives and highlight the potential of spaceborne Doppler radars to significantly advance our understanding of cloud dynamics and convection in the climate system.
- Article
(3463 KB) - Full-text XML
- BibTeX
- EndNote


Deep convective clouds are responsible for the vertical transport of air and water, one of the most influential atmospheric processes that is yet poorly constrained by measurements. Deep convection is crucial in balancing the Earth's heat budget and influencing large-scale weather patterns, including cloud formation and the development of storms and extreme weather (Hartmann et al., 1984). Deep convective events typically occur in tropical regions, but they affect the global atmospheric circulation beyond the tropics via anvil detrainment processes and latent heat release via precipitation (Hartmann et al., 2018; Gasparini et al., 2021). A number of microphysical processes are active during convective initiation and development that are not yet well understood or properly implemented in models (Prein et al., 2015; Arakawa, 2004; Bony et al., 2015).
Despite the importance of deep convection, several aspects of deep convective clouds remain challenging to represent in high-resolution models (Fridlind et al., 2017; Ladino et al., 2017). Models also struggle to accurately represent convective updrafts, leaving significant observational gaps (Varble et al., 2014). Surface and airborne radar observations have provided valuable insight into the structure and magnitude of convective updrafts, but the observational record is very sparse and mostly available over land (Giangrande et al., 2013; Yang et al., 2016; North et al., 2017; Oue et al., 2019; Wang et al., 2020; Jeyaratnam et al., 2021). On the other hand, satellite observations can provide global coverage and sufficient sampling of deep convection and associated clouds and precipitation (Lee et al., 2021). In particular, the 3-D structure of deep convective clouds has been extensively studied using observations from spaceborne radars.
The Tropical Rainfall Measuring Mission (TRMM), developed by the National Aeronautics and Space Administration (NASA) and the National Space Development Agency of Japan (NASDA), introduced the first spaceborne radar, a 13.8 GHz Precipitation Radar (PR) (Kummerow et al., 1998; Kummerow et al., 2000). The TRMM PR was operational from 1997 to 2015 and advanced our understanding of tropical convection and associated rainfall (Xu and Zipser, 2012; Yokoyama et al., 2014). Studies using the TRMM PR data analyzed the structure of convective systems, including diurnal cycles and vertical profiles (Hamada et al., 2015). TRMM’s success led to the Global Precipitation Measurement (GPM) mission launched in 2014 by NASA and the Japan Aerospace Exploration Agency (JAXA) which enhances TRMM’s capabilities with improved resolution and higher latitude coverage (Skofronick-Jackson et al., 2017). The GPM mission features a Dual-frequency Precipitation Radar (DPR) that operates at Ka (35.5 GHz) and Ku (13.6 GHz) bands, providing multi-frequency measurements of 3D precipitation structures (Skofronick-Jackson et al., 2018). Studies using GPM DPR data show deep convection reaching the tropopause predominantly over land, consistent with TRMM findings (Liu and Liu, 2016; Liu et al., 2020; Battaglia et al., 2020). Ni et al., 2019 analyzed ice microphysical properties, revealing larger ice particles and higher ice water content in land-based deep convective cores. The limited sensitivity of the PR and DPR limited their ability to capture the 3D structure of the upper-level tropospheric cloud structures. The CloudSat-CALIPSO mission (Stephens et al., 2002), part of NASA’s A-Train since 2004, provided detailed cloud vertical structures. Its Cloud Profiling Radar (CPR) with 240 m vertical resolution captured convective cloud features, aiding studies on convective cores and updrafts (Takahashi et al., 2017). Findings indicate stronger convective cores and lower entrainment rates over land, enabling higher-altitude particle transport. Because CloudSat was a nadir-looking radar, not scanning across its track, it was limited in its ability to capture 3-dimensional spatial heterogeneity of deep convective cores (DCCs). To mitigate biases, CloudSat data have been integrated with passive sensors, such as MODIS cloud top temperature, for improved convective characterization (Luo et al., 2008; Luo et al., 2010; Luo et al., 2014; Yang et al., 2023).
Launched in 2018 as a NASA mission, RainCube demonstrated the feasibility of operating a scientific Ka-band radar from a CubeSat platform, with the radar instrument developed at NASA’s Jet Propulsion Laboratory (JPL) (Peral et al., 2018). Its innovative deployable antenna enabled compact integration and lower launch costs, paving the way for constellations of radar-equipped satellites, as the INCUS train formation. Finally, in May 2024, the Earth, Cloud, Aerosol and Radiation Explorer (EarthCARE, Illingworth et al., 2015), a joint European Space Agency (ESA) and JAXA mission, was successfully launched. The EarthCARE (EC) mission aims to improve cloud-aerosol-radiation interaction studies and enhance numerical weather prediction (NWP) models and climate simulations. EarthCARE carries a 94 GHz Doppler Cloud Profiling Radar (EC-CPR), a High-Spectral Resolution Lidar (ATLID), a Multi-Spectral Imager (MSI), and a Broad-Band Radiometer (BBR). Launched after CloudSat-CALIPSO ended operations in 2023, EarthCARE benefits from an improved radar sensitivity owing to its lower orbit and from having all instruments on the same platform (Illingworth et al., 2015; Wehr et al., 2023). Most importantly, the EarthCARE mission features the first spaceborne radar with Doppler capability (Amayenc et al., 1993; Kobayashi et al., 2002; Meneghini et al., 2003; Kollias et al., 2014, 2018, 2022). The availability of Doppler measurements from space offers a unique opportunity for the collection of a global dataset of vertical motions in clouds and precipitation. This global data set is expected to improve our understanding of convective motions in clouds and help evaluate current parameterizations of convective mass flux in cloud resolution models (Manabe and Strickler, 1964; Tiedtke, 1989; Bechtold et al., 2001).
Here, a first assessment of the performance of the EC-CPR Doppler velocity measurements in deep convection is presented. The main objectives of this study are to describe and interpret convective cores as observed by the EC-CPR, leveraging joint Doppler velocity and reflectivity measurements, and to compare these observations with geostationary data. For the first time, Doppler velocities from a spaceborne radar are used to identify and characterize convective cores, providing insights into their internal dynamics and updraft structures (Kollias et al., 2023). Coincident MSI observations are compared with geostationary Meteosat Second Generation (MSG) imagery to assess the capability of passive sensors to detect convection and track its evolution.
One of the new capabilities of the EarthCARE mission is the CPR Doppler velocity measurements. Several factors are expected to impact the quality of the CPR Doppler velocity measurements (Tanelli et al., 2002; Tanelli et al., 2005; Schutgens, 2008a; Schutgens, 2008b; Kollias et al., 2014; Kollias et al., 2018; Hagihara et al., 2022; Kollias et al., 2022). The EarthCARE satellite speed of 7.6 km s−1 introduces significant broadening (decorrelation) of the CPR phase measurements that causes significant uncertainty in the Doppler velocity estimates (Kollias et al., 2014; Kollias et al., 2022). Antenna mispointing is another source of uncertainty (Tanelli et al., 2005; Battaglia and Kollias, 2014; Puigdomènech Treserras et al., 2025). In deep convection, additional factors such as attenuation, multiple scattering (Battaglia et al., 2008; Battaglia et al., 2010; Battaglia and Tanelli, 2011), non-uniform beam filling (Tanelli et al., 2002; Kollias et al., 2022), and aliasing (Sy et al., 2014) can have a significant impact on the observed Doppler velocities and introduce considerable uncertainty and biases.
2.1 Convection embedded in stratiform event
An example of CPR observations of a deep convective system is shown in Fig. 1. The CPR observations were collected on 19 September 2024, over Western Africa on a descending (daytime) orbit. Here, CPR Level 2a (L2a) C-PRO data products are used (Kollias et al., 2023). These products are derived from the CPR Level 1b data plus auxiliary meteorological data. The L2a C-PRO data product was released to the research community in March 2025 (Eisinger et al., 2023). The CPR reflectivity factor (Fig. 1a) illustrates the vertical structure of a wide deep precipitating system. The reflectivity plot in Fig. 1a has 1 km resolution in the along-track dimension, 100 m resolution in the vertical dimension. CloudSat-based studies of deep convection mainly use the reflectivity profile features near cloud top to identify deep convective cores (DCC, Takahashi and Luo, 2012; Luo et al., 2014; Takahashi et al., 2017; Stephens et al., 2024). The underlying reasoning is that the overshooting of radar reflectivity is an indicator of the larger-size particles pushed higher up; this is only possible with the presence of strong rising updrafts. Three criteria are commonly adopted for convection identification (Takahashi and Luo, 2014):
-
CPR cloud mask (2B-GEOPROF product) greater than 20;
-
A continuous radar echo from below 2 to above 10 km, thus a thick cloud deck;
-
The 10 dBZ echo top height which is indicative of the level where large size particles are lofted by strong convection above 10 km (Luo et al., 2008).
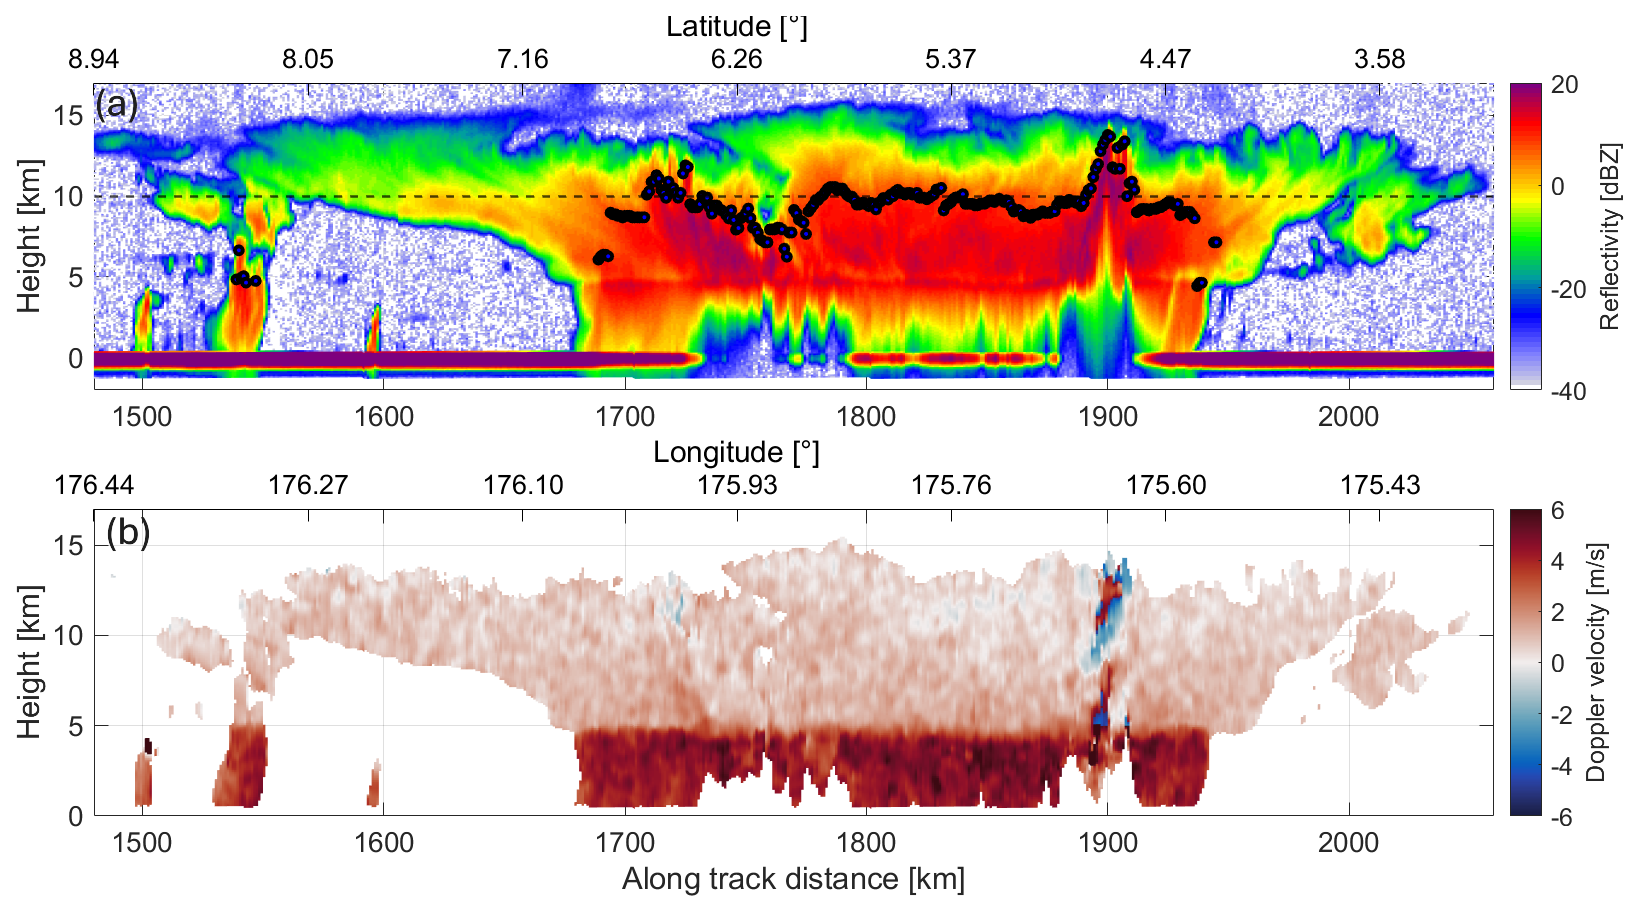
Figure 1(a) CPR reflectivity during a large-scale, deep precipitating system with embedded convection observed on 19 September 2024 over the Tropical Western Pacific (Frame 1760E). The horizontal line indicates the 10 km height, and the blue circles indicate the maximum height where a dBZ value above 10 dBZ is observed. (b) The CPR Doppler velocity measurements after a 4 km along-track integration (Kollias et al., 2023). Positive Doppler velocities indicate hydrometors' movement towards the ground.
In Fig. 1a, the 10 dBZ echo top height is very close to the 10 km height for a significant part of the deep precipitating system. In two areas (1710–1730 and 1890–1910 km along track), the 10 dBZ echo top height is well above the 10 km height and closer to the cloud top height. Luo et al., 2014 introduced a fourth criterion for detecting DCCs, which requires that the 10 dBZ echo top height be within 2 km of the cloud top height determined by the CPR.
The CPR Doppler velocity measurements for the same event can help us evaluate these different methodologies for identifying DCCs. Figure 1b shows the CPR Doppler velocity averaged over a 4 km along-track distance. The CPR Doppler velocity measurements are shown only in areas where the CPR reflectivity exceeds -15 dBZ. The native CPR along track resolution is 500 m, thus, a total of nine CPR Doppler velocity estimates (their respective real and imaginary parts of the lag-1 pulse pair estimator) have been averaged (Kollias et al., 2023). The averaging operation has to be performed in the lag-1 space, in order to avoid the cancellation due to opposite sign in the velocity space, that would lead to a wrong estimation of the Doppler velocity. Averaging over a larger number of pulses reduces aliasing but does not eliminate it, meaning that the Doppler velocity estimates remain susceptible to aliasing errors. Conversely, using a 4 km integration length constrains the ability to resolve the variability within convective cores, which typically occurs at sub-kilometer scales. Before the along track averaging, the CPR Doppler velocities have been corrected for antenna mispointing (Puigdomènech Treserras et al., 2025) and non-uniform beam filling (NUBF) Doppler velocity biases (Kollias et al., 2014; Sy et al., 2014).
The nadir-pointing CPR Doppler velocity VD represents the sum of the vertical air motion WAIR and the reflectivity-weighted Doppler sedimentation velocity of the hydrometeors :
The term can only take positive values (downward motion) while the term WAIR can take both positive (downdraft) and negative (updraft) values. The majority of the observed VD in Fig. 1b are positive. This implies that the magnitude of is higher than that of the embedded WAIR updrafts. This suggests the presence of negligible vertical air motions ( 2 m s−1). Because Doppler velocities are reflectivity-weighted, and non-Rayleigh scattering effects tend to reduce the reflectivity of large particles, the maximum reflectivity-weighted terminal velocity at W-band does not exceed 6.5 m s−1. A typical example profile of the CPR Doppler velocity and corresponding radar reflectivity in stratiform precipitation conditions is shown in Fig. 2. In this example, the Nyquist velocity is 5.09 m s−1 and the PRF is 6.38 kHz. The most pronounced VD feature is its melting layer signature just below 5 km height that indicates the phase change from the slowly falling solid ice/snow particles to the fast falling liquid raindrops around the 0 °C isotherm (Fig. 2a). The 1 km CPR-averaged Doppler velocity profiles exhibit the same trend but with considerable fluctuations (Kollias et al., 2014). The noisiness of the CPR 1 km averaged Doppler velocities makes the estimation of the hydrometeors' size and/or density challenging (Kollias et al., 2022; Mroz et al., 2023). The melting layer signature is also evident in the CPR reflectivity profile with a pronounced increase around the 0 °C isotherm (Fig. 2b). The ice-to-rain Doppler velocity transition is a well-known feature of the Doppler velocity in cold-rain systems, routinely observed by ground-based and airborne Doppler radars (Fabry and Zawadzki, 1995; Heymsfield et al., 2010), but for the first time with EC it is possible to see it from space.
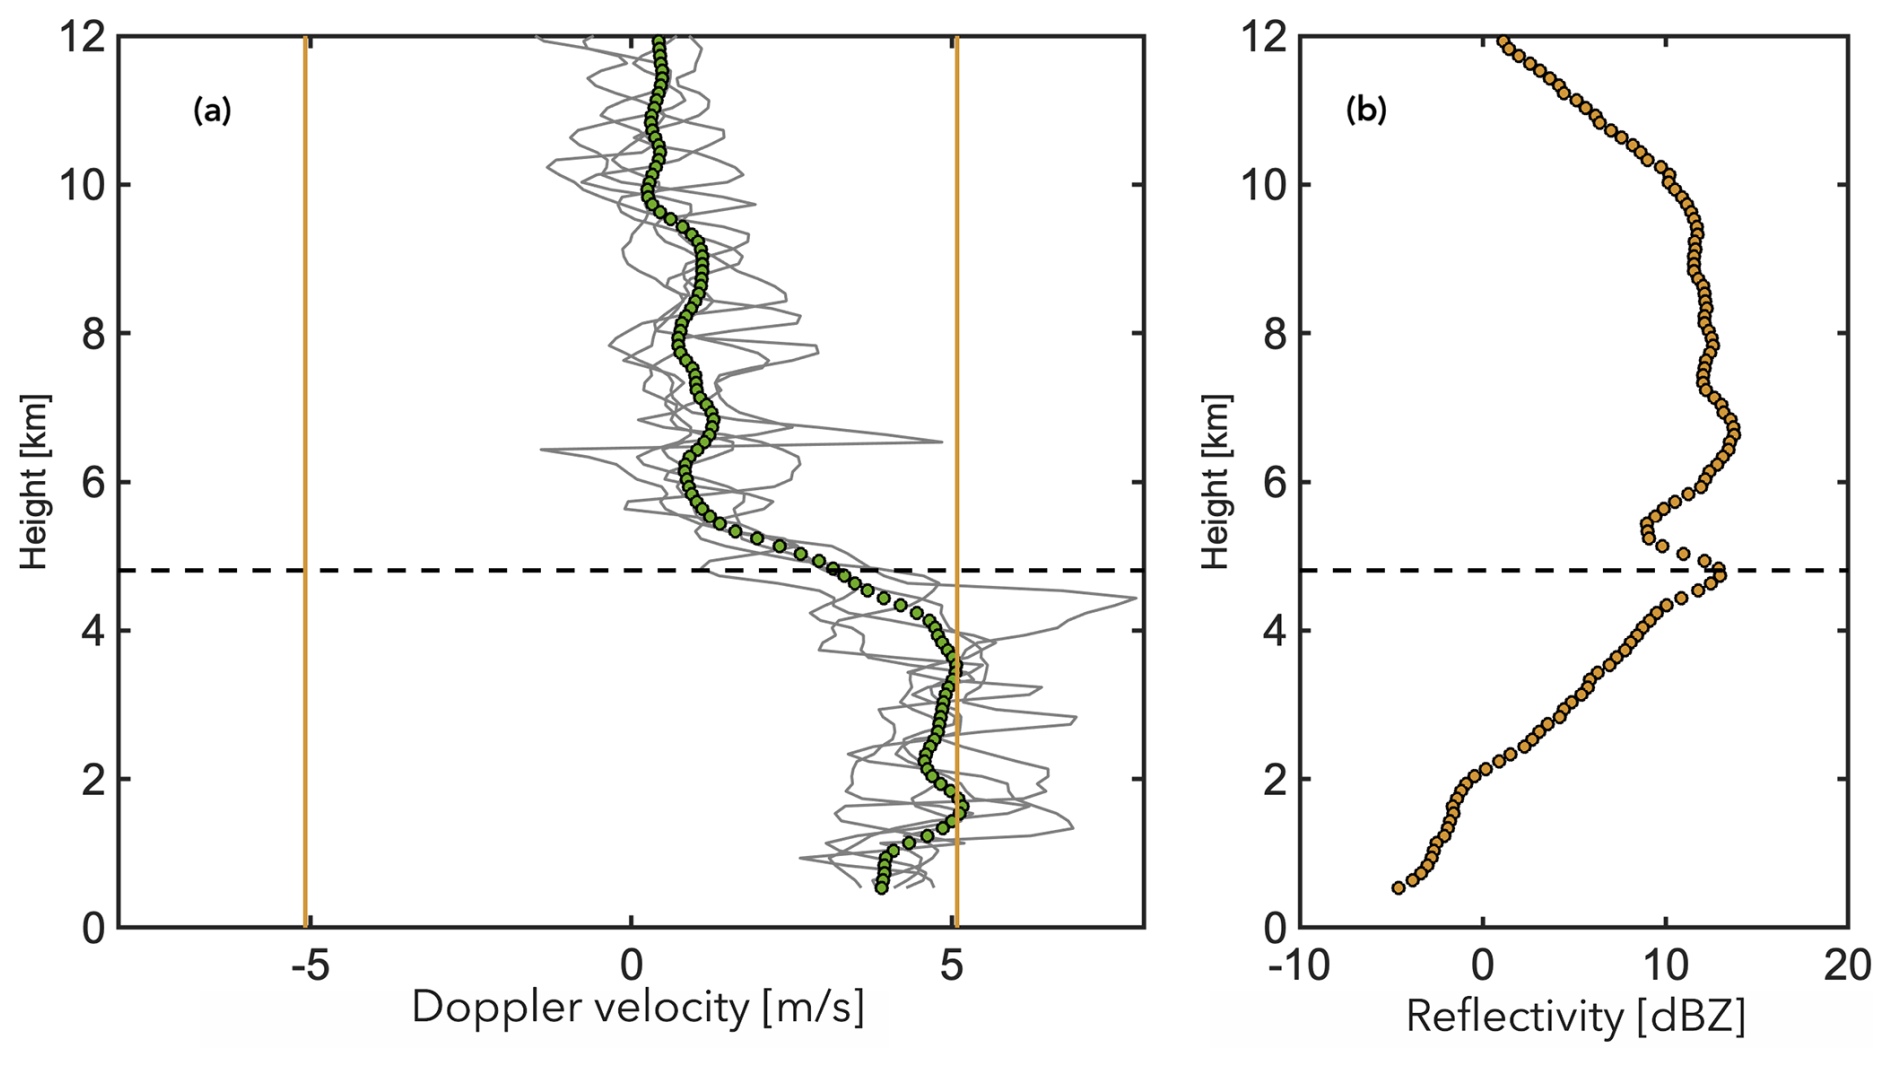
Figure 2(a) The CPR Doppler velocity profiles at along track distance of 1840 km. The 4 km CPR Doppler velocity estimate is shown as green circles and the 1 km Doppler velocity estimates within a 2 km distance from 1840 km are shown as gray lines. The yellow vertical lines indicate the CPR Nyquist velocity and the horizontal dashed line indicates the melting layer height. (b) The corresponding CPR reflectivity at along track distance of 1840 km.
The Nyquist velocity (, yellow lines in Fig. 2a) is the maximum unambiguous velocity that can be detected by the CPR without aliasing. During stratiform conditions, in the ice layer, velocity folding is rare even for the 1 km CPR Doppler velocity estimates (Fig. 2a). Below the melting layer, velocity folding occurs especially in the 1 km CPR Doppler velocity estimates, which are noisier. In Fig. 2a the 1 km Doppler velocity estimates outside the VN boundaries have been corrected for velocity folding. The assumption used for the unfolding is that negative Doppler velocities below the melting layer in a stratiform precipitation profile are the results of VD exceeding +VN. Subsequently, all negative VD values below the 0°C isotherm are unfolded by adding 2 VN to them.
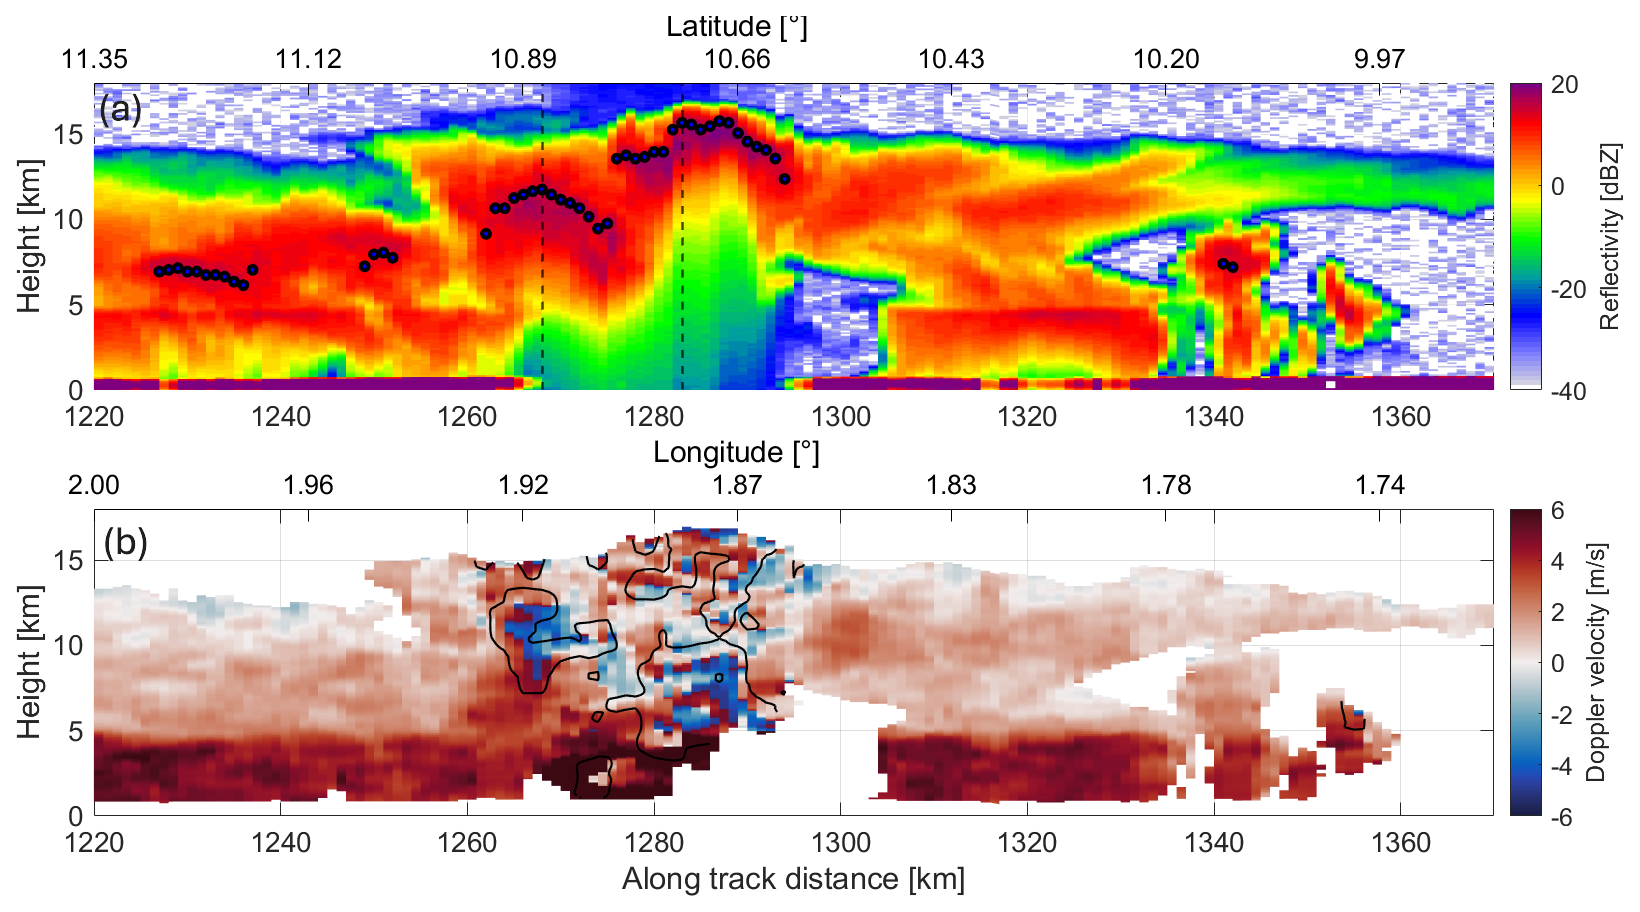
Figure 3(a) CPR reflectivity during a deep convective event on 18 September 2024 over Western Africa (Frame 1752E). The blue circles indicate the height where multiple scattering effects become important. The vertical dashed lines indicate the locations where CPR profiles will be shown in later figures. (b) The CPR Doppler velocity measurements after a 4 km along-track integration (Kollias et al., 2023). Positive Doppler velocities indicate hydrometors' movement towards the ground. The black contour indicates the area where the 4 km CPR Doppler velocity standard deviation exceeds 2 m s−1. A box of 3 km along-track by 2 km in range is used for the estimation of the standard deviation.
The interpretation of the CPR Doppler velocity profile in deep stratiform layers serves as a baseline for understanding convective updrafts. In Fig. 1b, updrafts are depicted as regions with negative (upward) 4-km-averaged VD estimates in cold temperatures (Fig. 1b). The clusters of negative VD are generally located near the cloud top, with the exception of the cluster located at along-track distances between 1890 and 1910 km. Since ice particles are smaller at colder temperatures, it is plausible that near cold cloud tops, weak gravity waves and updrafts contribute to an overall negative (upward) CPR Doppler velocity signal. Interestingly, two regions around 1720 and 1900 km with 10 dBZ echo top height well above the 10 km altitude exhibit such dynamical features. At 1890–1910 km along-track, a deep and coherent dynamical structure is observed, characterized by strong upward motions extending from 8 to 14 km. This vertically oriented feature represents a deep convective updraft and is collocated with the highest 10 dBZ echo top heights. The WAIR within this convective updraft is strong enough to cause velocity folding, depicted as a red patch of Doppler velocities embedded within the negative Doppler velocity cluster.
2.2 Deep convective scene
The complexity of the VD profiles in deep convection is examined using a sample deep convective cloud (DCC) observed by the CPR (Fig. 3). The DCC is located between 1265 and 1300 km along track and is characterized by overshooting cloud tops reaching up to 17 km in altitude. Strong attenuation is observed (Fig. 3a), and the smooth appearance of radar reflectivity echoes extending to and below the surface indicates the presence of moderate multiple scattering effects (Battaglia et al., 2010). Regions contaminated by multiple scattering are currently identified in the C-FMR product (Kollias et al., 2023) using a simple flagging approach based on the methodology proposed by Battaglia et al., 2011. The blue-filled circles indicate the height at which multiple scattering effects on radar reflectivity are expected to become significant. To correctly interpret Doppler velocities in deep convection, it is essential to assess the influence of multiple scattering on the Doppler signal (Battaglia and Tanelli, 2011). Doppler velocity measurements within regions affected by multiple scattering cannot be considered reliable. Although a marked reduction in the correlation between successive pulses – and consequently an increase in Doppler velocity noise – is expected in these regions, such behavior is not always observed. This inconsistency warrants further investigation in future studies. Adopting a conservative approach, Doppler velocity values within these portions of convective cell profiles should therefore be treated with caution or excluded from quantitative analysis. However, since this issue is beyond the scope of the present study, our interpretation is limited to the portion of the VD profiles above the height at which multiple scattering effects are expected to become significant.
Figure 3b shows that the VD profiles vary substantially with regions of both positive and negative values. In this frame the Nyquist velocity is 5.08 m s−1 and the PRF is 6.38 kHz The range of VD values spans the full Nyquist interval [−VN: +VN]. The convective VD profiles are characterized by frequent Doppler velocity aliasing. Figure 3b presents the 4 km averaged VD. Velocity aliasing is even more pronounced at the 1 km averaged VD. The observed variability of VD serves as a strong indicator of the presence of convective updrafts and downdrafts. In Fig. 3b, the black outline highlights regions where the standard deviation of Doppler velocity exceeds 2 m s−1. The standard deviation is calculated within a moving window of 3 km horizontally and 2 km vertically, centered on each pixel, to capture Doppler velocity variations in both the along-track and across-track Doppler velocity directions.
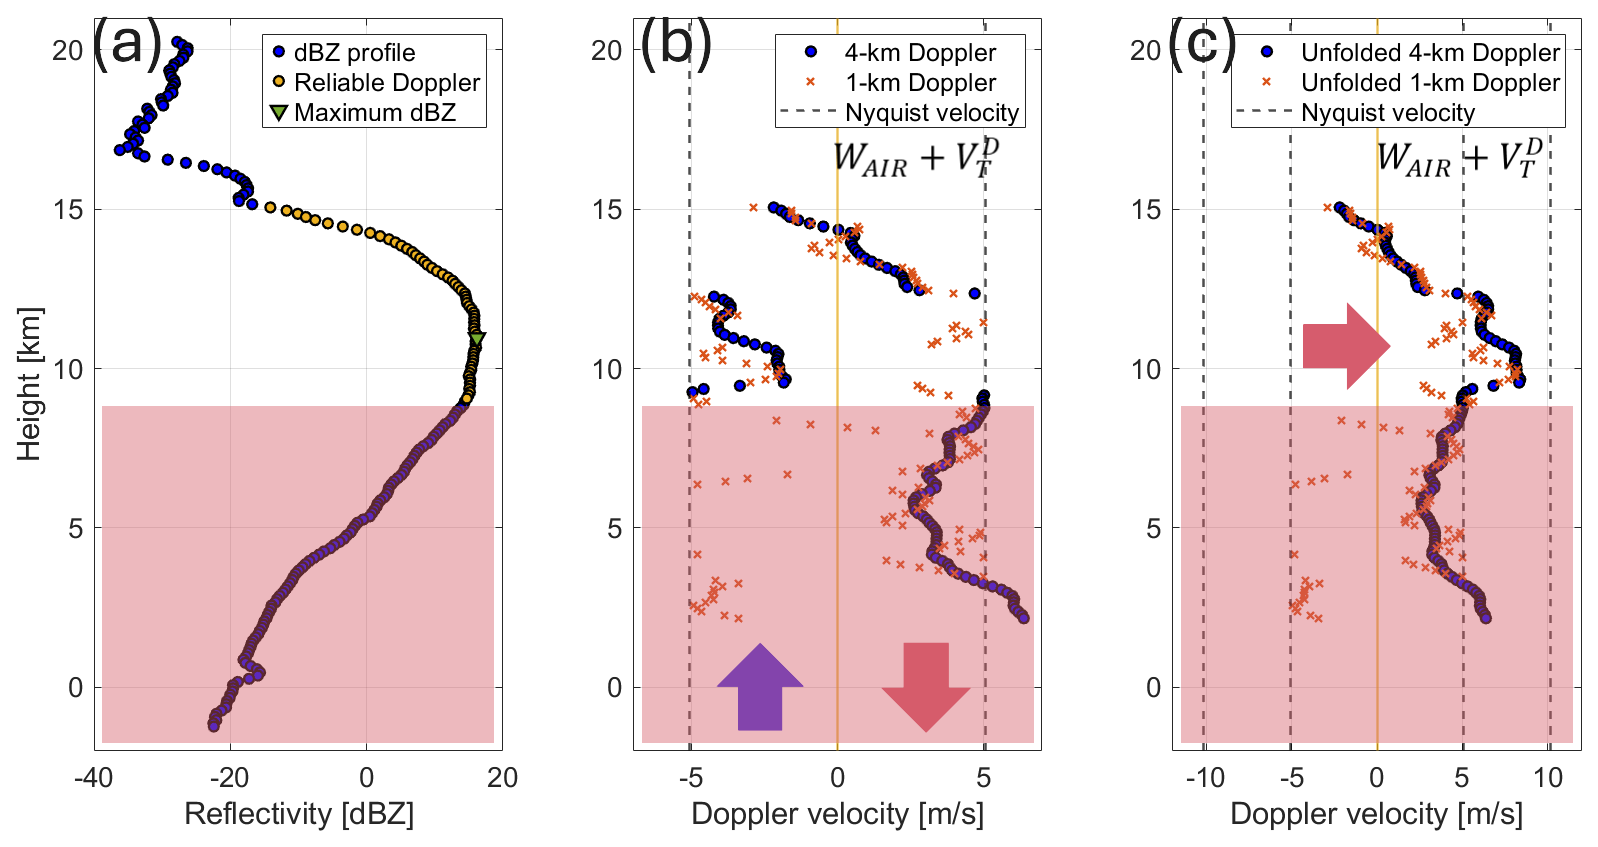
Figure 4(a) The CPR reflectivity profile at along-track distance of 1268 km. The yellow filled circles section of the CPR reflectivity profile indicate the CPR gates where the Doppler velocity estimates are considered unaffected by multiple scattering. The green triangle indicates the height of the maximum radar reflectivity. (b) The 4 km CPR Doppler velocity profile (blue filled circles) and the 1 km CPR Doppler velocity profile (orange crosses). The black dashed vertical lines indicate the CPR Nyquist Doppler velocity. (c) The unfolded 4 km CPR Doppler velocity profile (blue filled circles) and the unfolded 1 km CPR Doppler velocity profile (orange crosses). The black dashed vertical lines indicate the CPR Nyquist Doppler velocity. The red shading highlights the sections of the profile affected by multiple scattering.
Two example profiles corresponding to the along-track locations indicated by the black dashed lines in Fig. 3b are analyzed to explore the complexity of VD in deep convective cores. The first profile is shown in Fig. 4. The CPR reflectivity profile is presented in Fig. 4a. The yellow-filled circles mark the CPR range gates where Doppler velocity estimates are considered unaffected by multiple scattering. Additionally, VD estimates near the cloud top are excluded if the reflectivity falls below –15 dBZ. The maximum reflectivity is observed at an altitude of 11 km, more than 5 km below the cloud top. The corresponding VD profiles, averaged over 1 km and 4 km along-track intervals, are shown in Fig. 4b. The black dashed lines indicate the Nyquist bounds, while the vertical yellow line indicates zero Doppler velocity. As expected, the 4-km-averaged VD varies less with height compared to the 1 km VD estimates. This vertical correlation is expected, given that the CPR pulse length is 500 m and VD is estimated every 100 m.
Here, we focus on interpreting the VD estimates within the section identified as having reliable Doppler velocity observations. Beginning with the 4 km profile: near the cloud top, the value of VD is negative, indicating the presence of a weak updraft. Below 14 km, the value of VD turns positive, which may indicate the presence of large hydrometeors with high sedimentation velocity and/or a downdraft, resulting in an apparent downward motion. The abrupt jump of about 10 m s−1 in the profile at 12.5 km is attributed to velocity aliasing. In general, if the absolute value of the difference between two consecutive Doppler measurements exceeds the Nyquist velocity, then adding ±2 VN to one of the velocity produces a smoother profile. Due to the noisiness of the measurements, the identification of a fold is not straightforward and there will be some ambiguity for successive points in the profile with jumps in VD close to VN (e.g. at 4 km integration length, values within 1 m s−1 from VN are potential foldings). In this example, the difference is much larger, so folding is identified unambiguously and unfolding is straightforward. The entire segment of the profile between 9 and 12.5 km is therefore aliased; Fig. 4c shows the unfolded 1 and 4 km VD profiles. The aliased section of the 4 km profile has been corrected by adding 2 VN. The unfolded 4 km profile displays a smooth vertical structure. Except for a small region near the cloud top, the VD values remain positive, suggesting that in this upper part of the convective tower all hydrometeors are falling to the ground.
The second profile is shown in Fig. 5. The CPR reflectivity profile is presented in Fig. 5a. This profile is selected from the elevated cloud top region of the deep convective cloud to highlight the complexity of the Doppler velocity measurements, especially in convective regions where multiple scattering effects are significant. In this case, the maximum CPR reflectivity is detected higher in the profile, only 2.5 km below the cloud top. The corresponding VD profiles, averaged over 1 and 4 km along-track intervals, are shown in Fig. 5b. These VD profiles appear more complex due to the presence of significant multiple scattering effects. Figure 5c shows the unfolded 1 km and 4 km VD profiles. In this case, the section of the 4 km averaged VD from the cloud top to a height of 13.8 km is identified as aliased and corrected by subtracting 2 VN. The unfolded 4 km profile displays a smooth vertical structure. A strong updraft is present above 12 km, and its magnitude exceeds 10 m s−1 near the cloud top.
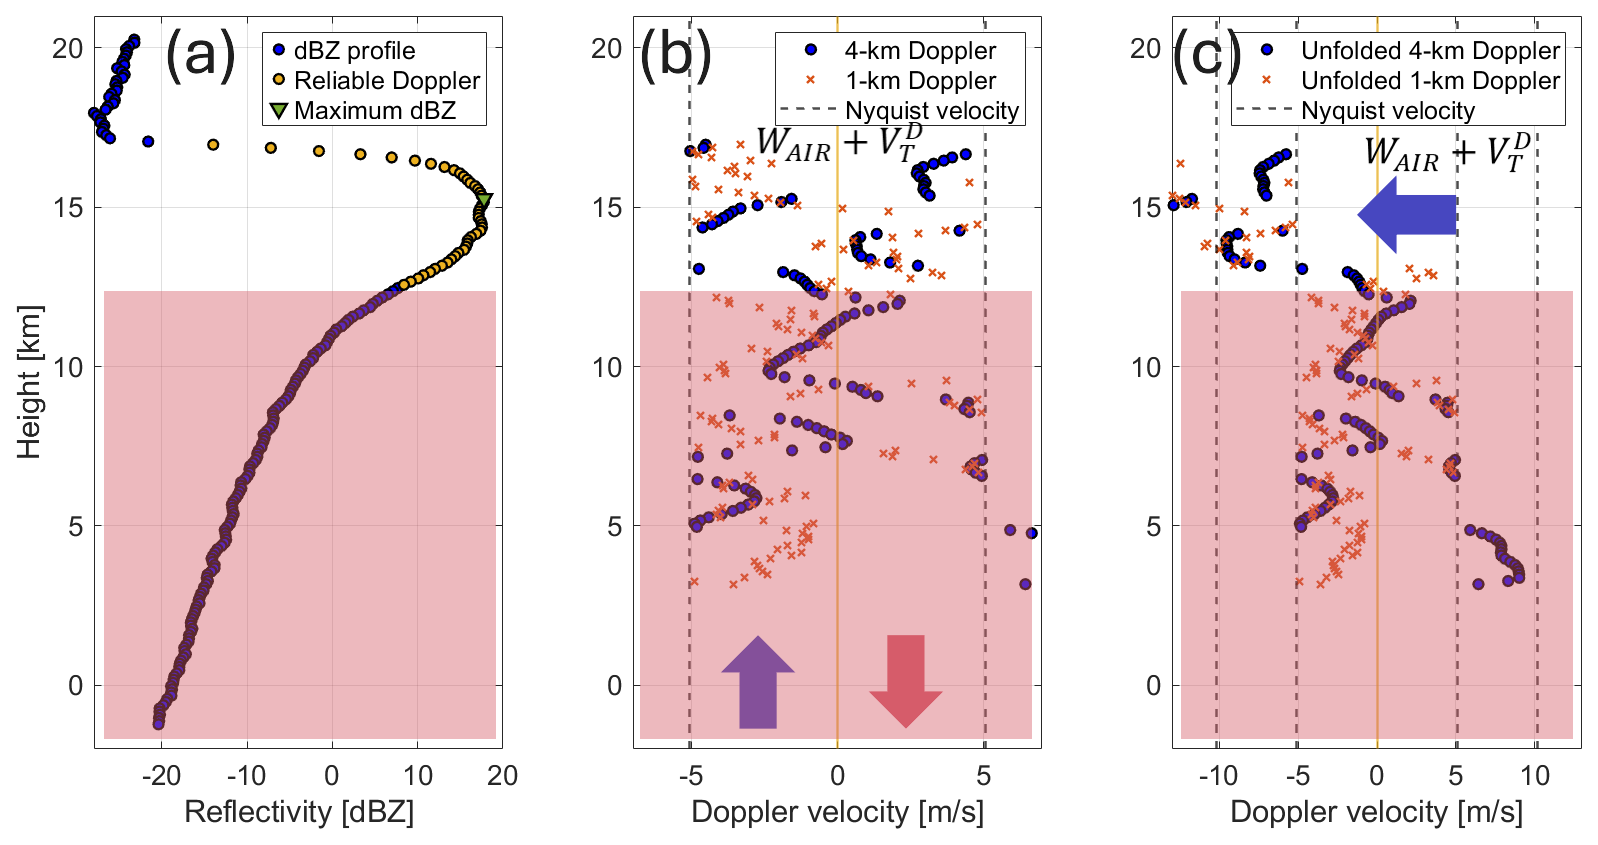
Figure 5(a) The CPR reflectivity profile at along track distance of 1283 km. The yellow filled circles section of the CPR reflectivity profile indicate the CPR range gates where the Doppler velocity estimates are considered unaffected by multiple scattering. The green triangle indicates the height of the maximum radar reflectivity. (b) The 4 km CPR Doppler velocity profile (blue filled circles) and the 1 km CPR Doppler velocity profile (orange crosses). The black dashed vertical lines indicate the CPR Nyquist Doppler velocity. (c) The unfolded 4 km CPR Doppler velocity profile (blue filled circles) and the unfolded 1 km CPR Doppler velocity profile (orange crosses). The black dashed vertical lines indicate the CPR Nyquist Doppler velocity. The red shading highlights the sections of the profile affected by multiple scattering.
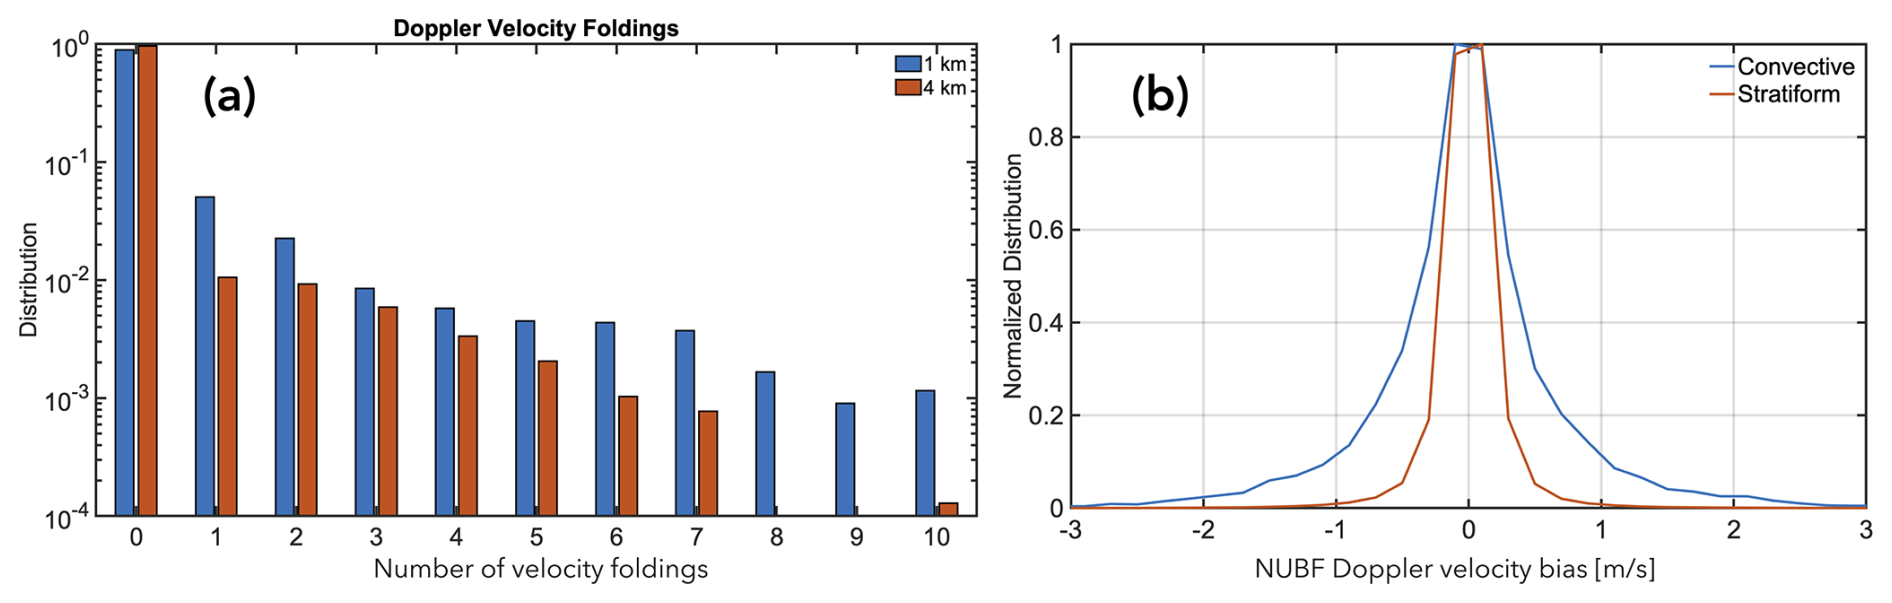
Figure 6(a) The normalized frequency of occurrence of CPR Doppler velocity folding, (b) The NUBF induced CPR Doppler velocity bias in m s−1 in convective and stratiform regions, derived by multiplying the along track reflectivity gradient by a correction coefficient (0.165 m s−1 (dB/km)−1) (Kollias et al., 2023).
2.3 Analysis of Doppler velocity aliasing
The analysis of the two convective VD profiles underscores the challenges associated with unfolding CPR Doppler velocity profiles in deep convection. The low Nyquist velocity of the EarthCARE CPR (VN<6 m s−1 even for the highest PRF) combined with the presence of strong updrafts and downdrafts frequently results in complex VD profiles. The normalized frequency of occurrence of CPR Doppler velocity folding is shown in Fig. 6a. In the ice portion of the deep precipitating layers, no velocity folding is observed in approximately 90 % and 97 % of VD of the 1 and 4 km averaged VD, respectively. Furthermore, NUBF conditions – expressed as the along-track gradient of CPR radar reflectivity – are more pronounced in deep convective cores. Based on comprehensive statistics from a large dataset (117 000 km of CPR observations) of deep precipitating layers, the standard deviation of the along-track gradient of CPR radar reflectivity is 5.25 and 1.67 dB km−1 in convective and in stratiform conditions, respectively. Figure 6b shows the distribution of the corresponding NUBF VD velocity biases in both convective and stratiform conditions. The standard deviations of the NUBF velocity bias distributions are 0.87 and 0.28 m s−1 for convective and stratiform conditions, respectively. A NUBF velocity bias correction algorithm is applied to the VD data to reduce these biases (Kollias et al., 2023). Previous simulation studies have demonstrated that, on average, the residual error is about 20 % of the observed NUBF-induced velocity bias (Kollias et al., 2023). For our case this translates into residual random errors of 0.174 m s−1 in convective conditions and 0.056 m s−1 in stratiform conditions. The Doppler velocity error is estimated by multiplying the reflectivity gradient by a correction factor. For EarthCARE, this factor is 0.165 m s−1 (dB/km)−1, resulting in a corresponding velocity bias. The residual random errors in convection are three times higher than those in stratiform conditions, yet they are practically negligible considering the expected magnitudes of the convective updrafts and downdrafts.
The analysis suggests that the primary cause of the frequent occurrence of velocity folding in deep convection is the presence of strong convective updrafts and downdrafts. The design of the EarthCARE CPR was finalized more than 20 years ago, at a time when incorporating multiple pulse repetition frequency (PRF) operating modes (Kollias et al., 2007) or polarization diversity techniques (Battaglia et al., 2013) was considered technologically risky. These techniques have since been recommended for future proposed missions, such as WIVERN (Illingworth et al., 2018; Battaglia et al., 2025). While there is considerable experience within the research community in applying radar Doppler velocity dealiasing techniques, most of these methods are designed for scenarios with slowly varying horizontal wind fields and focus on reconstructing spatial and temporal continuity in the velocity field (Eilts and Smith, 1990; Zhang and Wang, 2006; Feldmann et al., 2020; Louf et al., 2020). However, there is significantly less experience with Doppler velocity dealiasing in deep convective clouds, particularly under conditions characterized by narrow Nyquist velocity intervals (Maahn and Kollias, 2012). In such environments, vertical continuity cannot be assumed – convective updrafts and downdrafts often have limited vertical extent, and different portions of the hydrometeor column may be in distinct stages of their lifecycle, experiencing markedly different dynamical conditions. For example, the reflectivity profile in Fig. 5a exhibits a double-peak structure above 12 km, indicating a possible vertical discontinuity near the local CPR reflectivity minimum around 15 km. This discontinuity is also reflected in the Doppler velocity profile shown in Fig. 5b. A top-down dealiasing technique – based on the assumption that the upper boundary of the deep convective Doppler velocity profile is free from aliasing – was applied; however, the resulting dealiased profiles were found to be unphysical. As previously discussed, horizontal continuity cannot be assumed in deep convection, since updrafts and downdrafts typically have finite horizontal scales. In addition, multiple scattering and strong attenuation further limit the applicability of simplifying assumptions such as WAIR≈0 m s−1 below the melting layer. Consequently, Doppler velocity dealiasing in convective systems remains a significant challenge and will be addressed in future work. The primary difficulty arises from the lack of reliable boundary conditions, particularly within convective regions. While in stratiform precipitation it is generally reasonable to assume predominantly downward motion below the melting layer – allowing the unfolding to proceed upward from the top of the bright band – such assumptions do not hold in convective environments, where multiple scattering affects the reliability of measurements in the lower portions of the profiles. As a result, only the upper section of each profile can be considered sufficiently trustworthy, and the unfolding is therefore performed in a top-down manner by computing velocity differences between successive gates from the highest gate downward, using as a boundary condition the uppermost gate with a sufficiently high signal-to-noise ratio (SNR).
Geostationary satellites today provide a quasi-global coverage in a wide and common set of wavelengths, ranging from visible shortwaves to infrared (IR) (Fiolleau and Roca, 2024). Over the past decade, the capabilities of geostationary satellites have increased significantly in terms of spectral diversity and enhanced spatial and temporal resolution of observations. The synergistic use of these measurements with range resolved cloud and precipitation profiles offers a unique opportunity to the scientific and meteorological community. In particular, compared to CloudSat, EarthCARE offers finer horizontal resolution and is equipped with a Doppler radar. This enables, for the first time, global observations of in-cloud vertical velocities, thus deeper insights into convective storm lifecycle processes and the corresponding environmental responses.
An example highlighting the possible synergies between the CPR Doppler velocity observations and MSI and Geostationary observations is presented here. The convective event occurred on November 7th, 2024 over the southern Mediterranean and the Atlas Mountains in North Africa, during a descending (daytime) orbit (Fig. 7). Figure 7a shows the visible band (0.6 µm) radiance from the MSG satellite, with the EarthCARE satellite ground track overlaid in red. Figure 7b displays the MSI brightness temperatures in the clean infrared band (10.8 µm). Several convective cloud complexes are detected, and some deep convective clouds were sampled by the CPR. The analysis focuses on two of these cells – cell 1 and cell 2 – which are highlighted in Fig. 7.
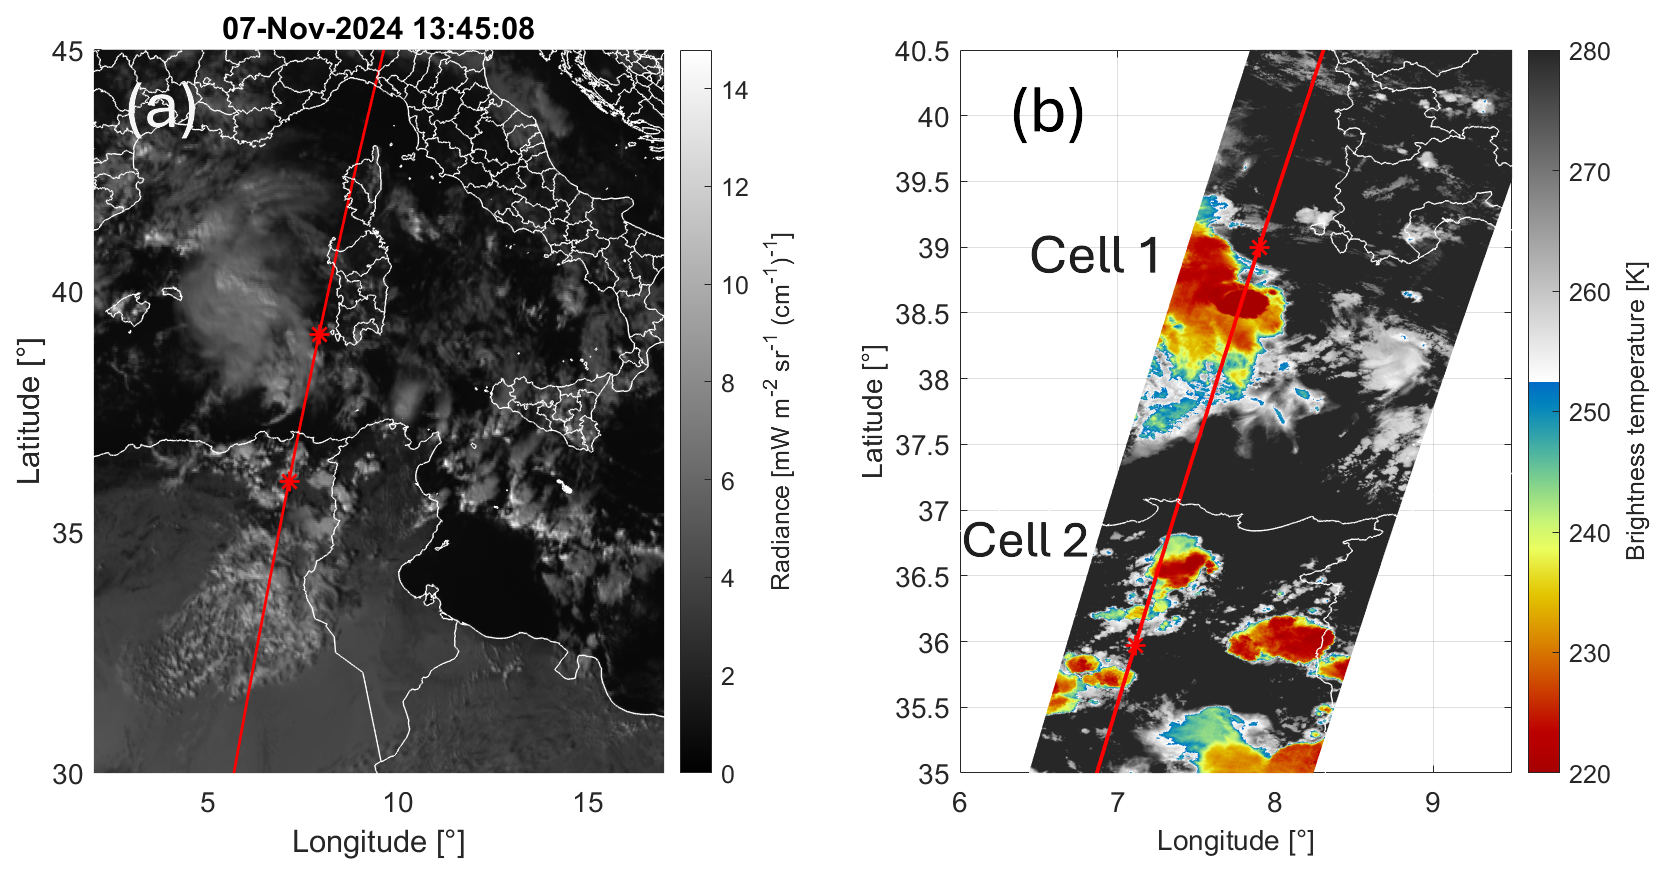
Figure 7(a) Radiance from channel 1 (0.6 µm) of MSG, on 7 November 2024 at 13:45 UTC. The EarthCARE ground track, corrected for parallax is shown as the red line. (b) The MSI IR channel data from the EarthCARE satellite. The overpass time is 13:43 UTC on 7 November 2024, frame 2530D. The red line is the satellite ground track. The segment between the two stars is plotted in Fig. 8.
Figure 8 illustrates the vertical cross-section of the CPR reflectivity and Doppler velocity along the satellite overpass, specifically for the segment between the two red stars in Fig. 7. The along track resolution is 1 km. Two distinct convective complexes are apparent in Fig. 8. Cell 1 spans a broad area, with an anvil extending over 120 km along the EarthCARE orbit. This well-developed anvil reaches an altitude of 10 km and is primarily detrained southward from the main convective core. Between 38.4 and 38.5° of latitude, a stratiform region is identified, characterized by a continuous reflectivity echo extending from the surface to cloud-top heights above 10 km. The melting layer is clearly marked by the presence of a bright band. North of this stratiform region, around 38.7° of latitude, a stronger convective core is observed, featuring a thick reflectivity column that exceeds 15 dBZ. This core reaches nearly 12 km in echo-top height, overshooting the anvil cloud top. Furthermore, the cluster of high-reflectivity profiles below approximately 8 km shows signs of strong attenuation, indicative of significant hydrometeor loading.
Cell 2, located around latitude of 36.5°, is part of a cluster of high-reflectivity cells, all characterized by strong attenuation below the freezing level located at approximately 4 km. The CPR captures several distinct convective cores within this region. Between 36.5 and 36.75° of latitude, high cloud-top echoes reaching 8–10 km, reflectivities exceeding 10 dBZ, and significant attenuation collectively indicate a well-developed convective system. Further south, between 36 and 36.3° latitude, the lower height of the reflectivity echo, combined with the presence of very high reflectivity between 4 and 6 km, suggests a convective cell still in an earlier stage of its lifecycle. In Fig. 8c, the orange line represents the number of Doppler velocity foldings per profile, while the blue line indicates the number of pixels per profile that exceed the stratiform range threshold ([−2 3] m s−1).
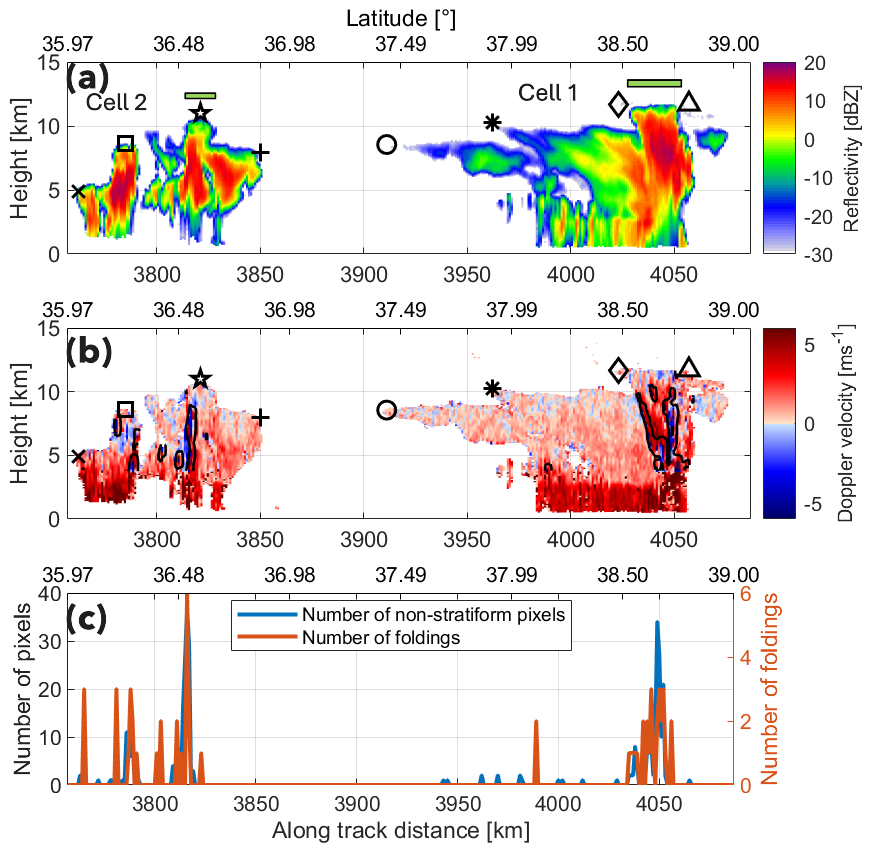
Figure 8EarthCARE overpass 2530D over South Mediterranean sea and Atlas mountains on 7 November 2024, at 13:43 UTC. (a) Reflectivity in dBZ, clutter removed. The green bars correspond to profiles labelled as convective from CloudSat methodology described in Takahashi and Luo, 2014. (b) Doppler velocity, corrected for antenna pointing and NUBF. Black contour is the standard deviation (calculated in a window 3 km horizontally and 1.1 km vertically) that exceeds 2 m s−1. (c) Number of foldings per profile and number of pixels per profile that exceed the stratiform interval [−2 3] m s−1.
Using the CloudSat methodology, a DCC would have been identified in Cell 1 between 38.5 and 38.7° of latitude (green bar on the right in Fig. 8a) whereas only the central tower in Cell 2, located around 36.5° of latitude, would be classified as deep convective (green bar on the left of Fig. 8a). The other convective cores do not meet the required criteria for cloud-top echo height and echo continuity.
To place the CPR convective cloud snapshots within the context of their lifecycle, observations from EUMETSAT’s MSG satellite are analyzed. Figures 9 and 10 display the corresponding MSG SEVIRI 1.5 rapid scan frames from channel 9 (10.8 µm) captured at 5 min intervals before and after the EarthCARE overpass for the two convective cells analyzed in this study. In these figures, the solid black line represents the EarthCARE ground track, corrected for parallax using cloud-top height derived from radar data, while the dashed line shows the original, uncorrected ground track position. The markers correspond to feature locations shown in Fig. 8a, with the black star indicating the position of the minimum brightness temperature tracked within the cell. Strong updrafts, including overshooting tops (Khlopenkov et al., 2021), are expected to be well captured by geostationary sensors. However, this assumption may not hold in cases where convection is embedded within a thick cloud deck or occurs beneath an extensive anvil cloud, where updrafts are obscured and not directly observable by spaceborne infrared and visible passive instruments.
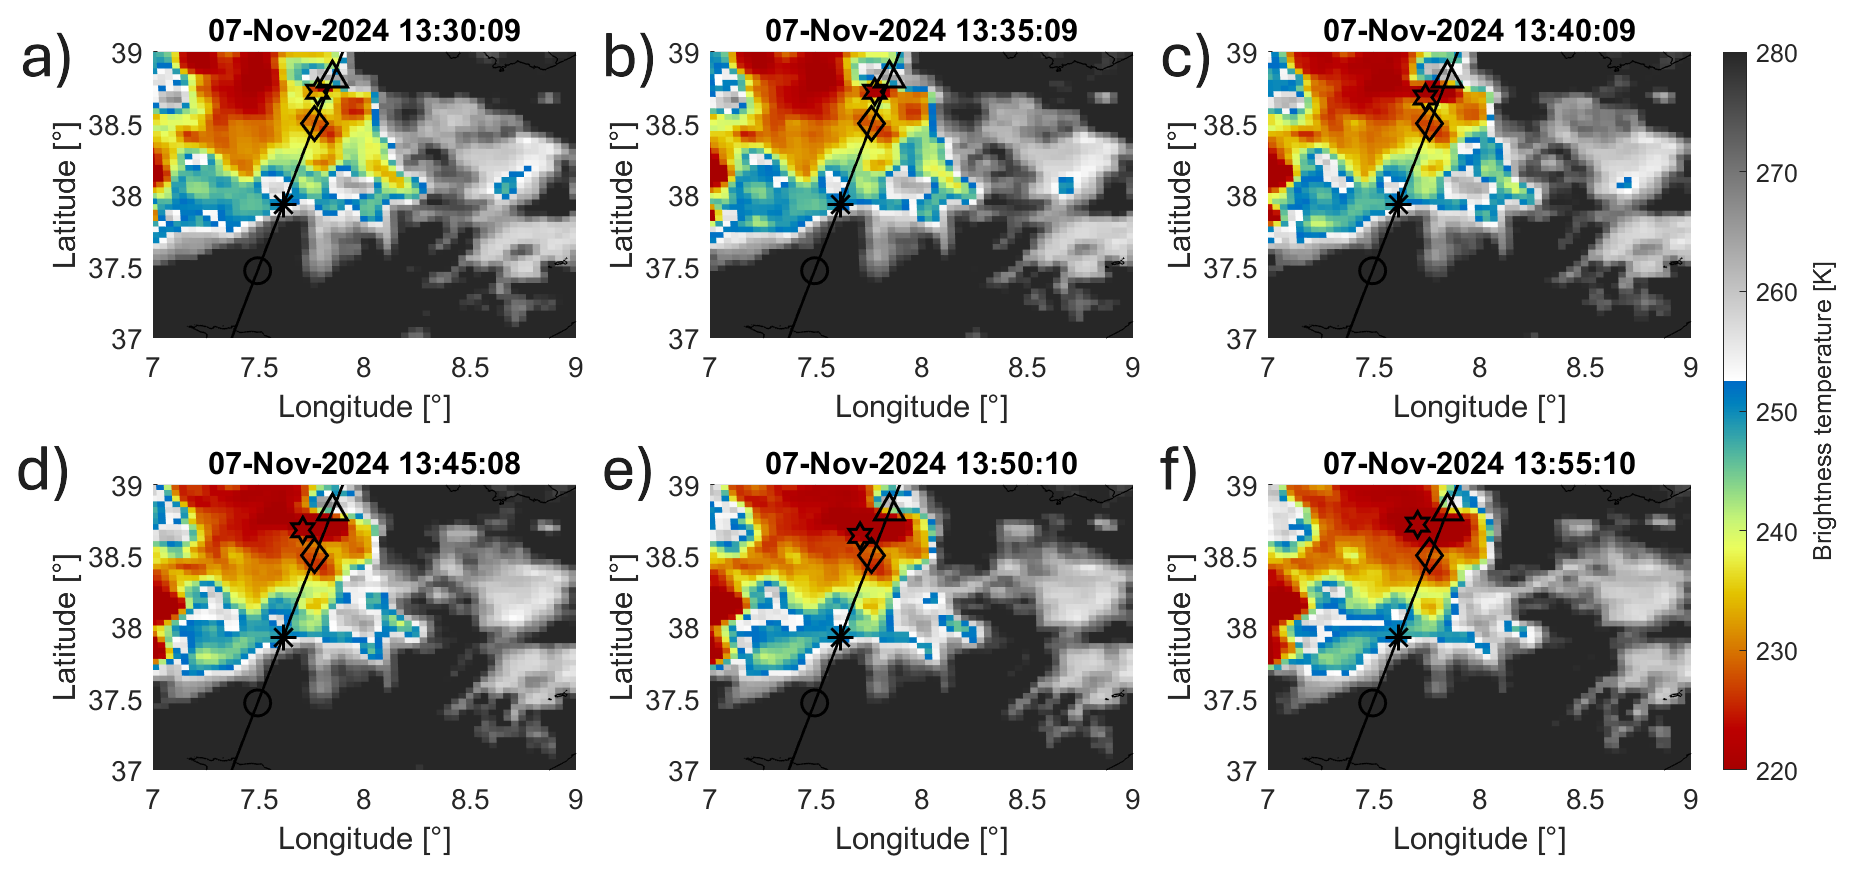
Figure 9Successive images depicting the time evolution of the IR brightness temperature field 10 min before (a), 5 min before (b), closest in time (c), 5 min after (d) and 10 after (e) EarthCARE overpass 2530D on 7 November 2024, zoom on cell 1. The colors represent the brightness temperature from channel 9 (10.8 µm), measured by MSG rapid scans. Black solid line represents the ground track of EarthCARE, corrected for parallax (dashed line is the original ground track). The black markers correspond to Fig. 8a. The black star is the minimum of the brightness temperature that is tracked.
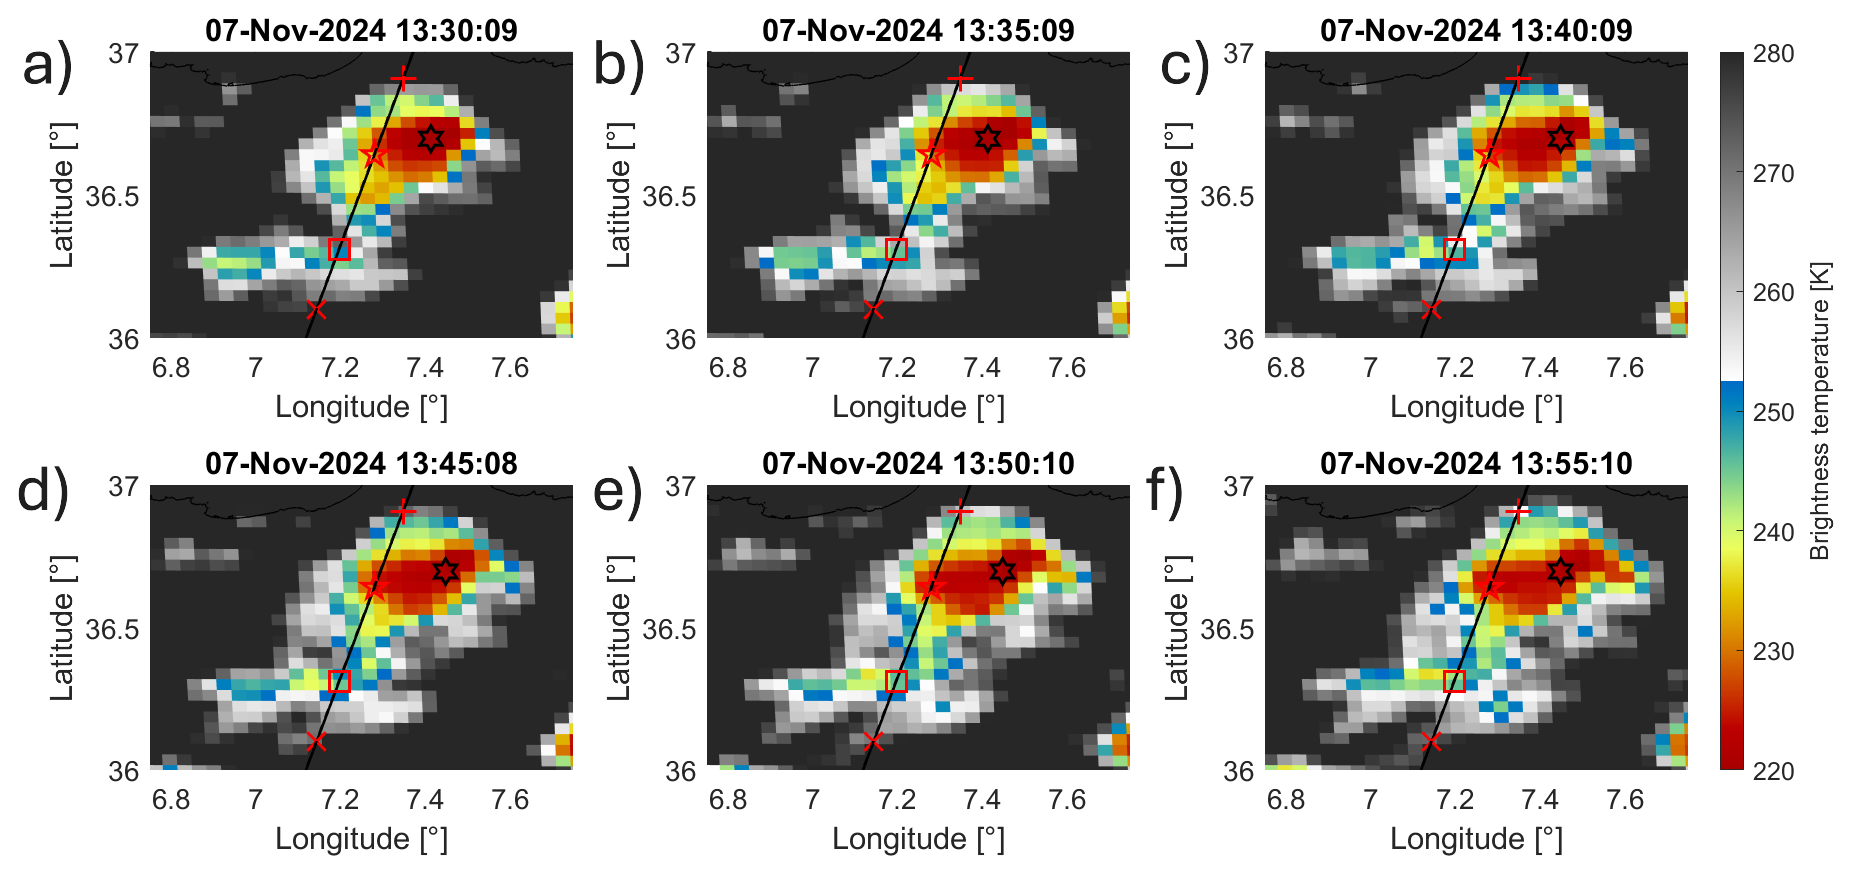
Figure 10Successive images depicting the time evolution 10 min before (a), 5 min before (b), closest in time (c), 5 min after (d) and 10 after (e) EarthCARE overpass 2530D on 7 November 2024, zoom on cell 2. The colors represent the brightness temperature from channel 9 (10.8 µm), measured by MSG rapid scans. Black solid line represents the ground track of EarthCARE, corrected for parallax (dashed line is the original ground track). Red markers correspond in shape to Fig. 8a. The black star is the position of the minimum brightness temperature that is tracked.
The Tracking and Object-Based Analysis of Clouds tobac algorithm is a robust and well-supported algorithm for feature detection and tracking of convective clouds (Heikenfeld et al., 2019; Sokolowsky et al., 2024). In this study, tobac is applied to MSG imagery to track the minimum brightness temperature within Cells 1 and 2 (Fig. 11). As shown in Fig. 9, Cell 1 is present well before the EarthCARE overpass and is already in a mature stage of development. Although the cloud top is very cold, no significant cooling is detectable in association with the ongoing embedded convective updraft observed by the CPR. It is likely that, as the cell began detraining mass into the anvil, multiple sparse convective cores developed beneath it. In such cases, radar observations are essential for accurately identifying and characterizing convection. According to the geostationary tracking, at the time of the EarthCARE overpass (13:43 UTC), the minimum brightness temperature in Cell 1 is already below 215 K (Fig. 11a) and fluctuates only slightly – by a few kelvin – during the minutes surrounding the overpass. At this stage of the convective lifecycle, the evolution of the minimum brightness temperature is no longer representative of fine-scale structures such as overshooting tops or highly localized, intense updrafts – features that, in contrast, are well captured by the EC-CPR.
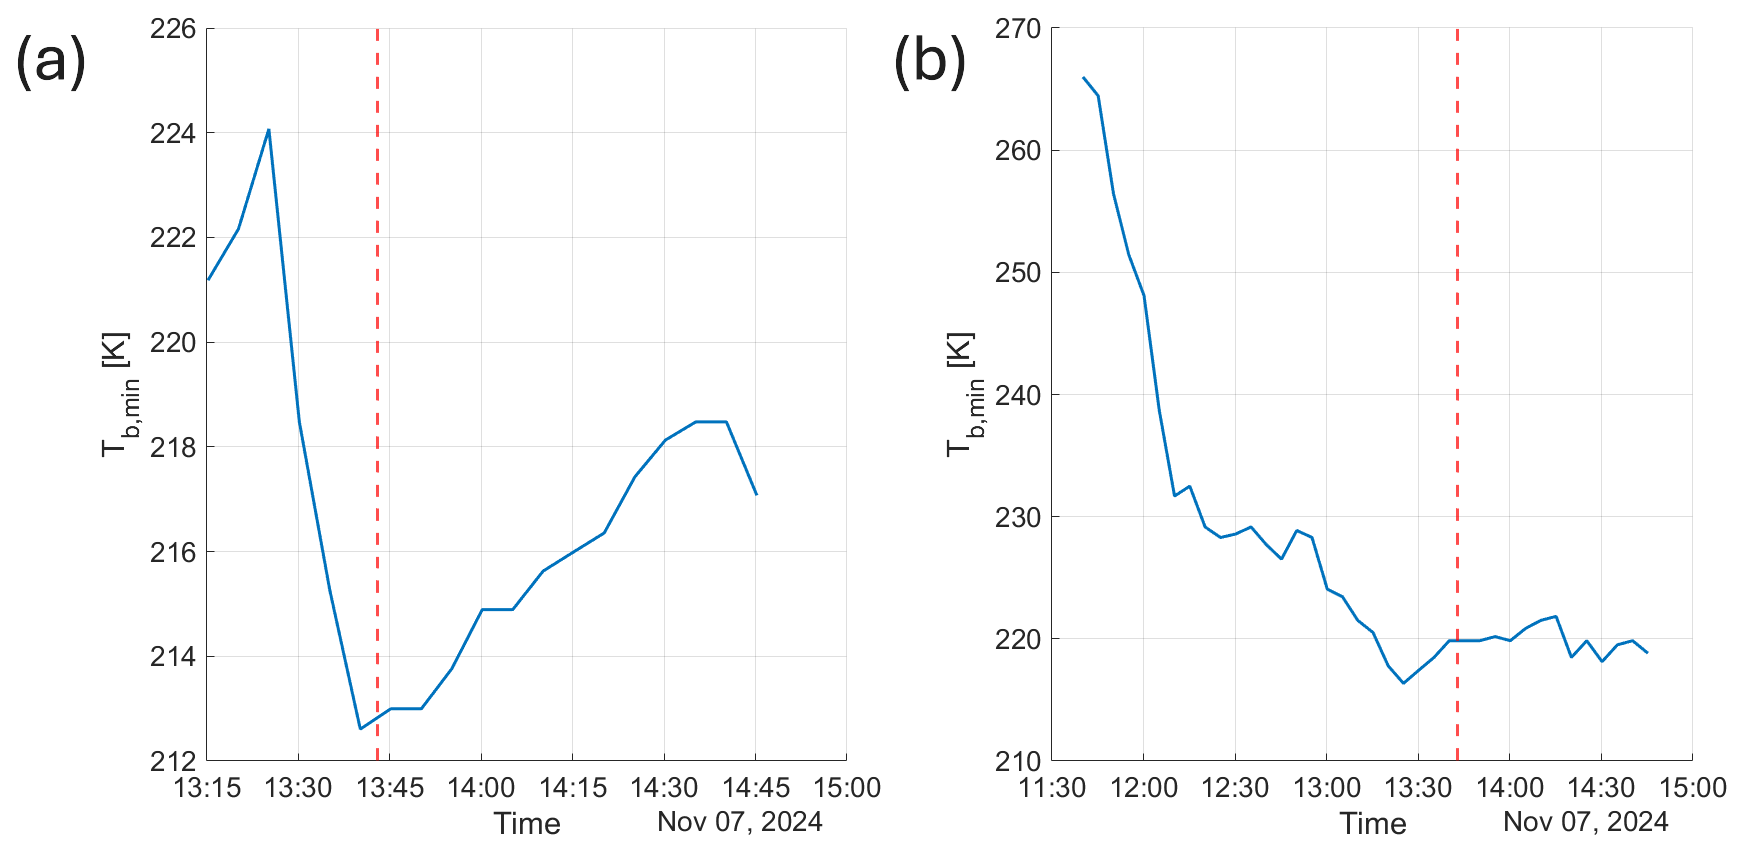
Figure 11Minimum brightness temperature (in K) within the cell, as detected and tracked with tobac. Red dashed line corresponds to the EC overpass time. (a) Cell 1. (b) Cell 2.
In contrast, Cell 2 is more isolated, which facilitates more effective tracking and allows for its evolution to be observed from the early stages. Figure 10 reveals a secondary cold spot on the southwest side of the cell, which later merges with the main convective core. The tobac tracking algorithm identifies a single feature, prioritizing the cooling associated with the main core while disregarding the cloud-top cooling of the smaller, secondary feature.
A significant cooling phase is observed during the first 20 min of the cell’s development. Following this initial phase, the tobac-tracked cloud-top temperature remains nearly constant, plateauing at approximately 220 K over the subsequent hour. The EarthCARE overpass (indicated by the red dashed line in the time series in Fig. 11a) occurs when the cell is already in its mature phase. Once again, it is challenging to directly correlate the CPR data – offering detailed vertical cross-sections of internal cloud structure – with the geostationary observations, which characterize the average behavior of the convective system based on cloud-top cooling rates. While tobac tracking provides valuable temporal context, it cannot capture the fine-scale vertical variability and internal dynamics revealed by the EC-CPR.
This discussion reinforces the limitations of relying solely on geostationary infrared cooling rates to characterize convection. While IR observations are effective at capturing relatively large and isolated updrafts near cloud tops, embedded convection and sub-kilometer-scale vertical motions largely go undetected. Resolving these features requires spaceborne radar observations, such as those provided by the EarthCARE CPR.
Spaceborne radar observations – such as those collected during NASA’s CloudSat and RainCube missions and the NASA-JAXA TRMM and GPM missions – have provided valuable global observations of storm and convective cloud reflectivity structures. However, direct observations of convective dynamics at the global scale have been lacking until now. The recently launched ESA-JAXA EarthCARE mission, equipped with a Doppler-capable radar, fills this critical observational gap and marks the beginning of a new era of satellite-based radar measurements to improve our understanding of convective dynamics.
Before launch, there were numerous questions regarding the quality of Doppler velocity measurements in deep convection, particularly due to anticipated challenges such as attenuation, multiple scattering, non-uniform beam filling (NUBF) effects, a narrow Nyquist velocity range, and the vertical and horizontal variability of convective cores. In this study, EC-CPR transects across various convective systems have been analyzed to assess and illustrate the impact of these challenges on the interpretation of Doppler velocity profiles.
The availability of Doppler velocity measurements from space provides valuable new insights into the presence, as well as the horizontal and vertical extent, of convective updrafts and downdrafts. Our case studies give evidence of differences in the detection of convective cores when Doppler velocity based instead of reflectivity based criteria are used. Future studies should investigate the impact of new Doppler velocity based criteria onto the climatology of occurrences of convective cores across Earth.
Furthermore, when combined with co-located infrared observations from geostationary satellites, CPR Doppler measurements offer new perspectives on the use of cloud-top cooling rates – computed as time derivatives of brightness temperature – as proxies for convective intensity.
Some final conclusions of this work are summarized in the following.
-
The first images of Doppler velocities measured by the EarthCARE Cloud Profiling Radar (EC-CPR) offer an unprecedented view of convective motions on a global perspective. While these images reveal the presence of convection, the quantitative interpretation of the CPR signal – such as the estimation of updraft and downdraft velocities or convective mass fluxes – will require further analysis. This need arises from the inherent complexity of convective dynamics, compounded by signal noise and the limitations imposed by the narrow Nyquist velocity range.
The CPR Doppler velocity measurements will serve as the foundation for a dynamics-based convection identification algorithm, designed to augment existing reflectivity-based detection methods. As demonstrated in the case study, parameters such as the standard deviation of Doppler velocity computed within a 3 km horizontal by 2 km vertical window, or the frequency of Nyquist velocity foldings, can serve as reliable indicators of convective activity.
-
The development of a robust algorithm for unfolding CPR Doppler velocity (VD) measurements in deep convective clouds is currently underway. The first step is to characterize the complexity of the VD field and to identify the primary sources of velocity discontinuities in deep convection. Initially, the focus will be limited to convective profiles exhibiting fewer than three Doppler velocity foldings at the 4 km along-track resolution – an approach expected to encompass more than 99 % of the observed CPR VD profiles. In cases where velocity aliasing is not observed in the 4 km averaged VD, but is present in the 1 km averaged profile, the 4 km averaged VD can be used as a weak constraint to unfold the 1 km averaged VD by minimizing the difference between the two. In more complex cases, such as those shown in this study, the morphology of the CPR reflectivity profile will be used to determine the vertical continuity of the convective column. In addition, VD estimates at 500 m (native CPR along track resolution), 1 or 4 km will be combined for the estimation of the unfolded CPR VD profile.
-
The CPR provides a unique capability for observing embedded convection and sub-kilometer-scale convective cells, thereby overcoming key limitations of convective observations derived from geostationary imagery. In particular, convective motion estimates based on cloud-top cooling rates are effective primarily for updrafts that are both comparable in size to the geostationary sensor’s resolution (typically larger than 2 km at mid-latitudes) and located near the cloud top. As such, this method is generally limited to convective cells in the early stages of development or to those exhibiting overshooting tops.
-
Geostationary imagery, on the other hand, offers significant potential for providing the spatio-temporal context of convection – such as whether it is part of a mesoscale system or an isolated cell, and whether it is in the early, mature, or decaying stage of its lifecycle. Additionally, geostationary observations are well-suited for quantifying updraft strength in isolated convective cells, where the time series of minimum cloud-top brightness temperature is expected to be strongly correlated with the intensity of the updraft.
The Doppler capability of EarthCARE’s Cloud Profiling Radar (CPR) represents a major innovation, enabling the direct observation of vertical air motion and the terminal fall speeds of hydrometeors. Nonetheless, substantial effort is still required to fully harness this capability and convert these measurements into actionable items of information for atmospheric science and modeling.
As a next step, a new convection classification framework will be developed using Doppler velocity and radar-derived features. Once established, this classification – when integrated with synergistic geostationary observations – will support the systematic identification of convective regimes and their associated characteristics. This framework will then be applied to generate global-scale statistics.
These efforts will significantly enhance our understanding of convective dynamics at the global scale and are expected to inform and validate high-resolution weather and climate models.
The code used for the calculations and the data analysis can be provided upon request to the authors.
EarthCARE data can be downloaded from the ESA portal, https://earth.esa.int/eogateway/missions/earthcare/data MSG data can be downloaded from the EUMETSAT data store, https://data.eumetsat.int/search?query=.
AG performed the analysis and provided the draft of the manuscript, AB supervised the study and reviewed the paper, PK provided the description of the Doppler velocity analysis and reviewed the paper, BPT provided the updated dataset and reviewed the paper.
At least one of the (co-)authors is a member of the editorial board of Atmospheric Measurement Techniques. The peer-review process was guided by an independent editor, and the authors also have no other competing interests to declare.
Publisher’s note: Copernicus Publications remains neutral with regard to jurisdictional claims made in the text, published maps, institutional affiliations, or any other geographical representation in this paper. While Copernicus Publications makes every effort to include appropriate place names, the final responsibility lies with the authors. Views expressed in the text are those of the authors and do not necessarily reflect the views of the publisher.
This article is part of the special issue “Early results from EarthCARE (AMT/ACP/GMD inter-journal SI)”. It is not associated with a conference.
PK and BPT were supported by the European Space Agency (ESA) under the Clouds, Aerosol, Radiation – Development of INtegrated ALgorithms (CARDINAL) project (RFQ/3-17010/20/NL/AD) and the National Aeronautics and Space Administration (NASA) under the Atmospheric Observing System (AOS) project (contract no. 80NSSC23M0113).
This research has been supported by 5 the PANGEA4CalVal project (grant no. 101079201) funded by the European Union and by the Space It Up project funded by the Italian Space Agency, ASI, and the Ministry of University and Research, MUR, under contract no. 2024-5-E.0 – CUP no. I53D24000060005.
This paper was edited by Robin Hogan and reviewed by two anonymous referees.
Amayenc, P., Testud, J., and Marzoug, M.: Proposal for a Spaceborne Dual-Beam Rain Radar with Doppler Capability, J. Atmos. Ocean Technol., 10, 262–276, https://doi.org/10.1175/1520-0426(1993)010<0262:PFASDB>2.0.CO;2, 1993. a
Arakawa, A.: The Cumulus Parameterization Problem: Past, Present, and Future, J. Climate, 17, 2493–2525, https://doi.org/10.1175/1520-0442(2004)017<2493:RATCPP>2.0.CO;2, 2004. a
Battaglia, A. and Kollias, P.: Using ice clouds for mitigating the EarthCARE Doppler radar mispointing, IEEE Trans. Geosci. Remote Sens., 53, 2079–2085, https://doi.org/10.1109/TGRS.2014.2353219, 2014. a
Battaglia, A. and Tanelli, S.: DOMUS: Doppler MUltiple-Scattering Simulator, IEEE Trans. Geosci. Remote Sens., 49, 442–450, https://doi.org/10.1109/TGRS.2010.2052818, 2011. a, b
Battaglia, A., Haynes, J. M., L'Ecuyer, T., and Simmer, C.: Identifying multiple-scattering-affected profiles in CloudSat observations over the oceans, J. Geophys. Res. Atmos., 113, https://doi.org/10.1029/2008JD009960, 2008. a
Battaglia, A., Tanelli, S., Kobayashi, S., Zrnic, D., Hogan, R. J., and Simmer, C.: Multiple-scattering in radar systems: A review, J. Quant. Spectrosc. Radiat. Transfer, 111, 917–947, https://doi.org/10.1016/j.jqsrt.2009.11.024, 2010. a, b
Battaglia, A., Augustynek, T., Tanelli, S., and Kollias, P.: Multiple scattering identification in spaceborne W-band radar measurements of deep convective cores, J. Geophys. Res. Atmos., 116, https://doi.org/10.1029/2011JD016142, 2011. a
Battaglia, A., Tanelli, S., and Kollias, P.: Polarization Diversity for Millimeter Spaceborne Doppler Radars: An Answer for Observing Deep Convection?, J. Atmos. Ocean Technol., 30, 2768–2787, https://doi.org/10.1175/JTECH-D-13-00085.1, 2013. a
Battaglia, A., Kollias, P., Dhillon, R., Roy, R., Tanelli, S., Lamer, K., Grecu, M., Lebsock, M., Watters, D., Mroz, K., Heymsfield, G., Li, L., and Furukawa, K.: Spaceborne Cloud and Precipitation Radars: Status, Challenges, and Ways Forward, Reviews of Geophysics, 58, e2019RG000686, https://doi.org/10.1029/2019RG000686, 2020. a
Battaglia, A., Rizik, A., Sikaneta, I., and Tridon, F.: I and Qs Simulation and Processing Envisaged for Spaceborne Polarization Diversity Doppler Radars, IEEE Trans. Geosci. Remote Sens., 63, 1–14, https://doi.org/10.1109/TGRS.2025.3529672, 2025. a
Bechtold, P., Bazile, E., Guichard, F., Mascart, P., and Richard, E.: A mass-flux convection scheme for regional and global models, Quarterly Journal of the Royal Meteorological Society, 127, 869–886, https://doi.org/10.1002/qj.49712757309, 2001. a
Bony, S., Stevens, B., Frierson, D. M. W., Jakob, C., Kageyama, M., Pincus, R., Shepherd, T. G., Sherwood, S. C., Siebesma, A. P., Sobel, A. H., Watanabe, M., and Webb, M.: Clouds, circulation and climate sensitivity, Nature Geoscience, 8, 261–268, https://doi.org/10.1038/ngeo2398, 2015. a
Eilts, M. D. and Smith, S. D.: Efficient Dealiasing of Doppler Velocities Using Local Environment Constraints, J. Atmos. Ocean Technol., 7, 118–128, https://doi.org/10.1175/1520-0426(1990)007<0118:EDODVU>2.0.CO;2, 1990. a
Eisinger, M., Marnas, F., Wallace, K., Kubota, T., Tomiyama, N., Ohno, Y., Tanaka, T., Tomita, E., Wehr, T., and Bernaerts, D.: The EarthCARE mission: science data processing chain overview, Atmos. Meas. Tech., 17, 839–862, https://doi.org/10.5194/amt-17-839-2024, 2024. a
Fabry, F. and Zawadzki, I.: Long-Term Radar Observations of the Melting Layer of Precipitation and Their Interpretation, J. Atmos. Sci., 52, 838–851, https://doi.org/10.1175/1520-0469(1995)052<0838:LTROOT>2.0.CO;2, 1995. a
Feldmann, M., Curtis, N. J., Boscacci, M., Leuenberger, D., Gabella, M., Germann, U., Wolfensberger, D., and Berne, A.: R2D2: A Region-Based Recursive Doppler Dealiasing Algorithm for Operational Weather Radar, J. Atmos. Oceanic Technol., 37, 2341–2356, https://doi.org/10.1175/JTECH-D-20-0054.1, 2020. a
Fiolleau, T. and Roca, R.: A database of deep convective systems derived from the intercalibrated meteorological geostationary satellite fleet and the TOOCAN algorithm (2012–2020), Earth Syst. Sci. Data, 16, 4021–4050, https://doi.org/10.5194/essd-16-4021-2024, 2024. a
Fridlind, A. M., Li, X., Wu, D., van Lier-Walqui, M., Ackerman, A. S., Tao, W.-K., McFarquhar, G. M., Wu, W., Dong, X., Wang, J., Ryzhkov, A., Zhang, P., Poellot, M. R., Neumann, A., and Tomlinson, J. M.: Derivation of aerosol profiles for MC3E convection studies and use in simulations of the 20 May squall line case, Atmos. Chem. Phys., 17, 5947–5972, https://doi.org/10.5194/acp-17-5947-2017, 2017. a
Gasparini, B., Rasch, P. J., Hartmann, D. L., Wall, C. J., and Dütsch, M.: A Lagrangian Perspective on Tropical Anvil Cloud Lifecycle in Present and Future Climate, J. Geophys. Res. Atmos., 126, e2020JD033487, https://doi.org/10.1029/2020JD033487, 2021. a
Giangrande, S. C., Collis, S., Straka, J., Protat, A., Williams, C., and Krueger, S.: A Summary of Convective-Core Vertical Velocity Properties Using ARM UHF Wind Profilers in Oklahoma, Journal of Applied Meteorology and Climatology, 52, 2278–2295, https://doi.org/10.1175/JAMC-D-12-0185.1, 2013. a
Hagihara, Y., Ohno, Y., Horie, H., Roh, W., Satoh, M., Kubota, T., and Oki, R.: Assessments of Doppler Velocity Errors of EarthCARE Cloud Profiling Radar Using Global Cloud System Resolving Simulations: Effects of Doppler Broadening and Folding, IEEE Trans. Geosci. Remote Sens., 60, 1–9, https://doi.org/10.1109/TGRS.2021.3060828, 2022. a
Hamada, A., Takayabu, Y. N., Liu, C., and Zipser, E. J.: Weak linkage between the heaviest rainfall and tallest storms, Nature Communications, 6, 6213, https://doi.org/10.1038/ncomms7213, 2015. a
Hartmann, D. L., Hendon, H. H., and Houze, R. A.: Some Implications of the Mesoscale Circulations in Tropical Cloud Clusters for Large-Scale Dynamics and Climate, J. Atmos. Sci., 41, 113–121, https://doi.org/10.1175/1520-0469(1984)041<0113:SIOTMC>2.0.CO;2, 1984. a
Hartmann, D. L., Gasparini, B., Berry, S. E., and Blossey, P. N.: The Life Cycle and Net Radiative Effect of Tropical Anvil Clouds, Journal of Advances in Modeling Earth Systems, 10, 3012–3029, https://doi.org/10.1029/2018MS001484, 2018. a
Heikenfeld, M., Marinescu, P. J., Christensen, M., Watson-Parris, D., Senf, F., van den Heever, S. C., and Stier, P.: tobac 1.2: towards a flexible framework for tracking and analysis of clouds in diverse datasets, Geosci. Model Dev., 12, 4551–4570, https://doi.org/10.5194/gmd-12-4551-2019, 2019. a
Heymsfield, G. M., Tian, L., Heymsfield, A. J., Li, L., and Guimond, S.: Characteristics of Deep Tropical and Subtropical Convection from Nadir-Viewing High-Altitude Airborne Doppler Radar, J. Atmos. Sci., 67, 285–308, https://doi.org/10.1175/2009JAS3132.1, 2010. a
Illingworth, A. J., Barker, H. W., Beljaars, A., Ceccaldi, M., Chepfer, H., Clerbaux, N., Cole, J., Delanoë, J., Domenech, C., Donovan, D. P., Fukuda, S., Hirakata, M., Hogan, R. J., Huenerbein, A., Kollias, P., Kubota, T., Nakajima, T., Nakajima, T. Y., Nishizawa, T., Ohno, Y., Okamoto, H., Oki, R., Sato, K., Satoh, M., Shephard, M. W., Velázquez-Blázquez, A., Wandinger, U., Wehr, T., and van Zadelhoff, G.-J.: The EarthCARE Satellite: The Next Step Forward in Global Measurements of Clouds, Aerosols, Precipitation, and Radiation, B. Am. Meteorol. Soc., 96, 1311–1332, https://doi.org/10.1175/BAMS-D-12-00227.1, 2015. a, b
Illingworth, A. J., Battaglia, A., Bradford, J., Forsythe, M., Joe, P., Kollias, P., Lean, K., Lori, M., Mahfouf, J.-F., Melo, S., Midthassel, R., Munro, Y., Nicol, J., Potthast, R., Rennie, M., Stein, T. H. M., Tanelli, S., Tridon, F., Walden, C. J., and Wolde, M.: WIVERN: A New Satellite Concept to Provide Global In-Cloud Winds, Precipitation, and Cloud Properties, B. Am. Meteorol. Soc., 99, 1669–1687, https://doi.org/10.1175/BAMS-D-16-0047.1, 2018. a
Jeyaratnam, J., Luo, Z. J., Giangrande, S. E., Wang, D., and Masunaga, H.: A Satellite-Based Estimate of Convective Vertical Velocity and Convective Mass Flux: Global Survey and Comparison With Radar Wind Profiler Observations, Geophys. Res. Lett., 48, e2020GL090675, https://doi.org/10.1029/2020GL090675, 2021. a
Khlopenkov, K., Bedka, K., Cooney, J., and Itterly, K.: Recent Advances in Detection of Overshooting Cloud Tops From Longwave Infrared Satellite Imagery, J. Geophys. Res. Atmos., 126, https://doi.org/10.1029/2020JD034359, 2021. a
Kobayashi, S., Kumagai, H., and Kuroiwa, H.: A proposal of pulse-pair Doppler operation on a spaceborn cloud-profiling radar in the W band, J. Atmos. Ocean Technol., 19, https://doi.org/10.1175/1520-0426(2002)019<1294:APOPPD>2.0.CO;2, 2002. a
Kollias, P., Szyrmer, W., Zawadzki, I., and Joe, P.: Considerations for spaceborne 94 GHz radar observations of precipitation, Geophys. Res. Lett., 34, https://doi.org/10.1029/2007GL031536, 2007. a
Kollias, P., Tanelli, S., Battaglia, A., and Tatarevic, A.: Evaluation of EarthCARE Cloud Profiling Radar Doppler Velocity Measurements in Particle Sedimentation Regimes, J. Atmos. Ocean Technol., 31, 366–386, https://doi.org/10.1175/JTECH-D-11-00202.1, 2014. a, b, c, d, e
Kollias, P., Battaglia, A., A., T., Lamer, K., Tridon, F., and Pfitzenmaier, L.: The EarthCARE cloud profiling radar (CPR) Doppler measurements in deep convection: challenges, post-processing, and science applications, in: Remote Sensing of the Atmosphere, Clouds, and Precipitation VII, edited by: Im, E. and Yang, S., vol. 10776, International Society for Optics and Photonics, SPIE, 57–68, https://doi.org/10.1117/12.2324321, 2018. a, b
Kollias, P., Battaglia, A., Lamer, K., Puigdomenech Treserras, B., and Braun, S. A.: Mind the Gap – Part 3: Doppler Velocity Measurements From Space, Frontiers in Remote Sensing, 3, https://doi.org/10.3389/frsen.2022.860284, 2022. a, b, c, d, e
Kollias, P., Puidgomènech Treserras, B., Battaglia, A., Borque, P. C., and Tatarevic, A.: Processing reflectivity and Doppler velocity from EarthCARE's cloud-profiling radar: the C-FMR, C-CD and C-APC products, Atmos. Meas. Tech., 16, 1901–1914, https://doi.org/10.5194/amt-16-1901-2023, 2023. a, b, c, d, e, f, g, h, i
Kummerow, C., Barnes, W., Kozu, T., Shiue, J., and Simpson, J.: The Tropical Rainfall Measuring Mission (TRMM) Sensor Package, J. Atmos. Ocean Technol., 15, 809–817, https://doi.org/10.1175/1520-0426(1998)015<0809:TTRMMT>2.0.CO;2, 1998. a
Kummerow, C., Simpson, J., Thiele, O., Barnes, W., Chang, A. T. C., Stocker, E., Adler, R. F., Hou, A., Kakar, R., Wentz, F., Ashcroft, P., Kozu, T., Hong, Y., Okamoto, K., Iguchi, T., Kuroiwa, H., Im, E., Haddad, Z., Huffman, G., Ferrier, B., Olson, W. S., Zipser, E., Smith, E. A., Wilheit, T. T., North, G., Krishnamurti, T., and Nakamura, K.: The Status of the Tropical Rainfall Measuring Mission (TRMM) after Two Years in Orbit, J. Appl. Meteorol., 39, 1965–1982, https://doi.org/10.1175/1520-0450(2001)040<1965:TSOTTR>2.0.CO;2, 2000. a
Ladino, L. A., Korolev, A., Heckman, I., Wolde, M., Fridlind, A. M., and Ackerman, A. S.: On the role of ice-nucleating aerosol in the formation of ice particles in tropical mesoscale convective systems, Geophys. Res. Lett., 44, 1574–1582, https://doi.org/10.1002/2016GL072455, 2017. a
Lee, Y., Kummerow, C. D., and Zupanski, M.: A simplified method for the detection of convection using high-resolution imagery from GOES-16, Atmos. Meas. Tech., 14, 3755–3771, https://doi.org/10.5194/amt-14-3755-2021, 2021. a
Liu, N. and Liu, C.: Global distribution of deep convection reaching tropopause in 1 year GPM observations, J. Geophys. Res. Atmos., 121, 3824–3842, https://doi.org/10.1002/2015JD024430, 2016. a
Liu, N., Liu, C., and Hayden, L.: Climatology and Detection of Overshooting Convection From 4Years of GPM Precipitation Radar and Passive Microwave Observations, J. Geophys. Res. Atmos., 125, e2019JD032003, https://doi.org/10.1029/2019JD032003, 2020. a
Louf, V., Protat, A., Jackson, R. C., Collis, S. M., and Helmus, J.: UNRAVEL: A Robust Modular Velocity Dealiasing Technique for Doppler Radar, Journal of Atmospheric and Oceanic Technology, 37, 741–758, https://doi.org/10.1175/JTECH-D-19-0020.1, 2020. a
Luo, Z. J., Liu, G. Y., and Stephens, G. L.: CloudSat adding new insight into tropical penetrating convection, Geophys. Res. Lett., 35, https://doi.org/10.1029/2008GL035330, 2008. a, b
Luo, Z. J., Liu, G. Y., and Stephens, G. L.: Use of A-Train data to estimate convective buoyancy and entrainment rate, Geophys. Res. Lett., 37, https://doi.org/10.1029/2010GL042904, 2010. a
Luo, Z. J., Jeyaratnam, J., Iwasaki, S., Takahashi, H., and Anderson, R.: Convective vertical velocity and cloud internal vertical structure: An A-Train perspective, Geophys. Res. Lett., 41, 723–729, https://doi.org/10.1002/2013GL058922, 2014. a, b, c
Maahn, M. and Kollias, P.: Improved Micro Rain Radar snow measurements using Doppler spectra post-processing, Atmos. Meas. Tech., 5, 2661–2673, https://doi.org/10.5194/amt-5-2661-2012, 2012. a
Manabe, S. and Strickler, R. F.: Thermal Equilibrium of the Atmosphere with a Convective Adjustment, J. Atmos. Sci., 21, 361–385, https://doi.org/10.1175/1520-0469(1964)021<0361:TEOTAW>2.0.CO;2, 1964. a
Meneghini, R., Bidwell, S., Liao, L., Rincon, R., and Heymsfield, G.: Differential-frequency Doppler weather radar: Theory and experiment, Radio Science, 38, https://doi.org/10.1029/2002RS002656, 2003. a
Mroz, K., Treserras, B. P., Battaglia, A., Kollias, P., Tatarevic, A., and Tridon, F.: Cloud and precipitation microphysical retrievals from the EarthCARE Cloud Profiling Radar: the C-CLD product, Atmos. Meas. Tech., 16, 2865–2888, https://doi.org/10.5194/amt-16-2865-2023, 2023. a
Ni, X., Liu, C., and Zipser, E.: Ice Microphysical Properties near the Tops of Deep Convective Cores Implied by the GPM Dual-Frequency Radar Observations, J. Atmos. Sci., 76, 2899–2917, https://doi.org/10.1175/JAS-D-18-0243.1, 2019. a
North, K. W., Oue, M., Kollias, P., Giangrande, S. E., Collis, S. M., and Potvin, C. K.: Vertical air motion retrievals in deep convective clouds using the ARM scanning radar network in Oklahoma during MC3E, Atmos. Meas. Tech., 10, 2785–2806, https://doi.org/10.5194/amt-10-2785-2017, 2017. a
Oue, M., Kollias, P., Shapiro, A., Tatarevic, A., and Matsui, T.: Investigation of observational error sources in multi-Doppler-radar three-dimensional variational vertical air motion retrievals, Atmos. Meas. Tech., 12, 1999–2018, https://doi.org/10.5194/amt-12-1999-2019, 2019. a
Peral, E., Statham, S., Im, E., Tanelli, S., Imken, T., Price, D., Sauder, J., Chahat, N., and Williams, A.: The Radar-in-a-Cubesat (RAINCUBE) and Measurement Results, in: IGARSS 2018 – 2018 IEEE International Geoscience and Remote Sensing Symposium, 6297–6300, https://doi.org/10.1109/IGARSS.2018.8519194, 2018. a
Prein, A. F., Langhans, W., Fosser, G., Ferrone, A., Ban, N., Goergen, K., Keller, M., Tölle, M., Gutjahr, O., Feser, F., Brisson, E., Kollet, S., Schmidli, J., van Lipzig, N. P. M., and Leung, R.: A review on regional convection-permitting climate modeling: Demonstrations, prospects, and challenges, Reviews of Geophysics, 53, 323–361, https://doi.org/10.1002/2014RG000475, 2015. a
Puigdomènech Treserras, B., Kollias, P., Battaglia, A., Tanelli, S., and Nakatsuka, H.: EarthCARE's cloud profiling radar antenna pointing correction using surface Doppler measurements, Atmos. Meas. Tech., 18, 5607–5618, https://doi.org/10.5194/amt-18-5607-2025, 2025. a, b
Schutgens, N. A. J.: Simulated Doppler Radar Observations of Inhomogeneous Clouds: Application to the EarthCARE Space Mission, J. Atmos. Ocean Technol., 25, 1514–1528, https://doi.org/10.1175/2007JTECHA1026.1, 2008a. a
Schutgens, N. A. J.: Simulating Range Oversampled Doppler Radar Profiles of Inhomogeneous Targets, J. Atmos. Ocean Technol., 25, 26–42, https://doi.org/10.1175/2007JTECHA956.1, 2008b. a
Skofronick-Jackson, G., Petersen, W. A., Berg, W., Kidd, C., Stocker, E. F., Kirschbaum, D. B., Kakar, R., Braun, S. A., Huffman, G. J., Iguchi, T., Kirstetter, P. E., Kummerow, C., Meneghini, R., Oki, R., Olson, W. S., Takayabu, Y. N., Furukawa, K., and Wilheit, T.: The Global Precipitation Measurement (GPM) Mission for Science and Society, B. Am. Meteorol. Soc., 98, 1679–1695, https://doi.org/10.1175/BAMS-D-15-00306.1, 2017. a
Skofronick-Jackson, G., Kirschbaum, D., Petersen, W., Huffman, G., Kidd, C., Stocker, E., and Kakar, R.: The Global Precipitation Measurement (GPM) mission's scientific achievements and societal contributions: reviewing four years of advanced rain and snow observations, Q. J. Roy. Meteor. Soc., 144, 27–48, https://doi.org/10.1002/qj.3313, 2018. a
Sokolowsky, G. A., Freeman, S. W., Jones, W. K., Kukulies, J., Senf, F., Marinescu, P. J., Heikenfeld, M., Brunner, K. N., Bruning, E. C., Collis, S. M., Jackson, R. C., Leung, G. R., Pfeifer, N., Raut, B. A., Saleeby, S. M., Stier, P., and van den Heever, S. C.: tobac v1.5: introducing fast 3D tracking, splits and mergers, and other enhancements for identifying and analysing meteorological phenomena, Geosci. Model Dev., 17, 5309–5330, https://doi.org/10.5194/gmd-17-5309-2024, 2024. a
Stephens, G. L., Vane, D. G., Boain, R. J., Mace, G. G., Sassen, K., Wang, Z., Illingworth, A. J., O'Connor, E. J., Rossow, W. B., Durden, S. L., Miller, S. D., Austin, R. T., Benedetti, A., Mitrescu, C., and Team, C. S.: The CloudSat mission and the A-Train: A new dimension of space-based observations of clouds and precipitation, B. Am. Meteorol. Soc., 83, 1771–1790, https://doi.org/10.1175/BAMS-83-12-1771, 2002. a
Stephens, G. L., Shiro, K. A., Hakuba, M. Z., Takahashi, H., Pilewskie, J. A., Andrews, T., Stubenrauch, C. J., and Wu, L.: Tropical Deep Convection, Cloud Feedbacks and Climate Sensitivity, Surveys in Geophysics, 45, 1903–1931, https://doi.org/10.1007/s10712-024-09831-1, 2024. a
Sy, O. O., Tanelli, S., Takahashi, N., Ohno, Y., Horie, H., and Kollias, P.: Simulation of EarthCARE spaceborne Doppler radar products using ground-based and airborne data: Effects of aliasing and nonuniform beam-filling, IEEE Trans. Geosci. Remote Sens., 52, https://doi.org/10.1109/TGRS.2013.2251639, 2014. a, b
Takahashi, H. and Luo, Z.: Where is the level of neutral buoyancy for deep convection?, Geophys. Res. Lett., 39, https://doi.org/10.1029/2012GL052638, 2012. a
Takahashi, H. and Luo, Z. J.: Characterizing tropical overshooting deep convection from joint analysis of CloudSat and geostationary satellite observations, J. Geophys. Res. Atmos., 119, 112–121, https://doi.org/10.1002/2013JD020972, 2014. a, b
Takahashi, H., Luo, Z. J., and Stephens, G. L.: Level of neutral buoyancy, deep convective outflow, and convective core: New perspectives based on 5 years of CloudSat data, J. Geophys. Res. Atmos., 122, 2958–2969, https://doi.org/10.1002/2016JD025969, 2017. a, b
Tanelli, S., Im, E., Durden, S. L., Facheris, L., and Giuli, D.: The Effects of Nonuniform Beam Filling on Vertical Rainfall Velocity Measurements with a Spaceborne Doppler Radar, J. Atmos. Ocean Technol., 19, 1019–1034, https://doi.org/10.1175/1520-0426(2002)019<1019:TEONBF>2.0.CO;2, 2002. a, b
Tanelli, S., Im, E., Mascelloni, S. R., and Facheris, L.: Spaceborne Doppler radar measurements of rainfall: correction of errors induced by pointing uncertainties, J. Atmos. Ocean Technol., 22, 1676–1690, https://doi.org/10.1175/JTECH1797.1, 2005. a, b
Tiedtke, M.: A Comprehensive Mass Flux Scheme for Cumulus Parameterization in Large-Scale Models, Monthly Weather Review, 117, 1779–1800, https://doi.org/10.1175/1520-0493(1989)117<1779:ACMFSF>2.0.CO;2, 1989. a
Varble, A., Zipser, E. J., Fridlind, A. M., Zhu, P., Ackerman, A. S., Chaboureau, J.-P., Collis, S., Fan, J., Hill, A., and Shipway, B.: Evaluation of cloud-resolving and limited area model intercomparison simulations using TWP-ICE observations: 1. Deep convective updraft properties, J. Geophys. Res. Atmos., 119, 13891–13918, https://doi.org/10.1002/2013JD021371, 2014. a
Wang, D., Giangrande, S. E., Feng, Z., Hardin, J. C., and Prein, A. F.: Updraft and Downdraft Core Size and Intensity as Revealed by Radar Wind Profilers: MCS Observations and Idealized Model Comparisons, J. Geophys. Res. Atmos., 125, e2019JD031774, https://doi.org/10.1029/2019JD031774, 2020. a
Wehr, T., Kubota, T., Tzeremes, G., Wallace, K., Nakatsuka, H., Ohno, Y., Koopman, R., Rusli, S., Kikuchi, M., Eisinger, M., Tanaka, T., Taga, M., Deghaye, P., Tomita, E., and Bernaerts, D.: The EarthCARE mission – science and system overview, Atmos. Meas. Tech., 16, 3581–3608, https://doi.org/10.5194/amt-16-3581-2023, 2023. a
Xu, W. and Zipser, E.: Properties of deep convection in tropical continental, monsoon, and oceanic rainfall regimes, Geophys. Res. Lett., 39, https://doi.org/10.1029/2012GL051242, 2012. a
Yang, J., Wang, Z., Heymsfield, A. J., and French, J. R.: Characteristics of vertical air motion in isolated convective clouds, Atmos. Chem. Phys., 16, 10159–10173, https://doi.org/10.5194/acp-16-10159-2016, 2016. a
Yang, K., Wang., Deng, M., and Dettmann, B.: Combining CloudSat/CALIPSO and MODIS measurements to reconstruct tropical convective cloud structure, Remote Sensing of Environment, 287, 113478, https://doi.org/10.1016/j.rse.2023.113478, 2023. a
Yokoyama, C., Zipser, E. J., and Liu, C.: TRMM-Observed Shallow versus Deep Convection in the Eastern Pacific Related to Large-Scale Circulations in Reanalysis Datasets, J. Climate, 27, 5575–5592, https://doi.org/10.1175/JCLI-D-13-00315.1, 2014. a
Zhang, J. and Wang, S.: An Automated 2D Multipass Doppler Radar Velocity Dealiasing Scheme, J. Atmos. Ocean Technol., 23, 1239–1248, https://doi.org/10.1175/JTECH1910.1, 2006. a
- Abstract
- Introduction
- CPR Doppler velocity observations in deep convection
- Synergy between the CPR Doppler, MSI and Geostationary Observations
- Conclusions
- Code availability
- Data availability
- Author contributions
- Competing interests
- Disclaimer
- Special issue statement
- Acknowledgements
- Financial support
- Review statement
- References