the Creative Commons Attribution 4.0 License.
the Creative Commons Attribution 4.0 License.
 | 24 Nov 2025
The Carbon Mapper emissions monitoring system
Daniel Cusworth
Alana Ayasse
Katherine Howell
Alex Diamond
Tia Scarpelli
Jinsol Kim
Kelly O'neill
Judy Lai-Norling
Andrew Thorpe
Sander R. Zandbergen
Lucas Shaw
Mark Keremedjiev
Jeff Guido
Paul Giuliano
Malkam Goldstein
Ravi Nallapu
Geert Barentsen
David R. Thompson
Keely Roth
Daniel Jensen
Michael Eastwood
Frances Reuland
Taylor Adams
Adam Brandt
Eric A. Kort
James Mason
Robert O. Green
The Carbon Mapper emissions monitoring system contributes to the broader ecosystem of greenhouse gas observations by locating and quantifying CH4 and CO2 super emitters at facility scale across priority regions globally and making the data accessible and actionable. The system includes observing platforms, an operational monitoring strategy optimized for mitigation impact, and a data platform that delivers CH4 and CO2 data products for diverse stakeholders. Operational scale-up of the system is centered around a new constellation of hyperspectral satellites. The Carbon Mapper Coalition (hereafter Tanager) satellites are each equipped with an imaging spectrometer instrument designed by NASA's Jet Propulsion Laboratory that are assembled, launched and operated by Planet Labs. The first Tanager satellite (Tanager-1) was launched 16 August 2024 completed commissioning in January 2025 and continued to improve observational efficiency through summer 2025. Planet is currently working to expand the constellation to four Tanagers. Each imaging spectrometer instrument has a spectral range of about 400–2500 nm, 5 nm spectral sampling, a nadir spatial resolution of 30 m, and nadir swath width of about 19 km at the lowest orbital altitude. Each satellite is capable of imaging 250 000 km2 per day on average. By combining the results of independent controlled release testing with empirical evaluation of the radiometric, spectral, spatial, and retrieval noise performance of the Tanager-1 spectrometer, we predict minimum detection limits of about 64–126 kgCH4 h−1 for CH4 point sources and about 10 078–18 994 kgCO2 h−1 for CO2 point sources for images with 25 % albedo, 45° solar zenith angle, and 3 m s−1 wind speed. A review of the first 11 months of Tanager-1 CH4 and CO2 observations including initial validation with coordinated aircraft under-flights and non-blind controlled release testing indicates that the system is meeting performance requirements and, in many cases, surpassing expectations. We also present early evaluations in challenging onshore and offshore observational conditions and summarize the first use of Tanager data to guide the timely mitigation of a CH4 super emitter.
- Article
(17823 KB) - Full-text XML
-
Supplement
(1810 KB) - BibTeX
- EndNote


As governments, companies and actors across civil society pursue a broad range of efforts to stabilize and reduce greenhouse gas (GHG) emissions there is an increasing need for actionable emissions data that is accurate, timely, and trusted. The expanding portfolio of use-cases includes diverse governmental regulations, private sector market-based initiatives, leak detection and repair programs, and an increasing demand for measurement-based emission inventories and enhanced transparency. Example includes ambitious emission mitigation targets by governments under the Paris Agreement (UN, 2015), Kigali Amendment (UN, 2016), and Global Methane Pledge (UN, 2023) as well as major private sector initiatives such as the Oil and Gas Methane Partnership (UNEP, 2020). In parallel with these policy developments, dramatic advances in GHG measurement technology have occurred over the last several years – particularly for methane (CH4) and carbon dioxide (CO2), the top two climate pollutants.
Scaling up a global emissions monitoring system that can provide global operational tracking of millions of emission sources at facility-scale along with rapid, transparent data publication requires addressing technical as well as institutional barriers. To confront these challenges, the Carbon Mapper non-profit organization (https://carbonmapper.org/, last access: 16 November 2025) was established with the support of philanthropists to provide leadership in observational system development, CH4 and CO2 science data analysis, and stakeholder engagement. We also assembled a public-private partnership called the Carbon Mapper Coalition to design and launch the first in a series of next generation satellites. The Carbon Mapper Coalition (hereafter Tanager-series) satellites are each equipped with an imaging spectrometer instrument designed by NASA's Jet Propulsion Laboratory (JPL) that are assembled, launched and operated by Planet Labs. Like existing hyperspectral research satellites (e.g., PRISMA, EMIT, and EnMAP), Tanager is multi-application ready. However, unlike those missions, for the sake of operational GHG monitoring globally, a large portion of Tanager's tasking capacity is allocated to mapping known CH4 and CO2 emitting regions or infrastructure. The first Tanager satellite (Tanager-1) was launched 16 August 2024, completed commissioning in January 2025, and is on track to begin full operational monitoring by summer 2025. In this paper we describe the design, observational strategy, and performance of the Carbon Mapper emissions monitoring system as enabled by a constellation of Tanager satellites.
1.1 Motivation and challenges for measuring and mitigating CH4 and CO2 point sources
Since 2005, the ability to quantify global GHG concentrations using backscattered solar radiance at various spatio-temporal scales has existed from space with atmospheric sounding satellites, which for CH4 began with SCIAMACHY (Frankenberg et al., 2011) and more recently GOSAT (Turner et al., 2015) and the TROPOMI instrument onboard the Sentinel-5p satellite (Hu et al., 2018). CO2 measuring satellites include NASA's OCO-2 and OCO-3 missions (Crisp et al., 2004; Eldering et al., 2019) as well as GOSAT. These early generations of atmospheric sounding satellites – measure gas absorption features at sub-nanometer spectral resolution with high precision, but doing so requires coarse, multi kilometer-scale spatial resolution (Jacob et al., 2022). These systems are optimized for quantifying the total CH4 and CO2 fluxes for large regions, including the net contributions of diffuse area sources (typically distributed over several kilometers) and condensed point sources (typically originating from surface features <10 m across). Therefore, detection and quantification for individual point sources from these instruments is only sometimes possible for very large sources whose emission are generally more than 8 t CH4 h−1 (Schuit et al., 2023) to 50 t CH4 h−1 (Lauvaux et al., 2022) or 1600 t CO2 h−1 (Nassar et al., 2021). The regional flux mapping satellites have provided important constraints for atmospheric GHG budgets when their observations are assimilated with atmospheric chemistry and transport inverse models (e.g., Worden et al., 2022; Byrne et al., 2023). However, the spatial resolution of global inverse models is typically on the order of 25–400 km, which may be sufficient for regional flux quantification, but not identifying and quantifying individual point sources at the scale of meters or capturing the bulk of point source distributions. Past inverse modeling work has attempted to estimate facility-scale emissions for spatially isolated sources like individual landfills (e.g., Nesser et al., 2024), but this requires temporal averaging, and even average emissions cannot be attributed to facility-scale for dense infrastructure regions like oil/gas fields or urban areas. MethaneSAT was launched in March 2024 and until June 2025 quantified both the total CH4 emissions and larger point sources for global oil and gas production basins with significantly higher spatial resolution than other regional flux mappers (Chan Miller et al., 2024). Most recently, the Japanese space agency launched the GOSAT-GW satellite in June 2025 which is currently undergoing commissioning and is designed to provide global CH4 flux mapping with a 3 d revisit at spatial resolutions ranging from 1 to 10 km (Tanimoto et al., 2025).
Meanwhile, multiple studies have conclusively identified the existence of methane “super emitters” where a relatively small fraction of infrastructure is often responsible for a disproportionate fraction of total emissions from key regions and economic sectors. CH4 super emitters have the potential for emission rates exceeding 100 kg h−1 and are often associated with point sources. Super emitters can be the result of leaks, malfunctioning equipment, or process venting – many of which can be temporary but, in some cases, may persist for months to years (Cusworth et al., 2024). Beginning in 2016 and 2017, advanced remote-sensing aircraft were used to conduct the first comprehensive, economy wide survey of methane emitters in California and found that less than 0.2 % of the infrastructure is responsible for over a third of the state's entire methane inventory (Duren et al., 2019). Since then, these intensive field campaigns have expanded to other key regions across the US and other jurisdictions and show that a relatively small fraction of facilities are responsible for 20 %–60 % of total emissions spanning multiple economic sectors (Cusworth et al., 2022; Sherwin et al., 2024). Additionally, since 2020, Carbon Mapper aircraft surveys of California, Colorado, Pennsylvania, New Mexico and Texas have demonstrated that delivering actionable emissions data to facility operators and agencies can lead to expedited mitigation action (CARB, 2022; CDPHE, 2024). Participating operators have reported that roughly half of the methane emissions we identified at their facilities (primarily from oil and gas production, downstream natural gas and solid waste management sectors) are “fixable” and in many cases we have verified emission reductions with follow-up overflights. Another key finding is that many of these super emitters are highly intermittent, widely dispersed and difficult to find with conventional surface measurements that have limited coverage due to cost and logistical constraints (Cusworth et al., 2021a).
Given the major contribution of super emitters to regional methane budgets and the opportunity they present for mitigation, tools are needed that can provide global monitoring of these large, dispersed and often transient sources. Aircraft and satellite instruments optimized for point source imaging can complement area flux mapping satellites by quantifying emissions from point sources at very high (1–30 m) spatial resolution. Unlike area flux mapping satellites optimized for high spectral sampling over a narrow spectral range, many point source imagers tend to have coarser spectral sampling (5–10 nm) while being sensitive to the full Visible to Shortwave Infrared (VSWIR) spectral range of solar backscatter (e.g., 400–2500 nm) – which allows for a broader range of applications beyond trace gas sensing. Field campaigns with a class of VSWIR imaging spectrometers such as the next generation Airborne Visible/Infrared Imaging Spectrometer (AVIRIS-NG) and Global Airborne Observatory (GAO) have routinely shown that when flown at altitudes of 3–8 km, single point source CH4 emissions above 5–10 kgCH4 h−1 for 3 m s−1 wind can be detected and quantified, and their plumes can be mapped with 3–8 m spatial resolution (Frankenberg et al., 2016; Duren et al., 2019; Cusworth et al., 2021a). Those airborne instruments have also demonstrated the ability to quantify CO2 point source emissions as low as about 8000 kgCO2 h−1 (Kim et al., 2025) for a 3 m s−1 wind speed. The major benefit of such instruments is that their high spatial resolution can enable accurate attribution of observed CH4 and CO2 to plumes to specific emission sources at (and sometimes within) individual facilities. A key limitation of point source imagers is that they are primarily sensitive to discrete point sources rather than diffuse area sources and net emissions from regions. Another limitation of point source imagers is that singular instruments have limited spatio-temporal coverage, particularly aircraft surveys that are limited by logistics, cost and airspace restrictions. Individual point source imaging satellites can provide greater spatio-temporal coverage than aircraft but are still limited compared to regional flux mapping satellites. It is through the coordinated observations and analysis of data from point source imagers and regional flux mappers that truly complete, multi-scale understanding of CH4 and CO2 emissions can be obtained, have been demonstrated in previous studies (Cusworth et al., 2022; Naus et al., 2023).
1.2 Other point source imaging satellites
Building on the success of airborne campaigns, there have been considerable advances with point source imaging satellites over the past several years. GHGSat is a company that currently operates a constellation of 12 cubesats that were the first satellites to offer operational monitoring of CH4 point sources as a commercial service. Each GHGSat uses a novel Fabry-Perot spectrometer that is optimized for imaging facilities and small areas (∼ 12 km × 12 km) at 25 m resolution (Jervis et al., 2021). GHGSat reports a 50 % probability of detection of 120 kgCH4 h−1 (Jervis et al., 2022) for a 3 m s−1 wind speed although independent studies suggest more typical detection limits of about 180 kgCH4 h−1 and 2.1 % CH4 single measurement precision for average brightness scenes (McLinden et al., 2024). Although it is designed to map emissions at known facilities with rapid revisit, GHGSat is not optimized for mapping large regions because the retrieval method requires many samples over a given target to derive a single methane image.
Multi-spectral land imagers such as Sentinel-2 and Landsat-8 have also demonstrated some CH4 point source detection capability however their high spatial resolution (20 and 30 m, respectively) is offset by much coarser spectral resolution (200 nm FWHM) which translates to single measurement precisions >30 % (Jacob et al., 2022).
A broader general class of point source imagers are VSWIR imaging spectrometers. As with the AVIRIS series of airborne sensors, most current satellite VSWIR spectrometers are hyperspectral instruments designed primarily to address a large range of earth science research topics spanning terrestrial ecology and geology. These systems typically involve relatively high spatial resolution (30–60 m), moderate signal to noise ratio, and moderate spectral resolution. While swath widths of this class of instruments are typically narrower than regional flux mappers, they tend to image relatively long strips due to a pushbroom mode of operation and hence can be efficient at mapping larger regions at high spatial resolution. Most of these missions were not designed specifically to detect CH4 but many have demonstrated varying degrees of capability. For example, PRISMA, EnMAP and Gaofen-5 all report 30 m spatial resolution and spectral resolution of 10 nm full width half maximum (FWHM) (Guanter et al., 2021; Roger et al., 2024; Irakulis-Loitxate et al., 2021). The single measurement CH4 precisions of these instruments has been estimated to be 3 %–9 % (Jacob et al., 2022). NASA's EMIT instrument has 60 m spatial resolution, spectral resolution of about 9 nm FWHM, and estimated single measurement precision of 2 %–6 % (Jacob et al., 2022). Given their specifications, PRISMA, EnMAP Gaofen-5, and EMIT are anticipated to have 90 % probabilities of detection for CH4 point sources of 1000 kgCH4 h−1 or greater, however independent evaluations are still underway.
As described below, the Carbon Mapper monitoring system is designed to contribute to the growing ecosystem of methane observations by combining regional coverage, high precision, and ultimately high frequency sampling. This is enabled by the Tanager satellite constellation with higher spectral resolution and signal to noise ratio than most existing VSWIR imaging spectrometers.
1.3 Carbon Mapper monitoring system overview and objectives
Carbon Mapper has a public good mission to enable GHG emission reductions by making methane (CH4) and carbon dioxide (CO2) data more complete, actionable and accessible. We contribute to the emerging multi-scale ecosystem of global GHG observations by locating and quantifying CH4 and CO2 point sources at facility scale across key regions. While other programs are optimized for quantifying wide area methane emissions at the scale of regions and major oil and gas production basins, Carbon Mapper provides high resolution and high frequency tracking of methane and CO2 emissions of individual facilities and pieces of equipment globally. Our primary objectives are to provide actionable mitigation guidance to facility owner/operators and regulators and improve awareness of emissions across civil society. Carbon Mapper data also can be integrated with other data sets to help evaluate and improve greenhouse gas inventories and accounting frameworks in support of the Global Methane Pledge, Paris Climate Agreement, and mitigation targets of key sub-national jurisdictions. The Carbon Mapper emissions monitoring system is designed to fill critical gaps in the emerging global framework of greenhouse gas observing systems, providing actionable data at facility scale to drive leak repair efforts and hold emitters accountable. Stakeholders include US federal and state agencies and their counterparts in other countries, international data programs and registries, facility operators, development banks, non-governmental organizations, and civil society.
The Carbon Mapper emissions monitoring system includes observing platforms (Tanager satellites, aircraft, and EMIT), an operational monitoring strategy optimized for mitigation impact, and a data platform that delivers actionable, accessible, and transparent CH4 and CO2 data products for diverse stakeholders. Global scaling of this system is centered around the new constellation of Tanager satellites. The design of those satellites, along with Carbon Mapper's strategy for emissions monitoring and data platform were informed by campaigns and mitigation pilot projects using prototype aircraft sensors.
Carbon Mapper's emissions monitoring system is motivated by an overarching goal to make CH4 and CO2 super emitters visible and to deliver data to guide efforts to mitigate (eliminate or reduce) them. The system design and operations are in turn driven by our priorities of maximizing completeness, actionability, and accessibility. Completeness (also called Observing System Completeness) to be the percentage of a given population of emitters that can be detected based on an optimal balance of detection limits, spatial coverage and sample frequency (Jacob et al., 2022). Actionable means timely data delivery and notification (e.g., latencies measured in hours and days rather than months) with precise and reliable geolocation and attribution of observed CH4 and CO2 plumes to specific emissions sources. Accessible means that data is available to the largest possible set of stakeholders, is transparent and in formats that are readily understandable by a wide audience.
Carbon Mapper's monitoring strategy and the Tanager satellites are designed to optimize completeness. This metric constrains ultimate mitigation potential because characterizing a critical set of emitting infrastructure requires routine observation across large areas to identify specific leaks, equipment malfunctions and inefficient process venting. Actionability is the second major design driver. Using remote sensing to guide CH4 leak detection and repair (LDAR) action requires that high emission events can be detected and reported quickly enough so that facility operators can verify and diagnose the root cause with follow-up site visits. Some super emitter events have the potential to eclipse the normal net annual emissions of an entire facility within a few days or weeks if not detected and repaired in a timely fashion (Pandey et al., 2019). The Carbon Mapper emissions monitoring system is designed to deliver actionable information – images of emission plumes, estimated source coordinates, emission rate estimates, sectoral attribution – within 72 h of each observation. The low latency capability is enabled by the Planet's small satellite platform that includes a high-speed downlink and backhaul capability combined with low latency data processing by the Planet and Carbon Mapper data platforms. The ability to precisely and reliably geolocate and attribute observed plumes to a physical emission source is critical both for effective support of LDAR programs and quantification of high emission activity at facility-scale. Another major design driver is data accessibility, where transparent availability of quality-controlled CH4 and CO2 emissions data is intended to provide maximum support for monitoring, reporting and verification programs, measurement informed inventories, and improved situational awareness for a diverse audience of stakeholders.
2.1 Emissions monitoring strategy
Mitigation potential is ultimately constrained by the fraction of emissions from a given population that can be observed. Our system is designed to provide sustained operational monitoring of the world's CH4 and CO2 super emitters at facility scale. In doing so, our program complements and leverages other key CH4 and CO2 observing systems, such as S5/TROPOMI, GOSAT-GW, OCO-2, OCO-3, etc., that provide critical insights into net regional emission fluxes including the contributions of diffuse area sources. At the same time, a key element of our strategy is scalability and continuity of the Tanager constellation which is strongly dependent on available financing for assembly, launch and sustained operation of the satellites. This is enabled by Planet's use of Tanager to support a broad portfolio of environmental indicators beyond CH4 and CO2 (e.g., various land surface variables) that are derived from hyperspectral imaging across the full VSWIR spectral range. As a result, a large fraction of Tanager tasking capacity is allocated to observing known CH4 and CO2 emitting regions identified by Carbon Mapper and the remainder is allocated to either commercial CH4 services, other hyperspectral applications, and/or maximizing coverage of land areas. A general operating rule for Tanager is to “always be imaging” – meaning the satellite will image targets of opportunity over land when not in conflict with other tasking priorities or completely overcast conditions. Regardless of which application motivates tasking of a given area, Carbon Mapper processes every Tanager image to quantify and publish any CH4 and CO2 emissions that are detected.
There are no formal specifications of super emitter populations that span all emission sectors and processes, but to guide our strategy we have established a reference distribution of emitters informed by empirical field campaigns, emission inventories, and analysis of Geographical Information System (GIS) datasets. For CH4, we use findings from aircraft remote sensing surveys covering over half of US oil and gas production and over 250 landfills across multiple regions, jurisdictions, and time scales (Duren et al., 2019; Cusworth et al., 2024). The aircraft measurement methods used in those studies typically offer a 90 % probability of detection limit of 10–45 kg h−1 for 3 m s−1 wind speeds based on single-blind controlled release testing (El Abbadi et al., 2024; Ayasse et al., 2023). Additionally, a synthesis analysis combined nearly 1 million empirical measurements from those and other aircraft surveys with similar detection limits to construct a statistical model of all emissions >0.1 kg h−1 for major US oil and gas basins and found that 20 %–80 % of total emissions come from a relatively small population of sources emitting >100 kgCH4 h−1 (Sherwin et al., 2024). Hence, we set 100 kgCH4 h−1 as a reference definition for a CH4 super emitter. The same threshold was adopted by the US Environmental Protection Agency's Super Emitter Program and Greenhouse Gas Reporting Rule for the oil and gas sector (US EPA, 2024a, b). Similarly, for CO2, previous empirical studies and emission inventories indicate that 90 % of fossil fuel power plant emissions come from plants emitting >100 000 kgCO2 h−1 (Cusworth et al., 2021b). Hence, we adopt this as our definition of a CO2 super emitter.
Effective emissions monitoring strategies rely on multiple variables and so to provide quantitative guidance for optimization, we apply the Observing System Completeness (C) metric, defined as the fraction of a reference population of emitters that can be detected by a constellation of satellites as a function of detection limit (CD), spatial coverage (CS), and temporal sampling (CT) (Jacob et al., 2022).
Providing a detailed treatment of Completeness, particularly a robust treatment of the analysis that addresses satellite constellation design to optimize spatial coverage and temporal sampling in the presence of considerable spatio-temporal variability in emission source populations, is beyond the scope of this paper and will be covered in a separate manuscript. However, because CD is driven by single satellite performance we elaborate on it here.
CD describes the fraction of a given population that exceeds the detection limit of the instrument and retrieval algorithms. CD is constrained by spatial resolution and single measurement precision for a specified emissions distribution and set of environmental conditions – primarily albedo, solar zenith angle, and wind speed. To achieve an optimal CD we use the findings from the field studies described above to set a goal of 90 % empirical probability of detection (POD) for point sources ≥100 kg h−1 for CH4 and ≥ 100 000 kg h−1 for CO2. A related approach for specifying detection limits is to define a Minimum Detection Limit (MDL) – a flux above which a detection could be considered confident. Historically MDL has been calculated analytically from the measurement noise based on key instrument parameters such as spectral, radiometric, and spatial performance. The simplicity of this calculation made it helpful in defining system requirements. Here, in contrast, our empirical POD standard is calculated from controlled release experiments. This makes it a more robust metric as it accounts for not just the instrument design on a per-pixel basis, but also the real-world imaging conditions with complications such as turbulence, surface clutter, and other effects that are difficult to model, along with the complete observational and analysis workflow. The empirical POD is more representative of the range of actual detection rate under real world conditions. However, it requires empirical evaluation of an as-built instrument and data analysis system spanning a range of emission rates using controlled release experiments and/or coordinated observations of a population of sources with independent measurement systems. We are currently working to establish an empirical 90 % POD for Tanager methane data using a variety of methods which is anticipated to require a full year to collect enough coordinated observations. Meanwhile, to guide Tanager requirements during design and development we used airborne data collected from past field experiments to establish a linear relationship between the empirical 90 % POD and analytical MDL following methods described by Ayasse et al. (2023). For a 90 % empirical POD of 90 kgCH4 h−1 we estimated an equivalent MDL of 63 kgCH4 h−1 for Tanager's highest sensitivity imaging mode. That MDL target was used to set single measurement precision requirements and relate them to key instrument parameters such as spectral sampling, SNR, and spatial resolution. In addition to instrument design, SNR also varies with environmental factors such as surface albedo and solar zenith angle, both of which in turn can vary with latitude and season. Our analysis and on-orbit validation of single measurement precision and MDL is described in Sect. 4.
2.2 Instrument
Since 2016 studies with aircraft imaging spectrometers such as the Airborne Visible/Infrared Imaging Spectrometer (AVIRIS) series and Global Airborne Observatory (GAO) as well as research satellites have led to the publication of over 15 000 CH4 plumes to date (e.g., Thompson et al., 2015; Frankenberg et al., 2016; Duren et al., 2019; Cusworth et al., 2022; Thorpe et al., 2023; Cusworth et al., 2024) as well as initial CO2 point source studies (Thorpe et al., 2017; Cusworth et al., 2024). Pilot projects have used AVIRIS-NG and GAO and, more recently, analysis of data from NASA's EMIT (Earth Surface Mineral Dust Source Investigation) instrument on the International Space Station (ISS) – to demonstrate the utility of this technique for actionable geolocation and quantification of methane point source emissions. However, none of those instruments were designed for greenhouse gas sensing. Deploying a truly operational point source imager in space with improved area coverage while minimizing CH4 and CO2 detection limits introduced some design challenges, e.g. the instrument must provide increased light gathering power without sacrificing spectral sampling or spectral range. Preserving the full VSWIR spectral range rather than developing a spectrometer narrowly focused on the SWIR bands is necessary given the need to underpin the expansion and continuity of the Tanager constellation with commercial revenue for environmental data products that extend beyond CH4 and CO2 to serve a wide range of land and ocean hyperspectral applications.
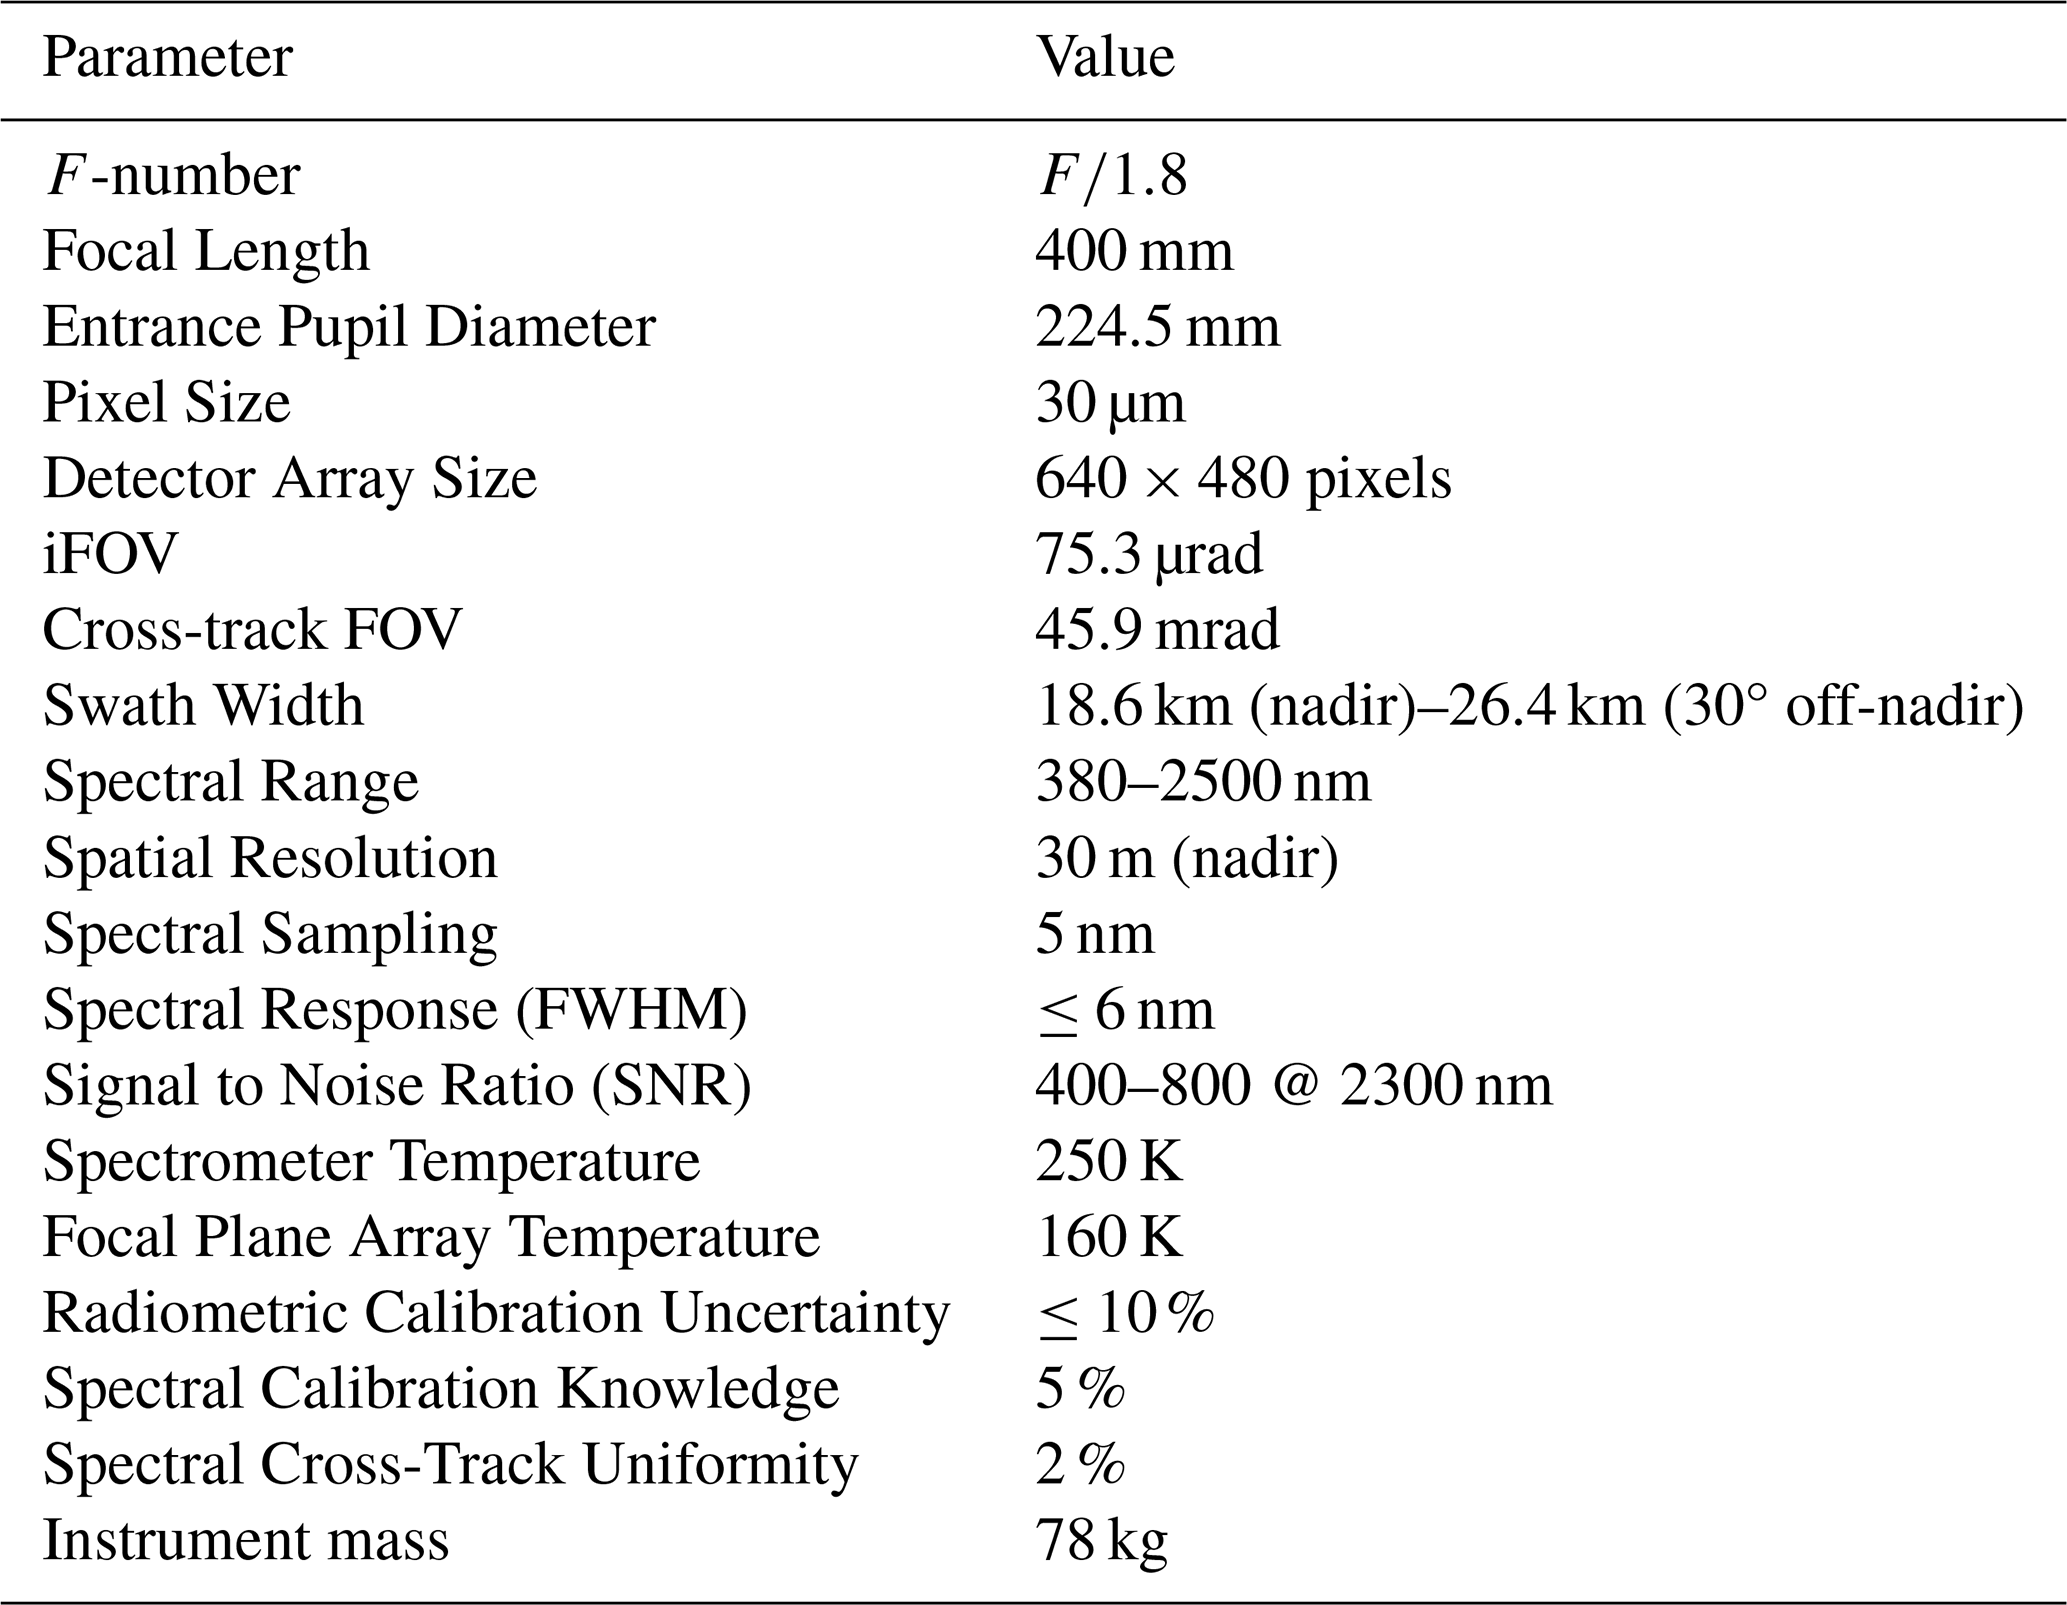
Practically, this means that each Tanager imaging spectrometer instrument must have a detector sensitive to a wide spectral range, with large pixels which can efficiently collect many photons. It must also have a small focal ratio, or f-number, for maximum light-gathering power and high signal to noise ratio (SNR). It must have a fine spatial resolution, so that individual CH4 or CO2 emission plumes can be geolocated precisely enough for facility operators to quickly find and verify with follow-up site visits (e.g., within about 30 m). The instrument must also have a sufficiently wide swath and along-track imaging capability to efficiently map large oil and gas production fields, major urban areas, and other priority regions for CH4 and CO2 point source emissions that can occur in a stochastic fashion. The key instrument parameters that resulted from these design trade-offs are summarized in Table 1. The swath width values shown here are for the final operational orbit altitude of 406 km; these values are ∼ 30 % higher during commissioning operations for a typical initial injection orbit of 510 km. Currently, the average orbit altitude is 430 km and the swath width is approximately 20 km.
Table 1Imaging spectrometer instrument specifications for a 406 km orbit altitude.
The resulting Tanager instrument design leverages four iterations of previous imaging spectrometer development and refinement by the Jet Propulsion Laboratory, including instruments such as the Airborne Visible/Infrared Imaging Spectrometer (AVIRIS) series of airborne instruments, the Moon Minerology Mapper, and most recently, the EMIT instrument on the International Space Station. EMIT achieved first-light on 28 July 2022, with excellent uniformity and calibration, meeting all performance requirements (Thompson et al., 2024). With a 60 m spatial resolution, 7 nm spectral sampling, low inclination orbit and no ground motion compensation, EMIT is not optimized for greenhouse gas monitoring. However, EMIT has already provided a demonstration of CH4 and CO2 plume detection and quantification (Thorpe et al., 2023) and Carbon Mapper's data platform has been routinely publishing those products to exercise workflow and quality control procedures in preparation for the Tanager satellites.
The instrument design is summarized in Supplement Sect. S1. Instrument specifications are summarized in Table 1 and have been validated by a combination of lab tests and on-orbit measurements. The instrument design achieves excellent spectral uniformity, with keystone and smile each <5 % (Zandbergen et al., 2022). Optimal performance requires good radiometric and spectral calibration uncertainty which the instrument design constrains to <10 %. The optics and baffling provide out of field stray light rejection by limiting detector illumination from extended field light sources to less than or equal to 10 % of the input image irradiance. Each instrument has a 2.589° usable cross-track field of view (FOV) and 75.3 micro-radian cross-track instantaneous FOV (iFOV), translating to an approximately 19 km wide swath at nadir (up to 26 km with 30° off-nadir viewing) at the target science altitude of 406 km. Note that the swath width is initially nearly 30 % larger during commissioning operations due to the higher injection orbit, typically around 510 km. The instrument spectral range is about 380 to 250 nm with 5 nm spectral sampling set by the focal plane array size and spectrometer design. The spectral response function is iteratively tuned during/after instrument cold alignment testing and the verified on-orbit median values for Tanager-1 are 5.5 nm full-width half-maximum (FHWM) across the spectral range, approaching the 5 nm sampling in the critical SWIR bands (Fig. S2). The spectrometer is optimized for high SNR, particularly in the CH4 absorption band between 2100 and 2430 nm (Fig. S3).
The instrument is hosted by Planet's Tanager smallsat platform which provides power, precision pointing and high speed data storage and downlink, further described in Sect. S2.
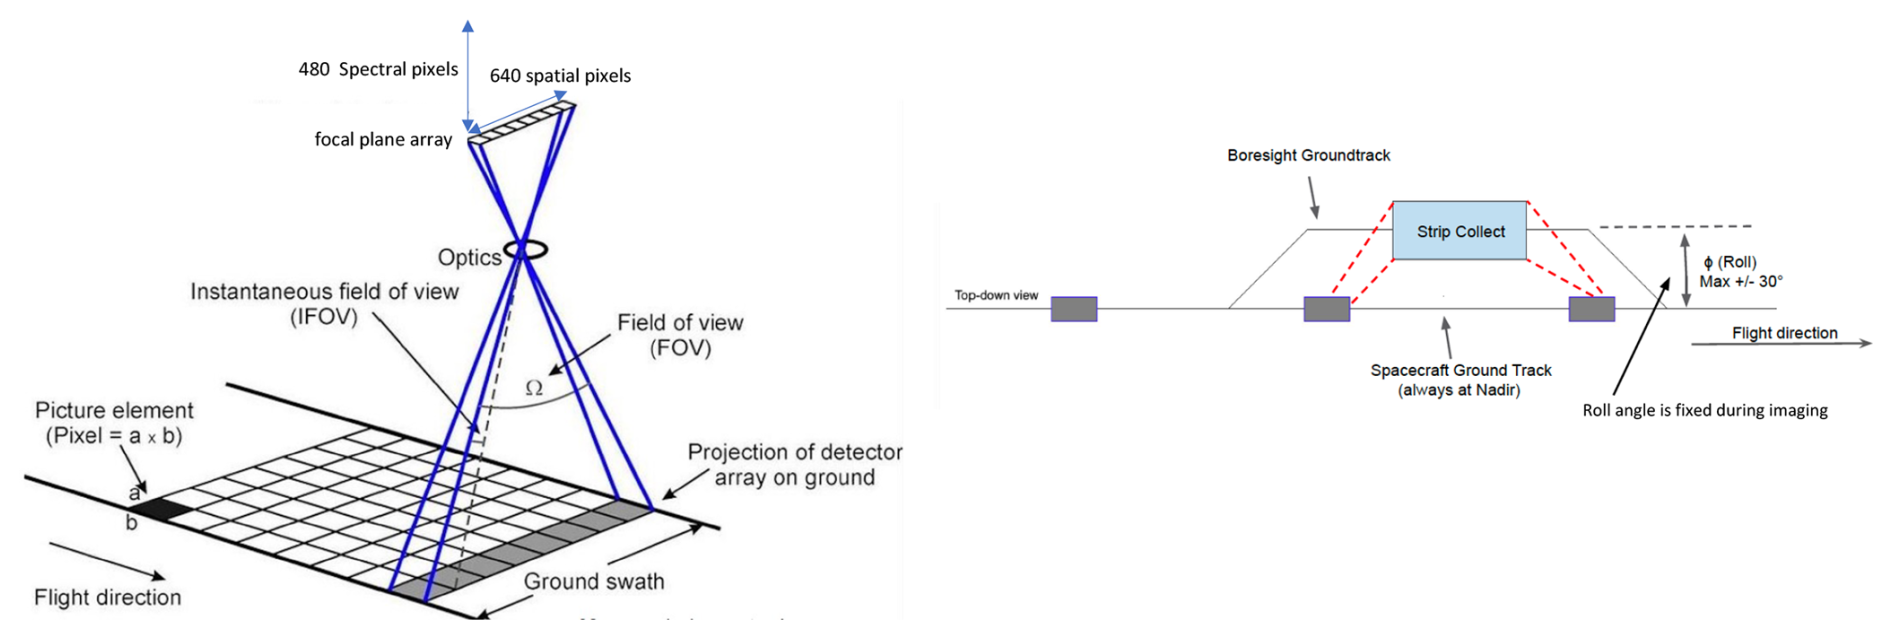
Figure 1Observing geometry. (Left) Conceptual illustration of the instrument Field of View (FOV). The swath width is set by the focal plane array's 640 cross track spatial pixels projected onto the earth below the satellite. The spectrometer disperses light across the 480 spectral pixels in each line as the satellite forward motion images the earth. (Right) Top-down view illustrating Tanager's ability to roll in the cross-track direction (nominally up to ±30 °) to image strips to the left or right of the nadir ground path.
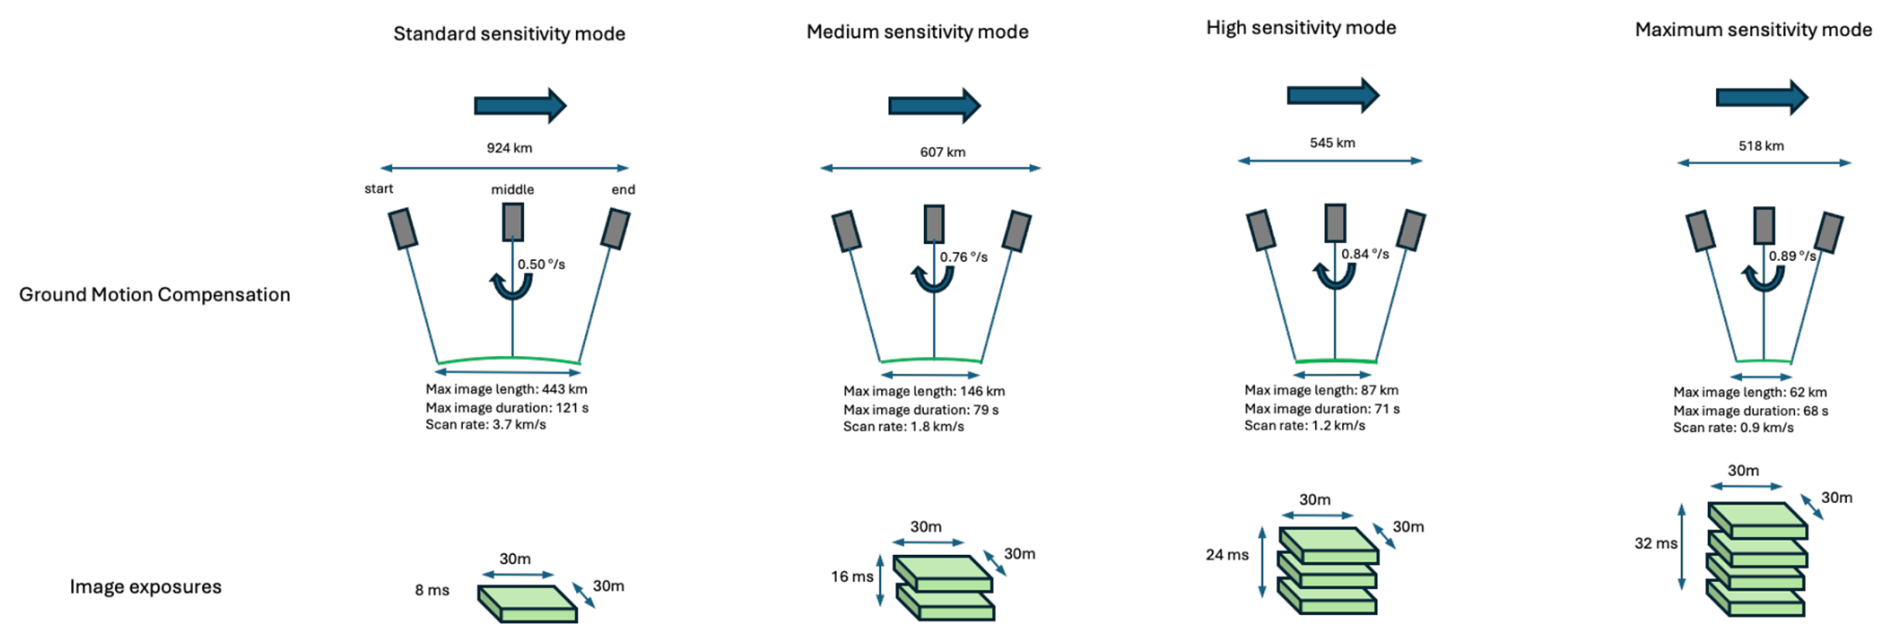
Figure 2Tanager standard imaging modes for 406 km altitude orbit. For each mode, the Tanager satellite back-nods with a given angular rate over some distance to provide ground motion compensation. The top part of the figure indicates satellite orientation at the start, middle and end of an image acquisition. The bottom part of the figure indicates the footprint of a single pixel for the specified number of 8 ms exposures. The range of imaging modes provides flexibility to trade between along-track spatial coverage and effective integration time for each image by selecting varying degrees of ground motion compensation. From left to right: standard sensitivity (single exposure) with 443 km maximum image strip length, medium sensitivity (two stacked exposures) with 146 km maximum strip length, high sensitivity (three stacked exposures) with 87 km maximum strip length, and maximum sensitivity (4 stacked exposures) with 62 km maximum strip length. Single image areas range from 346 to 8240 km2 and the along-track spatial resolution is preserved in each of these modes. The maximum strip lengths and areas shown here increase by about 15 %–20 % for a 430 km altitude orbit.
2.3 Orbit and Imaging Modes
Each Tanager satellite is launched into a near polar Sun Synchronous Orbit (SSO) with a goal of achieving an optimal local time of the descending node (LTDN) or crossing time at the equator between 1100 and 1300 h. This ensures consistent and maximum daylight illumination for spectroscopic observations. The initial injection altitude varies by individual launch but is typically around 510 km. Each Tanager satellite uses electric propulsion to maneuver to the final operational altitude of 406 km and then maintains operational altitude over the 5-year design life. For example, Tanager-1 was launched into an initial 510 km altitude orbit with an initial LTDN of approximately 1040 h. Tanager-1 was subsequently maneuvered into an interim orbit with a 430 km average altitude by January 2025 with a goal to complete maneuvering to the target 406 km and 1200 LTDN later. The final orbit parameters are selected to provide an optimal balance between SNR, spatial resolution, FOV and global access. By deploying multiple satellites with differing orbital planes and crossing times we can better constrain the variability and intermittency of emission sources.
The observing geometry of each Tanager satellite is described in Fig. 1. The imaging spectrometer is a pushbroom sensor where the image swath width is set by the instrument iFOV, 640 cross-track (spatial) elements of the focal plane, and the degree of off-nadir pointing. Our primary observing strategy leverages the agility of the Tanager satellites to provide cross-track imaging of strips, nominally up to ±30° left or right of the nadir ground track. This is done by rolling the satellite to a fixed off-nadir angle prior to imaging. The length of each image is set by the imaging mode.
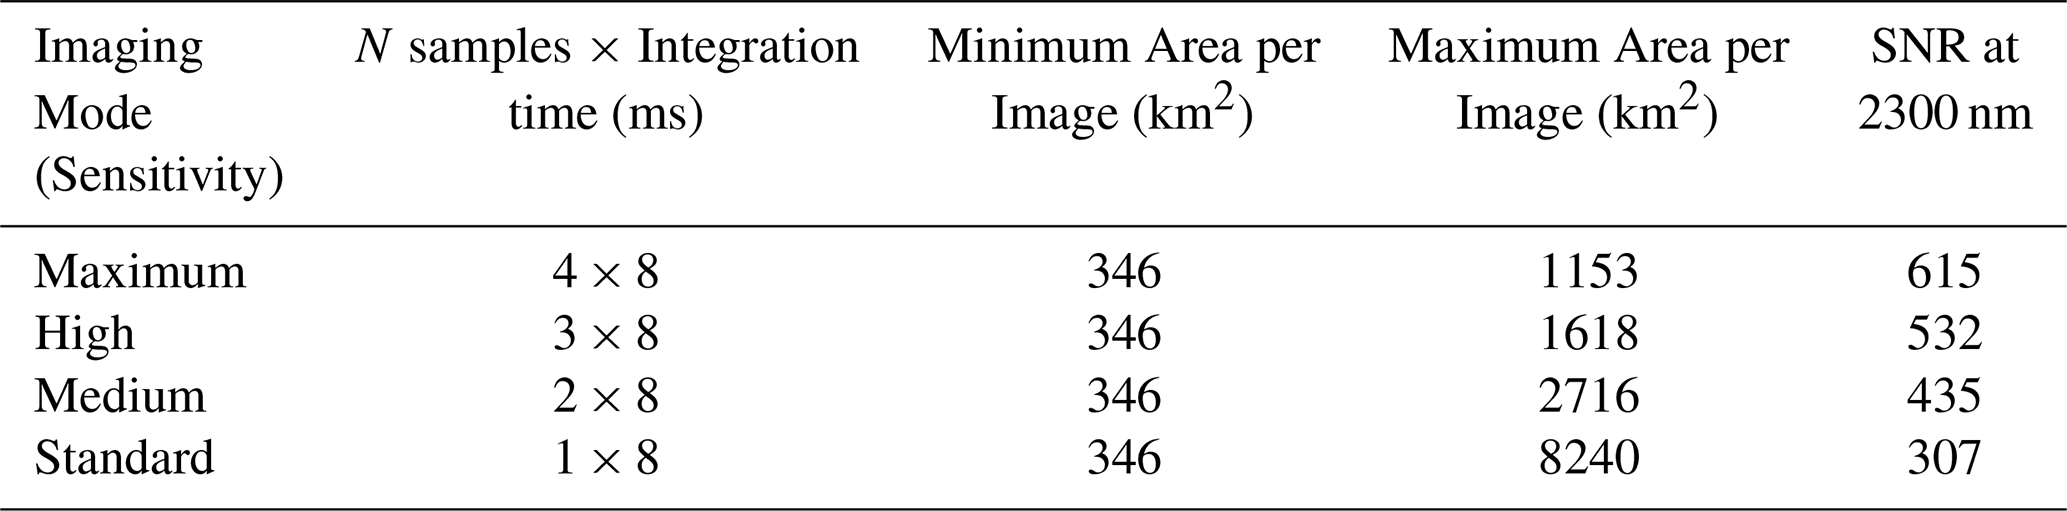
As summarized in Fig. 2 and Table 3, Tanager offers four standard imaging modes ranging from 1 to 4 exposures per surface footprint. Tanager satellites offer ground motion compensation (GMC) by back-nodding in the along-track direction to offset the orbital rate during an image exposure. This prevents along-track pixel stretch while enabling multiple exposures of a surface footprint. Since the instrument is shot noise limited, the effective SNR scales with where N is the number of exposures. For example, using the instrument standard 8 ms integration time per exposure, GMC allows up to 4 exposures to be acquired of the same surface footprint, where image stacking results in an effective integration time of about 32 ms and SNR about twice that of a single 8 ms exposure. Increasing the number of exposures increases SNR at the expense of decreasing along-track strip length and hence image area. Single image areas range from 346 to 8240 km2. This provides flexibility for trading off detection limit versus area coverage when designing an observing strategy for a given region, emission sector, or stakeholder use-case. Similar to EMIT and other airborne and satellite imaging spectrometers (but not shown in Fig. 2), the Tanager satellites are also capable of operating in pure nadir-viewing push-broom mode that allows image captures as long as 1080 km but doing so results in pixels that are 60 m along track, with lower effective SNR, and less efficient sampling.
Table 2Summary of integration time, spatial coverage, and SNR in the 2300 nm methane band (assuming a 25 % albedo and 35° solar zenith angle) for the primary imaging modes at an altitude of 406 km. For each mode, area coverage is adjustable by selecting the along-track image length. Standard (1×8) imaging mode is planned for most ocean glint observations however the maximum image area will typically be constrained by the size of the sun glint spot.
Given that 30 % of global oil and gas production occurs in offshore environments any complete monitoring system must be capable of assessing emissions from production platforms, drilling ships and related infrastructure. Previous aircraft studies indicate that the magnitude, intensity and persistence of CH4 emissions in some offshore environments exceed what is routinely seen in onshore production (e.g., Biener et al., 2024; Gorchov Negron et al., 2023; Ayasse et al., 2022). Tanager satellites are designed to conduct sun-glint observations over the ocean. This is critical for detecting methane emissions from offshore oil and gas platforms and potentially tanker vessels given that the ocean is dark at SWIR wavelengths. Aircraft prototyping indicates that sufficiently agile platform pointing and advance planning can align the instrument line of site with the bright specular sun-glint spot and infrastructure of interest (Ayasse et al., 2022). Tanager sun-glint observations typically use Standard imaging mode. In addition to the normal constraints for task planning for onshore targets, specular conditions for glint additionally require that the following two geometrical conditions are satisfied. (1) The elevations subtended by the spacecraft and the Sun are equal. (2) The Sun and Satellite are on the opposite sides of the target, i.e., the relative azimuth between the satellite and sun is 180°. The number of imaging opportunities for ocean glint spots is more restricted than for land observations given the need to align the sun-glint spot over areas of interest. For example, a maximum duration land observation in Standard imaging mode is 126 s or 443 km along track but most sun-glint observations will be limited to about 53 km along track. While Tanager-1 is demonstrating the successful application of sun-glint observations, we have not yet transitioned to operational offshore mapping.
Following launch, each Tanager satellite undergoes a commissioning phase that lasts several months and includes activation and checkout of spacecraft and instrument subsystems, a first light campaign to evaluate initial spectrometer performance at the injection altitude, followed by several months of propulsive maneuvers into the final lower orbit where calibration and validation efforts are completed prior to transition into steady state operations.
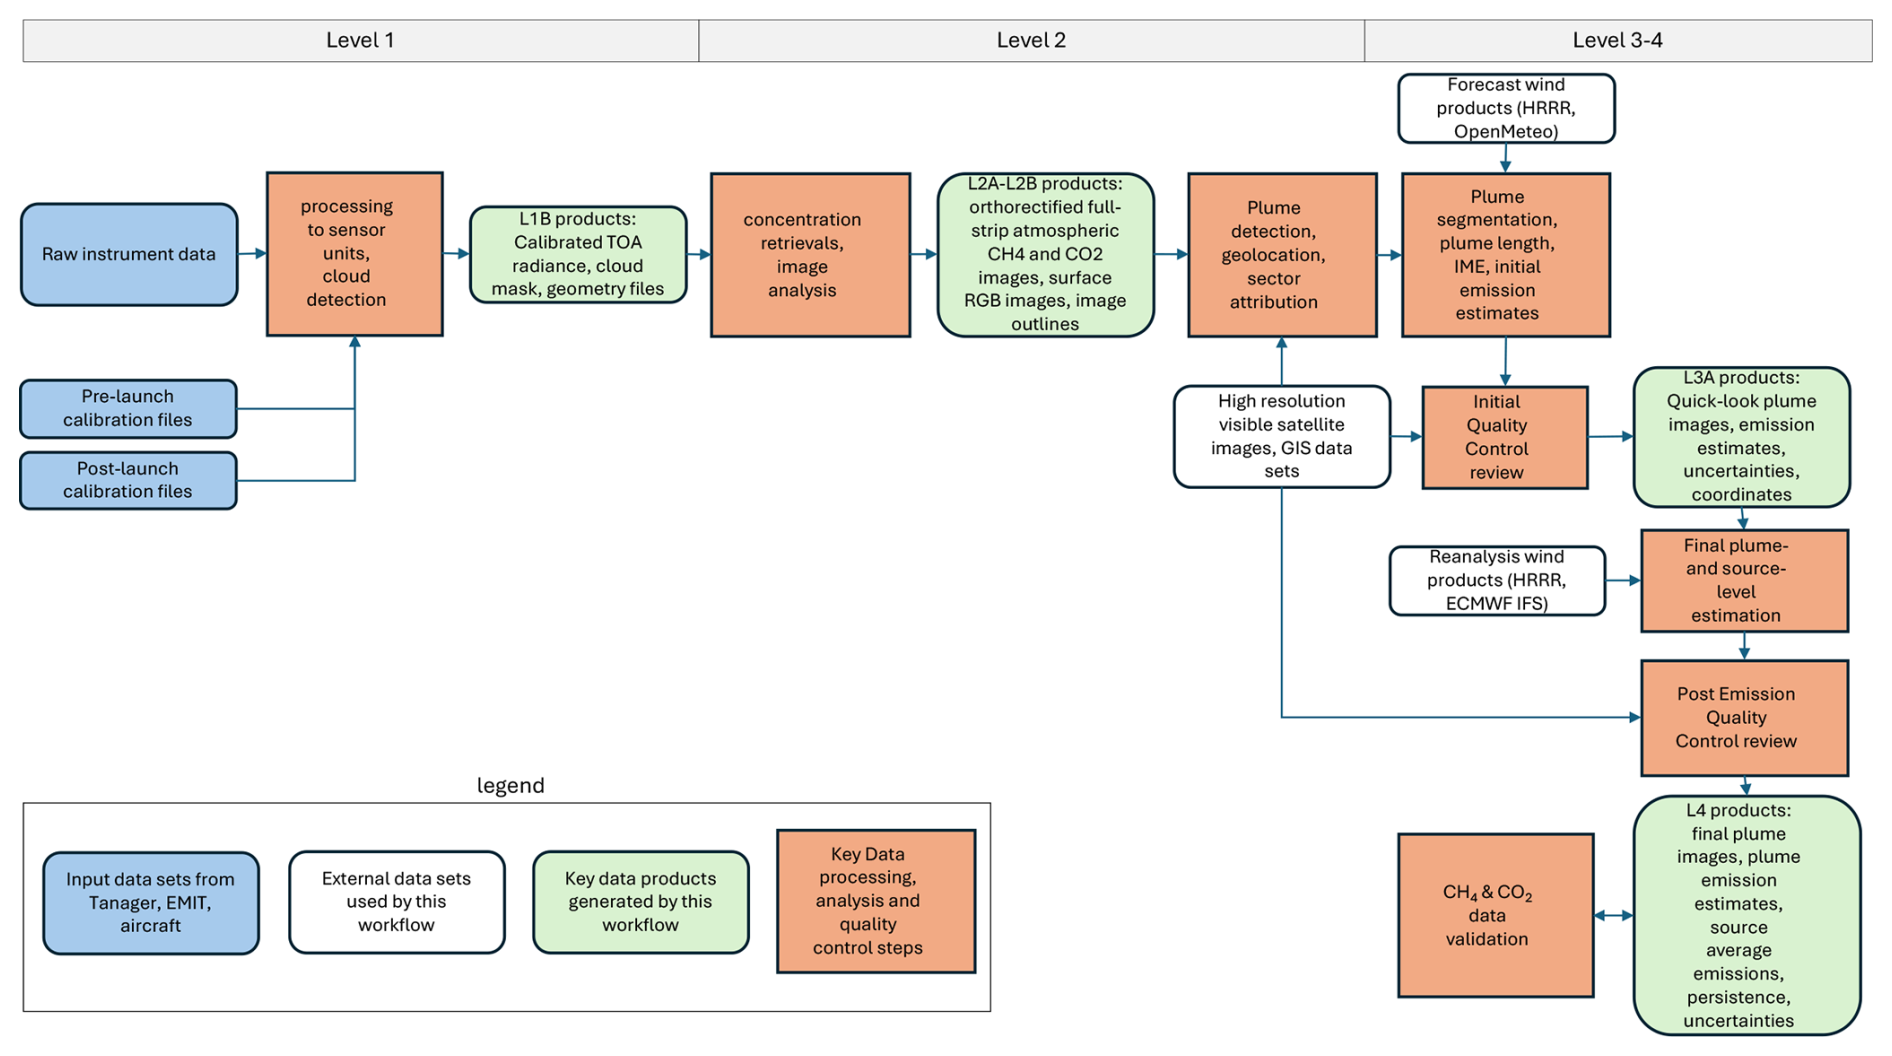
Figure 3Carbon Mapper data analysis workflow applied to Tanager, EMIT and aircraft observations.
2.4 Data platforms and products
The focus here is on data processing applied to Tanager observations however the same basic procedures for generating calibrated radiance (Level 1) products are applied to the aircraft and EMIT observations used by the Carbon Mapper emissions monitoring system. Carbon Mapper retrievals, plume detection, emission estimation and quality control procedures are also uniformly applied to Tanager, EMIT and aircraft data to generate Level 2–4 CH4 and CO2 data products. Figure 3 summarizes the operational data analysis workflow for CH4 and CO2 emissions.
For Tanager observations, Planet's data platform generates the Level 1 data product that consists of georectified radiance files that are delivered to Carbon Mapper's data platform for retrieving CH4 and CO2. This process begins with Planet's data platform receiving raw data from the Tanager satellites via the Smallsat Platform high speed downlink and backhaul. The raw images are first orthorectified using a combination of digital elevation data and a full state model that is iteratively refined using a set of globally distributed ground-controlled points derived from reference imagery (e.g., Landsat 8). The combination of this approach with pointing telemetry from the spacecraft enables rectification accuracy well below the 30 m (CE90) requirement.
Planet conducts pre- and post-launch calibration of each payload to quantify spectral, radiometric, spatial and uniformity characteristics. The calibration and characterization of the Tanager instruments is based on procedures developed by JPL that have been refined and proven over more than 30 years including those successfully demonstrated with the AVIRIS series of airborne instruments and the EMIT mission (Thompson et al., 2024). These procedures allow raw sensor digital numbers (DN) to be converted to physical sensor units. The result is a calibrated Top Of Atmosphere (TOA) radiance hypercube for each image. Additionally, the Planet data platform generates a cloud mask to support Level 2 processing. Level 1 processing is further described in Sect. S3.
For Tanager observations, the Carbon Mapper data platform uses calibrated radiance files delivered by Planet to derive several Level 2 data products. The L2 image outline products are the geographic boundaries, or “strips” of areas imaged by the Carbon Mapper Coalition satellites. Strip image outlines are helpful for determining where data is collected, the quality of that data, and verifying when methane or carbon dioxide sources are imaged, but no emissions above our detection limit were observed. In optimal observing conditions, such as an unobstructed view of the emission source and a high likelihood of detection, the absence of detection is termed a “null detect”. The null detects imply that the source is not emitting methane above the sensor's minimum detection limit. We consider an image to be a good candidate for a null detect status for an emission source if the image contains less than 25 % cloud cover and intersects any of the plume origin points estimated for the source. All Tanager L2 products are resampled to 30 m resolution. A summary of key Level 2–4 CH4 and CO2 data analysis steps is provided here with more detailed information in Sect. S4.
2.4.1 L2A Reference basemap images
L2A products are three-band (red-green-blue), natural color images of the Earth's surface generated from Tanager radiance files. This process involves correcting for atmospheric effects, geometric distortions, and terrain variations to produce accurate and visually appealing representations of the Earth. Carbon Mapper's operational workflow includes the use of Planet's Planetscope 5 m resolution visible band images that are updated globally on a monthly cadence. In cases where Tanager's 30 m spatial resolution is not sufficient to clearly identify the sector/facility type, Carbon Mapper may request high resolution (<1 m) visible band tasking from Planet's SkySat satellites. Carbon Mapper analysts use the various visible band image products and GIS data sets to help support attribution of observed CH4 and CO2 plumes to specific emission sectors, facilities, and, where possible, equipment types.
2.4.2 L2B Atmospheric retrievals
L2B products consist of orthorectified full-strip atmospheric retrieval images derived by the Carbon Mapper data platform from L1B calibrated radiance files to retrieve column or concentration length CH4 enhancements (units ppm m) in the strong methane SWIR band between 2200–2400 nm and concentration length CO2 enhancements between 1900–2100 nm. We use algorithms that build on experience gained from previous airborne surveys with the AVIRIS-NG and GAO imaging spectrometers and analysis of EMIT data. Specifically, the Carbon Mapper operational workflow uses a column-wise matched filter algorithmthat seeks an estimate for concentration length enhancement of CH4 or CO2 for each observed spectrum (Thompson et al., 2015, 2016).
2.4.3 Plume Detection
A point source is defined as the geographic location from which emissions originate that results in a highly concentrated plume of CH4 or CO2 gas in the atmosphere. Plumes are an excess mass of concentration in the atmosphere produced by a specific source. Plumes from point sources are a subset of a broader class of CH4 or CO2 enhancements that may occur anywhere in the atmosphere as a result of point source and/or diffuse area sources that may or may not be co-located with the enhancements (e.g., a “cloud” of enhanced CH4 can appear in the atmosphere some distance downwind of the actual source). This is a critical concept: not all observed atmospheric enhancements are the result of a point source emission nor can those enhancements be reliably attributed to a specific emission source. Therefore, Carbon Mapper point source detection and quality control procedures require that any detected atmospheric plume must be related to a credible point source on the earth's surface before reporting. Any observed enhancements that fail to meet quality control (QC) checks are noted for potential follow-up study but do not result in published plumes or emission rate estimates.
The Carbon Mapper point source detection process relies on concentration retrievals (CH4 and CO2 band images), visible red-green-blue (RGB) imagery from various observing systems, GIS data sets, and meteorological data. The process begins with automated application of CH4 and CO2 retrieval algorithms to every calibrated radiance strip image generated by a satellite or airborne sensor. This results in grayscale CH4 and CO2 band images that first undergo strip image level QC review by human analysts. This review includes determination of systematic issues affecting the entire strip image, including retrieval processing problems, atmospheric artifacts (high haze, clouds, smoke, etc), geolocation issues, or excessive noise. Each image's CH4 and CO2 band images are then reviewed to detect potential point source plumes along with geolocation of their likely origins.
2.4.4 Plume Segmentation
Following detection, Carbon Mapper implements an automated plume segmentation and delineation process on identified and geolocated plumes. This process separates the background from enhanced CH4/CO2 pixels to create a masked plume boundary that is used for mass and emission quantification.
2.4.5 Plume Emissions Quantification
For emissions quantification, we apply the Integrated Mass Enhancement (IME) approach, which calculates the excess mass in units of kilograms emitted to the atmosphere from a source (Thompson et al., 2016). We calculate an emission rate Q using the IME, plume length, and surface wind speed.
where i refers to a single plume pixel, P is the number of pixels in the segmented plume mask, Ω is the concentration enhancement of that pixel, α is a unit conversion scalar (from ppm m to kg m−2), and A is the area of that pixel (m2). We calculate an emission rate Q using the following relationship (Duren et al., 2019):
where U is the 10 m wind speed (m s−1) and L is the plume length (m). Here U is taken from the HRRR 3km, 60 minute reanalysis product for observations within the U.S. and the ECMWFIFS 9 km product outside the U.S. Forecast versions of these products may be used for initial quick-look processing given standard latencies in receiving reanalysis products. In Eq. (3), L is estimated as the maximum distance along the segmented plume's convex hull. For plumes covering large spatial distances, we impose a distance constraint such that the segmented plume mask is clipped to not exceed a 2500 m radial extent from the origin of the plume. Therefore, . The IME (Eq. 2) is also only calculated within this clipped plume mask. This clipping procedure is employed to reduce bias that may affect IME quantification due to differing surface and meteorological conditions across large plumes, intermittency of the emission rate of the source, and to limit potential merging of multiple plumes downwind of their sources. Uncertainty quantification is described in Sect. S4.
2.4.6 Quick look products
Carbon Mapper's workflow generates quick-look data products with a mean latency of <36 h following each observation. The quick-look product generation process includes a round of initial QC review by human analysts that generates quality flags for each plume that includes but are not limited to:
Strip image-level quality attributes
-
Image artifacts [column, glint, flare, contrast, other]
-
Low signal-to-noise flag
-
Atmospheric artifacts [clouds, smoke, haze, other]
-
Cloud cover fraction [0, 25, 50, 75, 100] or [0–1]
Plume-level quality attributes
-
Overall rating (Good, Questionable, or Bad)
-
plume shape flag
-
artifacts intersect plume flag
-
flare flag
-
high background enhancement flag
2.4.7 Final Processing and Publication
Following generation of quick-look products, Level 4 processing proceeds with additional QC review of the initial emission estimate and additional processing including the use of reanalysis products in place of forecast wind fields. In some cases where there is high confidence in a plume detection but there are concerns with the fidelity of the emission estimate, Carbon Mapper will publish the plume image and coordinates but without an emission estimate. In addition to delivering final version of plume-level images, emission estimates, uncertainties and sector attribution, Level 4 processing includes aggregating a time-series of plumes to a specific emission source on the earth's surface and calculating persistence-adjusted average emission rates for that source following methods described in Cusworth et al. (2021a). The resulting plume raster images and tabular information on emission rates, plume/source coordinates, sector attribution, detection dates/times, source persistences, and associated uncertainties as well as our Level 2 strip-image level products are published via Carbon Mapper's public data portal and available for API and bulk download 30 d following each Tanager observation. Additional Carbon Mapper documentation including our Data Product Guide, Algorithm Theoretical Basis Documents, and Quality Control Description Document are available in the Technical Resources section of our website (https://carbonmapper.org/resources/technical-resources, last access: 16 November 2025).
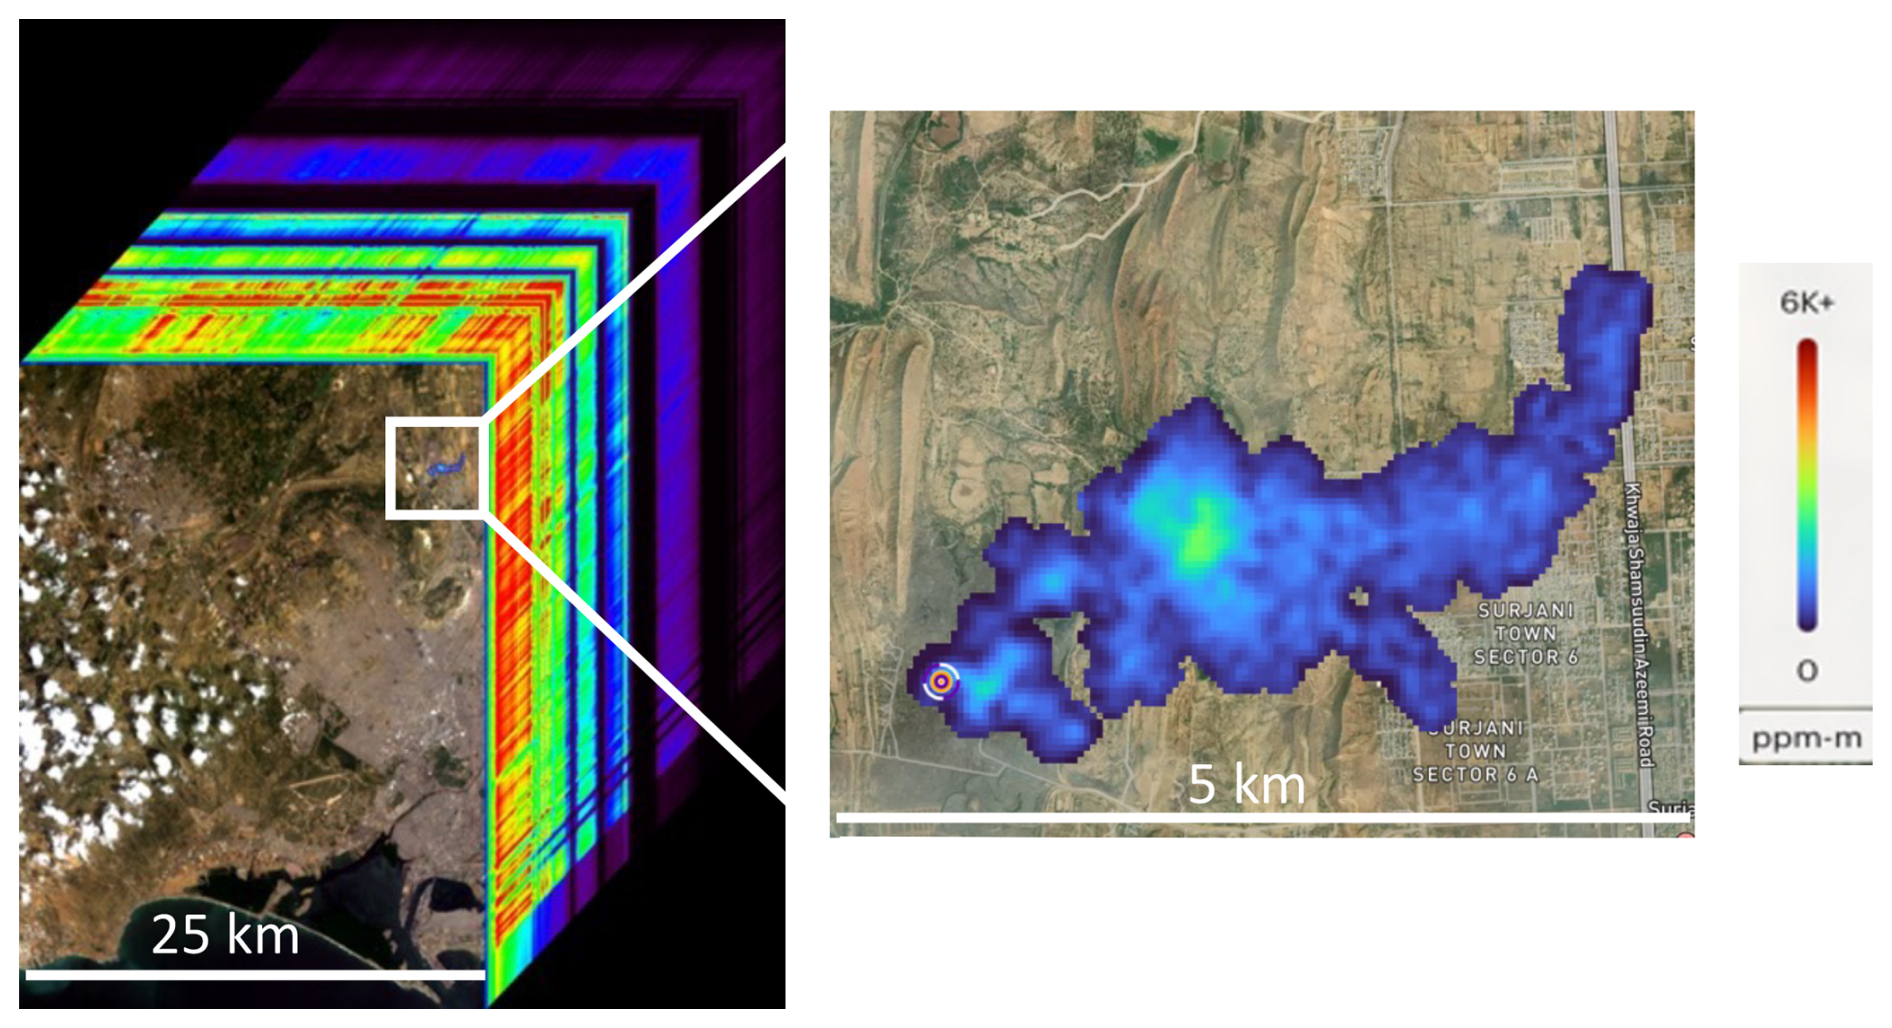
Figure 4(Left) Hyperspectral data cube from Tanager-1 first light observation of Karachi, Pakistan on 16 September 2024, one month after launch. (Right) The first CH4 plume detected by Tanager-1 at a waste dump within the same image, overlaid on a non-contemporaneous Planet high resolution Skysat visible image. The estimated emission rate is 1600 ± 300 kgCH4 h−1. The plume was detected and quantified within 12 h of the observation.
Here we present an initial demonstration of key system capabilities using observations acquired during the first seven months of Tanager-1 operations following instrument activation. After a month of spacecraft and instrument initialization and checkout, a First Light Campaign was conducted between September and December 2024. During this time the satellite orbit was gradually lowered from an average altitude of about 510 to 430 km – resulting in an instrument FOV and spatial resolution that was initially 6 %–26 % larger than that planned for the final operational orbit. The temporally coarser spatial resolution translated to CH4 and CO2 detection limits somewhat higher than expected for nominal operations. During the First Light Campaign, imaging was limited to about 1 observation per orbit on average, most observations were conducted in the Standard (lowest) sensitivity imaging mode, and the length of each image was significantly shorter than available in nominal operations. Despite these limitations, this provided an opportunity to exercise the critical satellite subsystems and enabled a preliminary assessment of the end-to-end performance of the Carbon Mapper emissions monitoring system. Starting in January 2025, Tanager-1 began a multi-month transition to steady state operations, with a steady ramp-up in image size and number of daily observations as well as increased use of Maximum sensitivity imaging mode. This paper includes some early results from this transition phase.
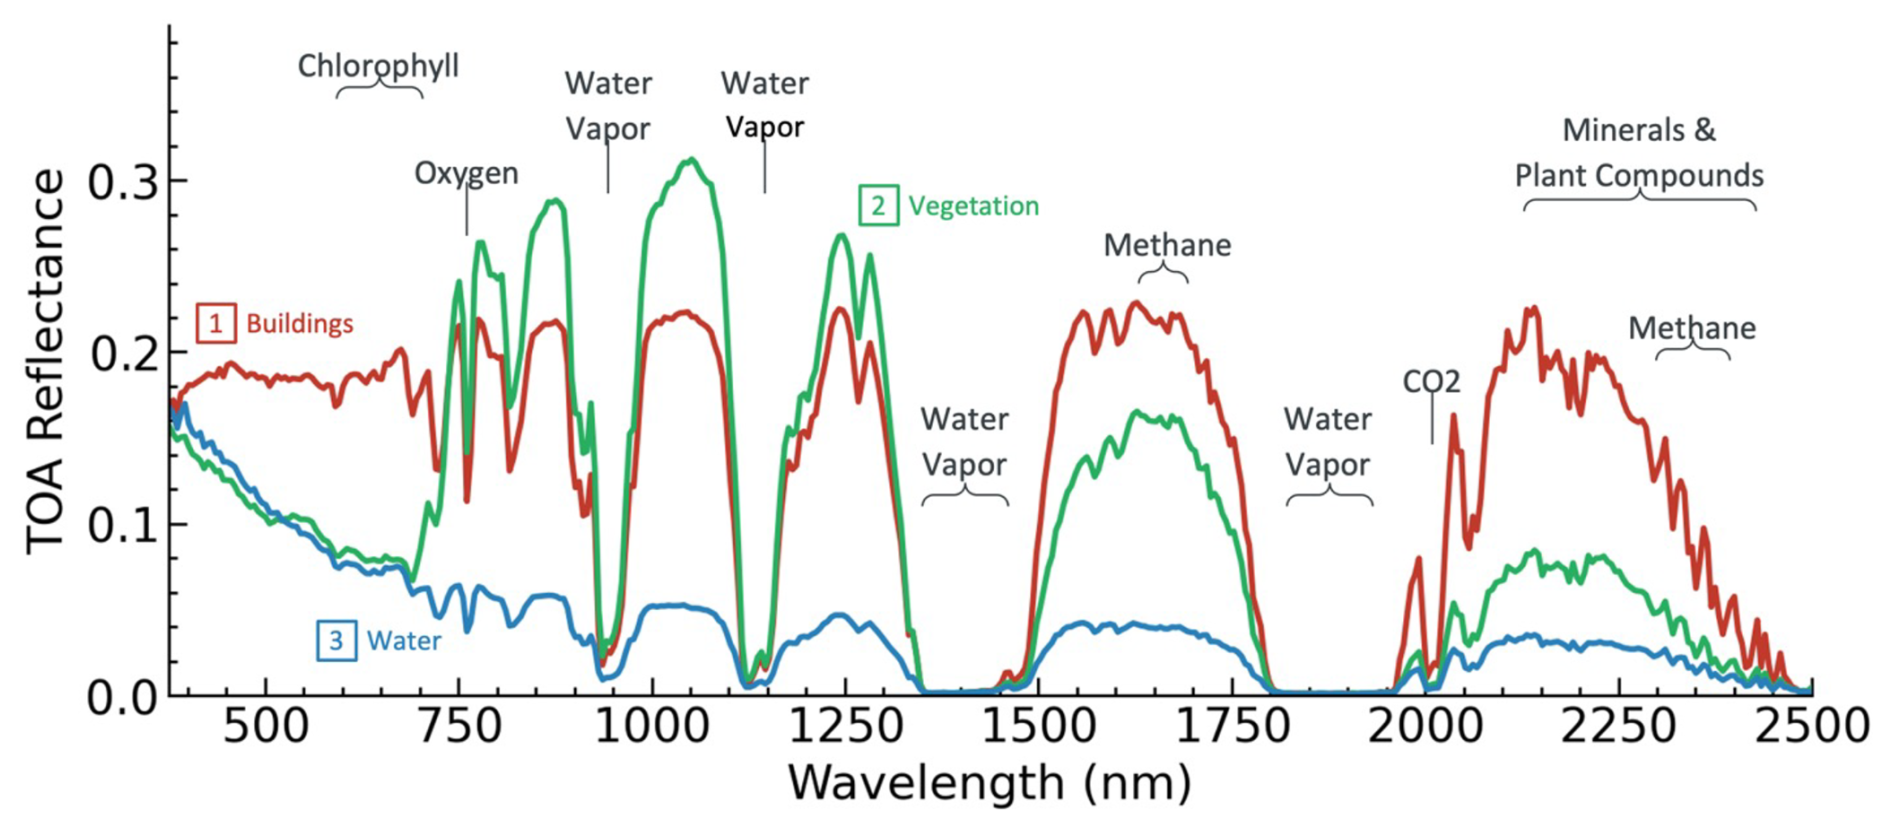
Figure 5Plots of full VSWIR TOA reflectance from 3 pixels containing buildings [1], vegetation [2], and water [3] in the image in Fig. 11 illustrating Tanager's hyperspectral sensitivity to CH4, CO2, and multiple other environmental variables.
Figure 4 shows a first-light hyperspectral data cube from a Tanager-1 observation of Karachi, Pakistan acquired on 16 September 2024, one month after launch. The first CH4 plume detected by Tanager-1 in that image was attributed to a known waste dump. The estimated emission rate is 1224 ± 221 kgCH4 h−1. The plume was detected and quantified within 12 h of the observation. Subsequent analysis of over 1400 plumes detected between 1 February and 1 April 2025 indicate good performance against our 72 h data latency requirement: median 10 h, mean 34 h between Tanager image acquisition and Carbon Mapper plume detection. As an illustration of Tanager's broader hyperspectral imaging utility including CH4, CO2 and multiple other environmental variables, Fig. 5 plots the TOA reflectance across the full VSWIR spectral range for 3 pixels in the Karachi image.
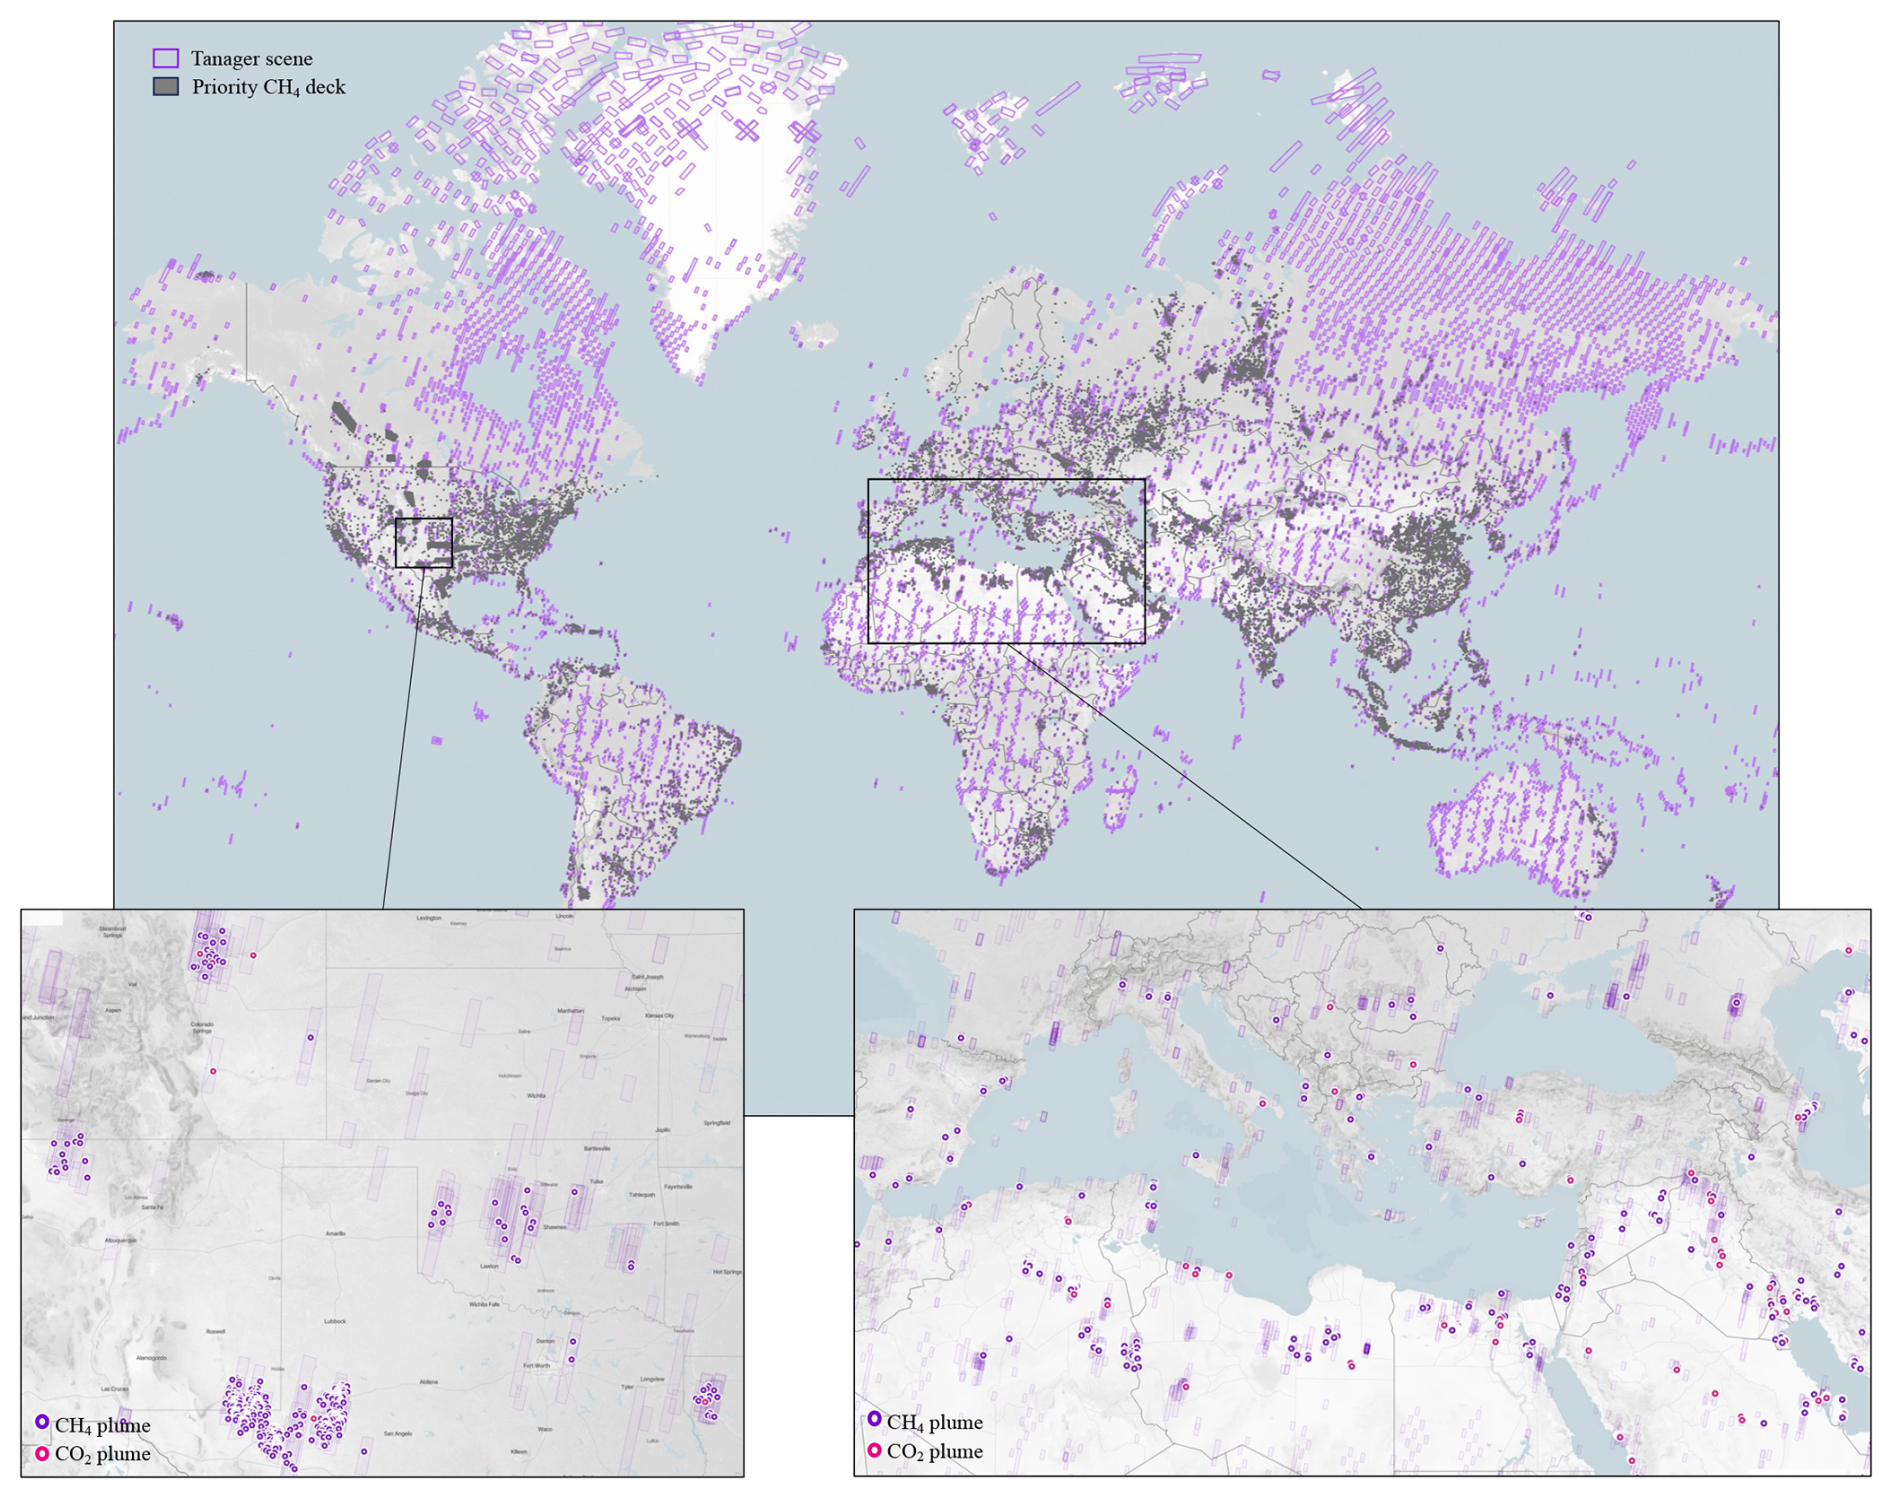
Figure 6Map of the Priority CH4 tasking deck from 16 September 2024 through 15 August 2025 representing about 35 % of 16 952 Tanager-1 scenes collected during that interval. This resulted in 6813 CH4 and CO2 plume detections globally. The zoom panels provide two regional examples of the frequency of plume detections within scenes collected to date for the Priority CH4 deck.
Between 16 September 2024 and 15 August 2025, Tanager-1 imaged nearly 17 000 scenes distributed globally (Fig. 6, top panel), about 35 % of which were from the priority CH4 tasking deck. The remaining scenes were of diverse land or ocean sites or island chains in support of non-trace gas hyperspectral applications or routine radiometric calibration where one would not expect to see strong CH4 or CO2 emissions. Additionally, the average daily coverage of Tanager-1 was initially limited to about 22 000 km2 but since the end of commissioning on January 2025 has dramatically increased to over 200 000 km2. As of 15 August 2025, about 5600 CH4 and about 1200 CO2 point source emission plumes have been detected in Tanager-1 scenes. The geographical distribution of detected plumes is shown in Fig. S5. Roughly 85 % of those plumes were detected after Commissioning was completed on 31 January 2025. Many of the scenes to date were collected in at initial altitudes as high as 510 km, resulting in coarser spatial resolution and higher plume detection limits. In most cases, Standard (1×8) Sensitivity imaging mode was used with shorter than normal line lengths (e.g., ≦100 km). Since April 2025, the average orbit altitude has remained fixed around 430 km and the number of scenes collected in Maximum Sensitivity (4×8) mode has increased. This means that optimal detection limits are just being reached near the end of the first year in orbit.
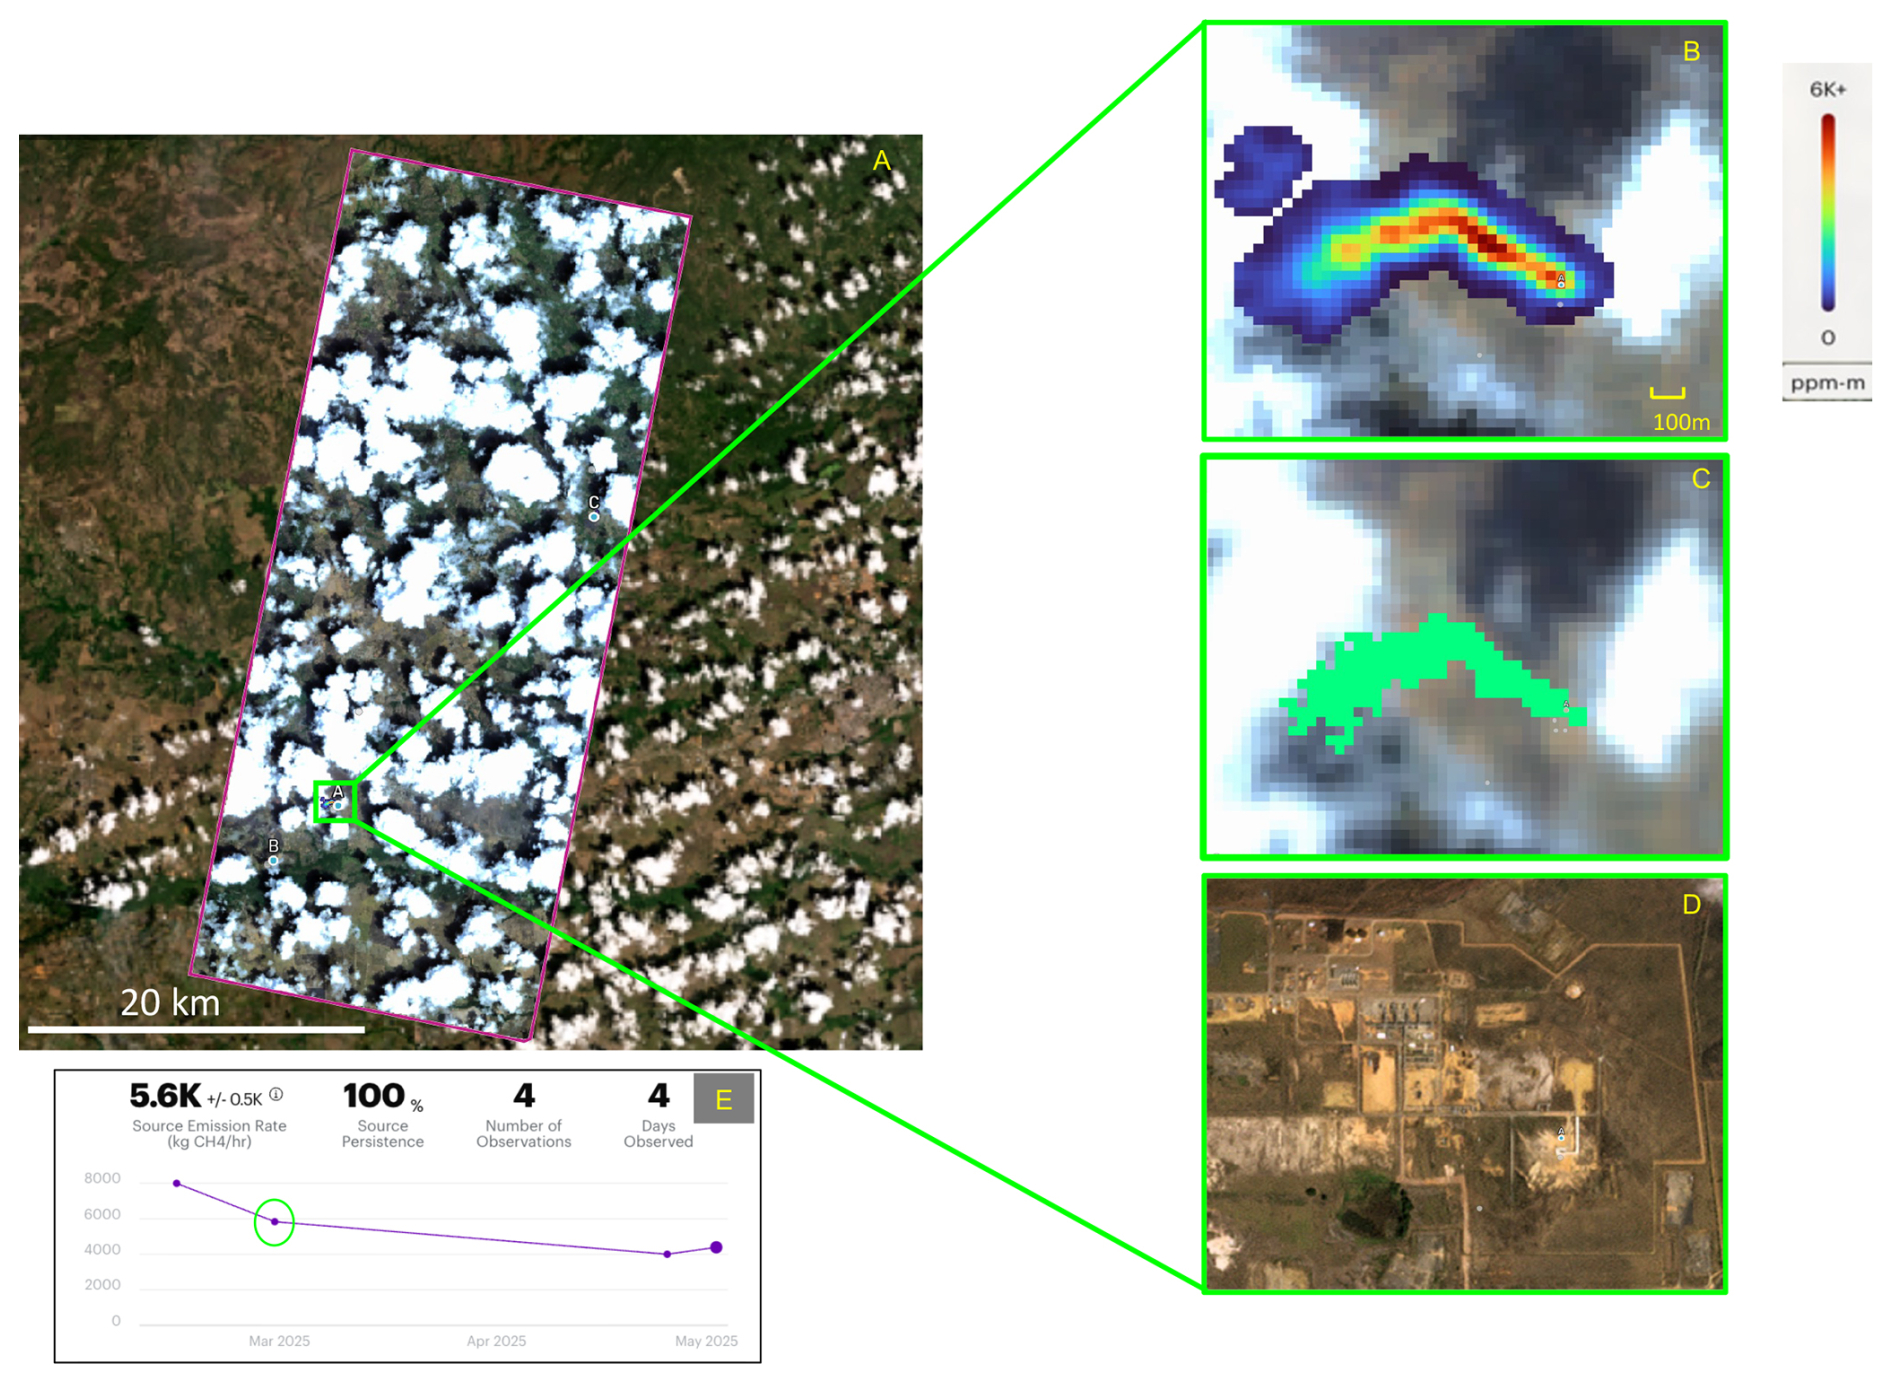
Figure 7Tanager-1's 30 m spatial resolution enables detection of CH4 plumes in perpetually cloudy regions such as the tropics. In this example of a cloudy image of Venezuela (A), Carbon Mapper detected a CH4 plume from an oil and gas facility within a roughly 700 m gap between clouds (B). The plume mask used to calculate an IME and emission rate does not overlap the cloud (C). A PlanetScope 5 m resolution visible image of the same area in February 2025 with no clouds clearly shows the oil and gas facility (D). Three other cloud free observations by Tanager-1on different dates show declining but consistent emissions from this site, averaging 5600±500 kgCH4 h−1 (E). The basemap overlaid by the Tanager image in (A) is © Mapbox, © OpenStreetMap, and © Maxar.
One motivation for Tanager high spatial resolution mapping is to help address the lack of granular CH4 and CO2 data in the tropics and other persistently cloudy regions that otherwise can remain unobserved for months or years. Frankenberg et al. (2024) analyzed global observations by the Sentinel-2 satellite with 10 m spatial resolution and 5 min mean revisit interval to show that satellites with a 30 m spatial resolution and wide area mapping should achieve median cloud-free (<0.1 % of a pixel) coverage in the Amazon of 10 % and 20 % during the rainy and dry season, respectively. In contrast, satellites with 1 km spatial resolution would achieve cloud-free yields of only 0.5 % and 2 % for the wet and dry seasons and satellites with >2 km spatial resolution would achieve <0.1 % cloud free yields. For reference, the current premier global CH4 flux mapping satellite (Sentinel-5p/TROPOMI) has a nadir spatial resolution of about 7 km. To evaluate Tanager performance in tackling cloudy images, we targeted several oil and gas basins, landfills and coal mines in the tropics. Figure 7 shows an example of a cloudy image acquired by Tanager-1 in February 2025 in Venezuela (panel A). Carbon Mapper detected a CH4 plume from an oil and gas facility with roughly 120 m separation from the nearest cloud (panels B and D). A PlanetScope 5 m resolution visible image of the same area the same month with no clouds clearly shows the oil and gas facility (panel D). The emission rate estimate from this cloudy scene is consistent with emissions observed by Tanager-1 at the same location under cloud free conditions on three other dates. Tanager-1 has successfully detected similar plumes at multiple sites across the tropics, demonstrating the promise of sustained high-resolution mapping of these critical regions.
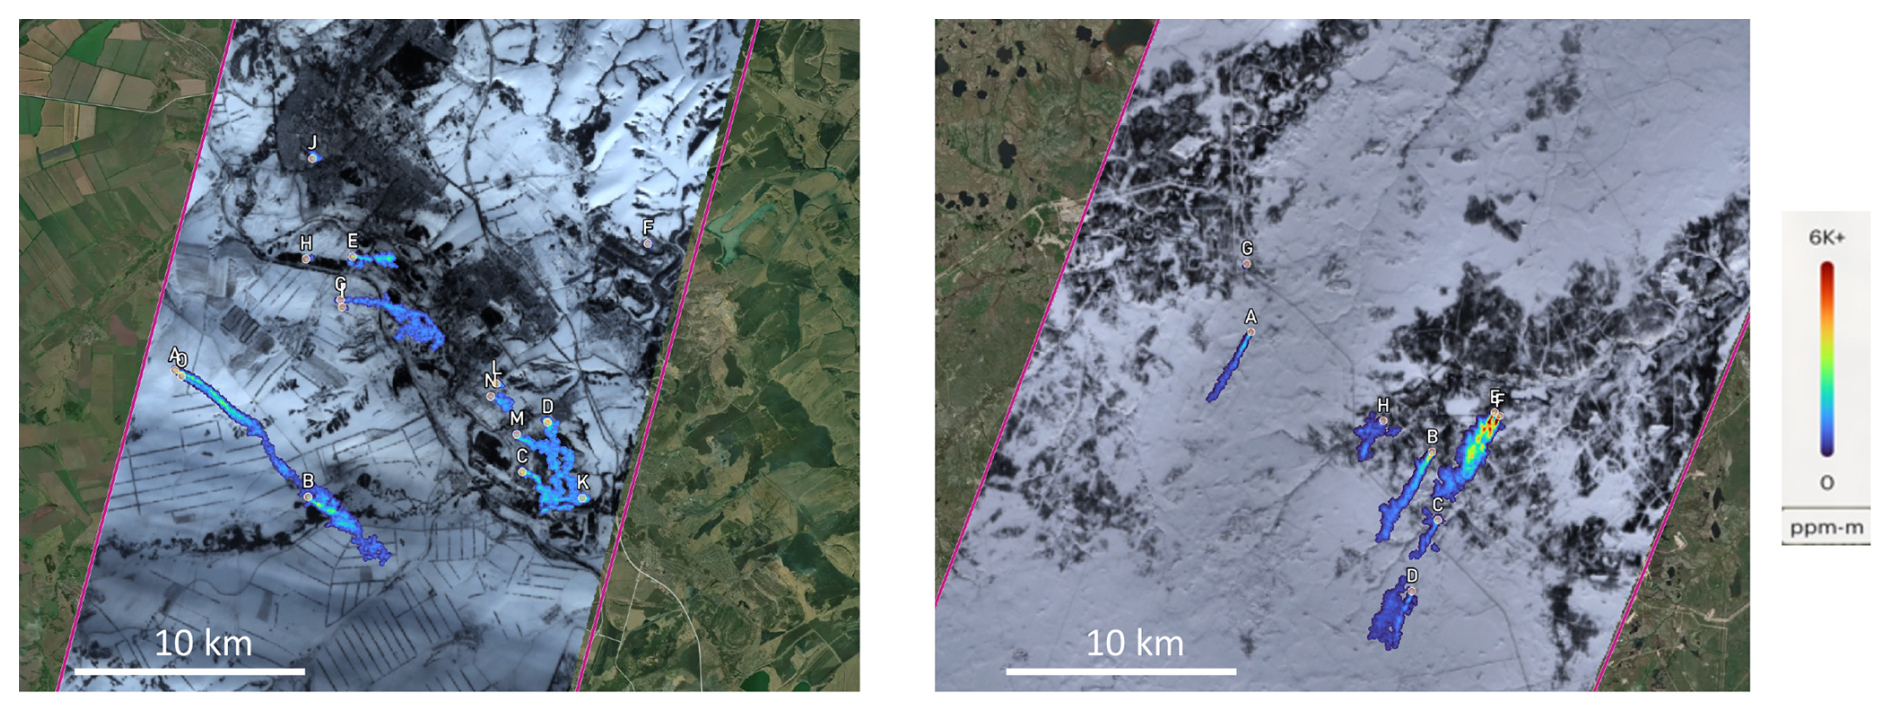
Figure 8Two examples of Tanager's CH4 detection capabilities for challenging high latitude winter images in Russia due to large solar zenith angles and low SWIR albedo due to snow covered surfaces. (left) 20×20 km2 subset of a Tanager-1 image at 55° N latitude with 13 CH4 plumes detected on 23 February 2025 at 05:51:06 UTC. Emission estimates for the plumes in this image range from about 400 to 2500 kgCH4 h−1. (right) 24×24 km2 subset of a Tanager-1 image at 66° N latitude with 6 CH4 plumes detected on 26 February 2025 at 06:54:41 UTC. Emission estimates for plumes in this image range from about 670 to 5000 kgCH4 h−1. In both figures the small letters denote individual plumes. The basemap overlaid by the Tanager image in each case is © Mapbox, © OpenStreetMap, and © Maxar.
Another major design driver for the Tanager instrument is to be robust to challenging observational scenarios including high latitude regions such Russia and Canada where low sun elevation angles and low SWIR albedos from snow covered surfaces can impact SNR and degrade CH4 and CO2 detection limits. To evaluate Tanager-1 performance in these conditions we conducted observations of representative high latitude oil and gas production regions during the northern hemisphere winter. Figure 8 shows the results of two such images in Russia in February at 55 and 66° N latitude. In each case, the ground is covered in snow and solar zenith angles exceeded 70°, however Tanager-1 detected multiple CH4 plumes.
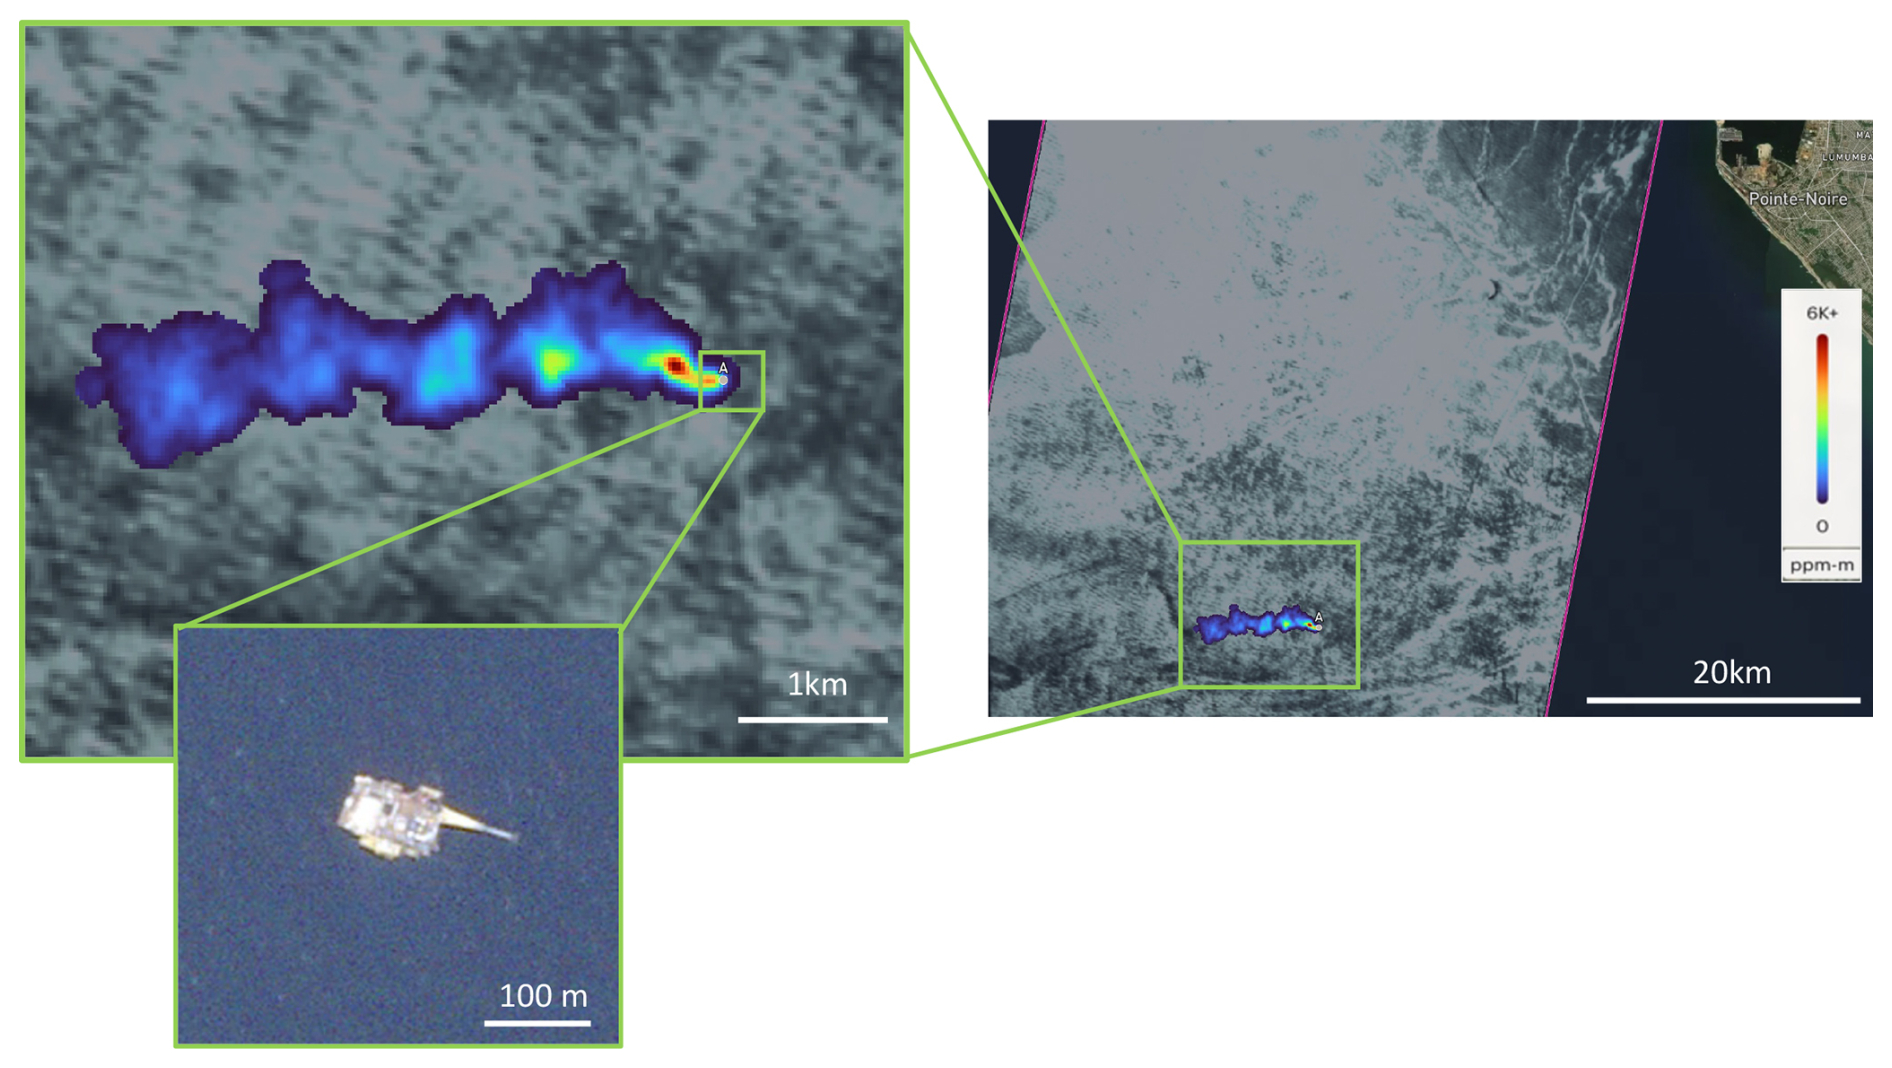
Figure 9Ocean “glint mode” detection of a CH4 plume from an oil and gas platform in the Moho Nord block off the coast of the Republic of the Congo. CH4 image derived from a Tanager-1 observation on 10 March 2025 at 10:19:13 UTC. The estimated emission rate is 2322±254 kgCH4 h−1. The basemap in the inset zoom view is from a Planet SkySat visible image (70 cm resolution) acquired 16 March 2025, providing clear attribution of the likely source origin. The basemap overlaid by the Tanager image in the right figure is © Mapbox. © OpenStreetMap, and © Maxar.
As described in Sect. 2.3, Tanager is also designed to detect CH4 emissions over ocean surfaces which are dark at SWIR wavelengths. To evaluate Tanager glint-mode performance we conducted several multiple sun-glint observations of selected offshore oil and gas production basins. Figure 9 shows a Tanager-1 detection of a CH4 plume from an oil and gas platform in the Moho Nord block off the coast of the Republic of the Congo. We intend to scale up glint-mode observations of other offshore production areas in the second year of Tanager-1 operations.
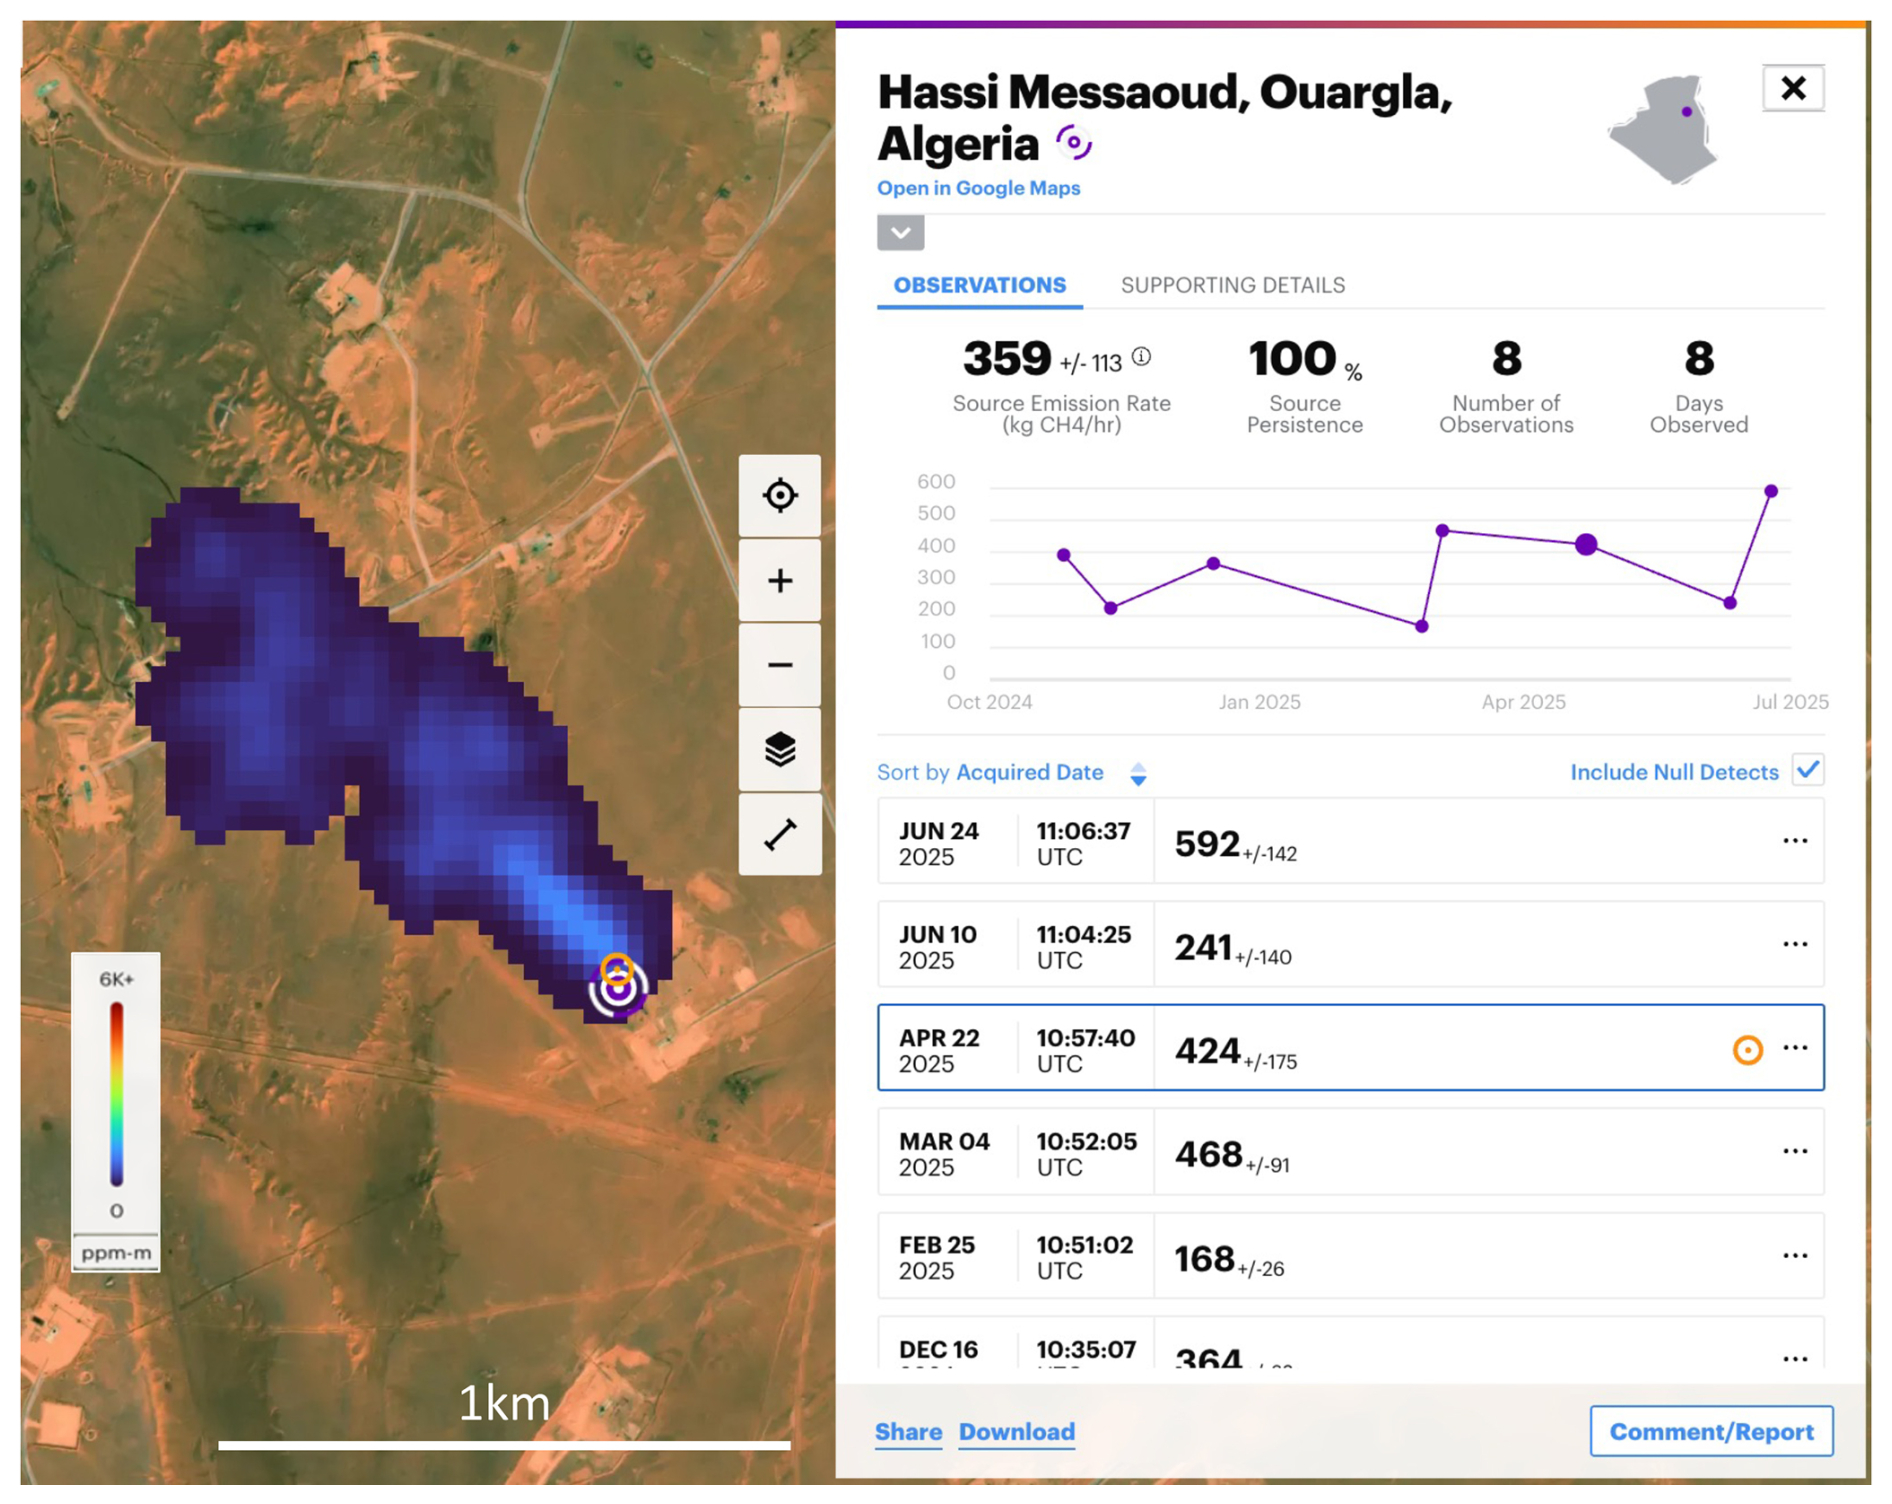
Figure 10Screenshot from Carbon Mapper's public data portal showing a time series of CH4 plumes detected by Tanger-1 at a persistently emitting oil and gas production site in Algeria. Tanager-1 observations occurred on a roughly monthly cadence from October 2024 through June 2025. Basemap image © Mapbox, © OpenStreetMap, and © Maxar.
Another key objective of Carbon Mapper's observing strategy is to routinely monitor high emission point sources to assess their variability and persistence. We have tested Tanager-1's ability to track individual super emitters with a regular sample cadence. Figure 10 shows one such example: a time-series of CH4 plumes detected by Tanger-1 at a persistently emitting oil and gas production site in Algeria. Tanager-1 observations occurred on a roughly monthly basis on average from October 2024 through June 2025. The persistent but variable emissions exhibited by this source are not unusual. Globally, roughly 30 % of the CH4 sources detected multiple times by Tanager-1 to date are at least 50 % persistent. This includes all sectors – oil and gas, coal, waste and agriculture – some of which are more or less prone to intermittent emissions.
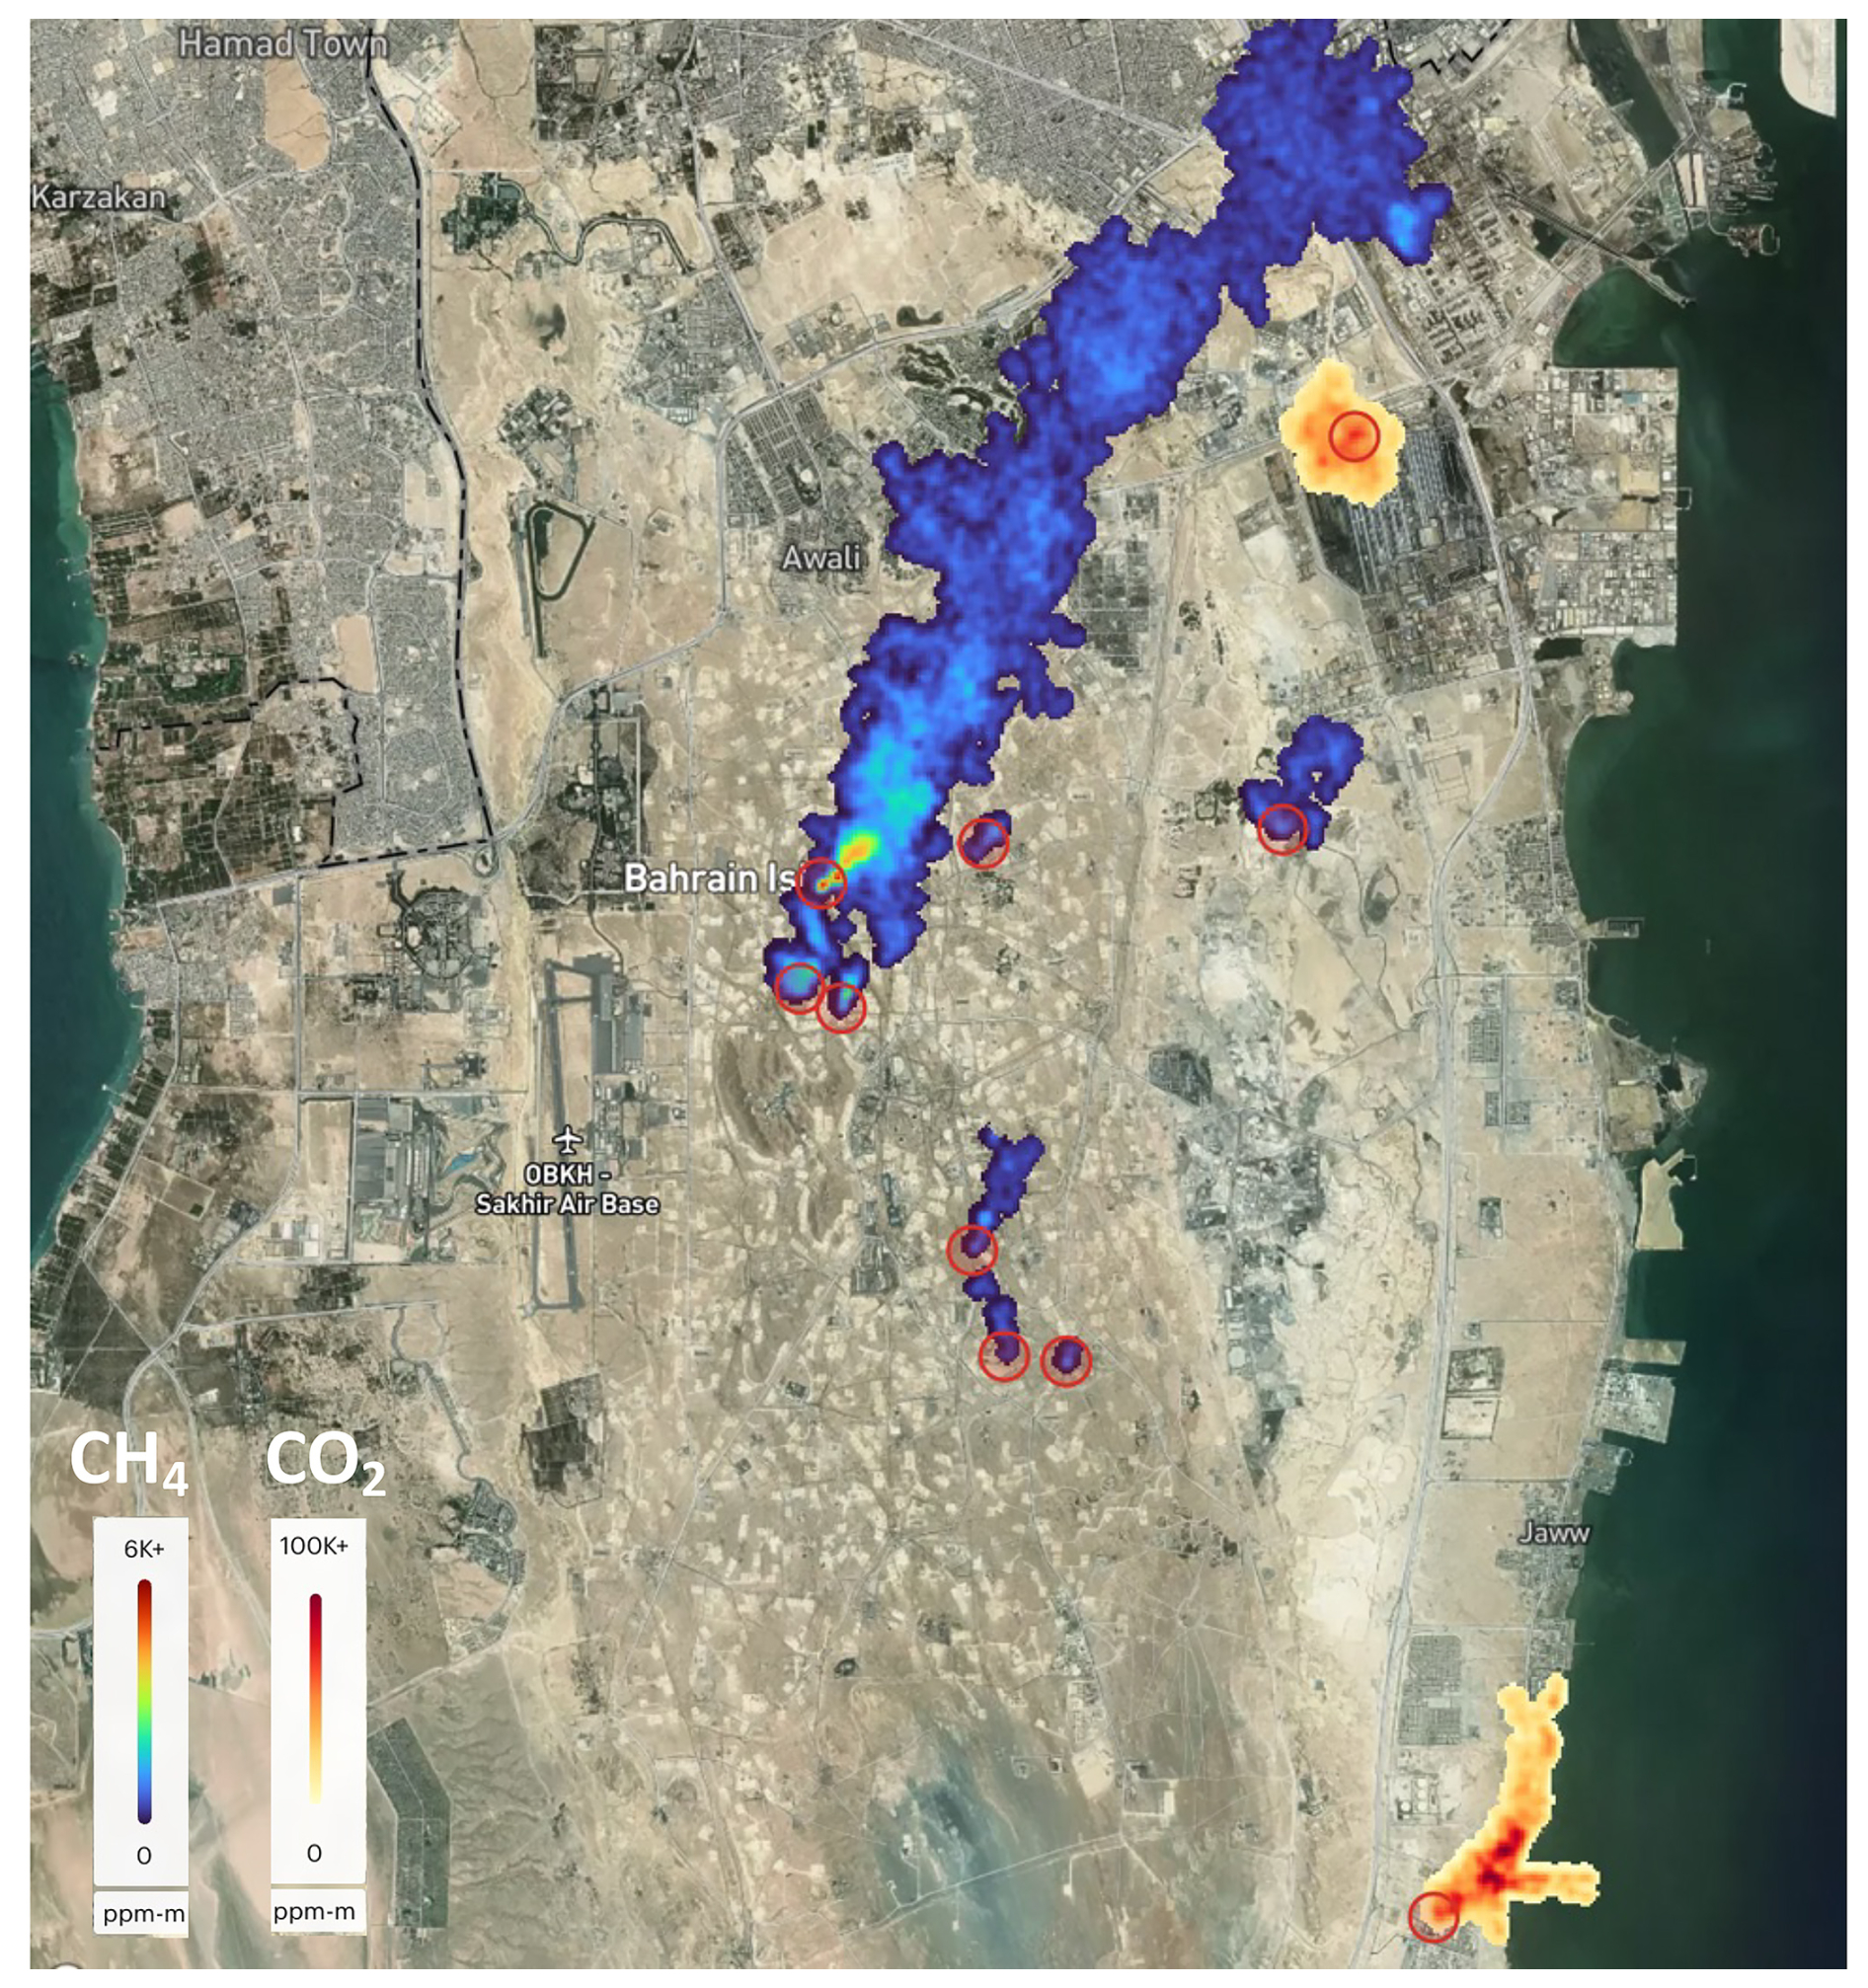
Figure 11Simultaneous detection of 2 CO2 plumes and 8 CH4 plumes in a single Tanager-1 image of Bahrain acquired on April 2025. The CO2 plumes are attributed to gas-fired power plants. The CH4 plumes are attributed to oil and gas production. Basemap image © Mapbox, © OpenStreetMap, and © Maxar.
To evaluate Tanager's ability to detect CH4 and CO2 point sources simultaneously, we observed some of the world's larger cities and industrial regions that host fossil energy production, electricity generation and refineries. This resulted in numerous individual images where multiple CH4 and CO2 plumes were detected. Figure 11 is one such example. Tanager-1 imaged Bahrain on 1 April 2025, revealing 8 CH4 plumes from oil and gas operations and 2 CO2 plumes from gas fired power plants. The distribution of plume sizes and shapes reveals both the diversity of emission rates and surface wind fields that are common to many regions.
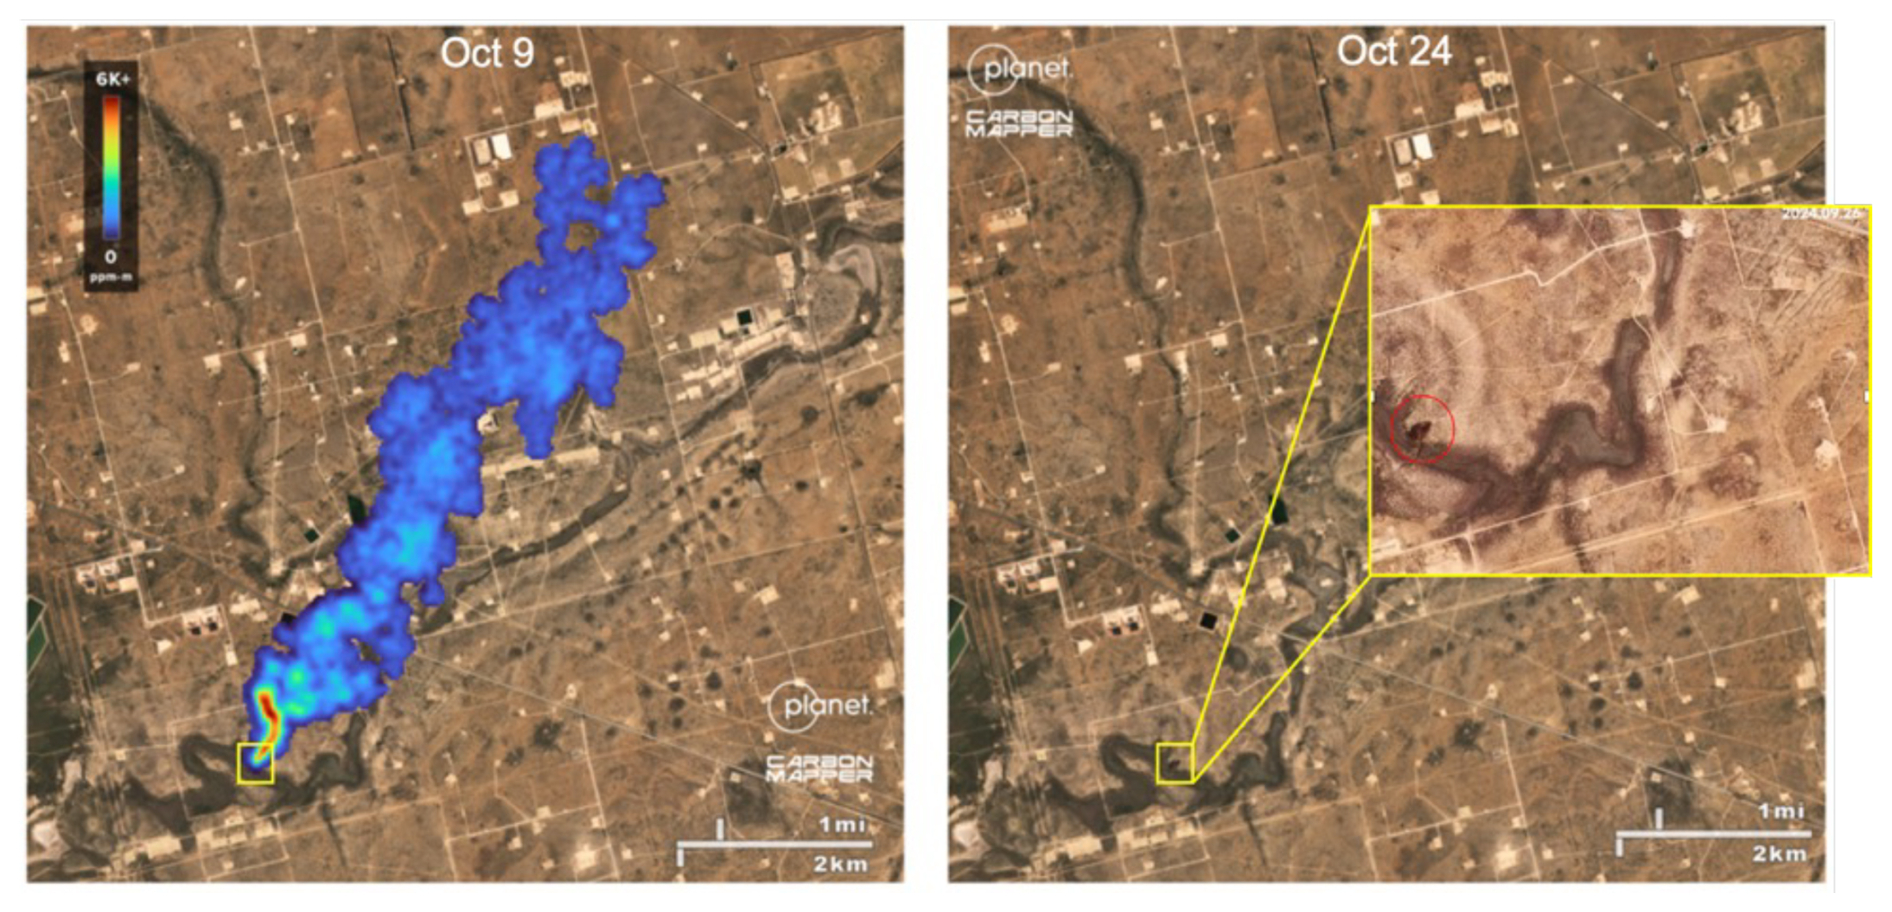
Figure 12(Left) a large persistent methane plume from a leaking oil and gas gathering pipeline was detected in the Texas Permian basin from a Tanager-1 observation on 9 October 2024 with an estimated instantaneous emission rate of 7100 ±1100 kgCH4 h−1. Carbon Mapper notified federal and state agencies the next day who informed the operator who reported that the leak was promptly repaired. (Right) a subsequent Tanager observation on October 24 detected no methane. The inset image on the right from Planetscope visible band observations indicated a sudden darkening of the surface within 30 m of the origin of the methane plume shortly before the first Tanager-1 observation, consistent with a potential condensate release from the pipeline. Basemap image © Mapbox, © OpenStreetMap, and © Maxar.
Tanager-1 commissioning also provided an opportunity to conduct some leak detection and repair pilot efforts. Figure 12 shows a methane plume from a leaking oil and gas gathering pipeline that was detected in the Texas Permian basin from a Tanager-1 observation on 9 October 2024 with an estimated instantaneous emission rate of 7100 ± 1100 kgCH4 h−1. After Carbon Mapper notified federal and state agencies the next day, the leak was reported to be voluntarily repaired by the operator. A subsequent Tanager observation on 24 October detected no methane at that location. Analysis of contemporaneous AVIRIS-3 aerial surveys of the Permian on 1, 9 and 10 October reveal high emissions at the same location in all 7 observations (in addition to the Tanager detection), indicating a persistent source with an average emission rate of 4200 ± 500 kgCH4 h−1 over at least that 10 d interval. This early demonstration bodes well for Carbon Mapper plans to scale-up data sharing with facility operators and expanded mitigation progress globally.
In addition to the various functional demonstrations during Tanager-1 commissioning, a series of experiments were conducted to provide quantitative validation of key performance parameters. Maximum CH4 and CO2 performance should occur when Tanager-1 reaches its final target altitude (406 km) and LTDN (1200 h). Additionally, instrument and detection performance is best assessed by completing a statistically robust number of blinded controlled release experiments sufficient to determine probabilistic detection limits. However, these initial experiments of on-orbit measurements provide strong empirical grounding in our predicted ultimate performance.
4.1 Single measurement precision and detection limits
The Minimum Detection Limit (MDL) for CH4 point sources as a function of measurement precision can be estimated using the method described by Jacob et al. (2016) as follows:
where Ma=0.029 kg mol−1 and kg mol−1 are the molecular weights of dry air and methane, p is the dry atmospheric surface pressure (typically about 1000 hPa), and g=9.8 m s−2 is the acceleration of gravity, U is the wind speed in m s−1, W is the pixel size in meters. σ is the single measurement precision or the ability to detect a localized enhancement of CH4 relative to the average local background (assumed here to be 650 mmol m−2). A similar approach can be used to estimate the MDL for CO2 point sources. This approach assumes a plume detection at the level of one or two contiguous pixels. This represents a theoretical minimum case which is generally insufficient for robust plume detection in practice, where our QC procedures generally require evidence of multiple pixels. However, it can serve as a useful benchmark and simple method for relating instrument and retrieval performance to detection. We demonstrate this empirically in Sect. 4.2. Ultimately the more valuable metric to assess true detection is derived probabilistically through comparison of satellite detection to a variety known releases rates (e.g., Conrad et al., 2023).
Instrument spectral performance (sampling and FWHM) and radiometric performance (SNR) are the primary constraints on σ. For Tanager, spectral sampling (5 nm) and FWHM (5.5 nm in the SWIR bands) were set by instrument design and alignment as described in Sect. 2. SNR is a more complex function of the instrument design (optical throughput, read noise, etc) and operation (effective integration time) as well as environmental factors such as solar zenith angle, surface albedo and various atmospheric variables. Prior to Tanager-1 launch we used the lab-measured instrument spectral (Fig. S2) and radiometric (Fig. S3) performance to generate theoretical predictions of the single measurement CH4 precisions for each imaging mode (Table 4). We simulated a top-of-the atmosphere radiance spectrum for 35° solar zenith angle, 25 % albedo using the MODTRAN6 radiative transfer model, and then applied the measured Tanager instrument noise. We applied the optimal estimation concentration retrieval algorithm IMAP-DOAS (Frankenberg et al., 2005), which provides single-sounding posterior precision for a retrieved column-averaged CH4 or CO2 column concentration. We then applied Eq. (4) and an assumed wind speed of 3 m s−1 and 30 m pixel size to calculate the predicted CH4 MDL for each imaging mode (Table 4).
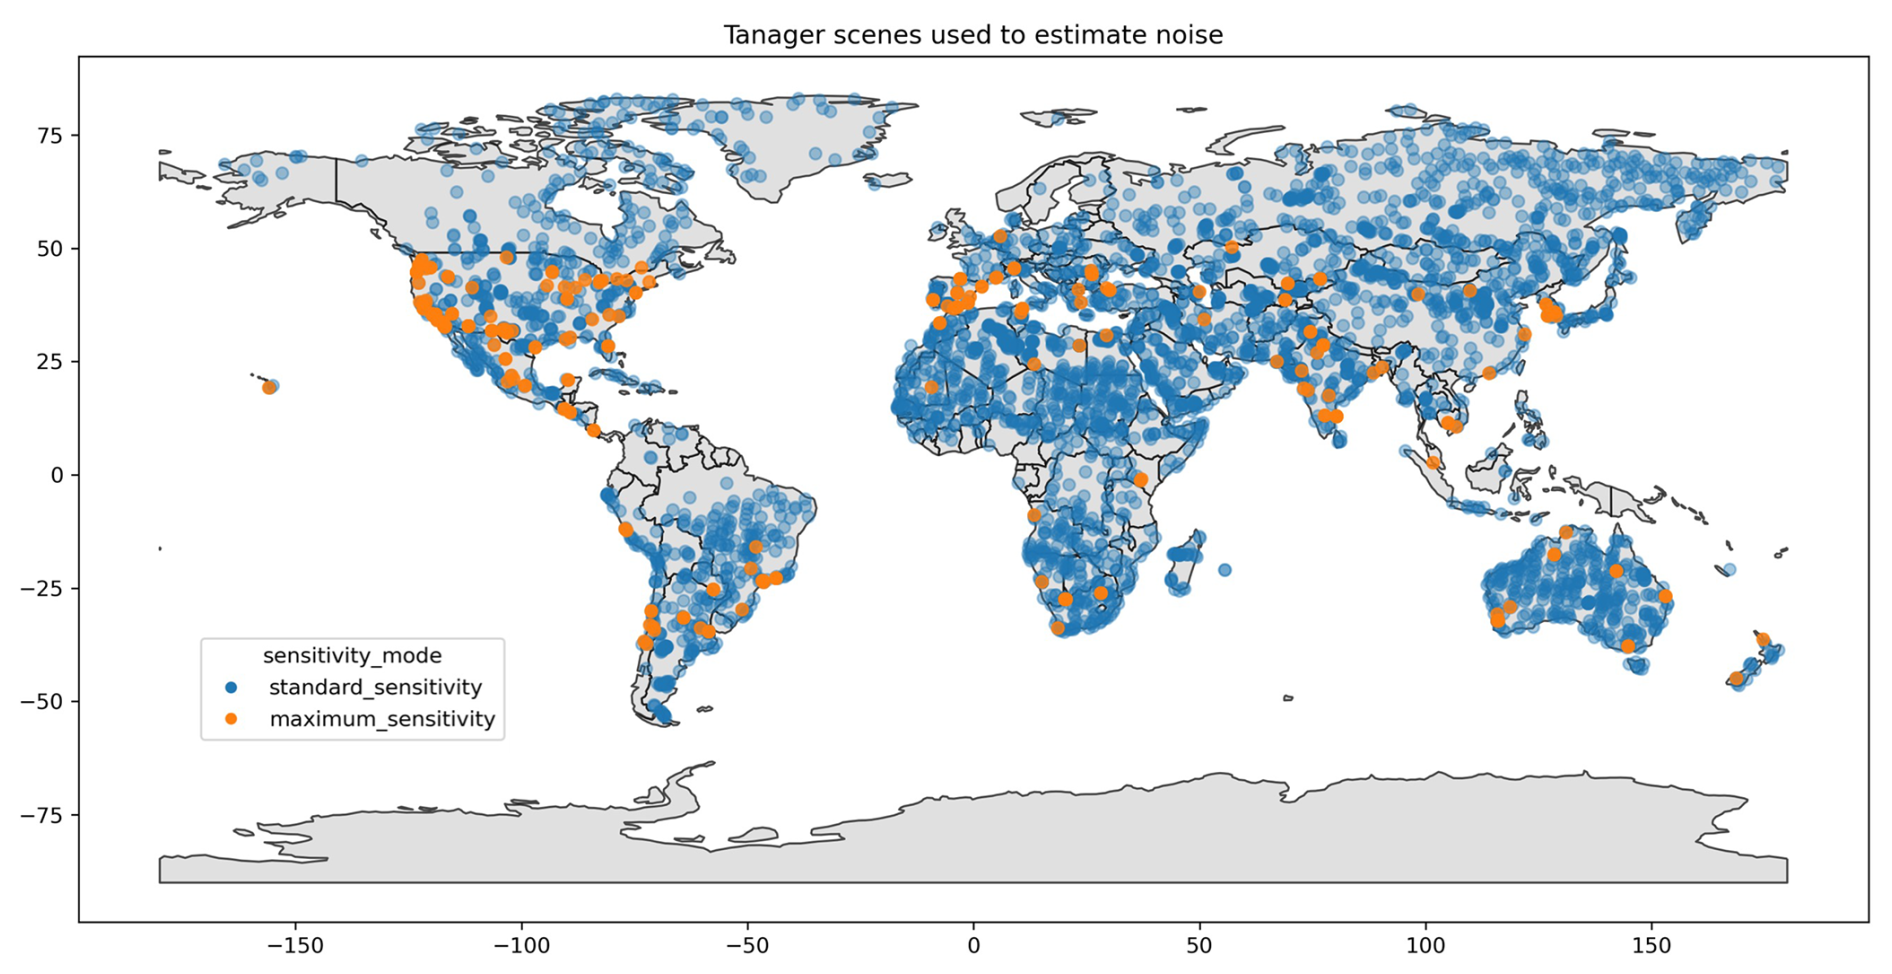
Figure 13Geographical distribution of roughly 4200 scenes imaged by Tanager-1 between September 2024 and July 2025 that were at least 75 % cloud free and used for empirical assessment of single measurement precision.
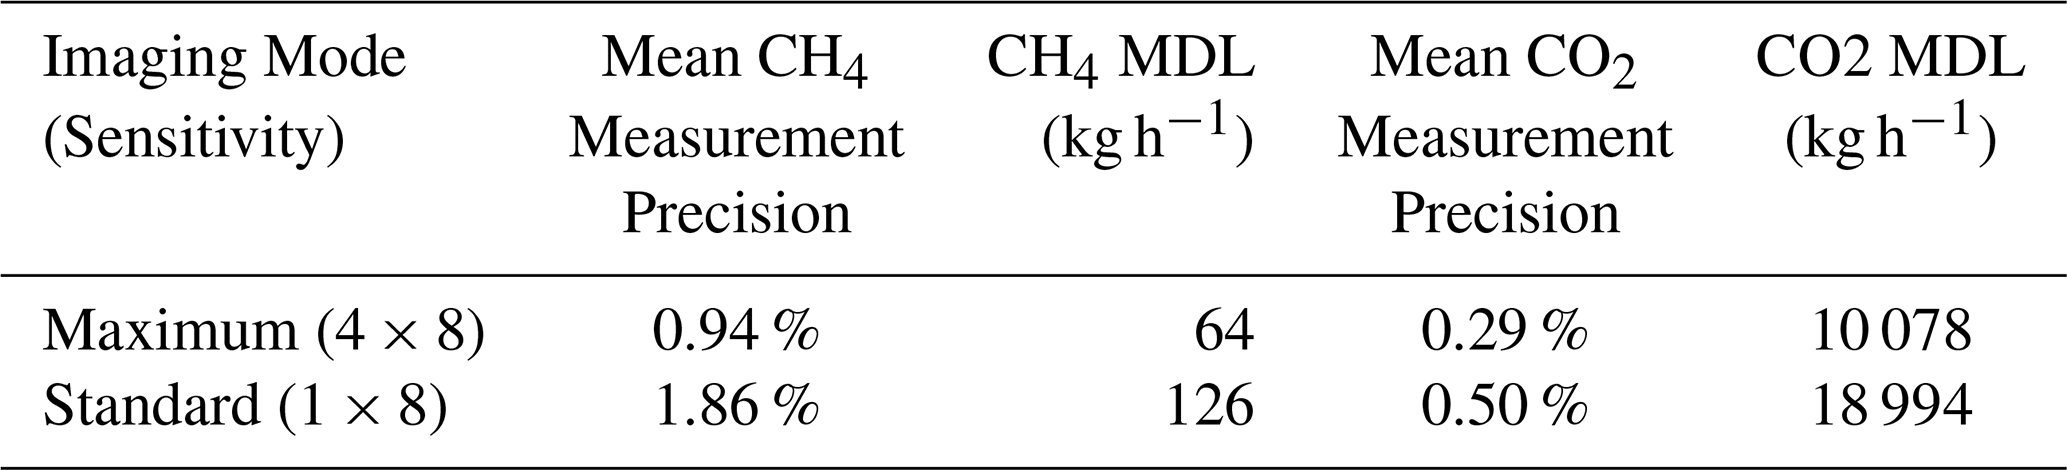
However, a more direct measure of σ with the as-built system can be obtained empirically by plotting the standard deviation of background CH4 in units milli-moles m−2 across over full image strips as a function of scene-averaged surface albedo for Tanager observations spanning a wide range of solar zenith angles. Figure 13 summarizes the geographical distribution of Tanager-1 observations between 16 September 2024 and 30 July 2025 for scenes that were at least 75 % cloud free. Of the roughly 4200 scenes shown here, 3950 were in Standard sensitivity mode and 278 were in Maximum sensitivity mode. Some scenes exhibit highly variable albedo due to strong surface heterogeneity (e.g., urban landcovers), however scene-averaging over a large population allows a preliminary estimate of how noise generally relates to environmental conditions in Tanager observations. Figure 14 provides a preliminary empirical assessment derived from the Maximum and Standard sensitivity observations in Fig. 13 where σ is calculated as the standard deviation of non-plume background CH4 within an image strip using the Columnwise Matched Filter algorithm that is the core of Carbon Mapper's operational data workflow. This confirms the predicted 50 % reduction in noise for Maximum sensitivity mode. The Tanager instrument design is based on a reference observation with 25 % albedo and 45° solar zenith angle. To evaluate the precision for that case we can filter the scenes in Fig. 13 to include albedos ranging from 0.2 to 0.3 (average 0.25) and solar zenith angle ranging from 40 to 50° (average 45°). The mean σ for the resulting 164 Standard sensitivity scenes is 12.09 mmol m−2 (1.86 %); assuming 650 mmol m−2 background. For the resulting 6 Maximum sensitivity scenes the mean σ is 6.11 mmol m−2, (0.94 %). Those values are equivalent to a CH4 MDL of 64 and 126 kgCH4 h−1, respectively, for a 30 m pixel size and 3 m s−1 wind speed (Table 5). This is in good agreement with pre-launch predictions, particularly considering that the former used the higher sensitivity IMAP-DOAS algorithm. Repeating this exercise for CO2 and assuming 109 030 mmol m−2 backgrounds we estimate single measurement precisions of 0.29 % and 0.50 % and MDL of 10 078 and 18 994 kgCO2 h−1, respectively, for Maximum and Standard sensitivity modes. As discussed in Sect. 2, our methane MDL requirements were derived from a goal of a 90 % POD of 100 kgCH4 which should be achievable with the as-built Tanager precision and spatial resolution however completion of additional empirical field testing will be necessary for confirmation.
Table 3Pre-launch predictions of single measurement precision and MDL for CH4 point sources by imaging mode using measured instrument performance and modeled radiances for plumes assuming 25 % albedo, 35° solar zenith angle, 3 m s−1 wind speed and 406 km orbit altitude. Additionally, a prediction of CH4 90 % POD is derived from a linear relationship between MDL and POD observed in empirical field testing of similar airborne instruments.
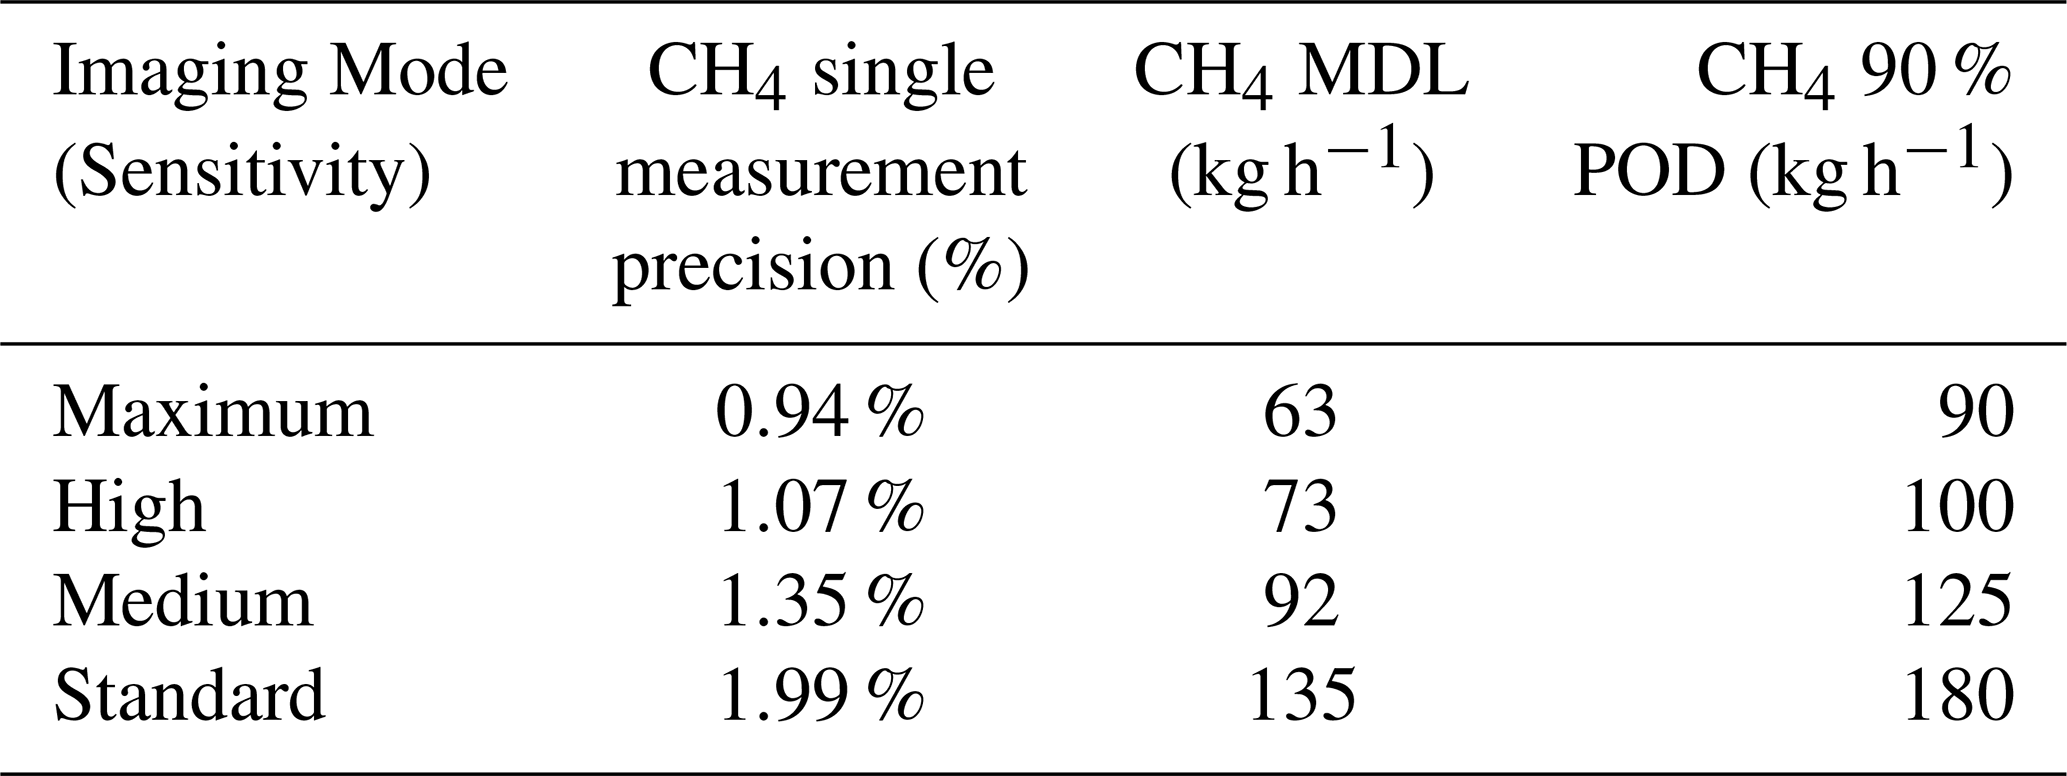
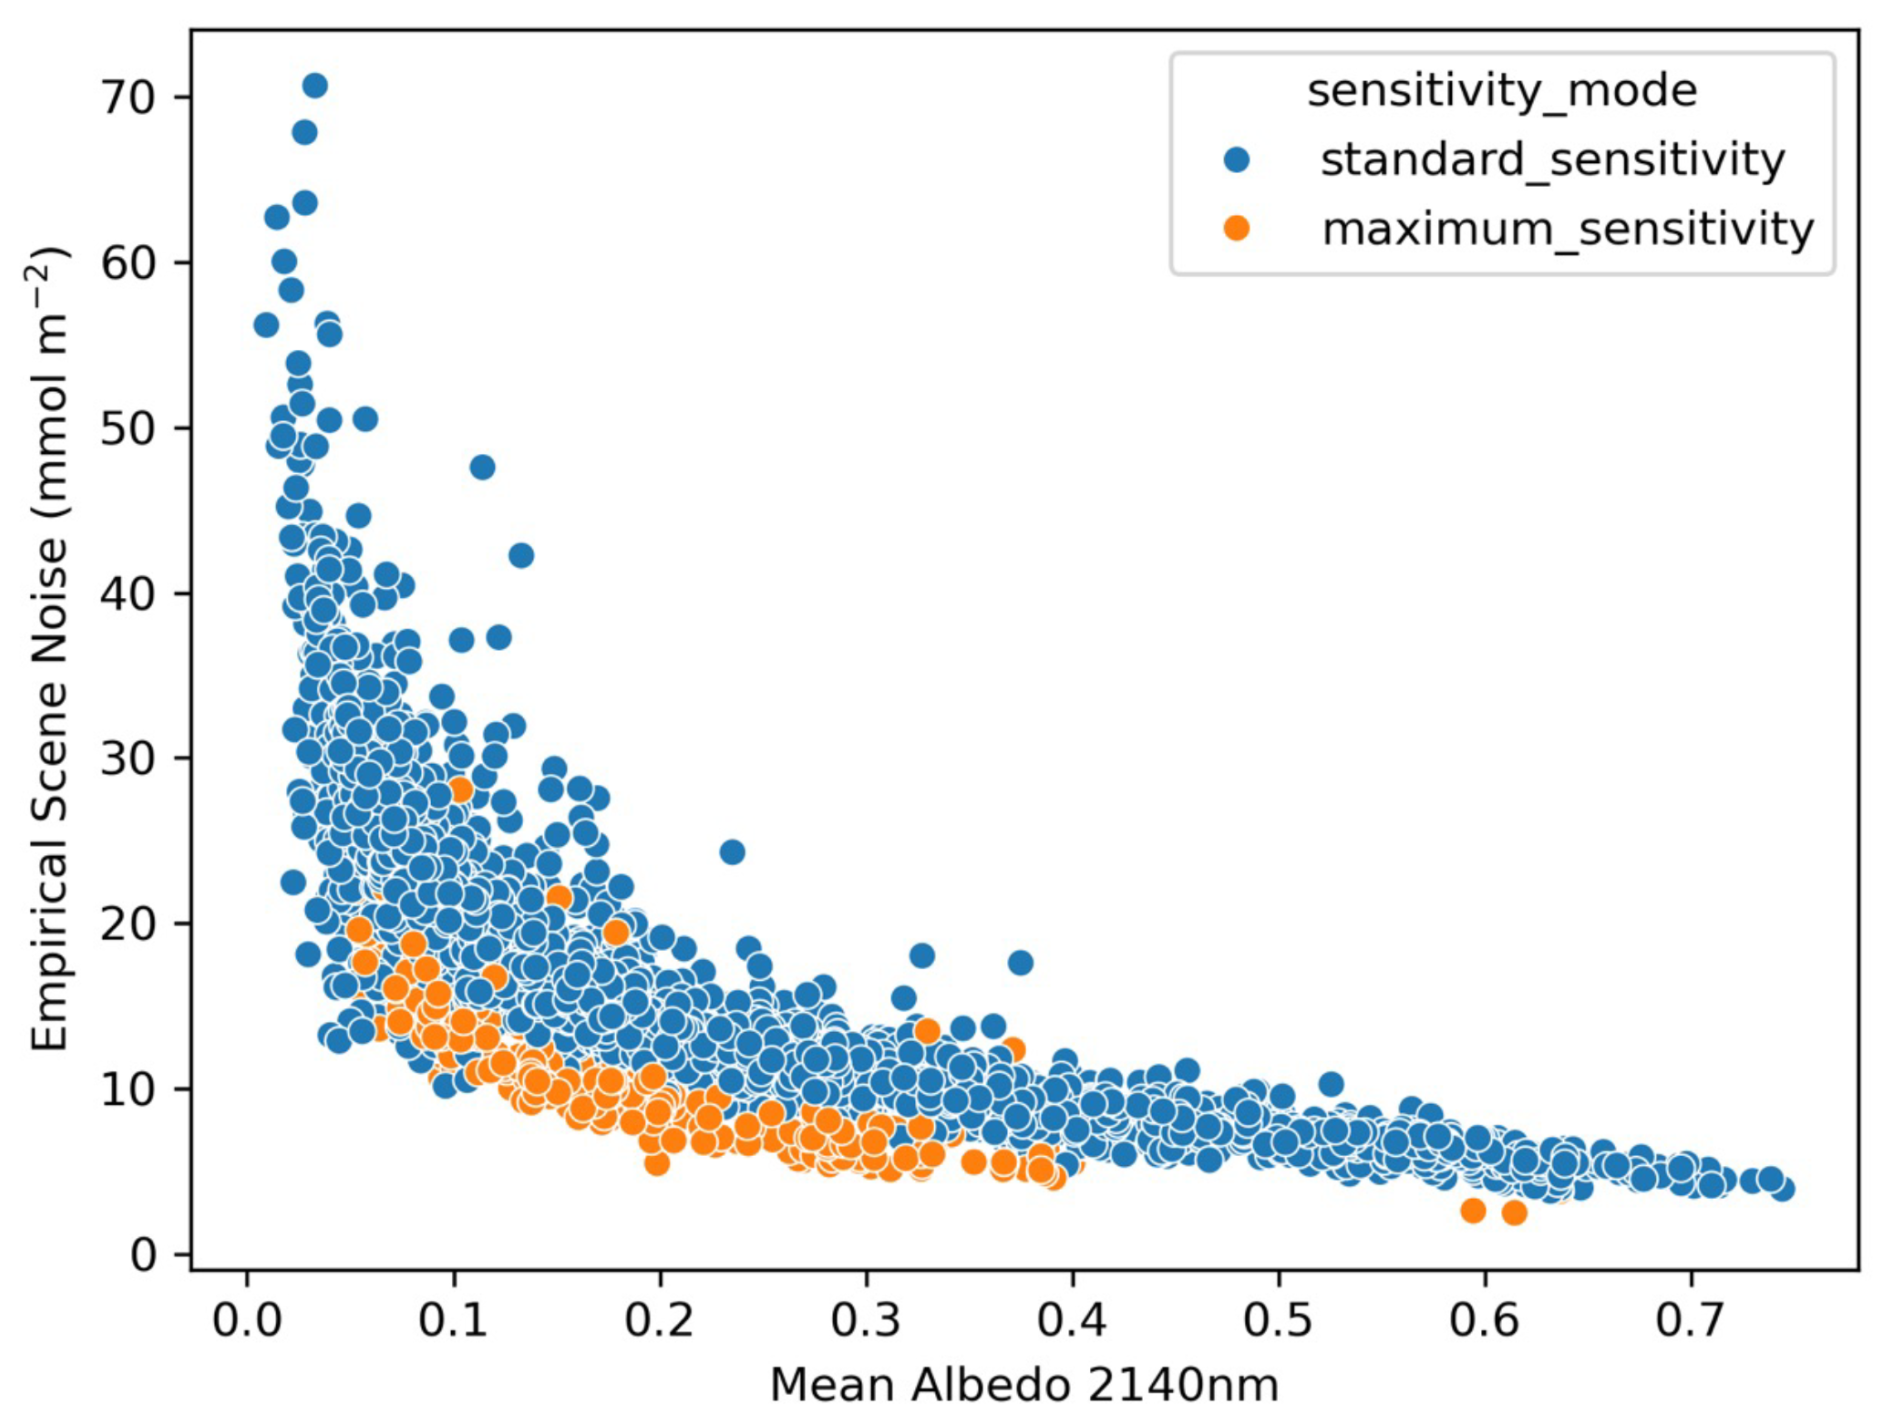
Figure 14Empirical evaluation of single measurement precision – estimated as the standard deviation of background noise across each scene as a function of albedo at 2140 nm for the population of scenes shown in Fig. 13.
Table 4Single measurement CH4 precision and MDL for Maximum and Standard imaging modes derived from Tanager on-orbit observations. Empirical precision is calculated from the standard deviation of background CH4 (assuming 650 mmol m−2 background) and CO2 (assuming 109 030 mmol m−2 background) across entire scenes using the operational CMF retrieval algorithm. This calculation was performed on Tanager-1 scenes with albedos ranging from 20 % to 30 % (mean 25 %) and solar zenith angles ranging from 40 to 50° (mean 45°). This empirical assessment is more conservative than the theoretical pre-launch predictions which used the higher precision IMAP-DOAS algorithm on a simulated image with a smaller solar zenith angle.
4.2 Validation against independent measurements
Empirical studies (e.g., Sherwin et al., 2024; Ayasse et al., 2023) underscore the importance of looking beyond simple analytic predictions of MDL to specify a 90 % POD that reflects real world performance over a broader range of conditions. The latter requires a statistically robust set of blinded controlled release tests (e.g., typically >50 samples which for most satellites can require up to a year to complete when limited to a single test site). While single-blind controlled release testing of Tanager-1 is underway now and anticipated to continue through 2025, we have conducted some initial experiments in the meantime that provide confidence in our pre-launch performance predictions.
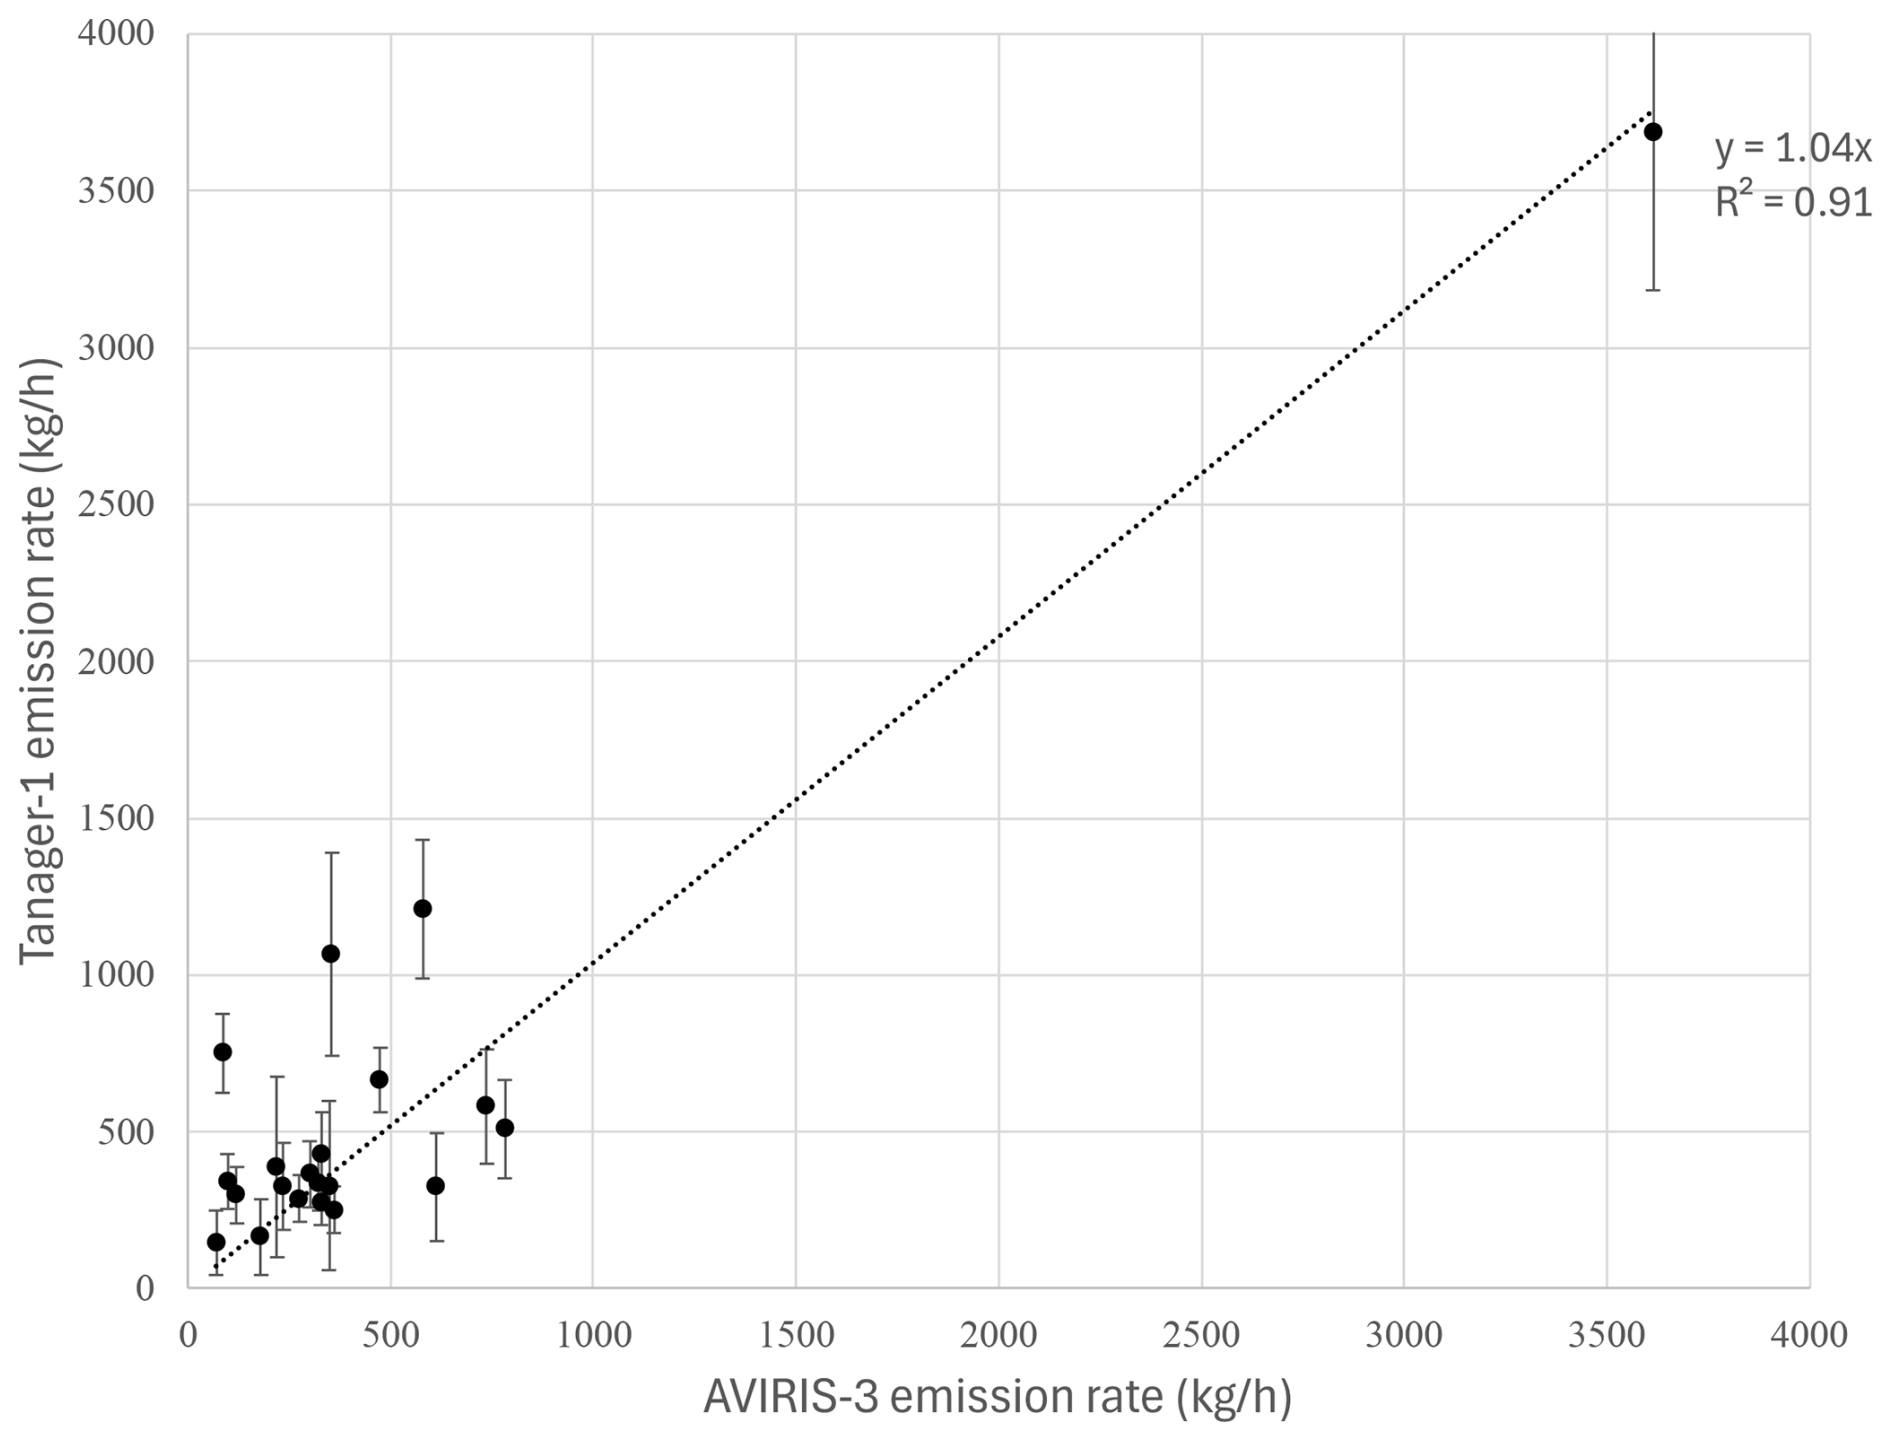
Figure 15Comparison of Carbon Mapper emission estimates for 20 CH4 plumes observed by both AVIRIS-3 and Tanager-1 during near-simultaneous overpasses. The median separation between observations was 12 min (mean 15 min, maximum 37 min). The slope and R2 for an ordinary least squares fit are shown. The error bars represent 1 standard deviation uncertainties in the Tanager-1 and AVIRIS-3 emission rate estimates.
During Tanager-1 commissioning phase JPL's AVIRIS-3 aircraft instrument (Green et al., 2022) conducted coordinated under-flights over known high CH4 emitting regions across the western US, typically at 8 km altitude with about 4.5 m spatial resolution. The objective of these flights was to provide contemporaneous observations of the same CH4 sources observed by Tanager-1 including super emitters in oil and gas basins across New Mexico and California. Figure 15 shows good agreement for 20 CH4 plumes detected by contemporaneous (mean temporal separation <15 min) mapping by AVIRIS-3 and Tanager-1 of the Permian Basin. Additionally, Tanager-1 participated in some cooperative (unblinded) controlled release tests at sites in Wyoming and Arizona designed and operated by a Stanford/University of Michigan research team. That team has established a capability to provide independent evaluation of methane detection limits and emission estimates from satellites, including a single-blind test program for multiple satellites that began operations in January in 2025.
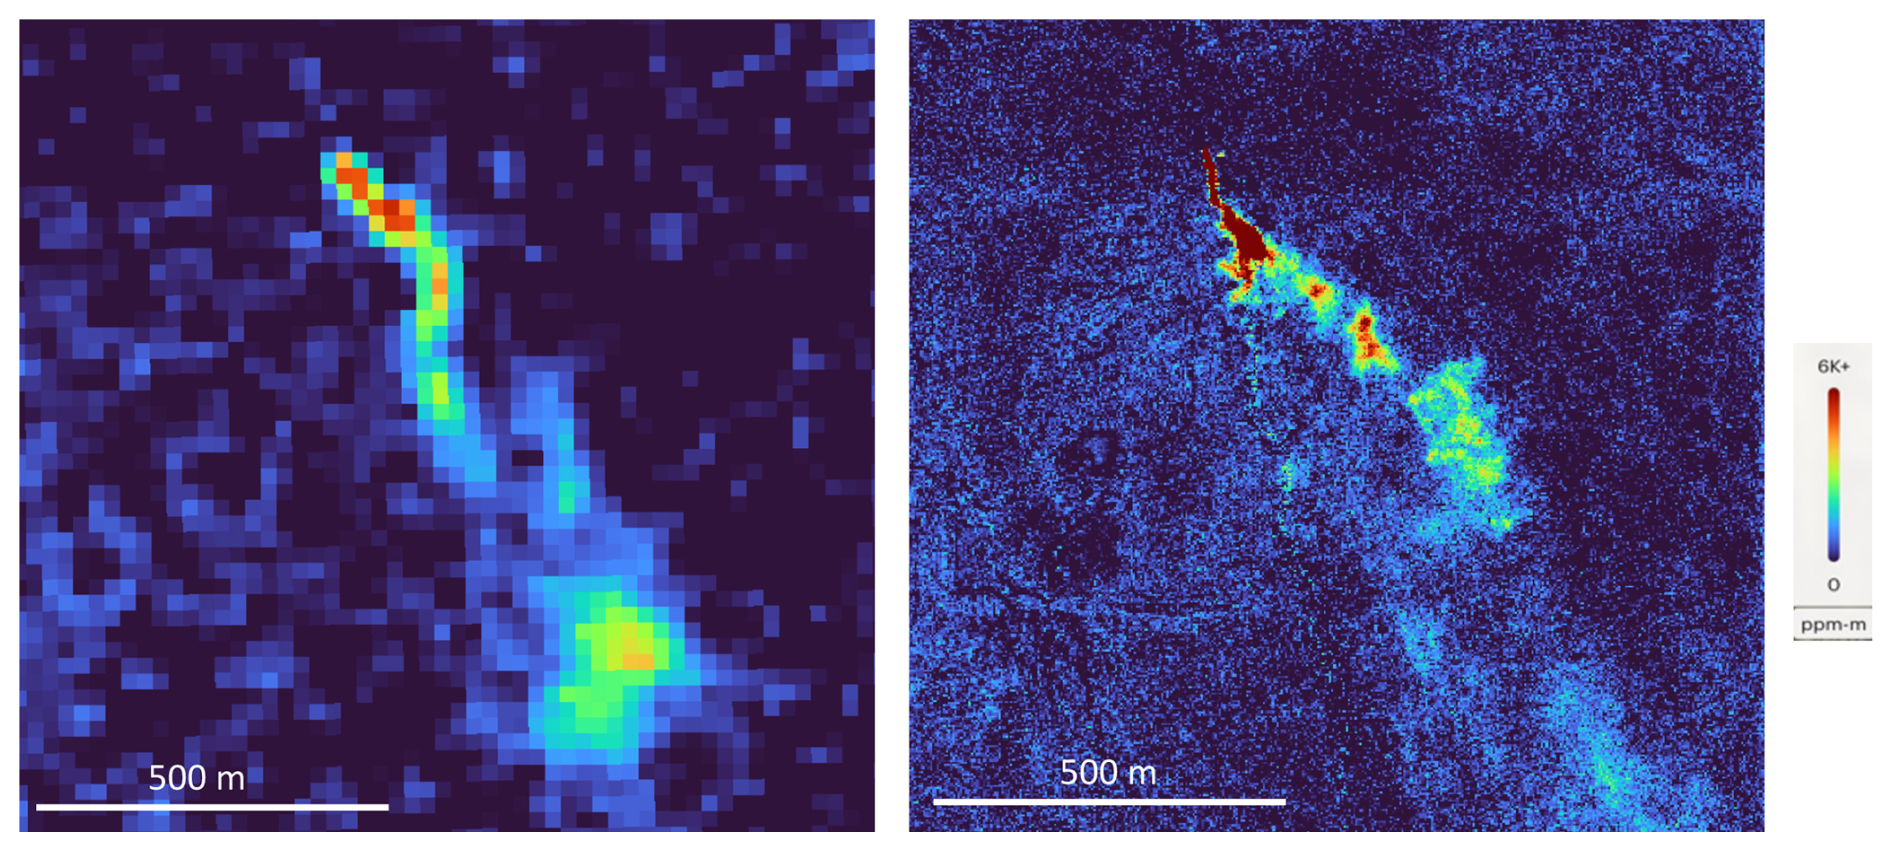
Figure 16CH4 retrieval outputs for plumes detected during near-simultaneous observations of a controlled release test in Arizona on 4 November 2024 with Tanager-1 at an altitude of about 500 km at 18:16:42 UTC (left panel) and AVIRIS-3 at an altitude of about 8 km at 18:17:10 UTC (right panel). In this case the AVIRIS-3 image is about 8 times higher spatial resolution than the Tanager-1 image. The images indicate consistent plume shape between the two observations. The geolocation of the methane plume origin from the two observations agreed to within 20 m. The emission rate estimate for the single Tanager-1 image was 775±111 kgCH4 h−1. The mean emission rate from three AVIRIS-3 observations within 10 min of the Tanager overpass was 882±133 kgCH4 h−1. The mean metered emission rate as reported by the controlled release team corresponding to the three AVIRIS-3 observations was 859±49 kgCH4 h−1.
Unblinded controlled release experiments of were conducted between 21 September and 16 October 2024, in Evanston, Wyoming (41.275815, −110.930561), and between 4 November and 31 December 2024, in Casa Grande, Arizona (32.821921, −111.785396). Test setup details are described in Sect. S5.
Figure 16 shows an example of near-simultaneous (<30 s separation) observations of one such controlled release test on 4 November 2024 by AVIRIS-3 and Tanager-1. In addition to consistent visual plume appearance, Carbon Mapper's analysis of the Tanager-1 and AVIRIS-3 aerial observations resulted emission estimate that agree to within about 10 % and plume geolocation estimates that agree to within 20 m. Figure 17 compares Carbon Mapper's estimated emission rates and the Stanford/U. Michigan reported emission rates for the 11 unblinded releases observed by Tanager-1. The slope and R2 of an ordinary least squares fit is shown for those observations of the two release sites. The Tanager observations here were acquired at initial higher orbital altitudes ranging from 430 to 510 km. Additionally, most of these tests occurred between November and December at the start of the northern hemisphere winter with lower sun elevations. These tests did not attempt to probe the Tanager detection limits given the system was not yet at peak sensitivity. As shown in Fig. 18, we note lower emission rate uncertainties for observations acquired in maximum sensitivity mode compared to standard sensitivity mode due to the differences in measurement precision.
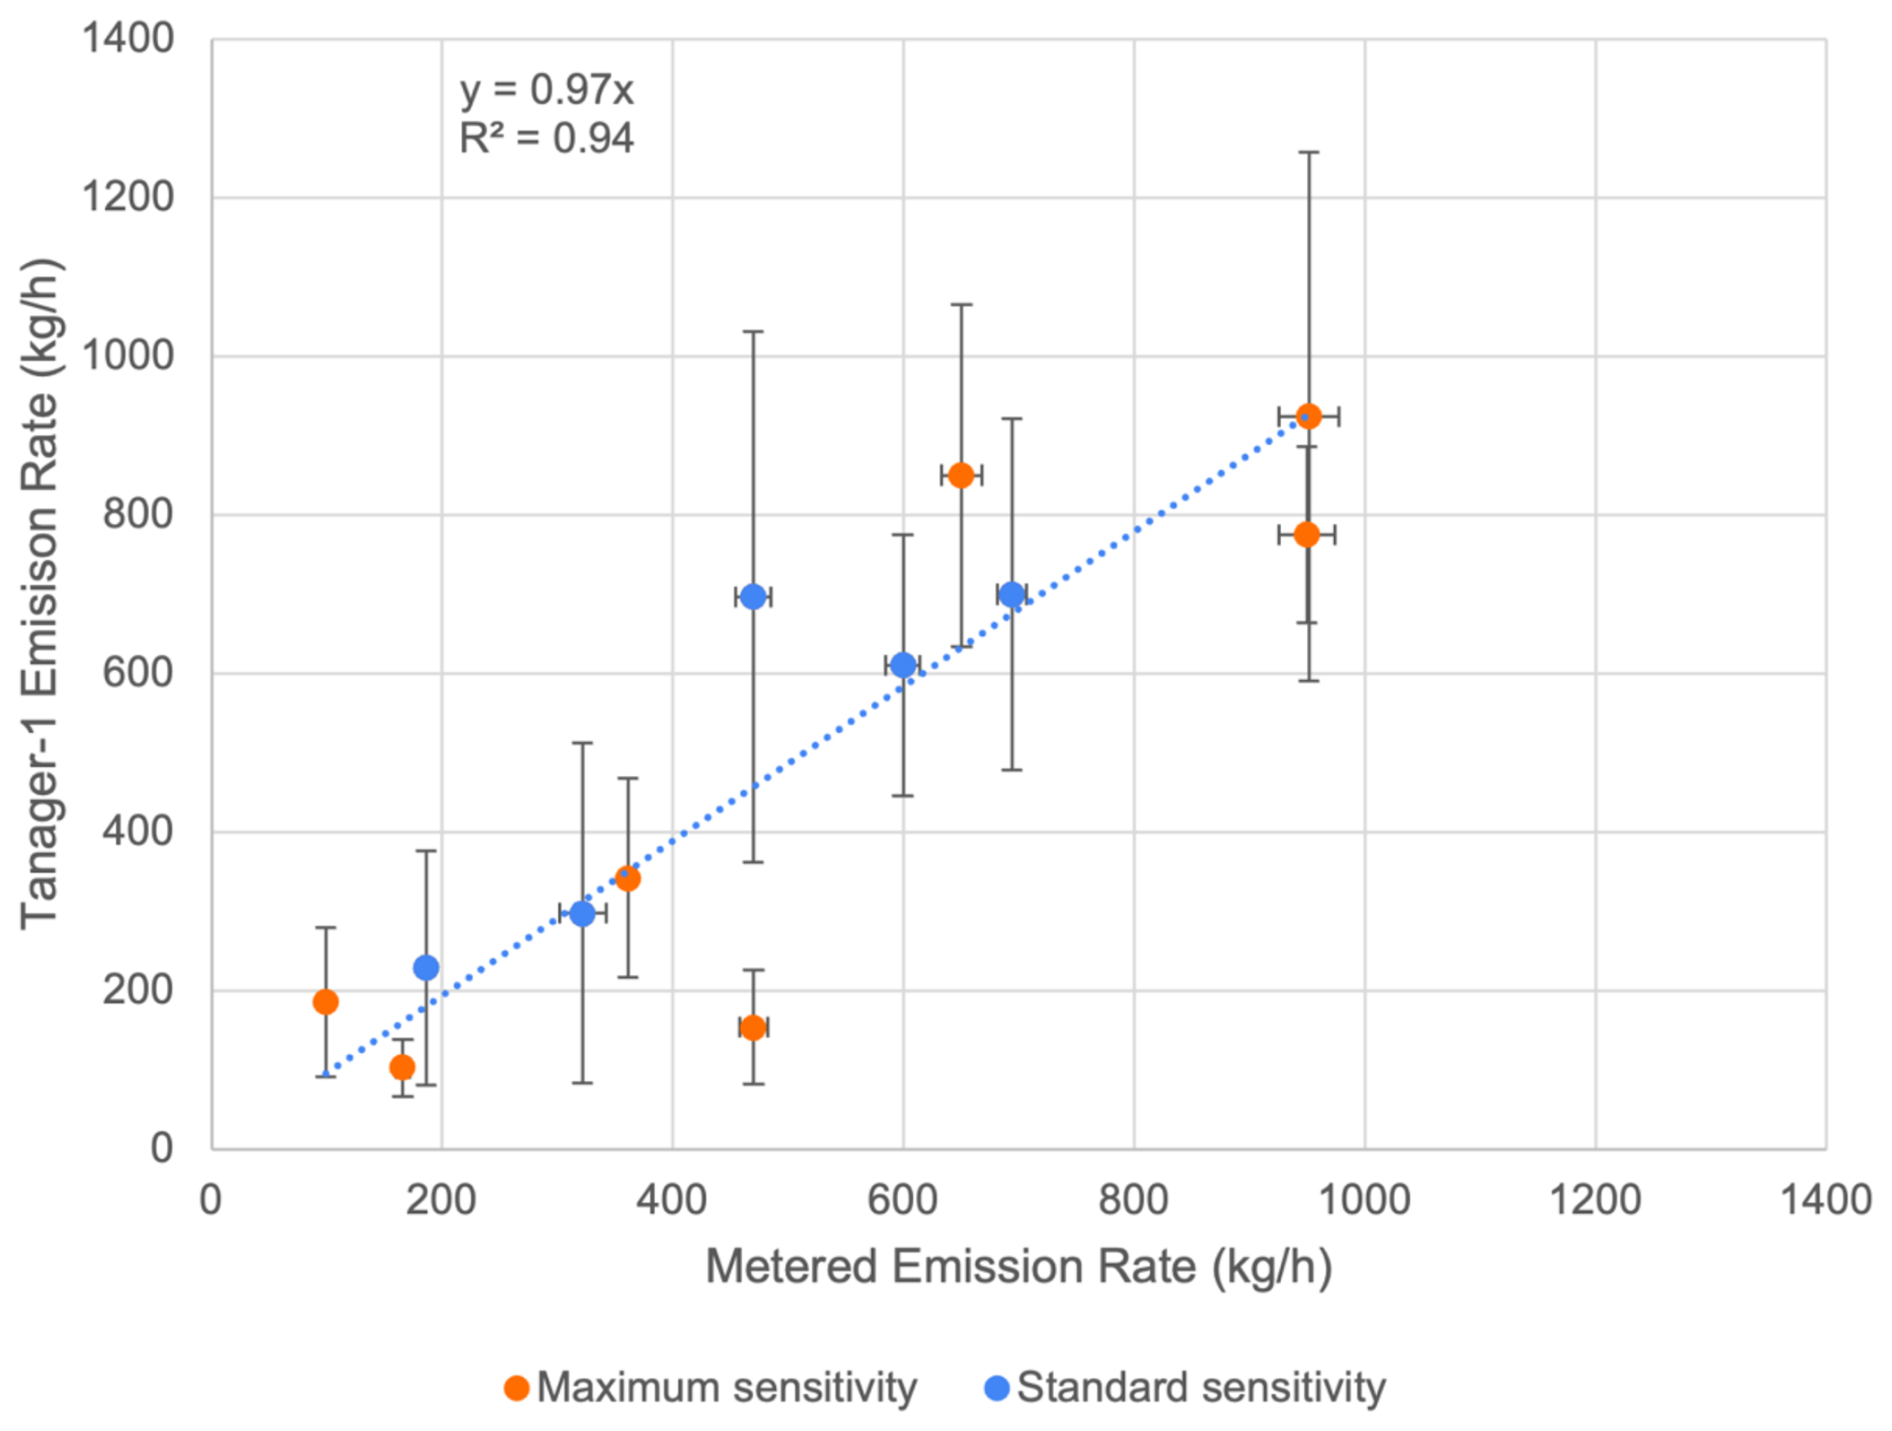
Figure 17Comparison of Carbon Mapper estimated emission rates and metered CH4 emission rates from the Stanford/U. Michigan controlled release team for cooperative (non-blind) testing of Tanager-1 at test sites Arizona and Wyoming. The slope and R2 for an ordinary least squares fit are shown. The error bars represent 1 standard deviation uncertainties in the Tanager-1 emission estimates and metered emission rates. The observations shown here were collected at initial higher orbital altitudes ranging from 430 to 510 km and used both maximum and standard sensitivity imaging modes. These initial experiments were designed to provide an initial evaluation of precision and bias rather than probing detection limits and do not represent final sensitivity.
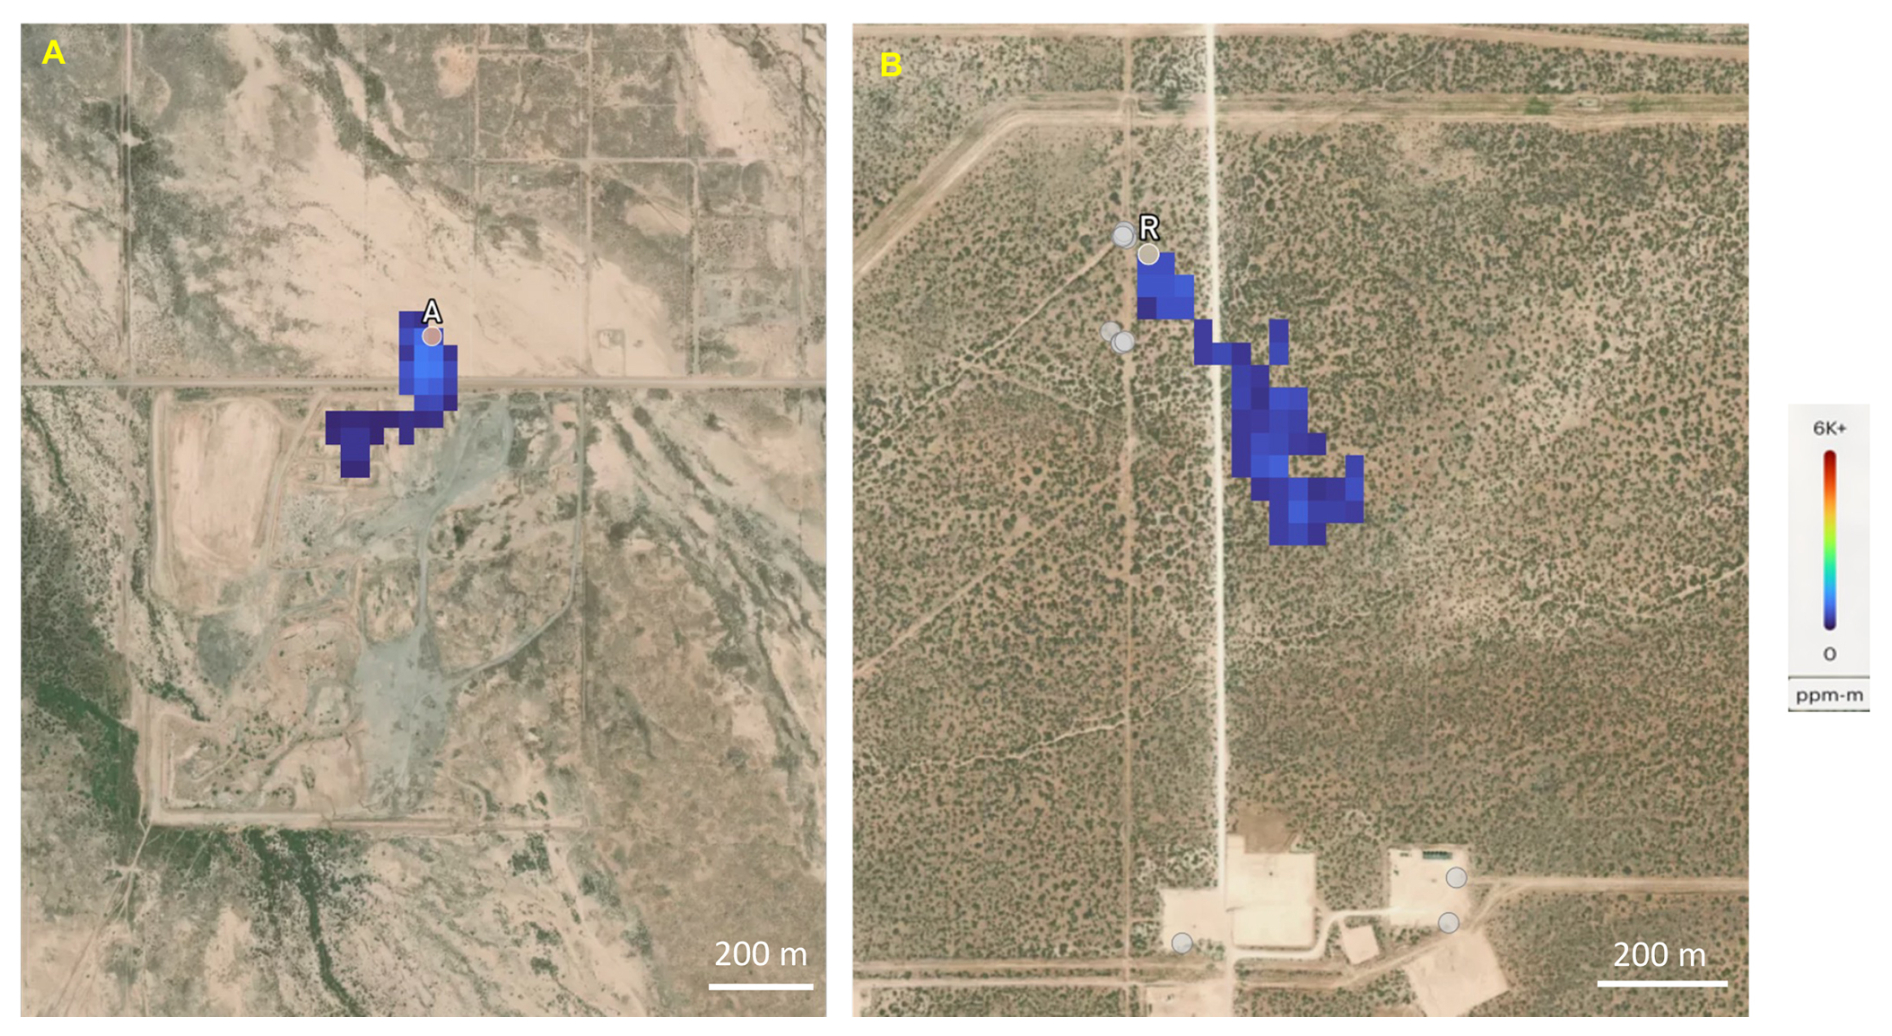
Figure 18Multi-pixel plumes with independent emission rate estimates in the range of the single pixel MDLs described in Tables 4 and 5. (A) shows a plume detected by Tanager-1 during an unblinded controlled release reported by surface metering as 99±4 kg h−1 on 21 December 2024 at 18:24 UTC. (B) shows a plume detected in the Permian basin that was observed near-simultaneously by AVIRIS-3 and quantified by AVIRIS-3 as 179±106 kg h−1 on 4 October 2024 at 17:48 UTC. Basemap image © Mapbox, © OpenStreetMap, and © Maxar.
As an additional check on the single pixel MDLs presented in Tables 4 and 5, we compare Tanager detections to independent metered rates and AVIRIS-3 quantified rates near the predicted Tanager MDL. Figure 18A shows a multi-pixel plume detected by Tanager-1, acquired in Maximum Sensitivity mode, for the lowest unblinded controlled release test with a reported release rate of 99±4 kg h−1 on 21 December 2024 at 18:24 UTC. Figure 18B shows another plume detected by Tanager-1 in Standard Sensitivity mode in the Permian Basin on 4 October 2024 at 17:48 UTC that was also detected by AVIRIS-3 and quantified by AVIRIS-3 as 179±106 kg h−1. In both cases a clear plume, extending well beyond a single pixel is readily visible, suggesting that our MDL predictions are in line with mass-balance noise estimates derived from Eq. (4).
We have described the design and observational strategies of the Carbon Mapper emissions monitoring system and provided an initial validation of the performance of Planet's Tanager-1 satellite through coordinated field measurements. We also demonstrated a range of key functional capabilities that were exercised during commissioning spanning observation, plume detection, quantification and rapid reporting. These empirical results indicate that Carbon Mapper and on-orbit Tanager performance is meeting our performance requirements, laying the foundation for further operational scale-up as more satellites are launched. Future papers will provide additional details on Tanager calibration and validation procedures, additional quantitative demonstration of CH4 estimation accuracy and probabilistic detection limits through blinded controlled release experiments, and further exploration of observing system completeness informed by actual operational experience.
The Carbon Mapper emission monitoring system is ultimately designed to detect, quantify and track 90 % of the world's high emission CH4 and CO2 point sources. Meeting that target will likely require a constellation of 10 or more Tanager satellites, because of observing system completeness demands for increased spatial coverage and sample frequency. Meanwhile, the planned interim constellation of four Tanager satellites is predicted to deliver about 60 % completeness for super-emitter detection globally and much higher completeness (approaching 100 %) for selected regions. We estimate that this interim capability could enable the detection of about 56 TgCH4 yr−1 in super-emitter emissions if CH4 point sources above 100 kgCH4 h−1 contribute 10 %, 30 %, 50 % and 50 %, respectively, to the agriculture, oil and gas, coal production and waste management sectors globally using bottom-up methane inventories for those sectors (Saunois et al., 2025). While those high emission point sources likely only constitute about 20 % of the global anthropogenic methane budget, they are also good candidates for expedited mitigation given those super emitters would be limited to a few thousand sites globally (compared to the millions of facilities that contribute the remaining methane flux including distributed area sources). Given the Global Methane Pledge of reducing methane emissions by 30 % by 2030, the ability to expedite action on mitigating methane super emitters could be an important component of the broader portfolio of mitigation programs this decade.
Beyond offering mitigation guidance for methane super-emitters, the Carbon Mapper emissions monitoring system is designed to improve quantitative understanding awareness of high emission CH4 and CO2 point sources at 30 m resolution for key regions around the globe through improved monitoring of the cloudy tropics, high latitudes and offshore oil and gas infrastructure – areas that have traditionally been challenging to observe. In doing so, our system serves as a key component in the growing multi-scale, tiered observing system for CH4 and CO2 emissions including other point source imagers as well as area flux mapping satellites.
To aid in expanded global awareness and data accessibility, Carbon Mapper publishes CH4 and CO2 data for all plumes detected by our system as quickly as 30 d following each observation, including quality-controlled retrieval outputs, plume images, coordinates, emission rates, uncertainties and attribution to source type. All Carbon Mapper CH4 and CO2 data is available for viewing and download via the Carbon Mapper public data portal (https://data.carbonmapper.org, last access: 16 November 2025) and API (https://api.carbonmapper.org/api/v1/docs, last access: 16 November 2025). Carbon Mapper documents including our Data Product Guide, Algorithm Theoretical Basis Documents, and Quality Control Description Document are available in the Technical Resources section of our website (https://carbonmapper.org/resources/technical-resources, last access: 16 November 2025). Additionally, rapid access (within 72 h) to Carbon Mapper quick-look methane products derived from Tanager is available from Planet for subscribers. Data from the controlled release tests referenced in this paper is available at the following repository https://doi.org/10.25740/qh001qt3946 (Reuland et al., 2025).
The supplement related to this article is available online at https://doi.org/10.5194/amt-18-6933-2025-supplement.
RD conceptualized and acquired funding for this work. RD, JN, MK, JG, JM, PG, and RG supervised key program elements. RD, DC, AA, KH, AD, TS, JK, KO, AT, SZ, LS, MG, RN, GB, DRT, and KR developed methodologies and implemented analysis. DJ, ME, FR, TA, AB, and EAK provided validation through independent aircraft under-flights and controlled release experiments. RD and DC wrote the draft manuscript, and all coauthors contributed to review and editing.
The contact author has declared that none of the authors has any competing interests.
Publisher’s note: Copernicus Publications remains neutral with regard to jurisdictional claims made in the text, published maps, institutional affiliations, or any other geographical representation in this paper. While Copernicus Publications makes every effort to include appropriate place names, the final responsibility lies with the authors. Views expressed in the text are those of the authors and do not necessarily reflect the views of the publisher.
The Carbon Mapper emissions monitoring system benefited from over a decade of research and technology development enabled by sustained support of NASA's Earth Science Division including the Carbon Monitoring System and airborne science programs. We thank the operations and data platform teams at Planet and Carbon Mapper for their efforts in managing Tanager observations and data delivery. Finally, we thank the management and staff of JPL and Planet for their support in establishing the unique public-private partnership that has underpinned this work.
Carbon Mapper research was funded by the generous support of our philanthropic donors including the High Tide Foundation, Grantham Foundation for the Protection of the Environment, Bloomberg Philanthropies, and other contributors. Portions of this work were performed at the Jet Propulsion Laboratory, California Institute of Technology, under a contract with the National Aeronautics and Space Administration (80NM0018D0004).
This paper was edited by Otto Hasekamp and reviewed by two anonymous referees.
Ayasse, A. K., Thorpe, A. K., Cusworth, D. H., Kort, E. A., Negron, A. G., Heckler, J., Asner, G. P., and Duren, R. M.: Methane remote sensing and emission quantification of offshore shallow water oil and gas platforms in the Gulf of Mexico, Environ. Res. Lett., 17, 084039, https://iopscience.iop.org/article/10.1088/1748-9326/ac8566/meta, 2022.
Ayasse, A. K., Cusworth, D., O'Neill, K., Fisk, J., Thorpe, A. K., and Duren, R.: Performance and sensitivity of column-wise and pixel-wise methane retrievals for imaging spectrometers, Atmos. Meas. Tech., 16, 6065–6074, https://doi.org/10.5194/amt-16-6065-2023, 2023.
Biener, K. J., Negron, A. G., Kort, E. A., Ayasse, A. K., Chen, Y., MacLean, J., and McKeever, J.: Environmental Science & Technology, 58, 4948–4956, https://doi.org/10.1021/acs.est.3c08066, 2024.
Bruegge, C. J., Arnold, G. T., Czapla-Myers, J., Dominguez, R., Helmlinger, M. C., Thompson, D. R., Van den Bosch, J., and Wenny, B. N.: Vicarious calibration of eMAS, AirMSPI, and AVIRIS sensors during FIREX-AQ, IEEE Transactions on Geoscience and Remote Sensing, 59, 10286–10297, 2021.
Byrne, B., Baker, D. F., Basu, S., Bertolacci, M., Bowman, K. W., Carroll, D., Chatterjee, A., Chevallier, F., Ciais, P., Cressie, N., Crisp, D., Crowell, S., Deng, F., Deng, Z., Deutscher, N. M., Dubey, M. K., Feng, S., García, O. E., Griffith, D. W. T., Herkommer, B., Hu, L., Jacobson, A. R., Janardanan, R., Jeong, S., Johnson, M. S., Jones, D. B. A., Kivi, R., Liu, J., Liu, Z., Maksyutov, S., Miller, J. B., Miller, S. M., Morino, I., Notholt, J., Oda, T., O'Dell, C. W., Oh, Y.-S., Ohyama, H., Patra, P. K., Peiro, H., Petri, C., Philip, S., Pollard, D. F., Poulter, B., Remaud, M., Schuh, A., Sha, M. K., Shiomi, K., Strong, K., Sweeney, C., Té, Y., Tian, H., Velazco, V. A., Vrekoussis, M., Warneke, T., Worden, J. R., Wunch, D., Yao, Y., Yun, J., Zammit-Mangion, A., and Zeng, N.: National CO2 budgets (2015–2020) inferred from atmospheric CO2 observations in support of the global stocktake, Earth Syst. Sci. Data, 15, 963–1004, https://doi.org/10.5194/essd-15-963-2023, 2023.
CARB: California Air Resources Board, Summary Report of the 2020, 2021, and 2023 Airborne Methane Plume Mapping Studies, 2024, https://ww2.arb.ca.gov/resources/documents/summary-report-2020-2021-and-2023-airborne-methane-plume-mapping-studies?keywords=2025 (last access: 1 November 2025), 2022.
CDPHE: Colorado Department of Public Health and the Environment, Aircraft Methane Plume Mapping Summary Report, 2024, https://oitco.hylandcloud.com/cdphermpop/docpop/docpop.aspx?docid=31557463 (last access: 21 November 2025), 2024.
Chan Miller, C., Roche, S., Wilzewski, J. S., Liu, X., Chance, K., Souri, A. H., Conway, E., Luo, B., Samra, J., Hawthorne, J., Sun, K., Staebell, C., Chulakadabba, A., Sargent, M., Benmergui, J. S., Franklin, J. E., Daube, B. C., Li, Y., Laughner, J. L., Baier, B. C., Gautam, R., Omara, M., and Wofsy, S. C.: Methane retrieval from MethaneAIR using the CO2 proxy approach: a demonstration for the upcoming MethaneSAT mission, Atmos. Meas. Tech., 17, 5429–5454, https://doi.org/10.5194/amt-17-5429-2024, 2024.
Conrad, B. M., Tyner, D. R., Johnson, M. R.: Robust probabilities of detection and quantification uncertainty for aerial methane detection: Examples for three airborne technologies, Remote Sensing of Environment, 288, 113499, ISSN 0034-4257, https://doi.org/10.1016/j.rse.2023.113499, 2023.
Crisp, D., Atlas, R. M., Breon, F.-M., Brown, L. R., Burrows, J. P., Ciais, P., Connor, B. J., Doney, S. C., Fung, I. Y., Jacob, D. J., Miller, C. E., O'Brien, D., Pawson, S., Randerson, J. T., Rayner, P., Salawitch, R. J., Sander, S. P., Sen, B., Stephens, G. L., Tans, P. P., Toon, G. C., Wennberg, P. O., Wofsy, S. C., Yung, Y. L., Kuang, Z., Chudasama, B., Sprague, G., Weiss, B., Pollock, R., Kenyon, D., and Schroll, S.: The Orbiting Carbon Observatory (OCO) mission, Advances in Space Research, 34, 700–709, https://doi.org/10.1016/j.asr.2003.08.062, 2004.
Cusworth, D. H., Duren, R. M., Thorpe, A. K., Olson-Duvall, W., Heckler, J., Chapman, J. W., and Eastwood, M. L.: Intermittency of Large Methane Emitters in the Permian Basin, Environmental Science & Technology Letters, 8, 567–73, https://doi.org/10.1021/acs.estlett.1c00173, 2021a.
Cusworth, D. H., Duren, R. M., Thorpe, A. K., Eastwood, M. L., Green, R. O., Dennison, P. E., Frankenberg, C., Heckler, J. W., Asner, G. P., and Miller, C. E.: Quantifying Global Power Plant Carbon Dioxide Emissions With Imaging Spectroscopy, AGU Advances, 2, https://doi.org/10.1029/2020AV000350, 2021b.
Cusworth, D. H., Thorpe, A. K., Ayasse, A. K., Stepp, D., Heckler, J., Asner, G. P., Miller, C. E., Chapman, J. W., Eastwood, M. L., Green, R. O., Hmiel, B., Lyon, D., and Duren, R. M.: Strong methane point sources contribute a disproportionate fraction of total emissions across multiple basins in the U.S., Proc. Natl Acad. Sci., 119, https://doi.org/10.1073/pnas.2202338119, 2022.
Cusworth, D. H., Duren, R. M., Ayasse, A. K., Jiorle, R., Howell, K., Aubrey, A., Green, R. O., Eastwood, M. L., Chapman, J. W., Thorpe, A. K., Heckler, J., Asner, G. P., Smith, M. L., Thoma, E., Krause, M. J., Heins, D., and Thorneloe, S.: Quantifying Methane Emissions from United States Landfills, Science, 383, 1499–1504, https://doi.org/10.1126/science.adi7735, 2024.
Duren, R. M., Thorpe, A., Foster, K. T., Rafiq, T., Hopkins, F. M., Yadav, V., Bue, B., Thompson, D. R., Conley, S., Colombi, N., Frankenberg, C., McCubbin, I., Eastwood, M., Falk, M., Herner, J., Croes, B. E., Green, R., and Miller, C.: California's Methane Super emitters, Nature, 575, 180–84, https://doi.org/10.1038/s41586-019-1720-3, 2019.
El Abbadi, S. H., Chen, Z., Burdeau, P. M., Rutherford, J. S., Chen, Y., Zhang Z., Sherwin, E. D., and Brandt, A. R.: Environmental Science & Technology, 58, 9591–9600, https://doi.org/10.1021/acs.est.4c02439, 2024.
Eldering, A., Taylor, T. E., O'Dell, C. W., and Pavlick, R.: The OCO-3 mission: measurement objectives and expected performance based on 1 year of simulated data, Atmos. Meas. Tech., 12, 2341–2370, https://doi.org/10.5194/amt-12-2341-2019, 2019.
Frankenberg, C., Platt, U., and Wagner, T.: Iterative maximum a posteriori (IMAP)-DOAS for retrieval of strongly absorbing trace gases: Model studies for CH4 and CO2 retrieval from near infrared spectra of SCIAMACHY onboard ENVISAT, Atmos. Chem. Phys., 5, 9–22, https://doi.org/10.5194/acp-5-9-2005, 2005.
Frankenberg, C., Aben, I., Bergamaschi, P., Dlugokencky, E. J., van Hees, R., Houweling, S., van der Meer, P., Snel, R., and Tol, P., Global column-averaged methane mixing ratios from 2003 to 2009 as derived from SCIAMACHY: Trends and variability, J. Geophys. Res., 116, D04302, https://doi.org/10.1029/2010JD014849, 2011.
Frankenberg, C., Thorpe, A. K., Thompson, D. R., Hulley, G., Kort, E. A., Vance, N., Borchardt, J., Krings, T., Gerilowski, K., Sweeney, C., and Conley, S.: Airborne methane remote measurements reveal heavy-tail flux distribution in Four Corners region, Proc. Natl Acad. Sci., 113, 9734–9739, 2016.
Frankenberg, C., Bar-On, Y. M., Yin, Y., Wennberg, P. O., Jacob, D. J., and Michalak, A. M.: Data drought in the humid tropics: How to overcome the cloud barrier in greenhouse gas remote sensing, Geophysical Research Letters, 51, e2024GL108791, https://doi.org/10.1029/2024GL108791, 2024.
Guanter, L., Irakulis-Loitxate, I., Gorroño, J., Sánchez-García, E., Cusworth, D. H., Varon, D. J., Cogliati, S., and Colombo, R.: Mapping methane point emissions with the PRISMA spaceborne imaging spectrometer, Remote Sensing of Environment, 265, 112671, https://doi.org/10.1016/j.rse.2021.112671, 2021.
Gorchov Negron, A. M., Kort, E. A., Chen, Y., Brandt, A. R., Smith, M. L., Plant, G., Ayasse, A. K., Schwietzke, S., Zavala-Araiza, D., Hausman, C., and Adames-Corraliza Á. F.: Excess methane emissions from shallow water platforms elevate the carbon intensity of US Gulf of Mexico oil and gas production, Proc. Natl. Acad. Sci. U.S.A., 120, e2215275120, https://doi.org/10.1073/pnas.2215275120, 2023.
Green, R. O., Schaepman, M. E., Mouroulis, P., Geier, S., Shaw, L., Hueini, A., Bernas, M., McKinley, I., Smith, C., Wehbe, R., Eastwood, M., Vinckier, Q., Liggett, E., Zandbergen, S., Thompson, D., Sullivan, P., Sarture, C., Van Gorp, B., and Helmlinger, M.: Airborne Visible/Infrared Imaging Spectrometer 3 (AVIRIS-3), 2022 IEEE Aerospace Conference (AERO), Big Sky, MT, USA, 1–10, https://doi.org/10.1109/AERO53065.2022.9843565, 2022.
Hu, H., Landgraf, J., Detmers, R., Borsdorff, T., Aan de Brugh, J., Aben, I., Butz, A., and Hasekamp, O.: Toward global mapping of methane with TROPOMI: First results and intersatellite comparison to GOSAT, Geophysical Research Letters, 45, 3682–3689, https://doi.org/10.1002/2018GL077259, 2018.
Irakulis-Loitxate, I., Guanter, L., Liu, Y., Varon, D. J., Maasakkers, J. D., Zhang, Y., Chulakadabba, A., Wofsy, S. C., Thorpe, A. K., Duren, R. M., Frankenberg, C., Lyon, D. R., Hmiel, B., Cusworth, D. H., Zhang, Y., Segl, K., Gorroño, J., Sánchez-García, E., Sulprizio, M. P., Cao, K., Zhu, H., Liang, J., Li, X., Aben, I., and Jacob, D. J.: Satellite-based survey of extreme methane emissions in the Permian basin, Sci. Adv., 7, eabf4507, https://doi.org/10.1126/sciadv.abf4507, 2021.
Jacob, D. J., Turner, A. J., Maasakkers, J. D., Sheng, J., Sun, K., Liu, X., Chance, K., Aben, I., McKeever, J., and Frankenberg, C.: Satellite observations of atmospheric methane and their value for quantifying methane emissions, Atmos. Chem. Phys., 16, 14371–14396, https://doi.org/10.5194/acp-16-14371-2016, 2016.
Jacob, D. J., Varon, D. J., Cusworth, D. H., Dennison, P. E., Frankenberg, C., Gautam, R., Guanter, L., Kelley, J., McKeever, J., Ott, L. E., Poulter, B., Qu, Z., Thorpe, A. K., Worden, J. R., and Duren, R. M.: Quantifying methane emissions from the global scale down to point sources using satellite observations of atmospheric methane, Atmos. Chem. Phys., 22, 9617–9646, https://doi.org/10.5194/acp-22-9617-2022, 2022.
Jervis, D., McKeever, J., Durak, B. O. A., Sloan, J. J., Gains, D., Varon, D. J., Ramier, A., Strupler, M., and Tarrant, E.: The GHGSat-D imaging spectrometer, Atmos. Meas. Tech., 14, 2127–2140, https://doi.org/10.5194/amt-14-2127-2021, 2021.
Jervis, D., Girard, M., MacLean, J.-P., McKeever, J., Ramier, A., Strupler, M., Tarrant, E., and Young, D.: Quantifying the Plume Detection Probability of the GHGSat Constellation, AGU Fall Meeting, Chigago, IL, USA, 12–16 December 2022, A13E, https://ui.adsabs.harvard.edu/abs/2022AGUFM.A13E..07J/abstract (last access: 19 November 2025), 2022.
Kim, J., Cusworth, D. H., Ayasse, A. K., Howell, K., O'Neill, K., and Duren, R. M.: Performance of airborne imaging spectrometers for carbon dioxide detection and emission quantification, Journal of Geophysical Research: Atmospheres, 130, e2024JD042755, https://doi.org/10.1029/2024JD042755, 2025.
Lauvaux, T., Giron, C., Mazzolini, M., d'Aspremont, A., Duren, R., Cusworth, D., Shindell, D., and Ciais, P.: Global assessment of oil and gas methane ultra-emitters, Science, 2, 557–561, https://doi.org/10.1126/science.abj4351, 2022.
McLinden, C. A., Griffin, D., Davis, Z., Hempel, C., Smith, J., Sioris, C., Nassar, R., Moeini, O., Legault-Ouellet, E., and Malo A.: An independent evaluation of GHGSat methane emissions: Performance assessment, Journal of Geophysical Research: Atmospheres, 129, https://doi.org/10.1029/2023JD039906, 2024.
Mouroulis, P. and Green, R. O.: Review of high fidelity imaging spectrometer design for remote sensing, Opt. Eng. 57, 040901, https://doi.org/10.1117/1.OE.57.4.040901, 2018.
Naus, S., Maasakkers, J. D., Gautam, R., Omara, M., Stikker, R., Veenstra, A. K., Nathan, B., Irakulis-Loitxate, I., Guanter, L., Pandey, S., Girard, M., Lorente, A., Borsdorff, T., and Aben, I.: Environmental Science & Technology, 57, 19545–19556, https://doi.org/10.1021/acs.est.3c04746, 2023.
Nassar, R., Mastrogiacomo, J.-P., Bateman-Hemphill, W., McCracken, C., MacDonald, C. G., Hill, T., O'Dell, C. W., Kiel, M., and Crisp, D.: Advances in quantifying power plant CO2 emissions with OCO-2, Remote Sensing of Environment, 264, 112579, https://doi.org/10.1016/j.rse.2021.112579, 2021.
Nesser, H., Jacob, D. J., Maasakkers, J. D., Lorente, A., Chen, Z., Lu, X., Shen, L., Qu, Z., Sulprizio, M. P., Winter, M., Ma, S., Bloom, A. A., Worden, J. R., Stavins, R. N., and Randles, C. A.: High-resolution US methane emissions inferred from an inversion of 2019 TROPOMI satellite data: contributions from individual states, urban areas, and landfills, Atmos. Chem. Phys., 24, 5069–5091, https://doi.org/10.5194/acp-24-5069-2024, 2024.
Pandey, S., Gautam, R., Houweling, S., van der Gon, H. D., Sadavarte, P., Borsdorff, T., Hasekamp, O., Landgraf, J., Tol, P., van Kempen, T., Hoogeveen, R., van Hees, R., Hamburg, S. P., Maasakkers, J. D., and Aben, I.: Satellite observations reveal extreme methane leakage from a natural gas well blowout, Proc. Natl. Acad. Sci. U.S.A., 116, 26376–26381, https://doi.org/10.1073/pnas.1908712116, 2019.
Reuland, F., Adams, T., Kort, E. A., and Brandt, A. R.: Large-Scale Controlled Methane Releases for Satellite-Based Detection and Emission Quantification of Methane Point-Sources, Version 5, Stanford Digital Repository [data set], https://doi.org/10.25740/qh001qt3946, 2025.
Roger, J., Irakulis-Loitxate, I., Valverde, A., Gorroño, J., Chabrillat, S., Brell, M., and Guanter, L.: High-Resolution Methane Mapping With the EnMAP Satellite Imaging Spectroscopy Mission, IEEE Transactions on Geoscience and Remote Sensing, 62, 4102012, https://doi.org/10.1109/TGRS.2024.3352403, 2024.
Saunois, M., Martinez, A., Poulter, B., Zhang, Z., Raymond, P. A., Regnier, P., Canadell, J. G., Jackson, R. B., Patra, P. K., Bousquet, P., Ciais, P., Dlugokencky, E. J., Lan, X., Allen, G. H., Bastviken, D., Beerling, D. J., Belikov, D. A., Blake, D. R., Castaldi, S., Crippa, M., Deemer, B. R., Dennison, F., Etiope, G., Gedney, N., Höglund-Isaksson, L., Holgerson, M. A., Hopcroft, P. O., Hugelius, G., Ito, A., Jain, A. K., Janardanan, R., Johnson, M. S., Kleinen, T., Krummel, P. B., Lauerwald, R., Li, T., Liu, X., McDonald, K. C., Melton, J. R., Mühle, J., Müller, J., Murguia-Flores, F., Niwa, Y., Noce, S., Pan, S., Parker, R. J., Peng, C., Ramonet, M., Riley, W. J., Rocher-Ros, G., Rosentreter, J. A., Sasakawa, M., Segers, A., Smith, S. J., Stanley, E. H., Thanwerdas, J., Tian, H., Tsuruta, A., Tubiello, F. N., Weber, T. S., van der Werf, G. R., Worthy, D. E. J., Xi, Y., Yoshida, Y., Zhang, W., Zheng, B., Zhu, Q., Zhu, Q., and Zhuang, Q.: Global Methane Budget 2000–2020, Earth Syst. Sci. Data, 17, 1873–1958, https://doi.org/10.5194/essd-17-1873-2025, 2025.
Sherwin, E. D., Rutherford, J. S., Zhang, Z., Chen, Y., Wetherley, E. B., Yakovlev, P. V., Berman, E. S. F., Jones, B. B., Cusworth, D. H., Thorpe, A. K., Ayasse, A. K., Duren,R. M., and Brandt, A. R.: US oil and gas system emissions from nearly one million aerial site measurements, Nature, 627, 328–334, https://doi.org/10.1038/s41586-024-07117-5, 2024.
Schuit, B. J., Maasakkers, J. D., Bijl, P., Mahapatra, G., van den Berg, A.-W., Pandey, S., Lorente, A., Borsdorff, T., Houweling, S., Varon, D. J., McKeever, J., Jervis, D., Girard, M., Irakulis-Loitxate, I., Gorroño, J., Guanter, L., Cusworth, D. H., and Aben, I.: Automated detection and monitoring of methane super-emitters using satellite data, Atmos. Chem. Phys., 23, 9071–9098, https://doi.org/10.5194/acp-23-9071-2023, 2023.
Tanimoto, H., Matsunaga, T., Someya, Y., Fujinawa, T., Ohyama, H., Morino, I., Yashiro, H., Sugita, T., Inomata, S., Müller, A., Saeki, T., Yoshida, Y., Niwa, Y., Saito, M., Noda, H., Yamashita, Y., Ikeda, K., Saigusa, N., Machida, T., Frey, M. M., Lim, H., Srivastava, P., Jin, Y., Shimizu, A., Nishizawa, T., Kanaya, Y., Sekiya, T., Patra, P., Takigawa, M., Bisht, J., Kasai, Y., and Sato, T. O.: The greenhouse gas observation mission with Global Observing SATellite for Greenhouse gases and Water cycle (GOSAT-GW): objectives, conceptual framework and scientific contributions, Prog. Earth Planet. Sci., 12, 8, https://doi.org/10.1186/s40645-025-00684-9, 2025.
Thompson, D. R., Leifer, I., Bovensmann, H., Eastwood, M., Fladeland, M., Frankenberg, C., Gerilowski, K., Green, R. O., Kratwurst, S., Krings, T., Luna, B., and Thorpe, A. K.: Real-time remote detection and measurement for airborne imaging spectroscopy: a case study with methane, Atmos. Meas. Tech., 8, 4383–4397, https://doi.org/10.5194/amt-8-4383-2015, 2015.
Thompson, D. R., Thorpe, A. K., Frankenberg, C., Green, R. O., Duren, R., Guanter, L., Hollstein, A., Middleton, E., Ong, L., and Ungar, S.: Space-based remote imaging spectroscopy of the Aliso Canyon CH4 superemitter, Geophys. Res. Lett., 43, 6571–6578, https://doi.org/10.1002/2016GL069079, 2016.
Thompson, D. R., Natraj, V., Green, R. O., Helmlinger, M. C., Gao, B.-C., and Eastwood, M. L.: Optimal estimation for imaging spectrometer atmospheric correction, Remote Sensing of Environment, 216, 355–373, 2018.
Thompson, D. R., Green, R. O., Bradley, C., Brodrick, P. G., Mahowald, N., Dor, E. B., Bennett, M., Bernas, M., Carmon, N., Chadwick, K. D., Clark, R. N., Coleman, R. W., Cox, E., Diaz, E., Eastwood, M. L., Eckert, R., Ehlmann, B. L., Ginoux, P., Ageitos, M. G., Grant, K., Guanter, L., Pearlshtien, D. H., Helmlinger, M., Herzog, H., Hoefen, T., Huang, Y., Keebler, A., Kalashnikova, O., Keymeulen, D., Kokaly, R., Klose, M., Li, L., Lundeen, S. R., Meyer, J., Middleton, E., Miller, R. L., Mouroulis, P., Oaida, B., Obiso, V., Ochoa, F., Olson-Duvall, W., Okin, G. S., Painter, T. H., Pérez García-Pando, C., Pollock, R., Realmuto, V., Shaw, L., Sullivan, P., Swayze, G., Thingvold, E., Thorpe, A. K., Vannan, S., Villarreal, C., Ung, C., Wilson, D. W., and Zandbergen, S.: On-orbit calibration and performance of the EMIT imaging spectrometer, Remote Sensing of Environment, 303, 113986, https://doi.org/10.1016/j.rse.2023.113986, 2024.
Thorpe, A. K., Frankenberg, C., Thompson, D. R., Duren, R. M., Aubrey, A. D., Bue, B. D., Green, R. O., Gerilowski, K., Krings, T., Borchardt, J., Kort, E. A., Sweeney, C., Conley, S., Roberts, D. A., and Dennison, P. E.: Airborne DOAS retrievals of methane, carbon dioxide, and water vapor concentrations at high spatial resolution: application to AVIRIS-NG, Atmos. Meas. Tech., 10, 3833–3850, https://doi.org/10.5194/amt-10-3833-2017, 2017.
Thorpe, A. K., Green, R. O., Thompson, D. R., Brodrick, P. G., Chapman, J. W., Elder C. D., Irakulis-Loitxate, I., Cusworth, D. H., Ayasse, A. K., Duren, R. M., Frankenberg, C., Guanter, L., Worden, J. R., Dennison, P. E., Roberts, D. A., Chadwick, K. D., Eastwood, M. L., Fahlen, J. E., and Miller, C. E.: Attribution of individual methane and carbon dioxide emission sources using EMIT observations from space, Sci. Adv., 9, https://doi.org/10.1126/sciadv.adh2391, 2023.
Turner, A. J., Jacob, D. J., Wecht, K. J., Maasakkers, J. D., Lundgren, E., Andrews, A. E., Biraud, S. C., Boesch, H., Bowman, K. W., Deutscher, N. M., Dubey, M. K., Griffith, D. W. T., Hase, F., Kuze, A., Notholt, J., Ohyama, H., Parker, R., Payne, V. H., Sussmann, R., Sweeney, C., Velazco, V. A., Warneke, T., Wennberg, P. O., and Wunch, D.: Estimating global and North American methane emissions with high spatial resolution using GOSAT satellite data, Atmos. Chem. Phys., 15, 7049–7069, https://doi.org/10.5194/acp-15-7049-2015, 2015.
United Nations (UN): Paris Agreement, https://unfccc.int/process-and-meetings/the-paris-agreement (last access: 1 November 2025), 2015.
United Nations (UN): Kigali Amendment to the Montreal Protocol, https://treaties.un.org/doc/Treaties/2016/10/20161015 03-23 PM/Ch_XXVII-2.f-English and French.pdf (last access: 1 November 2025), 2016.
United Nations (UN): Global Methane Pledge, https://www.globalmethanepledge.org/resources/global-methane-pledge (last access: 1 November 2025), 2023.
UNEP: Oil and Gas Methane Partnership 2.0, https://www.ogmpartnership.org/ (last access: 1 November 2025), 2020.
United States Environmental Protection Agency (US EPA): 40 CFR Part 60 – Standards of Performance for New, Reconstructed, and Modified Sources and Emissions Guidelines for Existing Sources: Oil and Natural Gas Sector, EPA–HQ–OAR–2021–0317, https://www.federalregister.gov/d/2024-13206 (last access: 1 November 2025), 2024a.
United States Environmental Protection Agency (US EPA): 40 CFR Part 98 – Mandatory Greenhouse Gas Reporting, Subpart W–Petroleum and Natural Gas Systems, https://www.ecfr.gov/current/title-40/part-98/subpart-W (last access: 1 November 2025), 2024b.
Worden, J. R., Cusworth, D. H., Qu, Z., Yin, Y., Zhang, Y., Bloom, A. A., Ma, S., Byrne, B. K., Scarpelli, T., Maasakkers, J. D., Crisp, D., Duren, R., and Jacob, D. J.: The 2019 methane budget and uncertainties at 1° resolution and each country through Bayesian integration Of GOSAT total column methane data and a priori inventory estimates, Atmos. Chem. Phys., 22, 6811–6841, https://doi.org/10.5194/acp-22-6811-2022, 2022.
Zandbergen, S. R., Duren, R., Giuliano, P., Green, R. O., Haag, J. M., Moore, L. B., Shaw, L., and Mouroulis, P.: Optical design of the Carbon Plume Mapper (CPM) imaging spectrometer, Proc. SPIE 12235, Imaging Spectrometry XXV: Applications, Sensors, and Processing, 1223505, https://doi.org/10.1117/12.2633767, 2022.
Zandbergen, S. R., Shaw, L., Klein, C., Thompson, D. R., Green, R. O., Duren, R., Gibson, M., Nazaryan, H., Smith, C., Cubanski, B., Giuliano, P., Haag, J. M., and Pritchett, C.: Preliminary alignment, characterization, and comparison of next generation carbon mapping imaging spectrometers, Proc. SPIE 12688, Imaging Spectrometry XXVI: Applications, Sensors, and Processing, 126880C, https://doi.org/10.1117/12.2678614, 2023.
- Abstract
- Introduction and objectives
- System Design
- Tanager-1 commissioning: demonstration of key capabilities
- Performance predictions and validation
- Summary
- Data availability
- Author contributions
- Competing interests
- Disclaimer
- Acknowledgements
- Financial support
- Review statement
- References
- Supplement