the Creative Commons Attribution 4.0 License.
the Creative Commons Attribution 4.0 License.
 | 10 Feb 2025
Retrievals of water vapour and temperature exploiting the far-infrared: application to aircraft observations in preparation for the FORUM mission
Sanjeevani Panditharatne
Helen Brindley
Caroline Cox
Richard Siddans
Jonathan Murray
Laura Warwick
Stuart Fox
We present the extension of the Rutherford Appleton Laboratory (RAL) Infrared Microwave Sounding (IMS) optimal estimation retrieval scheme to include the use of far-infrared channels in preparation for the upcoming Far-infrared Outgoing Radiation Understanding and Monitoring (FORUM) mission. The IMS code has been previously applied to mid-infrared spectral radiances measured by the Infrared Atmospheric Sounding Instrument (IASI) to retrieve temperature and water vapour. Given this, the evolution and evaluation of the extended scheme is performed in two steps. First, clear-sky retrievals of temperature and water vapour are performed on IASI and FORUM simulations. Comparable retrieval biases are observed for retrievals of temperature and water vapour; however, there is an increase of ∼ 1 degree of freedom for water vapour and temperature for the FORUM configuration. Secondly, radiances observed from an aircraft flight in the upper troposphere are modified to match the FORUM spectral characteristics. Retrievals from these radiances using the modified code show a strong agreement with contemporaneous in situ measurements of the atmospheric state, reducing the root-mean-square error (RMSE) by 18 % for water vapour from the a priori, giving confidence in its performance. The extended IMS scheme is now available for use on FORUM observations and can be easily adapted to other far- and mid-infrared instrument configurations.
- Article
(7484 KB) - Full-text XML
-
Supplement
(2257 KB) - BibTeX
- EndNote


Water vapour composes approximately 3 % of the Earth's atmosphere and is the most dominant greenhouse gas with absorption bands in the microwave, infrared, and visible spectral regions (Harries, 1996; Andrews, 2000). Capturing its spatial and temporal distribution is critical in quantifying the Earth's greenhouse effect, characterising atmospheric circulation, and approximating the strength of water vapour's radiative effect and feedback, which has the potential to exacerbate anthropogenic climate change (Dessler et al., 2008; Chung et al., 2014).
Water vapour in the upper troposphere strongly regulates this water vapour feedback (Chung et al., 2014), with current increases in tropospheric moisture consistent with an amplifying water vapour feedback (IPCC, 2023). However, discrepancies in long-term trends exist between observations, climate models, and reanalysis datasets (Schröder et al., 2019; Santer et al., 2021; Allan et al., 2022). Considerable work has been performed to improve assessments of water vapour distributions through the use of in situ measurements such as radiosondes and aircraft-based sensors (Sun et al., 2021). However, best-case uncertainties from the Global Climate Observing System (GCOS) Reference Upper Air Network (GRUAN) radiosondes are estimated to still be of the order 5 %, reaching 15 % near the tropopause (Dirksen et al., 2014), with limited homogeneity in the radiosondes' distribution, regularity, and vertical sampling (Ferreira et al., 2019).
Satellite observations across the electromagnetic spectrum have also been used to characterise the atmosphere with increased spatial coverage. However, satellite retrievals can lack sufficient vertical resolution (Chung et al., 2014), demonstrate an inherent bias (Santer et al., 2021), or have a reduced sensitivity to upper tropospheric water vapour (Kursinski and Gebhardt, 2014), causing inconsistencies between retrieved upper tropospheric humidities (Shi et al., 2022). While hyperspectral sounders, such as the Atmospheric Infrared Sounder (AIRS) and the Infrared Atmospheric Sounding Interferometer (IASI), have improved the vertical resolution of water vapour and temperature (Chahine et al., 2006; Hilton et al., 2012), radiances in the mid-infrared region (667–2000 cm−1) have a limited sensitivity to water vapour in the mid- to upper troposphere, and upper tropospheric biases remain present (Fetzer et al., 2008; Trent et al., 2019).
In the global mean, the far-infrared region (100–667 cm−1) accounts for approximately 55 % of the outgoing longwave radiation (OLR), and the absorption of water vapour dominates this region, with its pure rotational band extending from 6 to 667 cm−1 (Brindley and Harries, 1998). As a consequence, radiances in this region are significantly more sensitive to middle and upper tropospheric water vapour than in the mid-infrared region (Sinha and Harries, 1995; Brindley and Harries, 1998).
Due to technical limitations, there are historically no observations of spectrally resolved far-infrared radiances at the top of the atmosphere (TOA). However, this is changing due to space missions such as NASA's Polar Radiant Energy in the Far-InfraRed Experiment and ESA's Far-infrared Outgoing Radiation Understanding and Monitoring (FORUM) mission, with the former having launched in summer 2024 and the latter scheduled for launch in 2027 (L'Ecuyer et al., 2021; Palchetti et al., 2020).
This study is in support of the FORUM mission that aims to measure the Earth's spectrally resolved OLR using the FORUM Sounding Instrument (FSI), which will have a spectral range from 100 to 1600 cm−1 with a spectral resolution greater than 0.5 cm−1 and a target radiometric accuracy of 0.1 K at 3σ. The FORUM satellite will fly in a loose formation with the EUMETSAT MetOp-SG-1A satellite, complementing mid-infrared observations of the OLR taken by the Infrared Atmospheric Sounding Instrument New Generation (IASI-NG); when combined, these observations will create a unique dataset of the Earth's entire OLR spectrum (Palchetti et al., 2020).
Given the sensitivities and spectral features across the far-infrared for water vapour, there is a significant potential for improved retrievals from the upcoming TOA observations in the far-infrared (Harries et al., 2008; Ridolfi et al., 2020). Theoretical studies by Merrelli and Turner (2012) demonstrated this potential in retrievals of simulated upwelling radiances with realistic instrument configurations, and the benefit of far-infrared information has recently been confirmed by Warwick et al. (2022), who performed a single retrieval on a spectrum covering the far- and mid-infrared regions observed from an aircraft flying in the upper troposphere. To date, other existing retrieval codes built to exploit the far-infrared have only been tested on simulations of upwelling far- and mid-infrared radiances, and observations of downwelling radiances have been limited to the spectral range of 200–1000 cm−1 (Di Natale et al., 2020; Ridolfi et al., 2020).
This paper presents the extension of the Rutherford Appleton Laboratory (RAL) Infrared Microwave Sounding (IMS) retrieval scheme for the upcoming FORUM mission into the far-infrared, focusing on clear-sky retrievals of water vapour and temperature using the optimal estimation method. It is a fast and flexible retrieval code that has been built to perform multi-target retrievals of instruments on board the MetOp satellites covering the mid-infrared and microwave spectral regions. It can simultaneously retrieve several atmospheric and surface components (Siddans et al., 2017), including cloud properties, and its ability to retrieve temperature and water vapour profiles using the mid-infrared has been thoroughly evaluated in Siddans (2019) and Trent et al. (2023).
To test this scheme in the far-infrared, it has undergone two stages of testing. The first is an assessment of the retrieval performance on a diverse set of simulations of upwelling TOA radiances, exploiting the entire FSI spectral range. The second builds on the earlier work of Warwick et al. (2022) by adapting aircraft-based observations to mimic the expected FSI instrumental characteristics, developing what we term “FORUM-aircraft” radiances. We also include a greater number of radiometric observations from the flight and optimise the IMS channel selection for the FORUM-aircraft configuration. The retrieval performance of the extended IMS code applied to these FORUM-aircraft observations is then evaluated through comparison with contemporaneous in situ atmospheric measurements.
The layout of the paper is as follows: in Sect. 2, we outline the retrieval scheme and methodology; Sect. 3 details the extension for FORUM; Sect. 4 outlines the testing on simulated cases; Sect 5 describes the aircraft campaign and observations; Sect. 6 outlines modifications made to the retrieval framework and the observations to improve their representation of the FSI; Sect. 7 contains the final retrievals from observations; and, finally, conclusions are given in Sect. 8
The RAL Infrared Microwave Sounding (IMS) retrieval scheme uses the optimal estimation method to simultaneously retrieve vertical profiles of atmospheric temperature and gases, along with surface skin temperature, surface spectral emissivity and cloud parameters (Rodgers, 2000; Siddans, 2019). It was initially developed for joint retrievals of the vertical methane profile from IASI observations combined with the Microwave Humidity Sounder and the Advanced Microwave Sounding Unit on the MetOp satellites. However, IMS is a customisable retrieval framework that can be easily adapted to other instruments. As part of the ESA Water Vapour Climate Change Initiative project, Trent et al. (2023) evaluated the IMS water vapour and temperature retrieval products from IASI observations across a 9.5-year period against two sets of radiosonde measurements. A mean global water vapour bias of 10 % and a temperature bias of within 1 K were seen between retrieved profiles and radiosonde measurements.
A brief overview of the optimal estimation method used within IMS is outlined below; however, full details of the IMS algorithm can be found in Siddans (2019) and Trent et al. (2023). IMS uses the optimal estimation method from Rodgers (2000) to fit an observed spectrum (the measurement vector, y) by iteratively perturbing the retrieval targets (the state vector, x). Estimations of y are calculated from adjusted values of x using a forward model, F(x), which (in this case) is a radiative transfer model. Prior knowledge of the state is contained in the a priori state vector, xa, with covariance, Sa, representing the vertical variability and correlation of the profile, and both are used to constrain the retrieval. Similarly, the measurement covariance, Sy, represents the uncertainty in the measurement; for IASI, it has been calculated based on the residual between simulations and bias-corrected IASI observations in the current IMS configuration (Trent et al., 2023).
The Radiative Transfer for TOVS v12 (RTTOVv12) fast radiative transfer model is used as the forward model in the IMS scheme. It can simulate clear-sky and cloudy spectra with atmospheric profiles input onto 101 fixed pressure levels using coefficients to increase its operational speed (Haiden et al., 2018). These coefficients are derived by performing a regression on a database of transmittances of atmospheric gases calculated from the TOA to each fixed pressure level using the Line-By-Line Radiative Transfer Model v12.8 (LBLRTMv12.8) (Clough et al., 2005), for all of the profiles in the European Centre for Medium-Range Weather Forecasts (ECMWF) diverse 83-profile dataset that was developed to capture a large variety of atmospheric states (Chevallier et al., 2006). The LBLRTM transmittances include the effects of 28 gas species, alongside continua (MT_CKDv3.2) due to water vapour (self- and foreign broadening), ozone, carbon dioxide, nitrogen, and oxygen (Saunders et al., 2017). They are adapted to match the instrument line shape of ∼ 90 different satellite sensors; therefore, each set of regression coefficients is customised to the specific instrument (Haiden et al., 2018; Saunders et al., 2017).
In this work, we perform simultaneous retrievals of temperature (K), water vapour (ppmv), surface skin temperature (K), and surface emissivity. We use hourly ERA5 reanalysis data as the a priori for temperature, water vapour, and surface skin temperatures, rather than the climatology used in Trent et al. (2023), as a tighter constraint given the limited number of observations of far-infrared radiances. Vertical profiles for CO2, O3, CH4, N2, and other trace gases are fixed to the US 1976 Standard Atmosphere profile unless specified otherwise. The a priori for surface emissivity is taken from the IREMIS surface emissivity atlas within RTTOVv12 (Seeman et al., 2008). This uses the input latitude, longitude, and snow fraction for land to determine the surface emissivity based on an offline database. For sea, the emissivity is parameterised in terms of zenith angle, wind speed, and skin temperature and is calculated offline based on refractive indices from Hale and Querry (1973) and a wave slope model from Masuda (2006). The a priori covariance for temperature, water vapour, and skin temperature is a 2-dimensional matrix derived from the differences between the zonal mean of ERA5 profiles for 3 d (17 April, 17 July, and 17 October 2013). The a priori covariance for the surface emissivity is derived from surface emissivities from the IREMIS atlas for the same time period. Both of these covariance matrices contain correlations manifested as non-zero off-diagonal elements.
2.1 Retrieval method
Iterations are based on the Levenberg–Marquardt (LM) method (Marquardt, 1963):
where i is the iteration; γ is the LM parameter controlling the magnitude of the state vector perturbation, which is initially set to 0.001 in IMS; and Ki is a Jacobian matrix of partial derivatives of the forward model output to elements of the state vector.
The fit optimisation is based on minimising the cost, χ2, with the first and second terms on the right-hand side of Eq. (2) corresponding to the measurement and state cost, respectively:
The measurement cost indicates the fit of the simulated and observed spectra in relation to the Sy in the selected channels. A larger measurement cost per channel indicates a worse fit and suggests that the retrieved state vector is less likely to match the true state. The state cost indicates how far the retrieved state has deviated from the a priori in relation to Sa. A high state cost could be caused by either an a priori which is not similar to the true state or a small Sa, which suggests the retrieval is tightly constrained.
The retrieval is performed using selected channels, rather than for the entire spectral range, to minimise operational time and eliminate unreliable channels. It is said to have converged when χ2 has reduced, is the lowest value calculated so far, and the change in χ2 is less than one. If the cost increases but is below a set threshold, the retrieval stops based on a low cost. If 10 iterations are reached and the criteria have not been met, the retrieval has not converged. These settings can be varied and have been optimised based on retrievals from IASI observations.
Several other metrics are used to assess the performance of the retrieval. The first is the covariance of the retrieved state, Sx, which is the covariance of a Gaussian probability distribution function:
where the square root of the diagonal of this matrix represents the error in the retrieved state and is equivalent to 1 standard deviation. This will be referred to as the estimated standard deviation (ESD) in the retrieval.
The second is the averaging kernel (AK) matrix, A, that represents the vertical sensitivity of the retrieved to the true state. A larger averaging kernel means that a greater amount of the retrieval is from the observation, rather than the a priori. This is, in practice, calculated using the gain matrix, G, which is the sensitivity of the retrieval to the measurement and its uncertainty and can be used to smooth a true state, , to the resolution of the retrieval:
The third parameter is the degrees of freedom for signal (DOFS), which represents the number of independent pieces of information and is calculated from the trace of A.
The final parameter is the root-mean-square error (RMSE) value, which is calculated using the difference between the a priori or retrieved profile and the true profile. The RMSE values for water vapour are calculated using the units of the logarithm of specific humidity, as concentrations can vary by several orders of magnitude throughout the vertical, and are used as a summary value to further assess the quality of the retrieval.
When developing the IMS retrieval scheme for use on FSI observations, the first thing to consider is the ability of the forward model to simulate spectra. The RTTOVv12 regression coefficients used to simulate spectra have already been built for the FSI and can be easily integrated into the retrieval framework. The RTTOVv12 FSI radiances cover the full FSI spectral range at a sampling of 0.3 cm−1 and have the strong Norton–Beer apodisation applied. This results in a total of 5000 channels and a spectral resolution of 0.6 cm−1. This necessitates two key modifications to the retrieval process. The first is the adjustment of spectrally varying covariance matrices used to constrain the retrieval (Sect. 3.1). The second is the selection of channels to optimise the spectral fitting performed in the retrieval (Sect. 3.2).
3.1 Covariance adaptions
The a priori covariance for the surface emissivity and measurement covariance are both spectrally dependent and, therefore, must be tailored to the specifications of the FSI defined in RTTOVv12. They are currently configured for the mid-infrared and microwave spectral regions with spectral sampling and ranges for instruments on board the MetOp satellites. Both of these correlated covariance matrices can be found in the Supplement.
The surface emissivity is also retrieved, as its been shown to (1) improve the agreement between retrievals of lower tropospheric water vapour and ECMWF analyses and (2) reduce cloud contamination (Trent et al., 2023). The same method as described in Sect. 2 was used to calculate the a priori covariance for sea cases and extend it to the far-infrared. For land cases, the surface emissivity produced by the IREMIS atlas is fixed in the far-infrared; thus, the covariance was instead found using an emissivity database that covers the FSI spectral range (Huang et al., 2016).
The measurement covariance was built using the apodised target noise-equivalent spectral radiance (NESR) and target absolute radiometric accuracy (ARA) for the FSI. These two components have been combined to produce a correlated covariance matrix. The leading diagonal of the matrix is shown in Fig. 1b. It has been separated into the NESR and ARA components in Fig. 1c, with the full matrix included in Fig. S2 in the Supplement. The apodised NESR includes four sets of non-zero off-diagonals due to the thin instrument line shape and is the dominant contributor to the measurement covariance below 1300 cm−1 and above 1450 cm−1. The target ARA is 0.1 K between 300 and 1100 cm−1, 0.2 K between 200 and 300 and between 1100 and 1300 cm−1, and 1 K elsewhere. As the ARA is defined in brightness temperature, it is converted into radiance units for each individual spectrum, and the average is shown in Fig. 1c for the 83 ECMWF profiles. We assume that the ARA covariance is fully correlated; therefore, it has contributions off the leading diagonal of up to 0.5 (mW m−2 sr−1 (cm−1)−1)2 below 100 cm−1 and above 1300 cm−1.
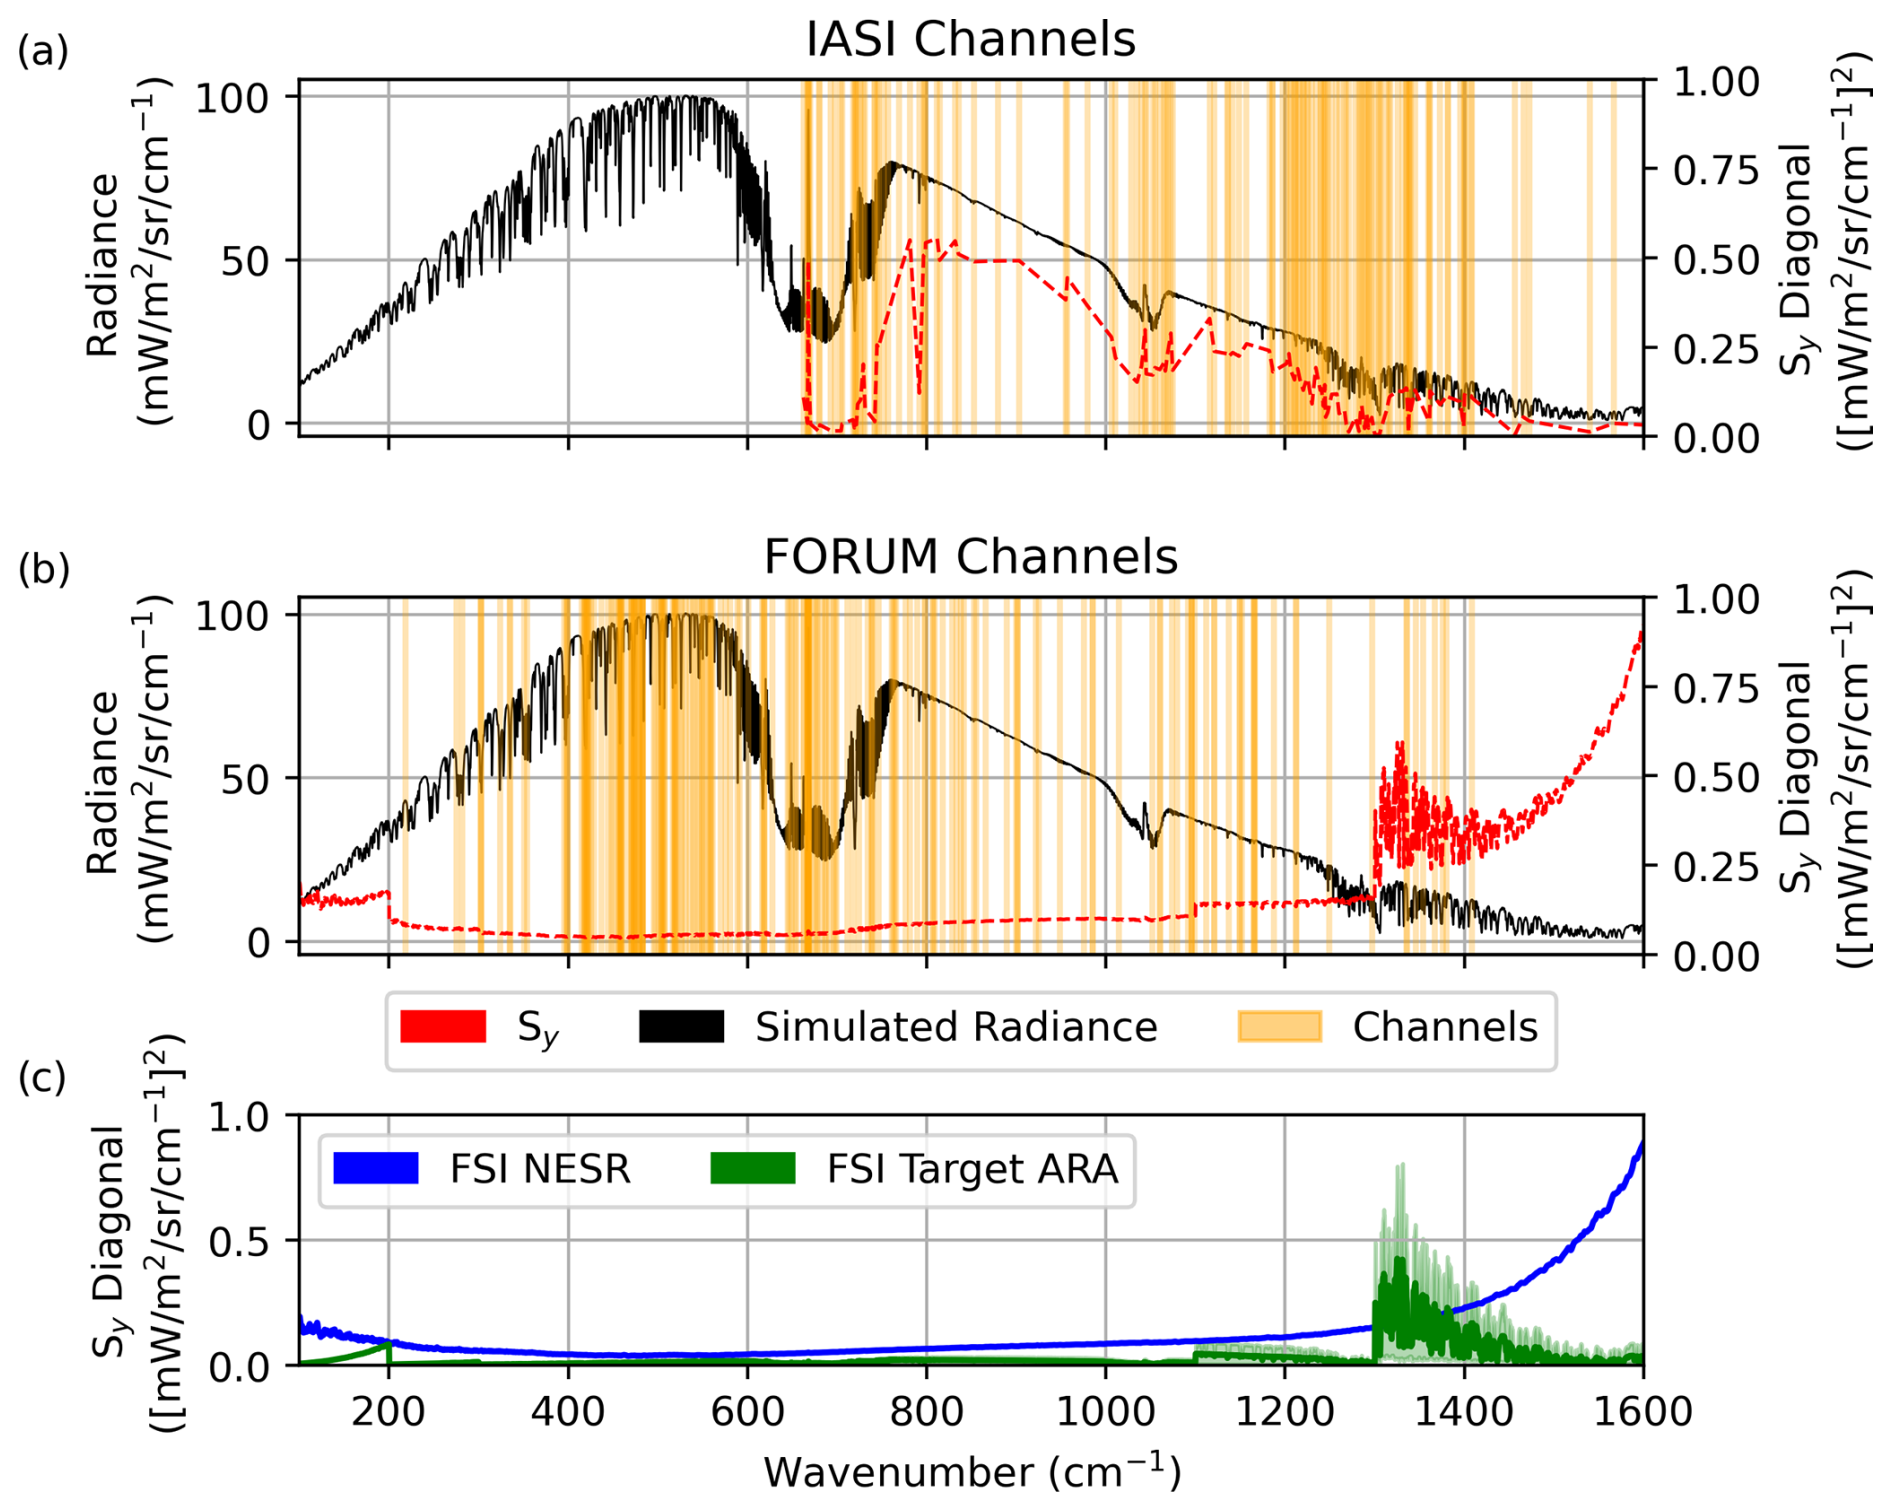
Figure 1An example upwelling FORUM spectrum simulated using RTTOVv12 overplotted with channels selected for (a) IASI and (b) FORUM retrievals. The main diagonal of the measurement covariance Sy is shown in red in both cases. (c) The main diagonal of the FORUM measurement covariance separated into components from the noise-equivalent spectral radiance (NESR) and the target absolute radiometric accuracy (ARA). As the ARA is provided in brightness temperature, it has been converted into radiance units for each of the profiles in the ECMWF 83-profiles dataset. The median is shown here, with the shading representing the minimum and maximum values.
This measurement covariance relates to the FSI 15 km footprint and acquisition time of 8s. The leading diagonal of the IASI measurement covariance outlined in Sect. 2 is shown in Fig. 1a. This corresponds to the IASI 12 km footprint, which also has an acquisition time of 8 s. As can be deduced from Fig. 1, the FSI measurement covariance is between 0.08 and 0.37 (mW m−2 sr−1 (cm−1)−1)2 smaller than its IASI counterpart between 750 and 1200 cm−1. At wavenumbers above 1300 cm−1, the FSI measurement covariance increases, reaching a difference of 0.9 (mW m−2 sr−1 (cm−1)−1)2 at 1600 cm−1.
3.2 Channel selection
IMS uses 139 of the available 8460 IASI channels (Fig. 1a), each with a channel width of 0.25 cm−1 and a spectral resolution of 0.5 cm−1 (Trent et al., 2023). These were selected to maximise the information content of the retrieval for temperature, water vapour, and ozone, as well as to filter channels for noise and reliability. Final channels were added or removed to enhance the retrieval outputs for these profiles on an ad hoc basis for general retrievals from IASI observations (Collard, 2007; Weston, 2011).
A similar analysis is performed here for the channel selection for the FSI. The 5000 channels available for FORUM are ranked based on their contribution to the total available information content for the ECMWF diverse 83-profile dataset (Chevallier et al., 2006). The parameter for information content, H, is dependent on the sensitivity of the retrieval to the measurement and a priori covariance. It is calculated using Eq. (5) by exploiting A outlined in Eq. (4) (Rodgers, 2000):
where I is an identity matrix.
Therefore, H can be used to filter out channels with a greater uncertainty and weaker sensitivity to the retrieval products. In this case, the a priori covariance is a weak constraint; thus, the measurement covariance plays a more significant role in the channel selection.
Improvements in the information content and DOFS values for temperature and water vapour plateaued for the FORUM configuration at 200 channels, with no notable improvements when more channels were included. Therefore, these 200 channels have been selected for use in IMS for the FORUM configuration (as shown in Fig. 1b). These capture ∼ 66 % of the total available information content, with the remaining channels each contributing 0.1 % at most. Unlike the IASI case in Fig. 1a, no channels are selected at wavenumbers greater than 1400 cm−1. Similarly, no channels below 200 cm−1 are selected. A markedly reduced percentage of channels are located between 1000 and 1400 cm−1, in comparison to the IASI selection, as the noise characteristics associated with the FSI have effectively shifted the locations of peak information to the 400–700 cm−1 range for water vapour, and information relating to ozone (and other trace gases) has not been prioritised.
Given the limited number of observations of upwelling TOA radiances in the far-infrared region, preliminary testing was performed using simulated test cases for the IASI and FORUM configurations. The input or “true” profiles are known for each test case; as a result, the retrieved products can be compared against the truth without any introduction of uncertainty in the atmospheric state. The ability of IMS to retrieve from IASI observations is well documented, and so we use this as a reference output to assess the performance of the updated FORUM configuration.
A number of existing artificial datasets have been crafted to encompass variable atmospheres, such as the ECMWF diverse 83-profile dataset; however, these have already been used in generating the RTTOVv12 coefficients and for the channel selection in Sect. 3.2 (Saunders et al., 2017). Reanalysis datasets, including but not limited to ERA5 and CAMS, have also been used in the development of IMS and, although the reliance of IMS on these datasets is very weak, they do not provide an independent basis for testing IMS (Siddans, 2019). Therefore, we constructed a test set from Modern-Era Retrospective analysis for Research and Applications, Version 2 (MERRA-2) reanalysis data produced by the NASA Global Modeling and Assimilation Office (Gelaro et al., 2017). MERRA-2 has been shown to perform comparably to ERA5 when assessed against observations and is an independent base for this test set (Jiang et al., 2015; Arshad et al., 2021; Huang et al., 2021; Johnston et al., 2021).
Instantaneous 3-hourly MERRA-2 reanalysis data are used for temperature, water vapour, and ozone vertical profiles (Global Modeling and Assimilation Office, 2015a). Ozone is not a retrieval target in this work and is fixed to the “true” profile in each retrieval, but it has been chosen to vary across the test cases given its strong absorption in the mid-infrared range. Instantaneous hourly MERRA-2 reanalysis data are used for skin temperatures and surface pressures (Global Modeling and Assimilation Office, 2015b).
The MERRA-2 data were first restricted to 1 March, 1 June, 1 September, and 1 December 2019 to cover a broad range of seasons and conditions. From this dataset, 240 test cases were selected to capture variations in temperature and water vapour near the surface and in the upper troposphere. The spatial distribution of test cases can be seen in Fig. 2, and the distributions of skin temperature and total column water vapour (TCWV) are shown in Fig. 3. The selected test cases, shown in red, capture the upper and lower limits of the restricted MERRA-2 data, shown in blue, for skin temperature and TCWV; however, the distribution of test cases has a slightly smaller proportion of cases with a TCWV below 2.5 kg m−2. Overall, the finalised test cases demonstrate a comparable spread relative to the initially selected MERRA-2 days.
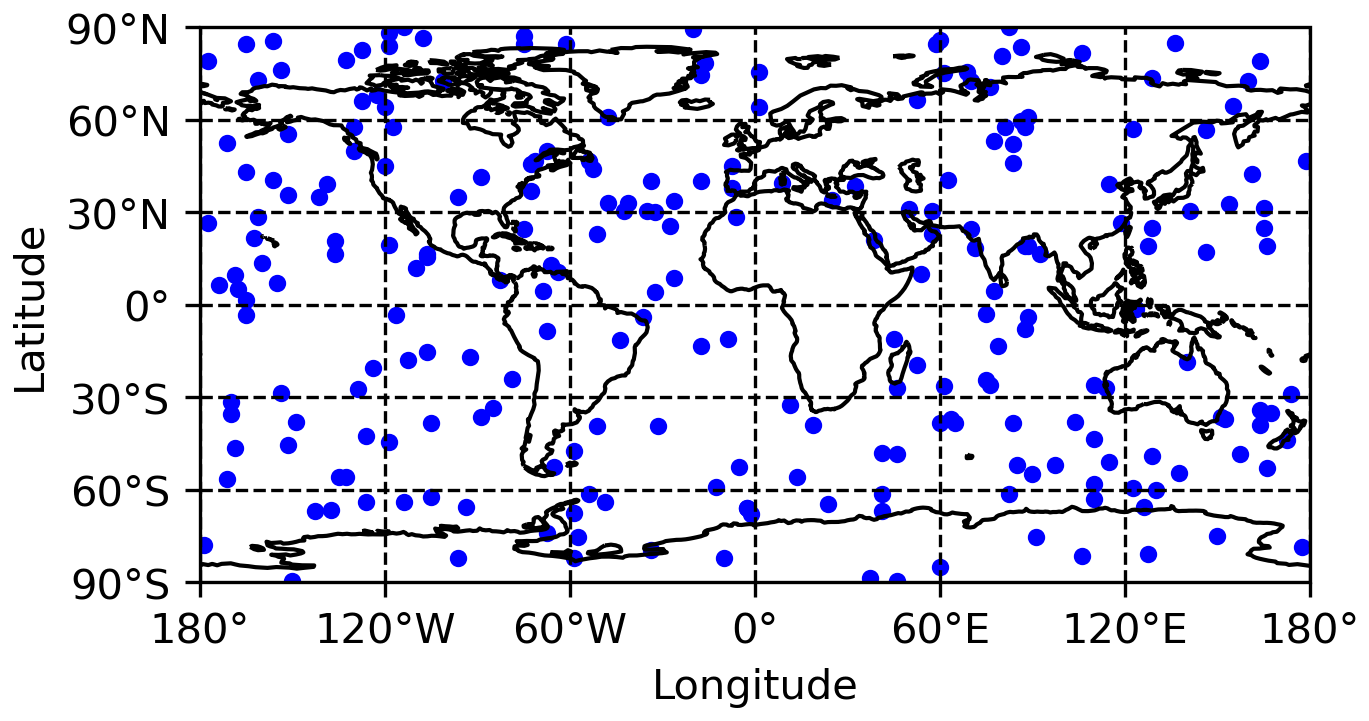
Figure 2The spatial distribution of the 240 cases selected for testing IMS: 70 tropical cases, 95 mid-latitude cases, and 75 Arctic cases. Profiles were derived from MERRA-2.
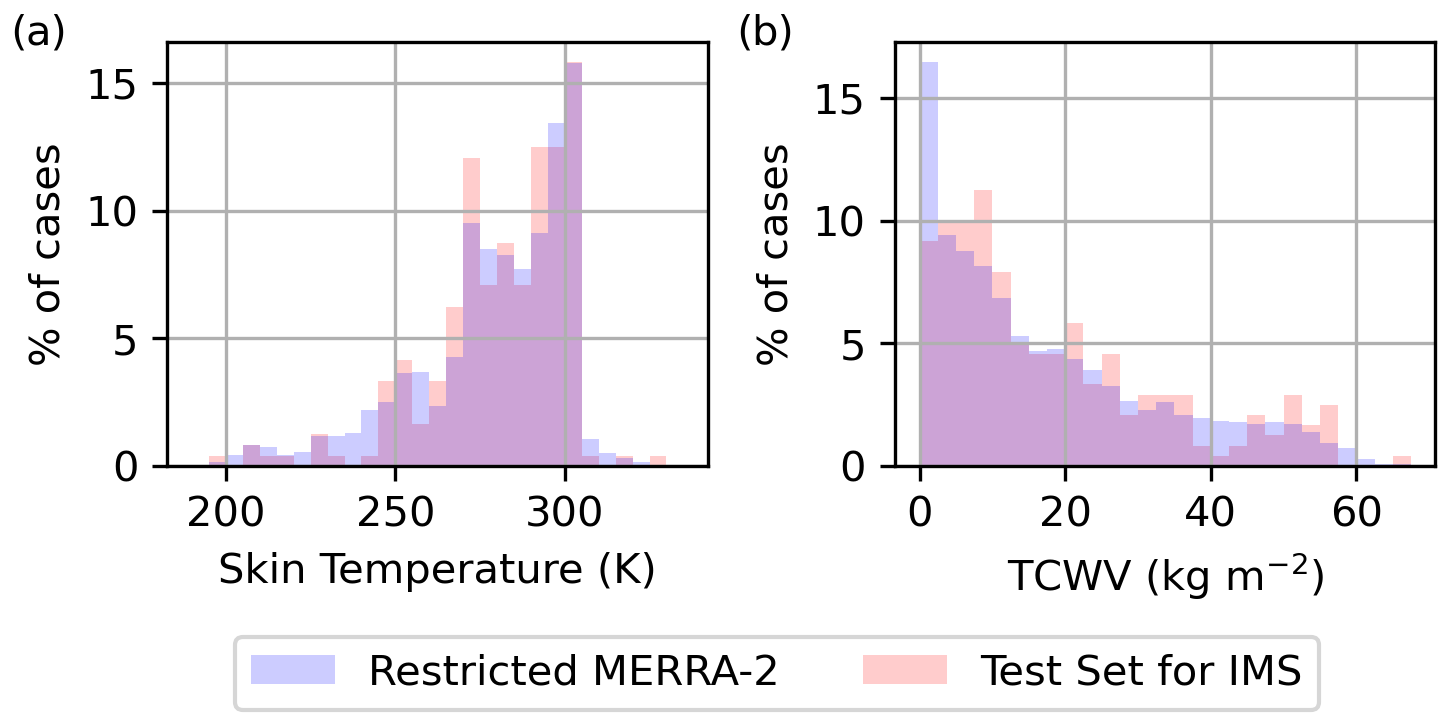
Figure 3The percentage of total cases with respective (a) skin temperature and (b) total column water vapour (TCWV) values in the MERRA-2 reanalysis dataset for 1 d in March, June, September, and December in 2019 (shown in blue) and used in the test dataset (shown in red). Overlapping regions, where the same proportion of cases are present in the test set and MERRA-2 reanalysis dataset, are shown in purple.
The US 1976 Standard Atmosphere profile for CO2, CH4, and N2O were scaled to match National Oceanic and Atmospheric Administration (NOAA) flask measurements averaged from 2019 (Saunders et al., 2017; Dlugokencky et al., 2021) and were kept constant across all of the test cases. Realistic surface emissivities were selected based on their MODIS surface type from the IREMIS atlas and residuals between the IREMIS atlas and the Huang et al. (2016) emissivity database for sea and land, respectively (Platnick et al., 2003; Seeman et al., 2008), and were also retrieved as outlined in Sect. 3.1.
4.1 Retrievals from simulations
Retrievals on RTTOVv12 simulations of all 240 tests cases outlined in Sect. 4 have been performed for both the IASI and FORUM configurations. Details of the temperature and water vapour retrievals using each configuration are presented in this section. The retrievals of surface emissivity and skin temperature can be found in the Supplement. The performance of the IASI configuration shows comparable retrieval biases to those observed in Trent et al. (2023) from IASI observations, with a mean bias of within 12 % and 0.3 K for water vapour and temperature retrievals, respectively. These are driven by inherent biases between the a priori state vector, taken from ERA5, and the MERRA-2 profiles used to simulate the test cases (Johnston et al., 2021).
Table 1 summarises the evaluation metrics for retrievals performed using both the IASI and FORUM configurations. Broadly speaking, the performance of the two configurations is similar, with each metric agreeing within the associated uncertainty seen across the test cases. The FORUM configuration does appear to have a slightly increased state cost, indicative of a greater divergence from the a priori state, which iterative tests suggest is linked to the addition of information from the far-infrared channels and the channel optimisation, in line with findings in Merrelli and Turner (2012). It is worth recalling that the FORUM measurement covariance consists solely of the estimated FSI NESR and target calibration uncertainty, while the IASI measurement covariance implicitly also includes forward model error.
Table 1A summary of the median and median absolute deviation in diagnostic parameters outlined in Sect. 2.1 for the FORUM retrievals of the 240 test cases for the IASI and FORUM configurations.
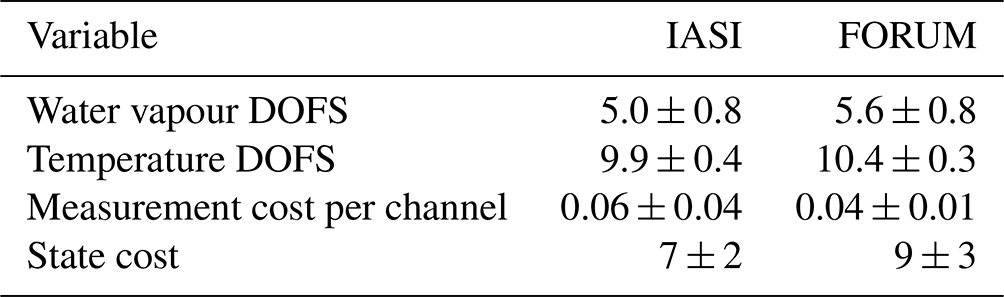
The average DOFS values for water vapour and temperature were also greater for the FORUM configuration in this comparison, with observed improvements primarily in the upper troposphere. This is shown in the median cumulative degrees of freedom for signal (CDOFS) values in Fig. 4 which are indicative of the vertical resolution of the retrieved profile. The FORUM configuration (blue) has a sharper increase in the CDOFS values between 200 and 400 hPa for both temperature and water vapour. This suggests a slightly higher vertical resolution for the FORUM configuration in the upper troposphere in comparison to the IASI configuration. Below 600 hPa, both configurations have a CDOFS that aligns with a vertical resolution of approximately 200 hPa per DOFS for water vapour and temperature.
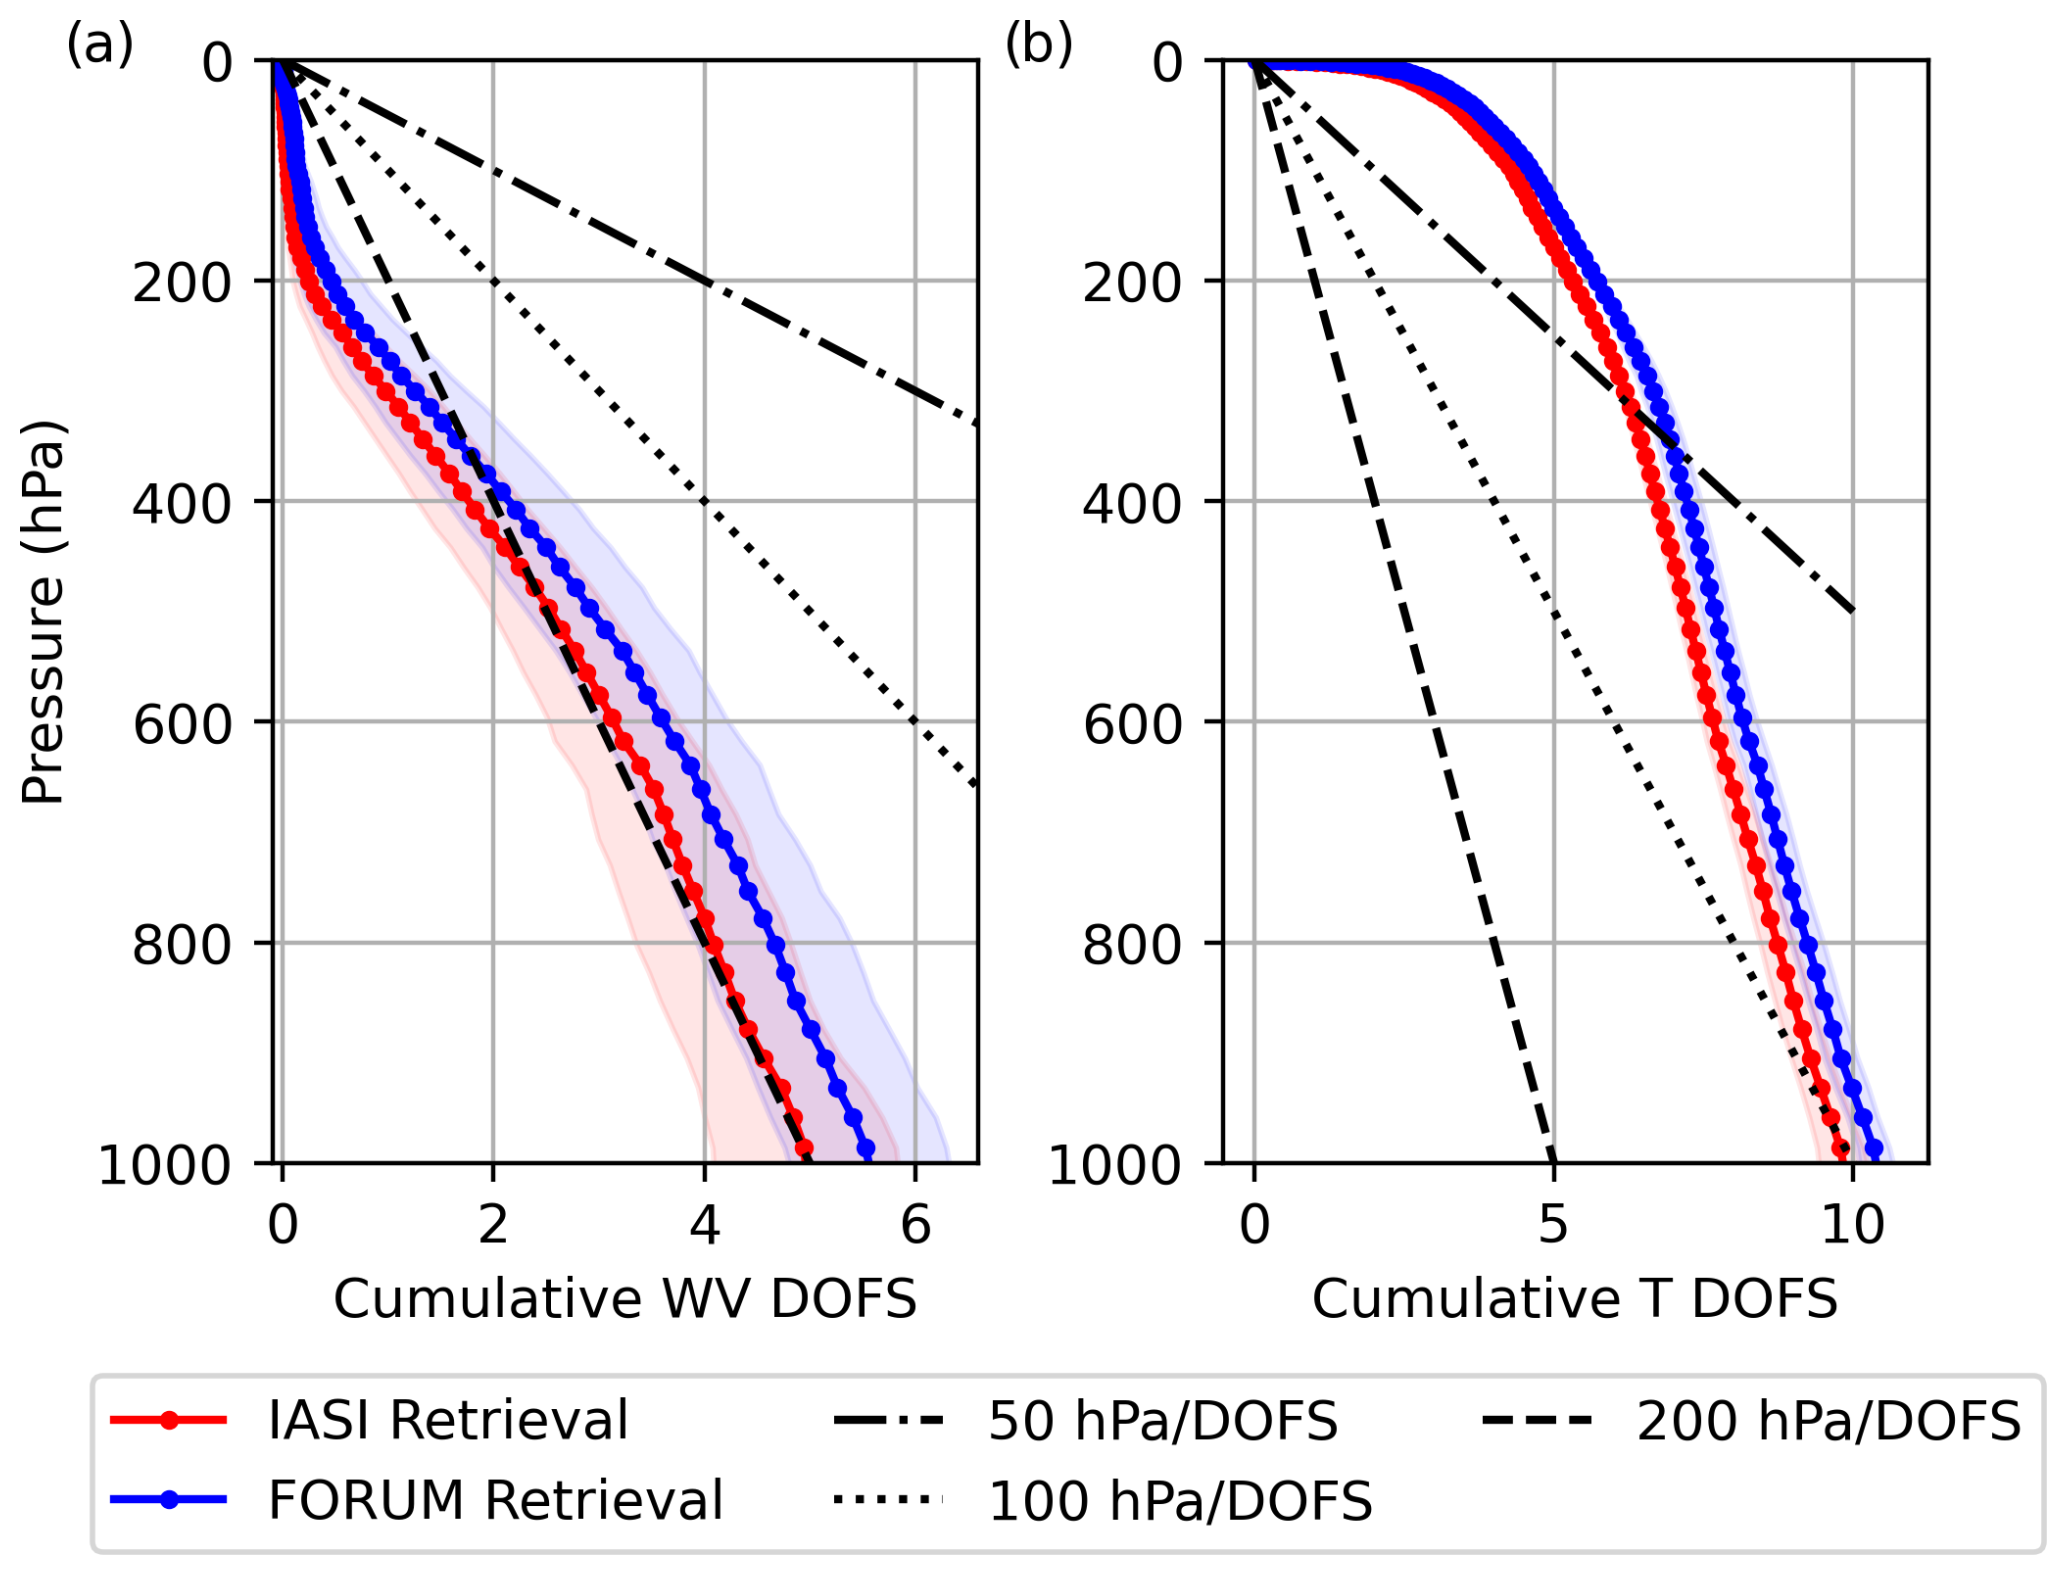
Figure 4The median cumulative degrees of freedom for signal (CDOFS) values for (a) water vapour and (b) temperature averaged across all 240 cases for the IASI and optimised FORUM configuration, shown in red and blue, respectively. Shaded regions represent the median absolute deviation. This shows how the vertical distribution of the information content can be related to the vertical resolution of the retrieved profile.
The median retrieval biases for both configurations are presented in Fig. 5. The FORUM and IASI retrieval configurations perform comparably throughout the vertical, with biases within 2 % and 0.2 K of each other for water vapour and temperature, respectively. Generally, the FORUM configuration has a lower median water vapour bias of up to 2 %. Between 600 and 700 hPa, the FORUM retrieval does not perform as well, with its water vapour bias reaching up to −2.5 %; however, this remains within the median estimated standard deviation (ESD) of the retrieval. Noticeably, the ESD associated with the FORUM configuration for water vapour is up to 7 % smaller throughout the vertical profile than its IASI counterpart, suggesting a higher confidence in the retrieved state. However, this is not observed in the temperature retrievals, with the ESD being comparable between configurations and the IASI temperature retrievals performing better above 900 hPa.
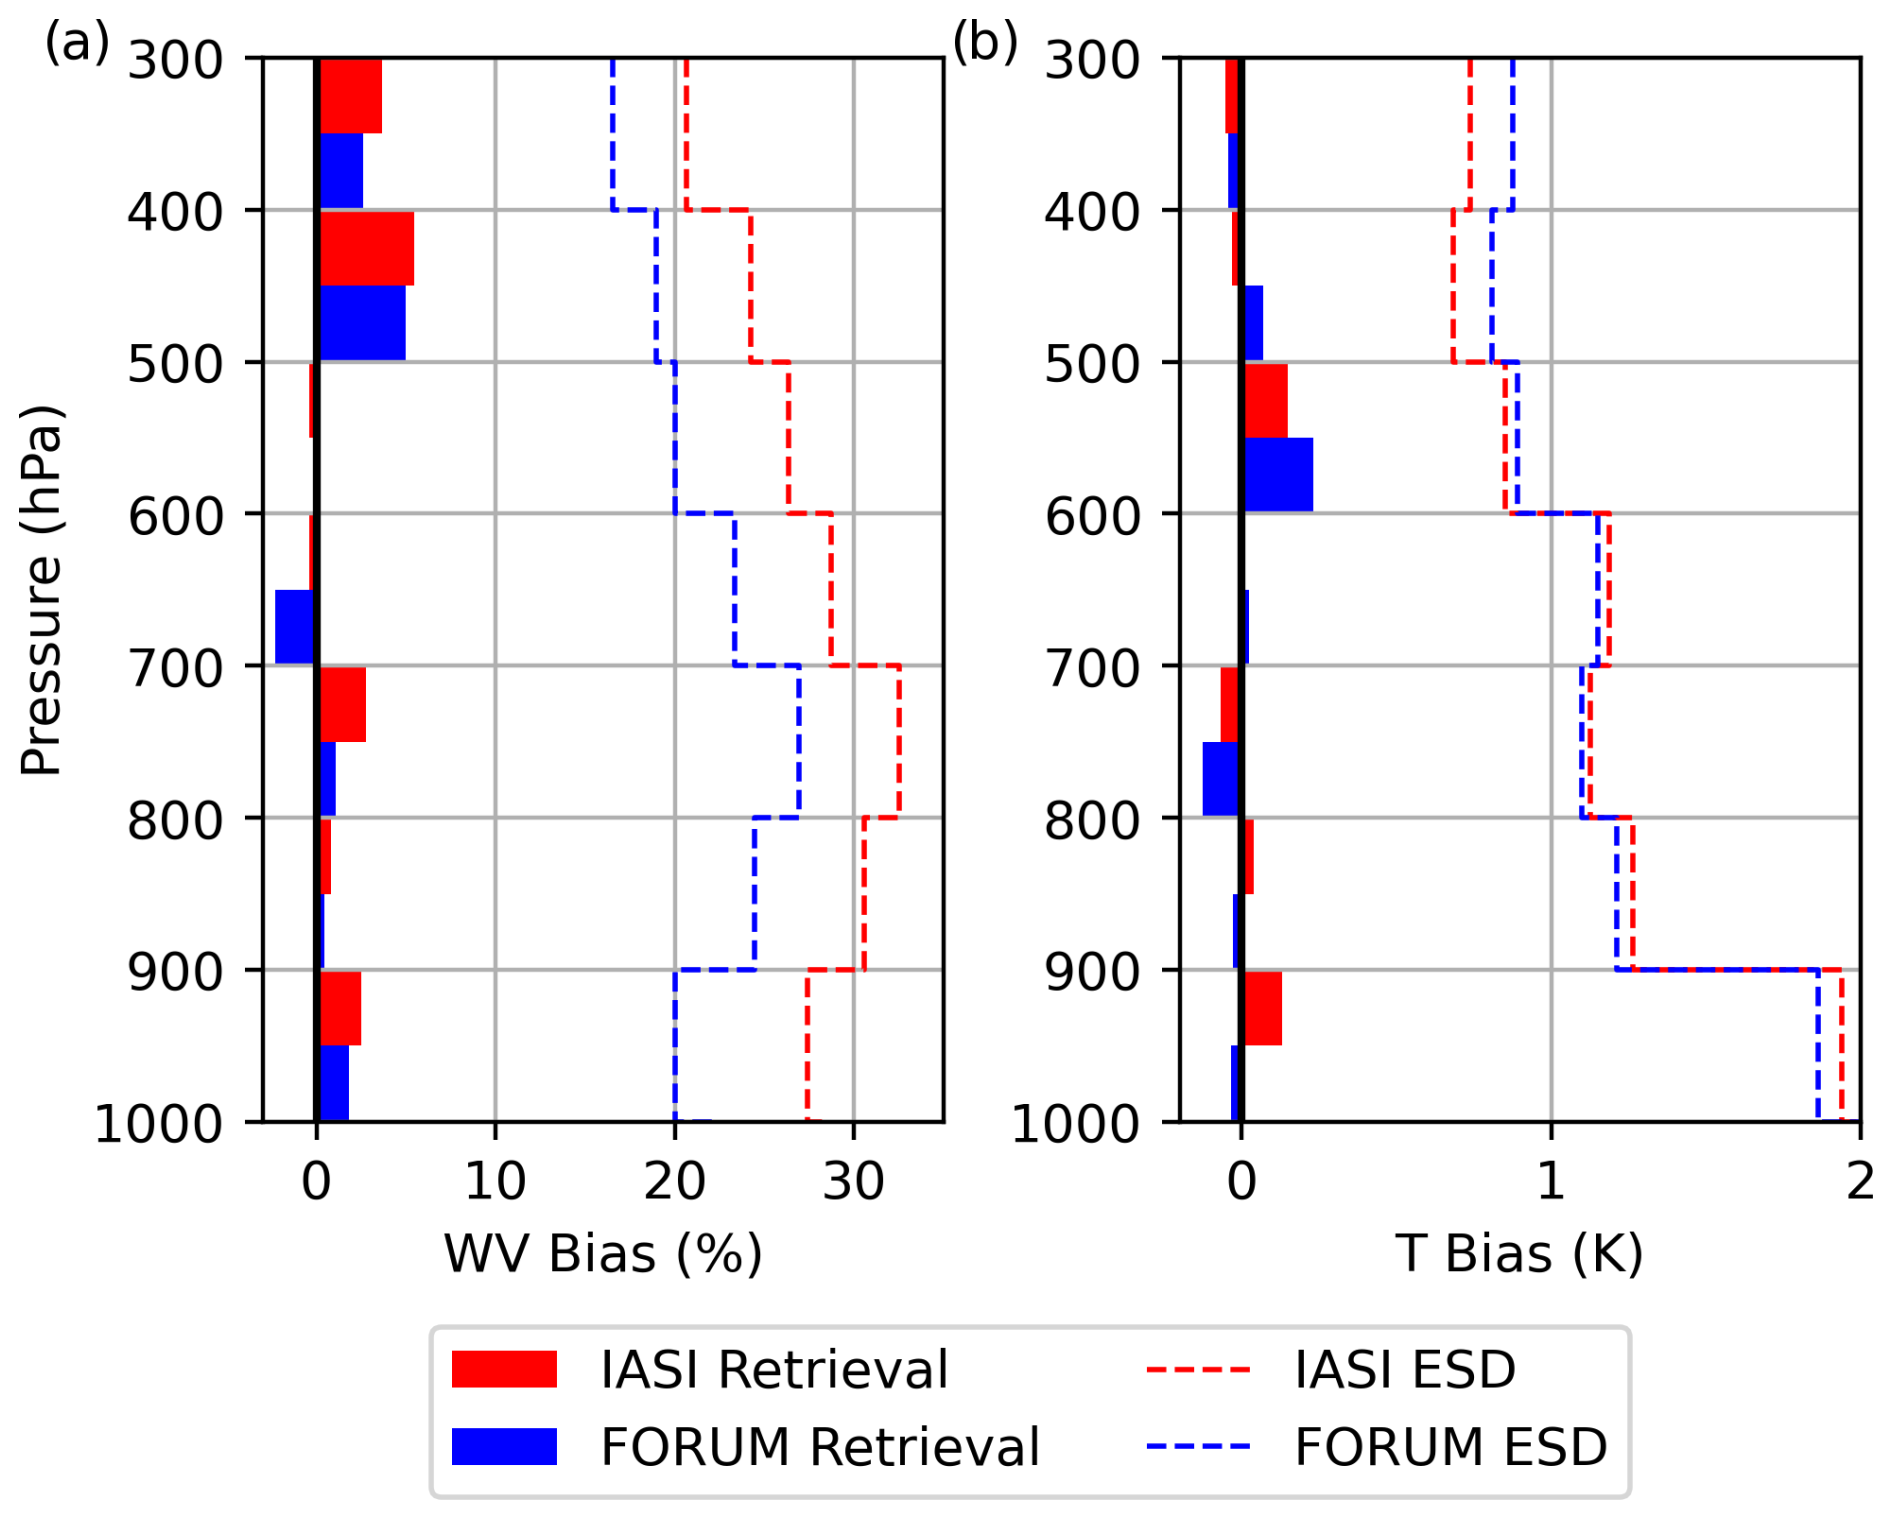
Figure 5The median (a) water vapour (WV) and (b) temperature (T) bias of the retrieved profile to the true state across the testing cases for the optimised IASI and FORUM configurations, shown in red and blue, respectively. Biases are evaluated between 300 and 1000 hPa in 100 hPa bins, as in Trent et al. (2023). The water vapour percentage bias is calculated from absolute values (in ppmv). Dashed lines show the median estimated standard deviation (ESD) for a single retrieval for the test cases in each bin. For water vapour, this is plotted with an offset of −10 % for clarity.
The next stage of testing involves assessing retrievals from aircraft-based observations of upwelling radiances in the far- and mid-infrared taken during the PIKNMIX-F campaign. This will highlight limitations in the forward model as well as the wider retrieval framework not explored in the previous section.
5.1 Flight C153 overview
The PIKNMIX-F campaign took place in March 2019, based out of Stornoway, Scotland, and was a joint venture between the UK Met Office and the Facility for Airborne Atmospheric Measurements (FAAM) Airborne Laboratory. The primary science goals were to (1) obtain data that could be used to improve the representation of specific cloud microphysical and boundary layer processes within the Met Office suite of models and (2) validate radiative transfer modelling of cloudy scenes. Additional funding from ESA allowed further flight hours in support of the FORUM mission, such as the C153 flight that occurred on 13 March 2019.
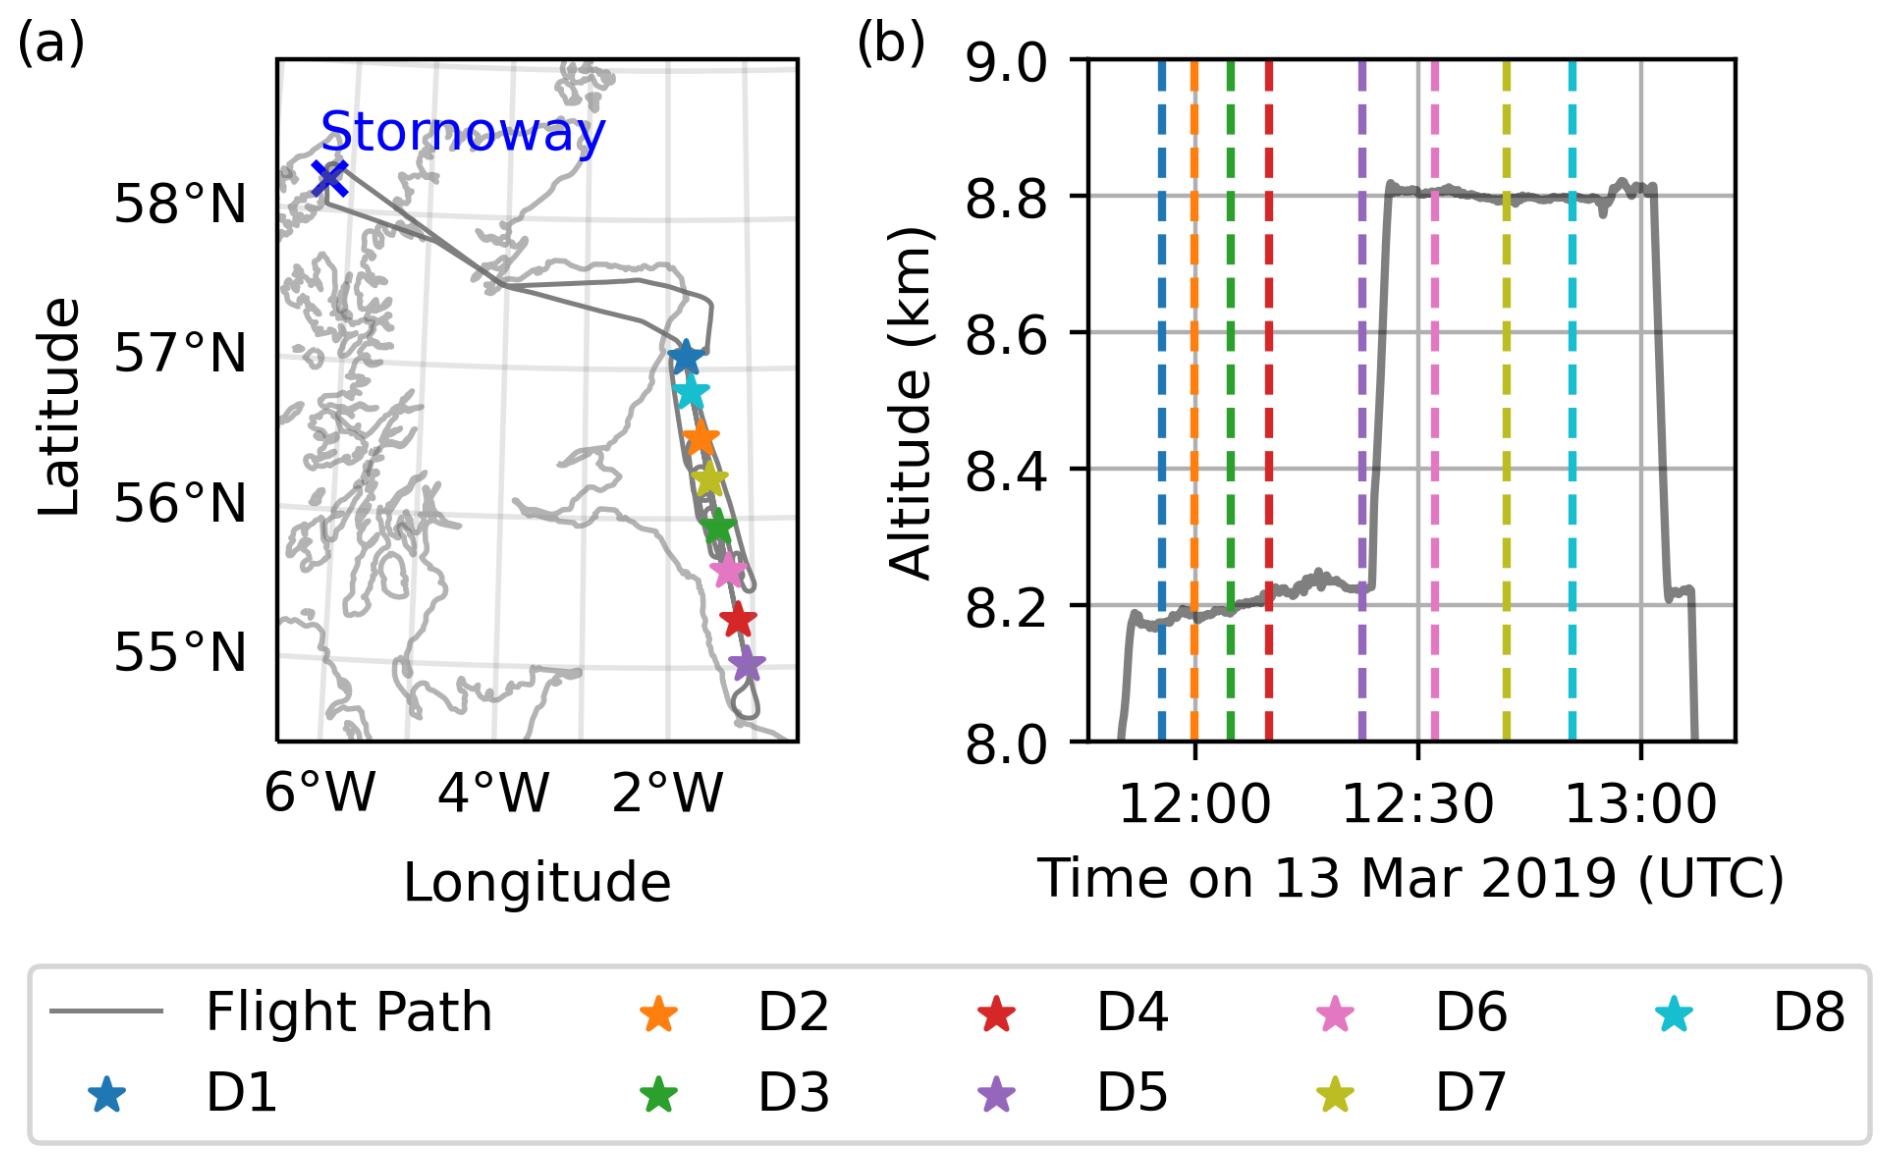
Figure 6(a) The track of the C153 flight. (b) The altitude measured by the aircraft during the SLRs. Dropsonde releases are marked in panel (a) and correspond to the dashed lines in panel (b).
The C153 flight path and altitude variation are shown in Fig. 6. This flight aimed to observe simultaneous nadir-viewing spectra in the far- and mid-infrared using the Tropospheric Airborne Fourier Transform Spectrometer (TAFTS) and the Airborne Research Interferometer Evaluation System (ARIES) (Canas et al., 1997; Wilson et al., 1999). Two straight and level runs (SLRs) were conducted between 57 and 55° N from 11:55 to 12:55 UTC at speeds ranging from 175 to 190 m s−1. The first SLR travelled south-west at an altitude of approximately 8.2 km. The aircraft then ascended and flew back over the same path at approximately 8.8 km, as highlighted in Fig. 6b. Clear-sky conditions were generally observed throughout the flight, with a small amount of low cloud observed near the southern end.
5.1.1 Radiometric instrumentation
TAFTS is a four-port Martin–Puplett interferometer (Canas et al., 1997). Measurements are made at the output ports by pairs of detectors, each containing a “longwave” and “shortwave” detector made of GeGa and SiSb, respectively. The instrument has two pairs of blackbody calibration targets held at ambient temperature and 323 K, respectively. There is an internal calibration before scans, with a single nadir scan taking ∼ 1.5 s and having an angular field of view of 1.6°. TAFTS has a nominal spectral range of 80–300 cm−1 (longwave channel) and 330–600 cm−1 (shortwave channel) with a sampling of 0.06 cm−1. It has a nominal spectral resolution of 0.12 cm−1; however, to reduce the instrument noise and allow more spectra to be collected, this was reduced to 0.24 cm−1 by reducing the optical path difference and scan time. The uncertainty of a single TAFTS spectrum is composed of the random noise and calibration error added in quadrature (Fig. 8a). In the shortwave channel, this is of the order of ±1–2 mW m−2 sr−1 (cm−1)−1, whereas this value is of the order of ±0.5 mW m−2 sr−1 (cm−1)−1 in the longwave channel. In both channels, the uncertainty increases towards the detector band edges.
ARIES uses a Michelson-type configuration with a HgCdTe photodetector for the “longwave” channel and an InSb photodetector for the “shortwave” channel (Wilson et al., 1999). It also has two temperature-controlled blackbody targets and performs periodic calibrations during its measurement sequence. A single ARIES scan takes ∼ 0.25 s and has an angular field of view of 2.5°, with a maximum optical path difference of 1.01 cm. The instrument spectral range covers 550–1800 cm−1 (longwave channel) and 1700–3000 cm−1 (shortwave channel), with a spectral resolution of 1 cm−1 and a spectral sampling of 0.42 cm−1. Only observations from the longwave channel are considered here, as the shortwave channel exceeds the FSI spectral range. The ARIES measurement uncertainty also consists of the random noise and calibration error added in quadrature (Fig. 8b). Between 650 and 1350 cm−1, this is at most ±1 mW m−2 sr−1 (cm−1)−1, but it can reach up to ±4 mW m−2 sr−1 (cm−1)−1 outside of this spectral range.
5.1.2 Auxiliary information
On board the FAAM aircraft, additional core instruments have been used to characterise the atmospheric state. Positional information was measured by the POS AV 410 GPS-aided Inertial Navigation Unit, and static pressure was recorded by the air data computer. Flight level ozone concentrations were recorded by a Core Thermo Fisher Scientific Inc. Model 49i UV absorption ozone photometer. Measurements from the aircraft's spiral descent after the second SLR have been used to build a vertical profile of ozone that is assumed constant throughout the flight and fixed in the retrievals.
The aircraft was also equipped with the Airborne Vertical Atmospheric Profiling System (AVAPS), which released eight Vaisala RD94 dropsondes throughout both SLRs (Fig. 6b). Five dropsondes were released during the lower SLR and three during the higher SLR. The Vaisala RD94 dropsondes use the same humidity sensor as the Vaisala RS92 radiosonde, whose uncertainty in humidity measurements was assessed in Miloshevich et al. (2009). The sensor calibration uncertainty was estimated to be ±5 % of the measured relative humidity value plus an absolute offset of ±0.5 %. The production variability uncertainty was ±1.5 % of relative humidity values above 10 % or ±3 % for values below 10 %. No equivalent information is available for the temperature sensor, so a manufacturer-quoted repeatability of 0.2 K is used to represent the uncertainty.
After release, each dropsonde drifted in a south-westerly direction away from the flight path, remaining within 25 km of their release point. The standard deviation in the ERA5 grid surrounding the path of each dropsonde is shown in Fig. 7. Figure 7a suggests a low spatial variability in the water vapour between 4 and 6 km and below 2 km. More variation in ERA5 water vapour is seen between 3 and 4 km, particularly around dropsondes 1 and 2, and above 6 km. Smaller variability is seen in the ERA5 temperature (Fig. 7b) around the path of each dropsonde; however, the variation that is present peaks between 4 and 8 km and closer to the surface. Given the temporal and spatial resolution of the ERA5 data used (hourly and 0.25 × 0.25°, respectively), this variation can be taken as a lower limit on the in situ variability that should be considered when evaluating the quality of the retrievals against the dropsonde profiles.
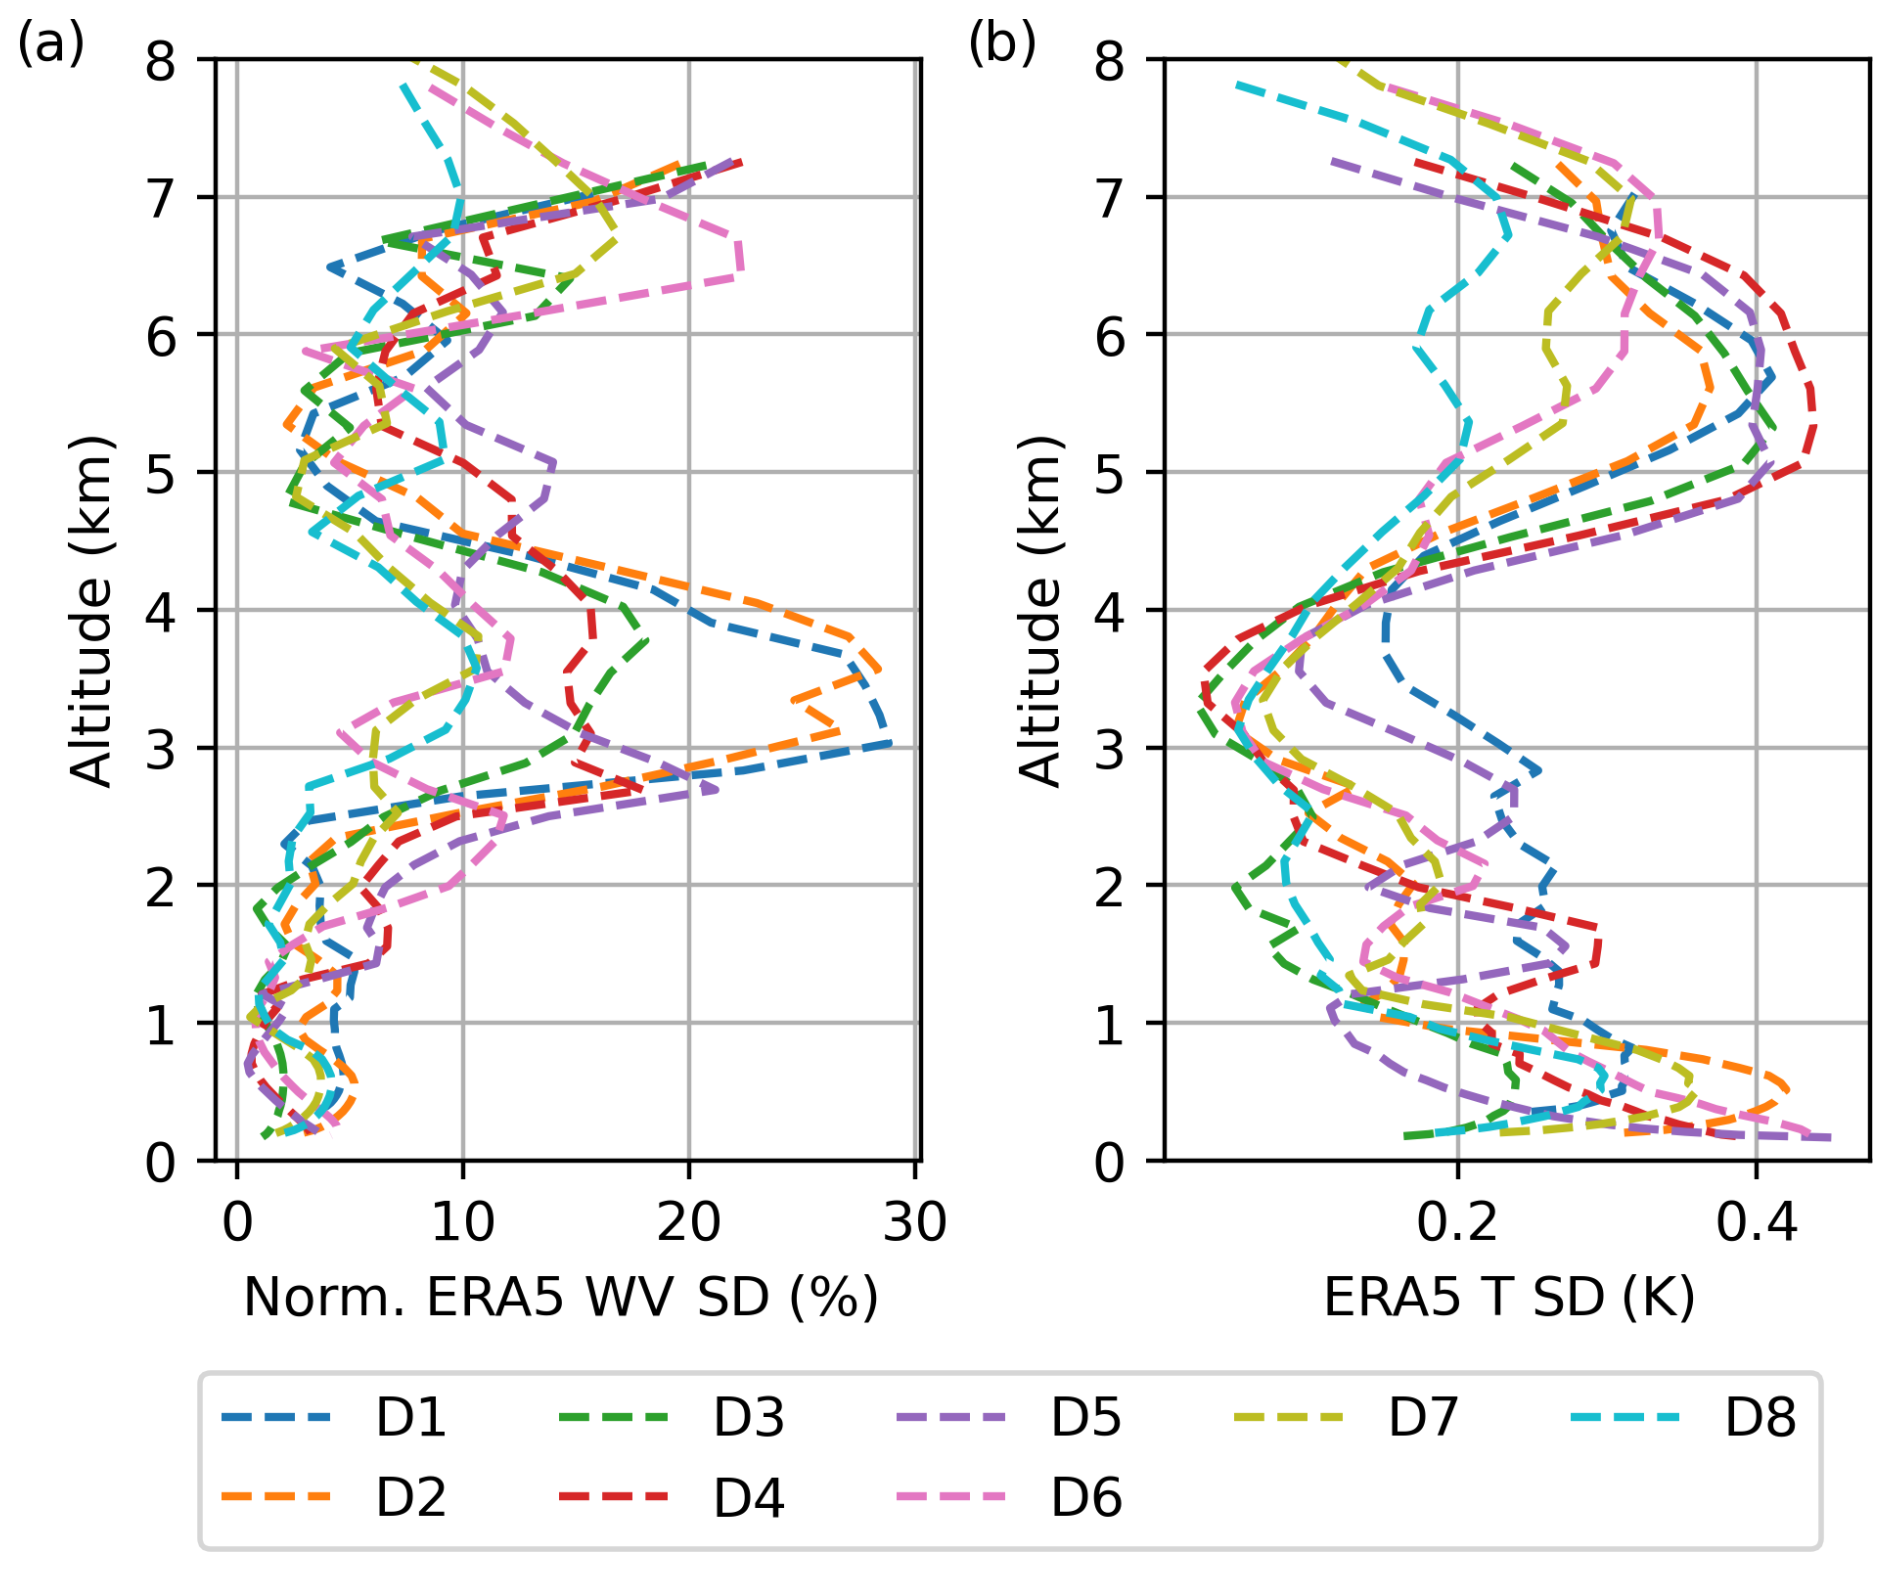
Figure 7(a) The normalised standard deviation of water vapour (WV) and (b) the standard deviation of temperature (T) taken from the ERA5 data surrounding the path of each dropsonde (±30 min, ±48 km). The spatial resolution of ERA5 is 0.25 × 0.25° with a temporal resolution of 1 h; thus, this plot gives an indication of the variability in the atmosphere at these scales.
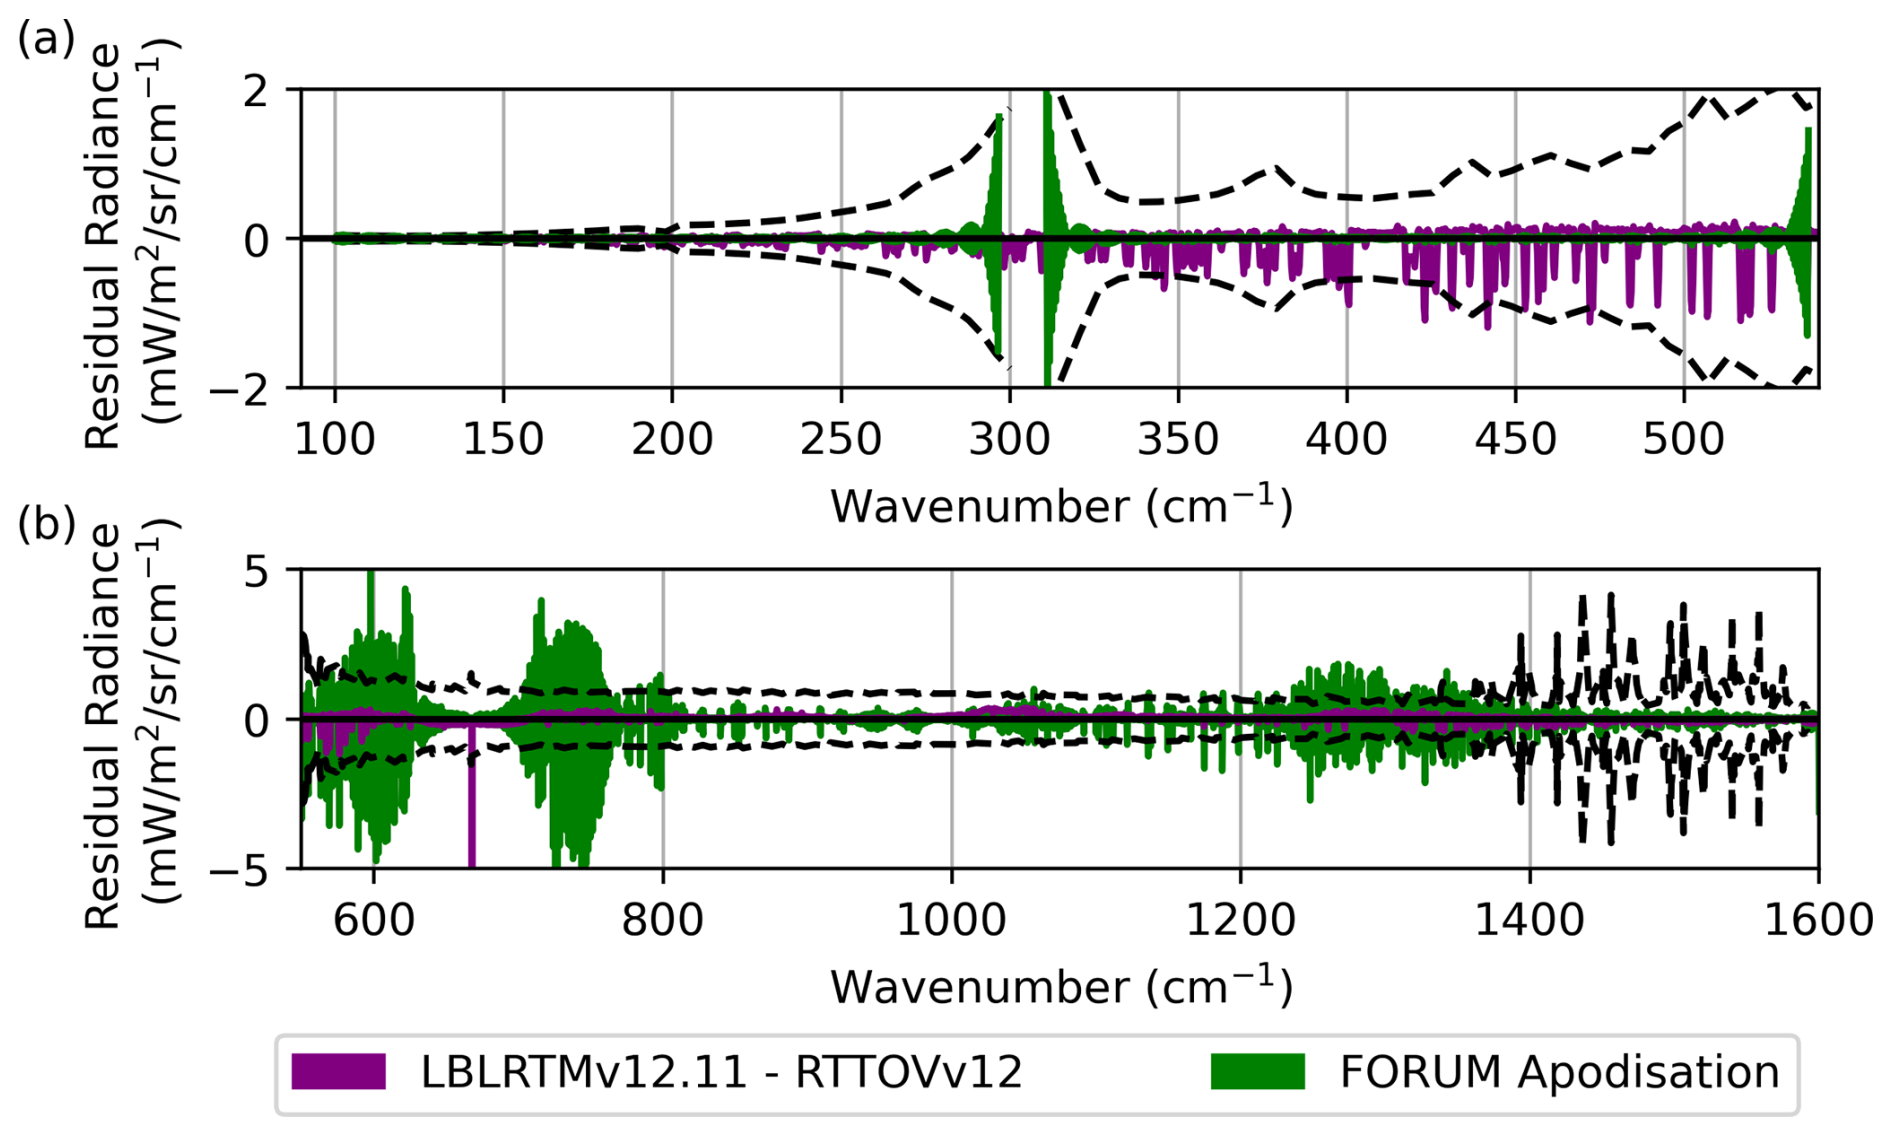
Figure 8The uncertainty associated with developing FORUM-aircraft observations. The purple line is the residual between an FSI-apodised LBLRTMv12.11 simulation and RTTOVv12 FSI simulation using the aircraft-level coefficients in the (a) TAFTS and (b) ARIES spectral ranges. The green line shows the residual between LBLRTMv12.11 simulations of the TAFTS and ARIES observations during the C153 flight that have had the FORUM apodisation directly applied and been made to look like TAFTS or ARIES first, as outlined in Sect. 6.1. The dashed line is the noise and calibration uncertainty combined in quadrature associated with the ARIES longwave channel and both TAFTS channels.
5.2 Selection of radiance observations
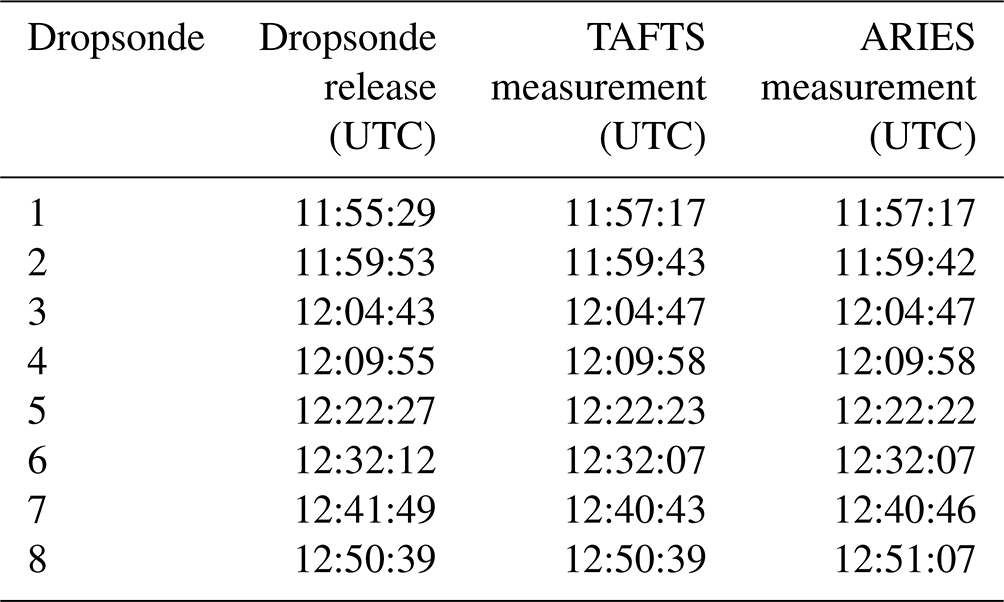
The dropsondes provide an in situ measurement of the atmospheric state. Therefore, the TAFTS observation that is closest in time to the release of each dropsonde has been selected. Six ARIES scans centred on each selected TAFTS spectrum were chosen to create an average ARIES spectrum that is best matched to the TAFTS' field of view and scan time. This averaging reduces the random component of uncertainty. However, the calibration uncertainty for ARIES tends to be relatively large between 600 and 1600 cm−1; thus, averaging has only a small impact on the total instrument uncertainty.
Final selection times are shown in Table 2. For dropsondes 3, 4, 5, and 8, there are observations from TAFTS and ARIES within 5 s of the dropsonde release. During the release of dropsonde 8, the ARIES instrument was calibrating; therefore, there is a greater time difference between the TAFTS and ARIES measurements. However ARIES scans in this period are consistent with simulations using the profile from dropsonde 8 (Warwick et al., 2022). For dropsonde 2, the TAFTS and ARIES observations are 10 s away from the dropsonde release, whereas there is over 1 min difference for dropsondes 1 and 7, which should be considered in later comparisons.
Table 2The times of each dropsonde release and the closest TAFTS scan in time. For each TAFTS scan, the closest six ARIES scans are averaged to provide the best match for the field of view and scan time between the instruments. The time of the central ARIES scan is shown.
The coincident aircraft-level observations taken by TAFTS and ARIES present a unique opportunity to assess the potential of what FORUM observations could deliver, as when combined TAFTS and ARIES cover the full FSI spectral range. To evaluate this potential, the TAFTS and ARIES observations have been altered to mimic the FSI instrument response function and spectral sampling, thereby creating the FORUM-aircraft observations. Specialised RTTOVv12 transmission coefficients have also been developed, using LBLRTMv12.11, to enable simulations of upwelling spectra at the altitude of each SLR with the spectral characteristics of the FSI. This version of LBLRTM uses the MT_CKDv3.5 continuum model, which, most notably for this study, contains an update to the water vapour continuum that increases water vapour absorption within the far-infrared (Mlawer et al., 2019). A comparison of directly simulated radiances from LBLRTMv12.11 with RTTOVv12 simulations using the new coefficients typically generated differences that were much smaller than the instrument uncertainty, except for three or four isolated channels in the far-infrared (Fig. 8b) that were subsequently excluded from the channel selection process described in Sect. 6.2.
This section will focus on evaluating the specialised RTTOVv12 coefficients and adapting the TAFTS and ARIES observations (Sect. 6.1), before optimising and testing IMS for this FORUM-aircraft configuration (Sect. 6.2) on the test cases from Sect. 4.
6.1 Constructing FORUM-aircraft observations
The FORUM-aircraft observations are constructed by applying the FSI instrument line shape (ILS) and apodisation to the observed TAFTS and ARIES radiances. Both TAFTS and ARIES each have their own ILS, and TAFTS also has an apodisation applied to its observed radiances. These cannot be removed, creating a source of error that needs to be quantified to constrain the retrieval of the FORUM-aircraft observations. To do this, we take the native, high-resolution LBLRTMv12.11 output spectrum and treat it in two ways. First, we directly apply the FSI ILS and apodisation. Second, we apply the individual TAFTS and ARIES ILS and apodisation and then apply the FSI characteristics. By taking the difference between these two methods, we can evaluate the impact of the original instrument characteristics on the FORUM-aircraft measurements.
Figure 8a shows (in green) that the previous TAFTS spectral characteristics have a minimal effect on radiances over the majority of the TAFTS spectral range. Closer to the shortwave and longwave detector band edges, this effect increases; however, residuals are predominantly within the measurement uncertainty. In comparison, there is a larger impact on the ARIES spectrum (Fig. 8b) due to its coarser spectral sampling, with residuals often exceeding the measurement uncertainty. This effect is most prominent in the 667 cm−1 CO2 band wings which are typically exploited to obtain the vertical temperature profile and is likely to degrade the performance of the temperature retrieval. Therefore, the uncertainty caused by the FORUM apodisation process has been combined with the instrument uncertainty (the dashed lines in Fig. 8) in quadrature, and these uncertainties together form the main diagonal of the measurement covariance for the FORUM-aircraft configuration shown in Fig. 9.
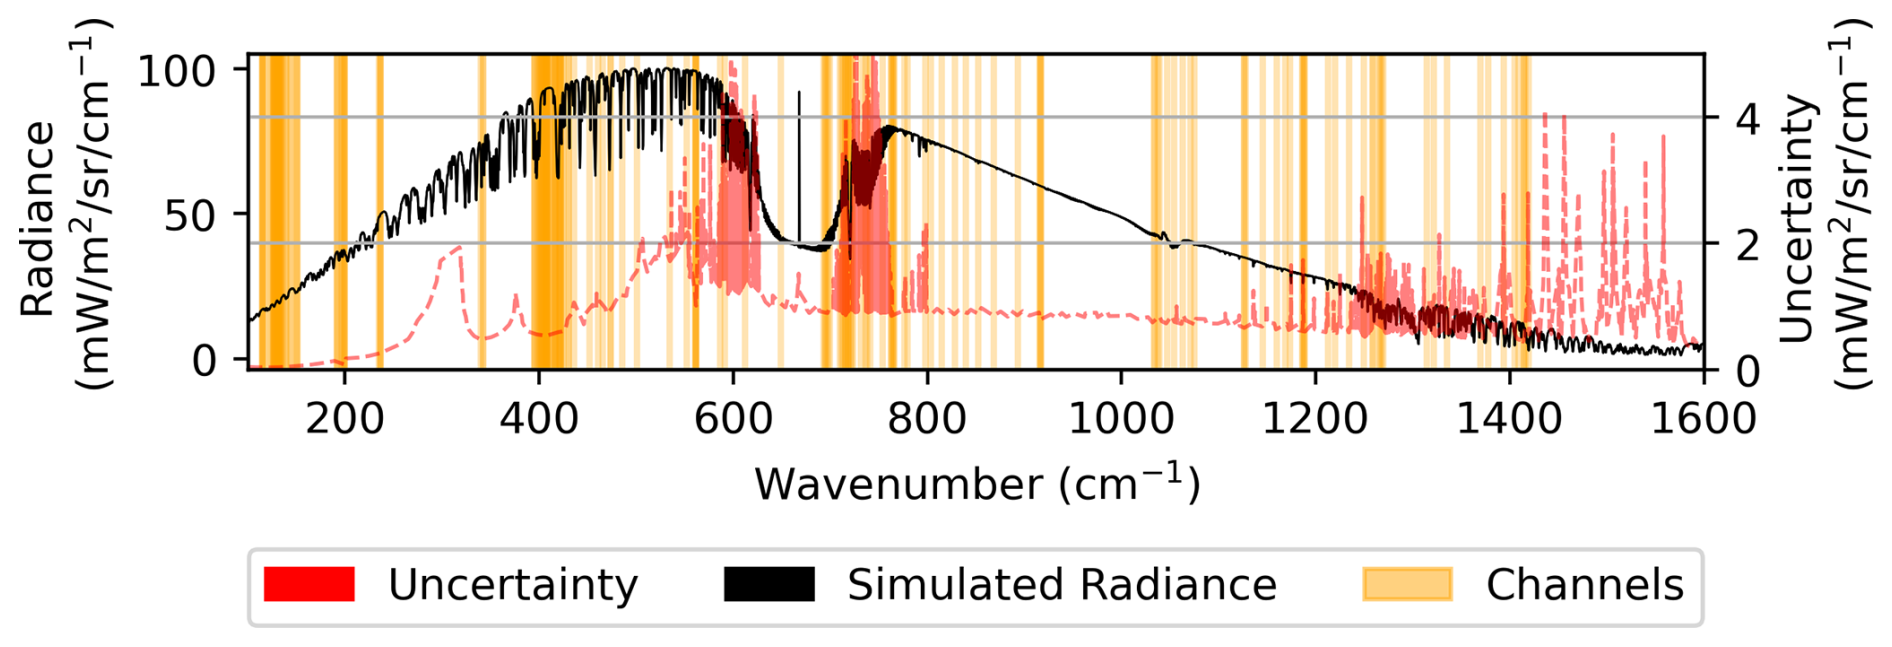
Figure 9The uncertainty used for FORUM-aircraft configurations is overlaid on an example simulated upwelling spectrum at the altitude of the higher SLR. This is composed of the instrument uncertainty and the uncertainty that arises from the FORUM apodisation process discussed in Sect. 6.1. This uncertainty squared is used as the main diagonal of Sy. The instrument uncertainty is the radiometric calibration and random noise for each instrument combined in quadrature for a single TAFTS scan and six ARIES scans. For both instruments, this uncertainty is dominated by the calibration, particularly for ARIES, where the random noise is reduced due to multiple scans. The impact of the FORUM apodisation process can be seen most clearly in the 15 µm CO2 band and between 1200 and 1400 cm−1. The 200 channels selected for the aircraft retrievals are also shown.
6.2 Channel selection and testing on simulations
Using the FORUM-aircraft measurement covariance in Fig. 9, new channels have been selected to optimise the information content for the FORUM-aircraft configuration, employing the same approach as in Sect. 3.2.
The 200 channels with the highest information content are shown in Fig. 9 and represent 63 % of the total available information content, comparable to the FORUM configuration's channel selection in Sect. 3. Similar to the FORUM configuration, the FORUM-aircraft configuration selects channels in the 350–500 cm−1 region and the 667 cm−1 CO2 band wings, despite the larger measurement covariance (cf. Fig. 9 and Fig. 1b). However, as the uncertainty for the FORUM-aircraft configuration is considerably reduced below 200 cm−1 relative to the rest of its spectral range, 23 % of the channels have been selected in this region, whereas none were identified in this range for the FORUM configuration.
To compare the performance of the FORUM-aircraft against the FORUM configuration, the testing in Sect. 4.1 has been repeated using the newly selected channels and measurement covariance calculated for the FORUM-aircraft configuration. These FORUM-aircraft retrievals have been performed using the same test cases identified in Sect. 4 but for an observing sensor at the pressure level of the higher SLR of the C153 flight. A full bias comparison can be seen in the Supplement; however, there is an improvement of up to 2 % and 0.1 K in the water vapour and temperature bias, respectively, against the FORUM configuration below the pressure level of the higher SLR. The median DOFS for temperature was also reduced by ∼ 0.4 due to the larger measurement covariance in the CO2 band wings. The similarity between the FORUM-aircraft and FORUM retrieval performance across the test cases suggests that, when we apply the IMS FORUM-aircraft configuration to real observations in the next section, the FORUM-aircraft results will give a realistic indication of the potential quality of retrievals that can be expected from the FSI.
7.1 Initial retrieval
Retrievals of temperature and water vapour were performed (using the approach described in Sect. 2.1) on the selected aircraft observations (Sect. 5.2) that have been modified to mimic the FSI's instrument line shape. Retrievals of the spectral surface emissivity and surface skin temperature were also obtained simultaneously (results can be found in the Supplement). In each case, the closest hourly ERA5 data were used as the a priori for surface skin temperature, atmospheric temperature, and water vapour, accompanied by the weak, global a priori covariance outlined in Sect. 2. The average retrieved surface skin temperature was found to be 280.3 ± 0.2 K across the eight cases consistent with the iterative process used in Warwick et al. (2022).
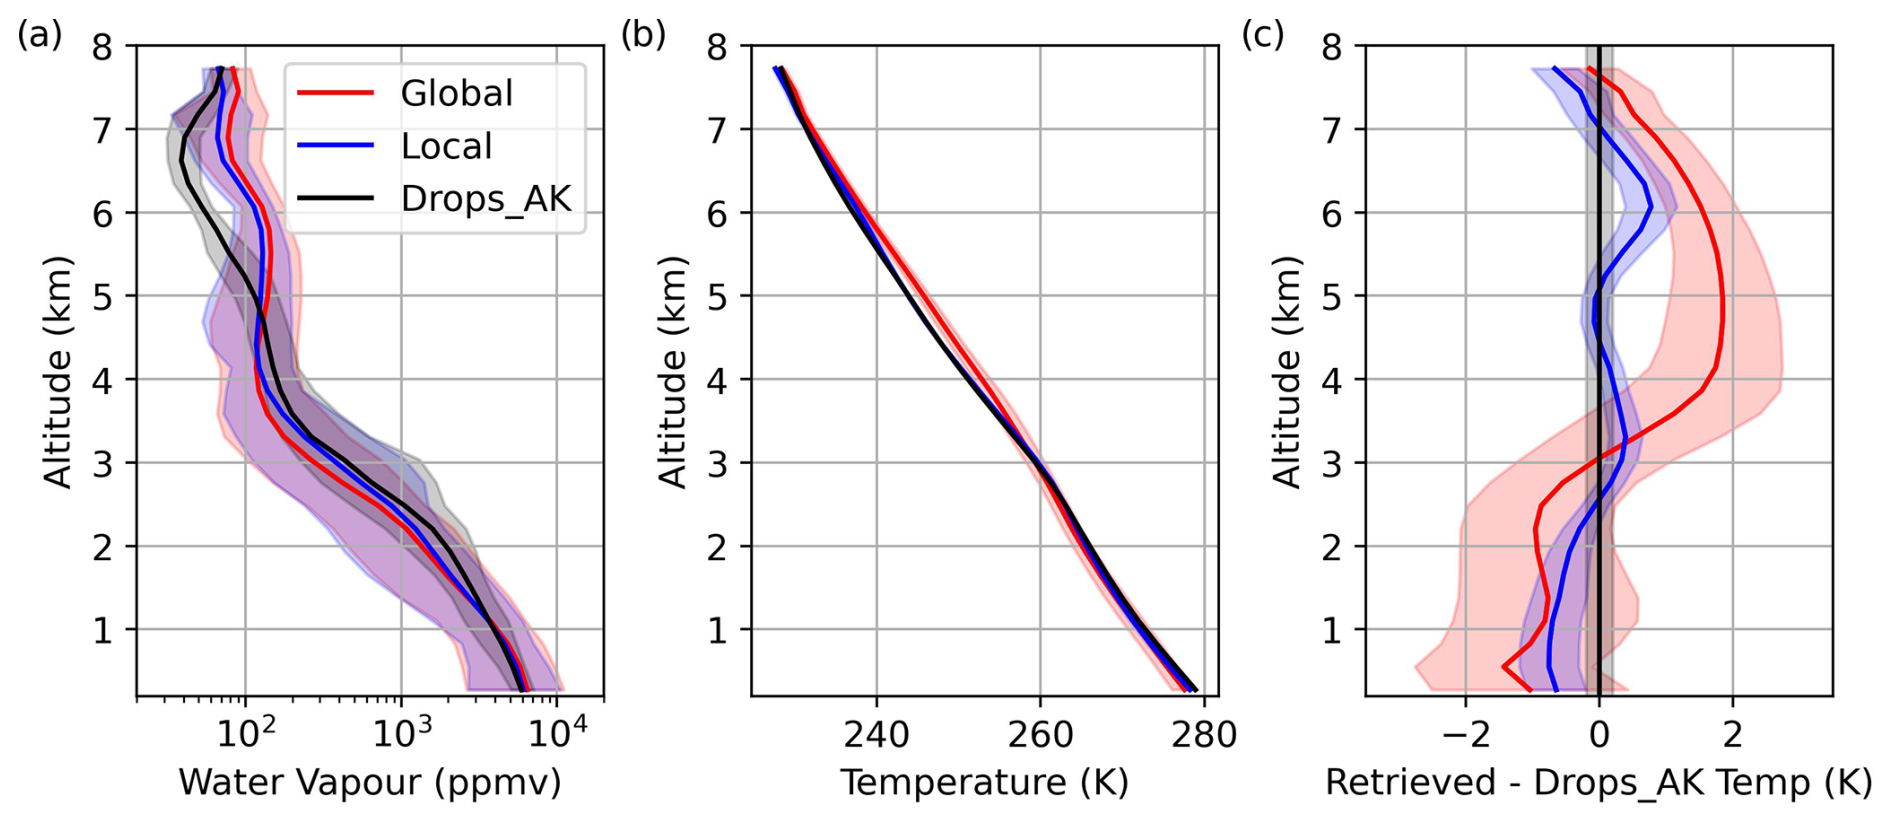
Figure 10The mean retrieved (a) water vapour and (b) temperature profiles as well as the (c) the residual between the retrieved temperature and each AK-treated dropsonde profile (Drops_AK), using the global and local grid a priori covariances for temperature, shown in red and blue, respectively. The Drops_AK water profile and temperature profiles shown in panels (a) and (b) did not change significantly with the different covariances; therefore, they are only shown for the global covariance. The temperature residuals shown in panel (c) were calculated with respect to the correct Drops_AK profile. The global a priori covariance is calculated from ERA5 temperatures across the globe for 3 d, as used in Trent et al. (2023). The local a priori covariance is calculated from ERA5 temperatures surrounding the SLRs for the duration of the flight. Blue and red shaded regions show the full spread of retrieved profiles, with purple regions showing the overlap. The black shaded region in panel (a) shows the full spread of AK-treated dropsonde profiles as well as the measurement uncertainty, whereas it shows the dropsonde measurement uncertainty only in panels (b) and (c).
Figure 10 shows the mean temperature and water vapour retrievals for all eight observations (red curves) co-located with the release of each dropsonde. The black curve shows the average of all of the dropsonde measurements with their respective averaging kernel applied. These are referred to as AK-treated dropsonde measurements, xAK, and are calculated using the following equation:
where the averaging kernel used is calculated for each individual retrieval.
The water vapour retrieval captures the AK-treated dropsonde profile below approximately 5 km within its uncertainty. However, the temperature retrieval has a limited performance, particularly above 4 km and near the surface, with a mean retrieval bias of up to 2 K.
Warwick et al. (2022) indicated that the ARIES spectra were, at best, poorly constrained in regions of the spectrum sensitive to atmospheric temperature due to possible heating of the instrument housing. Here, the additional impact of the apodisation in the CO2 band on the measurement exacerbates this unreliable information and results in the large temperature residuals between the AK-treated dropsonde and retrieved profiles, as the retrieval attempts to fit anomalously warm observations. It is unlikely that this is due to the dropsondes' representation of the state. While Fig. 7b shows a variation of up to 0.5 K in ERA5 around each of the dropsondes between 4 and 7 km, a systematic effect is observed across all of the retrievals.
To compensate for this, the a priori covariance for temperature has been tightened to the local covariance of ERA5 temperature profiles surrounding the SLRs for the duration of the flight. The a priori covariance for water vapour has not been tightened and is still derived from global ERA5 data across 3 d. The impact on the mean temperature and water vapour AKs across the eight cases is shown in Fig. 11. As expected, Fig. 11d shows a reduction in the temperature AKs, with a 60 % reduction in the average temperature DOFS values. This tightening of the a priori temperature covariance also leads to an increase in the water vapour AKs focused below 4 km with a 17 % increase in the water vapour DOFS values in Fig. 11b.
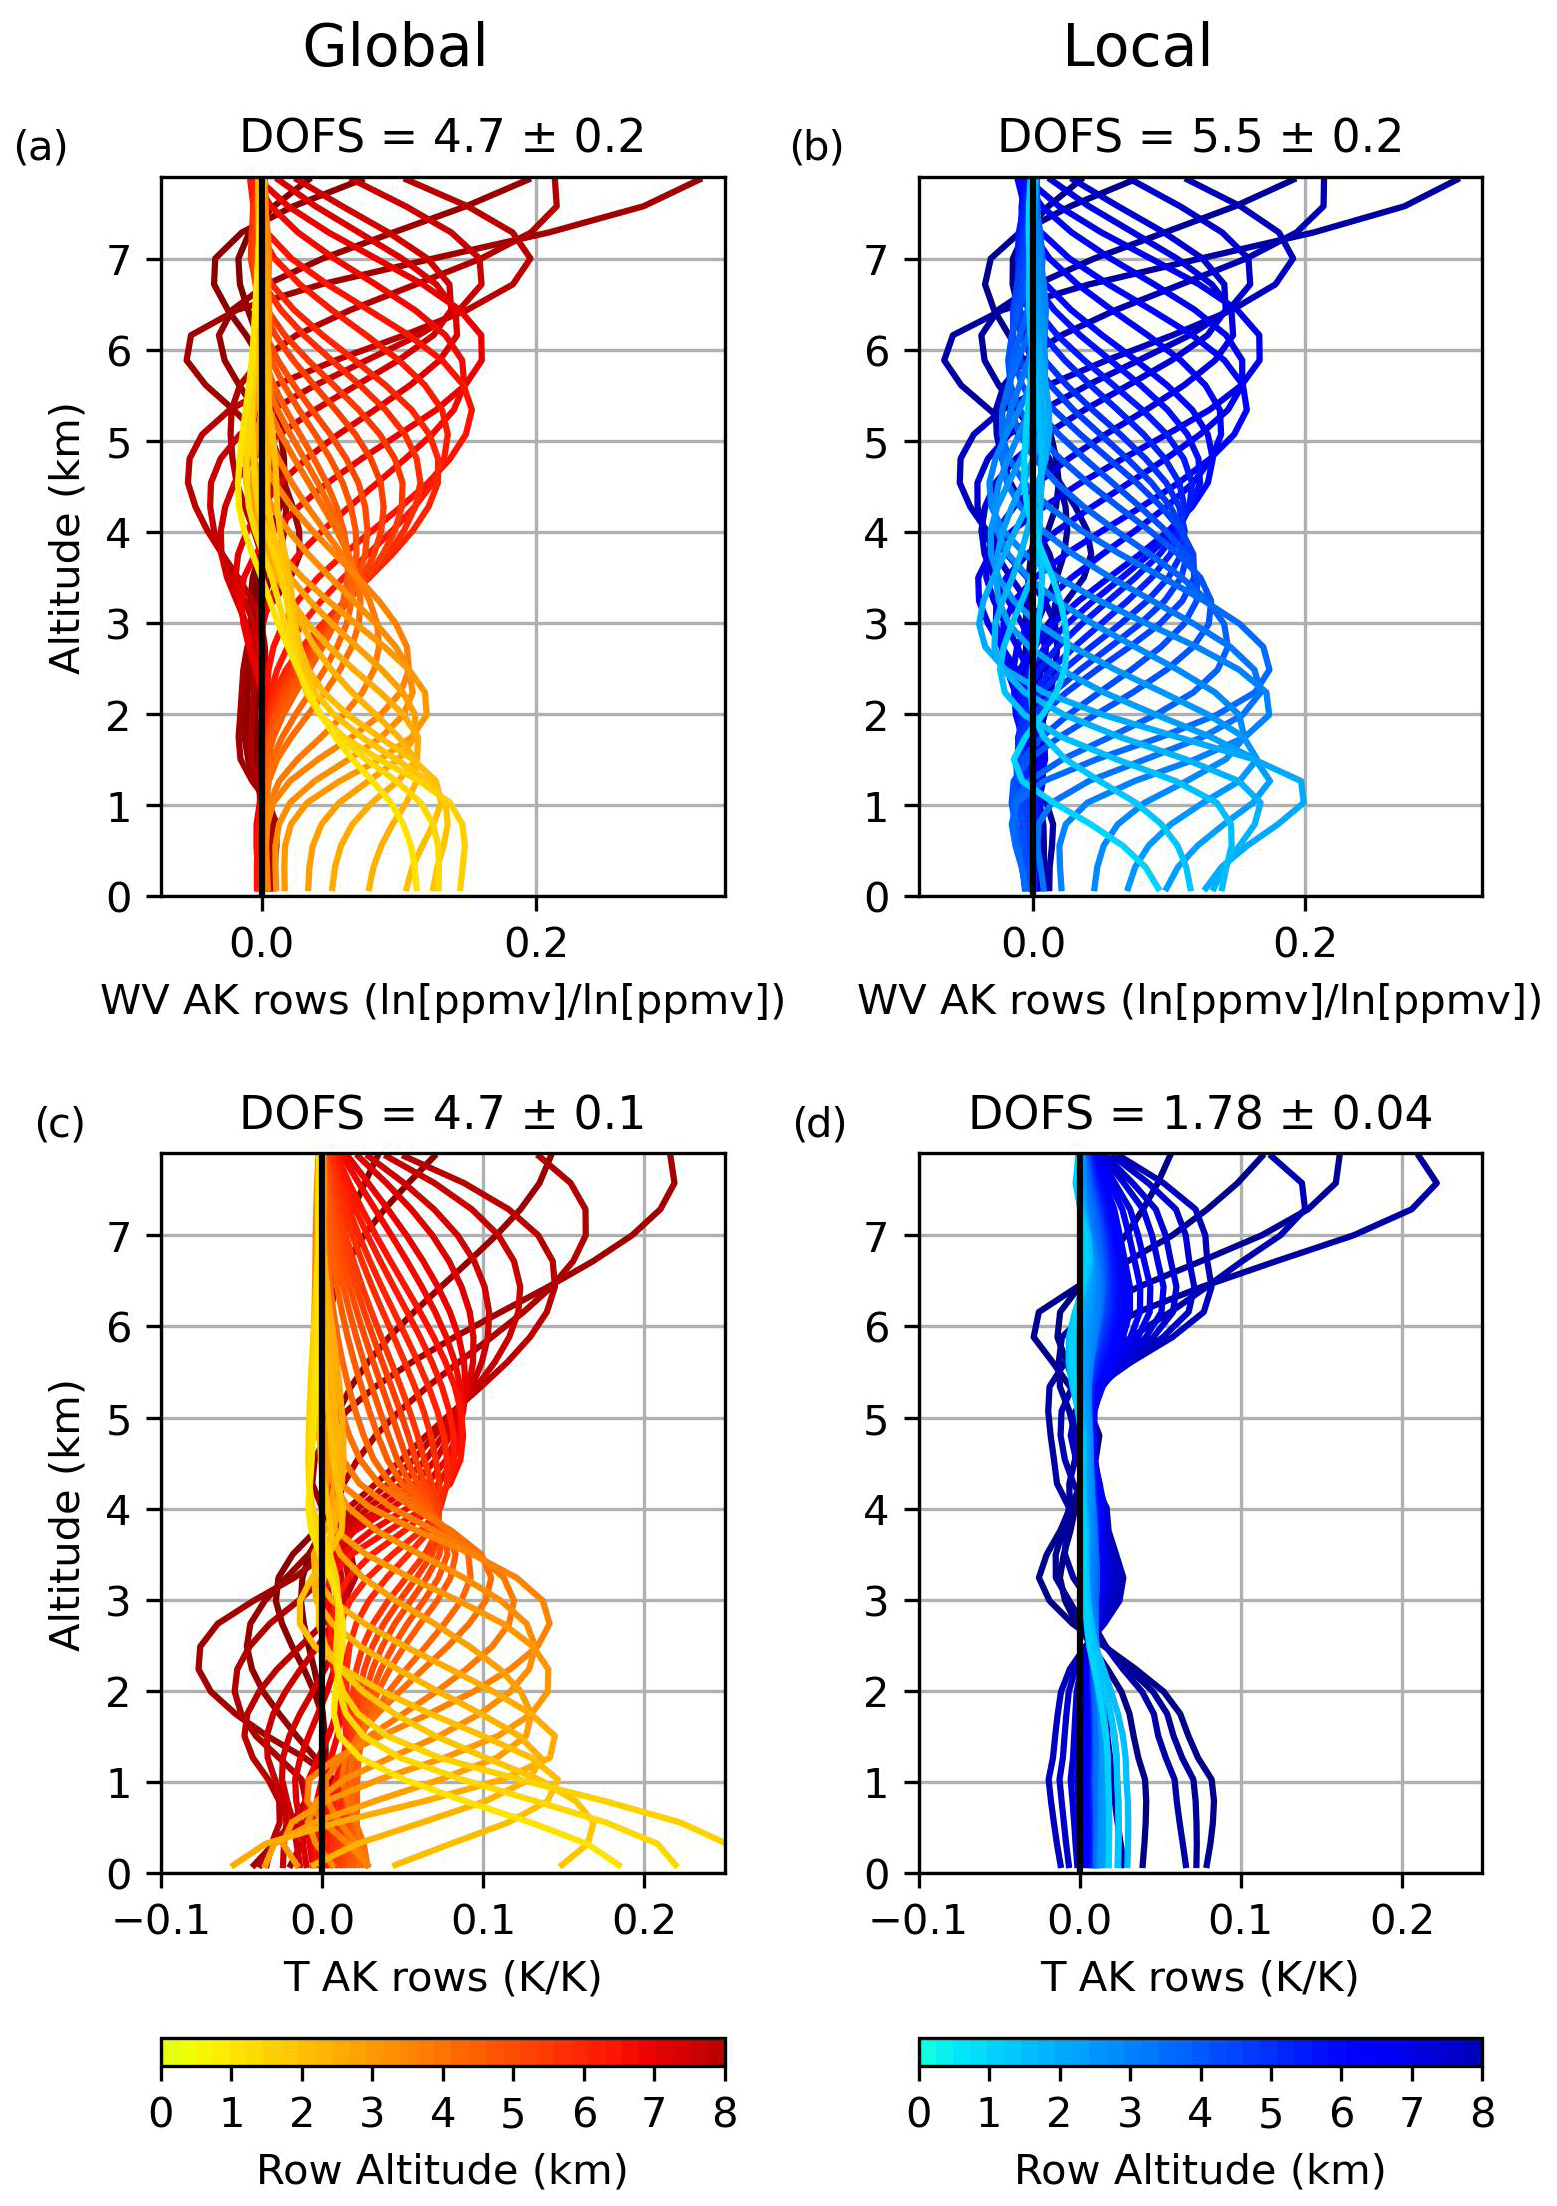
Figure 11Rows of the mean averaging kernels (AKs) for (a, b) water vapour and (c, d) temperature calculated from retrievals of the C153 observations, with colours representing the dropsonde altitude of each profile level. Panels (a) and (c) follow the same colour scheme and are the rows of the AKs for which the a priori temperature covariance was derived from 3 d of global ERA5 data. Panels (b) and (d) follow the same colour scheme and are the rows of the AKs for which the a priori temperature covariance was derived from the ERA5 data surrounding the SLRs for the duration of the flight. The water vapour a priori covariance used is the same in both sets of retrievals. The mean and standard deviation of the respective DOFS values from the eight retrievals are shown for each plot.
Figure 10 shows that the implementation of the local temperature constraint significantly improves agreement between the temperature retrievals (blue curve) and the AK-treated dropsonde profiles, with a mean temperature residual of 0.8 K at most. A similar improvement is observed in the percentage difference between the water vapour retrievals and AK-treated dropsonde, with an improvement of up to 20 % at 3 km and up to 33 % at 6 km. A smaller effect is observed in the retrievals at higher altitudes. This method enables the joint retrieval of temperature, water vapour, surface emissivity, and surface skin temperature that was not possible in Warwick et al. (2022) due to the limitations outlined for the ARIES spectra.
7.2 Revised retrievals
Given the findings in Sect. 7.1, we focus on the retrievals performed using the local a priori covariance for temperature derived from ERA5 temperature profiles surrounding the SLRs for the duration of the flight, and the global a priori covariance for skin temperature and water vapour. The surface emissivity a priori covariance is derived from the UWIREMIS atlas for sea surface types and the Huang et al. (2016) emissivity atlas for land surface types, as outlined in Sect. 3.1.
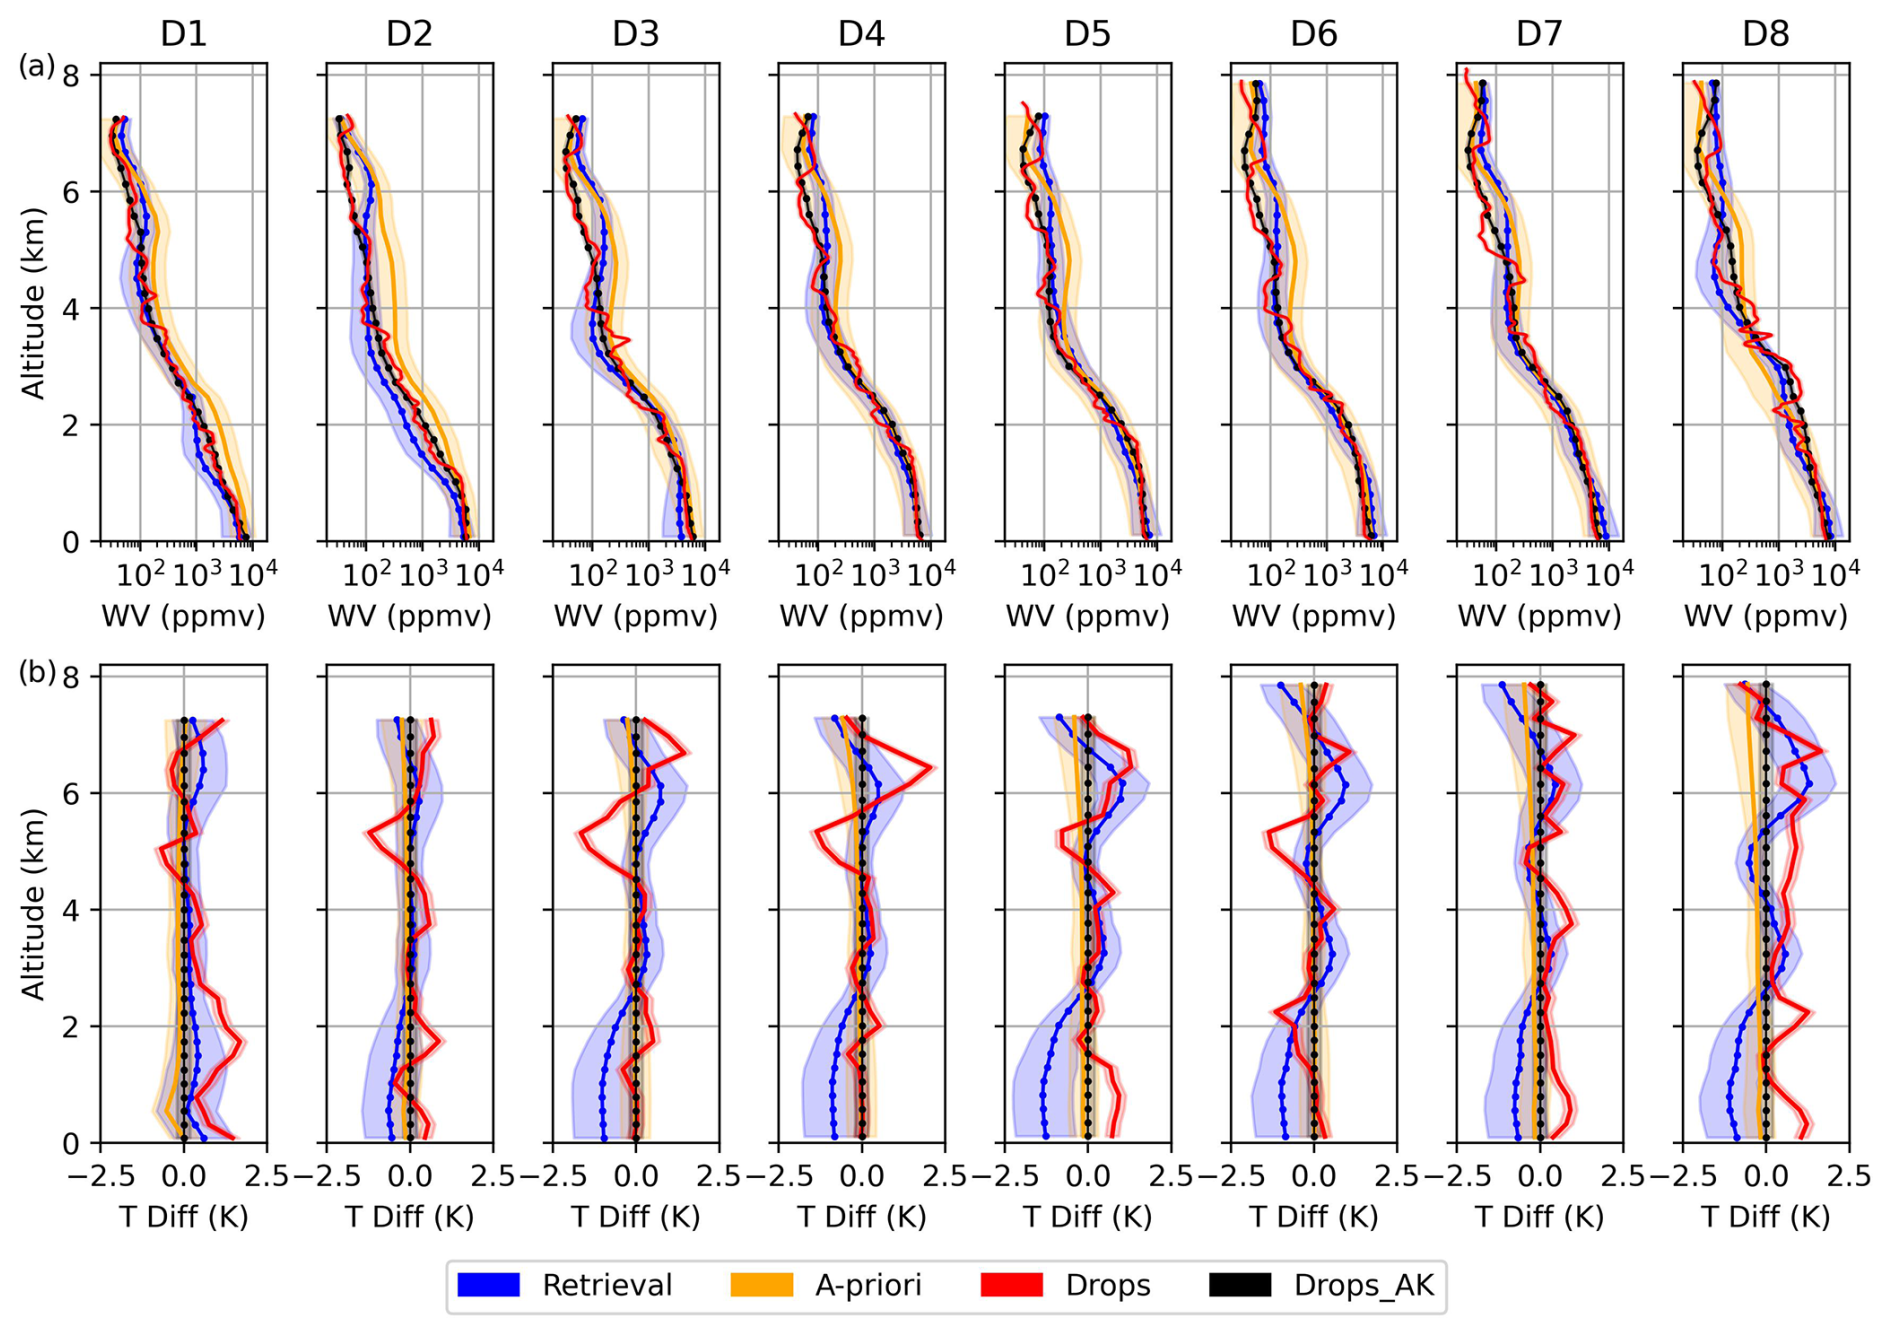
Figure 12(a) Water vapour retrievals and (b) the difference between the retrieved temperature and AK-treated dropsonde profiles performed using the FORUM-aircraft radiances. The shaded region in each retrieved value represents two ESDs of the retrieval derived from the square-root diagonal of Sx. The a priori is shown in orange, with the shaded region showing the a priori standard deviation. The dropsonde profiles from each case are shown in red, and each one has had their respective averaging kernels (Drops_AK) applied, which are shown in black. The shading around the dropsonde and Drops_AK profiles represents the uncertainties outlined in Sect. 5.1.2. For temperature, the dropsonde uncertainty is represented as 0.2 K. For water vapour, the dropsonde uncertainty varies with altitude but remains below 9 %.
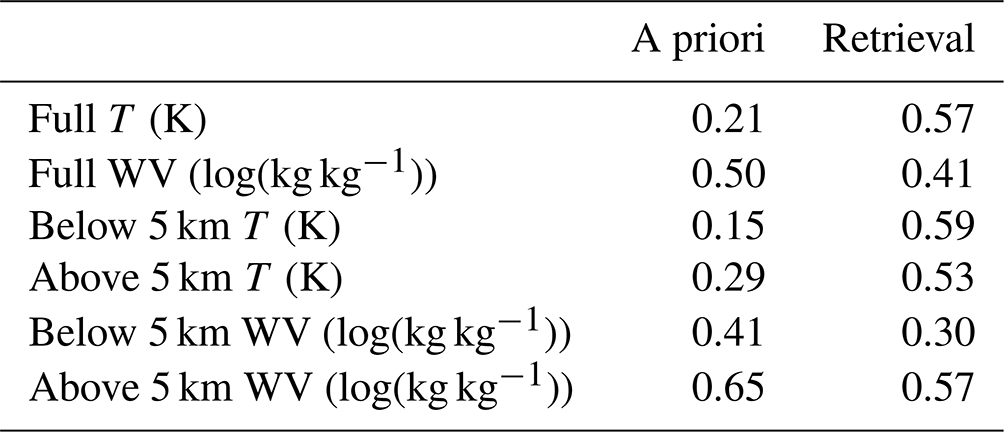
Figure 12 shows each retrieved water vapour and temperature profile compared to the a priori and to the reference AK-treated and untreated dropsonde profiles. Retrievals of water vapour typically bring the a priori estimate closer to the AK-treated dropsonde profile. This is reflected by an 18 % reduction in the RMSE relative to AK-treated dropsonde profiles throughout the vertical profile (Table 3). Retrievals of temperature have a restricted movement from the a priori, as outlined in Sect. 7.1; as a result, applying the AKs in Fig. 11d brings each dropsonde profile to within 0.6 K of their corresponding a priori.
Table 3The RMSE value relative to each AK-treated dropsonde profile for temperature (T) and water vapour (WV) for the eight observations against the a priori (ERA5) and retrieved profiles. RMSE values have been separated into above and below 5 km.
Both the retrievals of temperature and water vapour generally capture their reference state within their uncertainty. However, some issues are apparent; for example, the water vapour retrievals struggle with a persistently dry layer measured by the dropsondes between 5 and 7 km, and the temperature retrievals generally have a warm bias above 5 km and a cold bias closer to the surface. A deeper analysis of the retrievals follows, divided into altitudes above and below 5 km. To aid this analysis, Fig. 13 shows the average weighting function for selected 100 cm−1 wavenumber bands (in panel a), the spectral residuals between the final retrieved state and the observations (in panel b), and the improvement in the residuals relative to the original from the a priori (in panel c).
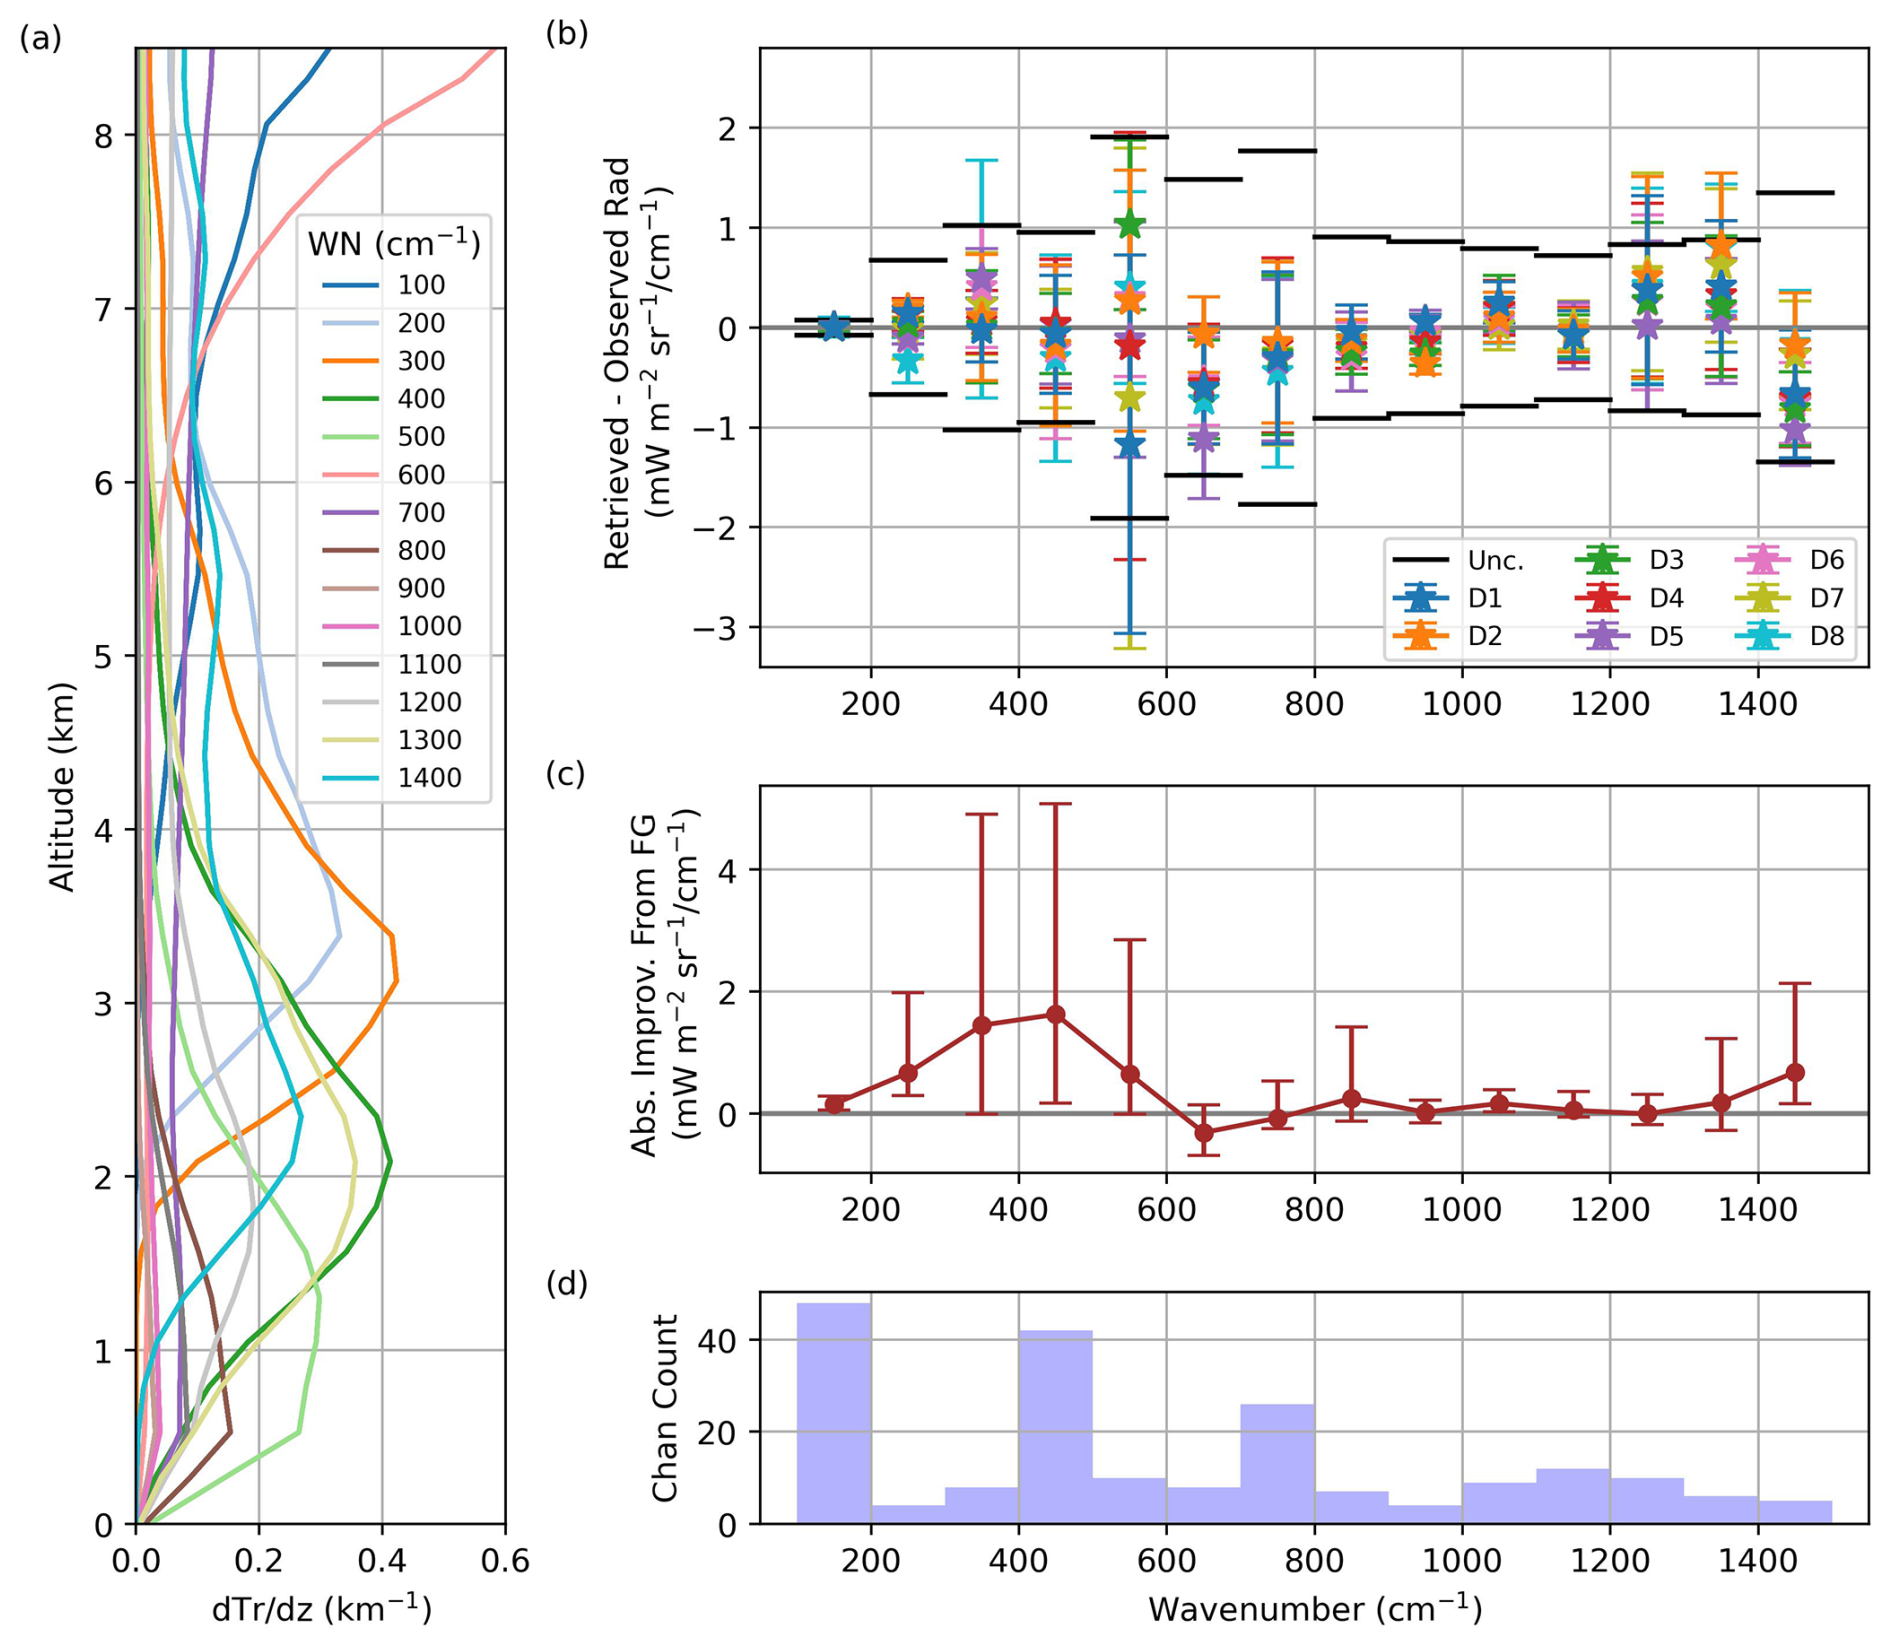
Figure 13(a) The mean weighting function (change in transmission (Tr) with altitude (z)) for each wavenumber (WN) bin averaged across the 200 selected channels for all eight dropsondes. (b) The radiance residuals in the selected 200 channels between the retrieved and FORUM-aircraft observed spectra for all cases. Residuals have been averaged over 100 cm−1 bins, and the mean and standard deviation for each bin are shown. The black line represents the mean uncertainty (Unc.) from Fig. 9, which is the square-root diagonal of Sy, in that bin. (c) The mean absolute improvement in the spectral residual from the first-guess (FG) spectra to the retrieved spectra across all eight cases in each bin. Error bars show the minimum and maximum values across the eight cases in each bin. Panel (d) shows the number of channels in each bin.
7.2.1 Above 5 km
Figure 12a shows that the retrieved water vapour concentration is generally overestimated relative to the dropsonde measurements at altitudes above 5 km. The most obvious discrepancy occurs in a layer between approximately 5 and 7 km, where the dropsondes are persistently drier than the a priori estimate. Although, in most cases, the retrieved profiles (blue lines) move towards the corresponding AK-treated dropsonde profiles (black lines) between 5 and 6 km, the shift is small and the difference between them can exceed 2 ESDs of the retrieval. Above 6 km, movement from the a priori towards the AK-treated dropsonde is less obvious.
As the AK-treated dropsonde also does not deviate substantially from the original dropsonde profile in this region, it is not expected that these differences are caused by a weak sensitivity to the profile or the a priori. Figure 13a shows that the channels with the highest sensitivity between 5 and 7 km tend to be clustered between 100 and 400 cm−1 and above 1400 cm−1, within the water vapour rotation and vibration–rotation bands. Between 100 and 400 cm−1, water vapour spectroscopy, including line and continuum contributions, has been continuously updated over the last couple of decades, but it is still subject to relatively large uncertainty (Mlawer et al., 2019, 2023), which will contribute to forward model error. Above 1400 cm−1, the fitted radiances are on average underestimated by −0.6 mW m−2 sr−1 (cm−1)−1; however, this remains within the measurement covariance (Fig. 13b).
The temperature retrievals broadly capture the AK-treated dropsonde within the uncertainty of the retrieval but generally do not present an improvement from the a priori. As discussed in Sect. 7.1, an overestimation of up to 1.3 K is seen above 5 km due to the ARIES spectra. However, there is also an underestimation observed closer to the aircraft. In Warwick et al. (2022), there were notable differences between simulated radiances and ARIES observations between 650 and 700 cm−1. Six out of the eight channels in the 600–700 cm−1 bin are within this spectral range. As Fig. 13a shows, the channels used within this bin show a greater sensitivity to the atmosphere above 7 km, and the fitted radiances within this bin are generally underestimated (Fig. 13b).
7.2.2 Below 5 km
When making comparisons to the dropsonde profiles at lower altitudes, it is important to note that the dropsondes have travelled up to 23 km from their release when they reach the surface. This is most significant for the retrievals closest to dropsonde 1 and 7, for which the radiometric observations are taken over 1 min from the dropsonde releases and so have a weaker reference of the atmospheric state at lower altitudes. Furthermore, the ERA5 reanalyses surrounding each dropsonde in Fig. 7 imply a higher variability in the water vapour concentrations between 2 and 4 km, reaching up to 30 % in water vapour for dropsonde 2. The corresponding temperature standard deviation reaches up to 0.5 K closer to the surface for all dropsondes. Hence, it is feasible that the dropsonde profiles are less representative of the atmosphere sounded by the aircraft spectrometers at these altitudes.
Nonetheless, below 5 km the a priori for water vapour for dropsondes 3–7 is close to the dropsonde profile, particularly below 2 km. For dropsondes 1, 2, and 8, there is a larger discrepancy that the retrieval successfully reduces, shifting the retrieved values closer to the relevant AK-treated dropsonde profile. Indeed, in all cases except dropsonde 2, the retrieval uncertainty fully encompasses the dropsonde values below 4 km. Even for the case closest to dropsonde 2, the retrieval significantly shifts from the a priori closer to the dropsonde profile, with the largest spectral shifts observed between 200 and 600 cm−1 (Fig. 13b).
Between 2 and 5 km, all of the temperature retrievals capture the AK-treated dropsonde profile within their retrieval uncertainty with limited movement from the a priori, as would be expected from the AKs (Fig. 11d). Nearer the surface, the average retrieval bias for the retrievals closest to dropsondes 2–8 is −0.9 ± 0.2 K relative to the AK-treated dropsonde profiles. Of these cases, only the retrieval closest to dropsonde 5 underestimates the AK-treated dropsonde temperature outside of both their uncertainties, and this underestimation is by only 0.1 K. The retrieval closest to dropsonde 1 is the only case that shows a warm bias to the AK-treated dropsonde profile nearer the surface; however, as previously mentioned, the dropsonde provides a weaker reference of the true profile in this instance.
These temperature and humidity changes are manifested in radiance space as shown in Fig. 13b. Figure 13a highlights that the spectral regions between 400 and 600 and 1200 and 1400 cm−1 are most sensitive to lower altitudes, particularly below 3 km. In these bins, particularly in the far-infrared, the retrieval reduces the spectral residuals by up to 5 mW m−2 sr−1 (cm−1)−1 from the first-guess spectra (Fig. 13c). Despite these improvements, the retrievals closest to dropsondes 1–3 still demonstrate a limited fit in the 500–600 and 1300–1400 cm−1 bins. While the timing of dropsonde 1 is somewhat offset from the radiometric aircraft measurements, the same is not true for dropsondes 2 and 3. Dropsondes 1 and 2 also show enhanced water vapour variability between 3 and 4 km in the surrounding ERA5 profiles compared to the other cases (Fig. 7b), but this enhancement is not seen around dropsonde 3.
We present the extension of the Infrared Microwave Sounding (IMS) retrieval scheme into the far-infrared in preparation for the upcoming FORUM mission. Retrievals of temperature and water vapour have been evaluated through a two-stage testing process: on simulated FORUM clear-sky radiances and on observed clear-sky radiances from the upper troposphere. For the former, we make comparisons to the “true” profiles used to generate the simulations, whereas we make comparisons to in situ measurements of the atmospheric state for the latter.
For the FORUM configuration, the measurement covariance is based on the expected apodised NESR and target ARA for the FORUM Sounding Instrument (FSI). An information content analysis was performed to optimise the channels used in the retrieval, resulting in the selection of 200 channels. The highest channel density was seen in the 400–600 cm−1 region due to the sensitivity of radiances to water vapour and temperature coupled with the relatively low NESR and ARA in this region.
The performance of IMS was first assessed using 240 RTTOVv12 simulations of TOA radiances based on MERRA-2 reanalysis profiles. Retrievals using the FORUM configuration had a tighter measurement covariance than the IASI configuration below ∼ 1200 cm−1. Both configurations demonstrated comparable retrieval biases. However, slight improvements in the FORUM median retrieval bias were observed in the mid- to upper troposphere for water vapour, with a reduced median uncertainty of at most 7 % and an increase of approximately 1 DOFS for both water vapour and temperature due to additional information in the upper troposphere. We stress that the goal of the comparison is not to assess which instrument is better in terms of their retrieval performance; rather, it is a sanity check of the new, extended IMS code. In particular, it is worth noting that the measurement covariance used for IASI in this comparison is not the quoted instrument NESR but, instead, implicitly includes the effects of instrumental and forward model error. For FORUM, the instrumental error has been approximated using the target instrument specifications; therefore, it is likely that the comparison overstates the improvement that FORUM will bring relative to IASI observations.
Coincident aircraft observations of far- and mid-infrared radiances were then used to test IMS on clear-sky cases. These were taken during an aircraft flight in the upper troposphere, with the periodic release of dropsondes to measure the atmospheric state. Eight observations closest to each dropsonde release were selected and modified to emulate the FSI's spectral characteristics. The combination of the aircraft and FSI characteristics results in an increased spectral uncertainty, particularly in the 15 µm CO2 absorption band. This propagates through to change the channels selected for the retrievals when compared to the TOA simulation study. Applying this revised FORUM-aircraft configuration to simulated aircraft-level radiances from the MERRA-2 test set shows only a limited impact on the retrieved temperature and water vapour profiles compared to values derived using the original FORUM configuration from the equivalent TOA radiances. This gives confidence that the results obtained here from the aircraft observations are indicative of what might be expected from FORUM when it is operating.
Retrievals of the FORUM-aircraft observations required the a priori covariance for temperature to be tightened to the local ERA5 grid of the SLRs for the duration of the flight due to the larger measurement uncertainty associated with the observed spectra, particularly across the 15 µm CO2 band. This enabled simultaneous retrievals of temperature and water vapour, exploiting the full FSI spectral range. Tightening this constraint had the additional benefit of reducing the bias in the water vapour retrieval by up to 33 %. The final retrievals of temperature and water vapour generally captured the dropsonde measurements of the atmospheric state, with the RMSE in water vapour concentration reducing by 18 % from the a priori to the retrieved state across all eight cases. We note that the results do still highlight some inconsistencies, with both the ERA5 a priori and retrievals consistently overestimating the humidity between 5 and 7 km, and a persistent cold bias below 2 km in seven out of the eight cases analysed. These deficiencies are manifested in the radiance residuals seen in the final, fitted spectra, and we use these to postulate that the humidity bias may be related to water vapour spectroscopic uncertainty in the far-infrared. While our analysis implies that the variability around each dropsonde is relatively small, the near-surface bias may be partly related to the dropsonde drift away from the aircraft as it descends through the atmosphere.
To summarise, the IMS scheme has been extended to cover the far-infrared spectral range in preparation for the FORUM mission. It has now been tested on multiple aircraft-level observations of upwelling far-infrared radiances as well as on a diverse set of TOA simulated upwelling radiances, exploiting channels from the full FORUM spectral range. Pending the real FSI systematic and random uncertainties, IMS is ready to use for clear-sky retrievals from the FSI.
The ERA5 data are from the Copernicus Climate Change Service (C3S) Climate Data Store (CDS) (https://doi.org/10.24381/cds.bd0915c6, Hersbach et al., 2023). The MERRA-2 data are from the NASA GMAO website (https://doi.org/10.5067/QBZ6MG944HW0, Global Modeling and Assimilation Office, 2015a; https://doi.org/10.5067/3Z173KIE2TPD, Global Modeling and Assimilation Office, 2015b). The TAFTS and ARIES observations can be found on the CEDA archive (https://catalogue.ceda.ac.uk/uuid/6a2bc7a1edc34650bd41e0f958cbd50a/, Facility for Airborne Atmospheric Measurements et al., 2019). The NOAA flask measurements are from https://doi.org/10.7289/V5CN725S (Dlugokencky et al., 2021).
The supplement related to this article is available online at: https://doi.org/10.5194/amt-18-717-2025-supplement.
The study design was conceived by SP, HB, and CC. SP extended the retrieval framework, conducted the validation work, and wrote the first draft of the manuscript. HB, CC, and RS provided expertise and contributed to discussions of the results and revisions of the manuscript. JM and LW took the measurements from the TAFTS instrument, as part of the PIKNMIX-F campaign, and provided expertise on the TAFTS observations. SF provided the ARIES data.
The contact author has declared that none of the authors has any competing interests.
Publisher's note: Copernicus Publications remains neutral with regard to jurisdictional claims made in the text, published maps, institutional affiliations, or any other geographical representation in this paper. While Copernicus Publications makes every effort to include appropriate place names, the final responsibility lies with the authors.
Sanjeevani Panditharatne was funded by NERC (under grant no. NE/S007415/1) via the SSCP DTP. Helen Brindley was funded as part of NERC's support of the National Centre for Earth Observation (under grant no. NE/R016518/1). The PIKNMIX-F flight campaign was jointly funded by the Met Office and the ESA. Airborne data were obtained using the BAe 146-301 Atmospheric Research Aircraft flown by Airtask Ltd and managed by FAAM Airborne Laboratory, now jointly operated by UKRI and the University of Leeds. The authors would like to thank the instrument operators, aircrew, operations staff, and engineers for their support during the campaign.
This research has been supported by the UK Research and Innovation and the Natural Environment Research Council (grant nos. NE/S007415/1 and NE/R016518/1).
This paper was edited by Gabriele Stiller and reviewed by Bianca Maria Dinelli and one anonymous referee.
Allan, R. P., Willett, K. M., John, V. O., and Trent, T.: Global Changes in Water Vapor 1979–2020, J. Geophys. Res.-Atmos., 127, e2022JD036728, https://doi.org/10.1029/2022jd036728, 2022. a
Andrews, D. G.: An introduction to atmospheric physics, Cambridge University Press, Cambridge, UK, https://doi.org/10.1017/CBO9780511800788, 2000. a
Arshad, M., Ma, X., Yin, J., Ullah, W., Liu, M., and Ullah, I.: Performance evaluation of ERA-5, JRA-55, MERRA-2, and CFS-2 reanalysis datasets, over diverse climate regions of Pakistan, Weather and Climate Extremes, 33, 100373, https://doi.org/10.1016/j.wace.2021.100373, 2021. a
Brindley, H. E. and Harries, J. E.: The impact of far i.r. absorption on clear sky greenhouse forcing: sensitivity studies at high spectral resolution, J. Quant. Spectrosc. Ra., 60, 151–180, https://doi.org/10.1016/S0022-4073(97)00152-0, 1998. a, b
Canas, T. A., Murray, J. E., and Harries, J. E.: Tropospheric Airborne Fourier transform spectrometer (TAFTS), Satellite Remote Sensing of Clouds and the Atmosphere II, 3220, 91–102, https://doi.org/10.1117/12.301139, 1997. a, b
Chahine, M. T., Pagano, T. S., Aumann, H. H., Atlas, R., Barnett, C., Blaisdell, J., Chen, L., Divakarla, M., Fetzer, E. J., Goldberg, M., Gautier, C., Granger, S., Hannon, S., Irion, F. W., Kakar, R., Kalnay, E., Lambrigtsen, B. H., Lee, S., Le Marshall, J., Mcmilan, W. W., Mcmillin, L., Olsen, E. T., Revercomb, H., Rosenkranz, P., Smith, W. L., Staelin, D., Strow, L. L., Susskind, J., Tobin, D., Wolf, W., and Zhou, L.: AIRS: Improving Weather Forecasting and Providing New Data on Greenhouse Gases, B. Am. Meteorol. Soc., 87, 911–926, https://doi.org/10.1175/bams-87-7-911, 2006. a
Chevallier, F., Michele, S. D., and McNally, A.: Diverse profile datasets from the ECMWF 91-level short-range forecasts, Tech. Rep. December, ECMWF, https://www.ecmwf.int/node/8685 (last access: 10 May 2023), 2006. a, b
Chung, E.-S., Soden, B., Sohn, B. J., and Shi, L.: Upper-tropospheric moistening in response to anthropogenic warming, P. Natl. Acad. Sci. USA, 111, 11636–11641, https://doi.org/10.1073/pnas.1409659111, 2014. a, b, c
Clough, S., Shephard, M., Mlawer, E., Delamere, J., Iacono, M., Cady-Pereira, K., Boukabara, S., and Brown, P.: Atmospheric radiative transfer modeling: a summary of the AER codes, J. Quant. Spectrosc. Ra., 91, 233–244, https://doi.org/10.1016/j.jqsrt.2004.05.058, 2005. a
Collard, A. D.: Selection of IASI Channels for Use in Numerical Weather Prediction Selection of IASI Channels for Use in Numerical Weather Prediction, Tech. rep., ECMWF, https://www.ecmwf.int/en/elibrary/74028-selection-iasi-channels-use-numerical-weather-prediction (last access: 10 May 2023), 2007. a
Dessler, A. E., Zhang, Z., and Yang, P.: Water-vapor climate feedback inferred from climate fluctuations, 2003–2008, Geophys. Res. Lett., 35, L20704, https://doi.org/10.1029/2008GL035333, 2008. a
Di Natale, G., Palchetti, L., Bianchini, G., and Ridolfi, M.: The two-stream δ-Eddington approximation to simulate the far infrared Earth spectrum for the simultaneous atmospheric and cloud retrieval, J. Quant. Spectrosc. Ra., 246, 106927, https://doi.org/10.1016/j.jqsrt.2020.106927, 2020. a
Dirksen, R. J., Sommer, M., Immler, F. J., Hurst, D. F., Kivi, R., and Vömel, H.: Reference quality upper-air measurements: GRUAN data processing for the Vaisala RS92 radiosonde, Atmos. Meas. Tech., 7, 4463–4490, https://doi.org/10.5194/amt-7-4463-2014, 2014. a
Dlugokencky, E., Crotwell, A., Lang, P., Higgs, J., Vaughn, B., Englund, S., Novelli, P., Wolter, S., Mund, J., Moglia, E., Crotwell, M., and NOAA ESRL: Earth System Research Laboratory Carbon Cycle and Greenhouse Gases Group Flask-Air Sample Measurements of CO2, CH4, CO, N2O, H2, SF6 and isotopic ratios at Global and Regional Background Sites, 1967–Present, Version 2.0, NOAA National Centers for Environmental Information [data set], https://doi.org/10.7289/V5CN725S, 2021. a, b
Facility for Airborne Atmospheric Measurements, Natural Environment Research Council, and Met Office: FAAM C153 PIKNMIX-F flight: Airborne atmospheric measurements from core and non-core instrument suites on board the BAE-146 aircraft, Centre for Environmental Data Analysis [data set], https://catalogue.ceda.ac.uk/uuid/6a2bc7a1edc34650bd41e0f958cbd50a/ (last access: 10 Novemeber 2021), 2019. a
Ferreira, A. P., Nieto, R., and Gimeno, L.: Completeness of radiosonde humidity observations based on the Integrated Global Radiosonde Archive, Earth Syst. Sci. Data, 11, 603–627, https://doi.org/10.5194/essd-11-603-2019, 2019. a
Fetzer, E. J., Read, W. G., Waliser, D., Kahn, B. H., Tian, B., Vömel, H., Irion, F. W., Su, H., Eldering, A., de la Torre Juarez, M., Jiang, J., and Dang, V.: Comparison of upper tropospheric water vapor observations from the Microwave Limb Sounder and Atmospheric Infrared Sounder, J. Geophys. Res.-Atmos., 113, D22110, https://doi.org/10.1029/2008jd010000, 2008. a
Gelaro, R., McCarty, W., Suárez, M. J., Todling, R., Molod, A., Takacs, L., Randles, C. A., Darmenov, A., Bosilovich, M. G., Reichle, R., Wargan, K., Coy, L., Cullather, R., Draper, C., Akella, S., Buchard, V., Conaty, A., da Silva, A. M., Gu, W., Kim, G.-K., Koster, R., Lucchesi, R., Merkova, D., Nielsen, J. E., Partyka, G., Pawson, S., Putman, W., Rienecker, M., Schubert, S. D., Sienkiewicz, M., and Zhao, B.: The Modern-Era Retrospective Analysis for Research and Applications, Version 2 (MERRA-2), J. Climate, 30, 5419–5454, https://doi.org/10.1175/jcli-d-16-0758.1, 2017. a
Global Modeling and Assimilation Office (GMAO): MERRA-2 inst3_3d_asm_Np: 3d,3-Hourly,Instantaneous,Pressure-Level,Assimilation,Assimilated Meteorological Fields V5.12.4, Greenbelt, MD, USA, Goddard Earth Sciences Data and Information Services Center (GES DISC) [data set], https://doi.org/10.5067/QBZ6MG944HW0, 2015a. a, b
Global Modeling and Assimilation Office (GMAO): MERRA-2 inst1_2d_asm_Nx: 2d,1-Hourly,Instantaneous,Single-Level,Assimilation,Single-Level Diagnostics V5.12.4, Greenbelt, MD, USA, Goddard Earth Sciences Data and Information Services Center (GES DISC) [data set], https://doi.org/10.5067/3Z173KIE2TPD, 2015b. a, b
Haiden, T., Janousek, M., Bidlot, J., Buizza, R., Ferranti, L., Prates, F., and Vitart, F.: Evaluation of ECMWF forecasts, including the 2018 upgrade, Technical memorandum, European Centre for Medium Range Weather Forecasts Reading, UK, https://doi.org/10.21957/ldw15ckqi, 2018. a, b
Hale, G. M. and Querry, M. R.: Optical Constants of Water in the 200-nm to 200-µm Wavelength Region, Appl. Optics, 12, 555–563, https://doi.org/10.1364/ao.12.000555, 1973. a
Harries, J., Carli, B., Rizzi, R., Serio, C., Mlynczak, M., Palchetti, L., Maestri, T., Brindley, H., and Masiello, G.: The far-infrared Earth, Rev. Geophys., 46, RG4004, https://doi.org/10.1029/2007RG000233, 2008. a
Harries, J. E.: The greenhouse Earth: A view from space, Q. J. Roy. Meteor. Soc., 122, 799–818, https://doi.org/10.1002/qj.49712253202, 1996. a
Hersbach, H., Bell, B., Berrisford, P., Biavati, G., Horányi, A., Muñoz Sabater, J., Nicolas, J., Peubey, C., Radu, R., Rozum, I., Schepers, D., Simmons, A., Soci, C., Dee, D., and Thépaut, J.-N.: ERA5 hourly data on pressure levels from 1940 to present, Copernicus Climate Change Service (C3S) Climate Data Store (CDS) [data set], https://doi.org/10.24381/cds.bd0915c6, 2023. a
Hilton, F., Armante, R., August, T., Barnet, C., Bouchard, A., Camy-Peyret, C., Capelle, V., Clarisse, L., Clerbaux, C., Coheur, P.-F., Collard, A., Crevoisier, C., Dufour, G., Edwards, D., Faijan, F., Fourrié, N., Gambacorta, A., Goldberg, M., Guidard, V., Hurtmans, D., Illingworth, S., Jacquinet-Husson, N., Kerzenmacher, T., Klaes, D., Lavanant, L., Masiello, G., Matricardi, M., McNally, A., Newman, S., Pavelin, E., Payan, S., Péquignot, E., Peyridieu, S., Phulpin, T., Remedios, J., Schlüssel, P., Serio, C., Strow, L., Stubenrauch, C., Taylor, J., Tobin, D., Wolf, W., and Zhou, D.: Hyperspectral Earth Observation from IASI: Five Years of Accomplishments, B. Am. Meteorol. Soc., 93, 347–370, https://doi.org/10.1175/bams-d-11-00027.1, 2012. a
Huang, L., Mo, Z., Liu, L., Zeng, Z., Chen, J., Xiong, S., and He, H.: Evaluation of Hourly PWV Products Derived From ERA5 and MERRA-2 Over the Tibetan Plateau Using Ground-Based GNSS Observations by Two Enhanced Models, Earth and Space Science, 8, e2020EA001516, https://doi.org/10.1029/2020EA001516, 2021. a
Huang, X., Chen, X., Zhou, D. K., and Liu, X.: An observationally based global band-by-band surface emissivity dataset for climate and weather simulations, J. Atmos. Sci., 73, 3541–3555, https://doi.org/10.1175/JAS-D-15-0355.1, 2016. a, b, c
Intergovernmental Panel on Climate Change (IPCC): The Earth's Energy Budget, Climate Feedbacks and Climate Sensitivity, in: Climate Change 2021 – The Physical Science Basis: Working Group I Contribution to the Sixth Assessment Report of the Intergovernmental Panel on Climate Change, edited by: Forster, P., Storelvmo, T., Armour, K., Collins, W., Dufresne, J.-L., Frame, D., Lunt, D. J., Mauritsen, T., Palmer, M. D., Watanabe, M., Wild, M., and Zhang, H., Cambridge University Press, Cambridge, 923–1054, https://doi.org/10.1017/9781009157896.009, 2023. a
Jiang, J. H., Su, H., Zhai, C., Wu, L., Minschwaner, K., Molod, A. M., and Tompkins, A. M.: An assessment of upper troposphere and lower stratosphere water vapor in MERRA, MERRA2, and ECMWF reanalyses using Aura MLS observations, J. Geophys. Res., 120, 11468–11485, https://doi.org/10.1002/2015JD023752, 2015. a
Johnston, B. R., Randel, W. J., and Sjoberg, J. P.: Evaluation of tropospheric moisture characteristics among COSMIC-2, ERA5, and MERRA-2 in the tropics and subtropics, Remote Sens., 13, 1–20, https://doi.org/10.3390/rs13050880, 2021. a, b
Kursinski, E. R. and Gebhardt, T.: A Method to Deconvolve Errors in GPS RO-Derived Water Vapor Histograms, J. Atmos. Ocean. Tech., 31, 2606–2628, https://doi.org/10.1175/jtech-d-13-00233.1, 2014. a
L'Ecuyer, T. S., Drouin, B. J., Anheuser, J., Grames, M., Henderson, D. S., Huang, X., Kahn, B. H., Kay, J. E., Lim, B. H., Mateling, M., Merrelli, A., Miller, N. B., Padmanabhan, S., Peterson, C., Schlegel, N.-J., White, M. L., and Xie, Y.: The Polar Radiant Energy in the Far Infrared Experiment: A New Perspective on Polar Longwave Energy Exchanges, B. Am. Meteorol. Soc., 102, E1431–E1449, https://doi.org/10.1175/BAMS-D-20-0155.1, 2021. a
Marquardt, D. W.: An Algorithm for Least-Squares Estimation of Nonlinear Parameters, J. Soc. Ind. Appl. Math., 11, 431–441, https://doi.org/10.1137/0111030, 1963. a
Masuda, K.: Infrared sea surface emissivity including multiple reflection effect for isotropic Gaussian slope distribution model, Remote Sens. Environ., 103, 488–496, https://doi.org/10.1016/j.rse.2006.04.011, 2006. a
Merrelli, A. and Turner, D. D.: Comparing information content of upwelling far-infrared and midinfrared radiance spectra for clear atmosphere profiling, J. Atmos. Ocean. Tech., 29, 510–526, https://doi.org/10.1175/JTECH-D-11-00113.1, 2012. a, b
Miloshevich, L. M., Vömel, H., Whiteman, D. N., and Leblanc, T.: Accuracy assessment and correction of Vaisala RS92 radiosonde water vapor measurements, J. Geophys. Res., 114, D11305, https://doi.org/10.1029/2008jd011565, 2009. a
Mlawer, E., Cady-Pereira, K., Mascio, J., and Gordon, I.: The inclusion of the MT_CKD water vapor continuum model in the HITRAN molecular spectroscopic database, J. Quant. Spectrosc. Ra., 306, 108645, https://doi.org/10.1016/j.jqsrt.2023.108645, 2023. a
Mlawer, E. J., Turner, D. D., Paine, S. N., Palchetti, L., Bianchini, G., Payne, V. H., Cady-Pereira, K. E., Pernak, R. L., Alvarado, M. J., Gombos, D., Delamere, J. S., Mlynczak, M. G., and Mast, J. C.: Analysis of Water Vapor Absorption in the Far-Infrared and Submillimeter Regions Using Surface Radiometric Measurements From Extremely Dry Locations, J. Geophys. Res.-Atmos., 124, 8134–8160, https://doi.org/10.1029/2018JD029508, 2019. a, b
Palchetti, L., Brindley, H., Bantges, R., Buehler, S. A., Camy-Peyret, C., Carli, B., Cortesi, U., Bianco, S. D., Natale, G. D., Dinelli, B. M., Feldman, D., Huang, X. L., C.-Labonnote, L., Libois, Q., Maestri, T., Mlynczak, M. G., Murray, J. E., Oetjen, H., Ridolfi, M., Riese, M., Russell, J., Saunders, R., and Serio, C.: FORUM: unique far-infrared satellite observations to better understand how Earth radiates energy to space, B. Am. Meteorol. Soc., 101, 2030–2046, https://doi.org/10.1175/BAMS-D-19-0322.1, 2020. a, b
Platnick, S., King, M. D., Ackerman, S. A., Menzel, W. P., Baum, B. A., Riédi, J. C., and Frey, R. A.: The MODIS cloud products: Algorithms and examples from Terra, IEEE T. Geosci. Remote, 41, 459–473, https://doi.org/10.1109/TGRS.2002.808301, 2003. a
Ridolfi, M., Bianco, S. D., Roma, A. D., Castelli, E., Belotti, C., Dandini, P., Di Natale, G., Dinelli, B. M., Labonnote, L. C., and Palchetti, L.: FORUM Earth Explorer 9: Characteristics of Level 2 Products and Synergies with IASI-NG, Remote Sens., 12, 1496, https://doi.org/10.3390/rs12091496, 2020. a, b
Rodgers, C. D.: Inverse Methods for Atmospheric Sounding, vol. 2, World Scientific Publishing, https://doi.org/10.1142/3171, 2000. a, b, c
Santer, B. D., Po-Chedley, S., Mears, C., Fyfe, J. C., Gillett, N., Fu, Q., Painter, J. F., Solomon, S., Steiner, A. K., Wentz, F. J., Zelinka, M. D., and Zou, C.-Z.: Using Climate Model Simulations to Constrain Observations, J. Climate, 34, 6281–6301, https://doi.org/10.1175/jcli-d-20-0768.1, 2021. a, b
Saunders, R., Hocking, J., Rundle, D., Rayer, P., Havemann, S., Matricardi, M., Geer, A., Lupu, C., Brunel, P., and Vidot, J.: RTTOV-12 Science and Validation Report, Tech. rep., EUMETSAT, https://nwp-saf.eumetsat.int/site/download/documentation/rtm/docs_rttov12/rttov12_svr.pdf (last access: 9 July 2024), 2017. a, b, c, d
Schröder, M., Lockhoff, M., Shi, L., August, T., Bennartz, R., Brogniez, H., Calbet, X., Fell, F., Forsythe, J., Gambacorta, A., Ho, S.-p., Kursinski, E. R., Reale, A., Trent, T., and Yang, Q.: The GEWEX Water Vapor Assessment: Overview and Introduction to Results and Recommendations, Remote Sens., 11, 251, https://doi.org/10.3390/rs11030251, 2019. a
Seeman, S., Borbas, E. E., Knuteson, R., Stephenson, G. R., and Huang, H.: Development of a Global Infrared Land Surface Emissivity Database for Application to Clear Sky Sounding Retrievals from Multispectral Satellite Radiance Measurements, J. Appl. Meteorol. Clim., 47, 108–123, https://doi.org/10.1175/2007jamc1590.1, 2008. a, b
Shi, L., Schreck III, C. J., John, V. O., Chung, E.-S., Lang, T., Buehler, S. A., and Soden, B. J.: Assessing the consistency of satellite-derived upper tropospheric humidity measurements, Atmos. Meas. Tech., 15, 6949–6963, https://doi.org/10.5194/amt-15-6949-2022, 2022. a
Siddans, R.: Water Vapour Climate Change Initiative (WV_cci) – Phase One, Deliverable 2.2; Version 1.0, RAL Space Remote Sensing Group-Technical Report, Tech. rep., RAL Space, https://climate.esa.int/documents/2497/Water_Vapour_CCI_D2.2_ATBD_Part2-IMS_L2_product_v2.0.pdf (last access: 1 July 2024), 2019. a, b, c, d
Siddans, R., Knappett, D., Kerridge, B., Waterfall, A., Hurley, J., Latter, B., Boesch, H., and Parker, R.: Global height-resolved methane retrievals from the Infrared Atmospheric Sounding Interferometer (IASI) on MetOp, Atmos. Meas. Tech., 10, 4135–4164, https://doi.org/10.5194/amt-10-4135-2017, 2017. a
Sinha, A. and Harries, J. E.: Water vapour and greenhouse trapping: The role of far infrared absorption, Geophys. Res. Lett., 22, 2147–2150, https://doi.org/10.1029/95GL01891, 1995. a
Sun, B., Calbet, X., Reale, A., Schroeder, S., Bali, M., Smith, R., and Pettey, M.: Accuracy of Vaisala RS41 and RS92 upper tropospheric humidity compared to satellite hyperspectral infrared measurements, Remote Sens., 13, 173, https://doi.org/10.3390/rs13020173, 2021. a
Trent, T., Schröder, M., and Remedios, J.: GEWEX Water Vapor Assessment: Validation of AIRS Tropospheric Humidity Profiles With Characterized Radiosonde Soundings, J. Geophys. Res.-Atmos., 124, 886–906, https://doi.org/10.1029/2018jd028930, 2019. a
Trent, T., Siddans, R., Kerridge, B., Schröder, M., Scott, N. A., and Remedios, J.: Evaluation of tropospheric water vapour and temperature profiles retrieved from MetOp-A by the Infrared and Microwave Sounding scheme, Atmos. Meas. Tech., 16, 1503–1526, https://doi.org/10.5194/amt-16-1503-2023, 2023. a, b, c, d, e, f, g, h, i, j
Warwick, L., Brindley, H., Roma, A. D., Fox, S., Havemann, S., Murray, J., Oetjen, H., Price, H. C., Schüttemeyer, D., Sgheri, L., and Tiddeman, D. A.: Retrieval of Tropospheric Water Vapor From Airborne Far-Infrared Measurements: A Case Study, J. Geophys. Res.-Atmos., 127, e2020JD034229, https://doi.org/10.1029/2020jd034229, 2022. a, b, c, d, e, f, g
Weston, P.: Progress towards the implementation of correlated observation errors in 4D-Var, UK Met Office, Crown Publishing, Forecasting Research Technical Report No. 560, http://www.metoffice.gov.uk/learning/library/publications/science/weather-science/forecasting-research-technical-report (last access: 5 May 2023), 2011. a
Wilson, S. H. S., Atkinson, N. C., and Smith, J. A.: The Development of an Airborne Infrared Interferometer for Meteorological Sounding Studies, J. Atmos. Ocean. Tech., 16, 1912–1927, https://doi.org/10.1175/1520-0426(1999)016<1912:tdoaai>2.0.co;2, 1999. a, b
- Abstract
- Introduction
- Retrieval framework
- Extension of IMS for FORUM
- Simulated test cases
- Observations for testing
- Development of aircraft-level retrievals
- Retrievals from aircraft observations
- Conclusions
- Data availability
- Author contributions
- Competing interests
- Disclaimer
- Acknowledgements
- Financial support
- Review statement
- References
- Supplement