the Creative Commons Attribution 4.0 License.
the Creative Commons Attribution 4.0 License.
 | 25 Feb 2025
Simultaneous measurement of greenhouse gases (CH4, CO2 and N2O) using a simplified gas chromatography system
Dominika Lewicka-Szczebak
Piotr Wójtowicz
This article presents a simple method for determining greenhouse gases (CH4, CO2 and N2O) using an alternative new set-up of the chromatographic system. The novelty of the presented method is the application of a Carboxen 1010 PLOT capillary column for separation of trace gases – CH4, CO2 and N2O – from air samples and their detection using a barrier discharge ionisation detector (BID). Simultaneously, a parallel molecular sieve column RT-Msieve 5A connected to a thermal conductivity detector (TCD) allowed the determination of CH4, N2 and O2 concentrations from 0.2 % to 100 %. The system was equipped with an autosampler transferring the samples without air contamination thanks to a vacuum pump and inert gas flushing. Method validation was performed using commercial gas standards and comparative measurement of CO2, CH4 and N2O concentrations applying cavity ring-down spectroscopy (CRDS). A 3 d continuous measurement series of greenhouse gas (GHG) concentrations in ambient air and tests of typical vial sample measurements with increased GHG concentrations were performed.
The advantage of this method is that the system is easy to set up and allows for simultaneous detection and analysis of the main GHGs using one gas chromatography (GC) column and one detector, thereby omitting the need for an electron capture detector (ECD) containing radiogenic components for N2O analysis and a flame ionisation detector (FID) with a methaniser for low-concentration CO2 samples. The simplification of the system reduces analytical costs, facilitates instrument maintenance and improves measurement robustness.
- Article
(2601 KB) - Full-text XML
- BibTeX
- EndNote


The reduction of greenhouse gas (GHG) emissions caused by human activity presents a major challenge that needs to be addressed in order to limit the effects of global warming. The main GHGs responsible for global warming are CO2, CH4 and N2O (Lamb et al., 2021). Besides natural sources (e.g. volcanic activity, peat bogs, paddy soils, and freshwater and saltwater sediments), human activity also contributes to increasing GHG emissions by having an impact on global carbon and nitrogen cycling. Therefore, precise measurement of GHG concentrations from natural sources and the environment is crucial in order to quantify and estimate the contribution of different anthropogenic sources to worldwide emissions. The development of analytical equipment in recent years has allowed the application of user-friendly methods to determine trace gases and monitor slight changes in their concentrations precisely, even at the lowest levels expressed in units of parts per million (ppm) and/or parts per billion (ppb) (Zaman et al., 2021). In the very near future, it can be expected that analytical devices and their measurement precision will be enhanced further. Therefore, in order to maintain reliable continuity of measurement data on GHG concentrations in the atmosphere and in other elements of the Earth's ecosystem, measurements should be performed with the utmost care using the most modern techniques and devices available. It is also important to maintain easy access to simple and relatively cheap analytical devices and their ease of use in order to obtain more statistical data. Often the analytical devices providing very precise measurements have limitations in the analytical range and do not allow for observations of GHGs in a wide range of concentrations observed in nature. Therefore, the development of a new analytical method that is characterised by relatively high sensitivity in the range from the lowest to the highest concentrations is a desirable feature but quite difficult to achieve in a single device.
Several methods are available for monitoring GHG based on optical techniques such as non-dispersive infrared spectroscopy (NDIR), Fourier-transform infrared spectroscopy (FTIR), photoacoustic spectroscopy (PAS), tunable laser absorption spectroscopy (TLAS), cavity ring-down spectroscopy (CRDS) and off-axis integrated cavity output spectroscopy (OA-ICOS) (Zaman et al., 2021). Some of these laser instruments allow for simultaneous analyses of CH4, CO2, N2O and NH3 using the laser absorption spectroscopy method (e.g. Picarro G2509 gas concentration analyser). Although these devices guarantee the stability of continuous measurements, their measurement range is much lower than chromatographic systems equipped with typical detectors. For example, the Picarro G2509 operation range for CO2 is 380–6000 ppm, for CH4 it is 1–800 ppm and for N2O it is 0.3–200 ppm. Other versions of Picarro analysers have been developed to measure single-GHG concentrations, e.g. of CH4, CO2 or N2O, in combination with analyses of stable isotope composition of carbon or nitrogen from atmospheric air or headspace samples (SSIM module). These methods are recommended only for the measurement of a single gas compound at very specific concentrations. Thus, the most reliable methods for GHGs measurements in a very wide range of concentrations are chromatographic methods (Ekeberg et al., 2004). Another important limitation of the laser-based system is the sample matrix, which should be stable and most similar to standard ambient air composition. Hence, these methods are not well suited for untypical gas samples, like mine gases, or samples originating from laboratory experiments, e.g. with a He atmosphere.
Gas chromatography with automated sampling injections is a very common, flexible and user-friendly technique. The most common GHG measurement systems have been developed with a thermal conductivity detector (TCD; measurement of CH4 and CO2), flame ionisation detector (FID; measurement of CH4 and CO2 using a methaniser) and electron capture detector (ECD; measurement of N2O) (Hedley et al., 2006; Loftfield et al., 1997; Wang and Wang, 2003). The gas chromatography (GC) systems can be dedicated for specific gases at ambient concentrations with precision similar to or even better than that achieved by optical techniques. Van der Laan et al. (2009) developed the GC system which allows for simultaneous measurement of CH4, CO2, N2O, CO and SF6 using one gas chromatograph and single injection that allows the measurement of GHGs from ambient air at remote stations. However, the system is characterised by a quite complex set-up with multiple gas valves, columns, a methaniser, a ECD and a FID.
The most popular analytical technique for determining N2O concentration is gas chromatography equipped with ECD using Porapak Q or HayeSep Q columns (Rapson and Dacres, 2014). However, the use of an ECD is associated with additional difficulties. The main disadvantage of the ECD is its poor stability over a long period of time. During ongoing analyses, the cell interior may become contaminated and natural wear may occur. This can result in an increasing response to the tested concentrations. Consequently, within a week a significant increase in the measured area may be observed for the same analysed concentrations. This drift can be compensated for by the addition of an internal standard. Moreover, due to the presence of radioactive material in the ECD, special safety requirements have to been taken into account. According to current regulations, the purchase of a new unit, its possession and the disposal of a used detector cell involve a number of formal requirements.
In the case of the dielectric barrier discharge ionisation detector (BID), there are no such limitations and restrictions. The only requirement is to ensure a supply of helium of appropriate purity (99.9999 %). The detector is incredibly stable and maintenance-free for a very long period of time. Application of the BID for N2O measurements has the advantages of avoiding radiogenic compounds present in the ECD and reducing the number of gases required. Combination of ECD+FID requires installation of a minimum of three gas tanks (carrier gas He, Ar, or N2; synthetic air; H2 or H2 generator; make-up gas for ECD N2 of 6.0 purity, min. 99.9999 %), whereas for BID only a He tank is required.
Separation of CH4, CO2 and N2O from one sample can be done using, for example, a system of two columns with 10-port valves (Scion Instruments, 2023) or a single column, e.g. a micropacked ShinCarbon ST or RT-Q-Bond column (Shimbo and Uchiyama, 2022). Methods using a single-column micropacked ShinCarbon ST or RT-Q-Bond are typically applied by Shimadzu using a Nexis GC-2030 gas chromatograph equipped with a dielectric barrier discharge ionisation detector (BID) dedicated to trace compounds (Shimbo and Uchiyama, 2022). This set-up using a single column and single BID detector is commonly used for determination of CH4 and CO2 at very low atmospheric concentrations (Gruca-Rokosz et al., 2020). Unfortunately, the retention times for CO2 and N2O are often insufficient for correct measurement, especially by high CO2 concentrations, when CO2 tailing can even cover the N2O peak. This separation can be enhanced by application of cryogenic methods for decreasing oven temperature. However, these methods are time-consuming and expensive. The present study tested an alternative solution that involved the application of a Carboxen 1010 PLOT column for CH4, CO2 and N2O separation.
A simple chromatographic system is presented here for a quick and accurate analysis of GHG using the TCD and BID of the Nexis GC-2030 gas chromatograph combined with an AS-210 greenhouse gas autosampler (SRI Instruments Europe GmbH, Bad Honnef, Germany) at a wide range of concentrations from ambient to higher fluxes observed for different emission sources.
The GC separation columns used in this study were performed with a porous layer open tubular column (Carboxen 1010 PLOT) and a molecular sieve column (RT-Msieve 5A), which assured the full separation of the analysed gases. The results of the experimental data were compared with the concentrations obtained for CH4, CO2 and N2O using the CRDS technique by Picarro analysers (G2201-i for CO2 and CH4; G5131-i for N2O).
2.1 Gas chromatography system
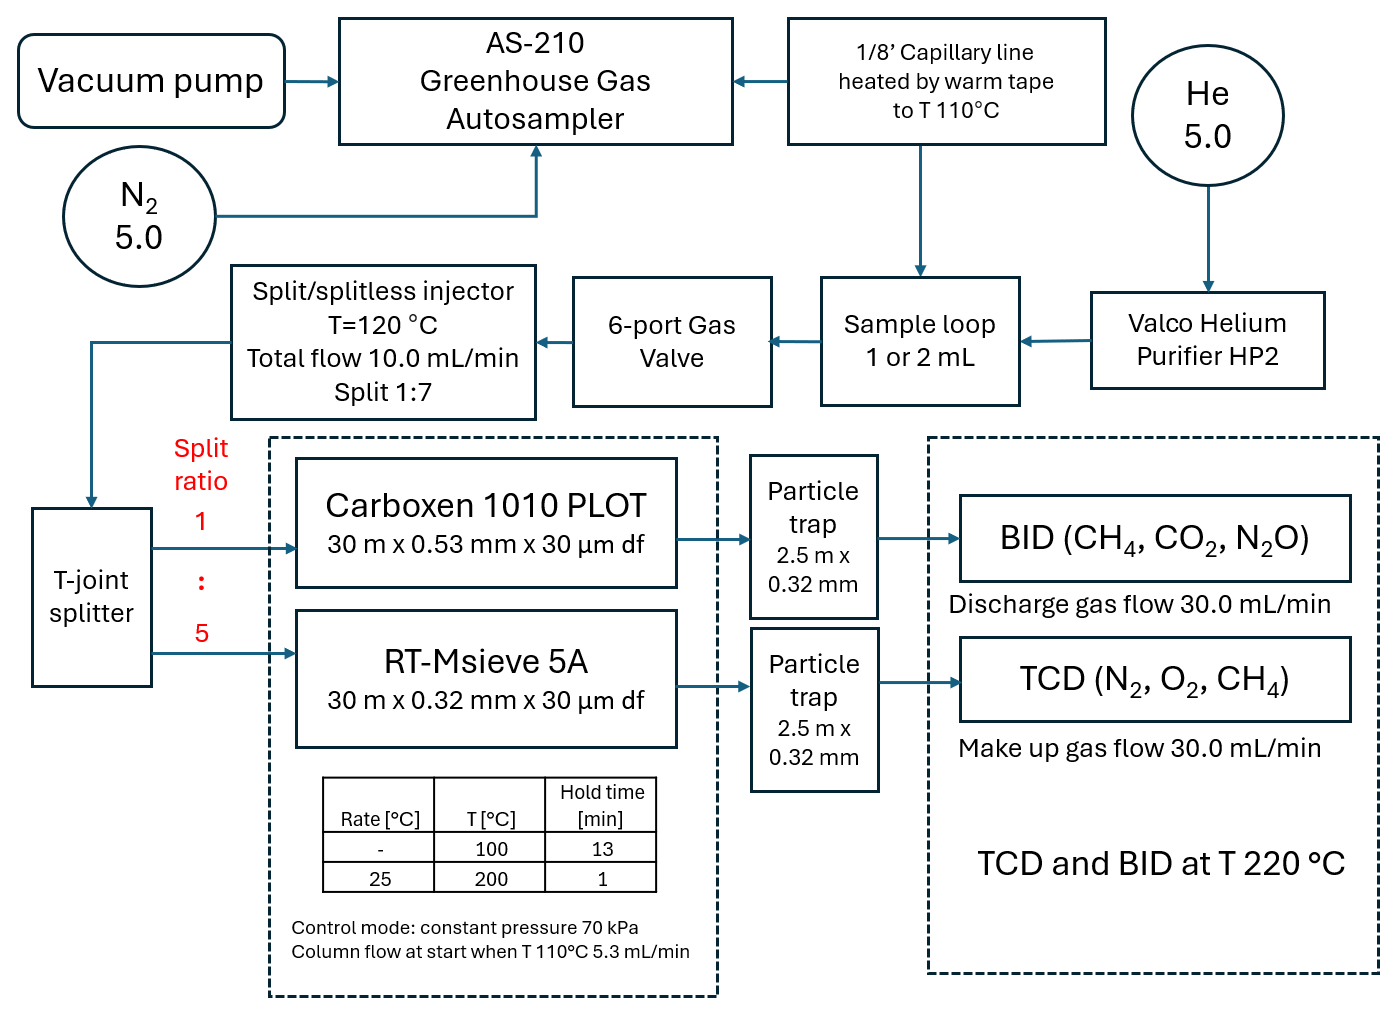
This chromatographic system was built based on the Shimadzu Nexis GC-2030 equipped with two parallel detectors: BID and TCD (Fig. 1). The carrier gas was controlled by an advanced flow controller (AFC) connected to a split/splitless injector. Between the AFC and the injector, a two-position six-port valve with a 1 mL (or 2 mL) sample loop was placed on the carrier line.
The gas chromatograph oven was equipped with an additional cryogenic option (CRG) where liquid nitrogen (LN2) was used as a cooling agent, which allowed for separation at below-ambient temperatures. The samples from the AS-210 greenhouse gas autosampler (SRI Instruments Europe GmbH) were transferred to the sampling valve through a stainless-steel transfer line continuously warmed to 110 °C with heating tape to prevent moisture contamination. The presence of moisture in the samples results in the loss of sorption capacity of carbon molecular sieves which are used commonly for separation of gases (Fastyn et al., 2003). The injection was performed by valve rotation. The sample was transferred from the loop (1 or 2 mL) through the injector at a total flow of 10 mL min−1 and was then split 1:7 just before the column inlet. This was sufficient to achieve a good peak shape with sufficient area.
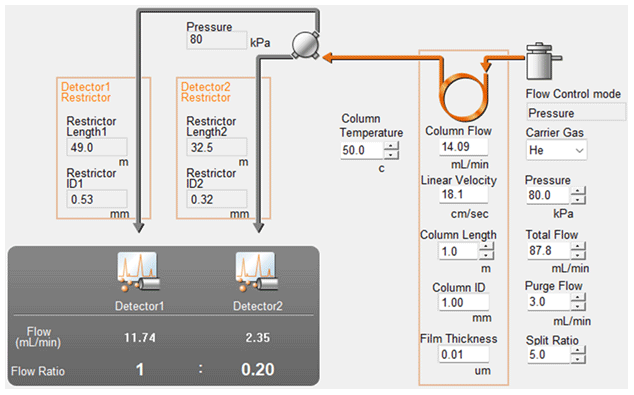
Additionally, the injection sample was then divided with using a T-joint connector between two porous layer open tubular capillary columns filled molecular sieve 5A (RT-Msieve 5A µm; Restek, USA, catalogue no. 19722) and fused silica (Carboxen 1010 PLOT µm; Supelco, USA, catalogue no. 25467). The dimensions of the columns were selected to achieve a splitting ratio of 1:5, directing most of the sample to the Carboxen 1010 PLOT and BID. Corresponding calculations were performed in Shimadzu AFT (Advanced Flow Technology) software (Fig. 2).
Extremely low baseline noise (signal-to-noise ratio (S N) always above 10) was achieved by a combination of two factors: a high-purity carrier gas helium of grade 5.0 connected to the Valco helium purifier HP2 (VICI, Valco Instruments Co. Inc.) and particle traps (2.5 m× 0.32 mm o.d.) mounted on the columns' outlets. The presence of the traps protected the detectors from particles dislodging from the porous layer open tubular (PLOT) capillary column, which can cause spikes.
Both of the detectors used are concentration dependent; therefore, to obtain the highest sensitivity on the BID channel, the discharge gas flow rate was decreased from a default of 50 to 30 mL min−1, which is the lowest possible flow. Below this value the plasma flame is not stable and tends to flicker or is extinguished. Detection levels did not need to be taken into consideration with the TCD.
The linearity of both detectors' response was controlled and maintained during all the measurements with minimal R2=0.99 applying at least two standard gases and zero point.
2.2 Parameters of the separation and detection methods
The temperature programme for gas chromatography analyses started at 100 °C for 13 min and later increased to 200 °C at a rate of 25 °C min−1 with the oven set at 200 °C for 1 min. The temperature of the split/splitless injector was 120 °C. The TCD and BID were at an equal temperature of 220 °C. The carrier gas pressure was 70 kPa and the column flow was 5.3 mL min−1. Linear velocity was 41.2 cm s−1 and purge flow was 1 mL min−1. The total flow for split ratios 1, 2, 3, 4 and 5 was 11.5, 16.8, 22.0, 27.3 and 32.5 mL min−1, respectively.
2.3 Standard gas mixtures
Standard gas mixtures used for testing and final determination of the measurements precision were atmospheric air from Wrocław (Poland) (analyses of N2, O2, CH4, CO2 and N2O at ambient atmospheric concentrations) and a special gas mixture from Messer (CH4 10 ppm, CO2 1000 ppm, N2O 50 ppm, diluted in pure N2). The in-house standard of compressed air from Wrocław (Poland), which contained natural moisture (water vapour), was stored in the 10 L gas cylinder. It was prepared using an oil-free compressor for diving cylinders. The second standard was ordered for Messer Polska Sp. z o.o. and is the commercial product prepared in Switzerland according to ISO6141:2015. This standard was prepared in pure N2, without moisture, and in a volume of 8 L, and it contains an F10 filter, which protects the outer valve from the possible water vapour or solid particles. The standards were directly connected by a in. capillary to the AS-210 greenhouse gas autosampler. The sample loops used for tests of standard gases were 1 and 2 mL. The atmospheric air was tested for splits 1, 2, 3, 4 and 5. The special gas mixture from Messer was tested for splits 3, 4 and 5.
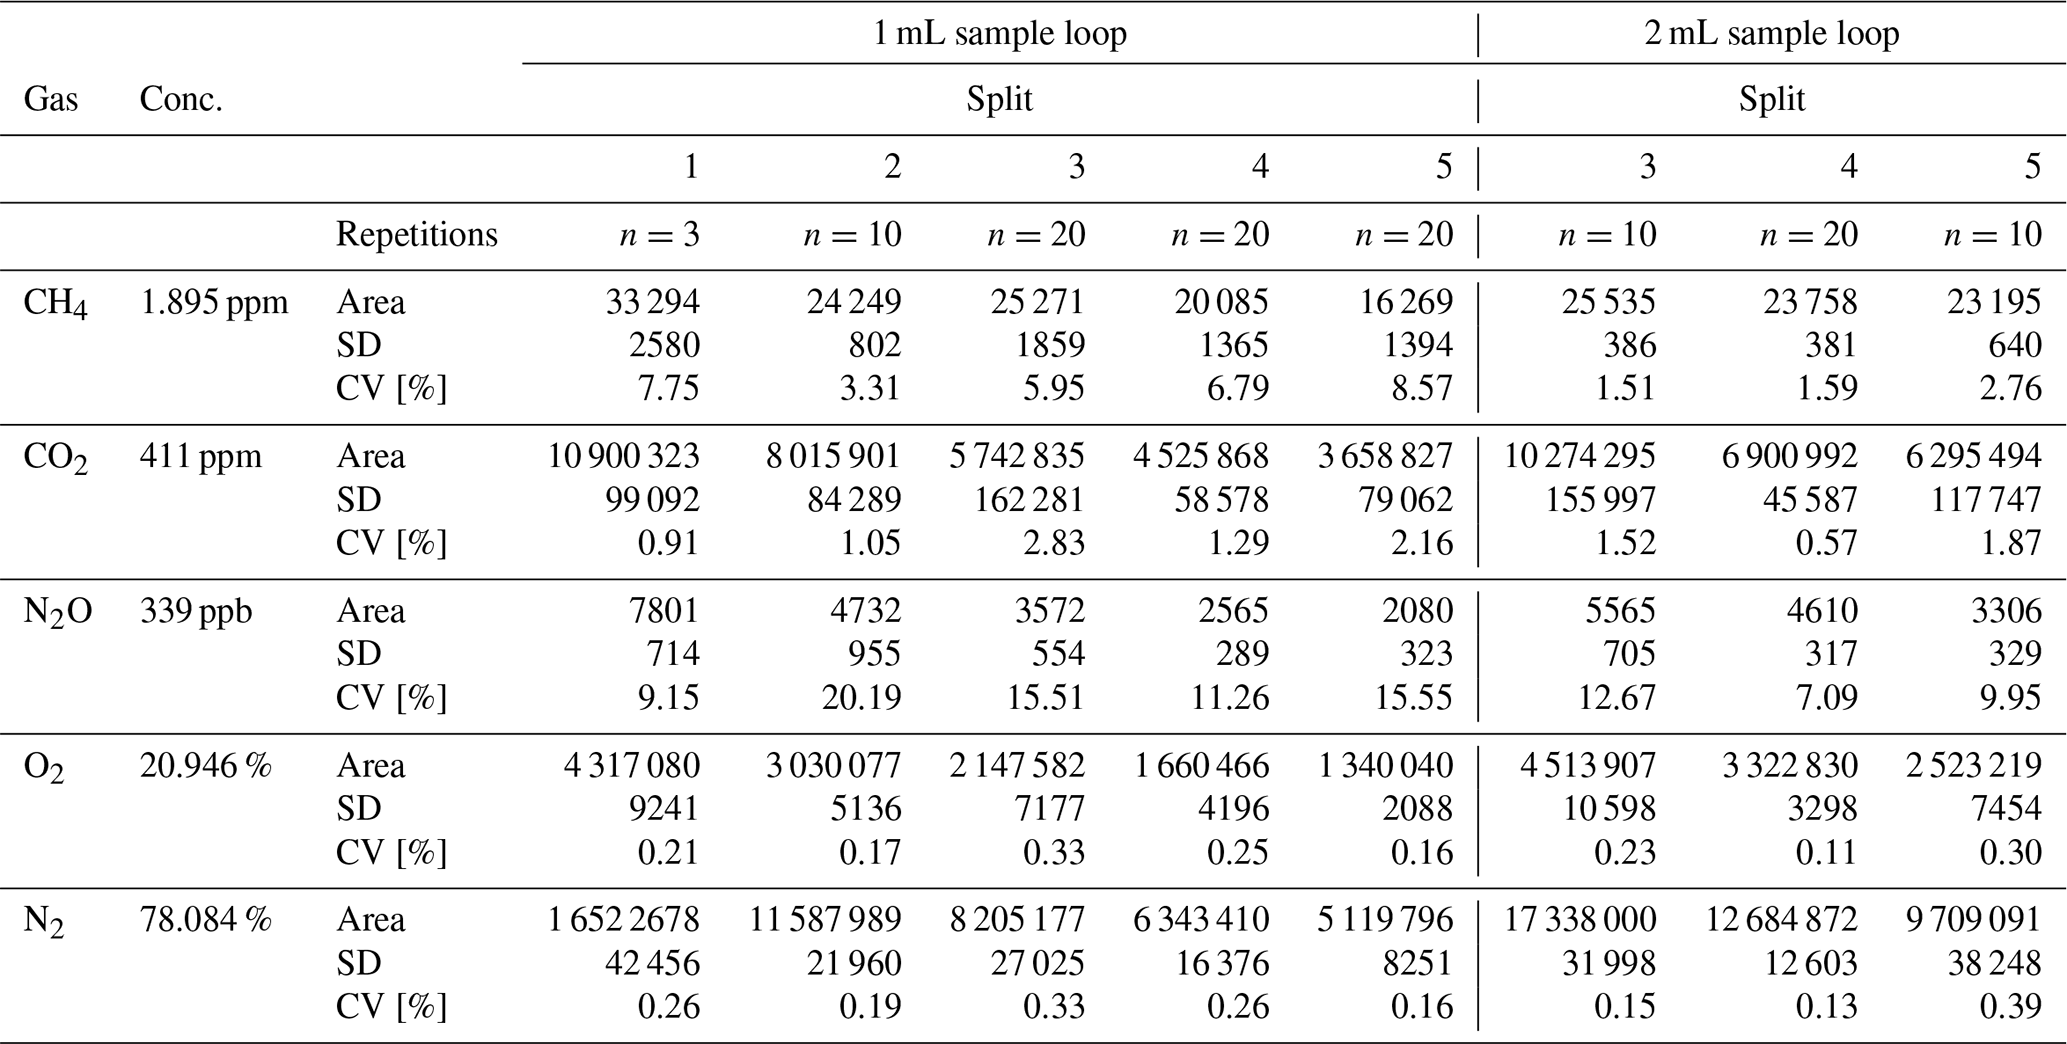
Table 1Peak area, SD (standard deviation) and CV (coefficient of variation) of standard atmospheric gas measurements at split ratios 1, 2, 3, 4 and 5 with 1 and 2 mL sample loops.
3.1 Basic testing of the SH-Q-BOND and Carboxen 1010 PLOT columns and BID detector
The chromatographic system for GHG analyses using a single BID was initially tested for application of the SH-Q-BOND column (30 m×0.53 mm i.d. ×20 µm df; catalogue no. 221-75765-30) from Shimadzu, which allows for separation of CH4, CO2 and N2O and is resistant to water vapour contamination. The scheme showing the GC configuration for testing of SH-Q-BOND and RT-Msieve 5A is presented in Appendix A (Fig. A1). In this configuration most of the parameters were exactly the same (length of the column, diameter, film thickness, flow parameters, split ratio) as in the configuration using the Carboxen 1010 PLOT column. The only differences were the usage of a SH-Q-BOND column for separation of CH4, CO2, and N2O and a different column oven temperature programme.
Separation of these gases was tested at different low temperatures of the column oven (30, 35 and 40 °C). The lowest temperature (30 °C) was difficult for the oven to achieve quickly without using a cryogenic trap. At the laboratory's normal temperature (22 °C), it was possible to decrease the oven temperature rapidly to 35 and 40 °C, but unfortunately both temperatures were insufficient to separate CO2 from N2O at a retention time interval longer than 30 s, which appeared very problematic while analysing real samples of elevated CO2 concentration. When the CO2 concentration was high (e.g. 700 ppm), the tail of the CO2 peak partially covered the N2O peak, as shown below in Fig. 3a and b, and ultimately the N2O peak area was understated. Moreover, this set-up did not allow detection of CH4 in atmospheric concentrations.
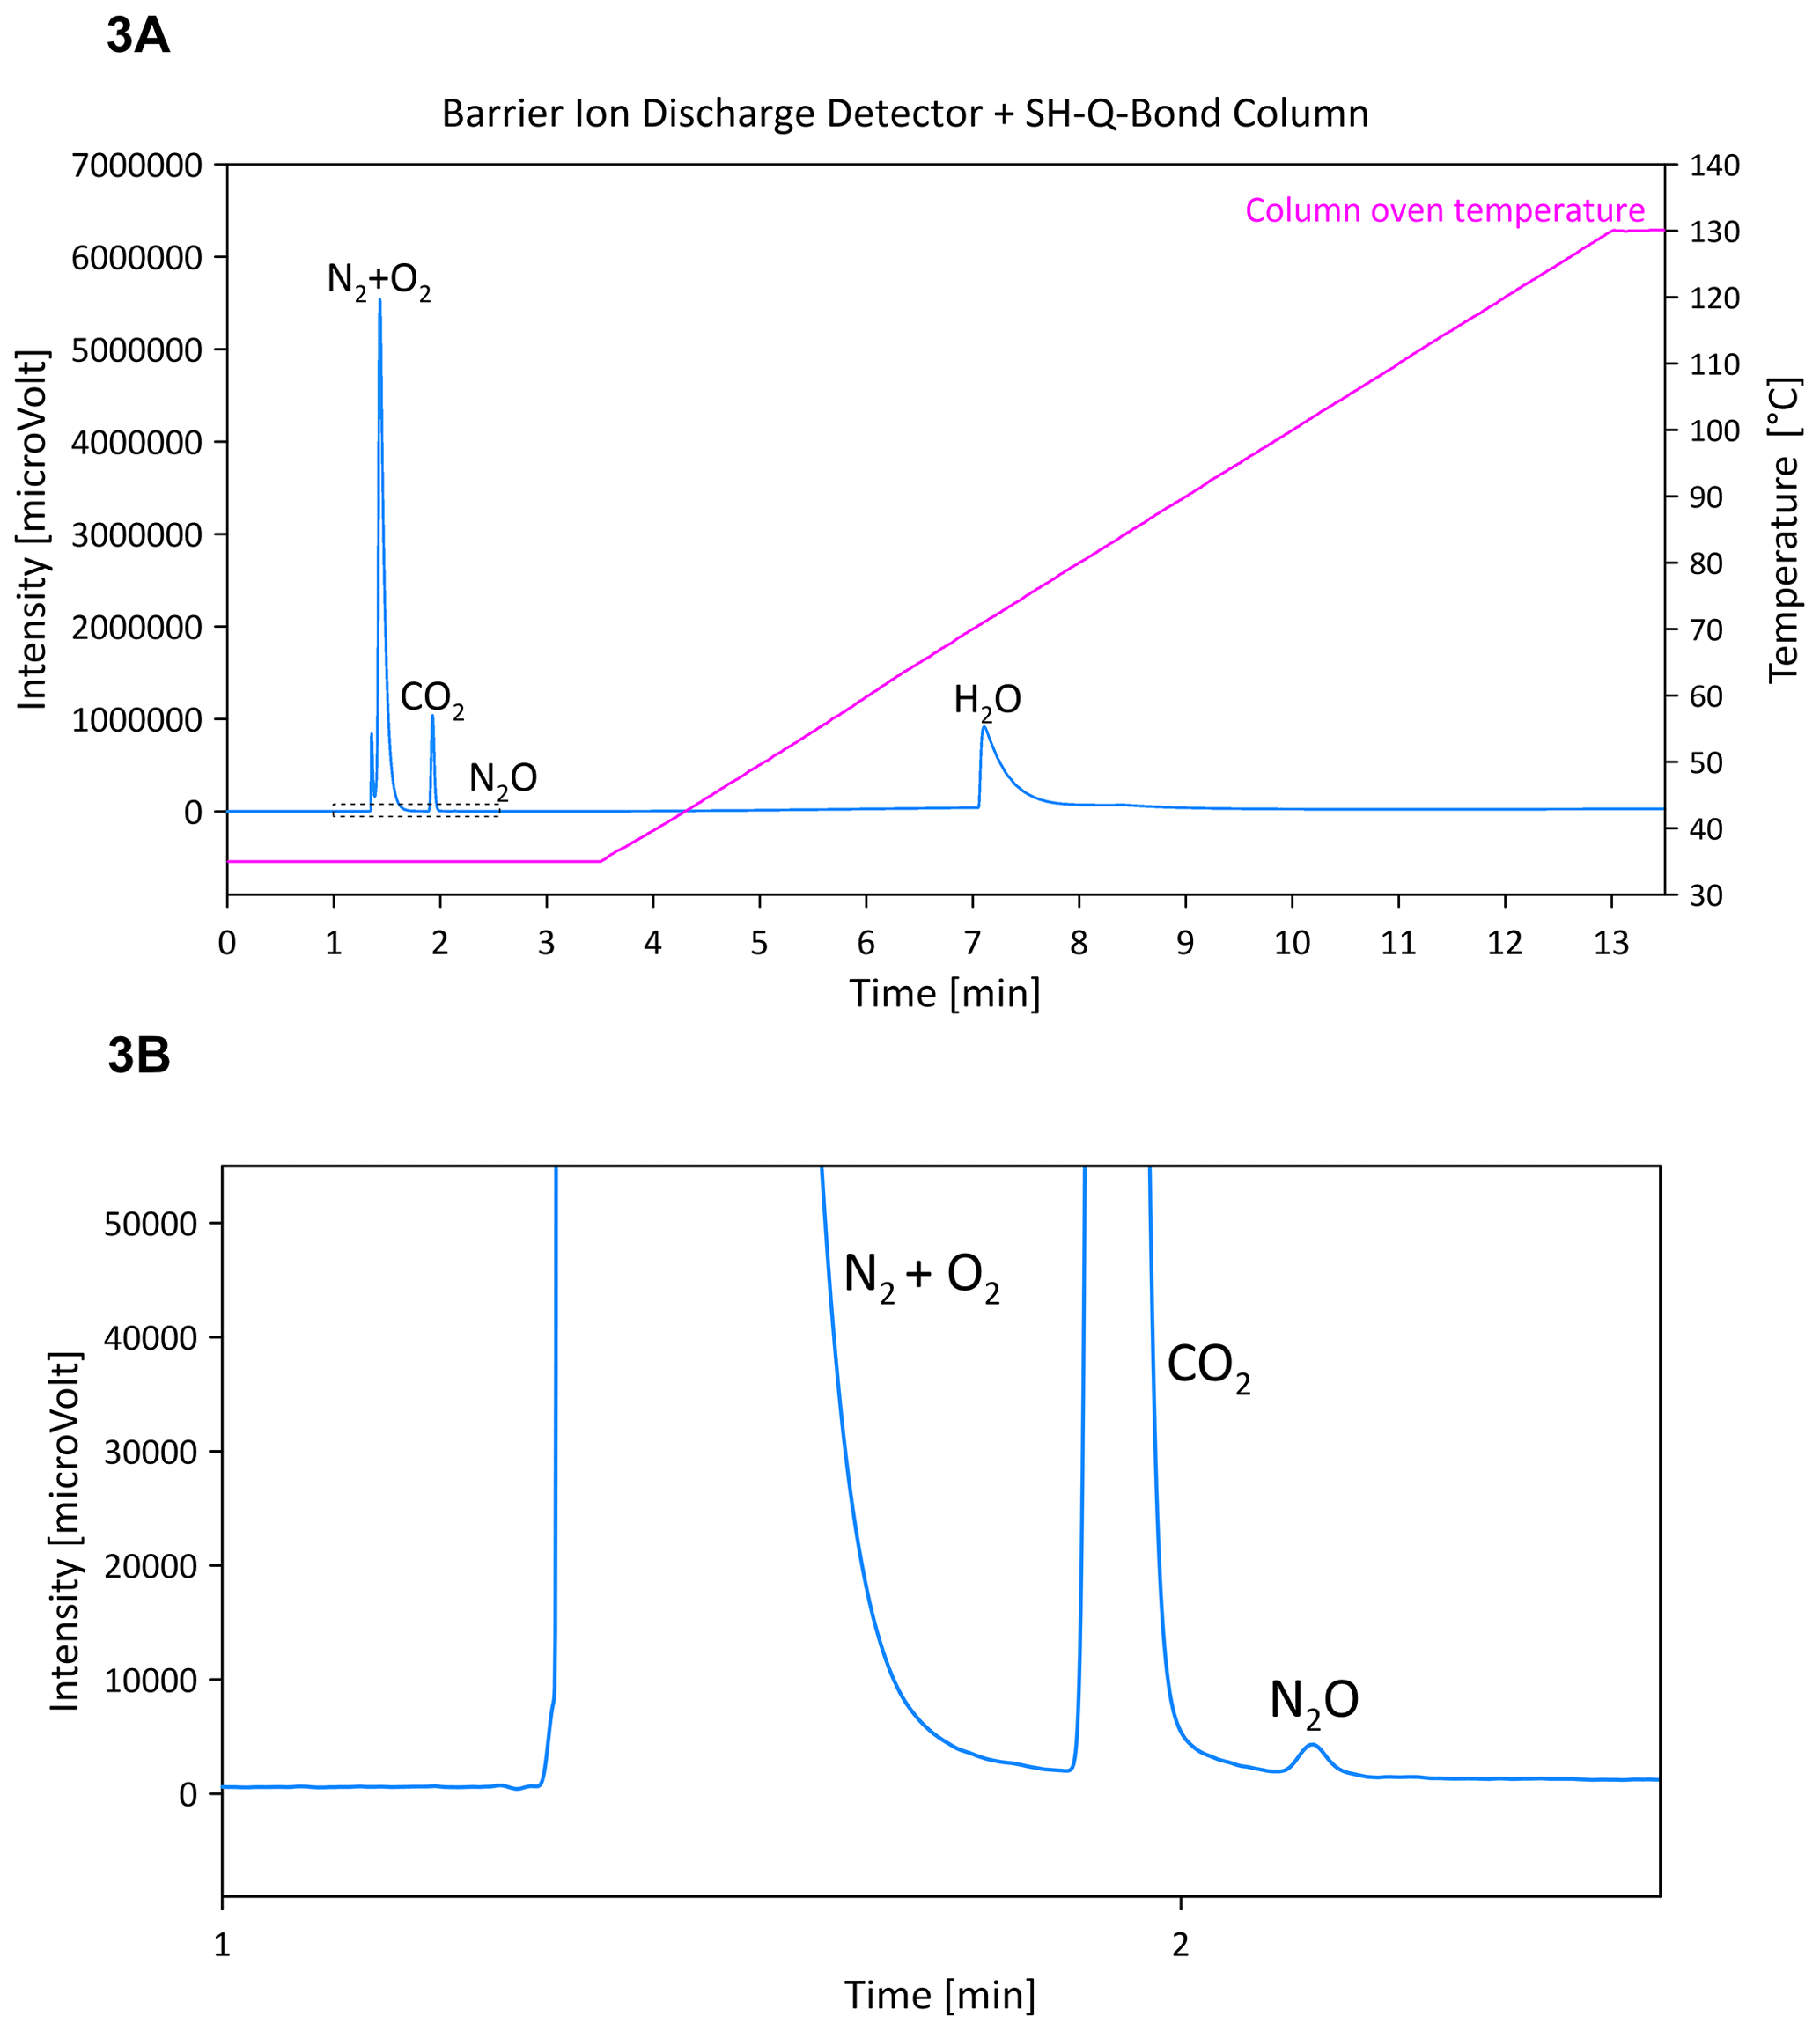
Figure 3(a) Chromatograms of ambient air gases separated using the SH-Q-BOND column and detected using BID; (b) zoomed chromatogram from panel (a).
Therefore, after basic tests of the SH-Q-BOND column at different temperatures, it was decided to check the retention times of individual CH4, CO2 and N2O gases on the Carboxen 1010 PLOT column. The Carboxen 1010 PLOT column offered very good separation of CO2 from N2O, even at a very high concentration (CO2 1000 ppm), as shown in Fig. 4 (peaks of CH4 and N2O are visible only when zoomed). Moreover, the ambient CH4 was very well separated from the N2+O2 peak (Fig. 4). The longer programme of separation guaranteed the ideal separation of CH4, CO2 and N2O (more than 2 min between each gas). The time for one single analysis is 18 min, but this is necessary because a low flow of the carrier gas is recommended for the Carboxen column by its manufacturer. A carrier gas flow that is too high (e.g. above 20 mL min−1) causes faster destruction of the column and contamination of the particle trap, and subsequently of the detector, with fragments of the column filling. However, the disadvantage of the application of the Carboxen column is also its low resistance to water vapour. Therefore, before starting the analyses, all lines of the AS-210 greenhouse gas autosampler as well as the sample loop were carefully heated using heating tape and a gun heater to remove water from the stainless-steel capillaries and metal parts of the valves. The parallelly connected column Rt-Msieve 5A and TCD allow for determination of N2 and O2 (and if necessary CH4) concentrations in the range from 0.2 % to 100 % (example shown in Fig. 5).
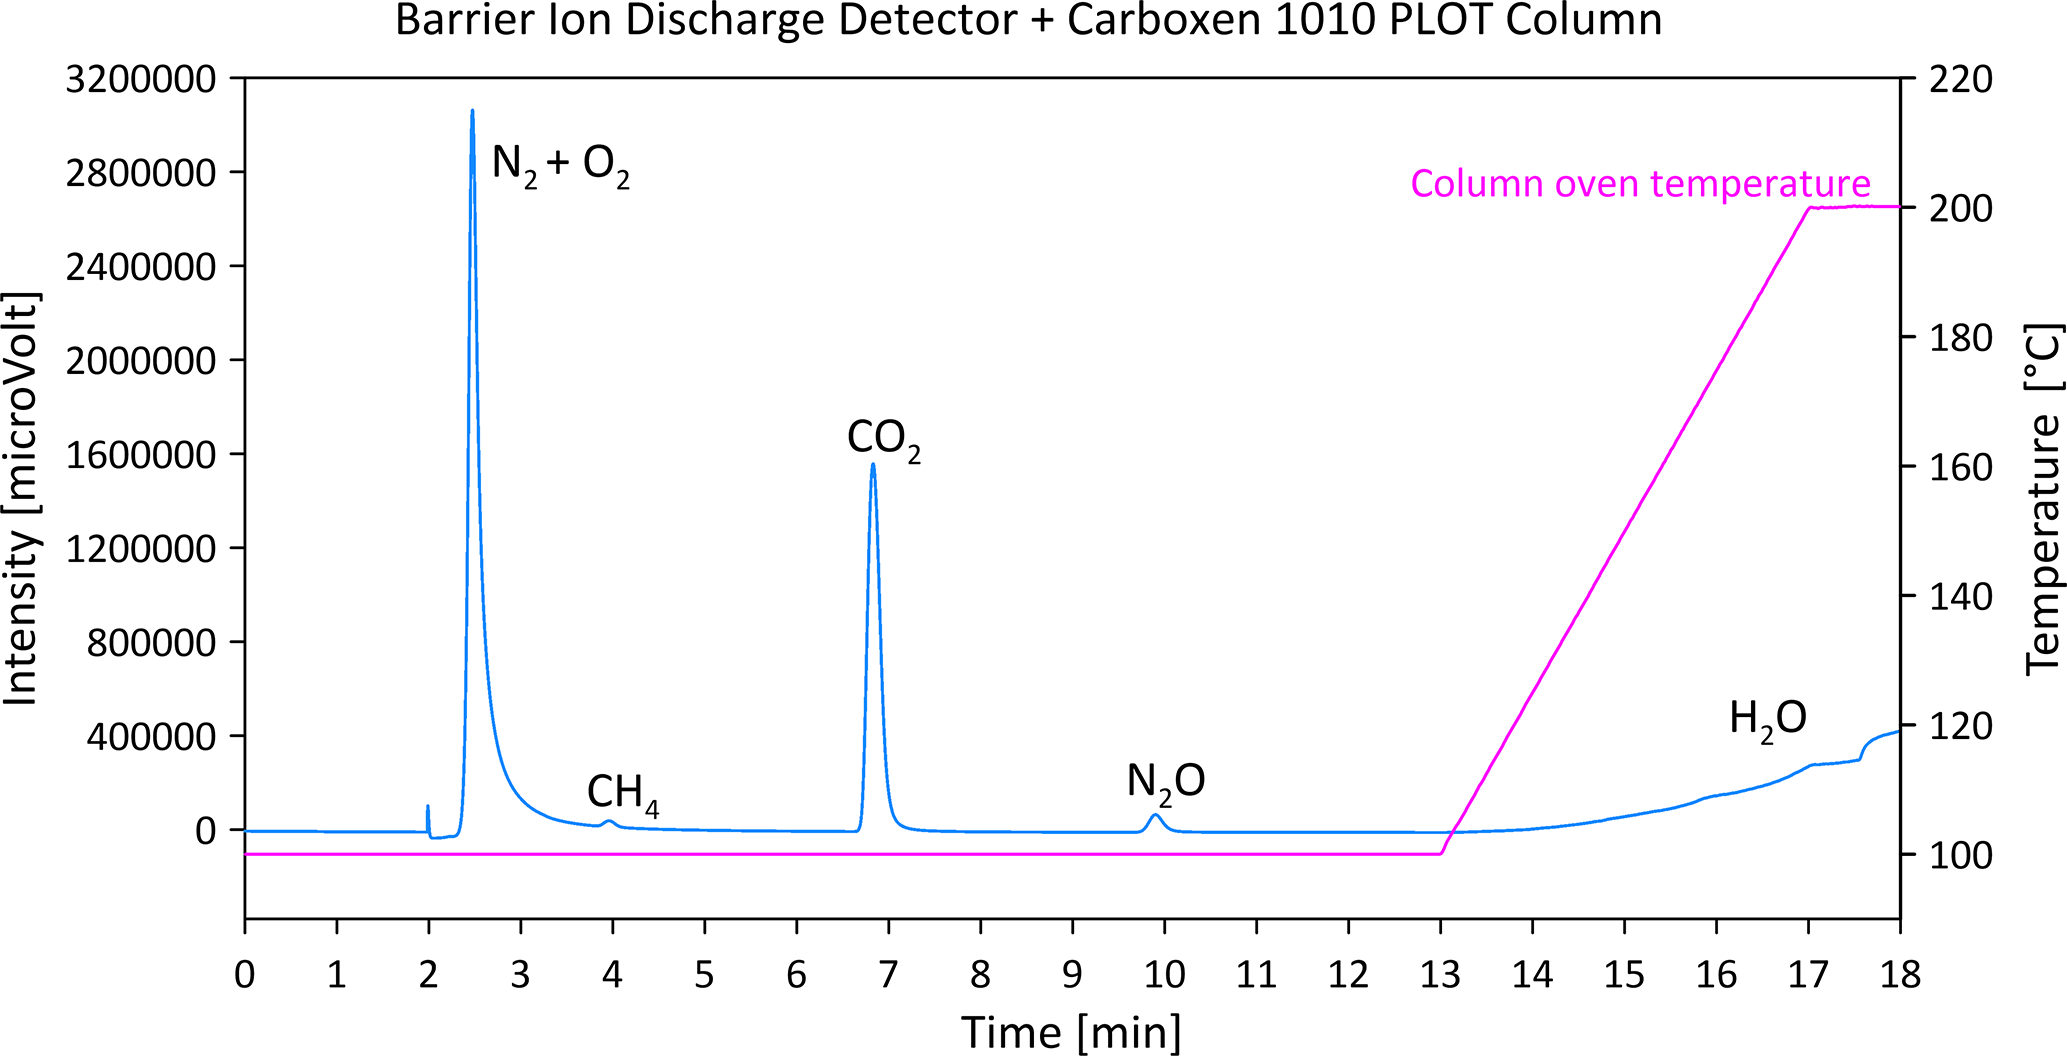
Figure 4Chromatogram of special gas mixture separated using the Carboxen 1010 PLOT column and detected using BID.
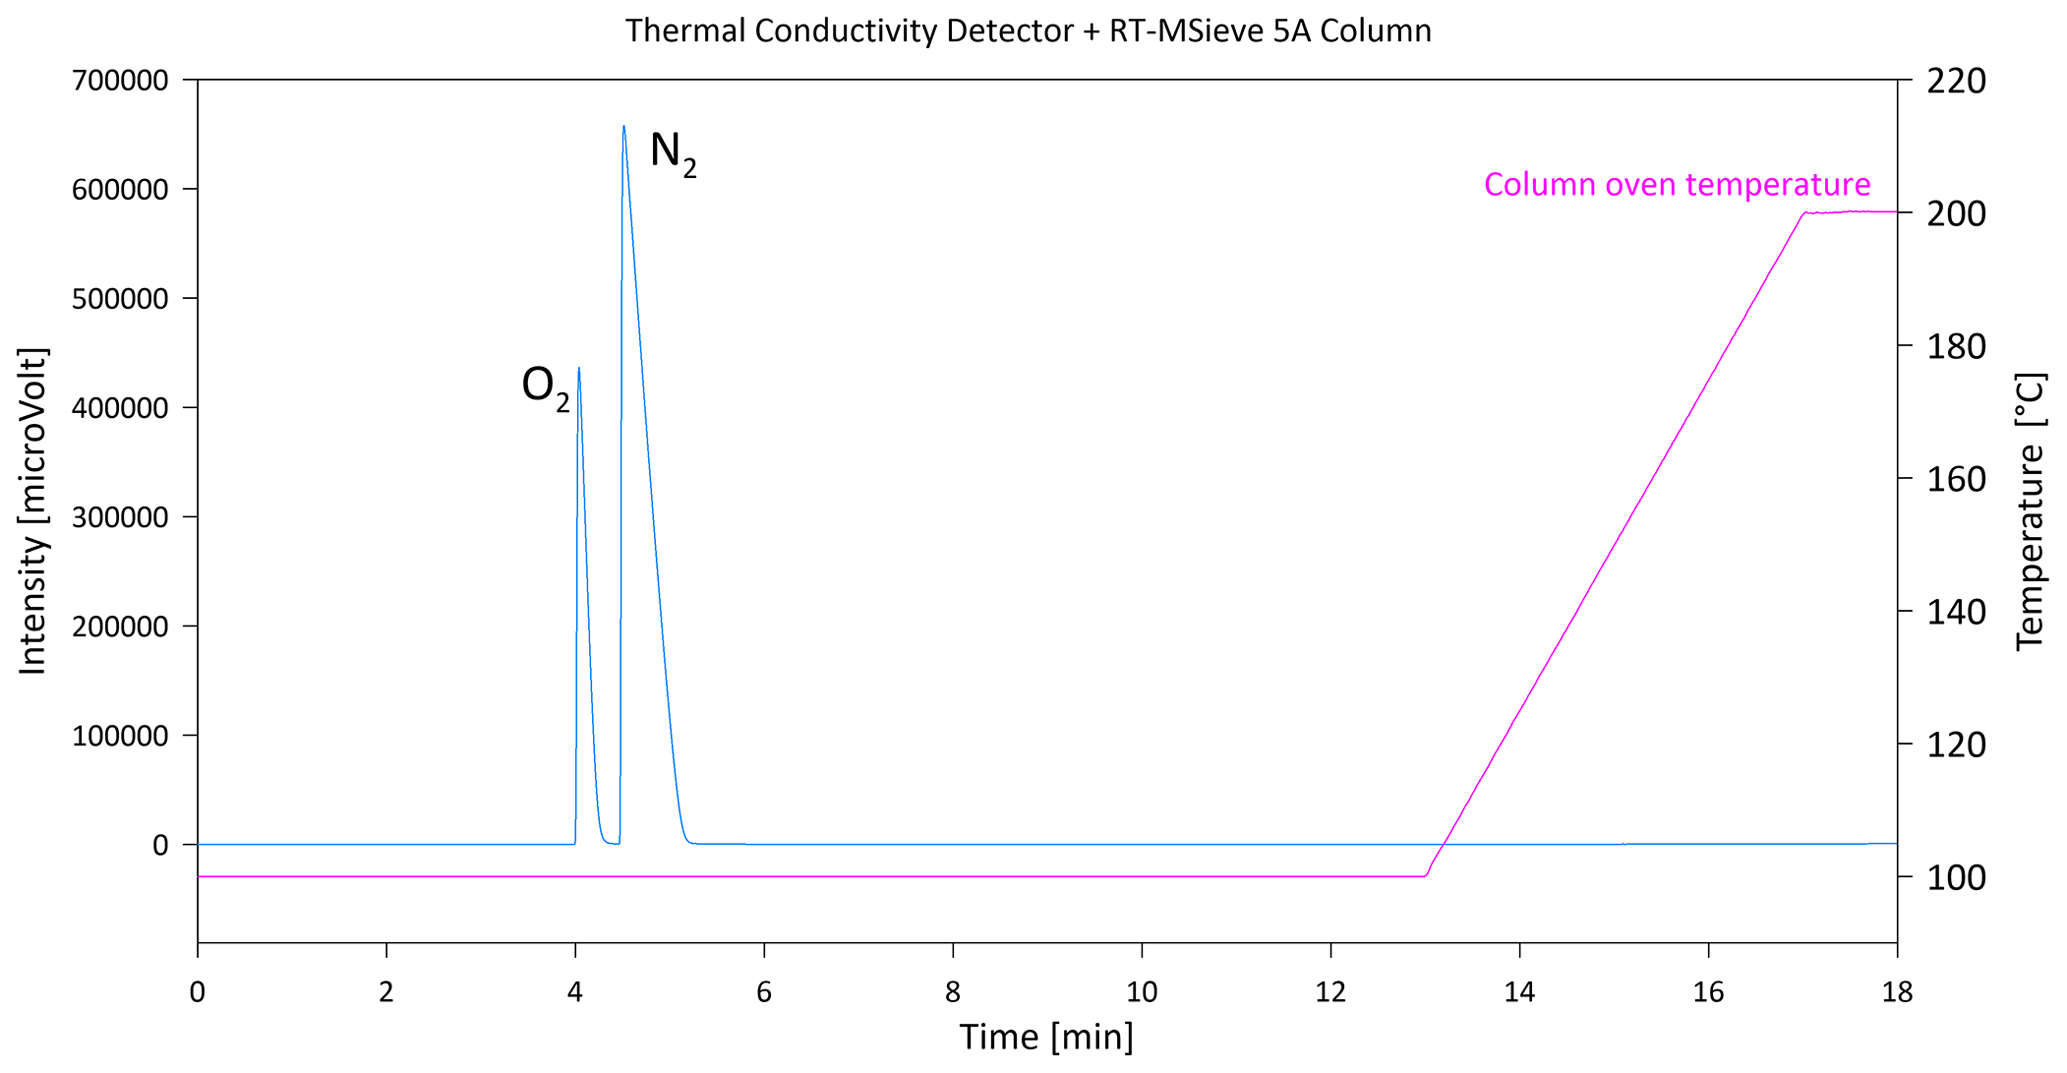
Figure 5Chromatogram of ambient air separated using the RT-Msieve 5A column and detected by TCD.
3.2 Compressed air standard measurements
The analyses of the compressed air standard with split ratios 1, 2, 3, 4 or 5 and using 1 and 2 mL sample loops showed a different precision, expressed as a coefficient of variation (CV; calculated as the standard deviation divided by the mean value, expressed in %). The CV of the CH4 measurement (1.895 ppm) was in the range of 3.31 % to 8.57 % for the 1 mL sample loop and 1.51 % to 2.76 % for the 2 mL sample loop. In the case of CO2 (411 ppm), the CV ranged from 0.91 % to 2.83 % for the 1 mL sample loop and from 0.57 % to 1.87 % for the 2 mL sample loop. The CV of the N2O measurement was lower for the 2 mL sample loop and ranged from 7.09 % to 12.67 %, compared with the 1 mL sample loop where the CV of the N2O measurement ranged from 9.15 % to 20.19 %. Generally, it was observed that gases at low detection limits (CH4, CO2) were measured more precisely using the 2 mL sample loop.
Measurement of N2O in split ratio 3 resulted in a significantly higher CV when compared with the results obtained in split ratios 4 and 5 (Table 1). This is because the injection of a higher amount of water vapour contained in the sample partially covered the peak area of the N2O (by increasing the baseline level), similarly to the measurement in split ratio 2 (CV 20.19 %). In this case the lower CV at split ratio 1 was only calculated for three measurements to avoid unnecessary contamination of the column.
The gases analysed using the TCD, O2 and N2, were characterised by a narrow CV ranging from 0.10 % to 0.39 %. The highest CV (0.39 %) was observed for the N2 measurement with the 2 mL sample loop, where the peak area was very large. The results of the measurement (peak area, SD, CV) are presented in Table 1.
3.3 Standard gas mixture measurements
The CH4, CO2 and N2O measurements of the special gas mixture standard at split ratios 3, 4 and 5 were characterised by a repeatable CV within a narrow range from 0.11 % to 3.22 %. The CV of the CH4 measurement (10 ppm) using the 1 mL sample loop ranged from 0.11 % to 0.55 %, while for the 2 mL sample loop the CV was in the range of 0.34 % to 1.79 %. The CV of CO2 (1000 ppm) for the 1 mL sample loop was between 2.05 % and 3.08 %, and for the 2 mL sample loop it was between 1.57 % and 3.22 %. The N2O measurement (50 ppm), which is a very high concentration (rare in the natural environment), was characterised by a CV in the range of 0.18 % to 0.44 % for the 1 mL sample loop and 0.85 % to 2.14 % for the 2 mL sample loop. These values clearly show that measurements of the gas mixtures with relatively high concentrations of N2O using BID were repeatable for all splits 3, 4 and 5 and were slightly better using the 1 mL sample loop. However, the application of the sample loops (1 and 2 mL) at split ratios 3, 4 and 5 guaranteed the achievement of repeatable results. Table 2 shows all the data of the standard gas mixture testing measurements.
Table 2Peak area, SD (standard deviation) and CV (coefficient of variation) of special gas mixture measurements at split ratios 3, 4 and 5 with 1 and 2 mL sample loops.
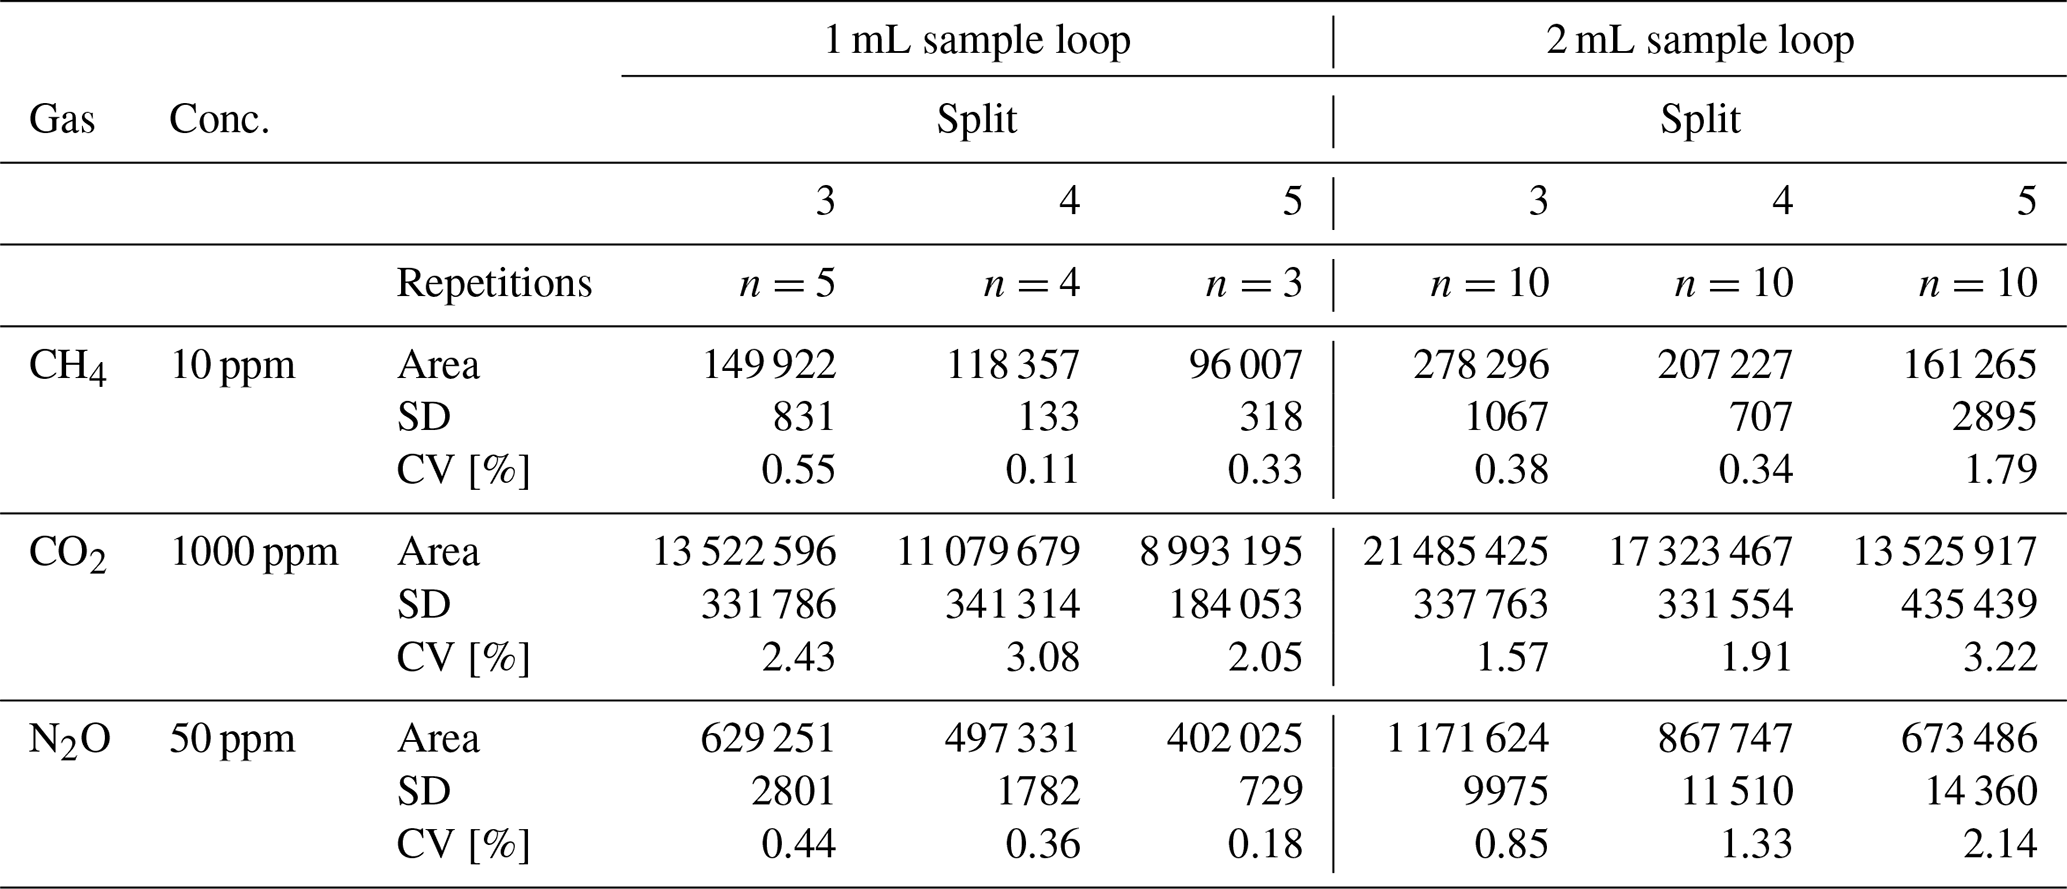
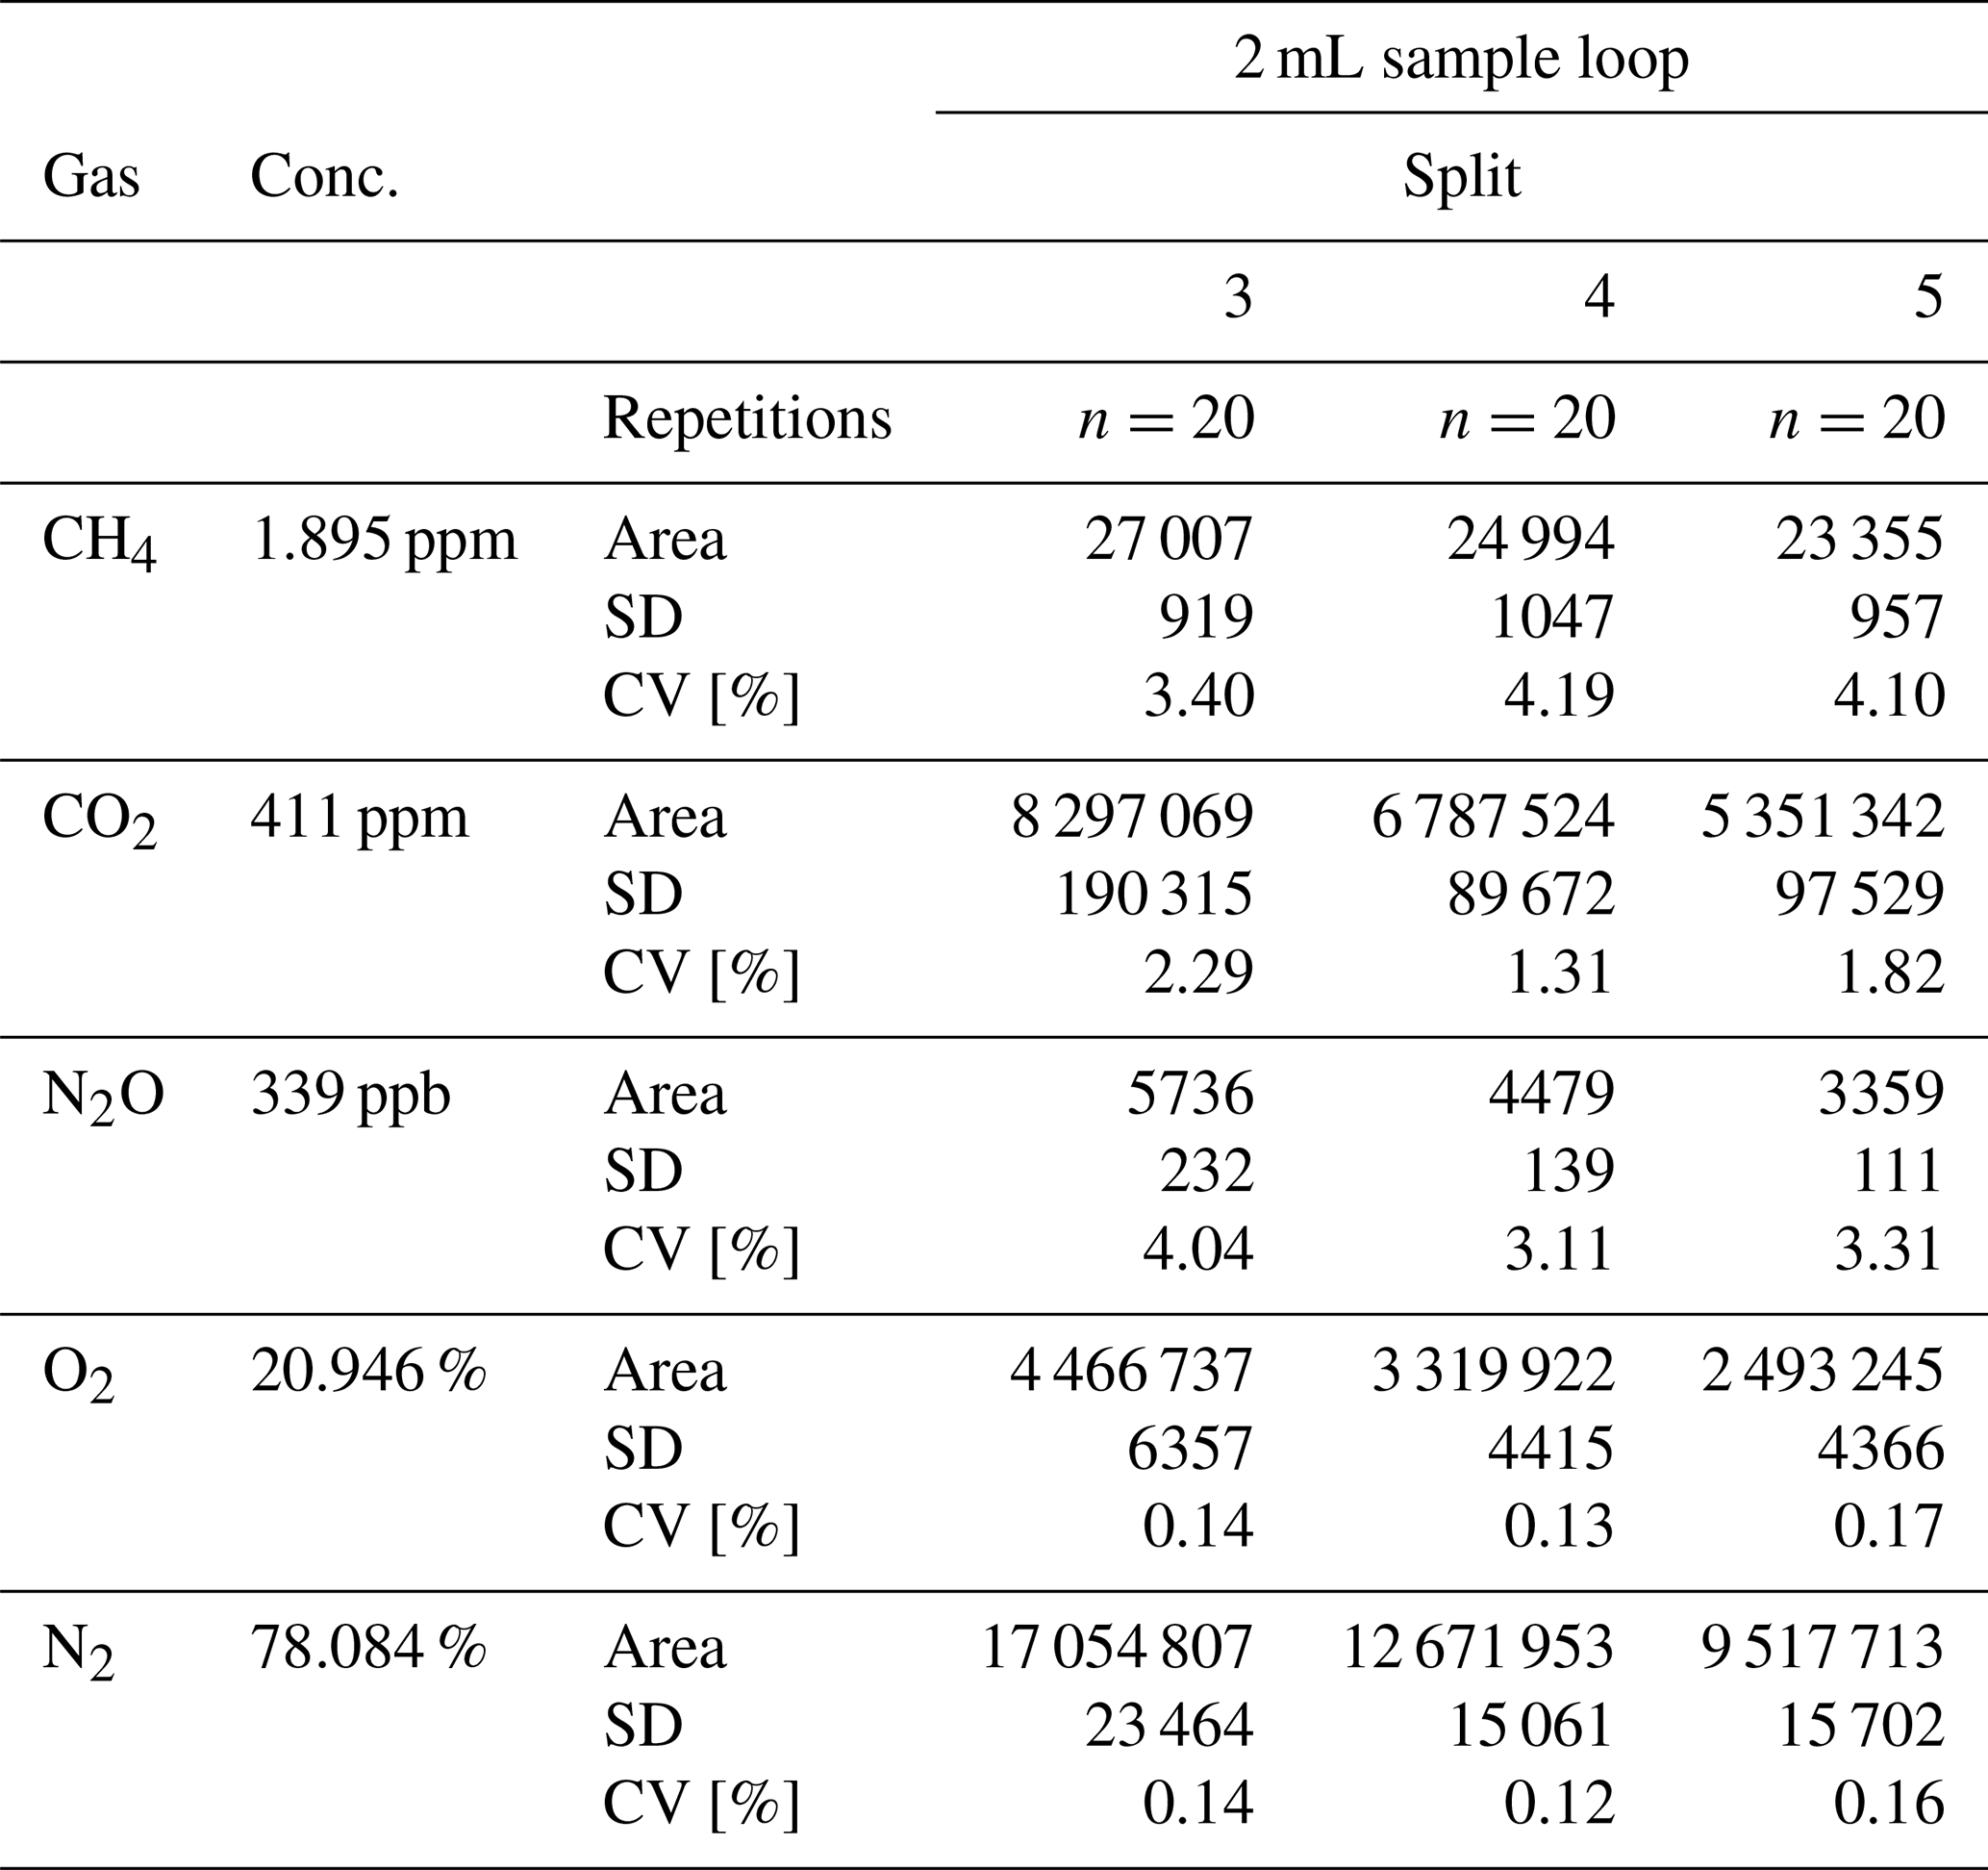
Table 3Peak area, SD (standard deviation) and CV (coefficient of variation) of direct measurements of laboratory air at split ratios 3, 4 and 5 with a 2 mL sample loop.
3.4 Direct measurement of ambient laboratory air using the AS-210 greenhouse gas autosampler
Another testing of the GC system was carried out with the application of splits 3, 4 and 5 with a 2 mL sample loop (Table 3). The ambient air from the laboratory on 1 d was analysed directly from the AS-210 greenhouse gas autosampler (empty plate for vials, which enabled direct sampling of the ambient air from the needle to the line connected with the GC's sample loop). The tests were performed with splits 3, 4 and 5 (splits 1 and 2 were omitted to avoid excessive introduction of air containing natural moisture into the Carboxen column).
The CV of CH4 was in the range of 3.40 % to 4.10 % (the highest value for split 4). The CV of CO2 was in range of 1.31 % to 2.29 %, whereas for N2O it was between 3.11 % and 4.04 %. These CV values are close to the results obtained during measurements of the compressed air standard (Sect. 3.3, Table 1). The difference between the two experiments is that compressed air always had the same composition and gas concentrations, whereas the CH4 and CO2 concentrations in ambient air could change slightly over time (daily variability).
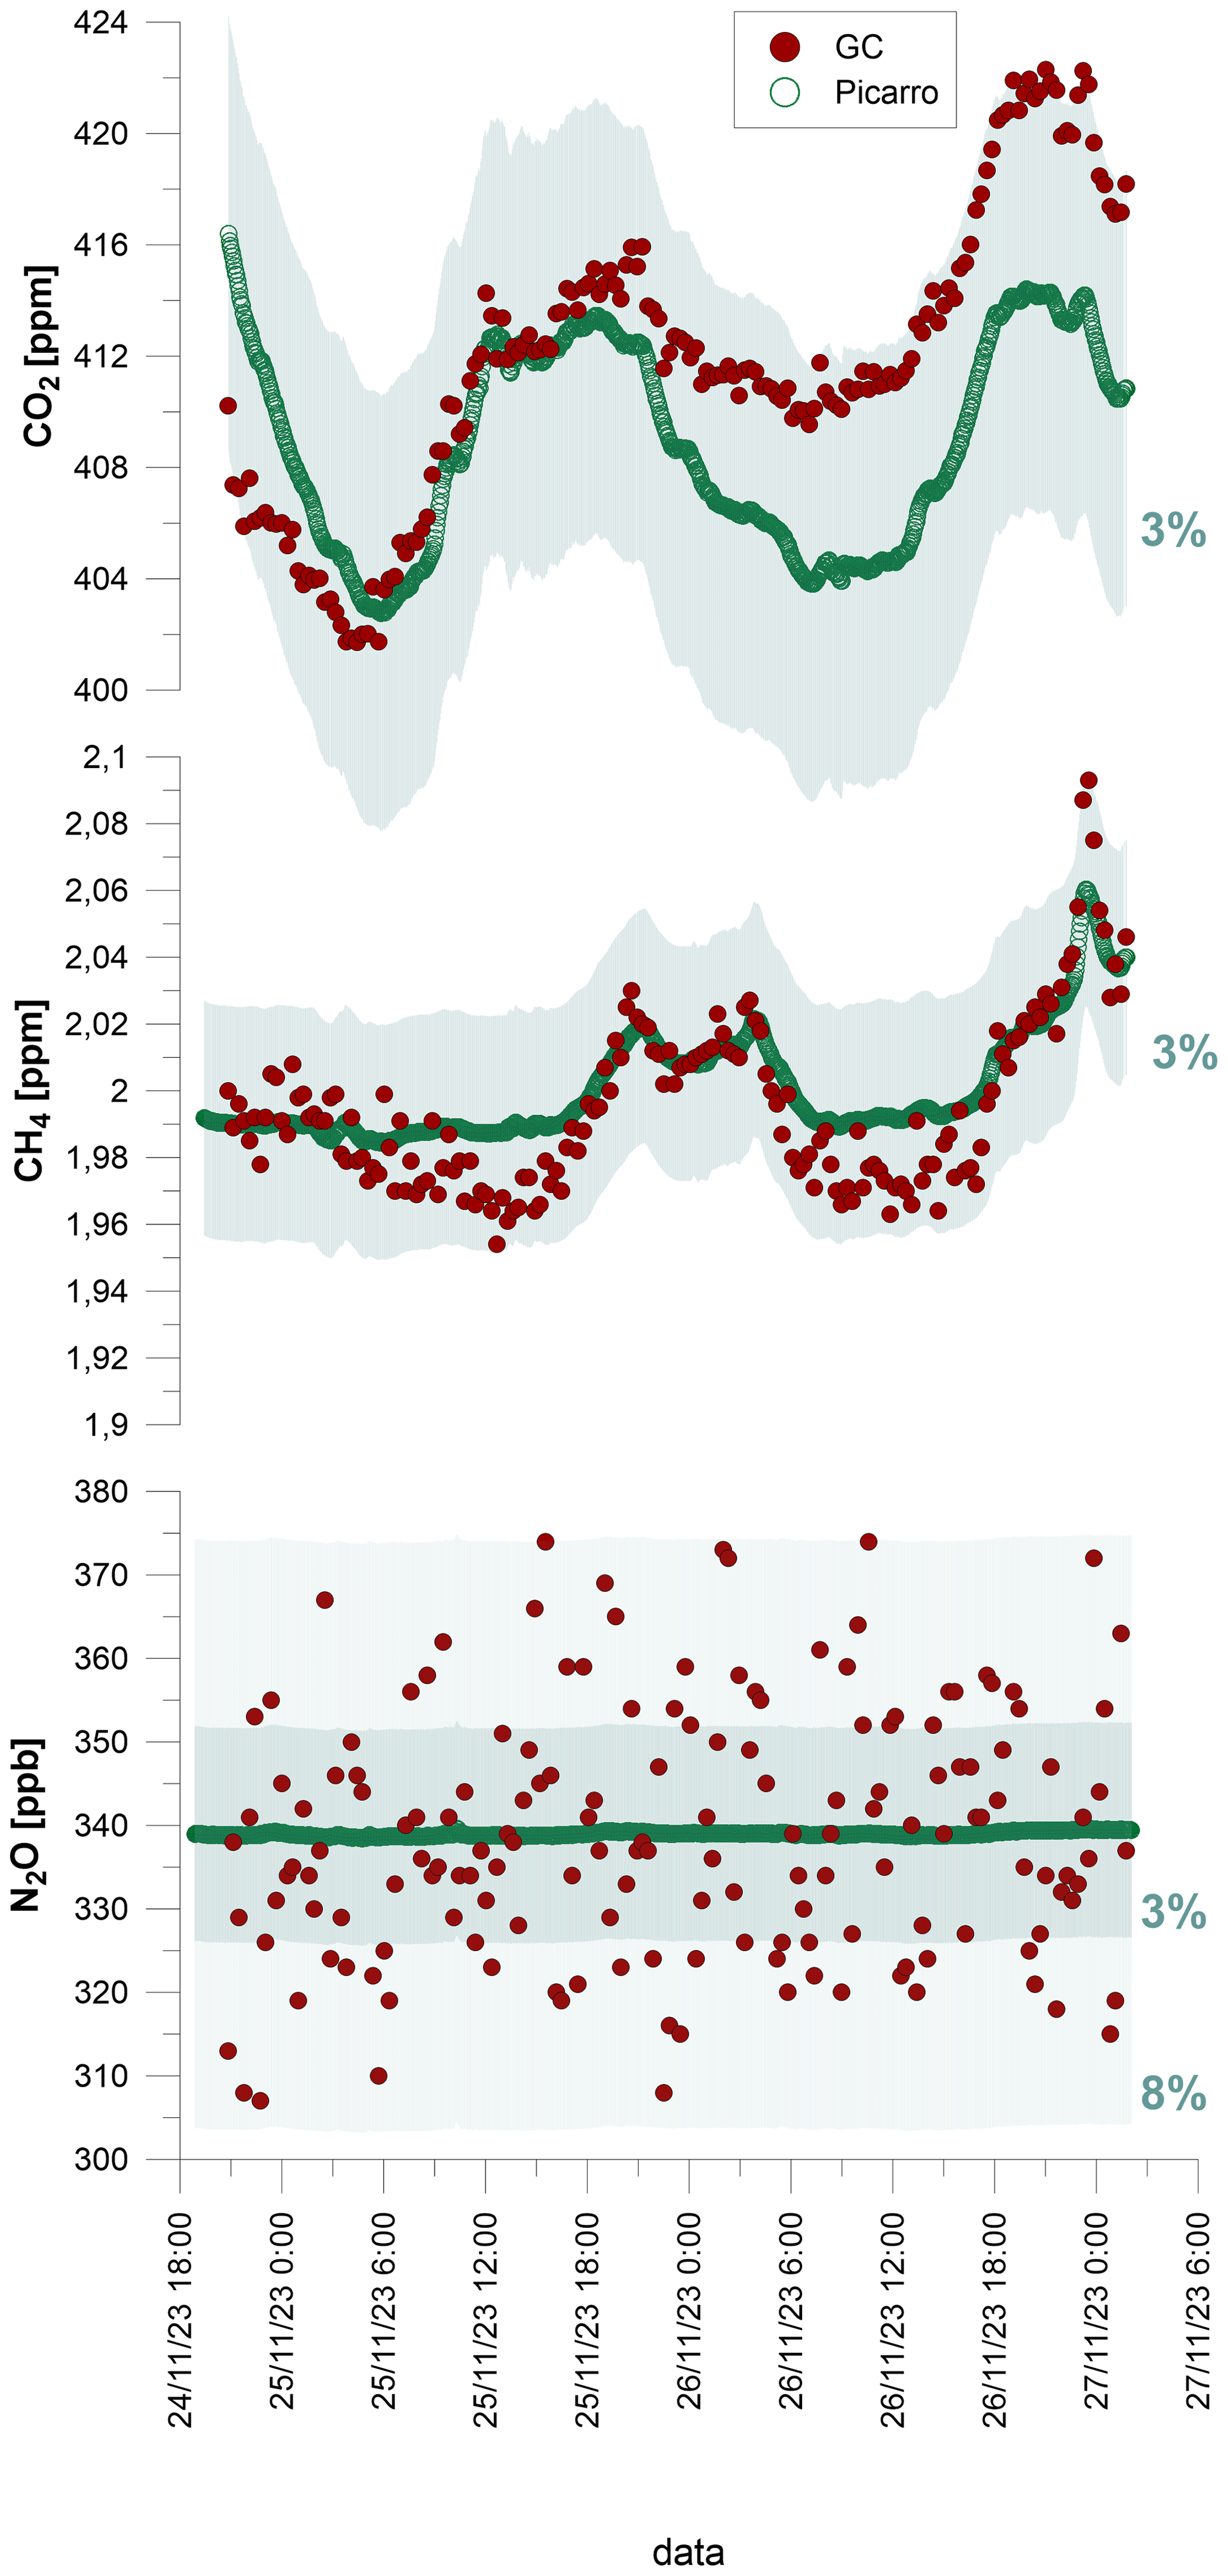
Figure 6Comparison of CH4, CO2 and N2O variations in ambient air measured using a Picarro analyser and the GC system.
3.5 Experimental measurement series comparing the GC results with the reference method (Picarro analyser)
To verify the long-term stability of the measurements and the system performance for real samples, a 55 h long measurement series of ambient laboratory air was performed. The subsequent air samples were measured in parallel with the GC set-up and with the optical instruments dedicated to analyses of GHG concentrations and isotopic signatures (Picarro G5131-i for isotopic N2O and Picarro G2201-i for CO2 and CH4) (Picarro, Santa Clara, USA). The reference methods were applied to check whether slight changes in GHG concentrations over the day/night period can be monitored well with this GC system. The reference instruments – isotopic Picarro – showed a quite narrow range of possible concentration measurements (Picarro G5131-i isotopic N2O up to 2000 ppb, Picarro G2201-i up to 2000 ppm CO2 and up to 12 ppm CH4) but a very high precision for ambient concentrations, without the need for calibration. Therefore, they served here as an ideal reference method.
During this 55 h time series, the Picarro measurement was performed every 3 min and the GC measurement every 19 min. For GC measurements, split 4 was applied. The concentration trends for CO2 and CH4 were observed to be generally in good agreement, and the N2O concentration was very stable (Fig. 6). Importantly, it was observed for CO2 that after 24 h the measurements were slightly recalibrated and shifted in relation to the reference method. This indicates the need for repeated calibration at least every 24,̉ especially for CO2. However, even without recalibration, the maximum difference between the GC measurement and the reference value was below 3 % for both CO2 and CH4. The largest variations in the GC results were observed for N2O, especially when comparing them to the very stable Picarro measurements. This is the most challenging analysis, since N2O ambient concentrations are lowest and hardest to measure correctly. The maximum difference between the GC measurement and the reference value for N2O was around 8 %, and the standard deviation of GC measurements was 15 ppb, which represents a 4.4 % error. This is quite high when compared with Picarro statistics where the standard deviation over 55 h of measurement was 0.24 ppb, which represents less than 0.1 % error. However, for typical N2O measurements of unknown sample with GC techniques, a 5 % error is a satisfactory result, typically given as an accepted GC measurement error in research studies (Arnold et al., 2001; Harvey et al., 2020). The precision obtained for ambient air measurements is similar for CO2 and CH4 compared with classical FID measurements, with an error of around 2 % (Loftfield et al., 1997), but is lower when compared with ECD measurements, for which a 1.2 % error has been reported (Loftfield et al., 1997). Usually systems that enable the simultaneous measurement of CH4 and CO2 are very accurate, but the main limitation is the upper detection limit. For example, Wang and Wang (2003) achieved a CH4 precision error in a range from 3.37 % (ambient concentration) to 0.05 % (60 ppm), or for CO2 from 0.66 % (ambient concentration) to 0.04 % (4000 ppm). In the present system, higher concentrations of CH4 can be measured by the TCD simply using a RT-Msieve 5A column. The chromatographic system can be improved by the addition of a second gas valve aimed at transferring CO2 to the TCD after separation using the Carboxen column. This would allow further improvement of this chromatographic system for the maximum range of measured GHG concentrations.
This article outlined a simple method for determination of CH4, CO2 and N2O concentrations from ambient air. The main advantage is that the use of at least two separate detectors can be avoided, including the ECD that contains radioactive materials and the FID with a methaniser to measure CO2. A single-column Carboxen 1010 PLOT can be successfully used for separation of GHG (CH4, CO2, N2O) in the time interval enabling measurement of each gas separately without the effect of peak overlapping. In parallel a connected Rt-Msieve 5A column allows for determination of higher CH4 concentrations as well control of the O2 and N2 concentrations in the sample. The main disadvantage of the method is the lack of direct measurement of samples with high CO2 concentrations (above 4000 ppm) in the set-up presented here, which is the upper detection limit for the BID. In summary the detection limits of the simplified GC system are 1.8 ppm–100 % for CH4, 411–4000 ppm for CO2, 339–4000 ppm for N2O, 0.2 %–100 % for O2 and 0.2 %–100 % for N2. Further reconstruction with an additional valve directing the separated CO2 to the TCD would allow additional analyses of higher CO2 concentrations.
Based on performed tests, it is recommended that atmospheric GHGs be analysed using a BID at split ratio 4 or 5 and with a sample loop of 2 mL volume. This would help avoid unnecessary contamination of the Carboxen column with water vapour; therefore, splits 1–3 should not be considered for the measurement of environmental gas samples. In this chromatography system, the CV of N2O measurement at atmospheric level was 11 %–15 % (1 mL sample loop) and around 7 %–9 % (when using the 2 mL sample loop), the CV of CH4 measurement at atmospheric level was near 7 % (1 mL sample loop) and below 3 % (when using the 2 mL sample loop), and the CV of the CO2 measurement at atmospheric level was near 2 % (1 mL sample loop) and around 1.5 % (when using the 2 mL sample loop). The diurnal variations for CO2 and CH4 can be monitored well with the precision below 3 % error, whereas for N2O measurements 8 % error must be taken into account. The presented results for the measurement precision are satisfactory for the most analytical needs for determining GHG fluxes in field studies or laboratory incubation experiments. However, this GC system is not designed for the most precise analyses at ambient concentration and monitoring daily changes or long-term periods. Its measurement accuracy is not sufficient for such purposes when compared with instruments using optical techniques or automated GC systems dedicated for GHG at ambient air concentration. The greatest advantage of the proposed GC system is the ability to measure GHGs at the widest possible concentration, from the near-ambient concentrations to 100 %, and in any sample matrix, without the risk of damaging or decalibration of the equipment. It is easy to use and relatively cheap. Therefore, it can be successfully used for analyses of the gas samples with unknown GHG concentrations, e.g. from soil chamber measurements, laboratory incubation studies, biogas plants, waste dumps, burning coal heaps, mines, or monitoring of environmental GHGs fluxes.
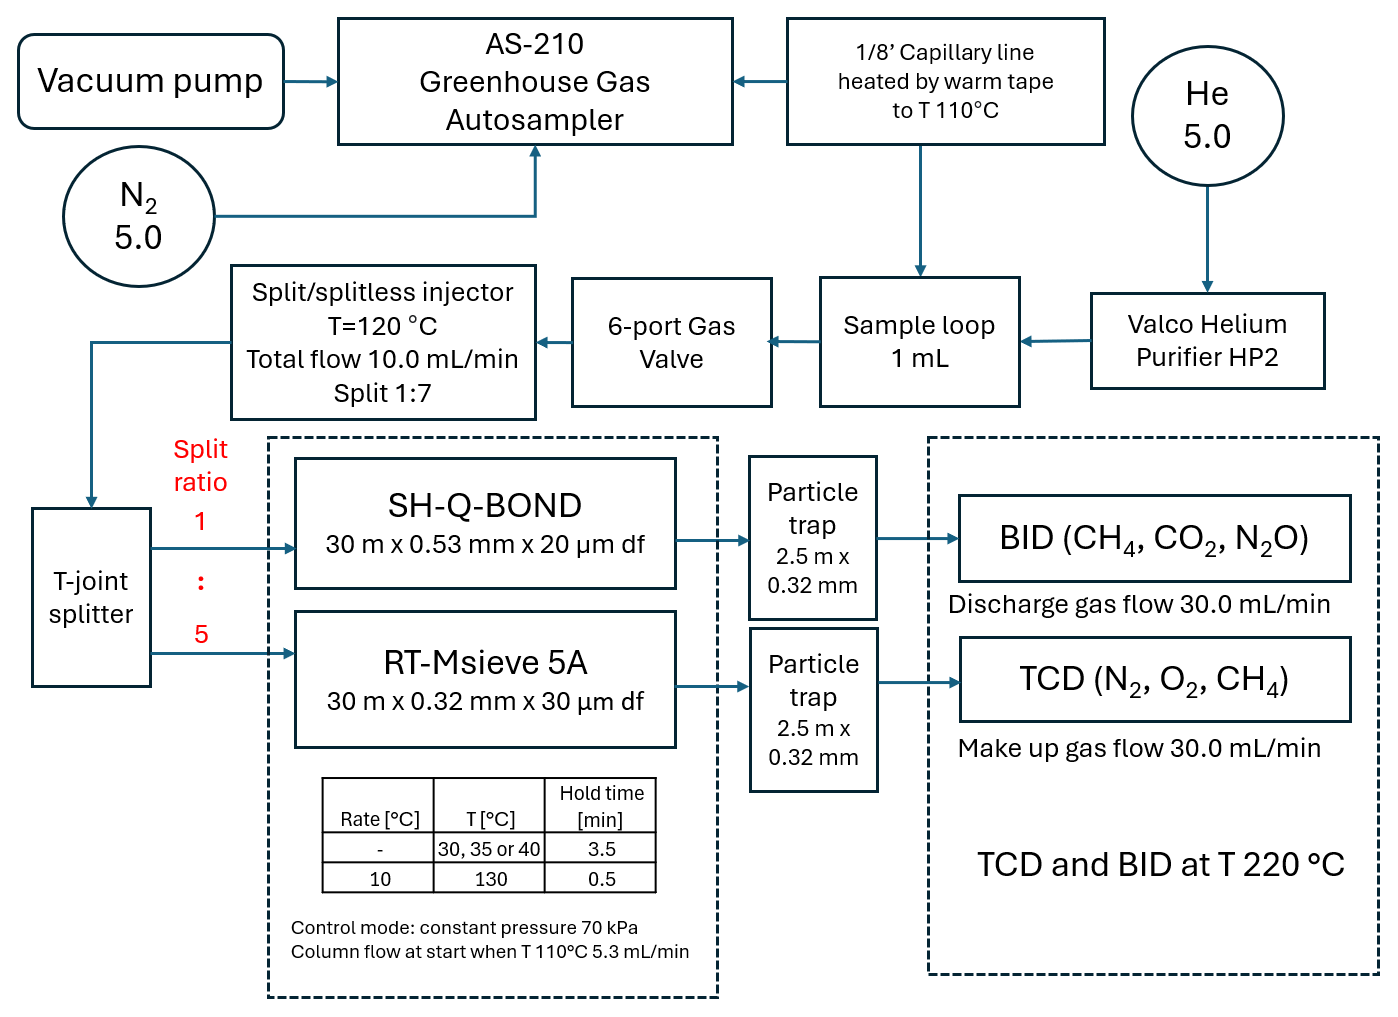
Figure A1The scheme of GC configuration for testing with columns SH-Q-BOND and RT-Msieve 5A.
Original data are available at https://doi.org/10.5281/zenodo.14905756 (Bucha, 2025).
MB and PW constructed the analytical set-up; MB and DLS planned the measurement campaign; MB, DLS and PW performed the measurements; MB and DLS analysed the data; MB, DLS and PW wrote the manuscript draft; MB, DLS and PW reviewed and edited the manuscript.
The contact author has declared that none of the authors has any competing interests.
Publisher’s note: Copernicus Publications remains neutral with regard to jurisdictional claims made in the text, published maps, institutional affiliations, or any other geographical representation in this paper. While Copernicus Publications makes every effort to include appropriate place names, the final responsibility lies with the authors.
This study was financially supported by the “Polish Returns” programme of the Polish National Agency for Academic Exchange and Opus grant no. 2021/41/B/ST10/01045 funded by the National Science Centre of Poland.
This paper was edited by Yoshiteru Iinuma and reviewed by three anonymous referees.
Arnold, S. L., Parkin, T. B., Doran, J. W., Eghball, B., and Mosier, A. R.: Automated gas sampling system for laboratory analysis of CH4 and N2O, Commun. Soil Sci. Plan., 32, 2795–2807, https://doi.org/10.1081/CSS-120000962, 2001.
Bucha, M.: Simultaneous measurement of greenhouse gases (CH4, CO2 and N2O) using a simplified gas chromatography system, In Atmospheric Measurement Techniques, Zenodo [data set], https://doi.org/10.5281/zenodo.14905756, 2025.
Ekeberg, D., Ogner, G., Fongen, M., Joner, E. J., and Wickstrøm, T.: Determination of CH4, CO2 and N2O in air samples and soil atmosphere by gas chromatography mass spectrometry, GC-MS, J. Environ. Monitor., 6, 621–623, https://doi.org/10.1039/b401315h, 2004.
Fastyn, P., Kornacki, W., Kardaś, M., Gawlowski, J., and Niedzielski, J.: Adsorption of water vapour from humid air in carbon molecular sieves: Carbosieve S-III and Carboxens 569, 1000 and 1001, Analyst, 128, 198–203, https://doi.org/10.1039/b209296d, 2003.
Gruca-Rokosz, R., Szal, D., Bartoszek, L., and Pękala, A.: Isotopic evidence for vertical diversification of methane production pathways in freshwater sediments of Nielisz reservoir (Poland), Catena, 195, 104803, https://doi.org/10.1016/j.catena.2020.104803, 2020.
Harvey, M. J., Sperlich, P., Clough, T. J., Kelliher, F. M., McGeough, K. L., Martin, R. J., and Moss, R.: Global Research Alliance N2O chamber methodology guidelines: Recommendations for air sample collection, storage, and analysis, J. Environ. Qual., 49, 1110–1125, https://doi.org/10.1002/jeq2.20129, 2020.
Hedley, C., Saggar, S., and Tate, K.: Procedure for fast simultaneous analysis of the greenhouse gases: Methane, carbon dioxide, and nitrous oxide in air samples, Commun. Soil Sci. Plant Anal., 37, 1501–1510, https://doi.org/10.1080/00103620600709928, 2006.
Lamb, W. F., Wiedmann, T., Pongratz, J., Andrew, R., Crippa, M., Olivier, J. G. J., Wiedenhofer, D., Mattioli, G., Al Khourdajie, A., House, J., Pachauri, S., Figueroa, M., Saheb, Y., Slade, R., Hubacek, K., Sun, L., Ribeiro, S. K., Khennas, S., De La Rue Du Can, S., Chapungu, L., Davis, S. J., Bashmakov, I., Dai, H., Dhakal, S., Tan, X., Geng, Y., Gu, B., and Minx, J.: A review of trends and drivers of greenhouse gas emissions by sector from 1990 to 2018, Environ. Res. Lett., 16, 1–31, https://doi.org/10.1088/1748-9326/abee4e, 2021.
Loftfield, N., Flessa, H., Augustin, J., and Beese, F.: Automated Gas Chromatographic System for Rapid Analysis of the Atmospheric Trace Gases Methane, Carbon Dioxide, and Nitrous Oxide, J. Environ. Qual., 26, 560–564, https://doi.org/10.2134/jeq1997.00472425002600020030x, 1997.
Rapson, T. D. and Dacres, H.: Analytical techniques for measuring nitrous oxide, TrAC – Trends Anal. Chem., 54, 65–74, https://doi.org/10.1016/j.trac.2013.11.004, 2014.
Scion Instruments: Analysis of Greenhouse Gas by Gas Chromatography, Application Note AN012, 1–2, 2023.
Shimbo, E. and Uchiyama, S.: Application News: Simultaneous Analysis of Three Greenhouse Gas Components, CH4, CO2, and N2O, Shimadzu Corporation, Application Note 01-00363A, 1–3, 2022.
van der Laan, S., Neubert, R. E. M., and Meijer, H. A. J.: A single gas chromatograph for accurate atmospheric mixing ratio measurements of CO2, CH4, N2O, SF6 and CO, Atmos. Meas. Tech., 2, 549–559, https://doi.org/10.5194/amt-2-549-2009, 2009.
Wang, Y. and Wang, Y.: Emissions from a Short-Plant Ecosystem, Adv. Atmos. Sci., 20, 842–844, https://doi.org/10.1007/BF02915410, 2003.
Zaman, M., Kleineidam, K., Bakken, L., Berendt, J., Bracken, C., Butterbach-Bahl, K., Cai, Z., Chang, S. X., Clough, T., Dawar, K., Ding, W. X., Dörsch, P., dos Reis Martins, M., Eckhardt, C., Fiedler, S., Frosch, T., Goopy, J., Görres, C.-M., Gupta, A., Henjes, S., Hofmann, M. E. G., Horn, M. A., Jahangir, M. M. R., Jansen-Willems, A., Lenhart, K., Heng, L., Lewicka-Szczebak, D., Lucic, G., Merbold, L., Mohn, J., Molstad, L., Moser, G., Murphy, P., Sanz-Cobena, A., Šimek, M., Urquiaga, S., Well, R., Wrage-Mönnig, N., Zaman, S., Zhang, J., and Müller, C.: Methodology for Measuring Greenhouse Gas Emissions from Agricultural Soils using Non-Isotope techniques, 11–209, in: Measuring Emission of Agricultural Greenhouse Gases and Developing Mitigation Options Using Nuclear and Related Techniques, Springer, ISBN 978-3-030-55395-1, https://doi.org/10.1007/978-3-030-55396-8, 2021.