the Creative Commons Attribution 4.0 License.
the Creative Commons Attribution 4.0 License.
 | 17 Feb 2026
Examining the characteristics of aerosols: a statistical analysis based on a decade of lidar and photometer observations at the Eastern border of ACTRIS
Doina Nicolae
Gabriela-Ancuta Ciocan
Victor Nicolae
Camelia Talianu
Jeni Vasilescu
Alexandru Dandocsi
Cristian Radu
Marius-Mihai Cazacu
Viorel Vulturescu
Livio Belegante
A decade-long (2015–2024) analysis of aerosol properties was conducted at RADO (Romanian Atmospheric 3D Observatory)-Bucharest station in Romania, a key atmospheric observational site at the Eastern border of the Aerosol, Clouds and Trace gases Research Infrastructure (ACTRIS). This study aims to characterize the optical and microphysical properties of aerosols, classify predominant aerosol types, and investigate their seasonal variability and transport pathways based on long-term multiwavelength Raman lidar and sun/sky/lunar photometer measurements.
Results indicate a dominance of fine-mode aerosols, with an average Aerosol Optical Depth (AOD) of ∼ 0.2 and Ångström Exponent (AE) values between 1.5 and 2.0, highlighting pollution-driven aerosol regimes. Seasonal variations were observed, with continental aerosols prevailing in winter, dust transport peaking in spring (altitudes of 2–8 km), and biomass-burning aerosols increasing during summer.
Analysis of 408 aerosol layers using the NATALI (Neural network Aerosol Typing Algorithm based on LIdar data) identified complex aerosol mixtures, with 63 high-resolution cases revealing a predominance of “dust polluted” and “continental smoke” types.
In the lower troposphere, the extinction-related Ångström exponent shows a narrow mono-modal distribution with the peak at 0.9, indicating predominantly medium-sized particles, whereas in the high troposphere it becomes bi-modal, reflecting alternating occurrences of small and large particles.
Lidar ratio values have a distribution peak at around 48–49 sr in both altitude regions, but their spread is much wider in the lower troposphere – revealing frequent layers of highly absorbing aerosols – while lofted layers in the high troposphere exhibit a narrower range typical of moderately absorbing particles. Distinct differences between fresh and aged biomass-burning aerosols (smoke) are identified through their altitude, depolarization, Ångström exponent, and lidar-ratio characteristics, demonstrating microphysical change during transport.
FLEXPART (FLEXible PARTicle dispersion model) retro-plume simulations provided insights into aerosol source regions and transport patterns showing contributions from local emissions, long-range transported desert dust, and biomass burning events from Europe and North America.
These findings emphasize the persistent influence of regional pollution and transported aerosols on air quality and climate. The integration of ground-based remote sensing and advanced retrieval algorithms like NATALI provides a robust framework for aerosol characterization, enhancing climate models and air quality assessments.
- Article
(4392 KB) - Full-text XML
-
Supplement
(453 KB) - BibTeX
- EndNote


Aerosols are a key focus of the Aerosol, Clouds, and Trace Gases Research Infrastructure (ACTRIS), which coordinates a pan-European network of advanced atmospheric observatories to document, understand, and quantify the effects of short-lived atmospheric constituents on climate, air quality, human health, and ecosystems (Laj et al., 2024). Within ACTRIS, harmonized procedures for instrument operation, calibration, and quality assurance enable the production of traceable long-term datasets of aerosol optical properties at both column and profile level, providing a unique basis for climatological studies and model evaluation.
Atmospheric aerosols strongly influence the Earth's radiation budget and climate through both direct and indirect effects. By scattering and absorbing solar radiation, and by acting as cloud condensation and ice nuclei, they modify radiative fluxes, cloud properties, and precipitation patterns (Hansen et al., 1997; IPCC, 2021; Schwartz and Andreae, 1996). Because their atmospheric lifetime is relatively short (days to weeks), aerosol loading and properties exhibit strong spatial and temporal variability, driven by complex source–transport–removal processes (Boucher, 2015). Quantifying this variability and distinguishing between different aerosol types (e.g. dust, smoke, marine, urban/industrial, continental clean, mixed) are essential for reducing uncertainties in climate forcing estimates and for interpreting air-quality conditions.
Aerosol optical properties derived from remote sensing provide integral constraints on aerosol type and radiative impact. Aerosol optical depth (AOD) describes the column-integrated extinction and is commonly used as a proxy for aerosol burden (Bréon et al., 2002), while the Ångström exponent (AE) carries information on the effective particle size and, indirectly, on aerosol type (Eck et al., 1999; Gobbi et al., 2007). Active remote sensing with lidars adds crucial vertical information: the linear particle depolarization ratio allows discrimination between spherical and non-spherical particles and is widely used for aerosol typing (e.g. dust versus smoke or urban aerosols), whereas the lidar ratio (extinction-to-backscatter ratio) provides additional constraints on aerosol composition and mixing state. The combined use of column and profile optical properties has been the backbone of many ACTRIS/EARLINET (European Aerosol Research Lidar Network) studies on aerosol classification, microphysical retrievals, and radiative impacts (e.g. Dubovik and King, 2000; Holben et al., 1998; Nicolae et al., 2018; Papagiannopoulos et al., 2018; Pappalardo et al., 2013).
Europe is a receptor region for a wide variety of aerosol types transported over long distances and produced locally. Over the continent, background continental aerosols, urban/industrial pollution, mineral dust intrusions from North Africa and the Middle East, marine aerosols from the Atlantic and regional seas, and biomass-burning smoke from both nearby and remote fires often coexist and mix in complex vertical structures (Nicolae et al., 2019; Pappalardo et al., 2013). The vertical distribution of these aerosols, including layers lofted above the planetary boundary layer, plays a critical role in their radiative effects and in the interpretation of column integrals derived from passive sensors.
The Eastern border of ACTRIS, represented by the RADO (Romanian Atmospheric 3D Observatory)-Bucharest station in Romania, is of particular interest because it is located at the intersection of several major transport pathways. The site is influenced by: (i) pollution from Central and Eastern Europe; (ii) desert dust outbreaks from the Sahara and occasionally from the Middle East; (iii) marine inflow from the Black Sea and, more sporadically, from the Eastern Mediterranean; and (iv) smoke from regional and remote biomass-burning events. Despite this complexity, long-term vertically resolved aerosol climatology for Eastern Europe remain less documented than those for Western and Central Europe. Existing studies often focus on selected episodes (e.g. volcanic eruptions or strong dust intrusions) or on shorter time periods, limiting our ability to assess climatological patterns and year-to-year variability in aerosol type occurrence and optical properties at this ACTRIS boundary region.
Within ACTRIS, the Centre for Aerosol Remote Sensing (CARS) provides harmonized quality assurance for both lidar and photometer observations, including standardized calibration procedures, regular intercomparisons, and routine performance tests. At RADO-Bucharest, these protocols ensure that long-term lidar and sun/sky/lunar photometer measurements are directly comparable with other ACTRIS sites and suitable for climatological analysis. The present study builds on this quality-controlled dataset, but does not implement combined microphysical retrieval schemes such as GARRLiC/GRASP (Dubovik et al., 2011, 2021; Lopatin et al., 2013). Instead, we focus on robust aerosol typing using intensive optical properties and on linking the observed aerosol types to their potential source regions.
Recent advances in automated aerosol typing algorithms now allow systematic classification of aerosol layers based on multi-wavelength lidar measurements. The Neural Network Aerosol Typing Algorithm based on Lidar Data (NATALI) exploits the combined information from backscatter, extinction, and depolarization profiles to assign aerosol types to individual layers (Nicolae et al., 2018; Papagiannopoulos et al., 2018; Mylonaki et al., 2021). Coupling such layer-resolved classification with columnar aerosol properties from photometers and with Lagrangian transport simulations (e.g. FLEXPART) provides a powerful framework to analyze the occurrence, optical characteristics, and source attribution of different aerosol types in both the lower troposphere and the free troposphere.
The aim of this paper is to examine the characteristics of aerosols observed at the RADO-Bucharest ACTRIS station over a full decade by combining long-term sun/sky/lunar photometer and multi-wavelength lidar measurements with the NATALI neural-network classifier and FLEXPART retro-plume analysis. Specifically, we (i) quantify the occurrence of major aerosol types and their seasonal variability in the lower troposphere and above the boundary layer, (ii) characterize their key optical properties (AOD, AE, depolarization ratio, lidar ratio), and (iii) relate the observed aerosol types and their vertical distribution to potential source regions and transport pathways. By providing the first decade-long, vertically resolved aerosol-type climatology at the Eastern border of ACTRIS, this work contributes to filling a geographical gap in European aerosol observations and offers constraints for regional climate and air-quality modelling.
In the following, we first describe the RADO-Bucharest site, the lidar and photometer datasets, the NATALI classification, and the FLEXPART configuration (Sect. 2). We then present the aerosol-type statistics and associated optical properties in the lower and high troposphere (Sect. 3.1–3.2), followed by the analysis of source-region contributions based on FLEXPART simulations (Sect. 3.3). Finally, we discuss the implications and limitations of our findings and outline directions for future work (Sect. 4).
2.1 Site and General Dataset Description
Measurements were collected at the RADO-Bucharest ACTRIS station, located 8 km southwest of Bucharest (44.34° N, 26.01° E, 73 m a.s.l.), a regional WMO–GAW observatory positioned in flat terrain surrounded by agricultural fields and residential areas (Nicolae et al., 2010). The site hosts aerosol in-situ, aerosol remote sensing, cloud remote sensing, trace gases, and weather instrumentation (Carstea et al., 2019; Pîrloagă et al., 2022). The Aerosol Remote Sensing Laboratory operates multi-wavelength Raman and polarization lidars, scanning and HSRL systems, and a collocated sun/sky/lunar photometer, following ACTRIS-CARS quality assurance protocols for calibration, alignment, and performance tests. Data streams are routinely submitted in near-real-time to the EARLINET and AERONET databases and are used for model validation (Stebel et al., 2021), satellite calibration/validation (Proestakis et al., 2019), and scientific analyses (Nicolae et al., 2019; Tsekeri et al., 2023). This study uses 10 years (2015–2024) of collocated Raman lidar and photometer observations to characterize aerosol layers and their dominant types, supported by FLEXPART dispersion modelling.
2.2 Raman Lidar Measurements (RALI)
The multiwavelength polarization Raman lidar RALI, operated at INOE, provides high-resolution vertical profiles of aerosol optical properties. The system emits at 355, 532, and 1064 nm and detects elastic, Raman, and polarization signals, enabling retrievals of backscatter and extinction coefficients, depolarization ratio, and water vapor. Its raw resolution is 10 s in time and 3.75 m in height, with reliable performance between ∼ 600 m and 20 km (Nemuc et al., 2013). Extinction from Raman channels (355, 532 nm) is available at night; daytime retrievals rely on elastic and polarization channels only. All lidar data were processed using the EARLINET Single Calculus Chain (SCC) (D'Amico et al., 2016; Mattis et al., 2016), producing 30 min averaged, 15 m resolution profiles. From the 218 SCC-processed datasets acquired between 2015 and 2024, 408 aerosol layers were identified. Among these layers, 229 passed the NATALI quality criteria, and 63 contained calibrated depolarization profiles suitable for high-resolution aerosol typing.
2.3 Sun/Sky/Lunar Photometer Measurements
The site operates an AERONET-compliant sun/sky/lunar photometer, consisting of a sensor head with 25 cm collimators on a 40 cm robotic tracker, equipped with Si (340–1020 nm) and InGaAs (1020–1640 nm) detectors. It measures spectral irradiance and sky radiances according to a predefined routine and stores control electronics, power supply, and satellite modem in a weatherproof housing. Direct-Sun observations cover 340–1640 nm using interference filters, including the 940 nm water-vapour channel (Holben et al., 1998) (Holben et al., 1998). Triplet measurements at 30 s intervals ensure cloud screening, while principal-plane and almucantar scans at 440, 670, 870, and 1020 nm support aerosol inversion retrievals (Dubovik and King, 2000). In this study, we use AERONET Version 3 Level 2.0 products – AOD, Ångström exponent, FMF (Fine Mode Fraction), – and apply classification thresholds derived from D'Almeida et al. (1991), Dubovik et al. (2002), Lee et al. (2010), Logothetis et al. (2020), Toledano et al. (2007), and Zhang and Huo (2016).
2.4 Aerosol Typing with NATALI
Aerosol layer typing is performed with the Neural Network Aerosol Typing Algorithm based on Lidar Data (NATALI), which uses multi-wavelength Raman lidar profiles of backscatter (β at 355/532/1064 nm), extinction (α at 355/532 nm), and depolarisation (δ at 532 nm) to determine aerosol type (Nicolae et al., 2018). NATALI is trained on a synthetic database constructed from OPAC aerosol components (Hess et al., 1998; Köpke et al., 1997) whose optical properties are computed with T-matrix methods (Mishchenko et al., 1996; Waterman, 1971). The training set includes spheroidal particle shapes to represent non-sphericity and mixture ratios of components such as water-soluble species, soot, dust (nucleation, accumulation, coarse), sulfates, and sea salt (accumulation/coarse). The algorithm operates in two modes:
-
High-resolution mode (with reliable depolarization):
– resolves 14 pure and mixed aerosol categories, including binary and ternary mixtures, if uncertainties meet strict limits (extinction ≤ 50 %, backscatter ≤ 20 %, depolarization ≤ 30 %). -
Low-resolution mode (without depolarization):
– resolves 6 dominant types: continental, continental polluted, smoke, dust, marine, and mineral mixtures.
The main aerosol category is determined across the six possible outputs, each representing a dominant type that may include up to 50 % presence of other components as minor traces: continental, continental polluted, smoke, dust, marine, and mineral mixtures. In high-resolution mode, NATALI further refines these classes into a set of fourteen advanced aerosol types that capture both pure and mixed states. These include: Continental (water soluble, insoluble, soot), Dust (mineral nucleation, mineral accumulation, mineral coarse mode, water soluble, soot), Continental Polluted (water soluble, soot, insoluble, sulfate), Marine (water soluble, sea salt accumulation mode, sea salt coarse mode, soot), Smoke (water soluble, soot, sulfate), Volcanic (mineral nucleation, mineral accumulation, mineral coarse mode, water soluble, sulfate), as well as mixed and binary types such as ContinentalDust (continental + dust), MarineMineral (dust + marine), ContinentalSmoke (continental + smoke), DustPolluted (dust + smoke or dust + continental polluted), Coastal (continental + marine), CoastalPolluted (continental polluted + marine), MixedDust (continental + dust + marine), and MixedSmoke (continental + smoke + marine). The correspondence between the aerosol types retrieved by NATALI in high- and low-resolution modes is presented in the results section.
Ambiguous or uncertain retrievals flagged by NATALI are excluded, following the algorithm recommendations.
NATALI has been used in European and international aerosol typing studies (Nicolae et al., 2019; Voudouri et al., 2019; Talianu and Seibert, 2019; Mylonaki et al., 2021) and compared with other automated methods (Veselovskii et al., 2020; Srivastava et al., 2021; Li et al., 2022; Szczepanik et al., 2021; Wang et al., 2019; Siomos et al., 2020).
2.5 Photometer-Based Aerosol Typing
Column aerosol types are retrieved using AERONET Version 3 inversion products. Classification uses established threshold relationships between AOD, AE, developed by D'Almeida et al. (1991), Dubovik et al. (2002), and Toledano et al. (2007). This approach provides complementary information to lidar-derived layer typing.
2.6 FLEXPART Backward Simulations
In this study, to classify the aerosol source regions, a statistical analysis of FLEXPART “retro-plumes” (back-trajectories and emission source-receptor sensitivities) was performed. The FLEXPART model uses three-dimensional (3D) meteorological fields and solves the equations for transport, turbulent diffusions and other relevant processes in a Lagrangian framework. The vertical levels used in the FLEXPART follow a hybrid η coordinate system, which is much more efficient than pressure levels. The hybrid η coordinates follow the terrain near the ground and approach the pressure levels towards the top of the model, satisfying the lower boundary condition of a surface-parallel flow much more easily than pressure levels that do not follow the terrain (Stohl et al., 1998). To obtain the retro-plumes, the FLEXPART model version 10.4 (Pisso et al., 2019) was used, together with ERA5 reanalysis meteorological data (ERA5) provided by the European Centre for Medium-Range Meteorology (ECMWF). The ERA5 data was selected at the highest resolution provided by ECMWF (0.25° horizontal, 1 h temporal and 137 vertical model levels). Flex_extract v 7.1.2, an open-source tool developed for downloading and processing ECMWF meteorological data (Tipka et al., 2020) was used to retrieve the data from the Meteorological Archiving and Retrieval System (MARS). After retrieving the meteorological fields, both the vertical velocity in the hybrid η coordinates system and the approximate instantaneous fluxes from the accumulated flux data provided by ECMWF Integrated Forecast System (IFS) were calculated. Using the η coordinates system (similar to the original ECMWF model layers) for the resolved scale wind transport in FLEXPART, instead of interpolating to a coordinate system with fixed heights above the terrain, improve the accuracy of particle transport because the interpolation errors are reduced.
Estimation of the sources regions for each aerosol layer identified from NATALI, was obtained running FLEXPART in the backward mode for a simulation period of 240 h (10 d) starting at every 3 h, with an emitted particles history interval of 30 min. The receptor parameters are chosen as follows: longitude and latitude are given by the spatial coordinates of the RADO-Bucharest station where the lidar/photometer measurements were made and the altitude levels (bottom and top) are similar with the base and top of the aerosol layer determined from NATALI.
The choice of tracer used for the FLEXPART runs was made as follows: for the aerosol types dust, continental dust and mixed dust, the dust species defined in the FLEXDust software package (available at https://git.nilu.no/christine/flexdust, last access: 22 April 2025) were used as tracers (Groot Zwaaftink et al., 2016). For the rest of aerosols types, black carbon (defined as SOOT in OPAC) was used as tracer.
The first version of the Lagrangian particle dispersion model FLEXPART, developed in the mid-1990s, was meant to calculate the long-range and mesoscale dispersion of hazardous compounds from point sources, such as those discharged following a nuclear power plant accident (Stohl et al., 1998, 2005). Its applications have expanded to include a wide spectrum of atmospheric gases and aerosols, including greenhouse gases, short-lived climate forcers such as black carbon and volcanic ash, as well as the atmospheric branch of the water cycle. Given appropriate meteorological input data, it can be employed on scales ranging from dozens of meters to global. In particular, FLEXPART's inverse modeling based on source-receptor connections is commonly used. FLEXPART 10.4 improves performance, physicochemical parameterizations, input/output formats, and pre-processing and post-processing software. This version uses ECMWF Integrated Forecast System meteorological input data and data from the United States National Centers of Environmental Prediction (NCEP) Global Forecast System (GFS). To account for the vertical velocity distribution asymmetry (upward and downward air movements) and air density gradients in the convective boundary layer, a unique turbulence model was developed (Cassiani et al., 2015) and implemented in FLEXPART version 10.4. files Also, the wet deposition process of aerosols was completely revised in the FLEXPART version 10.4, by introducing 3D cloud water fields from meteorological input files into the parameterization of this process using the methodology described by Grythe et al. (2017). Starting with version 10.4, the gravitational settling parameterization and the calculation of dry deposition rates have been extended to non-spherical particles by considering particle shapes and different types of particle orientations to determine the drag coefficient Cd of a particle (Bagheri and Bonadonna, 2016; Tatsii et al., 2024). In the updated scheme, three options are defined for the orientation of a particle in the atmosphere: (i) random orientation; (ii) the particle's maximum projection area perpendicular to the vector of gravity, (corresponding to its maximum drag or horizontal orientation); or (iii) particle orientation corresponding to the average of the first two options.
Detailed information about the improvements made in FLEXPART version 10.4 and how they can be used in FLEXPART simulations can be found in the documentation about the Lagrangian particle dispersion model FLEXPART version 10.4. Backward simulation of atmospheric concentrations at receptor locations with FLEXPART helps understand lidar and photometer aerosol compositions at a site (Pisso et al., 2019).
3.1 Sun-sky/lunar photometer retrievals
The analysis of aerosol properties over the study period points to a stable, fine-mode dominated aerosol regime driven by regional continental and polluted sources. This consistent background is topped by distinct seasonal cycles in aerosol loading and episodic intrusions of coarse-mode aerosols.
The monthly time series analysis (Fig. 1) determines the primary characteristics of the aerosol environment. Although the AOD at 440 nm fluctuates, typically spanning a low range between approximately 0.05 and 0.40, the most significant insights lie in the accompanying microphysical indicators. The percentage of AE values above 1 is consistently high, frequently exceeding 80 %, and FMF is near-unity (generally oscillating between 0.80 and 1.00). This pairing provides robust evidence for a persistent, year-round dominance of fine-mode particles.
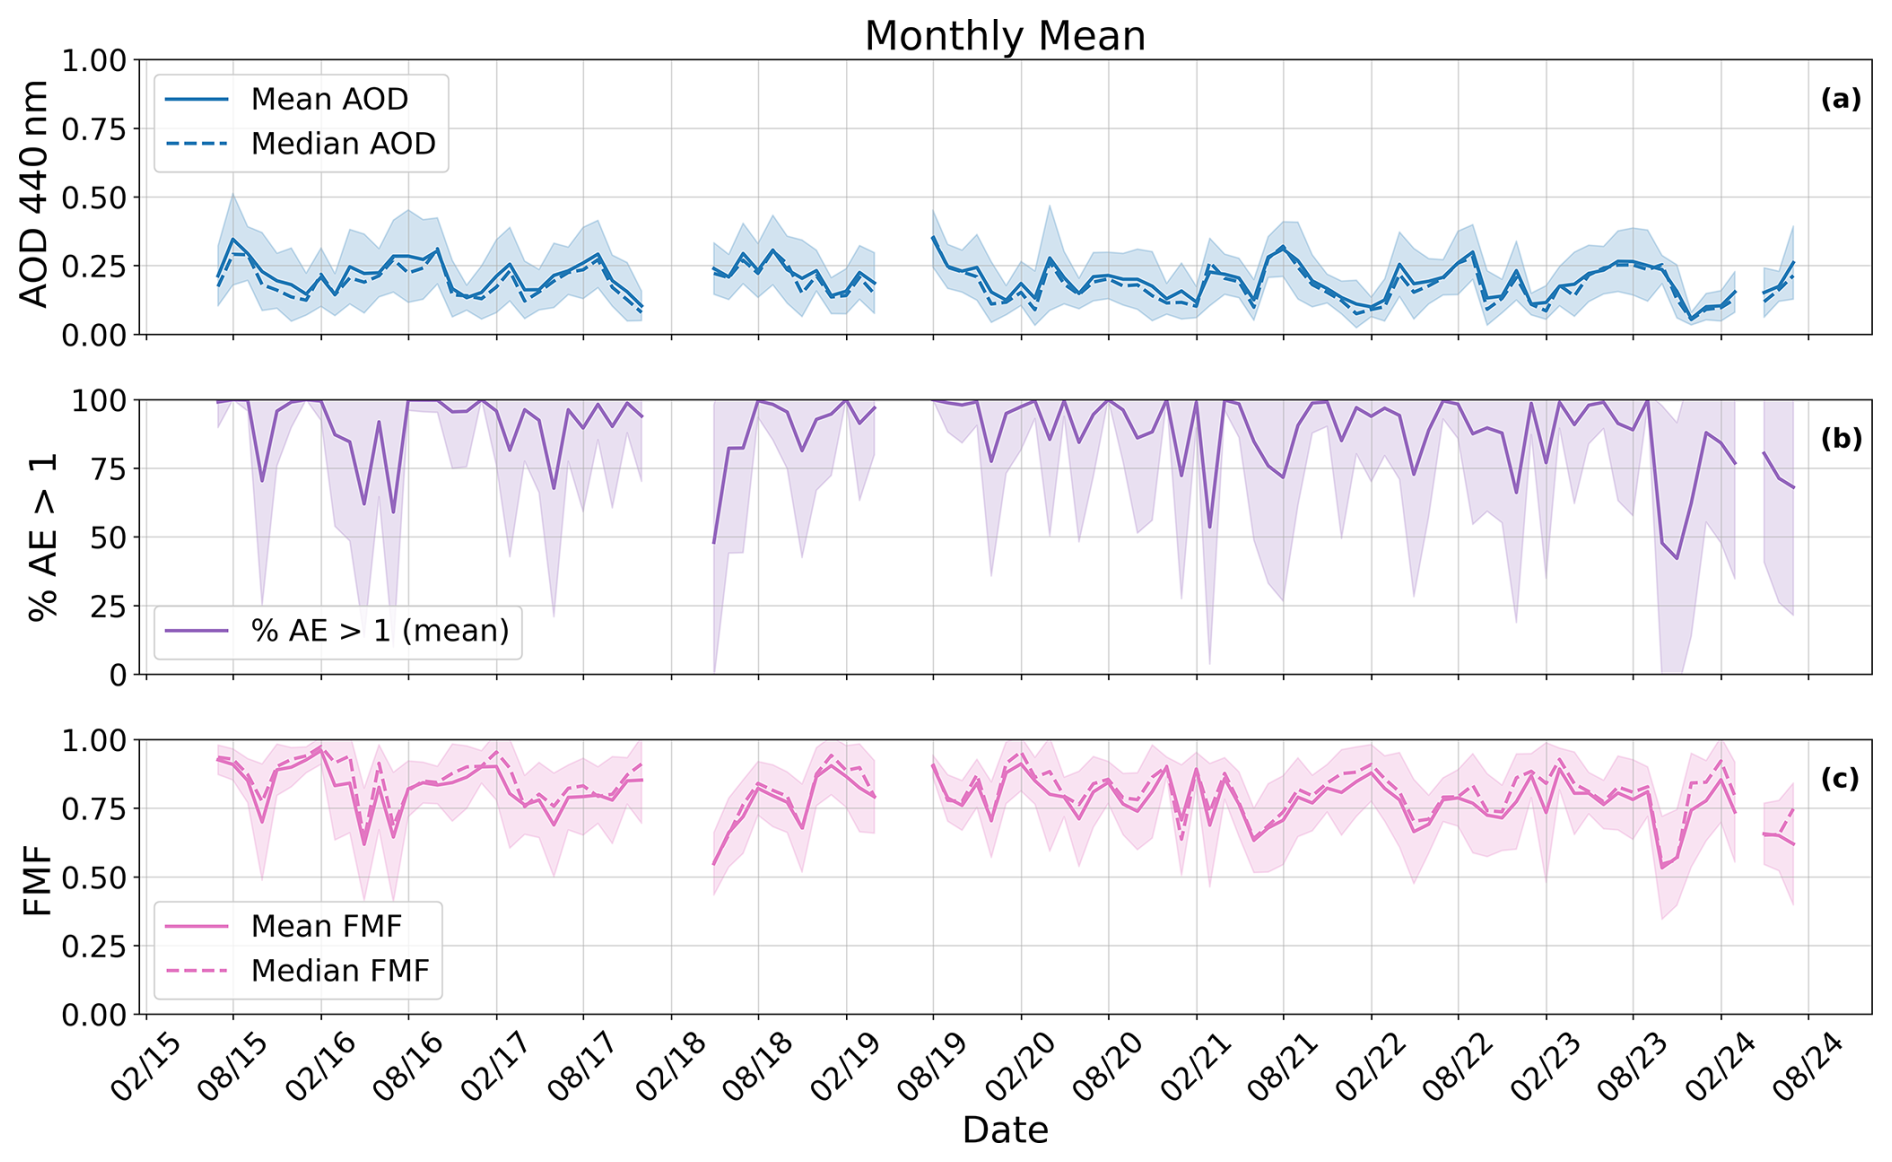
Figure 1Time series of monthly mean (solid line) and median (dashed line) values. Panel (a) displays the Aerosol Optical Depth (AOD) at 440 nm, indicating aerosol loading. Panel (b) displays the percentage of measurements where the Angstrom Exponent (AE) calculated between 440 and 870 nm is greater than 1. Panel (c) displays the Fine Mode Fraction (FMF) at 500 nm, representing the contribution of fine particles to the total AOD.
The seasonal violin plots (Fig. 2a, b, c) further refine this view. AOD exhibits a clear seasonal cycle, with median values and upper-range variability trending higher during the Summer and Fall months. In contrast, the distributions of the AE and FMF remain remarkably stable across all seasons and all years, with the majority of the AE values clustering tightly between 1.5 and 2.0. This stability confirms that the fine-mode nature is an inherent, year-round characteristic of the site's climatology.
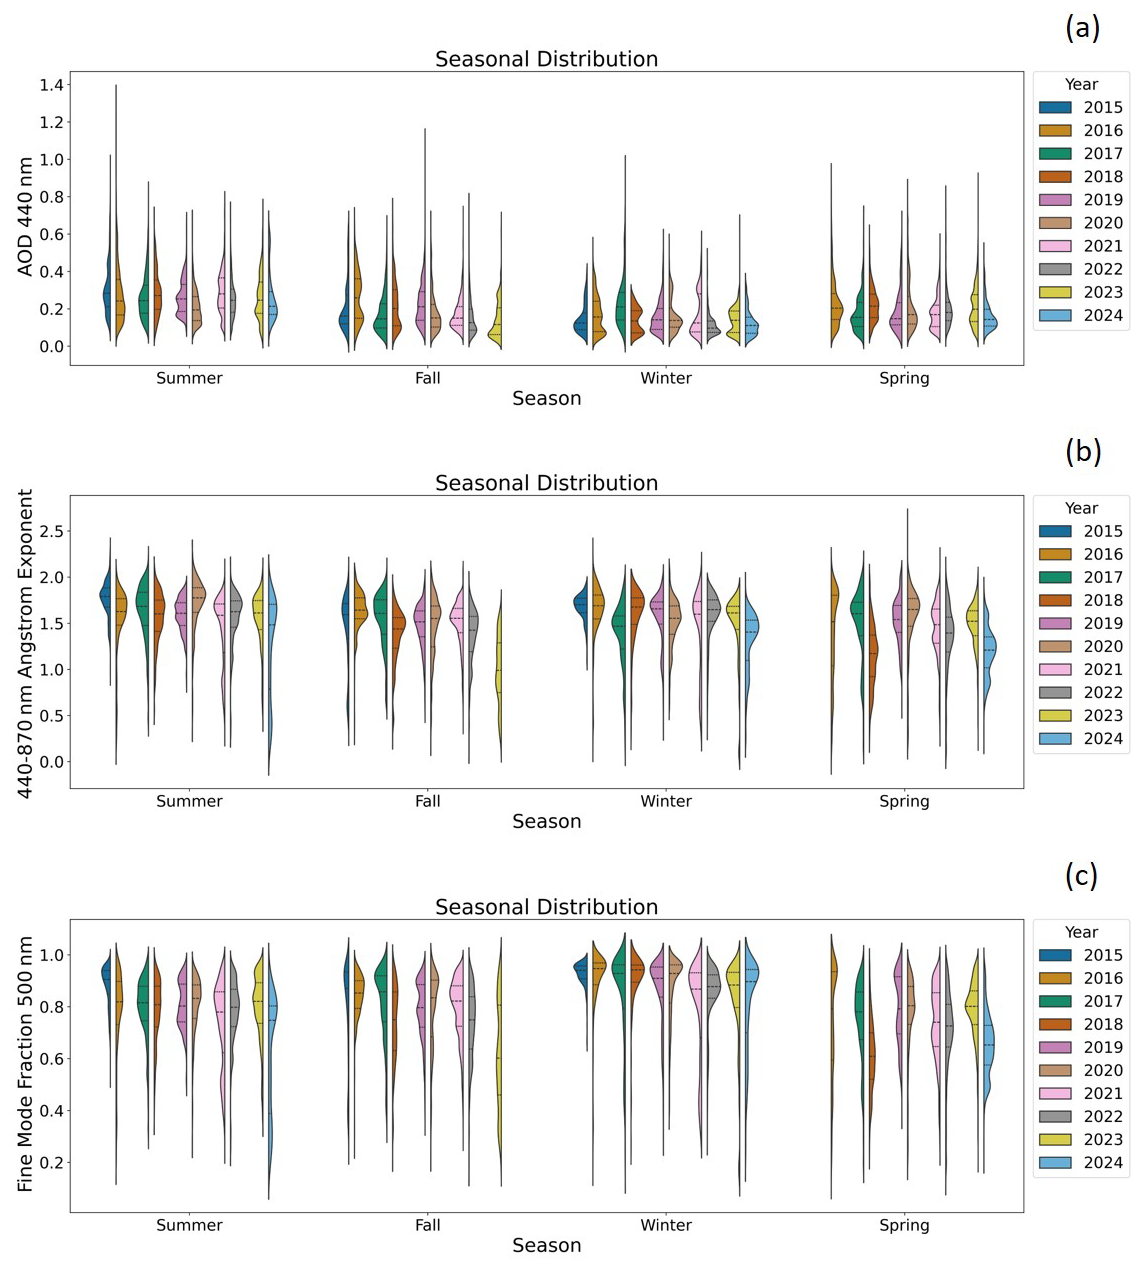
Figure 2Seasonal and inter-annual distribution of Aerosol Optical Depth at 440 nm (a), Angstrom Exponent (b), and Fine Mode Fraction (c). The violin plots illustrate the probability density function (distribution) of the measured values for each season and year. The width of the violin represents the density of the data points, where wider sections indicate more frequently observed values. The three dashed horizontal lines are as follows, in descending order from top to bottom: 75 % quartile, median, 25 % quartile.
The classification of aerosol types is based on the joint kernel density estimate of AOD and AE (Fig. 3), using a scheme that relies exclusively on optical properties and established threshold criteria consistent with AERONET-based methodologies (D'Almeida et al., 1991; Dubovik et al., 2002; Toledano et al., 2007). It is important to reiterate that the resulting clusters represent dominant optical signatures of complex, mixed, and atmospherically aged aerosol populations characteristic of a continental region, rather than chemically pure aerosol types (Giles et al., 2012). For clarity and conciseness, the detailed aerosol classification scheme and extended statistical tables are provided in Supplement S1 (Tables S1–S4).
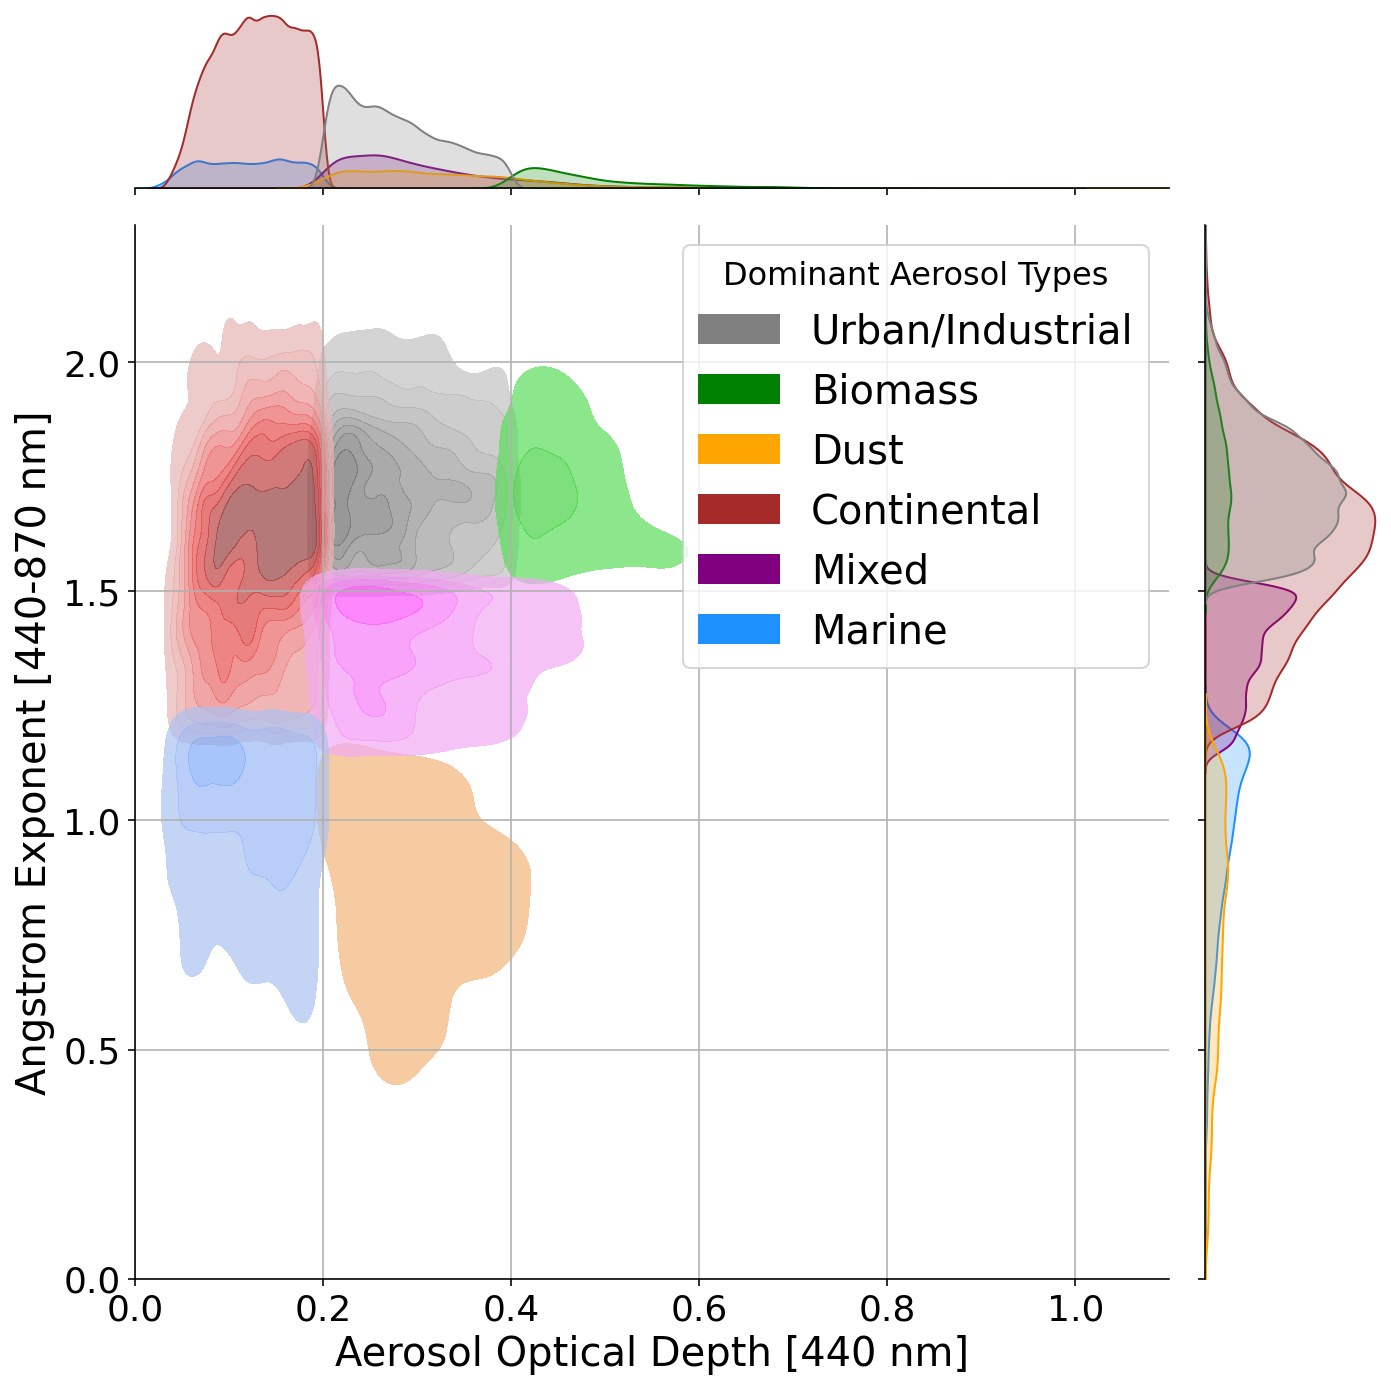
Figure 3Aerosol typing based on the joint probability density of AOD and AE. The 2D contour plot shows the relationship between AOD (x axis, aerosol loading) and AE (y axis, particle size). The density contours (colored regions) identify the dominant aerosol regimes: Urban/Industrial, Biomass, Continental, Mixed are fine-mode dominant, while Dust and Marine are coarse-mode dominant. The marginal distributions (top and right) show the density of AOD and AE values independently.
The fine-mode clusters form the densest grouping within the high-AE domain (AE > 1.0), identifying the prevalent Urban/Industrial (AE > 1.3) and Continental (AE ∼ 1.0–1.3) regimes. The Urban/Industrial type generally reflects localized or urban fine-mode anthropogenic aerosols, whereas the Continental type corresponds to the broader regional background composed of aged fine particles.
The coarse-mode clusters include Dust and Marine aerosols, which occupy the low-AE region and represent cases where coarse-mode components (AE < 1.15 for Dust-dominant conditions) optically dominate the atmospheric column. In this classification, the “Marine” label reflects an optically derived coarse-mode signature rather than chemically verified sea-salt aerosol, and may also represent weak dust, humidified coarse particles, or other coarse-mode mixtures that fall within the Marine optical boundaries. Instances of Dust and Marine aerosols occurring at AE values higher than those typically associated with pure types (AE < 0.5 for pure dust) arise from mixing between these coarse particles and fine-mode continental aerosols during long-range transport (Mamouri and Ansmann, 2014). The measurements reflect the entire atmospheric column, not just a single, isolated aerosol layer. Consequently, the measured AE is a weighted average of all particles present, making the influence of the prevalent fine-mode background (Continental, Urban/Industrial) unavoidable in episodes of coarse-mode transport (Eck et al., 2008; O'Neill et al., 2001). Such mixed optical signatures are common in this region, consistent with previous observations of Saharan dust intrusions over Romania, where AE values frequently range between ∼ 0.8 and 1.3 (Cazacu et al., 2015a; Ştefănie et al., 2023a).
The analysis of dominant aerosol types by month (Fig. 4) reveals seasonal patterns in source influence at the site. The Continental aerosol type stands out as the most consistent and widespread contributor during the Fall and Winter months, reflecting its role as a stable fine-mode background. This seasonal increase is likely driven by regionally persistent pollution episodes and meteorological conditions that favor the accumulation of aged continental aerosols.
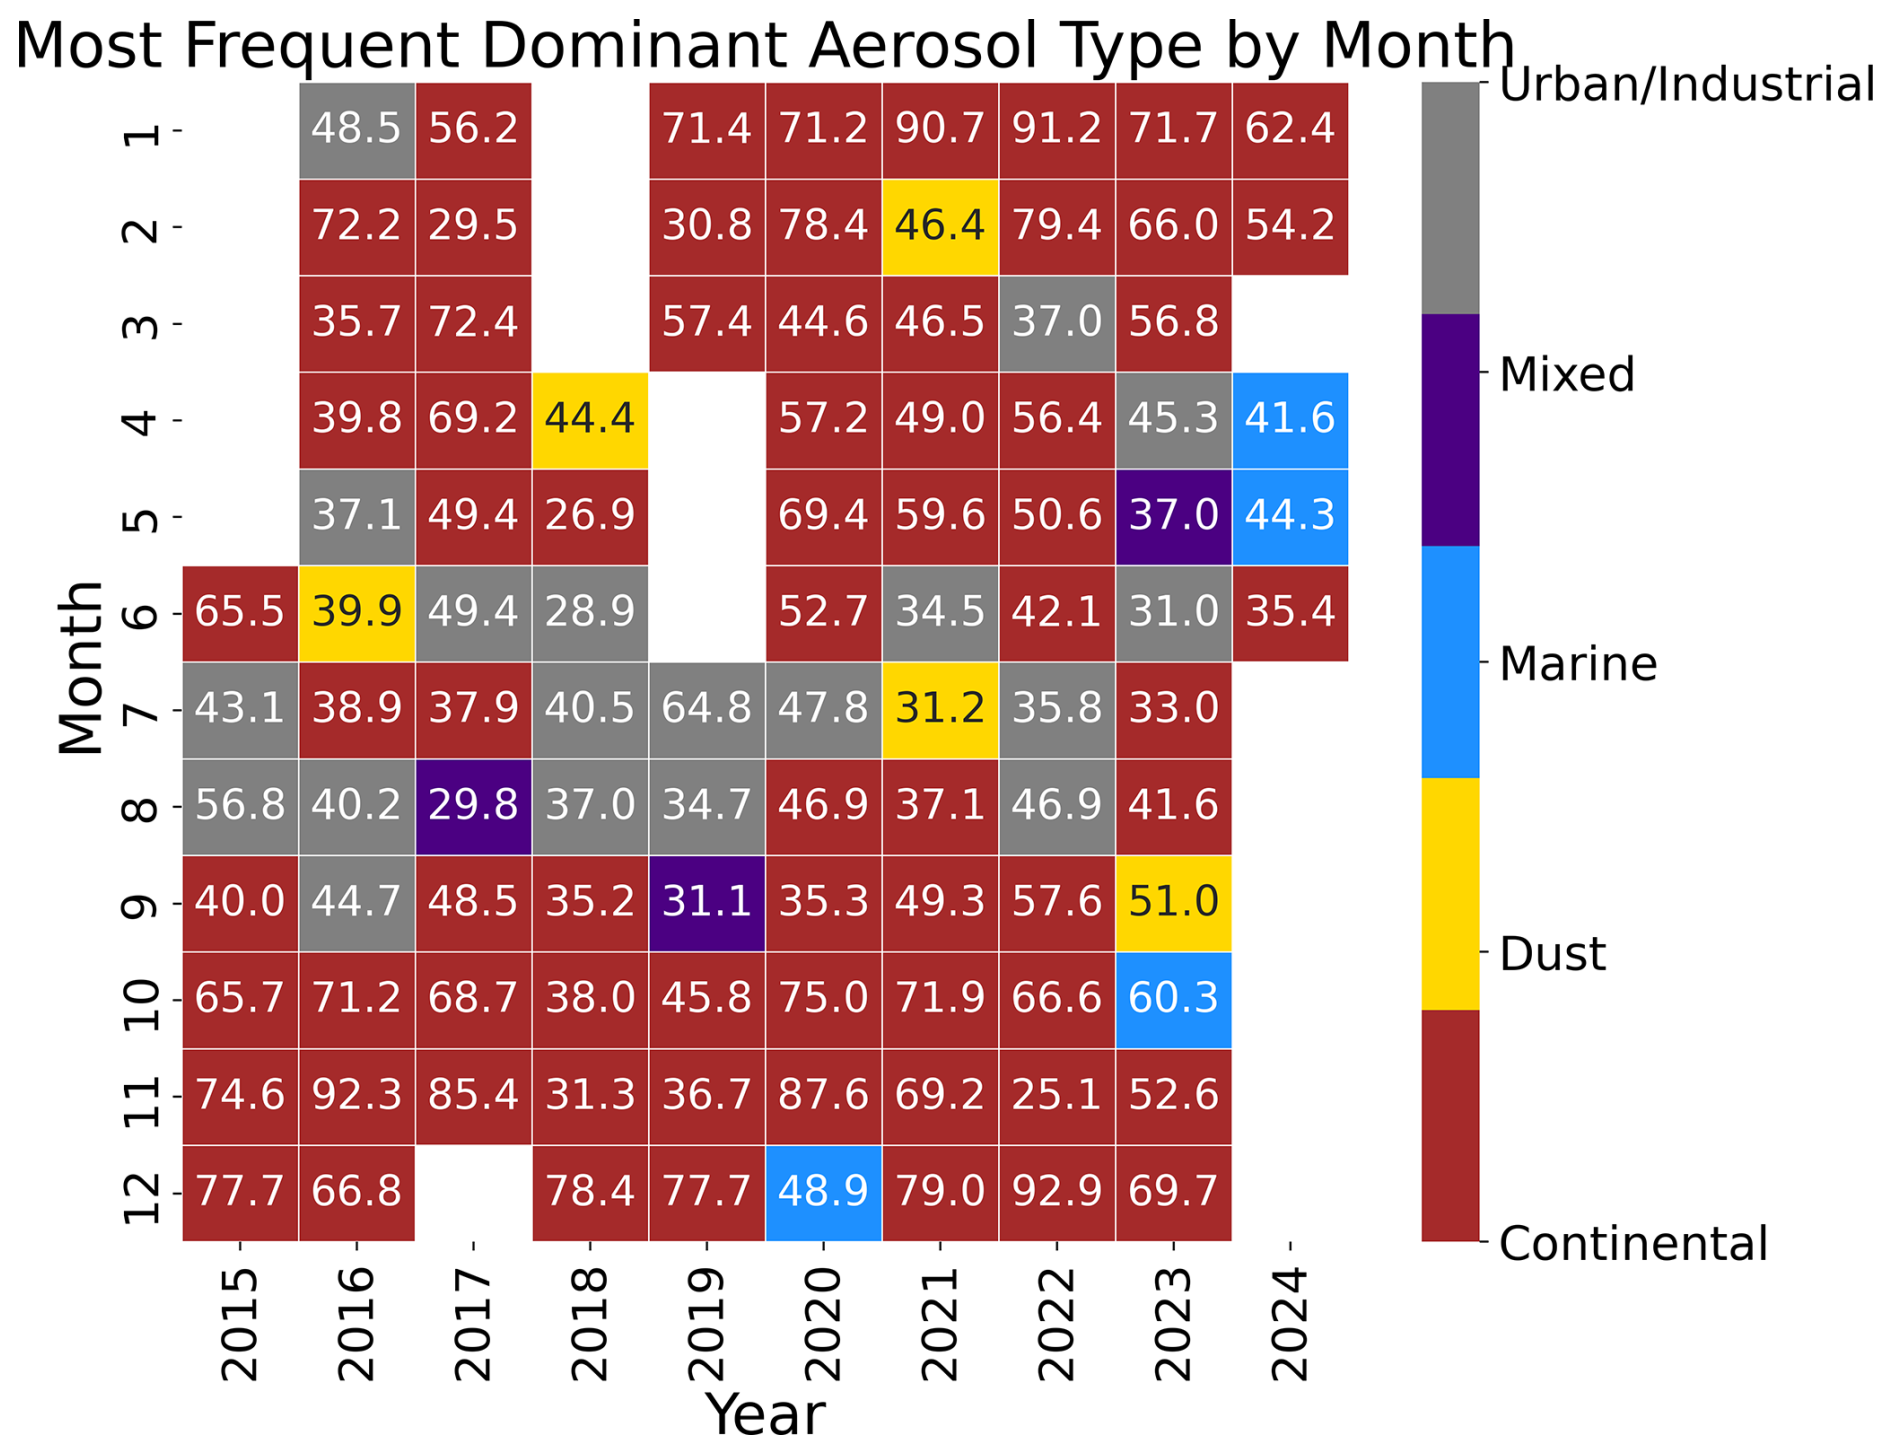
Figure 4The heatmap displays the most statistically dominant aerosol type determined for each calendar month (y axis) and year (x axis) based on the classification presented in Fig. 3. The color coding corresponds to the aerosol type, and the numerical value within each cell indicates the percentage frequency of the dominant type during the month. White spaces indicate months with insufficient or no data.
The day-to-day distribution of dominant aerosol types (Fig. 5) highlights the episodic character of coarse-mode transport. While the Continental type forms the baseline state, the figure displays short, distinct sequences of Dust (yellow) and Marine (blue) dominance, illustrating their intermittent arrival. These coarse-mode episodes peak during the Spring and Summer months, consistent with the climatology of regional atmospheric circulation. Spring is particularly favorable for Saharan dust outbreaks, while Summer and early Autumn often exhibit higher biomass burning influence. However, because this influence is more episodic, it does not appear clearly in the monthly representation (Fig. 4). The pronounced Dust dominance during Spring (Fig. 4) strongly supports the seasonal transport mechanisms expected for this region.
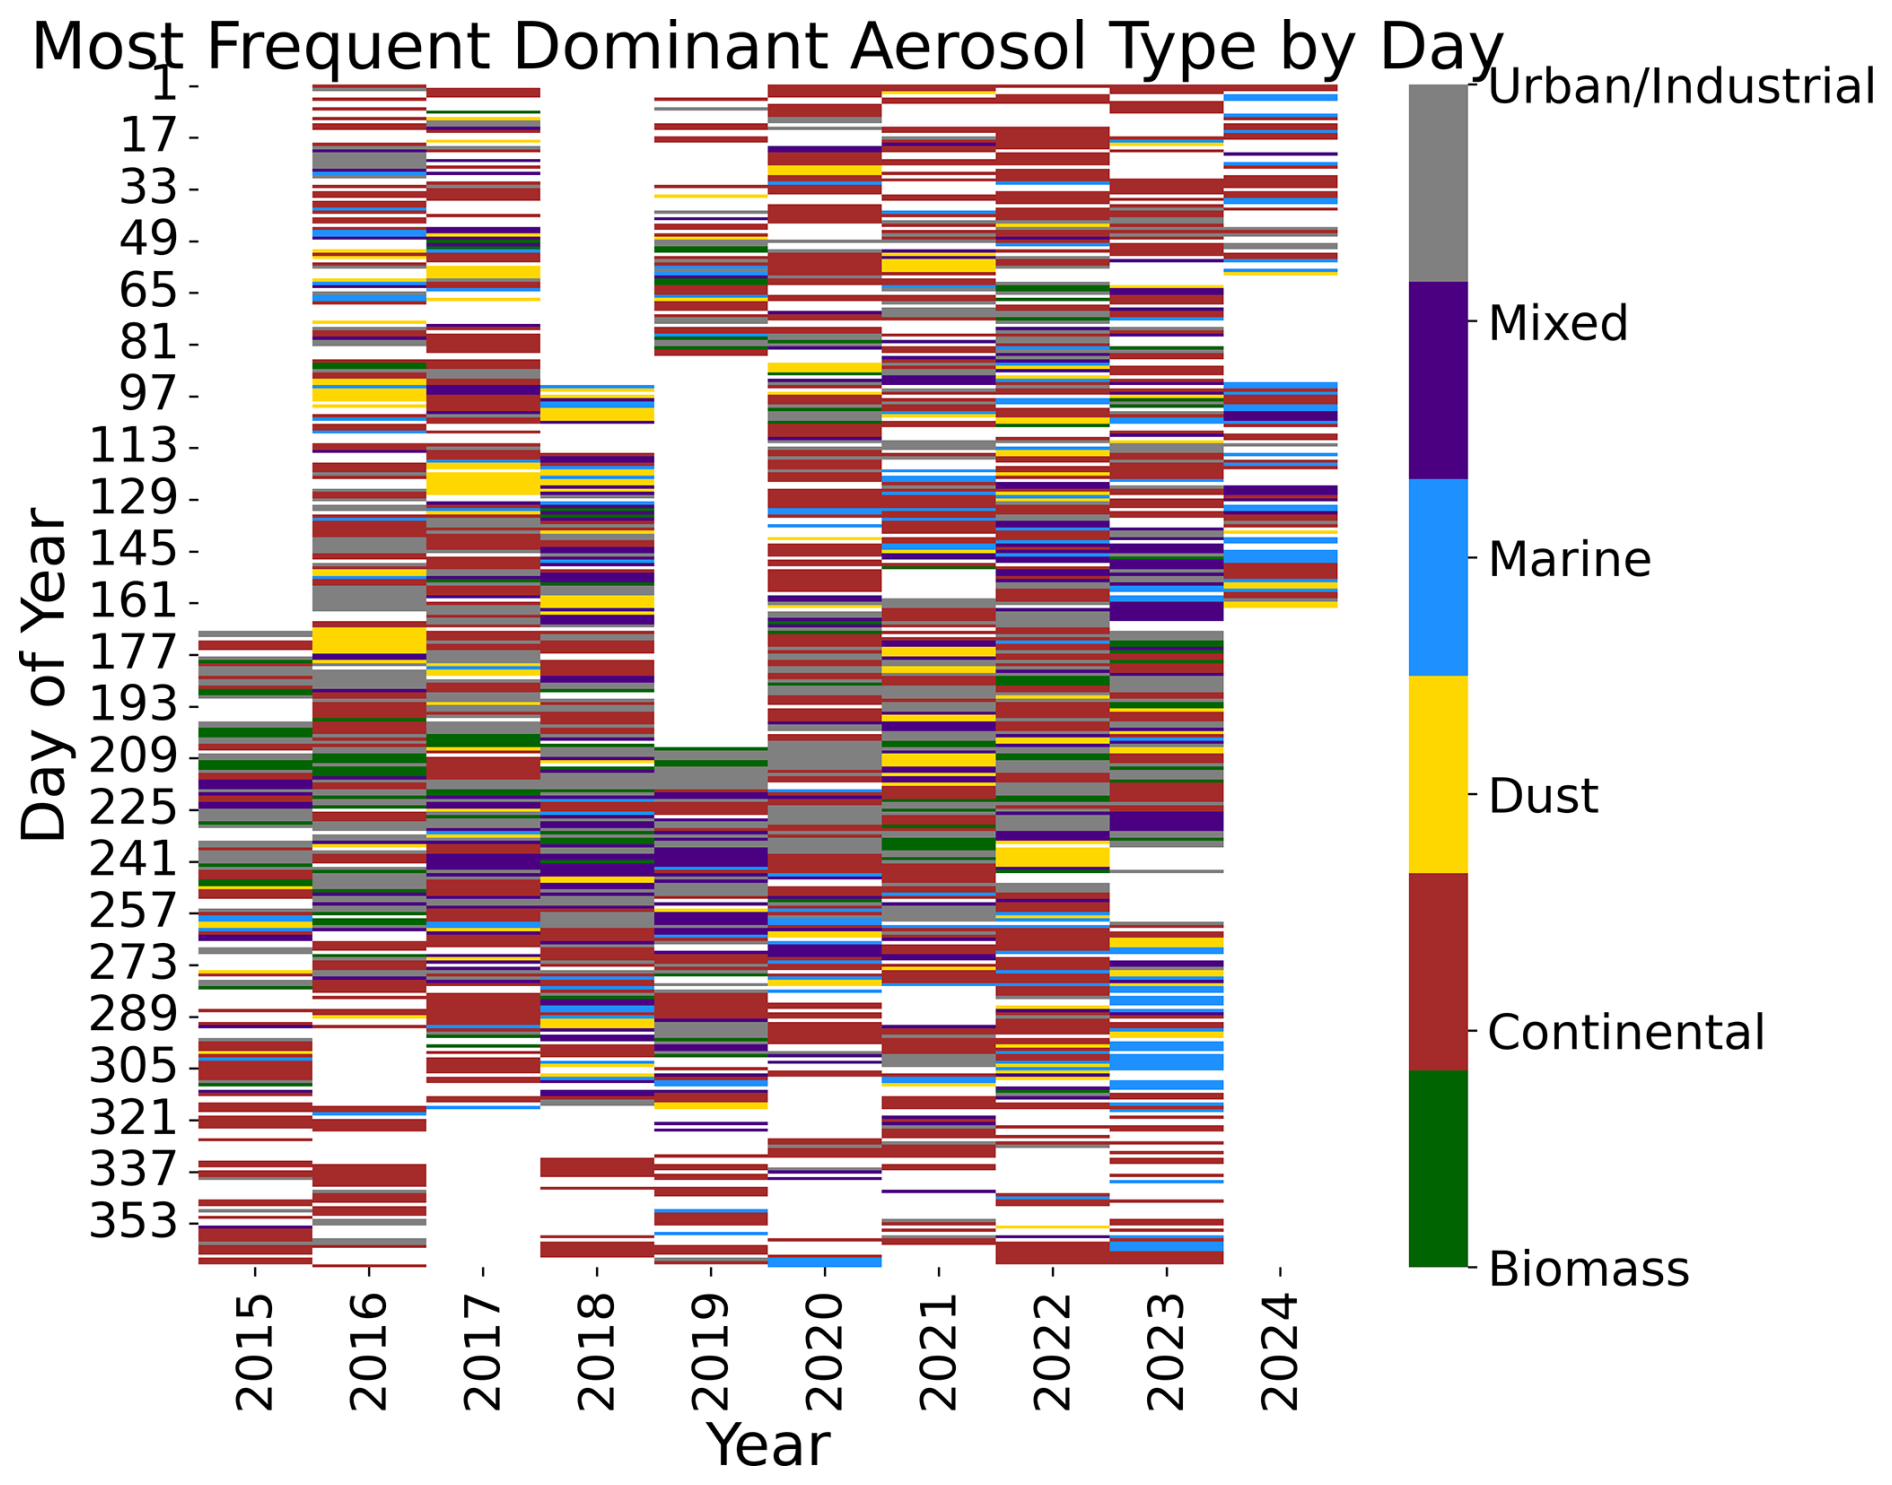
Figure 5The heatmap shows the dominant aerosol type for each recorded day (y axis: Day of Year, 1 to 365) over the entire measurement period (x axis: Year). The color coding corresponds to the aerosol type. White months indicate days with no valid measurement.
Both figures also highlight the persistent presence of the Mixed aerosol type (AE < 1.0), which appears throughout the observational period. This mixed signature reflects the complex vertical and horizontal structure of the aerosol column in a continental region, where multiple sources frequently overlap. Additionally, the sporadic appearance of high-AE Urban/Industrial dominance, particularly visible in the early months of 2016 and 2018, indicates periods of intensified local anthropogenic activity temporarily surpassing the broader continental background.
3.2 Multiwavelength lidar retrievals
3.2.1 Predominant aerosol types
The optical data products obtained from the multiwavelength Raman lidar, including backscatter coefficient profiles at 1064, 532, and 355 nm, extinction coefficient profiles at 532 and 355 nm, and linear particle depolarization ratio profile at 532 nm, were processed using the Single Calculus Chain. Level 2 processed data (which have passed all the quality assurance criteria) were then downloaded from the EARLINET-ACTRIS data portal and used as input for NATALI (Nicolae et al., 2024). The aerosol layers were classified as either low or high troposphere based on the altitude of the layer boundaries. In the following, “low troposphere” (LT) means the first identified layer closest to the ground, having the bottom above the minimum product height but below the climatological height of the Planetary Boundary Layer (PBL). Minimum product height represents the altitude above which the optical products (backscatter and extinction coefficients) are all valid, i.e. above the full overlap of the instrument (maximum for all channels), so that the intensive parameters can be quantified. The minimum product height for the placement of RADO-Bucharest is 500 m, while the maximum height for the first layer bottom (calculated as the climatological PBL height) is 1300 m. Furthermore, a stringent limitation has been imposed on the upper boundary of the layers in the lower troposphere, requiring them to be situated no higher than 3000 m above sea level. This implies that thick layers, even if their lower boundary is below the typical height of the planetary boundary layer, are not taken into account in the lower troposphere. The term “high troposphere” (HT) refers to all the layers that are located above the first layer, or if no first layer, the ones above 3000 m sea level. Particles created locally are typically carried by layers in the low troposphere. Layers situated in the upper troposphere are regarded as fully disconnected from the Earth's surface and have the potential to contain particles that have been transported across long distances. For each layer identified in the low and in the high troposphere, we have calculated the layer-mean aerosol intensive parameters, i.e. extinction (AE) and backscatter (CI) related Ångström coefficients, lidar ratios (LR) and linear particle depolarization ratio (DEP).
Figure 6 presents the distribution, central tendency, and spread of the aerosol extinction related Ångström coefficient at 355 to 532 nm (panel a), and of the lidar ratio at 355 nm (panel b), as they are characterizing low troposphere (LT) and High troposphere (HT).
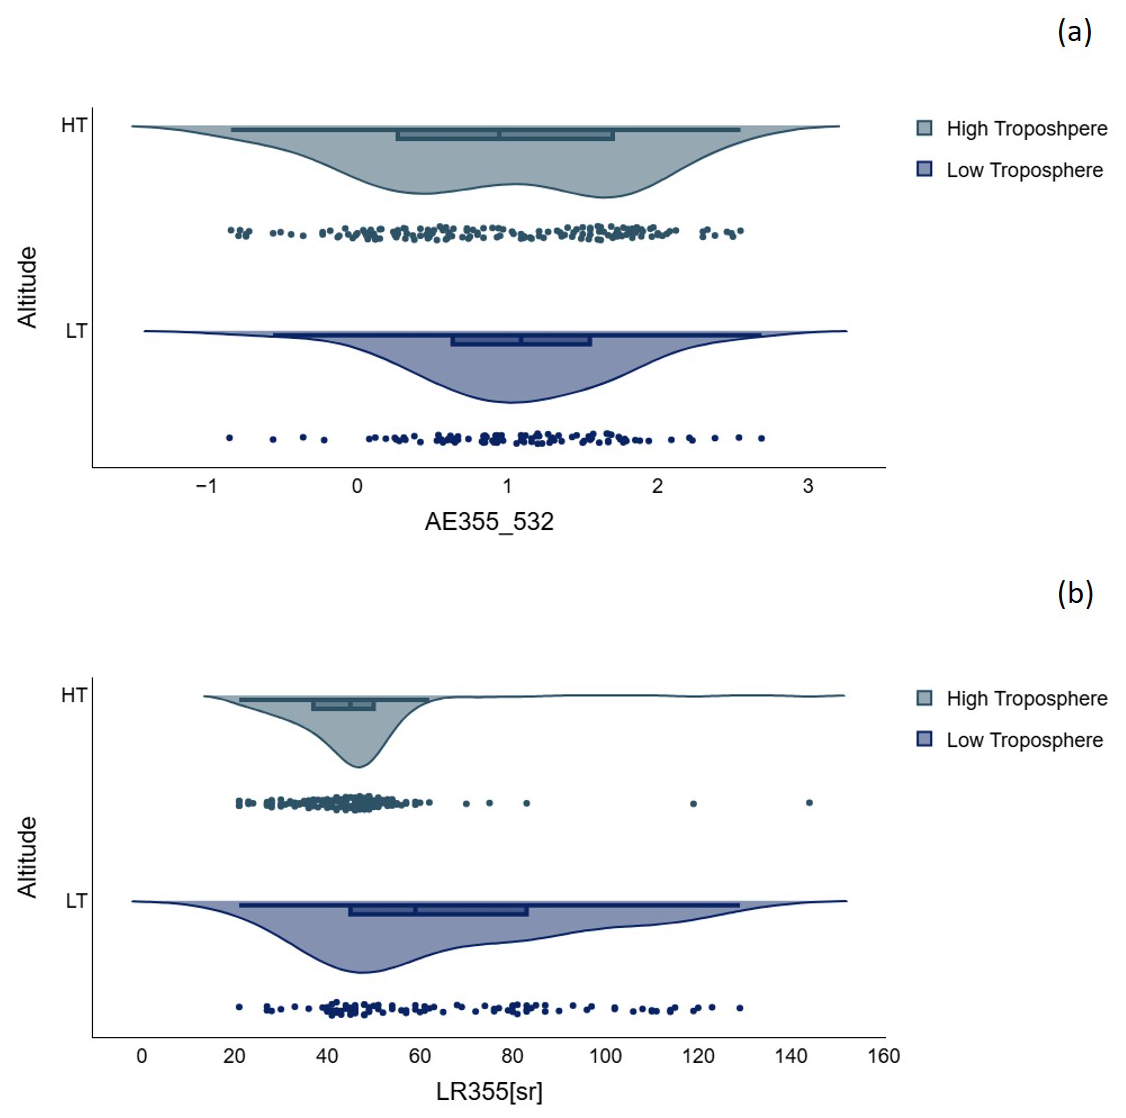
Figure 6Distribution, central tendency, and spread of the aerosol optical properties for both low troposphere (LT) and high troposphere (HT): extinction related Ångström coefficient (a); lidar ratio at 355 nm (b).
We observe that in the low troposphere (LT) the extinction related Ångström coefficient has a mono-modal aspect of the distribution and a peak around 0.9. It means that particles closer to the ground are medium-sized, and their dimension is almost uniformly spread around the median, although slightly skewed towards larger particles. In the high troposphere, the distribution of the extinction related Ångström coefficient has a bi-modal aspect, with peaks around 1.8 and 0.3 respectively. This indicates alternative presence of small and large particles, small particles having higher frequency. The analysis of the lidar ratio values shows that in the low troposphere the extinction-to-scattering properties of aerosols varies significantly, with a distribution peak around 48 sr. Although the majority of layers are composed of medium absorbing particles, the distribution is very wide, indicating that there are also many layers of highly absorbing aerosols, characterized by lidar ratio values above 70 sr. The peak of the lidar ratio distribution at 355 nm in the high troposphere is very similar, 49 sr, however the spread of the values is much lower, indicating that medium absorbing particles are usually transported by the lofted layers.
Next, we analyzed the aerosol types as retrieved by NATALI in high and low resolution (Fig. 7). The overall correspondence between aerosol types in high resolution and the predominant types in low resolution is shown Fig. 7a. As explained in the methodology section, the predominant aerosol types (from left to right in the graph) may be accompanied by traces of other types (from up down in the graph), in total amount of maximum 50 %. For example, NATALI identifies as predominant aerosol type “dust” if the neural networks agree that in more than 50 % of the cluster points (random combinations of aerosol intensive parameters considering the whole uncertainty interval) the values points towards “dust”, while for the rest of the cluster points the neural networks may indicate, “continental” or “mineral mixtures” (in low resolution), or in addition “mixed dust”, “coastal”, “continental dust”, “dust polluted” or “volcanic” (in high resolution). For the 63 aerosol layers for which the calibrated linear particle depolarization was available in the RADO-Bucharest lidar datafiles, we have analyzed the correspondence between aerosol types in high resolution and the predominant types in low resolution, both being provided in the NATALI output file.
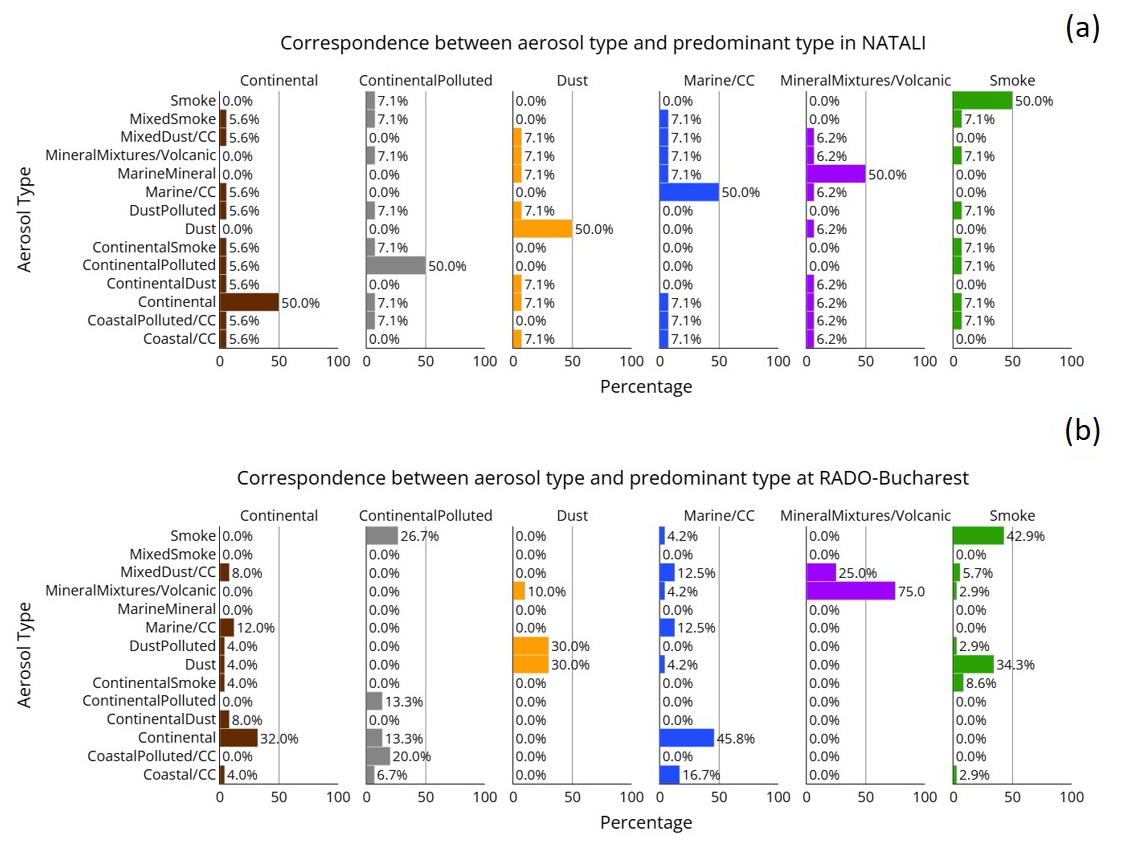
Figure 7Correspondence between the aerosol types retrieved in high resolution mode and the predominant aerosol type retrieved in low resolution mode: general correspondence in NATALI (a); correspondence as retrieved at RADO-Bucharest (b).
The results show that at our location mixtures of various aerosol types are generally present. Dust is frequently mixed with smoke or industrial (identified as “dust polluted” in high resolution), continental is predominant but accompanied by small percentages of dusty mixtures (“continental dust”, “dust polluted”) or smoke mixtures (“continental smoke”). Mineral mixtures contain, as expected, dust and marine (“mixed dust”), smoke is accompanied by mixtures of smoke with continental and dust (“continental smoke”, “mixed smoke”, “dust polluted”), and marine is identified when is mixed with dust (“mixed dust”). In some of the cases in low resolution, NATALI seems to attribute “marine or cloud corrupted” to continental type as identified in high resolution. Also, distinguishing continental polluted from smoke seems to be difficult in low resolution because the spectral characteristics are very similar.
Based on the cross-check between the low and high resolution typing of the 63 layers we conclude that the statistical analysis of the 229 low resolution typing can be done with a high degree of confidence, even though a small part of the “marine or cloud corrupted” cases may be in fact “continental”, and a part of the “smoke” cases may be in fact “continental polluted”.
Our long-term analysis shows that aerosol layers over South East Romania are rarely composed of a single dominant type and are instead characterized by frequent mixtures of continental, smoke, and dust components. This persistent mixing reflects the geographical position of the region, which is influenced simultaneously by local anthropogenic emissions, agricultural burning, and episodic transport from the Sahara and Eastern Europe. Compared to other European locations, the RADO-Bucharest site shows a higher prevalence of mixed continental–smoke layers in the lower troposphere and more frequent dust–smoke combinations at mid altitudes, indicating that biomass burning plumes arriving from Eastern Europe often interact with advected mineral dust. These mixed signatures are well captured by NATALI, with high resolution classifications clearly identifying combinations such as dust polluted, continental smoke, and mixed dust, which are not as frequent at sites dominated by either dust (southern Europe) or pollution (central and western Europe) alone. The difficulty in distinguishing continental polluted from smoke in low resolution also reflects the regional dominance of fine mode combustion aerosols, which share similar spectral properties. Overall, the classification patterns reveal that Eastern European aerosol at this site is defined not by a single type but by recurrent mixtures driven by simultaneous influence of local emissions, agricultural fires, and intermittent dust transport.
Figure 8 presents the altitude at which the various predominant aerosol types arrive at RADO-Bucharest (panel a) and the frequency of appearance (calculated as the ratio between the number of cases of a certain type and the total number of cases) (panel b).
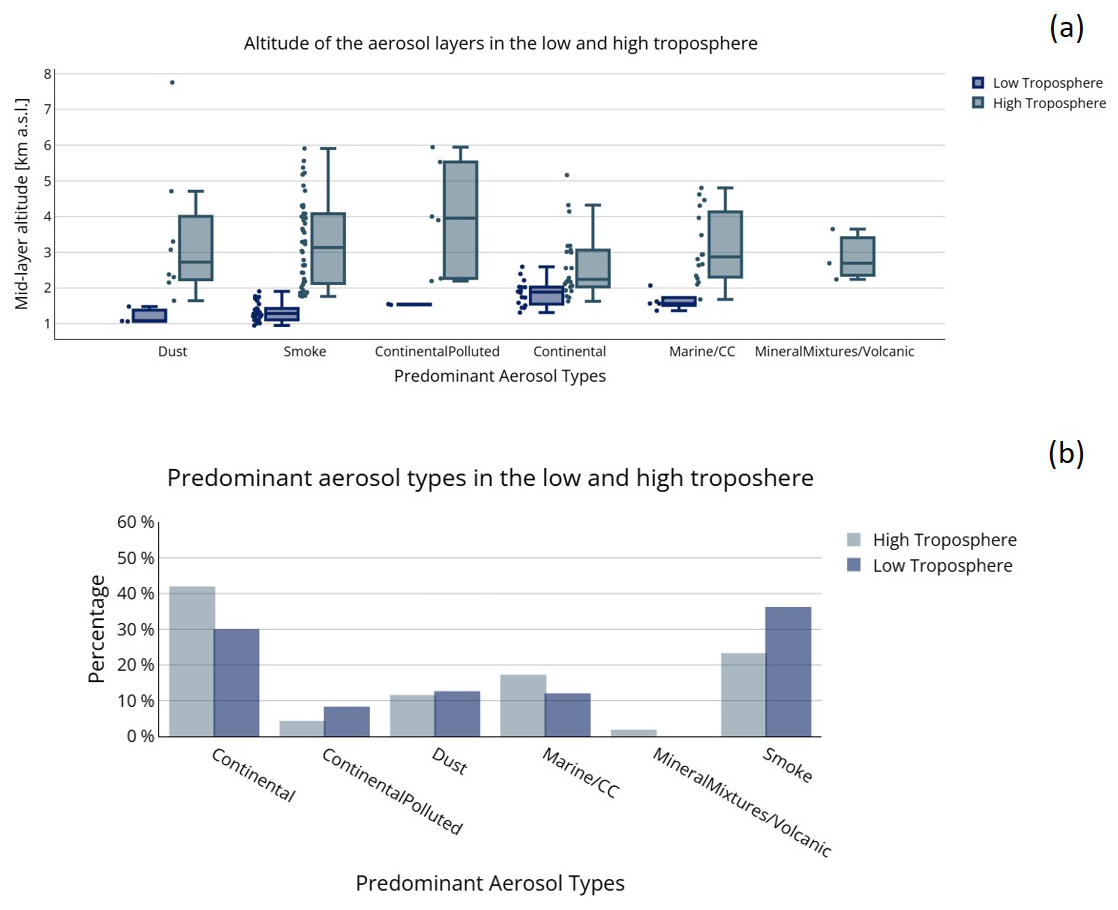
Figure 8Altitude distribution (a) and frequency of appearance (b) of various aerosol predominant aerosol types.
One can note that continental and smoke aerosols are predominant at the location, with smoke more present in the low troposphere. Continental polluted and smoke particles are often observed at low altitudes (1–2 km), with several cases of long range transported biomass burning arriving at higher altitudes (3–4 km). Dust particles are detected less often, and are two kinds: soil dust observed in the PBL (around 1 km altitude), and mineral dust transported from desert regions arriving at higher altitudes (2–8 km). Marine and mineral mixtures are sometimes detected around 2 km altitude. Part of these layers may be due to long-range transported mineral dust crossing over the Black Sea or Mediterranean Sea, part may be due to incomplete cloud screening.
Figure 9 presents the distribution of the predominant aerosol types over seasons, in the low (bottom panel a) and high troposphere (panel b).
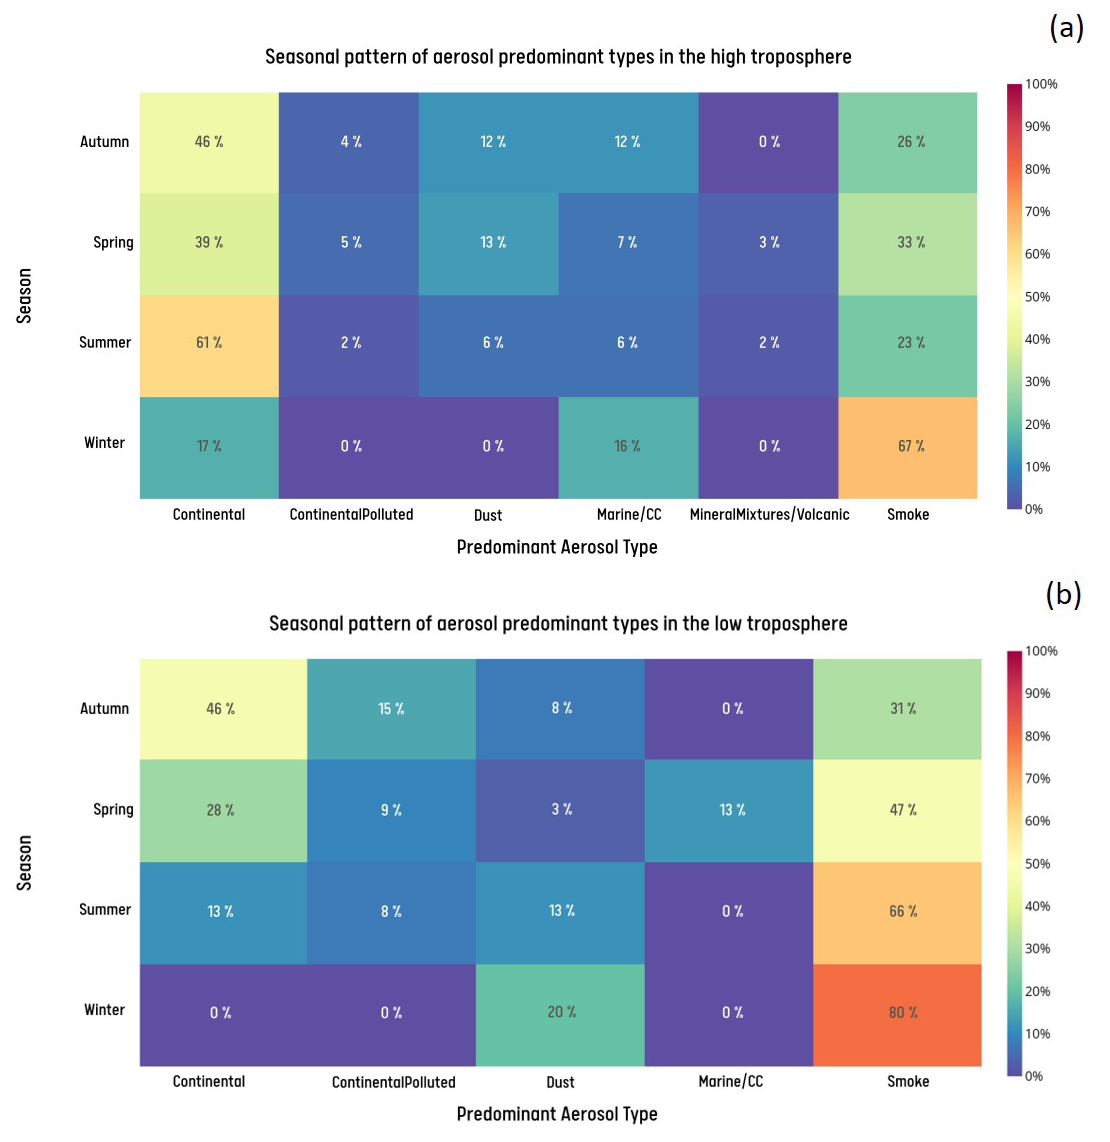
Figure 9Frequency of predominant aerosol types in the high troposphere (a) and the low troposphere (b) at RADO Bucharest. Numerical value within each cell indicates the percentage frequency of the dominant type during the season
In the low troposphere smoke is present all seasons with a higher frequency during winter (residential heating), spring and summer (burning of agricultural fields before sowing and after harvesting). Continental polluted particles are also present all seasons except winter, which may be related to the wrong attribution of the type in low resolution, some of the smoke cases during winter time being probably in fact continental pollution. Dust is detected in the low troposphere especially during summer and winter, when more intense winds are lifting soil particles from the nearby roads and agricultural fields. During spring and autumn wet deposition plays a role in removing the soil dust from the atmosphere. In the high troposphere smoke is detected especially during winter, spring and summer, in relation to vegetation fires in Russia, Ukraine and Greece and favorable circulations. Dust is observed mostly during spring when air mass transport from North Africa is frequent. During autumn and summer, the high troposphere above our station is cleaner, continental aerosols being predominant.
3.2.2 Discussion within the frame of other EARLINET results
Aerosol typing plays a central role in advancing current scientific efforts within EARLINET community (https://www.earlinet.org, last access: 1 April 2025). Over the last 25 years an extensive number of papers have been published using EARLINET data base (providing aerosol profiling data on a continental scale), and some of them have been focused on aerosol layer classification (e.g. del Águila et al., 2025; Mylonaki et al., 2021; Papagiannopoulos et al., 2018).
Del Águila et al. (2025) uses machine learning (ML) models for aerosol typing using high-resolution EARLINET data and is currently trained with data from the University of Granada (UGR) station in Spain, which means that it is primarily designed for the specific aerosol types present in this region. A comparative assessment of the Granada and RADO-Bucharest datasets reveals distinct region-specific aerosol signatures. For example, the higher dust depolarization ratios reported in del Águila et al. (2025) (∼ 0.25–0.30) contrast with the generally lower values found at our site, reflecting Eastern Europe's less frequent direct dust intrusions and the predominance of mixed or partially aged layers. Our work broadens the geographical coverage of high-resolution aerosol-type climatology and offers a foundation for future ML-based classification efforts and for harmonizing lidar-type databases across Europe.
A comparison of the intensive optical properties retrieved in our study with those reported by Mylonaki et al. (2021) reveals both methodological consistency and regional variability across Europe. In their analysis of multiwavelength lidar observations from four EARLINET stations, including Bucharest, Mylonaki et al. (2021) reported dust depolarization ratios typically exceeding 0.25, smoke depolarization ratios in the range 0.02–0.08, and continental/urban aerosols exhibiting very low depolarization (< 0.05). Our decade-long RADO-Bucharest dataset shows a similar pattern for smoke and continental aerosols; however, dust depolarization values in our climatology are generally lower than 0.20, reflecting the less frequent and more diluted Saharan dust intrusions that reach south-eastern Romania compared to western and southern Europe. In terms of lidar ratio, Mylonaki et al. (2021) reported dust LR values around 40–50 sr, smoke LR values frequently exceeding 60 sr, and polluted/continental LR values between 45 and 55 sr. Long-term observations show a dominant LR mode at 48–49 sr across both altitude regimes, with only episodic increases above 70 sr during biomass-burning events – indicating that strongly absorbing smoke layers are less common in the regional transport climatology of Eastern Europe. Similar differences emerge in the Ångström exponent: whereas Mylonaki et al. (2021) found AE values for smoke typically > 1.5 and for dust < 0.5, our dataset displays a bi-modal AE distribution in the high troposphere, with peaks near 1.8 and 0.3, but a mono-modal distribution (peak > 0.9) in the lower troposphere driven by mixed and regionally aged aerosols. Together, these contrasts highlight the stronger influence of mixed continental pollution at RADO-Bucharest and the comparatively weaker imprint of “pure” dust and fresh biomass-burning aerosol types relative to the stations analyzed by Mylonaki et al. (2021), underscoring the role of regional source regimes and transport pathways in shaping aerosol optical properties across Europe.
Floutsi et al. (2024) presents a data collection (DeLiAn) of intensive optical properties of several aerosol types, as measured by ground based lidars. Apart from campaign measurements, data from four permanent EARLINET stations have significantly contributed to this extensive study. The stations are mainly located in Europe: Leipzig (Germany), Évora (Portugal) and Warsaw (Poland). Our long-term Eastern-European dataset complements the global coverage of DeLiAn, helping to fill a geographical gap (Eastern Europe less sampled) – which is scientifically valuable.
3.2.3 Fresh and aged smoke
Long-range transported biomass burning aerosols (smoke) and their variation with atmospheric evolution (ageing) have been extensively studied during the last years using lidar measurements (e.g. Adam et al., 2020; Janicka et al., 2023). To distinguish between fresh and aged smoke we have been using the ratio of lidar (extinction-to-backscatter) ratios (LR532/LR355). It has been observed that this changes rapidly from values < 1 for fresh to > 1 for aged particles (Nicolae et al., 2013).
Figure 10 presents the distribution, central tendency, and spread of several lidar-derived intensive optical properties used to characterize fresh and aged smoke: (a) altitude, (b) linear particle depolarization ratio at 532 nm, (c) extinction-related Ångström exponent (AE), and (d) lidar ratio (LR) at 355 nm. Together, these panels provide a consistent physical picture linking smoke ageing to transport altitude, aerosol morphology, and optical signatures.
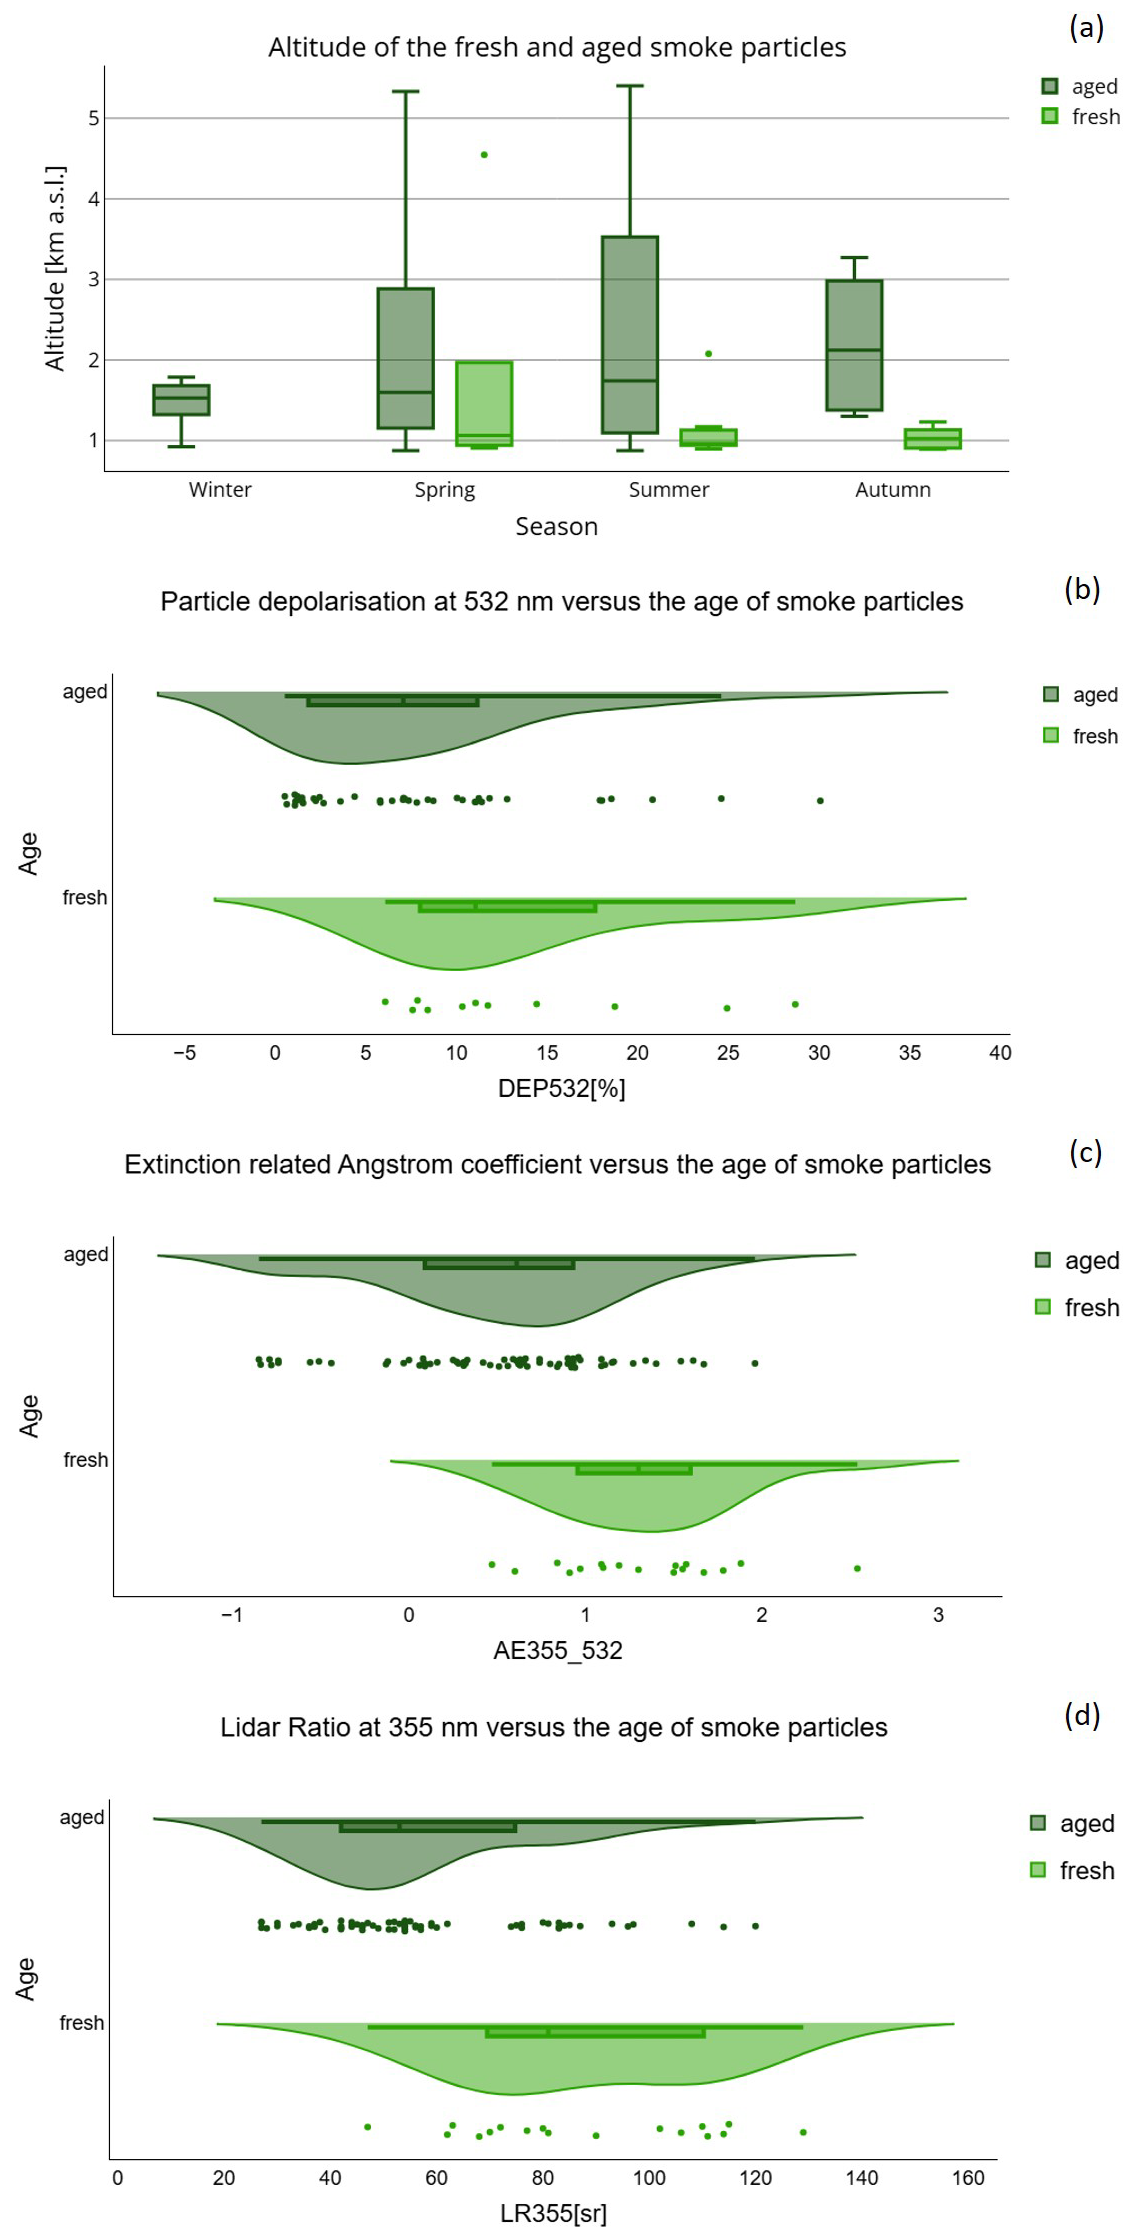
Figure 10Distribution, central tendency, and spread of the fresh and aged smoke characteristics: altitude of the smoke layers (a); linear particle depolarisation at 532 nm (b); extinction related Ångström coefficient (c); lidar ratio at 355 nm (d).
Figure 10a illustrates clear seasonal differences in the vertical distribution of fresh biomass burning aerosol layers. During spring, the detected layers extend to substantially higher altitudes, reaching up to 2 km, while in summer and autumn the maximum heights are noticeably lower. Despite this contrast in upper extent, the median layer height remains close to 1 km for all three seasons. For winter, fresh smoke cases are largely absent, most likely because unfavorable weather conditions (persistent low clouds and overcast skies) frequently prevented lidar observations, rather than because such aerosol events did not occur.
For aged smoke particles, the vertical distribution shows a clear contrast between winter and the other seasons. During winter, the aged aerosol layers remain more confined, typically not exceeding 2 km, whereas in spring, summer, and autumn the layers extend higher, reaching 3 km and up to about 3.5 km in summer. This pattern suggests that in winter the planetary boundary layer constrains the vertical mixing of aged smoke, keeping the aerosol trapped in the lower part of the atmosphere, while in the warmer seasons deeper boundary layers allow the layers to ascend to higher altitudes.
Figure 10b presents the distribution of fresh and aged smoke particles as a function of the particle depolarization ratio at 532 nm. For the RADO-Bucharest site, aged smoke typically exhibits depolarization values between 0 % and 15 %, with only a few isolated cases exceeding this range. Fresh smoke shows a narrower distribution, with most values constrained between 5 % and 15 %. This behavior is consistent with the expected microphysical evolution of biomass burning aerosols, where aging processes generally reduce particle asphericity and broaden the variability of the depolarization signal.
Figure 10d presents the distribution of fresh and aged smoke particles as a function of the 355 nm lidar ratio, revealing a bimodal behavior for both aerosol types. Fresh smoke shows two distinct clusters, with LR values predominantly occurring in the range 60 to 80 sr and a second group above 100 sr. A similar pattern is observed for aged smoke, although the lower LR cluster shifts toward smaller values, approximately 27 to 60 sr, while the upper cluster remains above about 75 sr. The presence of these two clusters for both fresh and aged cases suggests the influence of at least two major smoke sources affecting the region, each characterized by distinct optical properties.
A comparison of the intensive optical properties retrieved in our study with those reported by Ansmann et al. (2021) further supports the interpretation of aged smoke signatures over south-eastern Europe. Ansmann et al. (2021) and references within, found that lidar ratios measured at 355 nm were mostly around 75 ± 25 sr for fresh smoke and 55 ± 20 sr for aged smoke, low to moderate depolarization ratios (δ ≈ 5 %–15 %), and Ångström exponents typically exceeding 1.5 shortly after emission but decreasing substantially with atmospheric ageing (Fig. 10c). In our decade-long dataset, aged smoke layers exhibit moderate lidar ratios around 45–55 sr (Fig. 10d), δ values in the range 6 %–10 % (Fig. 10b), and an AE distribution with a peak near 1.8 for fresh smoke and near 0.8 for the aged one (Fig. 10c). These values are consistent with aged, regionally transported smoke but generally fall below the optical extremes observed in major transcontinental plume events analyzed by Ansmann et al. (2021). This contrast reflects the different source regimes: while their study captures exceptional long-range transport across hemispheres, our observations document more frequent but less optically intense smoke layers associated with intra-European or Eurasian biomass burning.
3.3 FLEXPART simulations
3.3.1 Synoptic conditions
Due to Romania's geographical position on the globe and within the European continent, the climate zone is transitional temperate-continental, characterized by warm summers, cold winters and two short transitional seasons, spring and autumn. The circulation of air masses in Romania is dominated by westerly winds from the Atlantic, but is also influenced by air masses from the east, north (cold and humid), and south (warm and dry or humid, depending on the direction).
To summarize, the climate in Romania is controlled by four main types of air circulation (Vaduva, 2008):
-
Western circulation: which represents approximately 45 % of the total number of cases in a year. This type of circulation manifests itself when a high-pressure field is established in the southern part of Europe, and low-pressure fields are established in the north. In this baric context, the circulation is western, bringing Atlantic air masses, usually humid.
-
Polar circulation: occurs when the Azores anticyclone expands northward due to a contraction of the Icelandic cyclone, which is also moving northward. Furthermore, this circulation occurs when the Scandinavian anticyclone acts over Scandinavia. Under these conditions, a circulation occurs from north-northwest to south-southeast.
-
Tropical circulation: occurs when low-pressure baric formations in southern Europe attract warm air masses from over North Africa towards the center. This circulation has two particularities:
-
Southeasterly circulation, when warm air penetrates over the Mediterranean Sea. This type of circulation is prominent in southern and southwestern Romania.
-
Southeasterly circulation in Asia Minor that occurs under the action of the Arabian cyclone.
-
-
Blocking circulation: it is established when a high-pressure field acts over Western and Central Europe, which prevents the penetration of cyclonic disturbances from over the Atlantic or Mediterranean. In winter, the blocking circulation also assumes the stability of East European air masses, characteristic of the Russian-Siberian anticyclone.
3.3.2 FLEXPART retro-plumes analysis
To distinguish between the influence of local and long-range transport in the FLEXPART analysis, the retro-plumes trajectories (corresponding to altitude levels from 500 m to 8.0 km) were split into the two clusters (LT and HT) using the threshold value of 1.3 km, altitude corresponding to the climatological mean value of the PBL. This value was selected to ensure consistency in the analysis of data obtained from lidar and photometer measurements with data obtained from FLEXPART. Moreover, this threshold value is high enough to avoid surface friction and terrain/topography effects in the area where the RADO-Bucharest station is located, but low enough to capture important meteorological patterns such as the presence of low-level clouds, wind changes and moisture transport.
Taking into account this complexity of the synoptic context in Romania, the potential sources of aerosols observed in lidar measurements performed at RADO-Bucharest station were classified as follows:
- 1.
Sources that contribute to the aerosol budget at a given location and are distributed in a single region. In this category, following sources were defined: Europe (whole continent), North Africa (Algeria, Egypt, Libya, Morocco, Sudan and Tunisia), Sahara (West Sahara, Mali, Niger, Chad and Mauritania), Middle East (Arabic Peninsula, Iran and Iraq), North America (Canada and USA), and Siberia.
- 2.
Sources that contribute almost equal to the aerosol budget at a given location and are distributed in two or more regions (e.g. Sahara and Europe). These were called “Mixed” sources.
The distribution of regions with aerosol sources is shown in Fig. 11 while the distribution of sources by season and by the two clusters obtained from FLEXPART analysis is shown in Fig. 12.
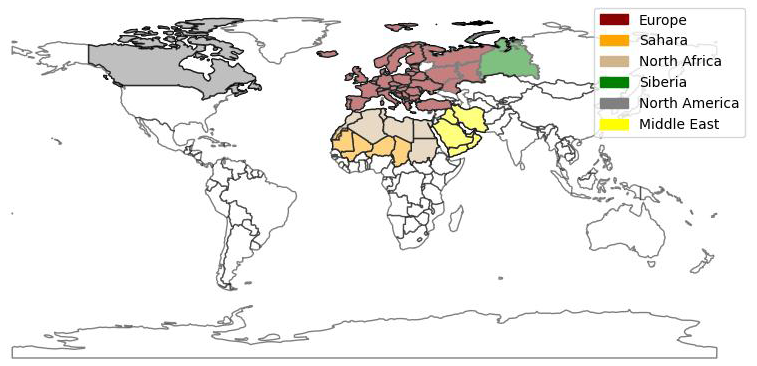
Figure 11Mask of regions with potential sources of aerosols that could be observed in the atmosphere at the RADO-Bucharest station.
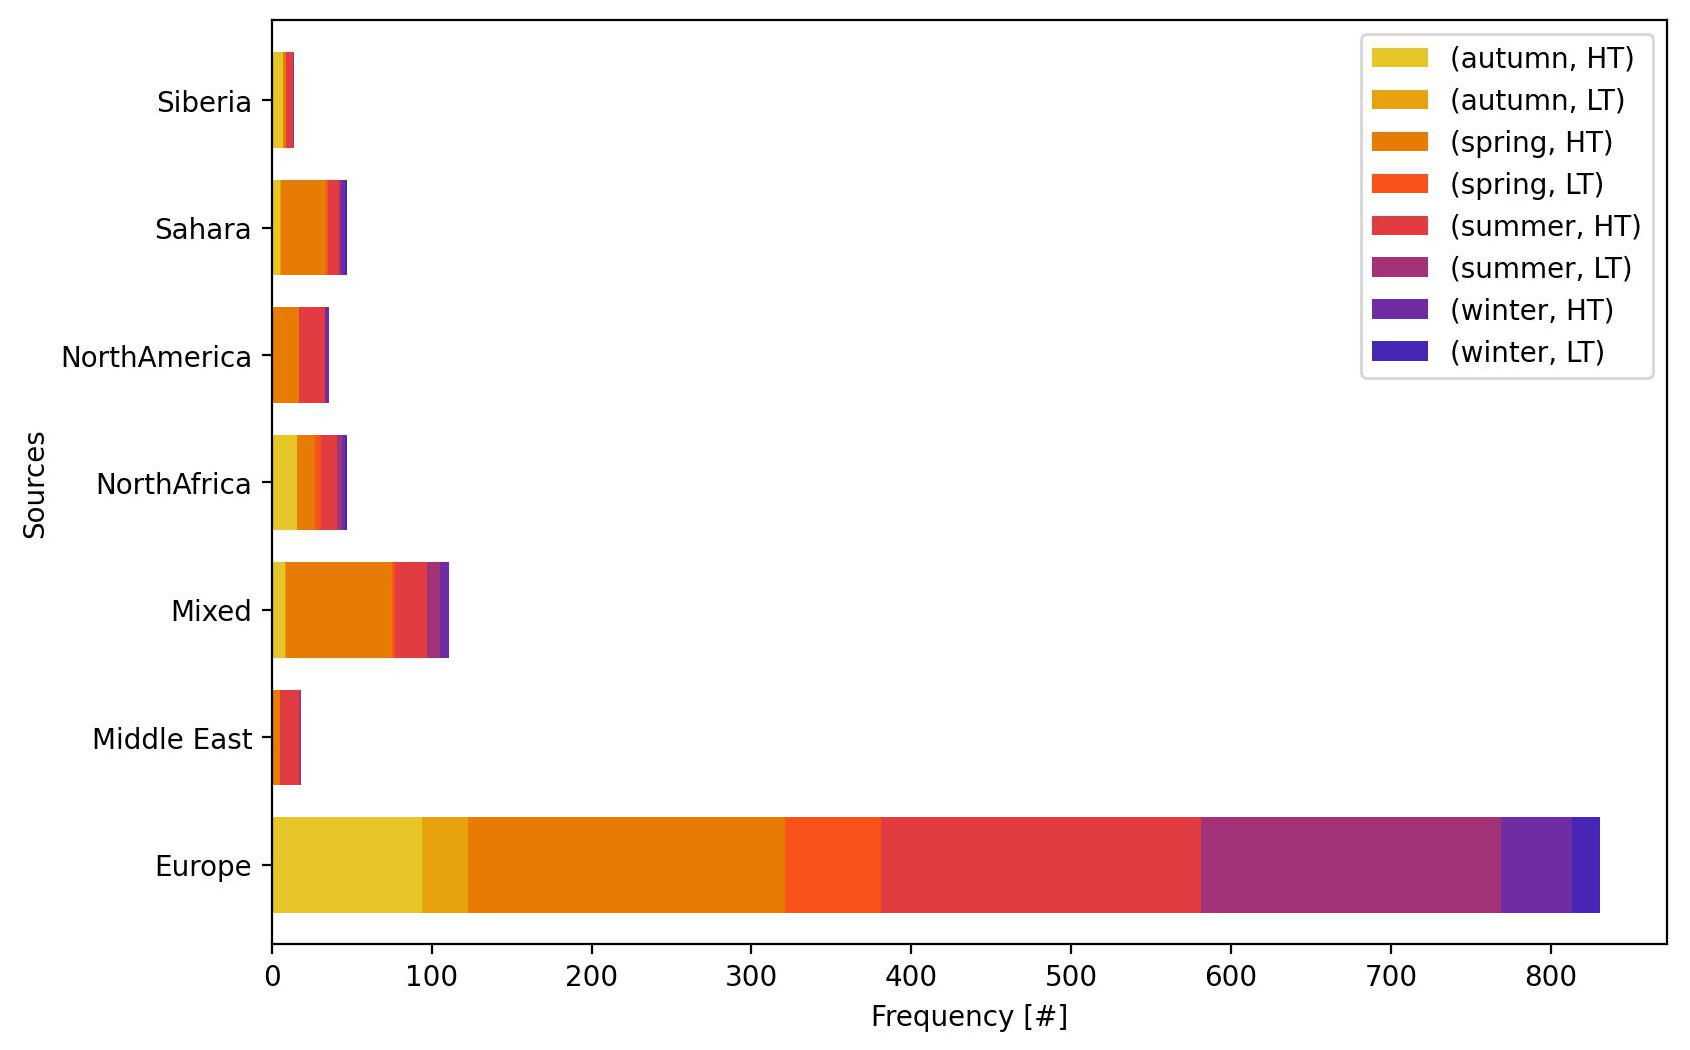
Figure 12The distribution of sources by season and by the LT and HT regions obtained from FLEXPART retro-plumes analysis.
As can be seen from Fig. 12, of the total sources associated with aerosol layers identified from lidar measurements throughout the atmospheric column during the analyzed period, Europe is the main source (74 %, of which 26 % in LT and 48 % in HT) for all seasons. This is followed by “mixed” sources (13 %) which contributed to the aerosol budget observed especially in the spring (62 %) and summer (25 %) seasons. The contribution of sources located very far from the observation point, such as the Sahara, North Africa, Middle East or North America, is poorly represented in the LT (< 2 % from total sources) and becomes significant in the aerosol layers observed in the HT (12 % from total sources). However, in an anticyclonic type of circulation when air masses descend from the upper troposphere and reach the land surface, aerosols transported over medium- to long-distances can be observed in the LT and/or can mixed with the aerosols from PBL. In LT, aerosol sources distributed across Europe can be frequently observed (65 %). The sources vary depending on different wind regimes at local scales and anthropogenic activities.
The variability of the sources of aerosols transported over long distances (e.g. dust from the Sahara and the Middle East or biomass burning aerosols from North America, North Africa and Europe), observed in HT is due to the location of the RADO-Bucharest station (in the south-eastern part of Romania) where the circulation of air masses is much more complex, presenting a transitional character, in the sense that the western influences are doubled by a southern circulation, frequently of a tropical nature, but also with transitional elements between Mediterranean influences in the southwest and continental ones in the east.
To summarize, FLEXPART retro-plumes analysis indicates contributions from:
-
Sahara in spring, and Middle East in summer, consistent with lidar-observed dust layers (high depolarization ratio);
-
Europe in all seasons, and North Africa, North America and Siberia in summer, consistent with lidar-observed smoke layers (low depolarization ratio);
-
Europe in autumn and winter seasons, consistent with lidar-observed smoke layers (low depolarization ratio);
-
Europe in winter, consistent with lidar-observed smoke layers (low depolarization ratio) and dust layers (high depolarization).
In the Supplement (S2) are presented in tabular form the distribution (in %) by season in the entire air column and in the two altitude classes (LT and HT) of the regions with sources associated with the types of aerosols observed in the lidar and photometer measurements for the analyzed period (Supplement S2, Tables S5–S7).
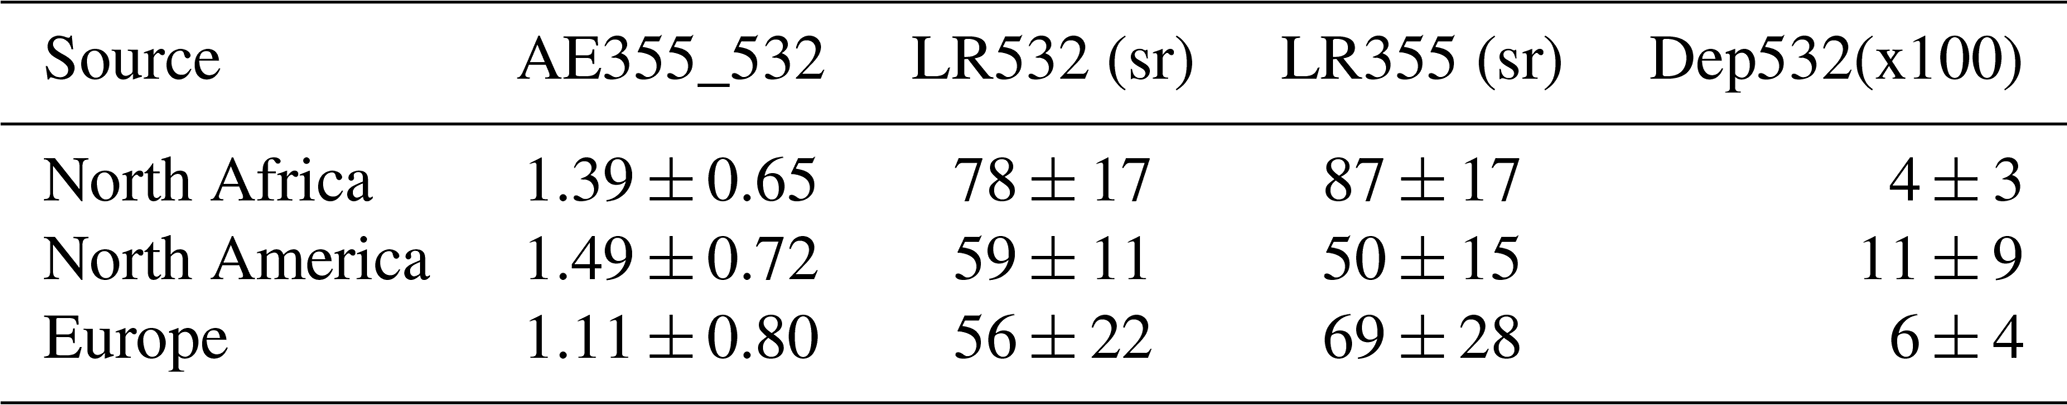
The mean values and standard deviation of the optical properties obtained from lidar data for dust originating from the Sahara, Europe and the Middle East are presented in Table 1 and for smoke originating from Europe, North Africa and North America are presented in Table 2.
Table 1Optical properties of dust originating from Sahara and Middle East obtained from lidar data.
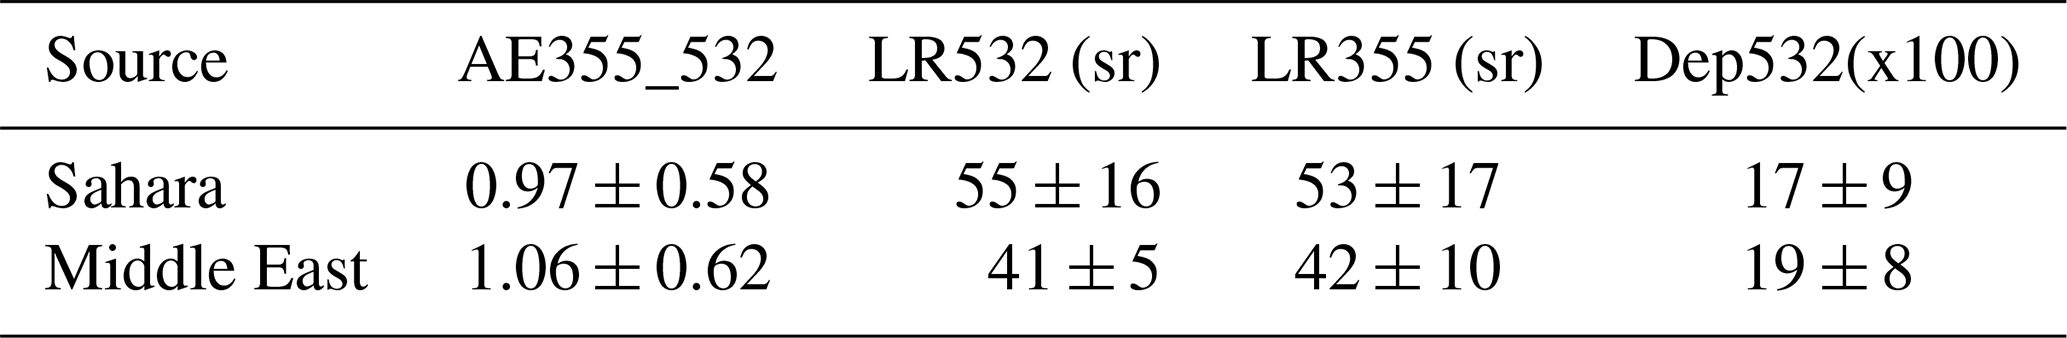
Table 2Optical properties of smoke originated from North America, North Africa and Europe obtained from lidar data.
This paper is presenting a comprehensive analysis of aerosol properties over a 10-year period (2015–2024) at the RADO-Bucharest facility in South-East Romania. Utilizing collocated multiwavelength Raman lidar and sun/sky/lunar photometer measurements, the research focuses on retrieving and analyzing aerosol optical and microphysical properties, as well as identifying predominant aerosol types by using NATALI algorithm on multiwavelength Raman lidar data collected with the RALI system, to capture the typical properties of aerosol layers in the lower and higher atmosphere. The aerosol classification analysis of sunphotometer data revealed distinct clusters that characterize the aerosol types in the atmospheric column.
During the analyzed period, consistently low Aerosol Optical Depth (AOD) values were recorded in the atmospheric column, indicative of a relatively low aerosol burden in the atmosphere at this location. Elevated Ångström Exponent (AE) and Fine Mode Fraction (FMF) values suggest a dominance of fine-mode aerosols, typically associated with anthropogenic pollution sources. A seasonal analysis revealed a slight increase in AOD during summer months, while AE and FMF remained consistently high throughout the year, signifying persistent fine-mode aerosol prevalence. Similar results were observed over Cluj-Napoca in North-West part of Romania (Ştefănie et al., 2023a) and Iasi (Cazacu et al., 2015b) but also on the Romanian Black Sea Coast (Stefan et al., 2020).
Cluster analysis identified the dominant classes as Continental, Urban/Industrial, and Mixed aerosols. Episodic dust events were recorded, particularly in 2016, 2018, and 2021, corresponding to periods of intensified dust transport or enhanced local dust activity. A progressive increase in the prevalence of the Continental aerosol type was observed over the years, suggesting a gradual shift toward a more continental aerosol regime.
Analyzing the aerosol layering from Lidar observations, dust events were more frequent during spring, with dust layers detected at altitudes ranging between 2 and 8 km, consistent with seasonal dust transport mechanisms, behavior also observed for Cluj area (Ştefănie et al., 2023b). Biomass burning signatures were detected periodically, predominantly in July and August, coinciding with increased occurrence of wildfires over the last decade and agricultural practices of burning croplands to enhance soil conditions. Continental aerosols were more abundant during winter months, indicating a seasonal transition toward more stable, fine-mode aerosols in colder conditions.
Lidar-based aerosol layer analysis further confirmed the predominance of continental and smoke aerosols at the study site. Smoke and polluted continental aerosols were largely confined to the lower troposphere, whereas mineral dust was less frequently observed here, with soil dust present in the planetary boundary layer and long-range transported mineral dust from desert regions detected at higher altitudes. Occasional marine-mineral aerosol mixtures were identified around 2 km altitude, likely resulting from transported mineral dust crossing over maritime regions such as the Black Sea or Mediterranean Sea, as also seen sometimes over Cluj (Ştefănie et al., 2023b). The NATALI algorithm analyzed 408 aerosol layers, of which 63 were resolved at high resolution using depolarization data. High-resolution aerosol typing frequently identified layers of mixed aerosol types, such as “dust-polluted” and “continental-smoke”. During spring and summer, aerosol concentrations were predominantly influenced by local emissions and long-range transported aerosols, including Saharan dust and biomass burning emissions from Europe and North America. Conversely, autumn and winter were characterized by a predominance of locally sourced and European aerosols, with minimal influence from long-range transport, as Saharan dust and North African biomass smoke were rarely detected. The detailed seasonal and optical characterization of smoke layers presented using ground based lidar measurements reinforces these results. Fresh smoke layers exhibited higher maximum altitudes in spring compared to summer and autumn, while aged smoke layers reached greater heights during the warmer seasons and remained confined below 2 km in winter, reflecting the influence of boundary layer dynamics on vertical transport.
Lidar ratio values cluster around 48–49 sr across both altitude regimes; however, the markedly broader spread in the lower troposphere reflects the presence of more diverse and occasionally strongly absorbing aerosol layers, whereas lofted free-tropospheric layers show a much narrower distribution indicative of more uniformly moderate absorption. Backward trajectory analysis using the FLEXPART model revealed distinct seasonal variations in aerosol source contributions consistent with the remote sensing observations.
The depolarization ratio analysis showed that fresh smoke was generally confined to a narrower 5 % to 15 % range, whereas aged smoke spanned a broader interval, consistent with microphysical restructuring during aging. Lidar ratio distributions at 355 nm revealed a bimodal structure for both fresh and aged smoke, suggesting the presence of at least two distinct source regimes affecting the region. Together, these results highlight the complexity of smoke plume evolution over South-East Romania and the importance of multi-parameter lidar measurements for resolving seasonal and microphysical variability.
Beyond the descriptive patterns highlighted above, the results have several implications for how aerosol variability should be represented and observed in this region. The frequent occurrence of mixed aerosol states, in particular the recurring continental-smoke and dust-smoke combinations identified by NATALI, points to a need for regional chemical transport models to better resolve vertically structured mixing and the seasonally varying ageing of fine-mode particles. The extended record also demonstrates the importance of maintaining ACTRIS-grade, co-located lidar and photometer observations at sites where multiple transport pathways intersect, since column-only products struggle to capture the layered structure revealed here. At the same time, the analysis is constrained by reduced lidar sampling during cloudy and winter periods, the limited capability of the low-resolution NATALI mode to separate fine-mode types with similar spectral behavior, and the relatively small set of layers with calibrated depolarization for the high-resolution classification. Addressing these limitations will require expanding the multi-parameter retrieval capability toward combined lidar-radiometer inversions and integrating these with regional modelling tools such as FLEXPART-CTM coupling. Such developments would allow a more quantitative assessment of source contributions and radiative effects and would strengthen the use of long-term ACTRIS datasets for evaluating emission-reduction policies and constraining aerosol–climate interactions in Eastern Europe.
The NATALI (Neural Network Aerosol Typing Algorithm Based on Lidar Data) software is available with a user guide from https://res.inoe.ro/s/4BqZXFWMyWwJkDp (last access: 16 February 2026).
The AOD data from the Magurele_Inoe AERONET station, as well as the retrievals from the AERONET standard aerosol algorithm for this site, are available at https://aeronet.gsfc.nasa.gov/ (last access: 1 April 2025).
NATALI-EARLINET typing dataset is publicly available here: https://doi.org/10.57837/CNR-IMAA/ARES/NATALI-EARLINET-TYPING-2015_2023 (Nicolae et al., 2024).
The supplement related to this article is available online at https://doi.org/10.5194/amt-19-1179-2026-supplement.
DN: conceptualization, methodology, formal analysis, software, writing – original draft, writing – review and editing. GAC: conceptualization, formal analysis, software, writing – original draft. AN: formal analysis, investigation; writing – review and editing. VN: formal analysis, software. CT: data curation, investigation. JV: project administration, resources, supervision. AD: data curation, investigation visualization. CR: data curation. MMC: writing – review and editing, mentorship. VV: writing – review and editing, project administration, resources, supervision. LB: conceptualization, formal analysis, methodology, resources, supervision, writing – original draft, writing– review and editing.
At least one of the (co-)authors is a guest member of the editorial board of Atmospheric Measurement Techniques for the special issue “Sun-photometric measurements of aerosols: harmonization, comparisons, synergies, effects, and applications”. The peer-review process was guided by an independent editor, and the authors also have no other competing interests to declare.
Publisher's note: Copernicus Publications remains neutral with regard to jurisdictional claims made in the text, published maps, institutional affiliations, or any other geographical representation in this paper. The authors bear the ultimate responsibility for providing appropriate place names. Views expressed in the text are those of the authors and do not necessarily reflect the views of the publisher.
This article is part of the special issue “Sun-photometric measurements of aerosols: harmonization, comparisons, synergies, effects, and applications”. It is not associated with a conference.
This work was carried out through the Core Program within the National Research Development and Innovation Plan 2022–2027, with the support of MCID, project no. PN23 05/-3.01.2023 and was financed by Smart Growth, Digitization and Financial Instruments Program (PoCIDIF) 2021–2027, Action 1.3 Integration of the national RDI ecosystem in the European and international Research Space, project “Supporting the operation of facilities in Romania within the ACTRIS ERIC research infrastructure”, SMIS code 309113.
Part of the work performed for this study was funded by RI-URBANS project (Research Infrastructures Services Reinforcing Air Quality Monitoring Capacities in European Urban & Industrial Areas, European Union's Horizon 2020 research and innovation program under grant agreement, contract 101036245.
The research was partially funded by the European Regional Development Fund through the Competitiveness Operational Programme 2014-2020, POC-A.1-A.1.1.1-F-2015, project Research Centre for Environment and Earth Observation CEO-Terra, SMIS code 108109, contract no. 152/2016.
Authors acknowledge AERONET-Europe for providing calibration service. AERONET-Europe is part of ACTRIS Research Infrastructure.
This research has been supported by the EU Horizon 2020 (grant no. 101036245) and the Ministerul Cercetării, Inovării şi Digitalizării (grant nos. PN23 05, SMIS code 309113, and SMIS code 108109, contract no. 152/2016).
This paper was edited by Sophie Vandenbussche and reviewed by two anonymous referees.
Adam, M., Nicolae, D., Stachlewska, I. S., Papayannis, A., and Balis, D.: Biomass burning events measured by lidars in EARLINET – Part 1: Data analysis methodology, Atmos. Chem. Phys., 20, 13905–13927, https://doi.org/10.5194/acp-20-13905-2020, 2020.
Ansmann, A., Ohneiser, K., Mamouri, R.-E., Knopf, D. A., Veselovskii, I., Baars, H., Engelmann, R., Foth, A., Jimenez, C., Seifert, P., and Barja, B.: Tropospheric and stratospheric wildfire smoke profiling with lidar: mass, surface area, CCN, and INP retrieval, Atmos. Chem. Phys., 21, 9779–9807, https://doi.org/10.5194/acp-21-9779-2021, 2021.
Bagheri, G. and Bonadonna, C.: On the drag of freely falling non-spherical particles, Powder Technol., 301, 526–544, https://doi.org/10.1016/j.powtec.2016.06.015, 2016.
Boucher, O.: Atmospheric Aerosols: Properties and Climate Impacts, Springer Netherlands, Dordrecht, https://doi.org/10.1007/978-94-017-9649-1, 2015.
Bréon, F.-M., Tanré, D., and Generoso, S.: Aerosol Effect on Cloud Droplet Size Monitored from Satellite, Science, 295, 834–838, https://doi.org/10.1126/science.1066434, 2002.
Carstea, E., Fragkos, K., Siomos, N., Antonescu, B., and Belegante, L.: Columnar aerosol measurements in a continental southeastern Europe site: climatology and trends, Theor. Appl. Climatol., 137, 3149–3159, https://doi.org/10.1007/s00704-019-02805-z, 2019.
Cassiani, M., Stohl, A., and Brioude, J.: Lagrangian stochastic modelling of dispersion in the convective boundary layer with skewed turbulence conditions and a vertical density gradient: Formulation and implementation in the FLEXPART Model, Bound. Lay. Meteorol., 154, 367–390, https://doi.org/10.1007/s10546-014-9976-5, 2015.
Cazacu, M. M., Timofte, A., Unga, F., Albina, B., and Gurlui, S.: AERONET data investigation of the aerosol mixtures over Iasi area, One-year time scale overview, J. Quant. Spectrosc. Ra., 153, 57–64, https://doi.org/10.1016/j.jqsrt.2014.09.004, 2015a.
Cazacu, M. M., Timofte, A., Unga, F., Albina, B., and Gurlui, S.: AERONET data investigation of the aerosol mixtures over Iasi area, One-year time scale overview, J. Quant. Spectrosc. Ra., 153, 57–64, https://doi.org/10.1016/j.jqsrt.2014.09.004, 2015b.
D'Almeida, G. A., Koepke, P., and Shettle, E. P.: Atmospheric aerosols: global climatology and radiative characteristics, A. Deepak Pub, Hampton, VA, USA, 1991.
D'Amico, G., Amodeo, A., Mattis, I., Freudenthaler, V., and Pappalardo, G.: EARLINET Single Calculus Chain – technical – Part 1: Pre-processing of raw lidar data, Atmos. Meas. Tech., 9, 491–507, https://doi.org/10.5194/amt-9-491-2016, 2016.
del Águila, A., Ortiz-Amezcua, P., Tabik, S., Bravo-Aranda, J. A., Fernández-Carvelo, S., and Alados-Arboledas, L.: Aerosol type classification with machine learning techniques applied to multiwavelength lidar data from EARLINET, Atmos. Chem. Phys., 25, 12549–12567, https://doi.org/10.5194/acp-25-12549-2025, 2025.
Dubovik, O. and King, M. D.: A flexible inversion algorithm for retrieval of aerosol optical properties from Sun and sky radiance measurements, J. Geophys. Res.-Atmos., 105, 20673–20696, https://doi.org/10.1029/2000JD900282, 2000.
Dubovik, O., Holben, B., Eck, T. F., Smirnov, A., Kaufman, Y. J., King, M. D., Tanré, D., and Slutsker, I.: Variability of Absorption and Optical Properties of Key Aerosol Types Observed in Worldwide Locations, J. Atmos. Sci., 59, 590–608, https://doi.org/10.1175/1520-0469(2002)059<0590:VOAAOP>2.0.CO;2, 2002.
Dubovik, O., Herman, M., Holdak, A., Lapyonok, T., Tanré, D., Deuzé, J. L., Ducos, F., Sinyuk, A., and Lopatin, A.: Statistically optimized inversion algorithm for enhanced retrieval of aerosol properties from spectral multi-angle polarimetric satellite observations, Atmos. Meas. Tech., 4, 975–1018, https://doi.org/10.5194/amt-4-975-2011, 2011.
Dubovik, O., Fuertes, D., Litvinov, P., Lopatin, A., Lapyonok, T., Doubovik, I., Xu, F., Ducos, F., Chen, C., Torres, B., Derimian, Y., Li, L., Herreras-Giralda, M., Herrera, M., Karol, Y., Matar, C., Schuster, G. L., Espinosa, R., Puthukkudy, A., Li, Z., Fischer, J., Preusker, R., Cuesta, J., Kreuter, A., Cede, A., Aspetsberger, M., Marth, D., Bindreiter, L., Hangler, A., Lanzinger, V., Holter, C., and Federspiel, C.: A Comprehensive Description of Multi-Term LSM for Applying Multiple a Priori Constraints in Problems of Atmospheric Remote Sensing: GRASP Algorithm, Concept, and Applications, Front. Remote Sens., 2, 706851, https://doi.org/10.3389/frsen.2021.706851, 2021.
Eck, T. F., Holben, B. N., Reid, J. S., Dubovik, O., Smirnov, A., O'Neill, N. T., Slutsker, I., and Kinne, S.: Wavelength dependence of the optical depth of biomass burning, urban, and desert dust aerosols, J. Geophys. Res.-Atmos., 104, 31333–31349, https://doi.org/10.1029/1999JD900923, 1999.
Eck, T. F., Holben, B. N., Reid, J. S., Sinyuk, A., Dubovik, O., Smirnov, A., Giles, D., O'Neill, N. T., Tsay, S.-C., Ji, Q., Al Mandoos, A., Ramzan Khan, M., Reid, E. A., Schafer, J. S., Sorokine, M., Newcomb, W., and Slutsker, I.: Spatial and temporal variability of column-integrated aerosol optical properties in the southern Arabian Gulf and United Arab Emirates in summer, J. Geophys. Res.-Atmos., 113, D01204, https://doi.org/10.1029/2007JD008944, 2008.
ECMWF: ERA5: data documentation, https://confluence.ecmwf.int/display/CKB/ERA5%3A+data+documentation?src=contextnavpagetreemode, last access: 22 April 2025.
Floutsi, A. A., Baars, H., and Wandinger, U.: HETEAC-Flex: an optimal estimation method for aerosol typing based on lidar-derived intensive optical properties, Atmos. Meas. Tech., 17, 693–714, https://doi.org/10.5194/amt-17-693-2024, 2024.
Giles, D. M., Holben, B. N., Eck, T. F., Sinyuk, A., Smirnov, A., Slutsker, I., Dickerson, R. R., Thompson, A. M., and Schafer, J. S.: An analysis of AERONET aerosol absorption properties and classifications representative of aerosol source regions, J. Geophys. Res.-Atmos., 117, D17203, https://doi.org/10.1029/2012JD018127, 2012.
Gobbi, G. P., Kaufman, Y. J., Koren, I., and Eck, T. F.: Classification of aerosol properties derived from AERONET direct sun data, Atmos. Chem. Phys., 7, 453–458, https://doi.org/10.5194/acp-7-453-2007, 2007.
Groot Zwaaftink, C. D., Grythe, H., Skov, H., and Stohl, A.: Substantial contribution of northern high-latitude sources to mineral dust in the Arctic, J. Geophys. Res.-Atmos., 121, https://doi.org/10.1002/2016JD025482, 2016.
Grythe, H., Kristiansen, N. I., Groot Zwaaftink, C. D., Eckhardt, S., Ström, J., Tunved, P., Krejci, R., and Stohl, A.: A new aerosol wet removal scheme for the Lagrangian particle model FLEXPART v10, Geosci. Model Dev., 10, 1447–1466, https://doi.org/10.5194/gmd-10-1447-2017, 2017.
Hansen, J., Sato, M., and Ruedy, R.: Radiative forcing and climate response, J. Geophys. Res.-Atmos., 102, 6831–6864, https://doi.org/10.1029/96JD03436, 1997.
Hess, M., Koepke, P., and Schult, I.: Optical Properties of Aerosols and Clouds: The Software Package OPAC, B. Am. Meteorol. Soc., 79, 831–844, https://doi.org/10.1175/1520-0477(1998)079<0831:OPOAAC>2.0.CO;2, 1998.
Holben, B. N., Eck, T. F., Slutsker, I., Tanré, D., Buis, J. P., Setzer, A., Vermote, E., Reagan, J. A., Kaufman, Y. J., Nakajima, T., Lavenu, F., Jankowiak, I., and Smirnov, A.: AERONET – A Federated Instrument Network and Data Archive for Aerosol Characterization, Remote Sens. Environ., 66, 1–16, https://doi.org/10.1016/S0034-4257(98)00031-5, 1998.
IPCC: Climate Change 2021 – The Physical Science Basis: Working Group I Contribution to the Sixth Assessment Report of the Intergovernmental Panel on Climate Change, 1st edn., Cambridge University Press, https://doi.org/10.1017/9781009157896, 2021.
Janicka, L., Davuliene, L., Bycenkiene, S., and Stachlewska, I. S.: Long term observations of biomass burning aerosol over Warsaw by means of multiwavelength lidar, Opt. Express, 31, 33150, https://doi.org/10.1364/OE.496794, 2023.
Köpke, P., Hess, M., Schult, I., and Shettle, E. P.: Global aerosol data set, Report/Max-Planck-Institut für Meteorologie, 243, https://doi.org/10.17617/2.3365749, 1997.
Laj, P., Lund Myhre, C., Riffault, V., Amiridis, V., Fuchs, H., Eleftheriadis, K., Petäjä, T., Salameh, T., Kivekäs, N., Juurola, E., Saponaro, G., Philippin, S., Cornacchia, C., Alados Arboledas, L., Baars, H., Claude, A., De Mazière, M., Dils, B., Dufresne, M., Evangeliou, N., Favez, O., Fiebig, M., Haeffelin, M., Herrmann, H., Höhler, K., Illmann, N., Kreuter, A., Ludewig, E., Marinou, E., Möhler, O., Mona, L., Eder Murberg, L., Nicolae, D., Novelli, A., O'Connor, E., Ohneiser, K., Petracca Altieri, R. M., Picquet-Varrault, B., Van Pinxteren, D., Pospichal, B., Putaud, J.-P., Reimann, S., Siomos, N., Stachlewska, I., Tillmann, R., Voudouri, K. A., Wandinger, U., Wiedensohler, A., Apituley, A., Comerón, A., Gysel-Beer, M., Mihalopoulos, N., Nikolova, N., Pietruczuk, A., Sauvage, S., Sciare, J., Skov, H., Svendby, T., Swietlicki, E., Tonev, D., Vaughan, G., Zdimal, V., Baltensperger, U., Doussin, J.-F., Kulmala, M., Pappalardo, G., Sorvari Sundet, S., and Vana, M.: Aerosol, Clouds and Trace Gases Research Infrastructure (ACTRIS): The European Research Infrastructure Supporting Atmospheric Science, B. Am. Meteorol. Soc., 105, E1098–E1136, https://doi.org/10.1175/BAMS-D-23-0064.1, 2024.
Lee, J., Kim, J., Song, C. H., Kim, S. B., Chun, Y., Sohn, B. J., and Holben, B. N.: Characteristics of aerosol types from AERONET sunphotometer measurements, Atmos. Environ., 44, 3110–3117, https://doi.org/10.1016/j.atmosenv.2010.05.035, 2010.
Li, J., Carlson, B. E., Yung, Y. L., Lv, D., Hansen, J., Penner, J. E., Liao, H., Ramaswamy, V., Kahn, R. A., Zhang, P., Dubovik, O., Ding, A., Lacis, A. A., Zhang, L., and Dong, Y.: Scattering and absorbing aerosols in the climate system, Nat. Rev. Earth Environ., 3, 363–379, https://doi.org/10.1038/s43017-022-00296-7, 2022.
Logothetis, S.-A., Salamalikis, V., and Kazantzidis, A.: Aerosol classification in Europe, Middle East, North Africa and Arabian Peninsula based on AERONET Version 3, Atmos. Res., 239, 104893, https://doi.org/10.1016/j.atmosres.2020.104893, 2020.
Lopatin, A., Dubovik, O., Chaikovsky, A., Goloub, P., Lapyonok, T., Tanré, D., and Litvinov, P.: Enhancement of aerosol characterization using synergy of lidar and sun-photometer coincident observations: the GARRLiC algorithm, Atmos. Meas. Tech., 6, 2065–2088, https://doi.org/10.5194/amt-6-2065-2013, 2013.
Mamouri, R. E. and Ansmann, A.: Fine and coarse dust separation with polarization lidar, Atmos. Meas. Tech., 7, 3717–3735, https://doi.org/10.5194/amt-7-3717-2014, 2014.
Mattis, I., D'Amico, G., Baars, H., Amodeo, A., Madonna, F., and Iarlori, M.: EARLINET Single Calculus Chain – technical – Part 2: Calculation of optical products, Atmos. Meas. Tech., 9, 3009–3029, https://doi.org/10.5194/amt-9-3009-2016, 2016.
Mishchenko, M. I., Travis, L. D., and Mackowski, D. W.: T-matrix computations of light scattering by nonspherical particles: A review, J. Quant. Spectrosc. Ra., 55, 535–575, https://doi.org/10.1016/0022-4073(96)00002-7, 1996.
Mylonaki, M., Giannakaki, E., Papayannis, A., Papanikolaou, C.-A., Komppula, M., Nicolae, D., Papagiannopoulos, N., Amodeo, A., Baars, H., and Soupiona, O.: Aerosol type classification analysis using EARLINET multiwavelength and depolarization lidar observations, Atmos. Chem. Phys., 21, 2211–2227, https://doi.org/10.5194/acp-21-2211-2021, 2021.
Nemuc, A., Vasilescu, J., Talianu, C., Belegante, L., and Nicolae, D.: Assessment of aerosol's mass concentrations from measured linear particle depolarization ratio (vertically resolved) and simulations, Atmos. Meas. Tech., 6, 3243–3255, https://doi.org/10.5194/amt-6-3243-2013, 2013.
Nicolae, D., Vasilescu, J., Carstea, E., and Prata, F.: Romanian atmospheric research 3D observatory: Synergy of instruments, Romanian Rep. Phys., 62, 838–853, 2010.
Nicolae, D., Nemuc, A., Müller, D., Talianu, C., Vasilescu, J., Belegante, L., and Kolgotin, A.: Characterization of fresh and aged biomass burning events using multiwavelength Raman lidar and mass spectrometry, J. Geophys. Res.-Atmos., 118, 2956–2965, https://doi.org/10.1002/jgrd.50324, 2013.
Nicolae, D., Vasilescu, J., Talianu, C., Binietoglou, I., Nicolae, V., Andrei, S., and Antonescu, B.: A neural network aerosol-typing algorithm based on lidar data, Atmos. Chem. Phys., 18, 14511–14537, https://doi.org/10.5194/acp-18-14511-2018, 2018.
Nicolae, D., Talianu, C., Vasilescu, J., Nicolae, V., Belegante, L., Nemuc, A., Dandocsi, A., Stachlewska, I. S., Szczepanik, D. M., Janicka, L., Papayannis, A., Amiridis, V., Marinou, E., Bortoli, D., Salgueiro, V., Mona, L., Papagiannopoulos, N., Amodeo, A., D'Amico, G., Mytilinaios, M., De Rosa, B., Dema, C., Baars, H., Floutsi, A. A., Engelmann, R., Heese, B., Hofer, J., Skupin, A., Althausen, D., Haarig, M., Balis, D., Voudouri, K. A., Baray, J.-L., Mamouri, R.-E., Nisantzi, A., Ajtai, N., Shang, X., Filioglou, M., Komppula, M., Iarlori, M., Rizi, V., HU, Q., Goloub, P., Sannino, A., Di Paolantonio, M., Giuliano, G., Szkop, A., Pietruczuk, A., Boselli, A., Romano, S., Calcagnile, L., Trickl, T., Vogelmann, H., Posyniak, M., WANG, D., Muñoz-Porcar, C., Apituley, A., Alados-Arboledas, L., Guerrero Rascado, J. L., Mattis, I., Wagner, F., Putaud, J. P., Podvin, T., Pujadas, M., Wiegner, M., Amoruso, S., Perrone, M. R., Pietras, C., Peshev, Z., Voudouri, K., Gumà-Claramunt, P., and Ripepi, E.: NATALI Earlinet Typing 2015–2023, Version 2, ACTRIS-ARES Data Centre Unit [data set], https://doi.org/10.57837/CNR-IMAA/ARES/NATALI-EARLINET-TYPING-2015_2023, 2024.
Nicolae, V., Talianu, C., Andrei, S., Antonescu, B., Ene, D., Nicolae, D., Dandocsi, A., Toader, V.-E., Ştefan, S., Savu, T., and Vasilescu, J.: Multiyear Typology of Long-Range Transported Aerosols over Europe, Atmosphere, 10, 482, https://doi.org/10.3390/atmos10090482, 2019.
O'Neill, N. T., Eck, T. F., Holben, B. N., Smirnov, A., Dubovik, O., and Royer, A.: Bimodal size distribution influences on the variation of Angstrom derivatives in spectral and optical depth space, J. Geophys. Res.-Atmos., 106, 9787–9806, https://doi.org/10.1029/2000JD900245, 2001.
Papagiannopoulos, N., Mona, L., Amodeo, A., D'Amico, G., Gumà Claramunt, P., Pappalardo, G., Alados-Arboledas, L., Guerrero-Rascado, J. L., Amiridis, V., Kokkalis, P., Apituley, A., Baars, H., Schwarz, A., Wandinger, U., Binietoglou, I., Nicolae, D., Bortoli, D., Comerón, A., Rodríguez-Gómez, A., Sicard, M., Papayannis, A., and Wiegner, M.: An automatic observation-based aerosol typing method for EARLINET, Atmos. Chem. Phys., 18, 15879–15901, https://doi.org/10.5194/acp-18-15879-2018, 2018.
Pappalardo, G., Mona, L., D'Amico, G., Wandinger, U., Adam, M., Amodeo, A., Ansmann, A., Apituley, A., Alados Arboledas, L., Balis, D., Boselli, A., Bravo-Aranda, J. A., Chaikovsky, A., Comeron, A., Cuesta, J., De Tomasi, F., Freudenthaler, V., Gausa, M., Giannakaki, E., Giehl, H., Giunta, A., Grigorov, I., Groß, S., Haeffelin, M., Hiebsch, A., Iarlori, M., Lange, D., Linné, H., Madonna, F., Mattis, I., Mamouri, R.-E., McAuliffe, M. A. P., Mitev, V., Molero, F., Navas-Guzman, F., Nicolae, D., Papayannis, A., Perrone, M. R., Pietras, C., Pietruczuk, A., Pisani, G., Preißler, J., Pujadas, M., Rizi, V., Ruth, A. A., Schmidt, J., Schnell, F., Seifert, P., Serikov, I., Sicard, M., Simeonov, V., Spinelli, N., Stebel, K., Tesche, M., Trickl, T., Wang, X., Wagner, F., Wiegner, M., and Wilson, K. M.: Four-dimensional distribution of the 2010 Eyjafjallajökull volcanic cloud over Europe observed by EARLINET, Atmos. Chem. Phys., 13, 4429–4450, https://doi.org/10.5194/acp-13-4429-2013, 2013.
Pîrloagă, R., Ene, D., Boldeanu, M., Antonescu, B., O'Connor, E. J., and Ştefan, S.: Ground-Based Measurements of Cloud Properties at the Bucharest–Măgurele Cloudnet Station: First Results, Atmosphere, 13, 1445, https://doi.org/10.3390/atmos13091445, 2022.
Pisso, I., Sollum, E., Grythe, H., Kristiansen, N. I., Cassiani, M., Eckhardt, S., Arnold, D., Morton, D., Thompson, R. L., Groot Zwaaftink, C. D., Evangeliou, N., Sodemann, H., Haimberger, L., Henne, S., Brunner, D., Burkhart, J. F., Fouilloux, A., Brioude, J., Philipp, A., Seibert, P., and Stohl, A.: The Lagrangian particle dispersion model FLEXPART version 10.4, Geosci. Model Dev., 12, 4955–4997, https://doi.org/10.5194/gmd-12-4955-2019, 2019.
Proestakis, E., Amiridis, V., Marinou, E., Binietoglou, I., Ansmann, A., Wandinger, U., Hofer, J., Yorks, J., Nowottnick, E., Makhmudov, A., Papayannis, A., Pietruczuk, A., Gialitaki, A., Apituley, A., Szkop, A., Muñoz Porcar, C., Bortoli, D., Dionisi, D., Althausen, D., Mamali, D., Balis, D., Nicolae, D., Tetoni, E., Liberti, G. L., Baars, H., Mattis, I., Stachlewska, I. S., Voudouri, K. A., Mona, L., Mylonaki, M., Perrone, M. R., Costa, M. J., Sicard, M., Papagiannopoulos, N., Siomos, N., Burlizzi, P., Pauly, R., Engelmann, R., Abdullaev, S., and Pappalardo, G.: EARLINET evaluation of the CATS Level 2 aerosol backscatter coefficient product, Atmos. Chem. Phys., 19, 11743–11764, https://doi.org/10.5194/acp-19-11743-2019, 2019.
Schwartz, S. E. and Andreae, M. O.: Uncertainty in Climate Change Caused by Aerosols, Science, 272, 1121–1121, https://doi.org/10.1126/science.272.5265.1121, 1996.
Siomos, N., Fountoulakis, I., Natsis, A., Drosoglou, T., and Bais, A.: Automated Aerosol Classification from Spectral UV Measurements Using Machine Learning Clustering, Remote Sens., 12, 965, https://doi.org/10.3390/rs12060965, 2020.
Srivastava, D., Daellenbach, K. R., Zhang, Y., Bonnaire, N., Chazeau, B., Perraudin, E., Gros, V., Lucarelli, F., Villenave, E., Prévôt, A. S. H., El Haddad, I., Favez, O., and Albinet, A.: Comparison of five methodologies to apportion organic aerosol sources during a PM pollution event, Sci. Total Environ., 757, 143168, https://doi.org/10.1016/j.scitotenv.2020.143168, 2021.
Stebel, K., Stachlewska, I. S., Nemuc, A., Horálek, J., Schneider, P., Ajtai, N., Diamandi, A., Benešová, N., Boldeanu, M., Botezan, C., Marková, J., Dumitrache, R., Iriza-Burcă, A., Juras, R., Nicolae, D., Nicolae, V., Novotný, P., Ştefănie, H., Vaněk, L., Vlček, O., Zawadzka-Manko, O., and Zehner, C.: SAMIRA-SAtellite Based Monitoring Initiative for Regional Air Quality, Remote Sens., 13, 2219, https://doi.org/10.3390/rs13112219, 2021.
Stefan, S., Voinea, S., and Iorga, G.: Study of the aerosol optical characteristics over the Romanian Black Sea Coast using AERONET data, Atmos. Pollut. Res., 11, 1165–1178, https://doi.org/10.1016/j.apr.2020.04.007, 2020.
Ştefănie, H., Radovici, A., Mereuta, A., Arghiuş, V., Cămărăşan, H., Costin, D., Botezan, C., Gînscă, C., and Ajtai, N.: Variation of Aerosol Optical Properties and Trends Over Cluj-Napoca, Romania, Based on 10 Years of AERONET Data and Satellite-Based Observations, Preprints [preprint], https://doi.org/10.20944/preprints202304.0774.v1, 2023a.
Ştefănie, H. I., Radovici, A., Mereuţă, A., Arghiuş, V., Cămărăşan, H., Costin, D., Botezan, C., Gînscă, C., and Ajtai, N.: Variation of Aerosol Optical Properties over Cluj-Napoca, Romania, Based on 10 Years of AERONET Data and MODIS MAIAC AOD Product, Remote Sens., 15, 3072, https://doi.org/10.3390/rs15123072, 2023b.
Stohl, A., Hittenberger, M., and Wotawa, G.: Validation of the lagrangian particle dispersion model FLEXPART against large-scale tracer experiment data, Atmos. Environ., 32, 4245–4264, https://doi.org/10.1016/S1352-2310(98)00184-8, 1998.
Stohl, A., Forster, C., Frank, A., Seibert, P., and Wotawa, G.: Technical note: The Lagrangian particle dispersion model FLEXPART version 6.2, Atmos. Chem. Phys., 5, 2461–2474, https://doi.org/10.5194/acp-5-2461-2005, 2005.
Szczepanik, D. M., Stachlewska, I. S., Tetoni, E., and Althausen, D.: Properties of Saharan Dust Versus Local Urban Dust – A Case Study, Earth Space Sci., 8, e2021EA001816, https://doi.org/10.1029/2021EA001816, 2021.
Talianu, C. and Seibert, P.: Analysis of sulfate aerosols over Austria: a case study, Atmos. Chem. Phys., 19, 6235–6250, https://doi.org/10.5194/acp-19-6235-2019, 2019.
Tatsii, D., Bucci, S., Bhowmick, T., Guettler, J., Bakels, L., Bagheri, G., and Stohl, A.: Shape Matters: Long-Range Transport of Microplastic Fibers in the Atmosphere, Environ. Sci. Technol., 58, 671–682, https://doi.org/10.1021/acs.est.3c08209, 2024.
Tipka, A., Haimberger, L., and Seibert, P.: Flex_extract v7.1.2 – a software package to retrieve and prepare ECMWF data for use in FLEXPART, Geosci. Model Dev., 13, 5277–5310, https://doi.org/10.5194/gmd-13-5277-2020, 2020.
Toledano, C., Cachorro, V. E., Berjon, A., De Frutos, A. M., Sorribas, M., De La Morena, B. A., and Goloub, P.: Aerosol optical depth and Ångström exponent climatology at El Arenosillo AERONET site (Huelva, Spain), Q. J. Roy. Meteor. Soc., 133, 795–807, https://doi.org/10.1002/qj.54, 2007.
Tsekeri, A., Gialitaki, A., Di Paolantonio, M., Dionisi, D., Liberti, G. L., Fernandes, A., Szkop, A., Pietruczuk, A., Pérez-Ramírez, D., Granados Muñoz, M. J., Guerrero-Rascado, J. L., Alados-Arboledas, L., Bermejo Pantaleón, D., Bravo-Aranda, J. A., Kampouri, A., Marinou, E., Amiridis, V., Sicard, M., Comerón, A., Muñoz-Porcar, C., Rodríguez-Gómez, A., Romano, S., Perrone, M. R., Shang, X., Komppula, M., Mamouri, R.-E., Nisantzi, A., Hadjimitsis, D., Navas-Guzmán, F., Haefele, A., Szczepanik, D., Tomczak, A., Stachlewska, I. S., Belegante, L., Nicolae, D., Voudouri, K. A., Balis, D., Floutsi, A. A., Baars, H., Miladi, L., Pascal, N., Dubovik, O., and Lopatin, A.: Combined sun-photometer–lidar inversion: lessons learned during the EARLINET/ACTRIS COVID-19 campaign, Atmos. Meas. Tech., 16, 6025–6050, https://doi.org/10.5194/amt-16-6025-2023, 2023.
Vaduva, I.: Clima Romaniei, edited by: Fundatia Romania de maine, Bucuresti, Romania, 54–56, ISBN 978-973-163-175-2, 2008 (in Romanian).
Veselovskii, I., Hu, Q., Goloub, P., Podvin, T., Korenskiy, M., Derimian, Y., Legrand, M., and Castellanos, P.: Variability in lidar-derived particle properties over West Africa due to changes in absorption: towards an understanding, Atmos. Chem. Phys., 20, 6563–6581, https://doi.org/10.5194/acp-20-6563-2020, 2020.
Voudouri, K. A., Siomos, N., Michailidis, K., Papagiannopoulos, N., Mona, L., Cornacchia, C., Nicolae, D., and Balis, D.: Comparison of two automated aerosol typing methods and their application to an EARLINET station, Atmos. Chem. Phys., 19, 10961–10980, https://doi.org/10.5194/acp-19-10961-2019, 2019.
Wang, L., Stanič, S., Eichinger, W., Song, X., and Zavrtanik, M.: Development of an Automatic Polarization Raman LiDAR for Aerosol Monitoring over Complex Terrain, Sensors, 19, 3186, https://doi.org/10.3390/s19143186, 2019.
Waterman, P. C.: Symmetry, Unitarity, and Geometry in Electromagnetic Scattering, Phys. Rev. D, 3, 825–839, https://doi.org/10.1103/PhysRevD.3.825, 1971.
Zhang, S. and Huo, F.: Angstrom science: Exploring aggregates from a new viewpoint, Green Energy Environ., 1, 75–78, https://doi.org/10.1016/j.gee.2016.04.008, 2016.