the Creative Commons Attribution 4.0 License.
the Creative Commons Attribution 4.0 License.
 | 19 Feb 2026
Intercomparison of MAX-DOAS, FTIR and direct sun HCHO vertical columns at Xianghe, China
Martina M. Friedrich
Corinne Vigouroux
Bavo Langerock
Isabelle De Smedt
Caroline Fayt
Christian Hermans
Steffen Beirle
Thomas Wagner
Minqiang Zhou
Ting Wang
Pucai Wang
Martine De Mazière
Michel Van Roozendael
MAX-DOAS (Multi-AXis Differential Optical Absorption Spectroscopy), direct sun DOAS (DS) and FTIR (Fourier Transform InfraRed) measurements are considered nowadays as reference data for the validation of HCHO satellite observations. Recognizing their strengths and limitations, as well as evaluating their consistency, is crucial for generating robust and reliable validation datasets. So far, only a handful of studies have explored the complementarity between MAX-DOAS and direct sun FTIR HCHO measurements and the question of the consistency of the ground-based retrievals within the different networks currently used for satellite validation is still relevant. Here we take advantage of the presence of a MAX-DOAS spectrometer, incorporating a direct sun viewing mode capability, and an FTIR instrument operating in parallel at the Xianghe site (39.75° N, 116.96° E, China), to compare the retrieved HCHO vertical columns and investigate the reasons for the observed differences. First, we compare the UV and IR HCHO vertical column densities (VCDs) in the direct sun geometry, for which the uncertainty due to the light path is negligible. We find an excellent agreement between the measurements obtained in both wavelength ranges, with a median difference of less than −0.5 × 10¹⁵ molec. cm−2 (−6 % ± 11 % for (FTIR − DS) DS). Second, the MAX-DOAS data from different retrieval strategies implemented within the European Space Agency Fiducial Reference Measurement centralized processing facility for DOAS observations are compared to the DS and FTIR ones. The MAX-DOAS HCHO columns correlate well with the direct sun DOAS and FTIR data, but underestimate them by about 20 %. Focusing on the vertical profiles, we show that this bias cancels out when taking properly into account the different a priori profiles and the respective vertical sensitivities of the MAX-DOAS and FTIR measurements. The underestimation in the current MAX-DOAS VCDs is coming from the limited vertical sensitivity of the technique and from the choice of the a priori profile, which neglects the free-tropospheric contribution (above 4 km), where the MAX-DOAS has no sensitivity. We test and suggest possible improvements to the current centralized MAX-DOAS HCHO retrievals processing, like using more appropriate a priori profiles, based on the CAMS and TM5 chemical-transport models (CTMs) that better estimate the HCHO content above 4 km.
- Article
(5400 KB) - Full-text XML
- BibTeX
- EndNote


Formaldehyde (HCHO), the most abundant carbonyl compound in the atmosphere, is an important atmospheric trace gas which is produced by the photochemical degradation of methane as well as non-methane volatile organic compounds (NMVOCs), the latter being the main source of HCHO over continents (Finlayson-Pitts and Pitts, 2000; Wolfe et al., 2016). It is in particular a byproduct of the oxidation of isoprene (Stavrakou et al., 2009). The primary emission sources of HCHO are biomass burning, industrial processes, fossil fuel combustion and vegetation (see e.g., Wolfe et al., 2016, and references therein). HCHO is frequently used as a proxy for NMVOCs, which are crucial in the photochemical processes that influence air quality. It is a precursor of the formation of ozone and aerosols, and it participates to photochemical smog production, especially in urban areas (Atkinson, 2000). HCHO is destroyed by photolysis and reaction with OH. Characterized by a short atmospheric lifetime (ranging from hours to a day), HCHO is highly reactive and its abundance reflects recent VOC oxidation. This molecule plays a pivotal role in the fast-paced dynamics of air quality, making it an important species to monitor in real-time pollution assessments.
HCHO can be measured in both the UV and IR part of the solar spectrum, from ground-based and satellite platforms.
The Multi-Axis Differential Optical Absorption Spectroscopy (MAX-DOAS; Hönninger et al., 2004; Wagner et al., 2004; Frieß et al., 2006) is a passive remote sensing technique that measures scattered sunlight at different elevation angles from the horizon to the zenith. It is sensitive to absorbers present close to the surface. From measured spectra, differential slant columns densities (DSCD) of target gases are derived by least-squares fitting to reference absorption cross-sections (Platt and Stutz, 2008) and, from there, the vertical column density (VCD) and the vertical distribution of the trace gas concentration can be retrieved by applying different inversion methods, such as the Optimal Estimation (OEM; Rodgers, 2000; e.g., Hendrick et al., 2004; Hönninger et al., 2004; Wittrock et al., 2004; Frieß et al., 2006; Clémer et al., 2010), parametrized approaches (Wagner et al., 2011; Vlemmix et al., 2015; Beirle et al., 2019; Irie et al., 2008) or simple geometrical approximations. MAX-DOAS HCHO measurements have been reported from many locations worldwide (e.g. Heckel et al., 2005; Wagner et al., 2011; Peters et al., 2012; Vlemmix et al., 2015; Gratsea et al., 2016; Wang et al., 2017, 2019; Hoque et al., 2018a, b; Irie et al., 2019; Benavent et al., 2019; Kumar et al., 2020; Chan et al., 2020; Schreier et al., 2020; Yombo Phaka et al., 2023; Rawat et al., 2024; Chong et al., 2024) and during intercomparison campaigns (e.g., Pinardi et al., 2013; Kreher et al., 2020; Piters et al., 2012; Tirpitz et al., 2021). Standardized settings for the SCD retrievals have been proposed during some campaigns (Pinardi et al., 2013; Kreher et al., 2020), but only few studies focused on comparing results from different retrieval approaches (Vlemmix et al., 2015; Tirpitz et al., 2021; Frieß et al., 2019) and these lead to consistent tropospheric vertical columns but to larger differences in terms of profiles. Harmonization of the VCD and profiles is still a matter of research in the DOAS community and require consolidation.
Formaldehyde has also been measured by FTIR (Fourier Transform Infrared) ground-based spectrometers, originally at a few individual stations as part of the Network for the Detection of Atmospheric Composition Change (NDACC), using different retrieval settings (Mahieu et al., 1997; Notholt et al., 1997; Hak et al., 2005; Vigouroux et al., 2009; Jones et al., 2009; Paton-Walsh et al., 2010; Viatte et al., 2014). In Vigouroux et al. (2018), the retrieval settings have been harmonized within the whole network and continuous HCHO measurements are since then performed at more that twenty stations in a consistent way and archived in the NDACC database (https://ndacc.larc.nasa.gov/, last access: 12 February 2026).
Another network growing fast in an harmonized way is the Pandonia Global Network (PGN, https://www.pandonia-global-network.org, last access: 12 February 2026). PGN provides HCHO measurements using Pandora spectrometers operated both in direct sun and in multi-axis geometries (Spinei et al., 2018, 2021; Park et al., 2018; Herman et al., 2018) and recent studies using the Pandora HCHO products and characterizing/assessing their quality are being published (Sebol et al., 2025; Zhao et al., 2025; Fu et al., 2025; Rawat et al., 2025).
MAX-DOAS, direct sun and FTIR networks are rapidly expanding and are increasingly regarded as reference data sources for validating satellite HCHO observations, e.g. for Low Earth orbits (LEO) (Vigouroux et al., 2020; De Smedt et al., 2015, 2021; Lee et al., 2015; Yombo Phaka et al., 2023; Chan et al., 2020, 2023; Müller et al., 2024; Herman and Mao, 2025), geostationary orbit satellites (GEO) like GEMS (Lee et al., 2024; Fu et al., 2025; Bae et al., 2025) and for chemistry-transport models (Oomen et al., 2024). This has been made possible owing to recent improvements in retrieval techniques and harmonization of the methodologies applied at the network level, in particular for FTIR instruments (Vigouroux et al., 2018) and with the rapid development of the PGN network. To produce robust and consolidated validation results, it is essential to understand the strengths and limitations of each correlative technique and to assess their consistency. In the past, only a few studies have explored the complementarity between MAX-DOAS and FTIR HCHO measurements. These were conducted in remote mountain-top observatories (Vigouroux et al., 2009; Franco et al., 2015), in remote regions (Ryan et al., 2020) and one in largely polluted area (Rivera Cárdenas et al., 2021) around Mexico City. They led to mixed findings, with biases close to zero or up to about 30 % differences depending on the location, the HCHO abundances and its horizontal inhomogeneity. The different MAX-DOAS (and FTIR) inversion methods used in those past studies is a limiting factor for comparing results from different sites/groups.
The lack of harmonization of the current MAX-DOAS HCHO datasets is an important limitation for its use in satellite validation, and it is being addressed by the recent development of a centralized processing facility for MAX-DOAS, as part of the FRM4DOAS project (Fiducial Reference Measurements for Ground-Based DOAS Air-Quality Observations, https://frm4doas.aeronomie.be/, last access: 12 February 2026; Van Roozendael et al., 2024). FRM4DOAS is an international project funded by the European Space Agency (ESA) aiming at harmonizing and standardizing the data retrieval of MAX-DOAS instruments operated within NDACC. HCHO columns and profiles are currently under scientific testing and have been used in a few scientific studies (Karagkiozidis et al., 2022; Yombo Phaka et al., 2023; Oomen et al., 2024; Lange et al., 2024; Bae et al., 2025), showing very promising results and useful insight in satellite validation during campaigns and new sites development. However, they require further consolidation, so they are not distributed operationally yet. The aim of this study is to explore how the MAX-DOAS HCHO FRM4DOAS retrievals compare with other techniques used for HCHO satellite validation.
In the present study, we take benefit of MAX-DOAS and FTIR spectrometers having been operated in parallel at the Xianghe station (China) during several years, to investigate in detail the agreement of the HCHO retrievals from these instruments in highly variable conditions. Moreover, the MAX-DOAS instrument also incorporates a direct sun viewing mode capability, allowing the comparison of direct sun measurements in the UV and in the IR. This addition is interesting considering the fast growing number of direct sun DOAS Pandora HCHO measurements within the PGN network.
The different instruments and retrievals are presented in Sect. 2 and their comparison is discussed in Sect. 3. We first compare direct-sun DOAS and FTIR data, and then we investigate several MAX-DOAS retrieval approaches and compare their HCHO columns to the direct sun ones. The study also addresses the impact of the different vertical sensitivities of the MAX-DOAS and FTIR techniques (Sect. 3.2.1). Overall the aims are to: (1) assess the quality of the MAX-DOAS HCHO products currently delivered by the FRM4DOAS system and (2) revisit the HCHO retrieval approach used in the system to further improve its accuracy (Sect. 3.2.2) and advise for possible improvements. This work intends to benefit to the whole DOAS community, which will result in more coherent correlative datasets for satellite validation.
The Xianghe Observatory (39.75° N, 116.96° E, 26 m a.s.l.) is a suburban site close to Beijing, China operated/owned by the Institute of Atmospheric Physics (IAP), of the Chinese Academy of Sciences. A MAX-DOAS from BIRA-IASB/IAP was operated on the roof of the LAGEO laboratory (http://lageo.iap.ac.cn/, last access: 12 February 2026) between 2010 and 2022, and a Bruker IFS 125HR FTIR spectrometer from BIRA-IASB/IAP is measuring since June 2018. The MAX-DOAS instrument also includes a direct sun channel. The instruments and their HCHO inversions are described below.
2.1 MAX-DOAS
The MAX-DOAS instrument at Xianghe has been extensively described in past studies (Clémer et al., 2010; Vlemmix et al., 2015; Hendrick et al., 2014). The system has been designed and assembled at BIRA-IASB in Brussels in 2007, then operated in Beijing during the 2008 Olympic Games before participating to the CINDI-1 campaign (Piters et al., 2012; Pinardi et al., 2013) in 2009 and finally being operated from March 2010 to mid 2022 in Xianghe. It is a dual channel system composed of two grating spectrometers covering the UV and visible wavelength ranges (300–390 and 400–720 nm, with a spectral resolution of 0.4 and 0.9 nm, respectively), connected to two cooled (−50 °C) CCD detectors. The spectrometers and detectors are enclosed in a thermo-regulated box that is connected to an external part, the optical head, through optical fibers. The optical head is mounted on a commercial sun tracker (INTRA, Brusag) that allows collecting the scattered light from a series of user-defined elevation and azimuth angles. The measurement routines includes zenith measurements at twilight and off-axis measurements (1, 2, 3, 4, 6, 8, 10, 12, 15, 30° elevation angles and zenith) from 85° SZA (solar zenith angle) sunrise to 85° SZA sunset with a time resolution of ∼ 15 min. After each off-axis scan, a measurement pointing to the sun (direct sun mode, DS) is also performed by means of a diffuser plate mounted on a filter wheel. From 2010 to around end 2015 the instrument was oriented towards the North, then up to 2019 it was turned to 15° W and from November 2019 onward, the pointing direction was changed to close to the South (179° azimuth w.r.t. North) due to an obstruction in the former viewing direction.
The instrumental set up including data transfer is fully automated, allowing continuous daily operation throughout the year. Several products have been retrieved such as aerosols (Clémer et al., 2010), NO2 (Hendrick et al., 2014; Vlemmix et al., 2015), HCHO (Vlemmix et al., 2015), HONO (Hendrick et al., 2014), SO2 (Wang et al., 2014), CHOCHO, and have been used as reference in several satellite validation studies for LEO (e.g., De Smedt et al., 2015, 2021; Theys et al., 2015, 2021; Pinardi et al., 2020; Compernolle et al., 2020; Verhoelst et al., 2021; Lerot et al., 2021) and GEO sensors (Lee et al., 2024; Ha et al., 2024).
The Xianghe MAX-DOAS measurements cover the period from March 2010 to July 2018 and from October 2019 to November 2021 for the UV channel and up to August 2022 for the VIS channel. Between July 2018 and October 2019 there is a data gap due to a failure of the pointing system. The instrument is not operating anymore. In this study, we concentrate on the HCHO data product developed within the FRM4DOAS project, and we focus on the period from 2018 onward, when both the FRM4DOAS system (started in July 2018, see Van Roozendael et al., 2024) and the FTIR instrument were in operation, see Fig. 1.
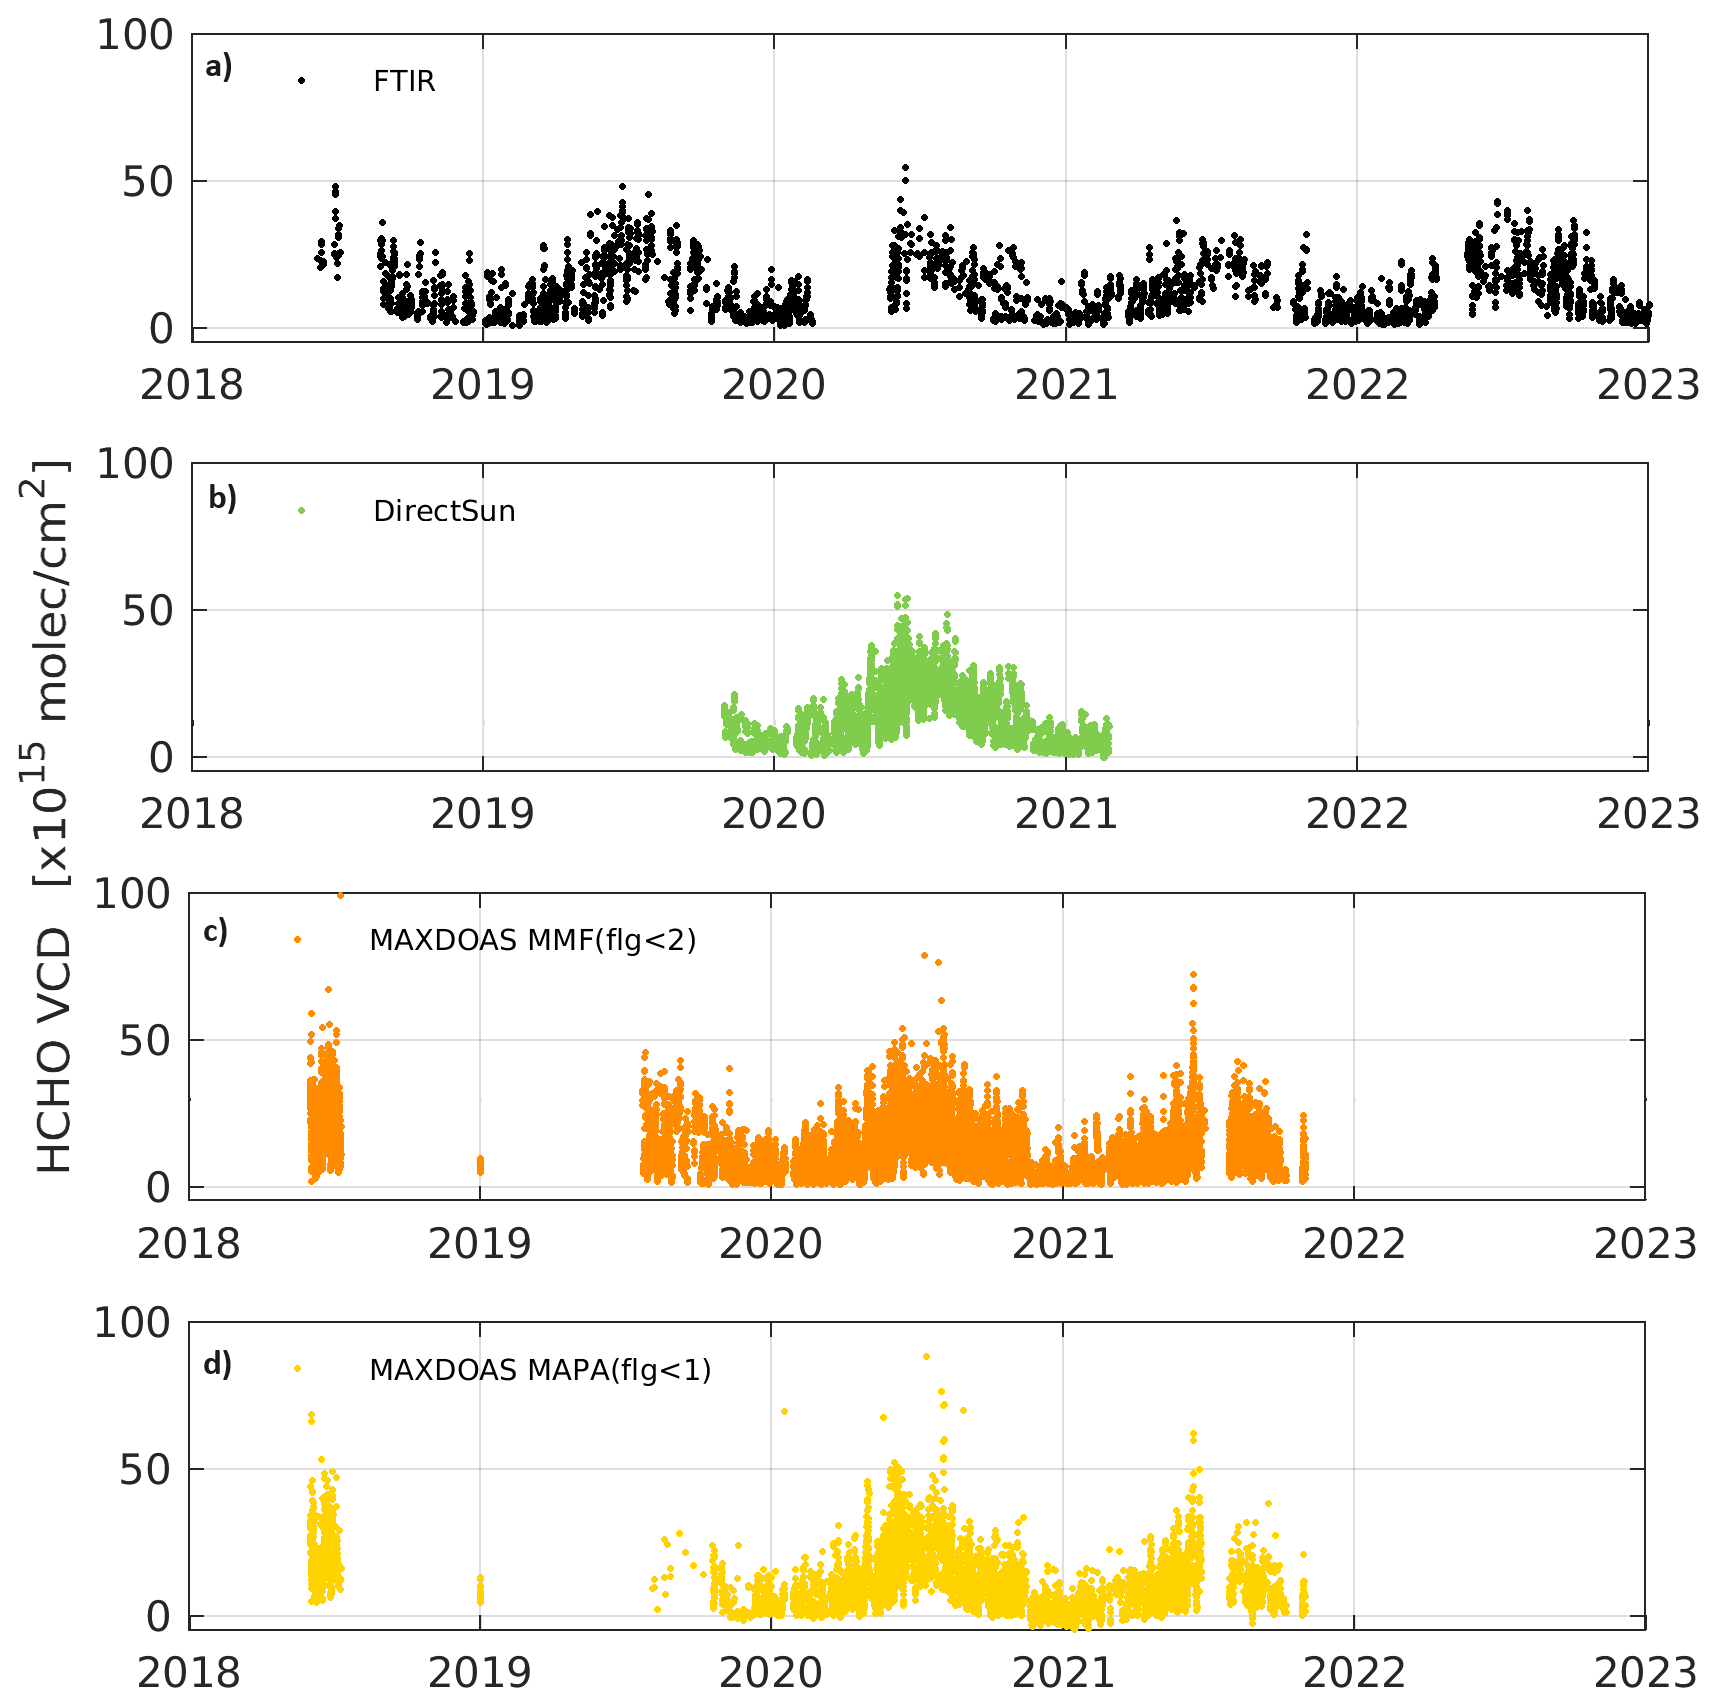
Figure 1HCHO VCD time series derived in Xianghe (China) from FTIR, direct-sun DOAS, and two instances of MAX-DOAS retrievals (MMF, and MAPA).
The measured spectra are analyzed with the QDOAS software (http://uv-vis.aeronomie.be/software/QDOAS/, last access: 12 February 2026; Danckaert et al., 2017), providing DSCDs that correspond to the concentration of the absorber integrated along the effective light path of the recorded sunlight, relative to the amount in the measured reference spectrum. The QDOAS settings used are fully described in the FRM4DOAS Algorithm Theoretical Basis Document (ATBD) (Hendrick et al., 2018), and are summarized in Table 1.
As mentioned in Sect. 1, different types of algorithm can be used to retrieve information about the vertical distribution of aerosols and trace gases from slant columns retrieved within a sequence of elevation angles (the off-axis sequence). Below we describe the specificities of the FRM4DOAS centralized processing system (Van Roozendael et al., 2024), that have been used here for the MAX-DOAS HCHO profile retrievals.
FRM4DOAS incorporates community-based retrieval algorithms into a fully traceable, automated and quality controlled processing environment that provides harmonized vertical columns and profiles for satellite validation. Two codes have been selected for implementation: (1) the MMF (Mexican MAX-DOAS Fit; Friedrich et al., 2019) optimal estimation-based algorithm and (2) the MAPA (Mainz Profile Algorithm; Beirle et al., 2019) algorithm, which is based on a parametrization of the retrieval profile shape and a Monte-Carlo approach for the inversion, see details below.
Both MMF and MAPA codes implement a two-step retrieval approach for trace gas profile retrieval. In the first step, the aerosol profile is determined based on a set of O4 DSCDs. The O4 vertical profile is well-known (it varies with the square of the O2 monomer concentration), and O4 DSCD measurements are used to provide information on the aerosols optical depth (AOD) and the vertical distribution of aerosols (Wagner et al., 2004; Frieß et al., 2006). In the second step, the retrieved aerosol profile is used to constrain the radiative transfer simulations needed for the trace gas retrieval. Both codes start from the same O4 and HCHO DSCD and share the same meteorological input parameters, while other parameters are algorithm specifics, as summarized in Table 2.
MMF and MAPA rely on two conceptually different retrieval strategies, each with distinct strengths and limitations. MMF follows an optimal-estimation framework and explicitly incorporates a priori information on the median HCHO profile, its expected variability in each layer, and the inter-layer correlations. The retrieval iteratively minimizes a cost function that balances deviations from the a priori profile in state space against differences between measured and simulated differential slant column densities in measurement space. The use of explicit a priori information stabilizes the profile retrieval, particularly in altitude regions where the MAX-DOAS sensitivity is limited. However, inaccurate or overly restrictive a priori assumptions may introduce systematic biases in the retrieved profiles. MAPA, in contrast, does not rely on a priori information in the classical optimal-estimation sense but is constrained by the choice of profile parametrization. For example, in the current MAPA version (this is being addressed in a version under development), elevated layers can only be represented in combination with a near-zero surface concentration. While this approach avoids potential biases associated with incorrect a priori assumptions, it lacks the stabilizing effect of explicit a priori constraints and does not allow the inclusion of additional information at altitudes where MAX-DOAS sensitivity is weak. To compensate for this reduced regularization, MAPA retrievals typically require more stringent quality filtering, which may be overly restrictive, particularly under noisy DSCD conditions (Frieß et al., 2019; Karagkiozidis et al., 2022).
The current strategy in FRM4DOAS is to run both MMF and MAPA inversions in parallel in order to combine their strength and mitigating their respective limitations and consolidate the MAX-DOAS results and assessing retrieval uncertainties. FRM4DOAS produces aerosols, NO2 and HCHO tropospheric profiles and columns from both algorithms in near real-time (NRT). For NO2, there is an additional merging step, that is checking the coherence of both inversion results in order to provide consolidated datasets for operational delivery outside of the FRM4DOAS consortium, as harmonized GEOMS format files (GEOMS hdf, https://evdc.esa.int/documentation/geoms/, last access: 12 February 2026). The integrated NO2 partial column up to 2 km and up to 4 km from both algorithms are compared and retained if they agree within their combined uncertainties, and at least one of the individual codes needs to judge a scan as valid (Van Roozendael et al., 2024). The NO2 data are currently in a pre-operational state, with daily transfer of the NO2 GEOMS files to the NDACC rapid delivery database (RD, https://www-air.larc.nasa.gov/missions/ndacc/, last access: 12 February 2026), including a mirroring on the EVDC (ESA Validation Data Center, https://evdc.esa.int/, last access: 12 February 2026), as described in Van Roozendael et al. (2024).
For HCHO profiles, this procedure does not work well as for NO2. There is less light (and thus more noise) in the UV than in the VIS spectra, and the photon path increases with wavelength, so MAX-DOAS has typically lower sensitivity to species in the UV than in the VIS and this sensitivity is less spread vertically than for the VIS species. MMF and MAPA profiles differ in many cases, leading to a limited number of consolidated data if using the NO2 approach as is. As a result, the product is still under development. In this paper we compare MMF and MAPA HCHO profile inversion results to our reference direct sun data (see Sect. 3), and we investigate options to improve the retrievals (Sect. 3.2.2).
2.1.1 MMF profile retrievals
The Mexican MAX-DOAS Fit (MMF; Friedrich et al., 2019), is an inversion algorithm using constrained least-square fitting with an optimal estimation regularization. The intensity mode from VLIDORT 2.7 (Spurr et al., 2001) radiative transfer model is used as forward model and a least-square fitting approach with Levenberg-Marquard iteration as presented in Rodgers (2000) is followed. On each iteration the new state vector x (the gas vertical profile) is calculated from the measurement vector y (a set of DSCDs measured at the different elevation angles forming the scan), the a priori profile xa in concentration (molec. cm−3), the measured error covariance matrix Sm, the a priori covariance matrix Sa, the simulated DSCD of the previous iteration F(xi) and the Jacobians of the previous iteration Ki, as in Eq. (A1) of Friedrich et al. (2019) (Eq. 5.36 of Rodgers, 2000).
The residuals from the QDOAS fitting are in most cases dominated by the random noise of the detector. The measurement error covariance matrix Sϵ is chosen diagonal with values corresponding to the statistical errors on the trace gas QDOAS fitting. This neglects the errors due to temporal changes between measurements.
In the used MMF version, the a priori profile and the associated a priori covariance matrix Sa are constructed as follows. The standard a priori profile xa is constant in time, and corresponds to an exponentially decreasing (with height) profile defined by the a priori vertical column VCDa and a scaling height SH:
where z is the center of the altitude grid above the surface.
The covariance matrices Sa are constructed from the a priori profile, by considering a variance on the diagonal elements and using Gaussian functions to calculate off-diagonal elements Sa i,j, following Hendrick et al. (2004). These account for correlations between trace gas concentrations at different altitude levels:
For HCHO, SH is set to 1 km, VCDa is 8.4 × 10¹⁵ molec. cm−2, the constrain on the diagonal (the scale parameter SaScal) is set to 0.5 and the correlation length η=200 m (see Table 2).
The vertical sensitivity of a retrieved profile x to the true profile xtrue is described by the averaging kernel matrix A:
A is calculated by MMF for each retrieved profile as in Eq. (19) of Friedrich et al. (2019). Each row of A is called an averaging kernel and is associated with the retrieved profile point at a certain altitude. The averaging kernel describes the vertical sensitivity function and how the retrieval distributes a deviation from the true profile into the different vertical layers. It is fundamentally linked to the vertical resolution of the retrieval. Specifically, the trace of A provides an estimate of the number of degrees of freedom for signal (DOFs) which corresponds to the number of independent pieces of information that can be retrieved from the measurements (Rodgers, 2000). The column averaging kernel AKcol (the sum of the individual averaging kernels rows) represents the sensitivity of the VCD to the changes in different heights. In an ideal case, it would be around 1 at all altitudes.
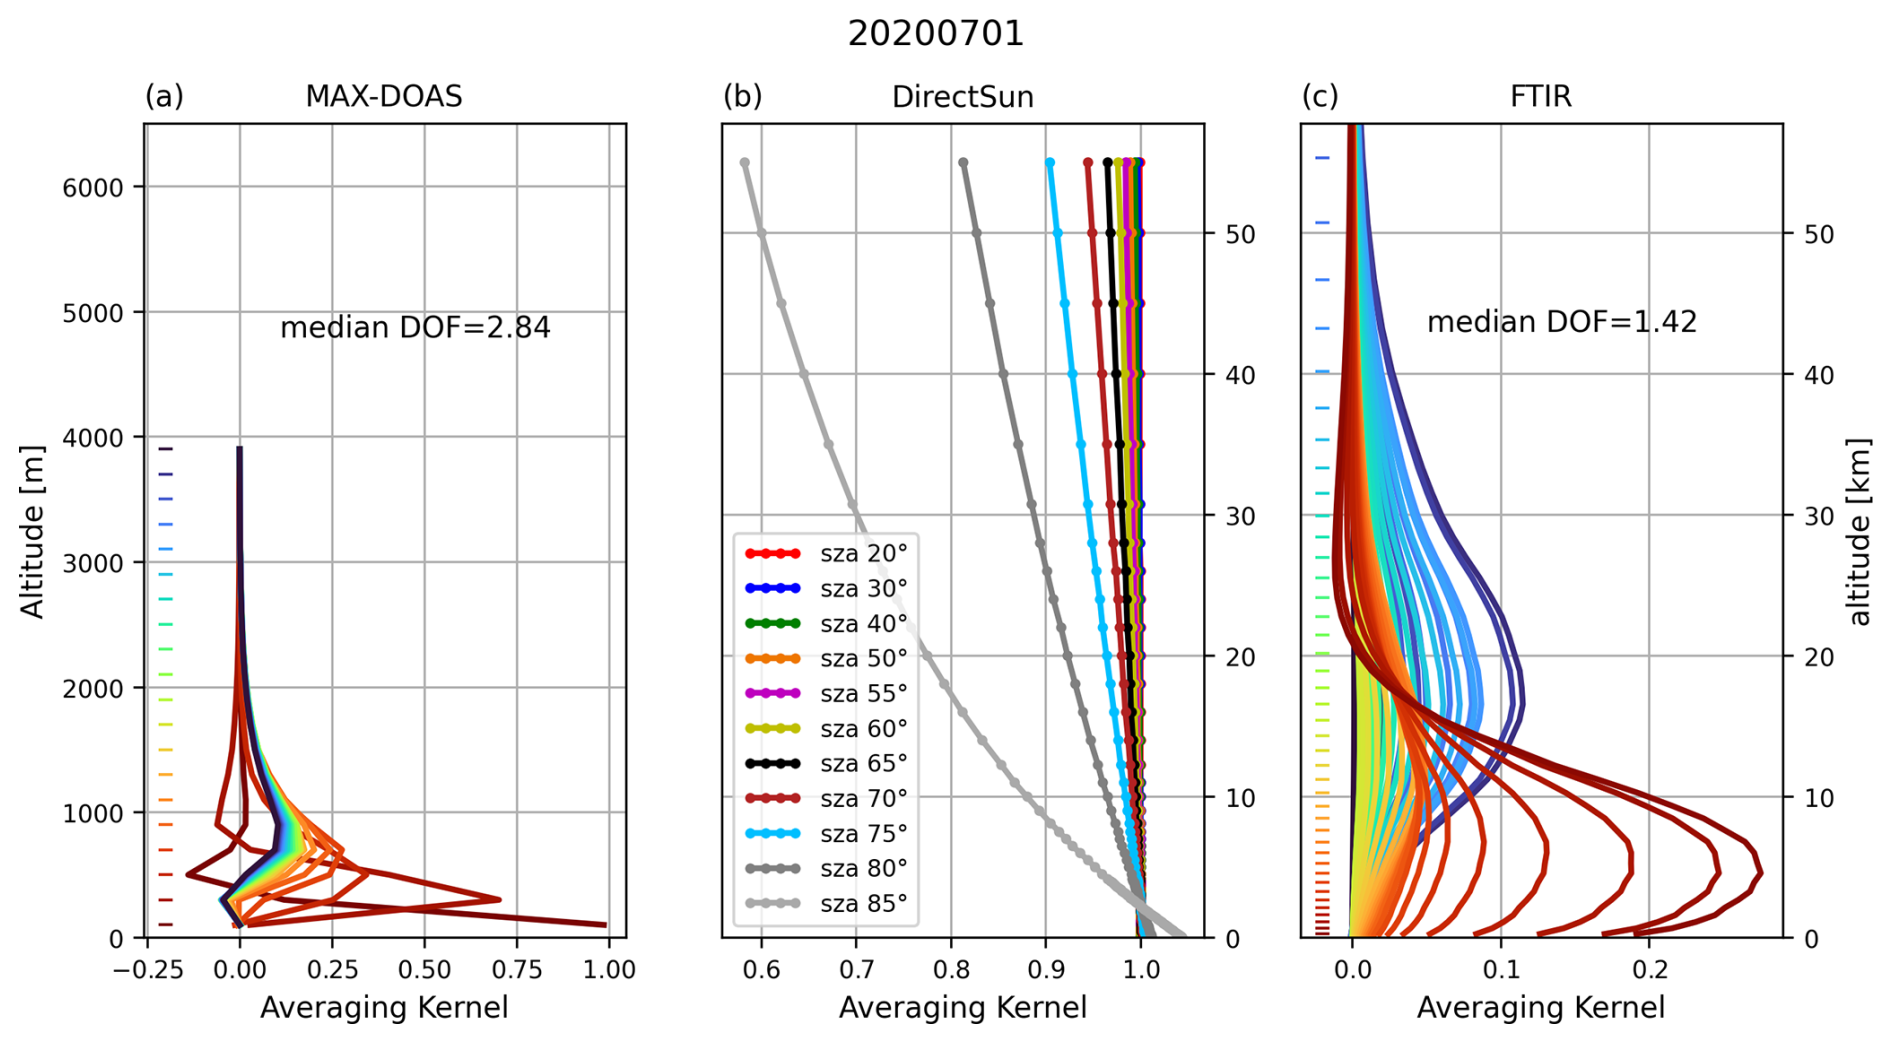
Figure 2MAX-DOAS, direct sun and FTIR HCHO averaging kernels for 1 July 2020. The median DOF for the day is given as insert. For the direct sun, the typical vertical sensitivity total column AK is given as a function of the solar zenith angle (SZA), while for the MAX-DOAS and the FTIR the elements of the AK matrix are shown for each altitude. Note the different altitude scales used for MAX-DOAS (in m) and for direct sun and FTIR data (in km).
An illustration of the averaging kernels for the MAX-DOAS MMF case is given in Fig. 2a for 1 July 2020. It can be seen that for the lowest layers close to the surface, the rows of A have values close to 1, while the sensitivity rapidly decreases above around 1.5 km, reaching values close to zero, where all the information content is coming from the a priori used in the OE inversion. The median DOF for that day is 2.84, sign that there are at least 2 independent pieces of information to be extracted from the profiles. For the whole 2020, the median DOF is of 2.62. The a priori profiles and the cumulative partial column DOF can be seen in Fig. 10 for February and July 2020.
In the following, we will consider the MMF data with its own recommended filtering criteria (qammf<2, i.e. keep valid and warning cases). Three conditions should be met. First, scans with a DOF below 1 are excluded. Secondly, all scans with an average dSCD root mean square (rms) larger than 4 times the DSCD retrieval error are excluded. Finally, due to a lack of good a priori knowledge for the aerosols, two aerosol retrievals are performed (differing by a factor 10 in AOD). If the retrieved aerosol profiles agree well, only one trace gas retrieval is performed and no extra test is applied. If the retrieved aerosol profiles differ by more than 20 % (as averaged partial AOD in each layer), the trace gas profile retrieval is performed with both aerosol profiles, and all scans for which the retrieved HCHO VCD differs by more than 10 % are flagged as invalid.
The errors on the MAX-DOAS VCD are discussed in Sect. A1, along with the direct sun and the FTIR contributions. The error, as the percentage value w.r.t. the VCD columns, is presented as the median value within 5° SZA bins from 15 to 80° SZA, see Fig. A1. MMF errors are of the order of 10 to 15 % of the VCD.
2.1.2 MAPA profile retrievals
The Mainz Profile Algorithm (MAPA; Beirle et al., 2019) is a profiling algorithm that is based on a parametrization approach. Atmospheric profiles are parametrized using three parameters: the integrated column c, the layer height h and the shape parameter s. The main reason to use a low number of free parameters is that the information content of MAX-DOAS observations with respect to the vertical distribution of aerosols and trace gases is limited, and therefore, a sufficiently wide range of possible profile shapes can be retrieved with a limited but appropriate choice of free parameters. With the MAPA choices
-
s=1 corresponds to a box profile with height h, containing column c
-
For s<1, the fraction s×c is within the box of height h, and above (exponentially decreasing)
-
s>1 represents elevated layers.
Additionally, a fourth optional parameter can be included, the O4 scaling factor SF, which was initially introduced by Wagner et al. (2009) in order to achieve agreement between the measured DSCDs and the forward model simulations. As currently there is no consensus for the need or not of such scaling factor or on its explanation (Wagner et al., 2019), three sets of MAPA outputs are run for different possibilities of the O4 scaling factor within the FRM4DOAS centralized processing implementation: using a fixed 0.8 value, using a SF = 1 (ie no scaling factor) and with a variable SF value, fitted to best match the measured and simulated O4 DSCD of each scan. The results of the latter case (variable O4 scaling factor) are used in the following.
MAPA does not perform online Radiative Transfer Model (RTM) simulations but its forward model is provided as pre-calculated look-up tables (LUTs) of differential air mass factors at multiple wavelengths. These LUTs have been calculated offline by a full spherical RTM, McArtim (Deutschmann et al., 2011), following a backward Monte Carlo approach. Since MAPA uses pre-calculated LUTs in combination with a parameterization approach, no a priori values are needed.
The profile inversion relies on finding the minimum differences between measured and modeled DSCDs, leading to the best matching parameters and their confidence interval. MAPA (v0.98) provides various statistics (best match as well as mean and median of the accepted parameter combinations) for the profile parameters as well as for the corresponding profiles. Within the current FRM4DOAS processing chain, only a subset of the MAPA results is included in the output files: the reported VCD are related to the best-match parameters, while the reported profiles are the mean of the ensemble parameters. This has the drawback that the results for the integrated retrieved profile can be different from the retrieved VCD. However, significant differences of both quantities raise a MAPA warning or error. Additionally, the MAPA retrieved (and reported) VCD considers contributions of the full tropospheric column (from the retrieval grid of Table 2) while the profiles stored in the FRM4DOAS output files currently stops at 4 km (output grid in Table 2). A VCD larger than the reported retrieved profile (from 0 to 4 km) can be explained by the contribution of elevated layers above 4 km to the VCD, not reported in the common FRM4DOAS output grid, but the opposite case can also happen. This will be changed in a future version.
MAPA also provides different flags to evaluate the convergence of the algorithm, the consistency of the derived Monte Carlo parameters, and the shape of the profile. More details about MAPA and its flagging algorithm can be found in Beirle et al. (2019). In the following, we will consider the MAPA data with its own recommended filtering criteria, which is qamapa = 0 (i.e., keep only valid cases).
The MAPA VCD error are also included in Fig. A1. They are typically a bit smaller than the MMF ones, as they do not include systematic contribution from the HCHO cross-section, see discussion in Sect. A1.
2.2 Direct sun DOAS
The Xianghe MAX-DOAS also incorporates a direct sun (DS) viewing mode. The optical head is mounted on a commercial sun tracking system from the Brusag company, equipped with photo-diodes that allow to calculate the sun position, and adjust to it precisely thanks to a four quadrant. In order to use the same optical elements than in the MAX-DOAS mode, a diffuser plate is inserted before the fiber by means of one of the positions of the filter wheel. The diffuser plate is needed to reduce the direct sun light intensity and to properly match the field of view of the fiber optic. The direct sun mode is included in the normal measurement routine, after the off-axis elevation scans, leading to, in the best cases, a DS measurement every half an hour, if there are no clouds in the field of view.
Unfortunately the filter wheel had some problems after February 2021, and DS measurements over 2018–2022 are only available for the period November 2019–February 2021.
For the direct sun analysis, the DOAS settings are similar to those used for the MAX-DOAS, but there is no Ring effect, see Table 1. For the retrieval of DS VCDs, slant column densities are first determined with respect to a fixed reference spectrum, and then converted to vertical columns using a geometrical AMF.
One fixed reference spectrum from 15 June 2020 at local noon has been used for the whole time-period analysis and the residual HCHO SCD in this spectrum (2.7 ± 0.16 × 10¹⁶ molec. cm−2) has been estimated using a Langley analysis based on selection of sunny days. It was evaluated from a full year of measurements using the Bootstrap estimation method (Cede et al., 2006). This uncertainty estimation is confirmed by repeating the same procedure using different reference spectra.
An alternative VCD retrieval was tested by using varying reference spectra, one per season, which improves slightly the DOAS fit residuals (as it reduces the impact of small drifts in the instrumental spectral response), but increases the uncertainty on the VCD columns. A fixed reference spectrum was preferred to avoid possible jumps in the time-series related to the uncertainty in the determination of the residual HCHO SCD in each reference spectrum. We used the difference between these two datasets to estimate the error on the residual HCHO content in the reference spectrum. The median difference over the whole DOAS direct sun time-period (November 2019 to February 2021) is of 5.9 × 10¹⁴ molec. cm−2 (about 5.9 %), with a linear regression slope and intercept of about 0.85 and 2.5 × 10¹⁴ molec. cm−2 respectively. The random slant column error coming from the QDOAS fit is of the order of 3 % to 7 % of the VCD up to 60° SZA and around 10 % to 12 % from 60 to 75° SZA on average. The AMF error is of a few percent (3 % maximum), and limited by the non-consideration of refraction effects and a small profile shape dependence at large SZA. The uncertainty related to the HCHO cross-sections temperature dependence is small, of about 0.05 % K−1, and can be neglected in our case, as we use the cross-section at 298 K and the bulk of formaldehyde lies in the troposphere. Adding in quadrature these three components (see Fig. A1), we estimate the total error on the direct sun VCD to be about between 10 % and 13.5 % for the different SZA ranges when considering 6 % for the reference spectra and up to 20 % if we consider 15 % as coming from the difference with respect to an ideal slope of 1.
The total column averaging kernels for UV direct sun geometry (and corresponding airmass factors) were estimated using a ray-tracing model accounting for earth sphericity and the temperature dependence of the HCHO absorption cross sections. We use the formulation developed by Eskes and Boersma (2003) for optically thin absorbers, which relates the averaging kernel to the airmass factor calculation. The HCHO a priori profile is based on monthly averaged CAMS model simulations for the month of June. Tests using a range of other profiles covering a full year show negligeable dependency (< 1 %). The DS is typically sensitive to the whole atmosphere, with averaging kernels close to 1 over the whole altitude range, as seen in Fig. 2b. At large SZA, the effect of the Earth sphericity appears, which slightly increases the sensitivity to the surface compared to the highest layers, corresponding to a decrease of the AK down to about 0.8 at 50 km altitude and 80° SZA.
2.3 FTIR
Since June 2018, a Bruker IFS 125HR spectrometer is measuring at the Xianghe station, on the roof of the same building where the MAX-DOAS is operated. The FTIR instrument is described in detail in Zhou et al. (2023). Although the instrument is primary measuring in the near-infrared region (Yang et al., 2020) due to its affiliation to TCCON (Total Carbon Column Observing Network), it also measures in a mid-infrared spectral range, from 1800 to 5500 cm−1, allowing the retrieval of many atmospheric components, e.g., O3, CH4, CO, C2H2, C2H6, HCN, NO, C3H8 and HCHO (Vigouroux et al., 2020; Ji et al., 2020; Zhou et al., 2021, 2023, 2024a; Sha et al., 2021).
The FTIR retrieval principle is also based on OEM. Volume mixing ratio vertical profile information can be derived from the pressure and temperature dependence of the infrared absorption lines. The magnitude of the AK varies depending on the gas of interest and the chosen fitting micro-windows.
Within the Network for the Detection of Atmospheric Composition Change (NDACC), the HCHO retrieval settings have been harmonized (Vigouroux et al., 2018) to provide a consistent data set among currently 28 FTIR stations, including Xianghe (Vigouroux et al., 2020). The details on the harmonized retrieval settings can be found in Vigouroux et al. (2018). Among the most important ones are the fitted spectral windows (2763.42–2764.17; 2765.65–2766.01; 2778.15–2779.1; 2780.65–2782.0 cm−1) and the spectroscopic parameters used for HCHO and the interfering gases: the so-called atm16 linelist from Geoffrey Toon (JPL, https://mark4sun.jpl.nasa.gov/toon/linelist/linelist.html, last access: 12 February 2026). For HCHO, it corresponds to HITRAN 2012 (Rothman et al., 2013). The WACCM v4 model (Garcia et al., 2007) profiles are used as a priori information for the profiles (WACCM averages from 1980 to 2020). A single profile for each FTIR site is used in the time series retrievals. A Tikhonov L1 matrix (Tikhonov, 1963) is used for regularization (Vigouroux et al., 2018).
The HCHO DOFs are limited to 1.0 to 1.6 depending on the station. The mean DOFS for Xianghe in 2020 is 1.32, with a sensitivity mainly located in the whole troposphere as seen in Fig. 2c. The averaging kernels rows are typically spread over several kilometers and the AKcol peaks around 10 km and is about 0.8 at the surface (see also Fig. 7), sign that about 80 % of the information comes from the retrieval and about 20 % from the a priori.
The uncertainty budget has been calculated at each station in Vigouroux et al. (2018) following Rodgers (2000). Depending on the station, the total systematic and random uncertainties of an individual HCHO total column measurement lie between 12 % and 27 % and between 1 and 11 × 1014 molec. cm−2, respectively. For the Xianghe site, the errors on the HCHO VCD are about 3 % random and 13 % systematic up to 50° SZA, and up to 6 % and 16 % at larger SZA (up to 75°), as can be seen in Fig. A1.
The Xianghe FTIR data covers the period from June 2018 onward and HCHO data (https://doi.org/10.60897/ndacc.xianghe_ftir.h2co_cas.iap001_rd) are available through the NDACC rapid delivery database (https://www-air.larc.nasa.gov/missions/ndacc/data.html?RapidDelivery=rd-list, last access: 12 February 2026). The Xianghe FTIR HCHO time-series are used in the TROPOMI validation (Vigouroux et al., 2020) and in on-going Quarterly S5P validation reports (https://s5p-mpc-vdaf.aeronomie.be/, last access: 12 February 2026), as well as other satellite validation, such as GEMS (Lee et al., 2024), OMI (Müller et al., 2024; Ayazpour et al., 2025) and OMPS (Kwon et al., 2023).
2.4 Models
In this paper, we investigate the vertical distribution of HCHO concentrations near Xianghe and evaluate the impact of varying a priori profiles in MAX-DOAS retrievals. To achieve this, we utilize two three-dimensional chemistry transport models: TM5-MP (1° spatial resolution, 30 min temporal resolution, 34 vertical levels; Williams et al., 2017) and the CAMS global reanalysis (EAC4, 80 km spatial resolution, 3 h temporal resolution, 60 vertical levels; Inness et al., 2019). These models are commonly used as a priori in satellite retrievals. Notably, TM5 is used as an input for the QA4ECV products (GOME, SCIAMACHY, GOME-2, OMI) and for the TROPOMI product (which extracts profiles from the TM5-MP forecast). The CAMS reanalysis profiles have recently been used to generate a consistent ESA Climate Change Initiative (CCI) HCHO climate data record incorporating various satellite sensors. For this study, we consider the monthly averaged profiles from both models, at a resolution of 0.125°, as constructed in the CCI+p L3 satellite data for 09:30 am and 01:30 pm LT, and the cell including Xianghe is considered.
As mentioned above, the FTIR HCHO retrievals rely on a fixed WACCM model profile as a priori (Vigouroux et al., 2018).
An illustration of the HCHO concentration profiles from the different models are presented in Fig. A2. It can be seen that all the models present a decrease of HCHO with altitude, with different rates, depending on the models and the period of the year. The TM5 model has a larger spread in the concentration ranges between the different months of 2020, with smaller values in winter for altitudes between 4 and 20 km. The FTIR a priori profile, from the WACCM average lies in between the CAMS and TM5 monthly profiles and is, by construction, flat in VCD over the year.
In this section, we investigate the coherence of the HCHO VCDs and profiles retrieved from the three instruments presented in Sect. 2. First we focus on the UV and IR direct sun VCD measurements and then the three MAX-DOAS datasets presented in Sect. 2.1 are considered.
3.1 VCD comparisons
Figure 1 presents the different VCD datasets considered in this study, focusing on the 2018–2022 period. All datasets present clear seasonality, with an enhanced HCHO signal in summer (up to 25 × 1015 molec. cm−2 on monthly average) and a reduced one in winter (of about 4 to 5 × 10¹⁵ molec. cm−2, see also Fig. A3 for the monthly medians VCD). The different instruments have different temporal sampling, with typically a measurement every 20 min to half an hour for the MAX-DOAS and the direct sun DOAS (DS) and every hour for the FTIR. The MAX-DOAS instrument also measures under cloudy situations (cloud filtering can be applied in a post-processing step), while DS and FTIR need a clear view of the sun. The different instruments also cover different time-periods, the DS having the smallest data coverage (November 2019–February 2021). We thus focus on that period in the rest of the paper.
3.1.1 FTIR vs. direct sun DOAS
Figure 3 presents a summary of the FTIR versus UV direct sun (DS) comparisons. It includes quantitative comparisons (statistical regression analysis on scatter plots, histogram and time-series of the absolute differences) and visual comparisons of the diurnal evolution of each dataset, separated per season (including their basic statistics). Both ordinary least square linear (Lin) and Theil-Sen (TS; Theil, 1950, Sen, 1968) regression statistics are given as inset in the different scatter plots. A summary of the main statistics is also included in Table 3.
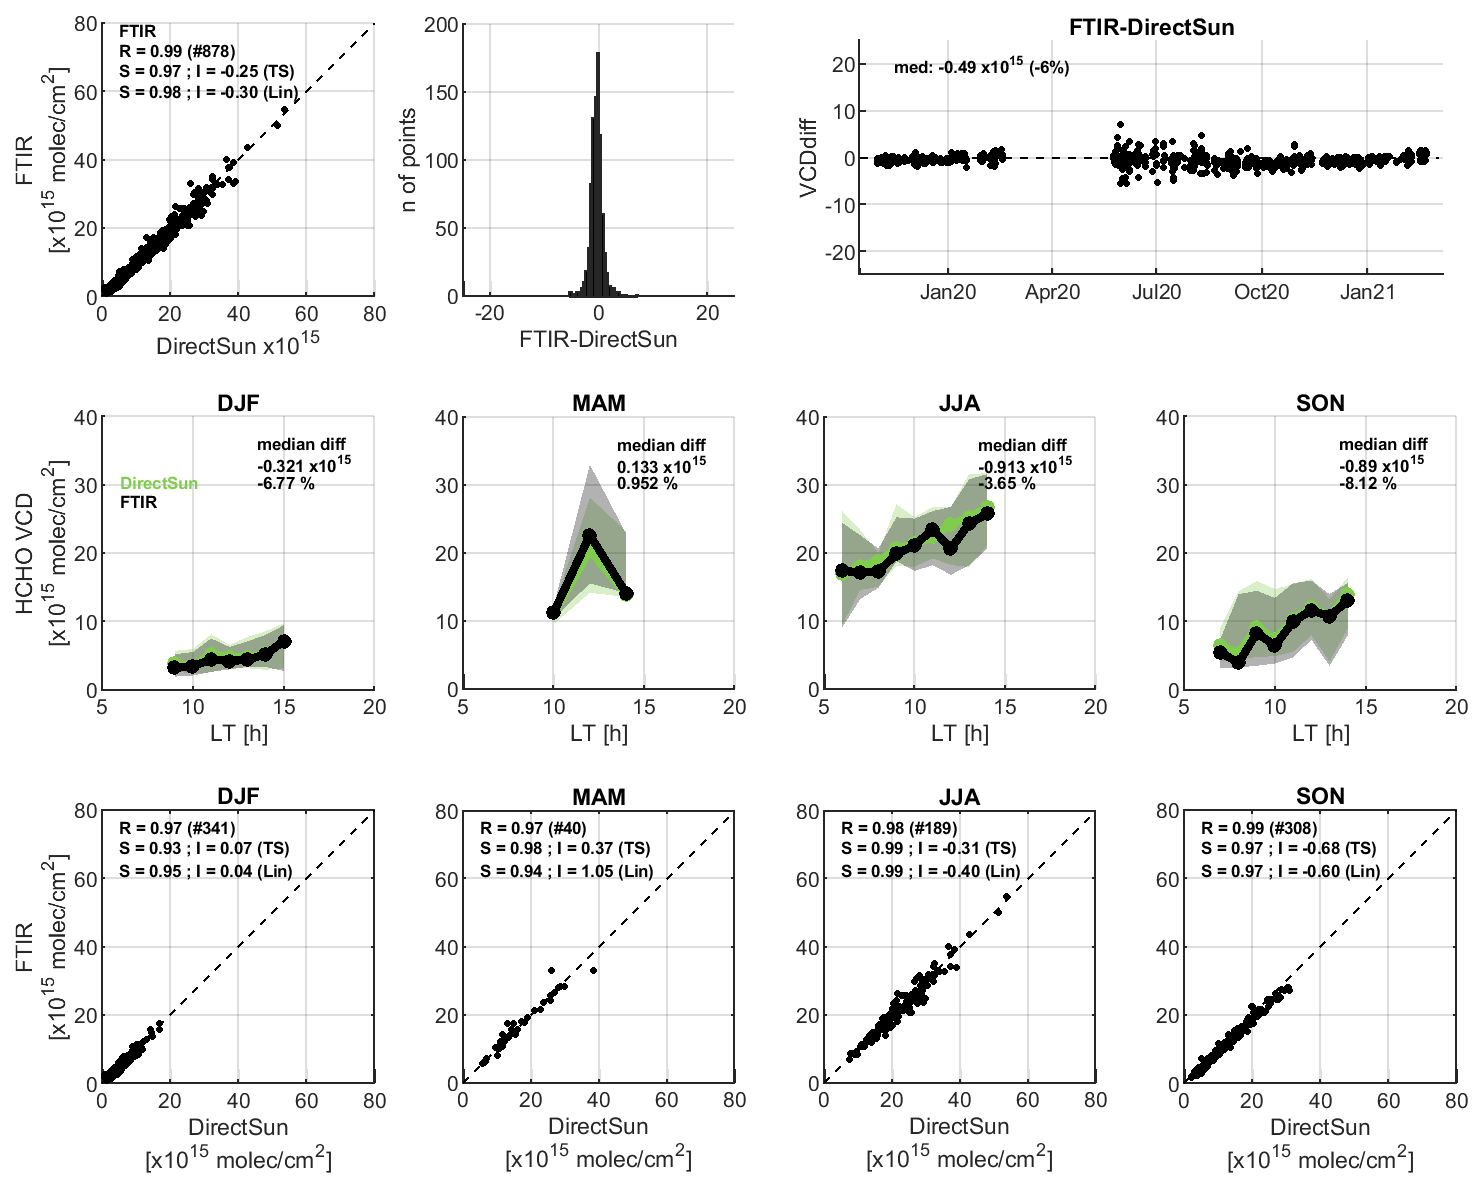
Figure 3Comparisons between FTIR and direct sun HCHO VCD data. The first row presents the comparisons of the whole common period (scatter plot, histogram and time-series of the absolute differences), while the second and third rows present the results separated by seasons. The second row is the median diurnal variation (FTIR in black and direct sun in green), with the percentiles 25 to 75 as a shaded area, while the third row presents the seasonal scatter plots with linear and Theil-Sen statistics given as inset. For the median diurnal variation (row 2) a requirement on having at least 5 points per hour has been considered.
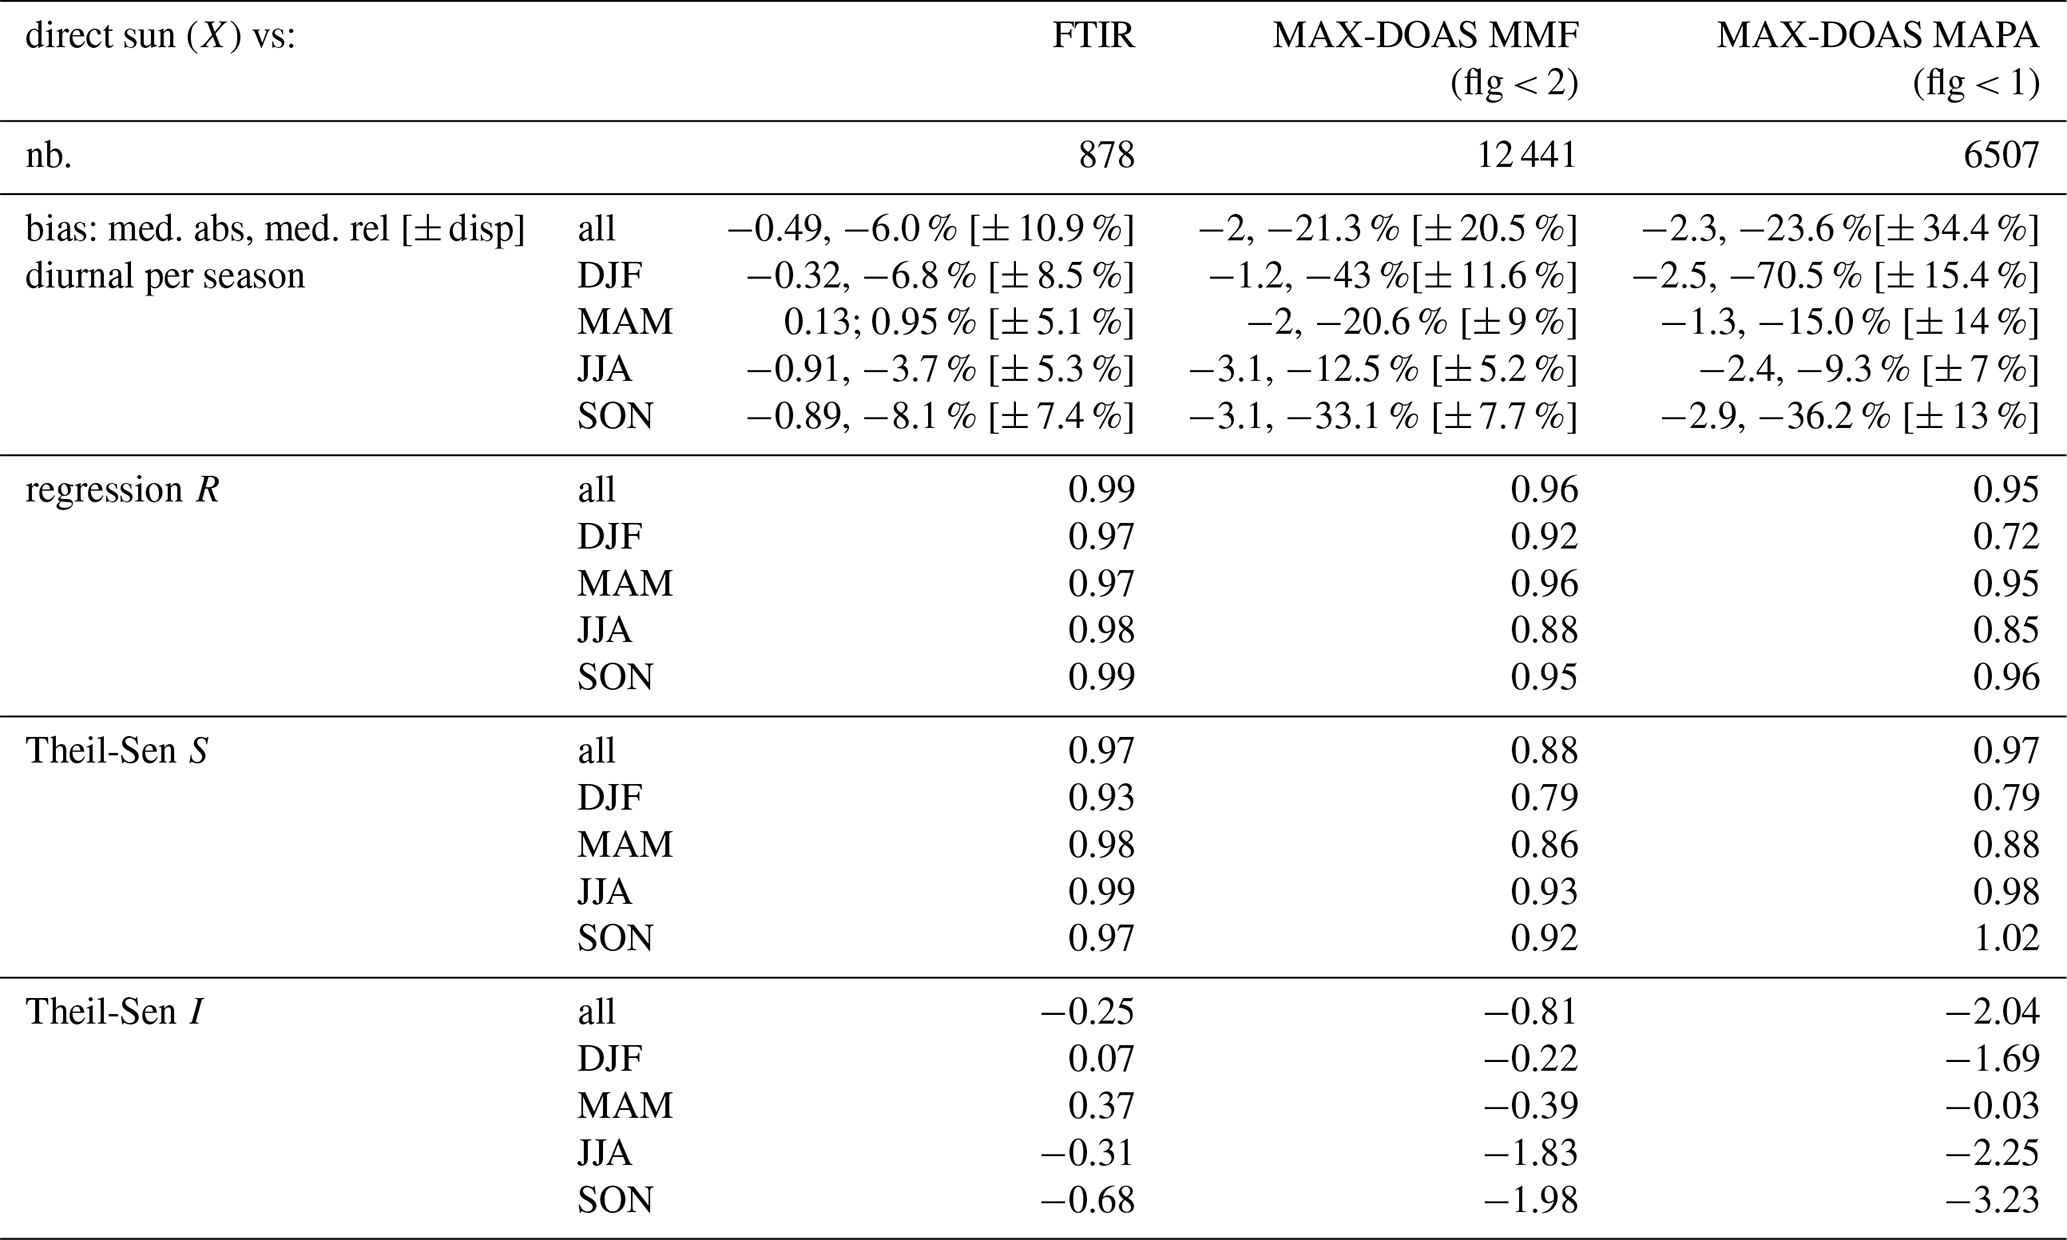
Table 3Summary results of the HCHO VCD direct sun (X) vs. FTIR and the different MAX-DOAS datasets (Y). The number of comparison points, the total median bias (abs = Y−X and rel = and the median diurnal bias per season are given in the first row, while the Pearson correlation coefficient R and the Theil-Sen regression analysis (slope S, intercept I) for the whole comparisons and for seasonal subsets are given in the following rows. Biases and intercepts I are given in × 1015 molec. cm−2. Relative biases and dispersion (as half the interpercentile 68 of the relative differences IP68/2) are given in percent. A minimum number of 5 points per hourly bin is required for the diurnal per season comparisons.
Data for each data set are selected if available within ±30 min of the DS and interpolated on a common temporal grid. It can be seen that the two datasets compare very well, with Pearson correlation R and regression slopes S (both Lin and TS) around 1 for all the periods, small intercepts and very coherent diurnal variations for all the seasons.
The largest discrepancies are found in winter for the slopes (around 0.93 for TS, a bit smaller than the other seasons) and in autumn for the intercept (about −0.68 × 10¹⁵ molec. cm−2). The median of all the FTIR-DS differences is −0.5 × 10¹⁵ molec. cm−2 (−6 % ± 11 %), well within the systematic uncertainty budgets. The largest difference is about −0.9 × 10¹⁵ molec. cm−2 (−8.1 %) in autumn (SON). In this comparisons we only focused on the VCD and we did not take into account the difference in sensitivity of the DS UV and FTIR, as this is small. The DS UV AK are only deviating significantly from 1 for SZA values around 75° and above (with larger values up to 1.04 below 2 km for the extreme 85° SZA case), while the FTIR AK are a bit smaller than 1 (with values down to about 0.8) below 1 to 1.5 km and larger above, see Figs. 2b and 7. Using the largest DS AK (for SZA = 85°) on the FTIR profiles would typically increase the HCHO profile below 2 km height and decreasing the profiles above, but we don't have many FTIR measurements for SZA > 75°. We made a test for a few days applying the DS UV 85° SZA AK to FTIR profile, with changes on FTIR VCD smaller than 0.5 %.
Unfortunately, the diurnal cycle can only be compared until 14:00–15:00 LT due to the lack of FTIR measurements after that time for the following reasons: (1) exhaustion of liquid Nitrogen around 15:30 LT in the summer time between June–September 2020, and (2) a temporary problem in the measurement recording script for HCHO between October 2020 and January 2021. Moreover, it should be noted that for the diurnal variations subplots, a requirement of at least 5 coincident points per hour has been set, which explains the peculiar diurnal variation for MAM, when only 40 comparison pairs (over 878) are available. This is in part due to the measurement gap in the FTIR dataset in March–May 2020. The comparison in MAM is still good, but the diurnal variation is not trustworthy due to the small number of points.
This level of agreement reflects the quality of the instruments, the maturity of the HCHO spectral fitting procedures, as well as the consistency of the HCHO spectroscopic data used in both wavelength ranges. These two datasets are therefore excellent references to test the different MAX-DOAS retrieval strategies. We have chosen the DS as the reference in the following section because of the larger number of possible comparison pairs with the MAX-DOAS.
3.1.2 MAX-DOAS vs. direct sun DOAS
Figure 4 shows the seasonal diurnal variations of HCHO VCD measured by MAX-DOAS compared to those measured by direct sun UV, for the two MAX-DOAS retrieval strategies: (a) MMF and (b) MAPA. For each dataset, data are selected as in Sect. 3.1.1. A summary of the main statistics is also included in Table 3.
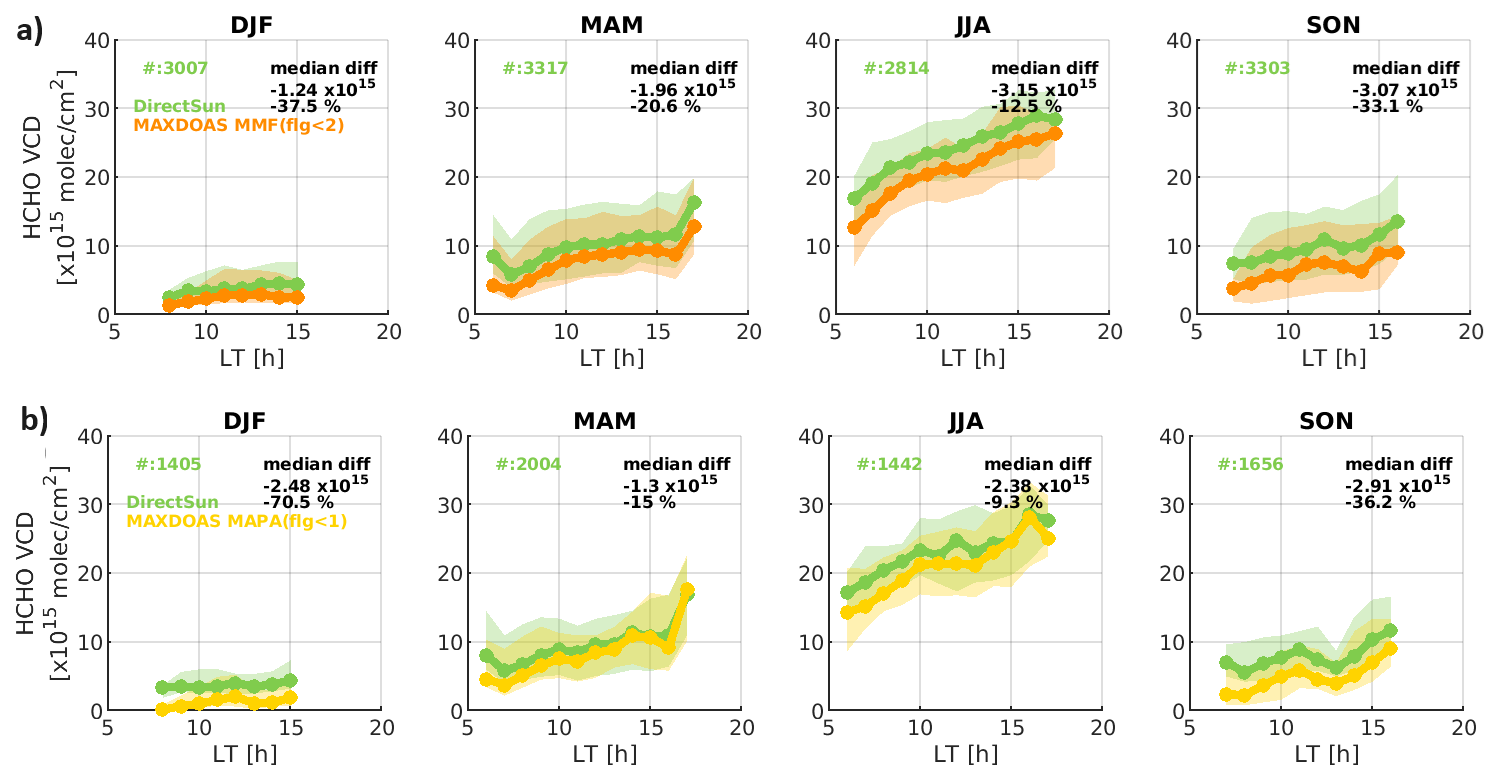
Figure 4MAX-DOAS vs. UV direct sun HCHO VCD median diurnal variations per seasons, for different MAX-DOAS retrieval strategies: valid (a) MMF results and (b) MAPA results. Only the respective valid data (qa flag < 2 and < 1 for MMF and MAPA, respectively), as described in Sect. 2.1.1 and 2.1.2, are considered. The number of coincidences for each season are given in each subplot, while the median absolute and relative difference (MAX-DOAS minus DS) are given in the upper right corner of each subplot. A minimum number of 5 points per hourly bin is required.
It can be seen that all the datasets show similar median diurnal patterns, but with a systematic under-estimation (around −22 % on average for the statistics using all seasons, see Table 3) of all the MAX-DOAS VCDs compared to the direct sun VCDs. A striking feature is the different number of coincidences for the two MAX-DOAS datasets, around 3000 each season for the MMF case (where the quality filter is less stringent), to about 1500 to 2000 for MAPA (only the best quality data is retained as default). The median difference is even larger in DJF and SON when HCHO is typically smaller, with differences up to 70 % (for MAPA) and 38 % (for MMF). MAPA typically retrieve smaller columns than MMF for small HCHO columns, and larger ones for large columns, as also seen and discussed in Karagkiozidis et al. (2022). In addition, MAPA allows retrieval of negative VCD, which mostly occur in winter, exacerbating the large negative bias with respect to the DS. In winter the slopes are smaller (around 0.8) (multiplicative bias) while in autumn the difference seems to be more an additive bias, with larger intercepts.
When considering the common points between the two MAX-DOAS algorithms, the median biases values and regression parameter with respect to the DS UV can change significantly, with MMF and MAPA results closer one to another, sign of an important contribution of the different sampling (from each algorithm flagging or from collocation to DS or to FTIR) on the VCD (not shown). The effect of the sampling is strongest in winter time but the under-estimation of the MAX-DOAS versus DS remains in all cases.
It should be noted that an under-estimation of the MAX-DOAS columns (being sensitive only in the first kilometers of altitude as discussed in Sect. 2.1) compared to the DS data that are sensitive to the whole atmospheric content (see Sect. 2.2, and Fig. 2) is in part expected.
This under-estimation of the MAX-DOAS is in line with results published in Tirpitz et al. (2021) as part of the second Cabauw Intercomparison of Nitrogen Dioxide measuring Instruments (CINDI-2) where direct sun DOAS HCHO products were higher compared to MAX-DOAS HCHO products. Likewise, recent comparisons of direct sun and MAX-DOAS HCHO measurements from Pandora/PGN instruments used to validate satellite data over a large number of sites also show larger biases for the PGN direct sun data (for both OMI (Herman and Mao, 2025) and GEMS (Fu et al., 2025)). However, the authors of the latter study claim that the difference found in their study is larger than what a free tropospheric HCHO could explain, and they suggested that, in some sites, the Pandora direct sun product may overestimates HCHO. One illustration is the comparisons in Bae et al. (2025) between collocated MAX-DOAS and Pandora instruments in Incheon (Korea) that showed an initial large over-estimation of the direct sun PGN HCHO data (126 %), that was reduced to around 30 % after data revision by the PGN team. The study of Bae et al. also showed that off-axis PGN data agreed well with the collocated MAX-DOAS tropospheric HCHO VCD, in line with previous MAX-DOAS intercomparisons (Pinardi et al., 2013; Kreher et al., 2020; Tirpitz et al., 2021).
3.2 Profile comparisons
The next step is to understand the origin of the VCD under-estimation of the MAX-DOAS by looking at the differences in the shape of the retrieved profiles. Indeed, as discussed above, the MAX-DOAS retrievals are very sensitive to the HCHO concentration in the lowest atmospheric layers and optimal estimation retrieval schemes are strongly dependent on the a priori profiles at altitudes above 2 km. The UV DS method is sensitive to the whole atmosphere and does not provide a profile, while the FTIR inversion provides a profile, but with a low associated DOF (1.3 on average for the year 2020), meaning that the retrieved profile shape is mostly constrained by the a priori profile, coming from the WACCM model.
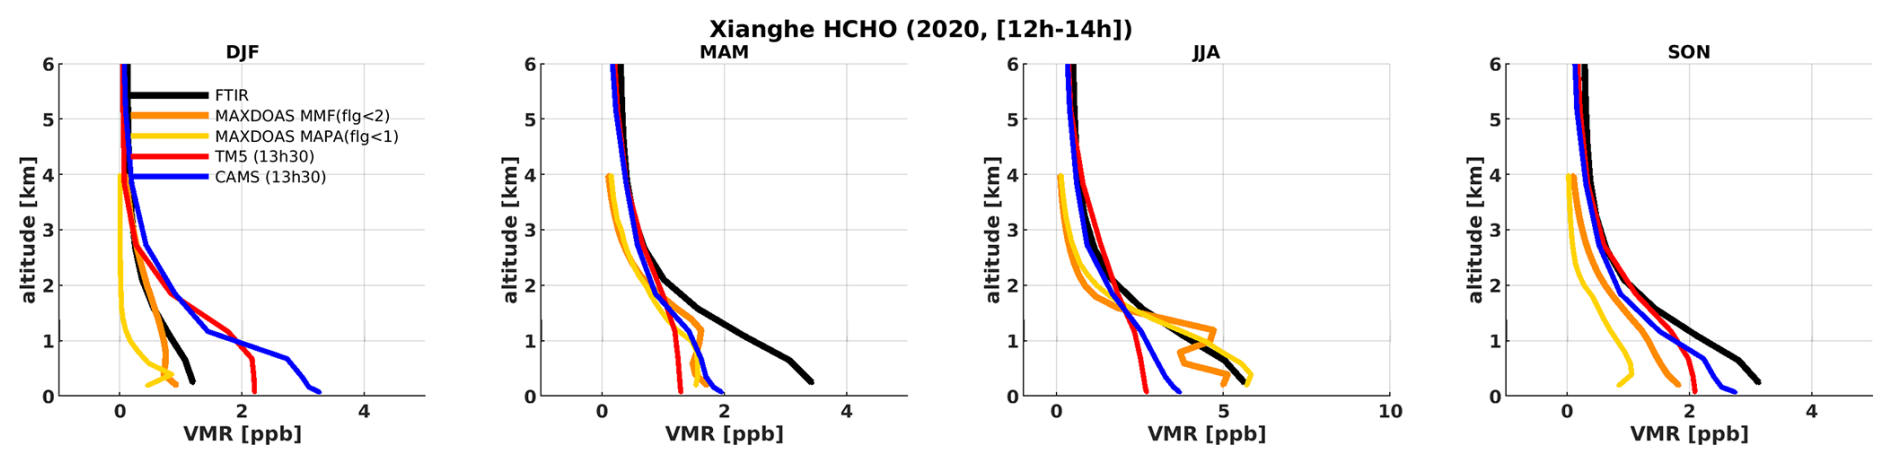
Figure 5Seasonally averaged HCHO retrieved VMR profiles from FTIR (black), MAX-DOAS (MMF and MAPA in different colors) and TM5 (red) and CAMS (blue) models.
We refer to Figs. A3 and A4 in Appendix A2 for a discussion on the quantitative evolution of the partial columns and the H75 (i.e., the altitudes where the cumulative partial column reach 75 % of the retrieved column profile). Here, we compare MMF and MAPA to FTIR profiles and to CAMS and TM5 models. Figure 5 shows the seasonal averages of all the datasets between 12:00 and 14:00 LT. When MMF and MAPA disagree the most (in winter and autumn), MAPA retrieved profiles have a tendency to decrease faster with altitude (see Fig. A4 in Appendix A2).
The MMF profiles present some oscillations in summer (JJA), which are likely an indication of the breakdown of the retrieval assumptions and an underestimation of the errors for these conditions. The presence of horizontal gradients or large temporal inhomogeneities within an elevation scan can change the state of the atmosphere and call into question the retrieval assumptions.
The largest difference between MAX-DOAS and FTIR profiles is obtained in autumn (SON), when the FTIR VMRs are larger at all altitudes. This is also true in spring (MAM), but there are only a few FTIR measurements in coincidence with the MAX-DOAS measurements in the March to May 2020 period (cf discussion related to Fig. 3), so this comparison is less representative.
There is generally a good consistency of the model profiles among them above 1 km, with larger differences at the surface. In summer (JJA) and winter (DJF) VMR values from both models are outside of the range of the retrieved VMRs in the first kilometers (respectively lower and larger than the inversions). Both CAMS and TM5 models, and the FTIR profiles, indicate the presence of a significant amount of HCHO above ∼ 4 km, where the MAX-DOAS is not sensitive (see Figs. 2 and 7 and respective discussions) and where the OE retrieval is strongly constrained by its (exponentially decreasing) a priori. MAPA profiles are also characterized by a rapid decrease with altitude, and they generally yield lowest concentrations in winter and autumn. In this case it is not related to a priori restrictions as MAPA does not rely on a priori estimations, but it can be related to assumptions made in the parametrization scheme and to the fact that, also for MAPA, the sensitivity of the technique is small above 4 km of altitude.
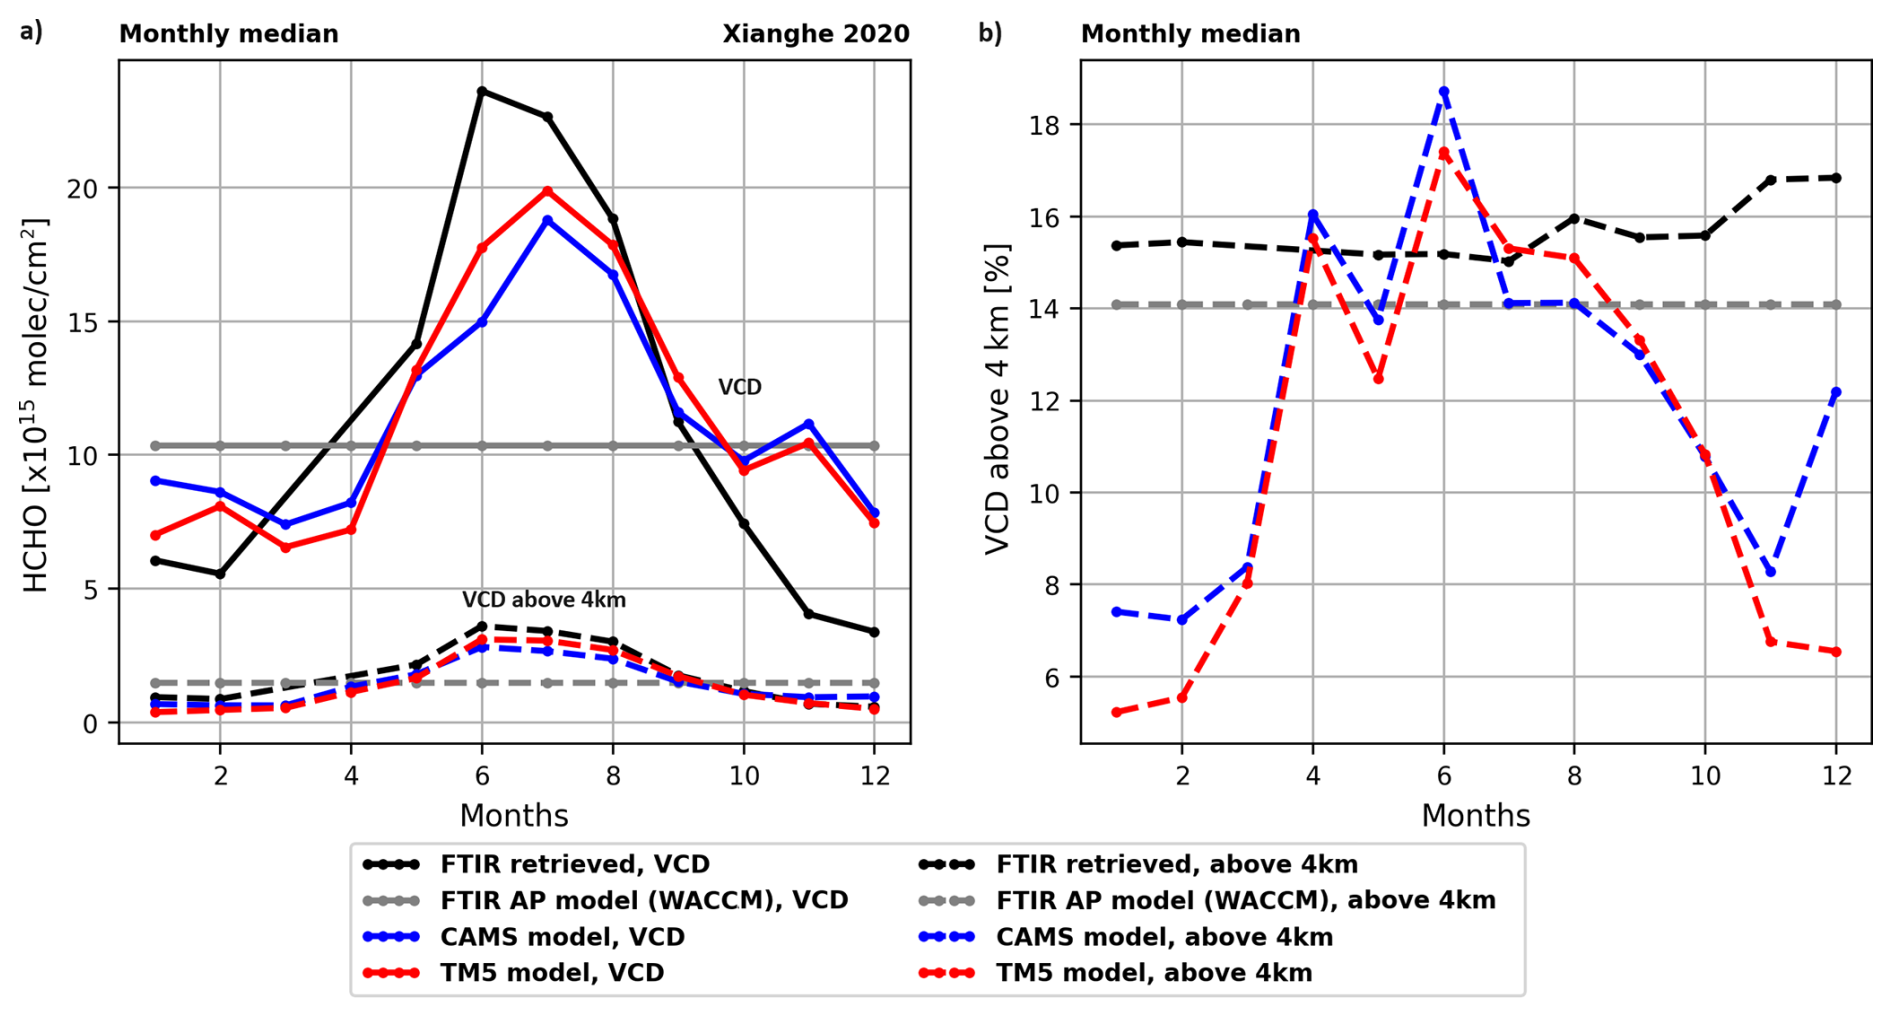
Figure 6Time evolution of the monthly means HCHO VCD from FTIR a priori (gray), FTIR retrieval (black) and TM5 (red) and CAMS (blue) models over the year 2020. Both the total VCD (plain lines) and the partial columns of all the layers above 4 km (dotted lines) are shown in panel (a). Panel (b) shows the relative contribution of the upper layers compared to the total VCD.
The systematically smaller concentrations of the MAX-DOAS retrievals compared to FTIR and to model profiles is clear above ∼ 2 km altitude in all seasons except winter. The underestimation of the MAX-DOAS columns compared to direct sun ones (cf Fig. 4) for those seasons could thus be due to a missing free-tropospheric HCHO column in the MAX-DOAS retrievals. In Fig 6, we evaluate both model data above Xianghe for the year 2020 and we quantify how much of the total HCHO VCD resides above ∼ 4 km. Both models are quite consistent, and suggest that approximately 6 % to 10 % of the total HCHO columns resides above 4 km in autumn/winter, and about 12 % to 18 % in March to September. This free tropospheric (above 4 km) HCHO content reported by the models explains part of the the gap between MAX-DOAS and direct sun columns. We also added FTIR a priori AP (a fixed WACCM profile) and the retrieved FTIR, showing smaller retrieved VCD in winter and larger in summer, compared to the fixed prior. This is true both for the VCD and for the VCD above 4 km, as by construction the FTIR retrieval is strongly constrained by its prior vertical shape. The FTIR part above 4 km is about 14 % to 16 % of the VCD.
3.2.1 MAX-DOAS vs. FTIR robust profiles comparison
To quantitatively compare the MAX-DOAS and FTIR retrieved profiles, we need to consider their respective vertical sensitivities. An illustration of the median HCHO column averaging kernels (AKcol) for the three techniques (MAX-DOAS, DS UV and FTIR) over the whole 2020 period is given in Fig. 7.
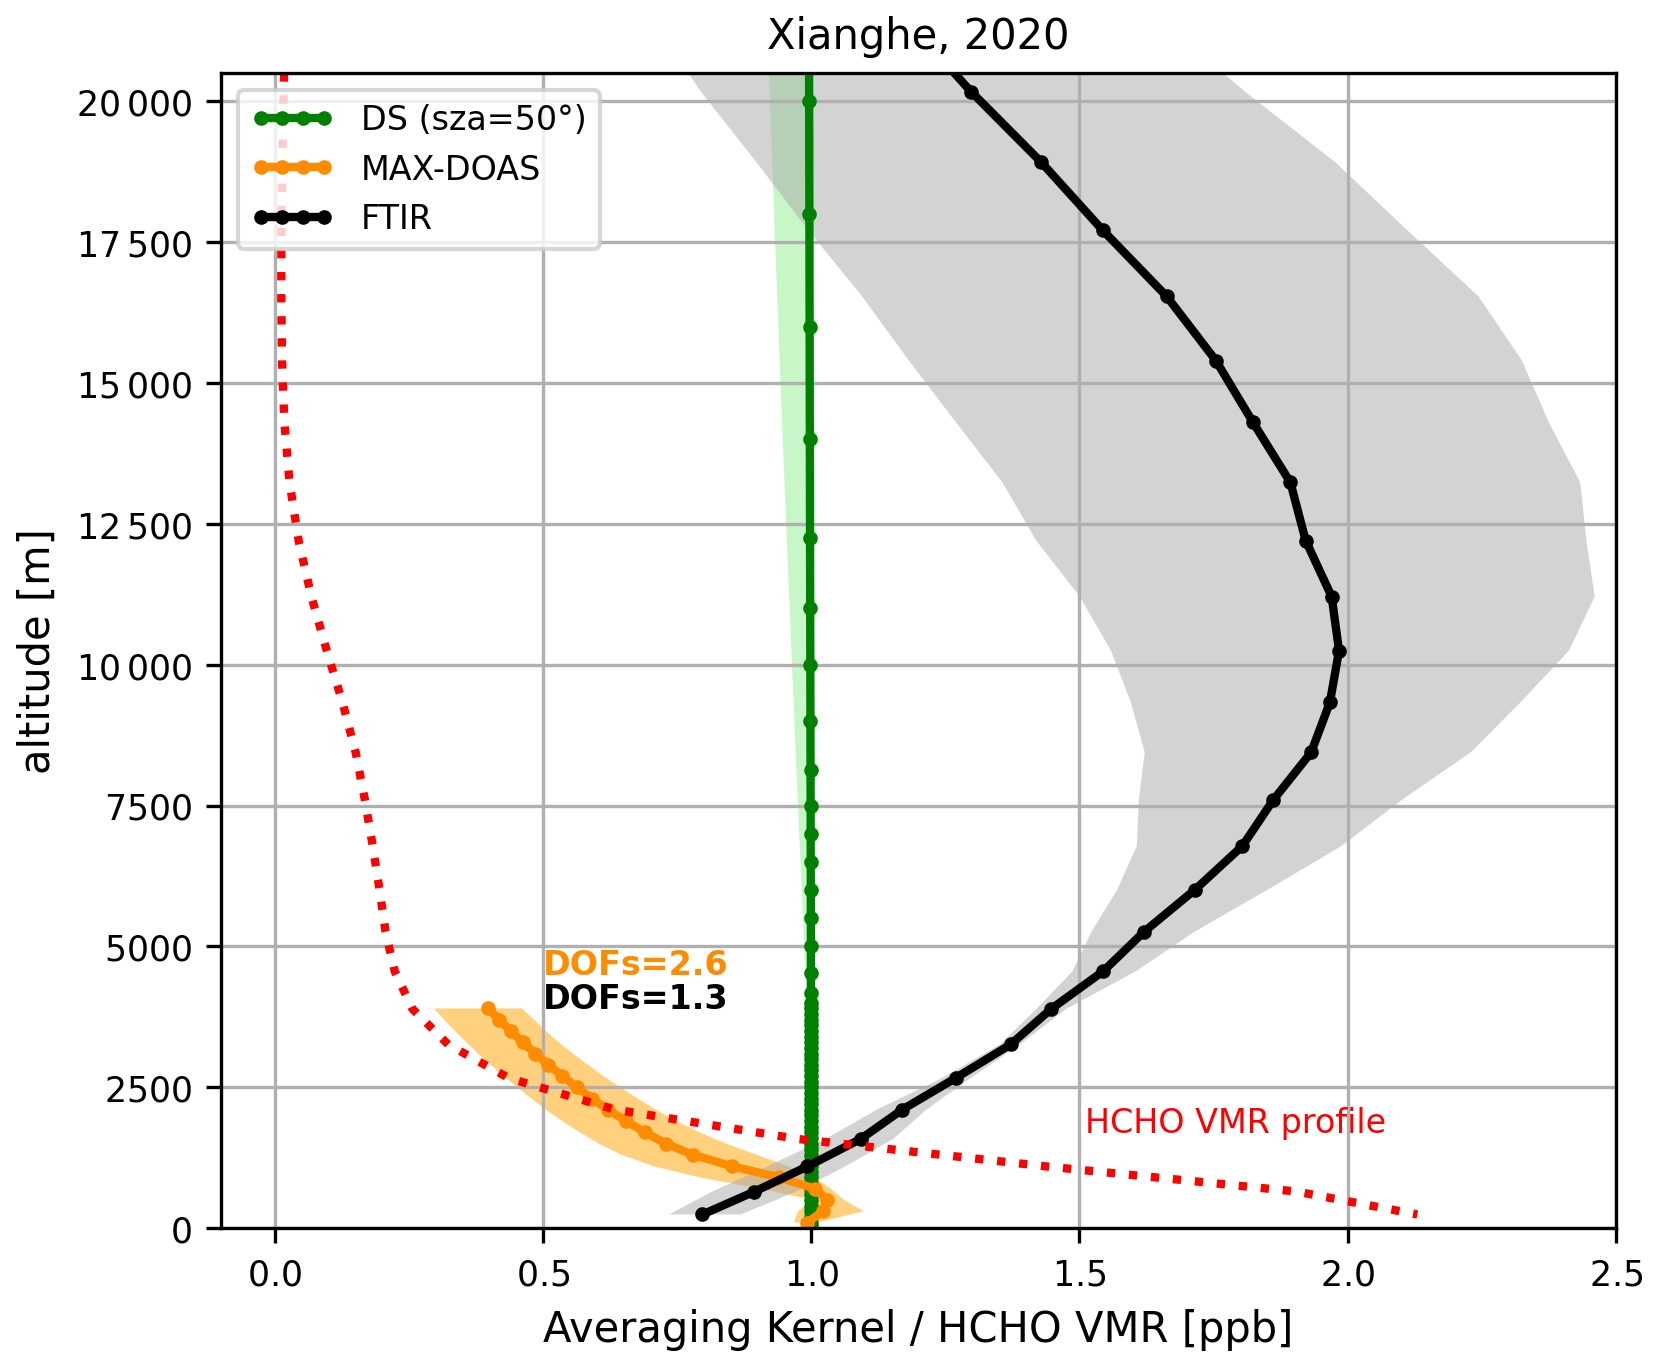
Figure 7MAX-DOAS, FTIR and UV direct sun (DS) HCHO median column averaging kernels and median HCHO VMR profile from FTIR. The median values over the year 2020 are plotted for FTIR and MAX-DOAS, and the 25–75 percentile range is given as a shaded area.
As discussed for Fig. 2, the sensitivity of the UV direct sun measurements does not depend as much as for the other techniques on the altitude and the AK values are close to 1 over the full range of relevant altitudes up to about 75 to 80° SZA. For the MAX-DOAS, the largest sensitivity is maximum close to the surface and decreases relatively fast after 1 km of altitude. On average in this case, 100 % of the retrieved information comes from the measurement nearby the surface, while at about 2 km of altitude 50 % of it comes from the a priori. For the FTIR, the sensitivity is spread throughout the troposphere, with only about 75 % of the information coming from the measurement at the surface, and then an increasing dependence on the a priori above the first kilometers, with a tendency to be larger than 1 and peaking around 10 km of altitude. Note that this does not affect much the FTIR HCHO VCD retrieval as the typical HCHO vertical profile is peaking at the surface, and is rapidly decreasing above 2 km, as shown with the red dotted curve in Fig. 7.
In order to compare MAX-DOAS and FTIR profiles accounting for their respective measurement sensitivities, the method of Rodgers and Connor (2003) is used. It requires the regridding (and extrapolation if needed) of one data set on the altitude of the other, followed by the substitution of the a priori profile.
In our case, the common a priori profile is chosen to be the one used in the FTIR retrievals (), and we adjust the MAX-DOAS retrieved profile by adding the term , as in Eq. (10) of (Rodgers and Connor, 2003):
where M stands for MAX-DOAS and F for FTIR. This substituted profile is then smoothed by the 2nd instrument averaging kernels following Eq. (25) of Rodgers and Connor (2003). For that, they need to be defined on the same altitude grid. This is done by regridding from the MAX-DOAS grid to the FTIR one () with an extension above 4 km based on the FTIR retrieved profile.
The MAX-DOAS substituted profile is smoothed by the FTIR averaging kernels AF:
This approach follows Rodgers and Connor (2003): the highest resolution instrument is smoothed with the lowest one averaging kernels. In our case, the MAX-DOAS profile (substituted with the FTIR a priori) is regridded on the FTIR altitude grid and smoothed with the FTIR AK. In this way, we can reconstruct the MAX-DOAS profile as seen by the FTIR. This is the approach also taken in Vigouroux et al. (2009), Ryan et al. (2020) and Rivera Cárdenas et al. (2021).
As the FTIR profile is defined up to 100 km of altitude, we can follow two approaches when regridding and smoothing the MAX-DOAS profile: (a) extending the MAX-DOAS profile up to 100 km in order to remain consistent with the FTIR retrieval, or (b) only focus on the altitude range from the surface up to 4 km, where the MAX-DOAS profiles are originally defined. The second approach is meaningful in our case as the FTIR cumulative DOF up to 4 km is of about 0.8 in all seasons. The statistical results for MAX-DOAS MMF vs. FTIR, before and after the substitution and smoothing for the two options, are summarized in Table 4. The median bias and the regression results change significantly for the original comparisons (due to the inclusion or not of the FTIR contribution above 4 km), but are very coherent after the substitution and smoothing.
Table 4Summary of the smoothing tests between FTIR (F, m1) and MAX-DOAS (M, m2) over 2018–2021 for the first line and over 2020 for the other cases. Median relative differences , Pearson correlation R and Theil-Sen regression slope S and intercept I are given for the original comparisons and after substitution + smoothing. Intercepts are in × 1015 molec. cm−2 and median relative differences and the dispersion around it in percent.
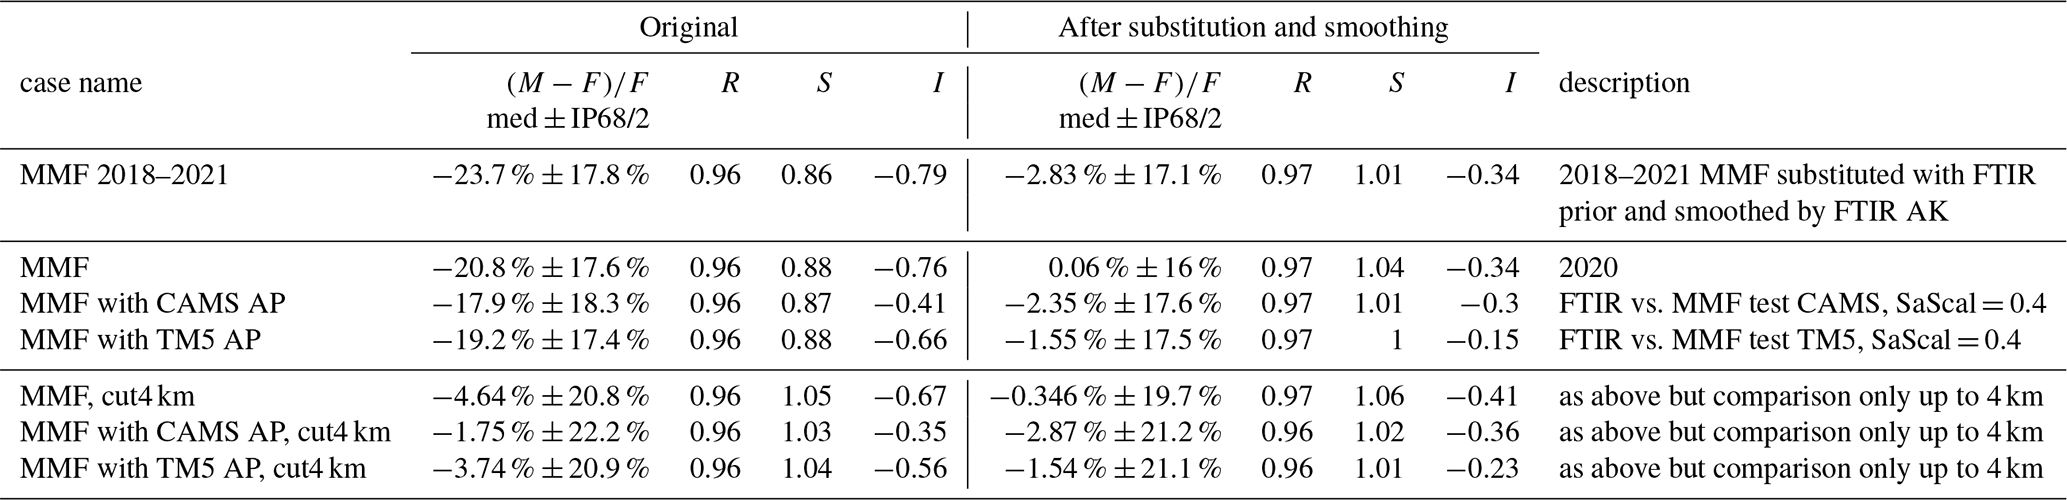
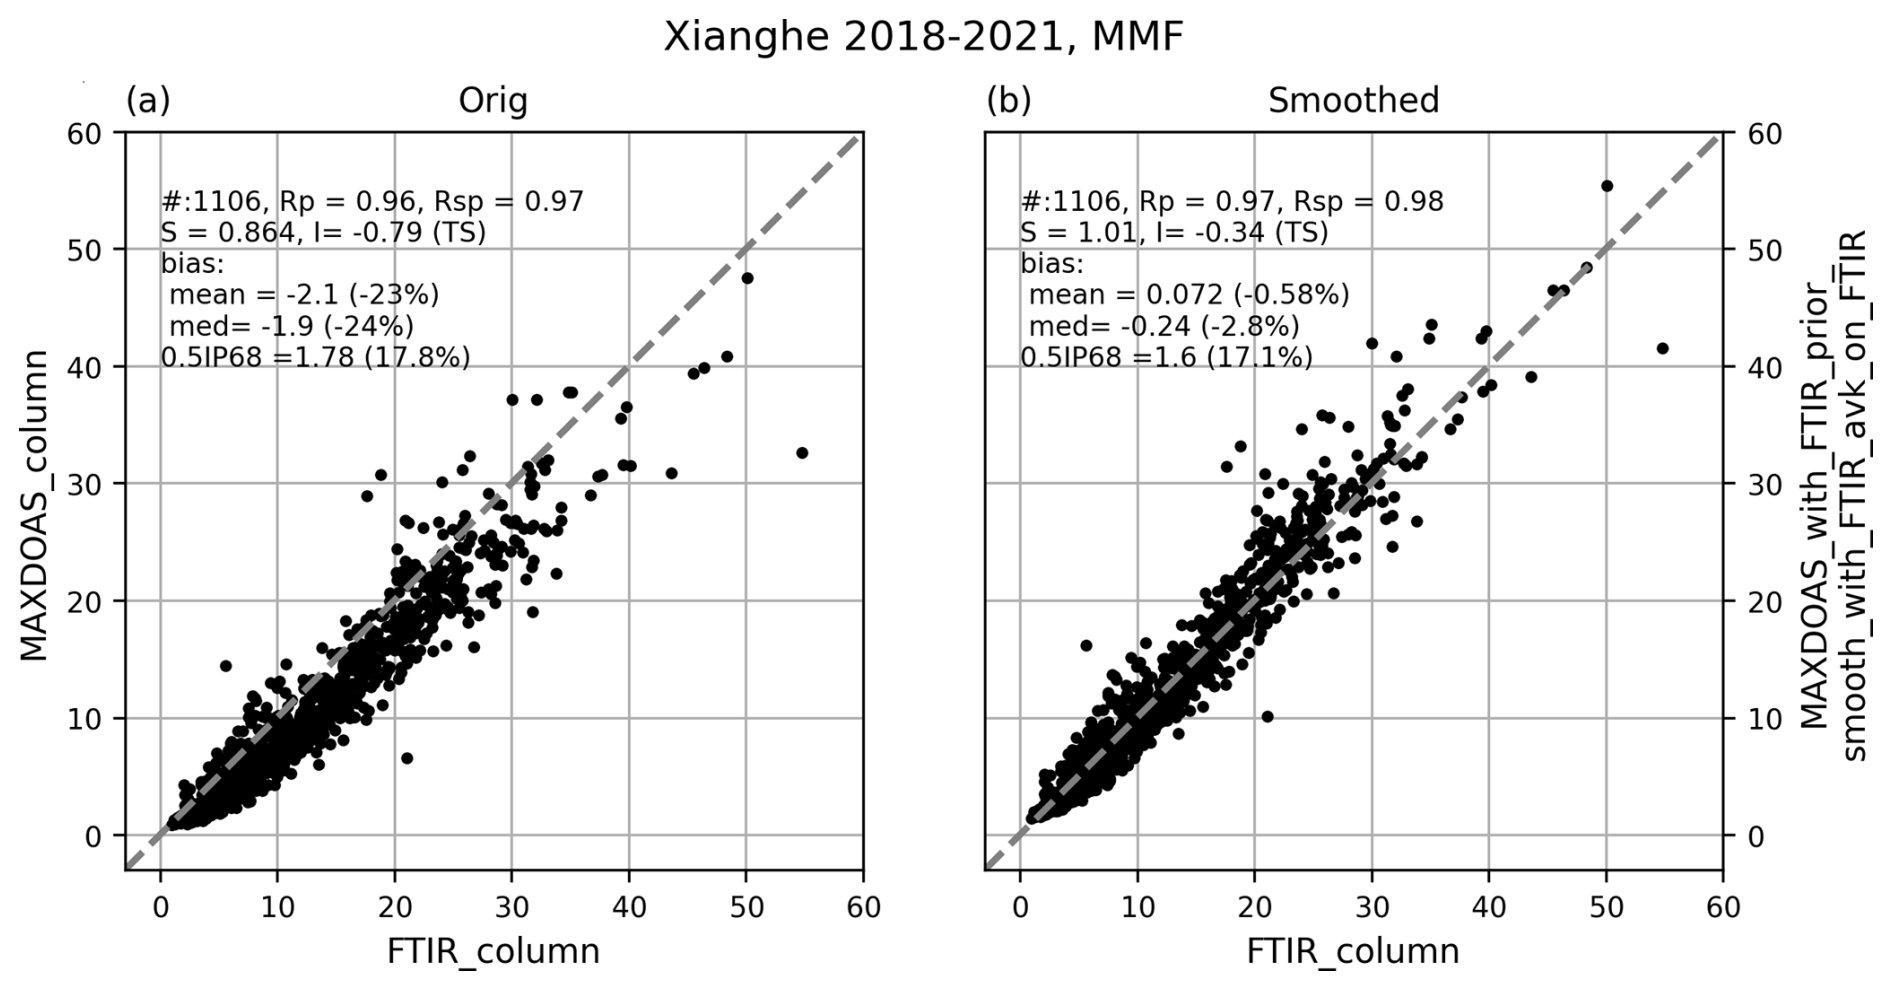
Figure 8FTIR and MAX-DOAS MMF HCHO VCD scatter plot for the period 2018–2021 (a) the original data and (b) after the substitution and smoothing step as described in the text. Theil-Sen regression statistics, mean and median differences (absolute and relative), as well as its dispersion (as half the interpercentile 68) are given in each panel.
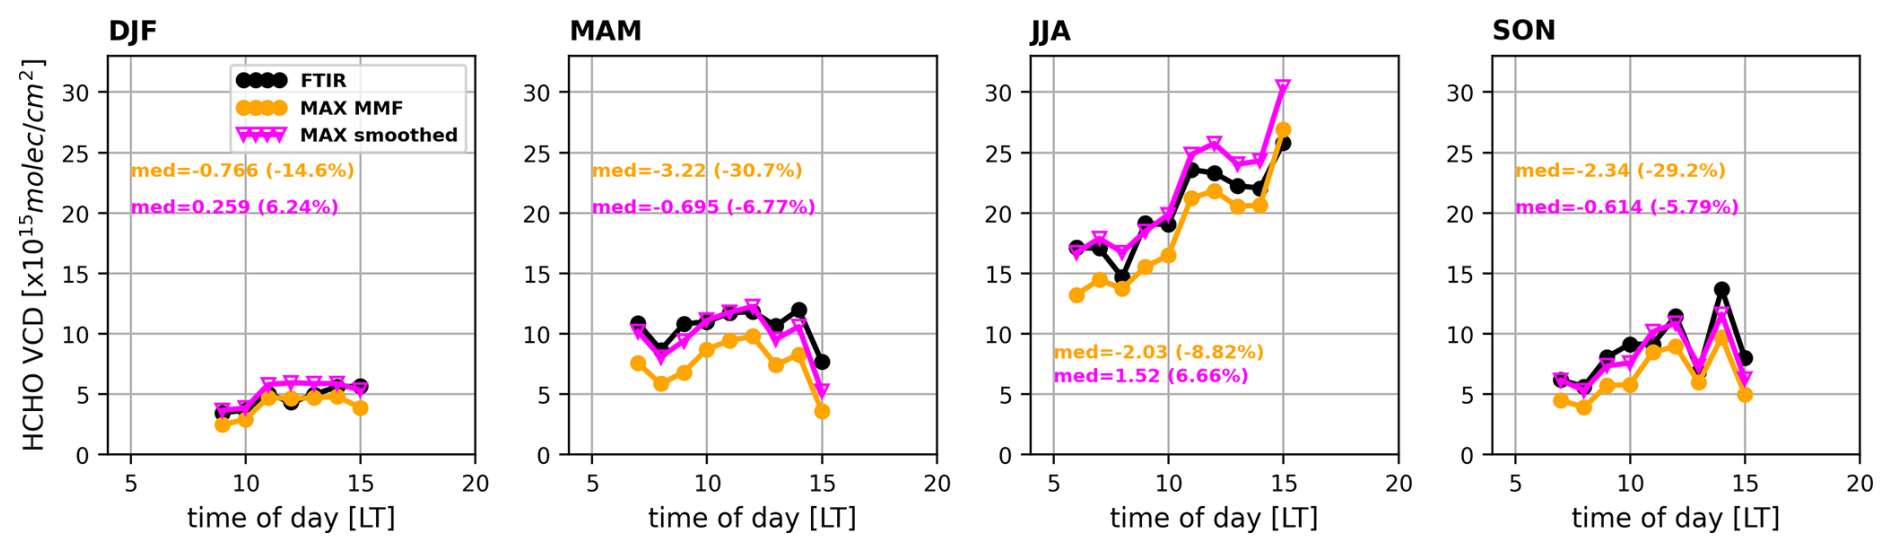
Figure 9FTIR and MAX-DOAS MMF HCHO VCD median diurnal variations per seasons for the period 2018–2021. Both the original MAX-DOAS (orange) and the smoothed one (magenta, see text) are shown. Median statistics of the MAX-DOAS minus FTIR absolute and relative differences are given for each season. A minimum number of 5 points per hourly bin is required.
An illustration of the VCD comparison before and after the application of the Rodgers and Conner approach is given in Figs. 8 and 9 for the MMF MAX-DOAS dataset over the whole 2018–2021 comparison period.
Figure 8 presents the MAX-DOAS to FTIR original VCD comparisons as a scatter plot. It can be seen that MMF typically underestimates the FTIR VCDs, with a median bias of −24 % ± 18 %. The correlation coefficient is of 0.96 and the regression parameters are of 0.86 for the slope and −0.79 × 10¹⁵ molec. cm−2 for the intercept. The results in Fig. 8b), show that the substitution and smoothing improve the median bias from around −24 % to −2.8 %, increase slightly the correlation, and improve the regression results, increasing the slope and decreasing the intercept, to values around 1 and −0.34 × 10¹⁵ molec. cm−2.
The comparison of the diurnal variability for the different seasons (Fig. 9) shows that the impact of the smoothing is important in every season (about 20 % increase of the MAX-DOAS columns after the Rodgers and Conner approach). In summer and in winter the change lead to slightly positive biases of the VCDMAX,smooth compared to the FTIR columns. Overall the diurnal VCDMAX,smooth are in closer agreement to the FTIR than the original MAX-DOAS integrated profiles. Differences are now of the order of ±6 %, which is the difference we found between FTIR and DS UV (Fig. 3).
When the comparisons are only performed on the 0–4 km partial columns, the bias is smaller than for the VCD of about 15 % (this is the typical amount of HCHO above 4 km in the FTIR profiles, see Fig. 6), leading to a bias of −4.6 % ± 21 %, with a correlation of 0.96, a slope of 1.05 and an intercept of −0.67 × 10¹⁵ molec. cm−2. After the smoothing, the overall bias is reduced to about zero, as for the main case.
In summary, the MAX-DOAS data are under-estimating the total HCHO VCD content, with differences with respect to UV direct-sun and to FTIR VCD data of the order of −20 %. When both MAX-DOAS and FTIR averaging kernels and a priori are taken into account, the median bias reduces significantly to around zero.
Compared to MAX-DOAS versus FTIR comparisons available in the literature, we find a similar order of magnitude of the (M−F) differences (between 0.3 % to 28 % depending on the sites). These were conducted in remote mountain-top observatories (Vigouroux et al., 2009; Franco et al., 2015, for Reunion Island and Jungfraujoch), in remote regions (Ryan et al., 2020, for Lauder and Melbourne) and one in largely polluted area (Rivera Cárdenas et al., 2021) around Mexico City. In those studies, an improvement was also generally obtained when considering the respective vertical sensitivities (Vigouroux et al., 2009; Ryan et al., 2020; Rivera Cárdenas et al., 2021), but the MAX-DOAS instruments had a tendency to report larger HCHO than the FTIR ones, although differences were generally within the combined uncertainties. The mean HCHO levels are quite different between the different studies: between 0.5 and 2.5 × 10¹⁵ molec. cm−2 for the Jungfraujoch, 2–5 to 6 × 10¹⁵ molec. cm−2 for Reunion Island, 2.5 ± 0.7 × 10¹⁵ molec. cm−2 in Lauder, 5.4 ± 0.2 × 10¹⁵ molec. cm−2 in Melbourne and between 20 to 30 × 1015 molec. cm−2 in Mexico, but with large spatial gradients. Here HCHO columns are typically between ∼ 4 to 25 × 1015 molec. cm−2 (see Fig. A3) and we expect relatively homogeneous spatial distributions around the Xianghe site due to its suburban nature. Ryan et al. (2020) also focused on the 0–4 km partial columns in his comparison, finding (M−F) monthly averaged of 15.1 ± 26.3 %, and decreasing to 10.1 ± 26.1 % when considering the vertical resolutions in the comparison, with correlation R about 0.81 and a linear regression slope of 1.03.
As discussed in the introduction, in recent years the retrieval strategies of both techniques have been harmonized and it is now easier to compare results from different sites, as we rely on coherent inversion choices from different locations. Within the FRM4DOAS consortium, there are four other MAX-DOAS sites (Bremen, Lauder, Toronto and Ny-Alesund, see Van Roozendael et al., 2024) where FTIR instruments operating in close vicinity, provide HCHO data (Vigouroux et al., 2018, 2020). A preliminary analysis has been performed at those locations, showing similar negative biases of the MAX-DOAS MMF dataset compared to the FTIR NDACC data for the original VCD comparisons, with median differences within −11 % to −30 %, except in Ny-Alesund, where the HCHO levels are very low and the difference is of about −70 %. The latter exercise should be extended to account for the different vertical sensitivities and a priori, to confirm these preliminary findings and see if the results obtained in our study for Xianghe are representative of other pollution conditions.
In our comparisons, based on the MMF MAX-DOAS data, we suspect that the underestimation of the original HCHO VCDs compared to direct sun results, is mostly due to the lack of sensitivity of the MAX-DOAS above 4 km, along with the too fast decrease with altitude of the chosen exponential decreasing a priori profile for the MMF MAX-DOAS retrieval. This is reduced when applying the Rodgers and Conner approach. The current choice of the MAX-DOAS a priori means that the free-tropospheric HCHO content is not accounted for. To further test this hypothesis, we run the MMF algorithm with different a priori profiles.
3.2.2 Change a priori profile in MMF processing
CAMS and TM5 models profiles shown in Fig. 5 have been used as a priori for the MMF MAX-DOAS retrievals, over the whole year 2020. The different tests start from the same DSCD and aerosols retrievals, and only recalculate retrieved HCHO concentrations with some changes in the inversion settings. In addition to the change of the HCHO a priori (from the exponential decrease of Eq. (1) to the monthly means CAMS or TM5 concentrations), the a priori constraint (the Sa covariance matrix) can also be adapted. As in this MMF implementation the Sa matrix is constructed from the a priori profile itself (see Eq. 2) we have tested several scaling parameters in order to keep similar DOFs while disentangling the effect of the a priori shape change from the induced effect of (over)constraining the prior.
Different Sa scaling parameters have been tested for a few months and the best candidate to keep similar DOFs is a Sa scaling factor (SaScal) of 0.4 (instead of the 0.5 in the original FRM4DOAS MMF implementation, see Table 2).
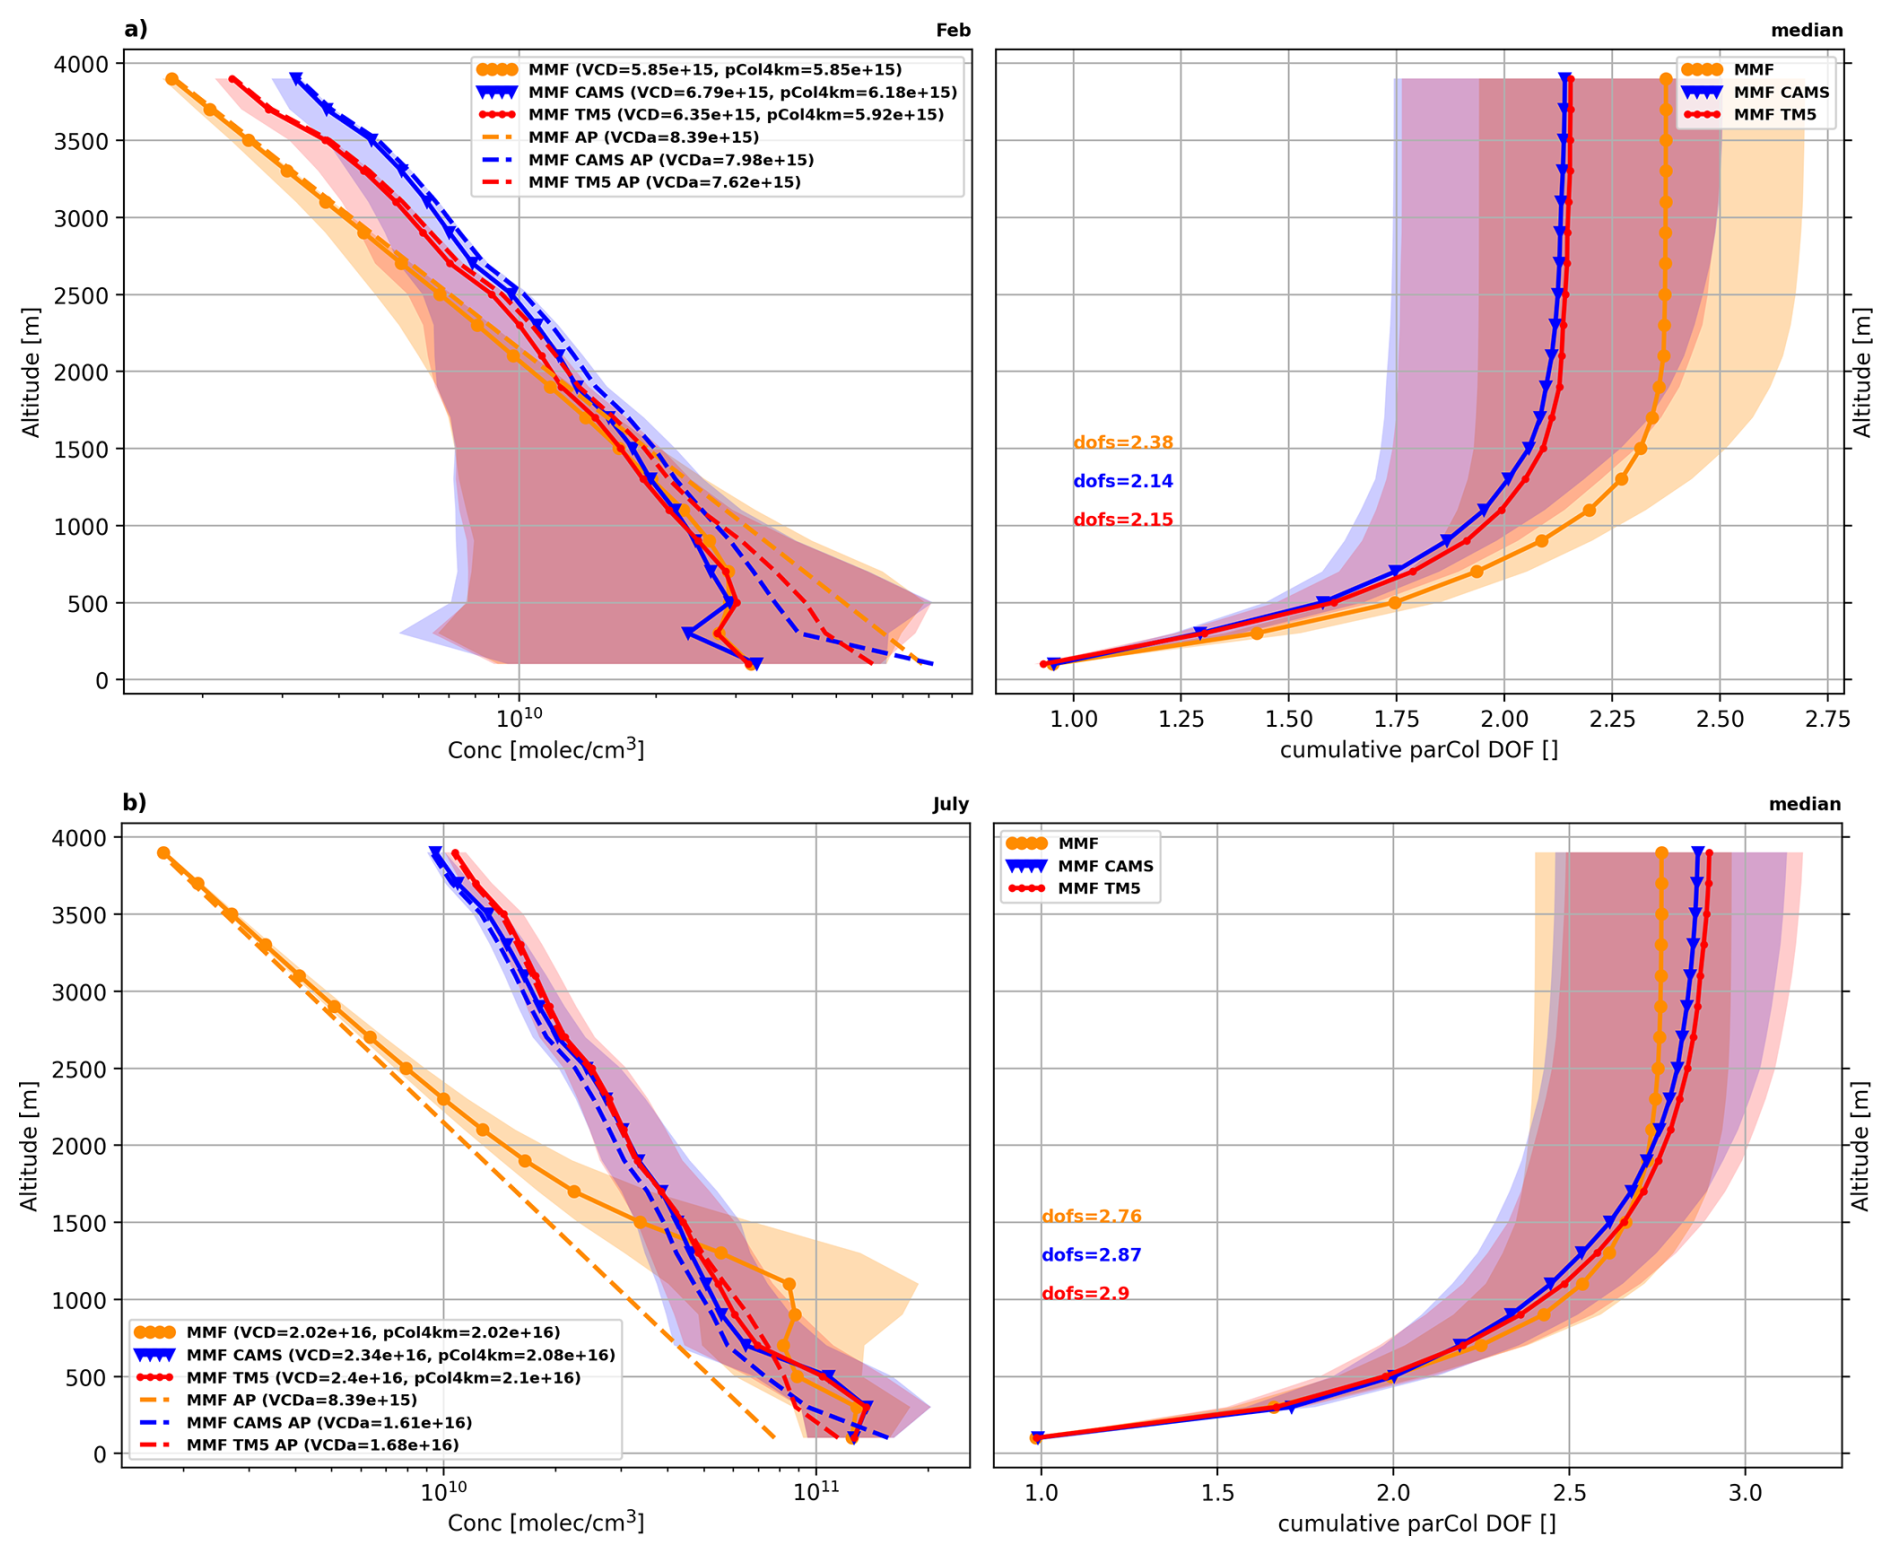
Figure 10MAX-DOAS a priori (dotted lines) and retrieved (plain lines) profiles (left panel) and corresponding cumulative partial column DOFs (right panel) for the month of February and July 2020 for MMF (in orange), TM5 a priori test case (in red) and CAMS a priori test case (in blue). The median values are shown with the addition of a shaded area representing the 25 to 75 percentiles values. The altitude is given in meters above the surface of the center of the retrieval layers.
Figure 10 presents the median retrieved profiles and the cumulative partial column DOFs for the months of February and July 2020 for the original FRM4DOAS MMF data (in orange) and two other tests with the TM5 (in red) and CAMS (in blue) profiles as a priori. Both the retrieved quantities (solid lines) and the a priori concentration profiles (dotted lines) are shown. In winter, we can see that the retrieved profiles are very similar for the three options below 1 km (where we have most information), while they diverge above, where they follow the different a priori constrains. The contribution to DOFs from layers above 2 km tends to zero. In summer, the use of model a priori profiles also lead to very coherent inversions in the first layers for the three cases, as well as a removal of the oscillation in the retrieved profile (between 700 m and 1.5 km), that was present in the original MMF inversion. The larger concentrations of the model a priori in elevated layers compared to the exponentially decreasing profile originally used in MMF result in larger retrieved values above 1.5 km. In the original inversions, this larger HCHO concentration was somehow pushed between 500 m and 1.5 km, where the gain in freedom (about 0.7 increase in the cumulative partial column DOF) allowed the retrieval to deviate from the a priori. As a result, an oscillation was produced.
Above 2 km, the DOFs becomes larger than originally retrieved. For both winter and summer examples, we can see the rapid increase of the cumulative partial column DOFs in the first layers, where the retrievals are diverging from their a priori profiles, while above 1.5–2 km, each retrieved profile is constrained to its prior, and the cumulative DOFs tends to a constant value. By construction, the HCHO concentration above 1.5 km for both CAMS and TM5 tested cases are therefore larger compared to the original MMF retrieval, leading to slightly larger simulated VCDs (around 2.4 × 10¹⁵ molec. cm−2 instead of 2 × 10¹⁵ molec. cm−2 in summer) and only small changes in the total DOFs (∼ 2.9 compared to 2.77 in summer). It should be noted, however, that the 0–4 km partial columns (summing the retrieved profiles from 0 to 4 km), are smaller, as the retrieval is only performed in the 0–4 km altitude range, while the given a priori is defined on the whole atmosphere, up to 60 km, defacto adding an effective ghost column to the reported VCDs.
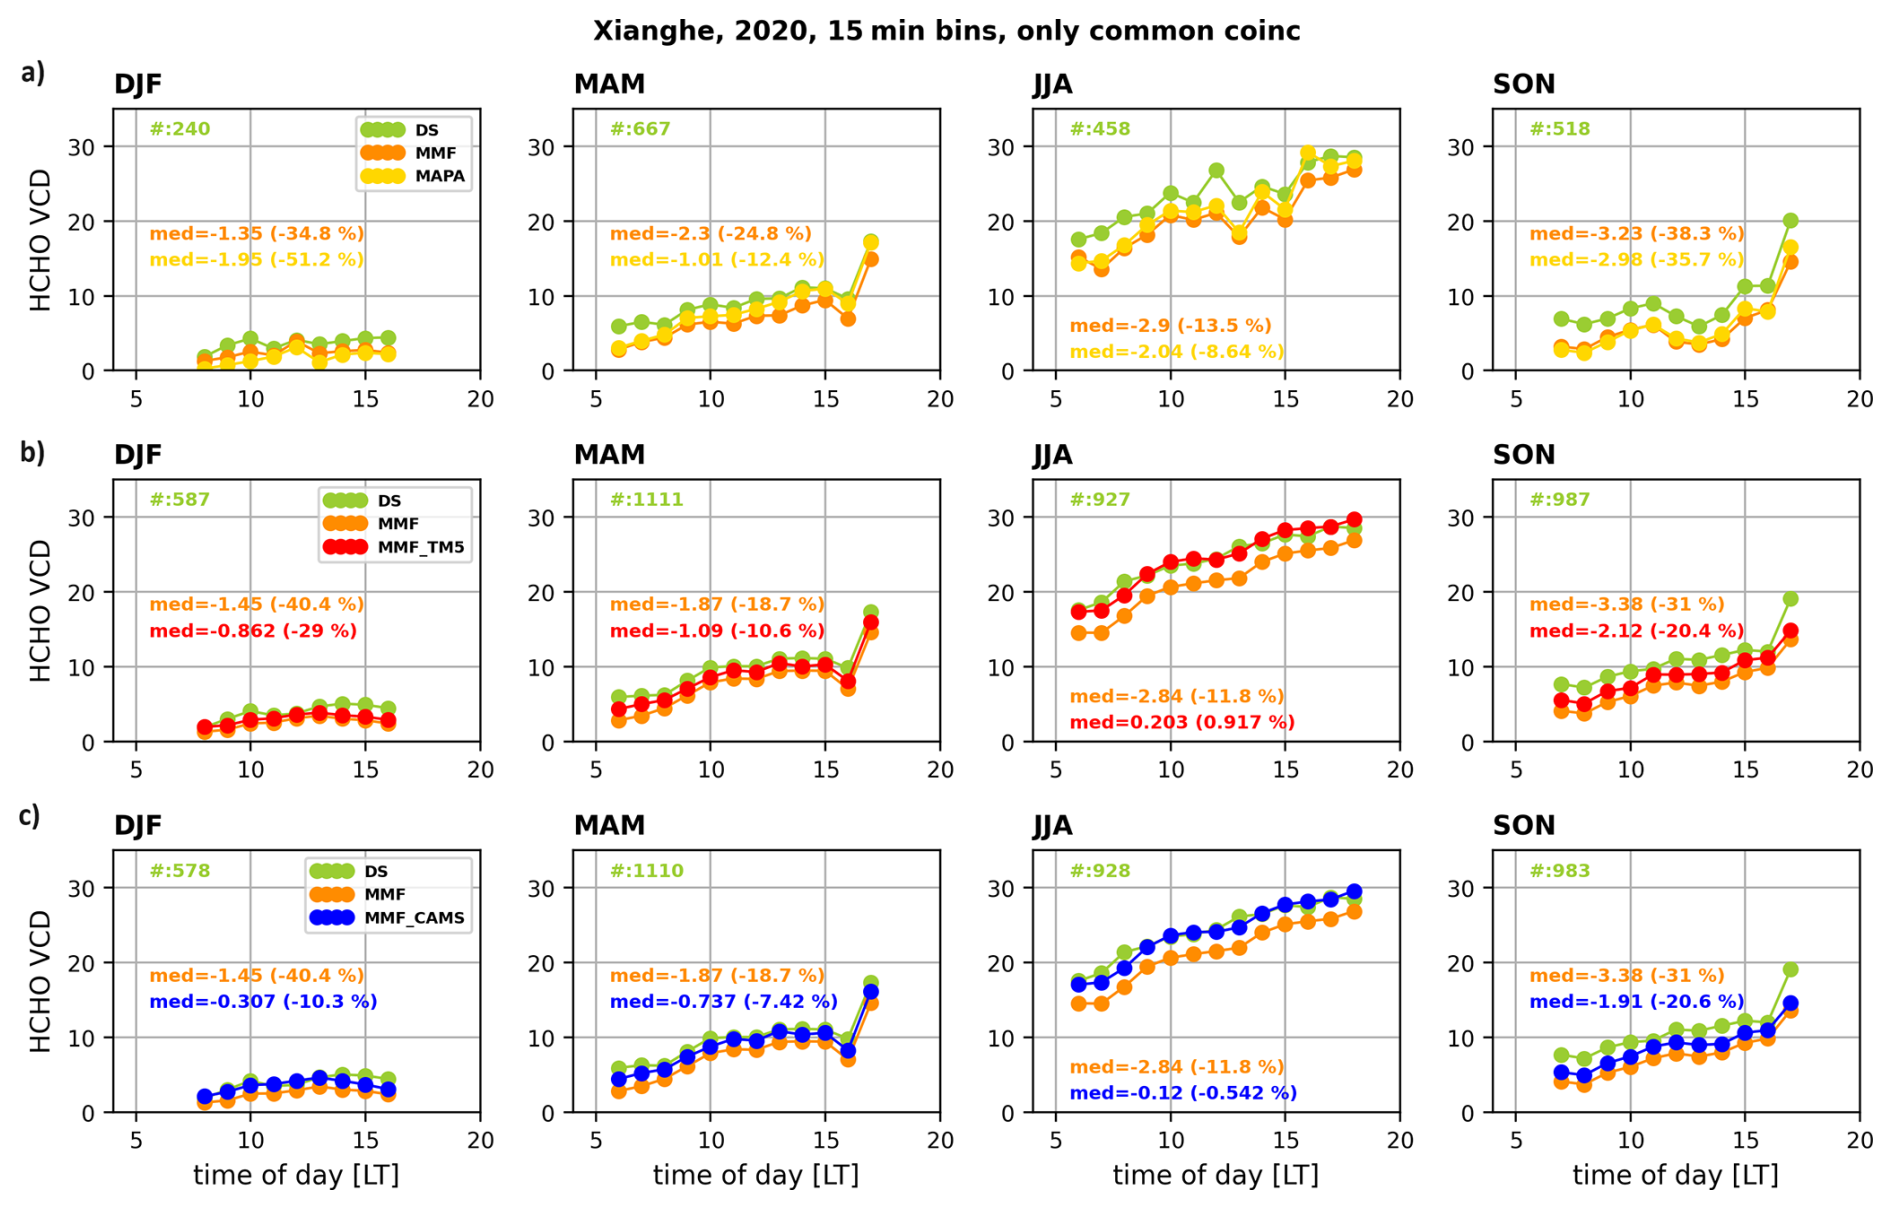
Figure 11HCHO VCD median diurnal variations per seasons of direct sun and several MAX-DOAS retrieval strategies for the common coincidences pairs over the year 2020: (a) DS UV, MMF and MAPA, (b) DS UV, MMF and MMF with TM5 a priori and (c) DS UV, MMF and MMF with CAMS a priori. Median statistics of the MAX-DOAS minus direct sun absolute and relative differences are given for each season in the corresponding color. A minimum number of 5 points per hourly bin is required.
Both TM5 and CAMS model profiles, when used as a priori with a SaScal = 0.4, lead to similar results in terms of retrieved DOFs. To quantify the impact of the change in a priori profile, we can compare the VCDs from the different sensitivity tests, to the direct sun VCD, as previously done in Fig. 4. Results are shown in Fig. 11. Please note that here we consider only the common valid occurrences within 15 min bins of the three DS, MMF and MAPA datasets together, and not selecting them two by two like in Fig. 4 and Table 3. This change in sampling change the bias numbers, especially in winter for MAPA. A large improvement in the MAX-DOAS minus DS absolute differences is obtained when using the CAMS or TM5 profiles as a priori instead of the exponentially decreasing shape of the default MMF case. The reduction of the bias of the MAX-DOAS VCD with respect to the direct sun VCD is clear in all seasons with differences reduced by about 10 % or more. In summer, both models lead to differences around zero. In winter the results using CAMS as a priori are closer to the direct sun than those with TM5. A similar comparison is done in Fig. A5 for MAX-DOAS pCol4km versus DS VCD. We now have a bias everywhere, due to non accounting the additional ghost column content above 4 km coming from the model priors. The values of the differences vs. DS are now close to the baseline MMF case also for the MMF CAMS and TM5 cases and the only significant improvement compared to the baseline MMF is obtained when using CAMS CTM as a priori in winter. The improvement in winter using CAMS seems to come from the HCHO contribution both below and above 4 km of altitude, while in the other cases, it is only the free tropospheric content above 4 km that leads to the largest change in VCD when using the models as a priori. To summarize, the impact of changing the exponentially decreasing a priori to model profiles, is thus leading to a ghost contribution added for the free tropospheric content in all the seasons of about 10 %. In winter, when the HCHO content itself is small, there can also be some changes below 4 km, depending on the selected model.
The change in the MAX-DOAS profile shape, can be estimated through the H75 parameter. The monthly averaged comparisons are shown in Fig. A4. Both CAMS and TM5 tend to increase the H75 values in most seasons, corresponding to HCHO vertical profiles that are less strongly peaked near the surface. This effect is particularly pronounced in winter when using CAMS, which distributes a large fraction of the HCHO column up to about 2 km or higher, in closer agreement with FTIR profile shapes. This vertical redistribution explains the stronger impact of the pCol4km contribution observed for the MMF CAMS configuration. Whether this behavior reflects real atmospheric conditions or limitations associated with the relatively coarse vertical resolution of the CAMS model cannot be assessed within the scope of this study, but it should be considered when interpreting wintertime results. Recent studies provide useful context for these findings. Zhao et al. (2025) reported an overestimation of HCHO concentrations by the GEOS-CF model in the 0.5–2 km layer compared to Pandora off-axis measurements over the eastern United States, which they attributed to the model (a combination of excessive boundary-layer mixing, uncertainties in emissions, and an overestimation of HCHO production from transported precursors). Conversely, Sebol et al. (2025) showed that Pandora off-axis retrievals capture the total tropospheric HCHO column well when compared to airborne in-situ measurements, but exhibit discrepancies in vertical shape, with higher concentrations near the surface and lower values near the top of the boundary layer. These studies illustrate current ground-based and model-based profile uncertainties in the lower troposphere. A test with higher resolution models as a priori and validation of the retrieved profiles with in-situ profile measurements would be beneficial to further understand the most appropriate winter a priori profile in Xianghe. This is specifically important in winter, considering the low HCHO content, the larger errors for all the datasets (see the increase in errors for SZA > 60° in Fig. A1), the larger differences between MMF and MAPA (see Fig. A3), the lower MAX-DOAS DOF (about 2 compared to 2.75 in summer, see Fig. A4) and the larger surface model VMR seen in Fig. 5. In the other seasons, the use of models as a priori profiles in the MAX-DOAS retrieval is essentially related to the contribution of the so-called ghost column above 4 km. Near the surface, the MAX-DOAS retrieval has sufficient degrees of freedom to deviate from the prior profile (in Fig. 10, the retrieved profiles of the different cases closely overlap up to about 750 m to 2 km, depending on the season).
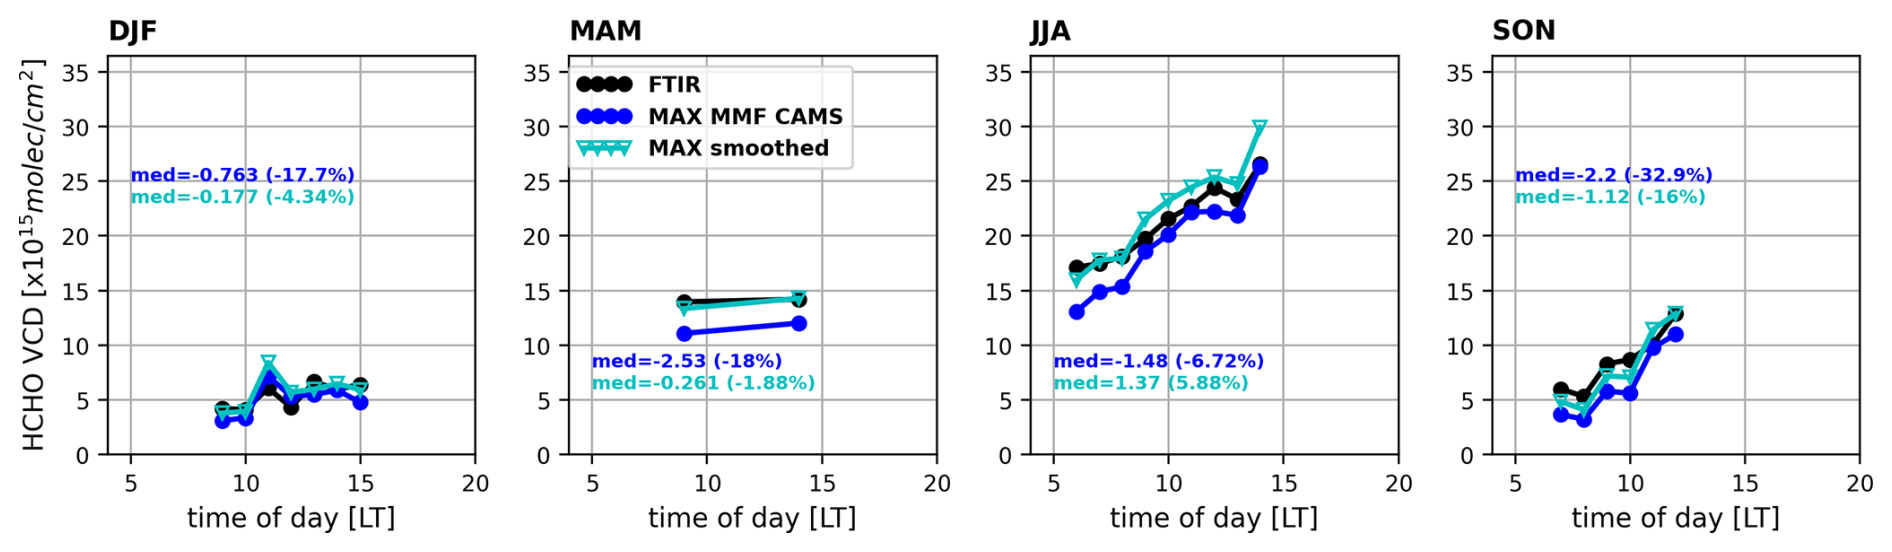
Figure 12FTIR and MAX-DOAS (CAMS a priori test case) HCHO VCD median diurnal variations per season. Both the original MAX-DOAS CAMS (blue) and the smoothed one (cyan) are shown. Median statistics of the MAX-DOAS minus FTIR absolute and relative differences are given for each season. A minimum number of 5 points per hourly bin is required.
Figure 12 presents the diurnal variation per season for the MMF CAMS 2020 data with respect to FTIR data, also including the effect of using the Rodgers and Conner approach on the vertical profiles distributions (as described in Sect. 3.2.1). The FTIR (black), the MAX-DOAS MMF CAMS integrated profiles (blue) and the smoothed (cyan) MAX-DOAS case are shown. This figure is similar to Fig. 9 for the original MMF inversion that was over the whole 2018–2021 period. Table 4 also presents the comparisons of the two sensitivity tests, before and after the regridding/smoothing. From Fig. 12 and Table 4 it can be seen that over the whole year, the test with the TM5 and CAMS models as a priori leads to slightly smaller total bias (−19.2 % and −17.9 % instead of −20.8 % with MMF), which all reduce to less than −2.4 % after the a priori substitution, regridding and smoothing, again with better regression statistics (slopes close to 1 and smaller intercepts). Decreased median bias for the diurnal variations per season are also clear after the Rodgers and Connor approach in Fig. 12 (and Fig. A6 for the TM5 case), with a small positive bias in summer, as it was already present in Fig. 9 for the original inversion.
It should be noted that for the comparisons of MAX-DOAS profiles with FTIR (reported as integrated profiles in Figs. 9, 12 and Table 4), the impact of the change in the MAX-DOAS a priori is smaller than when looking at VCD, as for Fig. 11 for DS. This is related to a discrepancy for the new tested cases, between the retrieved profiles (inversed only on the 0–4 km retrieval grid range) and the reported VCD (estimated on the whole atmosphere, including also contribution of the a priori above 4 km). The 0–4 km partial columns (calculated integrating the profile) are then smaller than the reported VCD, that include the ghost column contribution from the a priori above 4 km. An illustration of the difference between VCD and pCol4km for each case is shown in Fig. A3c over the year 2020. It is relatively constant around 16 % for FTIR, it is zero by construction for MMF, and it varies around 13 % and 12 % on average for the MMF retrievals with CAMS or TM5 as a priori.
If we focus the MAX-DOAS to FTIR profiles comparisons only on the 0–4 km range, as also done in Sect. 3.2.1 and reported in Table 4, it can be seen that with this configuration, the change of a priori has a different impact on the original bias (−1.75 % using CAMS and −3.74 % using TM5, compared to −4.6 % for the original MMF case) and using the Rodgers and Conner approach is reducing the median bias over the year 2020 to slightly smaller values (except when using CAMS model as prior). The regression parameters are similar for the three cases and in line with results obtained before when considering the whole FTIR grid for the comparison.
Harmonizing HCHO retrievals from MAX-DOAS instruments is a key requirement for their use as a reliable and consolidated reference network for satellite validation. The centralized FRM4DOAS processing represents an important first step toward this goal, but its effectiveness depends on a clear understanding of the consistency between MAX-DOAS products and other established ground-based HCHO datasets. In this study, we assessed the consistency of HCHO vertical column and profile measurements from MAX-DOAS, UV direct-sun DOAS, and FTIR at the suburban Xianghe site (China) over the period from mid-2018 to the end of 2021. By explicitly accounting for the different vertical sensitivities of these techniques, we evaluate their agreement and identify possible improvements. We found that:
-
The direct sun HCHO VCDs retrieved in the UV and IR agree very well and are a good reference for testing different MAX-DOAS approaches. A correlation of 0.99, a slope of 0.97 and a median bias of −5 × 10¹⁴ molec. cm−2 ( = −6 % ± 11 %) is found between the FTIR and direct sun DOAS HCHO VCDs over around 1 year period, with nice agreement of the diurnal cycles for the different seasons.
-
Both the MMF and MAPA MAX-DOAS VCDs, as implemented in the FRM4DOAS centralized processing system, correlated well with the direct sun data but systematically underestimate the direct sun DOAS and the FTIR VCDs by about 20 % on average.
-
This underestimation is primarily due to the limited sensitivity of the MAX-DOAS technique above 2 km, combined with unrealistic a priori profile assumptions in the MMF retrieval, where HCHO concentrations decrease exponentially to zero at 4 km. In the current MAPA version, simplified profile shapes are also used, allowing elevated layers only in the absence of surface concentrations. As a result, a significant fraction of free-tropospheric HCHO observed by the direct-sun UV and IR measurements is not captured by the MAX-DOAS retrievals.
-
Replacing the MMF a priori profiles with monthly mean model profiles substantially improves the agreement between MAX-DOAS, direct sun DOAS and FTIR data. Using CAMS or TM5 as a priori, and testing different prior constrains change slightly the results. This approach aligns MAX-DOAS retrievals with FTIR and satellite methodologies, which also rely on model-based priors, and mainly affects the contribution of the ghost column above 4 km. While the MAX-DOAS retrieval retains sufficient degrees of freedom to optimize HCHO concentrations in the lower troposphere, the profile shape above approximately 2–4 km is largely controlled by the a priori model.
Based on these results, we formulate the following recommendations to improve the FRM4DOAS centralized processing system and to bring MAX-DOAS HCHO retrievals into closer agreement with direct-sun reference measurements:
-
Adopt more realistic a priori profiles. We suggest extending the use of model-based a priori to additional FRM4DOAS sites and adopting a CAMS monthly climatology as the standard for the MMF retrieval. To support this, the a priori profiles should be provided over the full atmospheric grid, rather than being limited to 4 km as currently implemented. An extension of the retrieval grid to higher altitudes could also be envisaged, with progressively increasing layer thicknesses.
-
Provide clearer information on vertical sensitivity. As a complement to averaging kernels, an additional and more user-friendly indicator of the altitude range over which MAX-DOAS partial columns contain true information from measurements could be provided, facilitating interpretation by satellite validation users.
-
Optimize flagging strategies. The current quality-flagging approaches should be revised to better exploit the complementary information provided by the parallel MMF and MAPA retrievals.
Additional improvements foreseen for the FRM4DOAS centralized processing system include (i) implementation of the updated MAPA version, which allows a broader range of concentration profile shapes, and (ii) incorporation of the MAPA-derived O4 scaling factor (SF VAR) into the MMF retrieval. The latter is expected to improve aerosol consistency without significantly affecting HCHO concentrations.
Extending the type of analysis presented here for Xianghe to other sites would be a valuable next step to confirm the consistency of ground-based instruments across different pollution regimes, and evaluate their long-term stability. The establishment of additional co-located sites, where multiple ground-based techniques from different networks operate simultaneously, is strongly encouraged. Such sites would support detailed inter-comparisons, algorithm development, and provide particularly valuable reference datasets for satellite validation. Further extensions include incorporating selected Pandora off-axis measurements into the FRM4DOAS framework and comparing them with Pandora PGN HCHO products, thereby strengthening the link between MAX-DOAS and PGN networks. Several FRM4DOAS sites already host co-located FTIR instruments, and Pandora measurements are available at sites such as Bremen, Lauder, Toronto, and Ny-Ålesund. Finally, updating the FRM4DOAS HCHO analysis at the current 18 sites and extending it backward in time to periods prior to 2018 would further enhance satellite validation efforts by linking recent GEO missions with historical LEO sensors and enabling the assessment of potential long-term drifts.
The conclusions drawn in this study rely on the assumption that the CAMS and TM5 models provide a reasonable representation of HCHO in the free troposphere. While this assumption appears valid for Xianghe, further work is needed to evaluate modeled HCHO concentrations at the global scale. This limitation is particularly relevant in winter, which is characterized by low HCHO columns, reduced MAX-DOAS sensitivity, increased retrieval uncertainties, fewer available measurements, and an increased sensitivity to sampling effects. Winter also exhibits the largest discrepancies between CAMS and TM5 profile shapes, further emphasizing the need for independent constraints on the vertical distribution of HCHO. Getting information on the HCHO profile with airborne in-situ measurements above MAX-DOAS sites campaign (such as with the In Situ Airborne Formaldehyde instrument (ISAF; Cazorla et al., 2015) or the COmpact Formaldehyde FluorescencE Experiment (COFFEE; St. Clair et al., 2017), as recommended in Merlaud et al. (2020) would help in quantifying the free tropospheric HCHO content. Comparison of these MAX-DOAS results to MAX-DOAS network measurements performed in China (Song et al., 2023; Jiao et al., 2025) and to HCHO surface concentration measurements (e.g., with proton transfer reaction mass spectrometer, PTR-MS; Wei et al., 2023) would be beneficial to further validate the MAX-DOAS HCHO data.
For satellite validation applications – particularly for the geostationary missions TEMPO, GEMS, and Sentinel-4 – the use of vertically resolved profile information is strongly recommended, including prior harmonization and smoothing, in addition to simpler VCD-to-VCD comparisons. The unprecedented temporal resolution of GEO missions increases sensitivity to differences in vertical sensitivity, sampling, and diurnal variability, making harmonized ground-based datasets essential for robust bias assessments. Such datasets are also critical for ensuring continuity between GEO observations and long-term LEO records from sensors such as OMI and TROPOMI, enabling consistent inter-mission comparisons and detection of potential temporal drifts. Finally, careful treatment of data flagging, averaging strategies, and diurnal and seasonal variability remains crucial when performing satellite validation and inter-network comparisons.
A1 Errors estimation
Figure A1 present the HCHO VCD errors, as the percentage value of the VCD columns, as provided in the netCDF MAX-DOAS FRM4DOAS 01.01 files and in the FTIR GEOMS files available from NDACC RD. The median value within 5° steps SZA bins from 15 to 80° are shown.
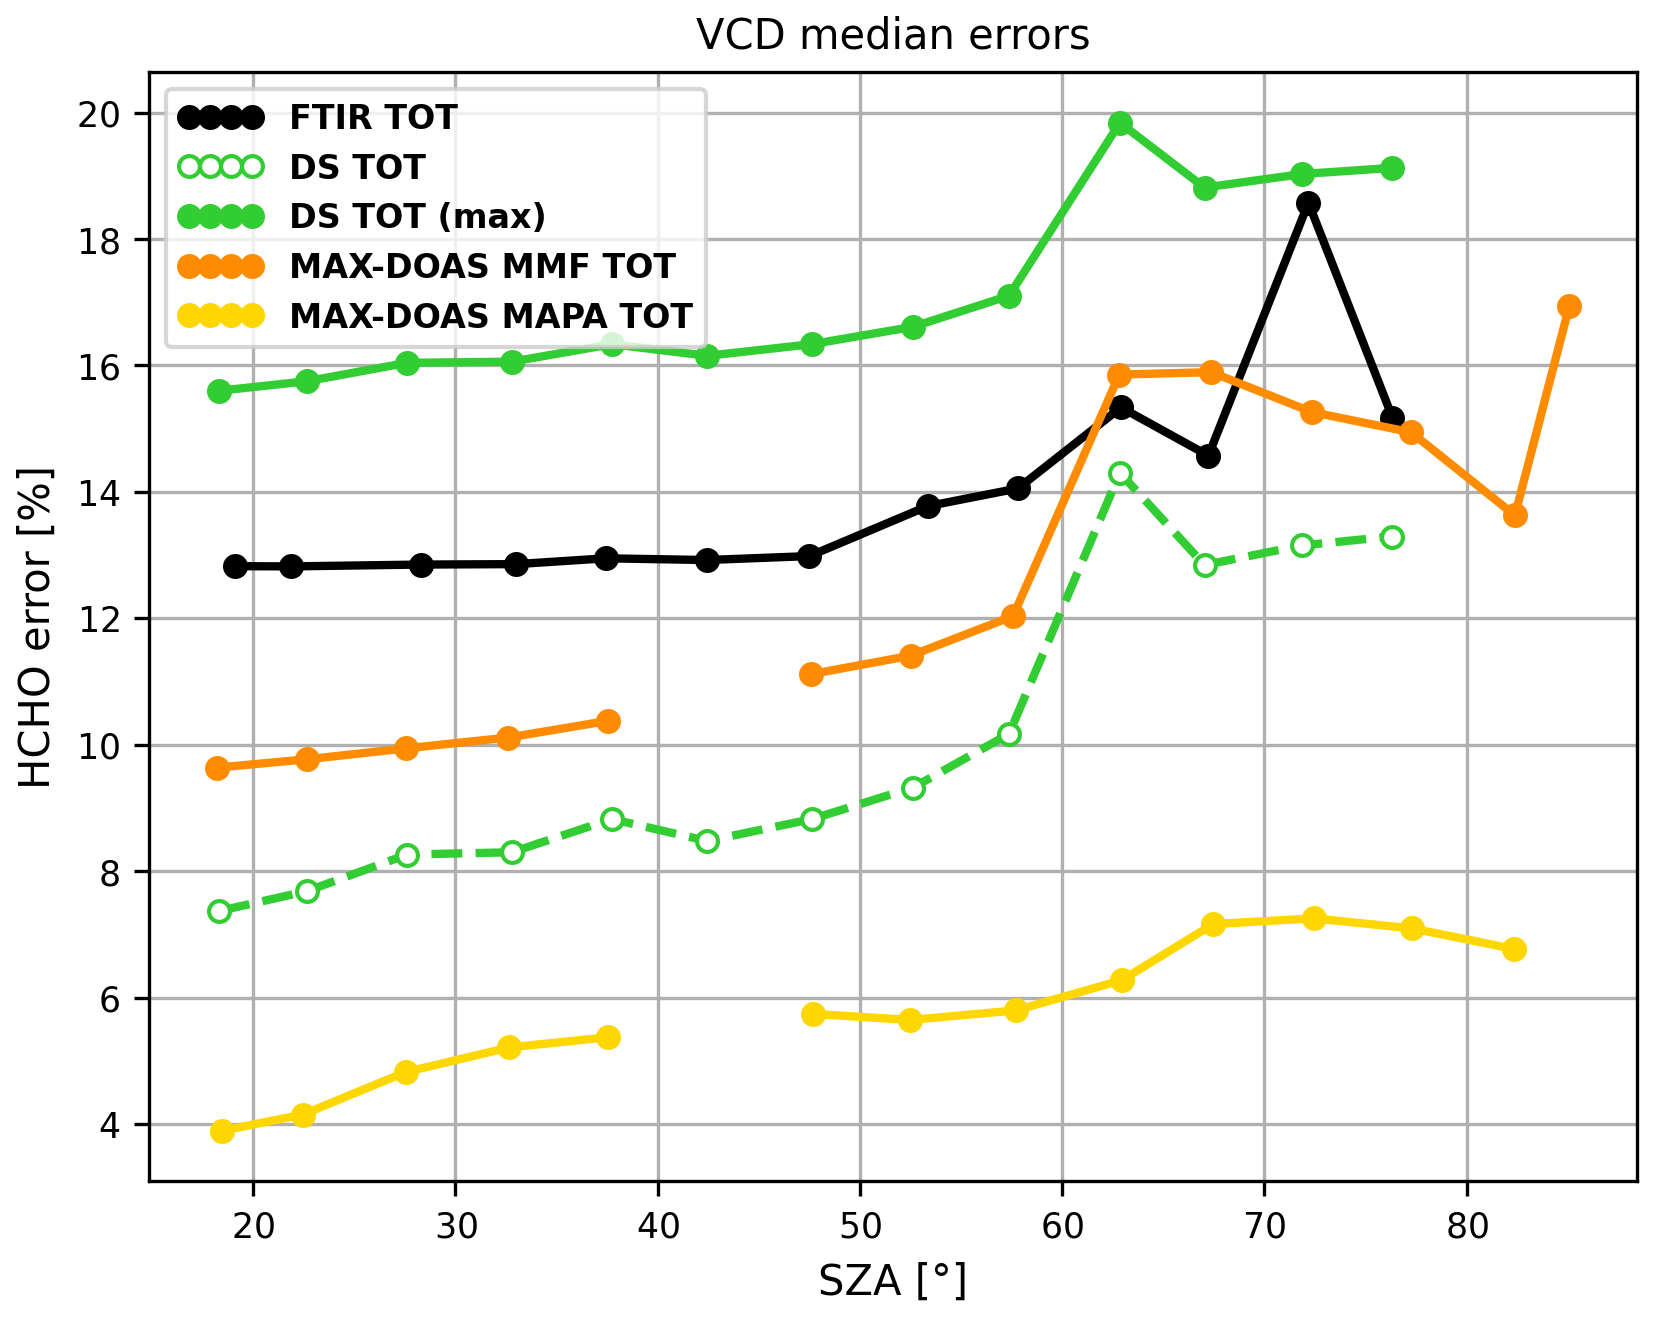
Figure A1Direct sun (DS), MAX-DOAS (MMF and MAPA) and FTIR HCHO median VCD errors as a function of SZA bins. Systematic constant errors are not displayed in the figure, but they are considered in quadrature when calculating the total contribution for the DS dataset. This includes 3 % AMF uncertainty, 6 % to 15 % reference spectra contribution (leading to the two different total curves for the DS). For the DS dataset, these are numbers estimated within this work, while for FTIR these are the numbers reported in the GEOMS harmonized files format and for the MAX-DOAS in the FRM4DOAS netCDF files.
For the FTIR data, the errors are provided as separated in random and systematic contributions, with typically a larger contribution from the systematic part of the errors. Here we combine them in quadrature. In the MAX-DOAS current internal netCDF FRM4DOAS files, the total VCD errors are provided for both MMF and MAPA, without separation of random and systematic contributions. The error estimation for both MMF and MAPA valid data is given in Fig. A1. It can be seen that the MMF errors are always larger, as they also include a 9 % systematic contribution to the errors as coming from the uncertainty on the HCHO cross-section (see e.g., Pinardi et al., 2013), which is not included in the MAPA errors. The MAPA VCD errors are estimated from weighted standard deviation of all matching profile parameters c that equals the VCD. The MMF errors are estimated from the covariance smoothing error matrix and the covariance measurement noise error matrix and include a systematic contribution as a fixed fraction of VCD (9 % for HCHO).
For DS the total error estimation in Fig. A1 includes 3 % AMF uncertainty, 6 to 15 % reference spectra contribution (leading to the two different total curves for the DS).
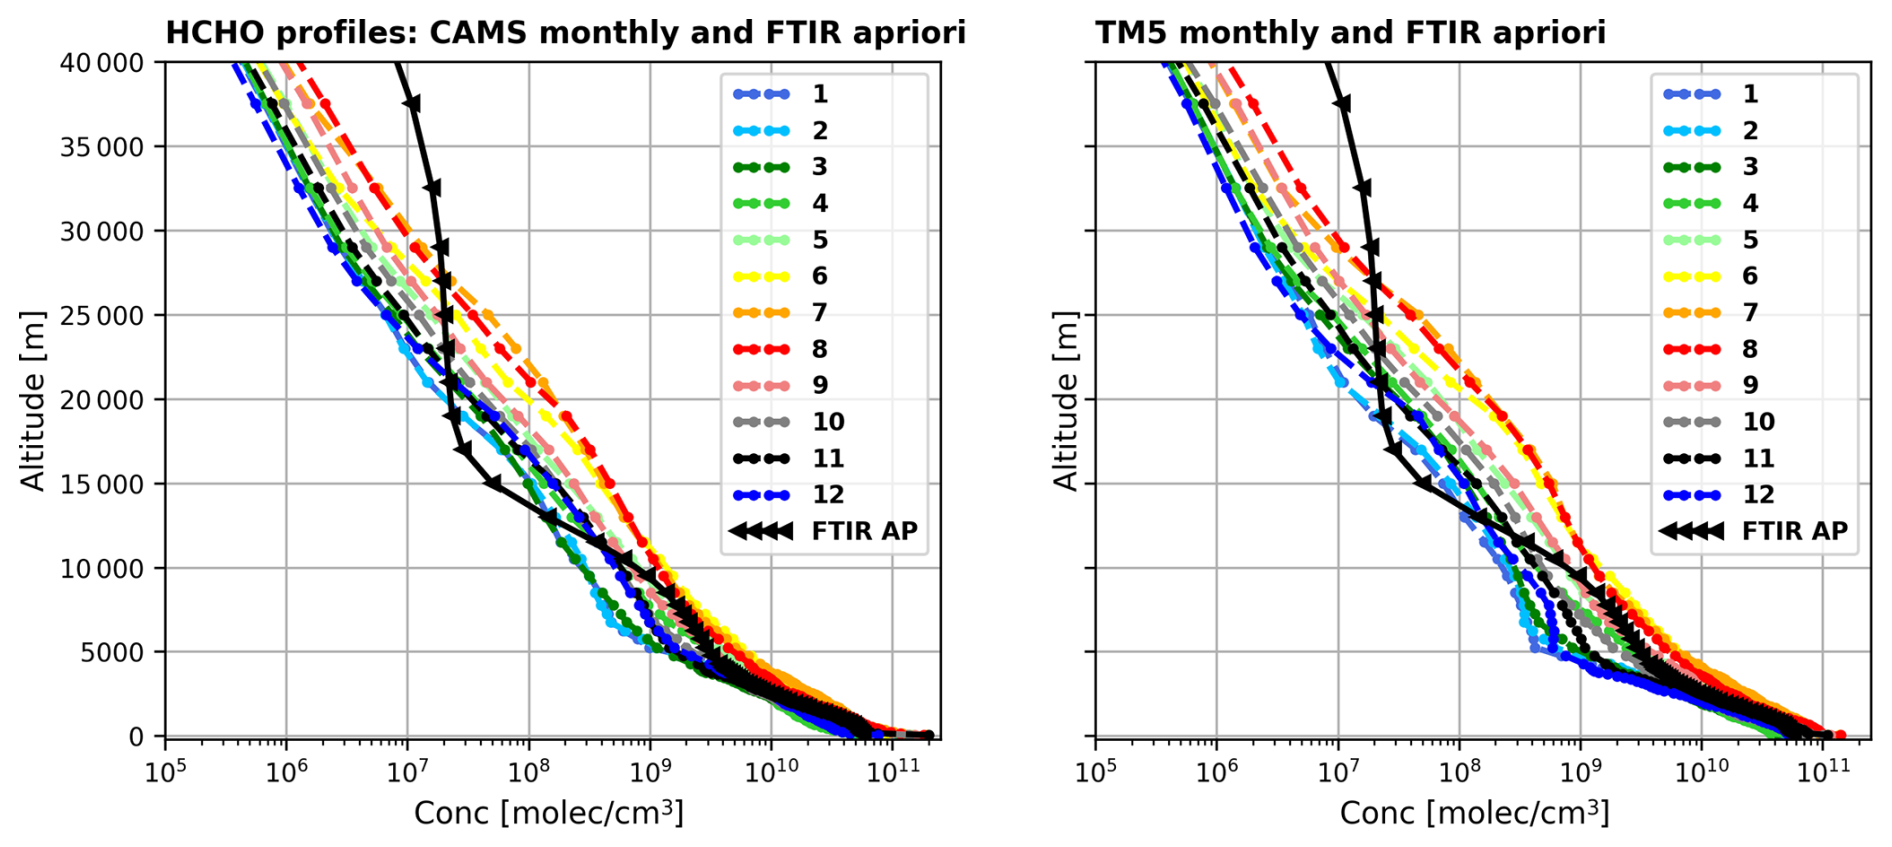
Figure A2HCHO concentration profiles over Xianghe for FTIR a priori (WACCM model, in black triangles) and with different colors for each month of CAMS (left) and TM5 (right) models in 2020.
However, the MAX-DOAS values reported in the files (and shown in Fig. A1) are likely underestimated. For example, for MMF, the current DOAS error contribution only includes an estimation from the DSCD fit and a systematic contribution for the HCHO cross-section uncertainty (9 %, from Meller and Moortgat, 2000), while we know that other DOAS fit parameters play a significant role in the DSCD error, as discussed in Fig. 18 of Pinardi et al. (2013).
A2 Vertical profiles and seasonality
Figure A2 presents the model concentration profiles (CAMS, TM5 but also the WACCM profile used as a priori in the FTIR retrievals). It can be seen that both CAMS and TM5 present similar seasonal variability and similar altitude dependency. The TM5 is however decreasing a bit faster vs. altitude for the winter months.
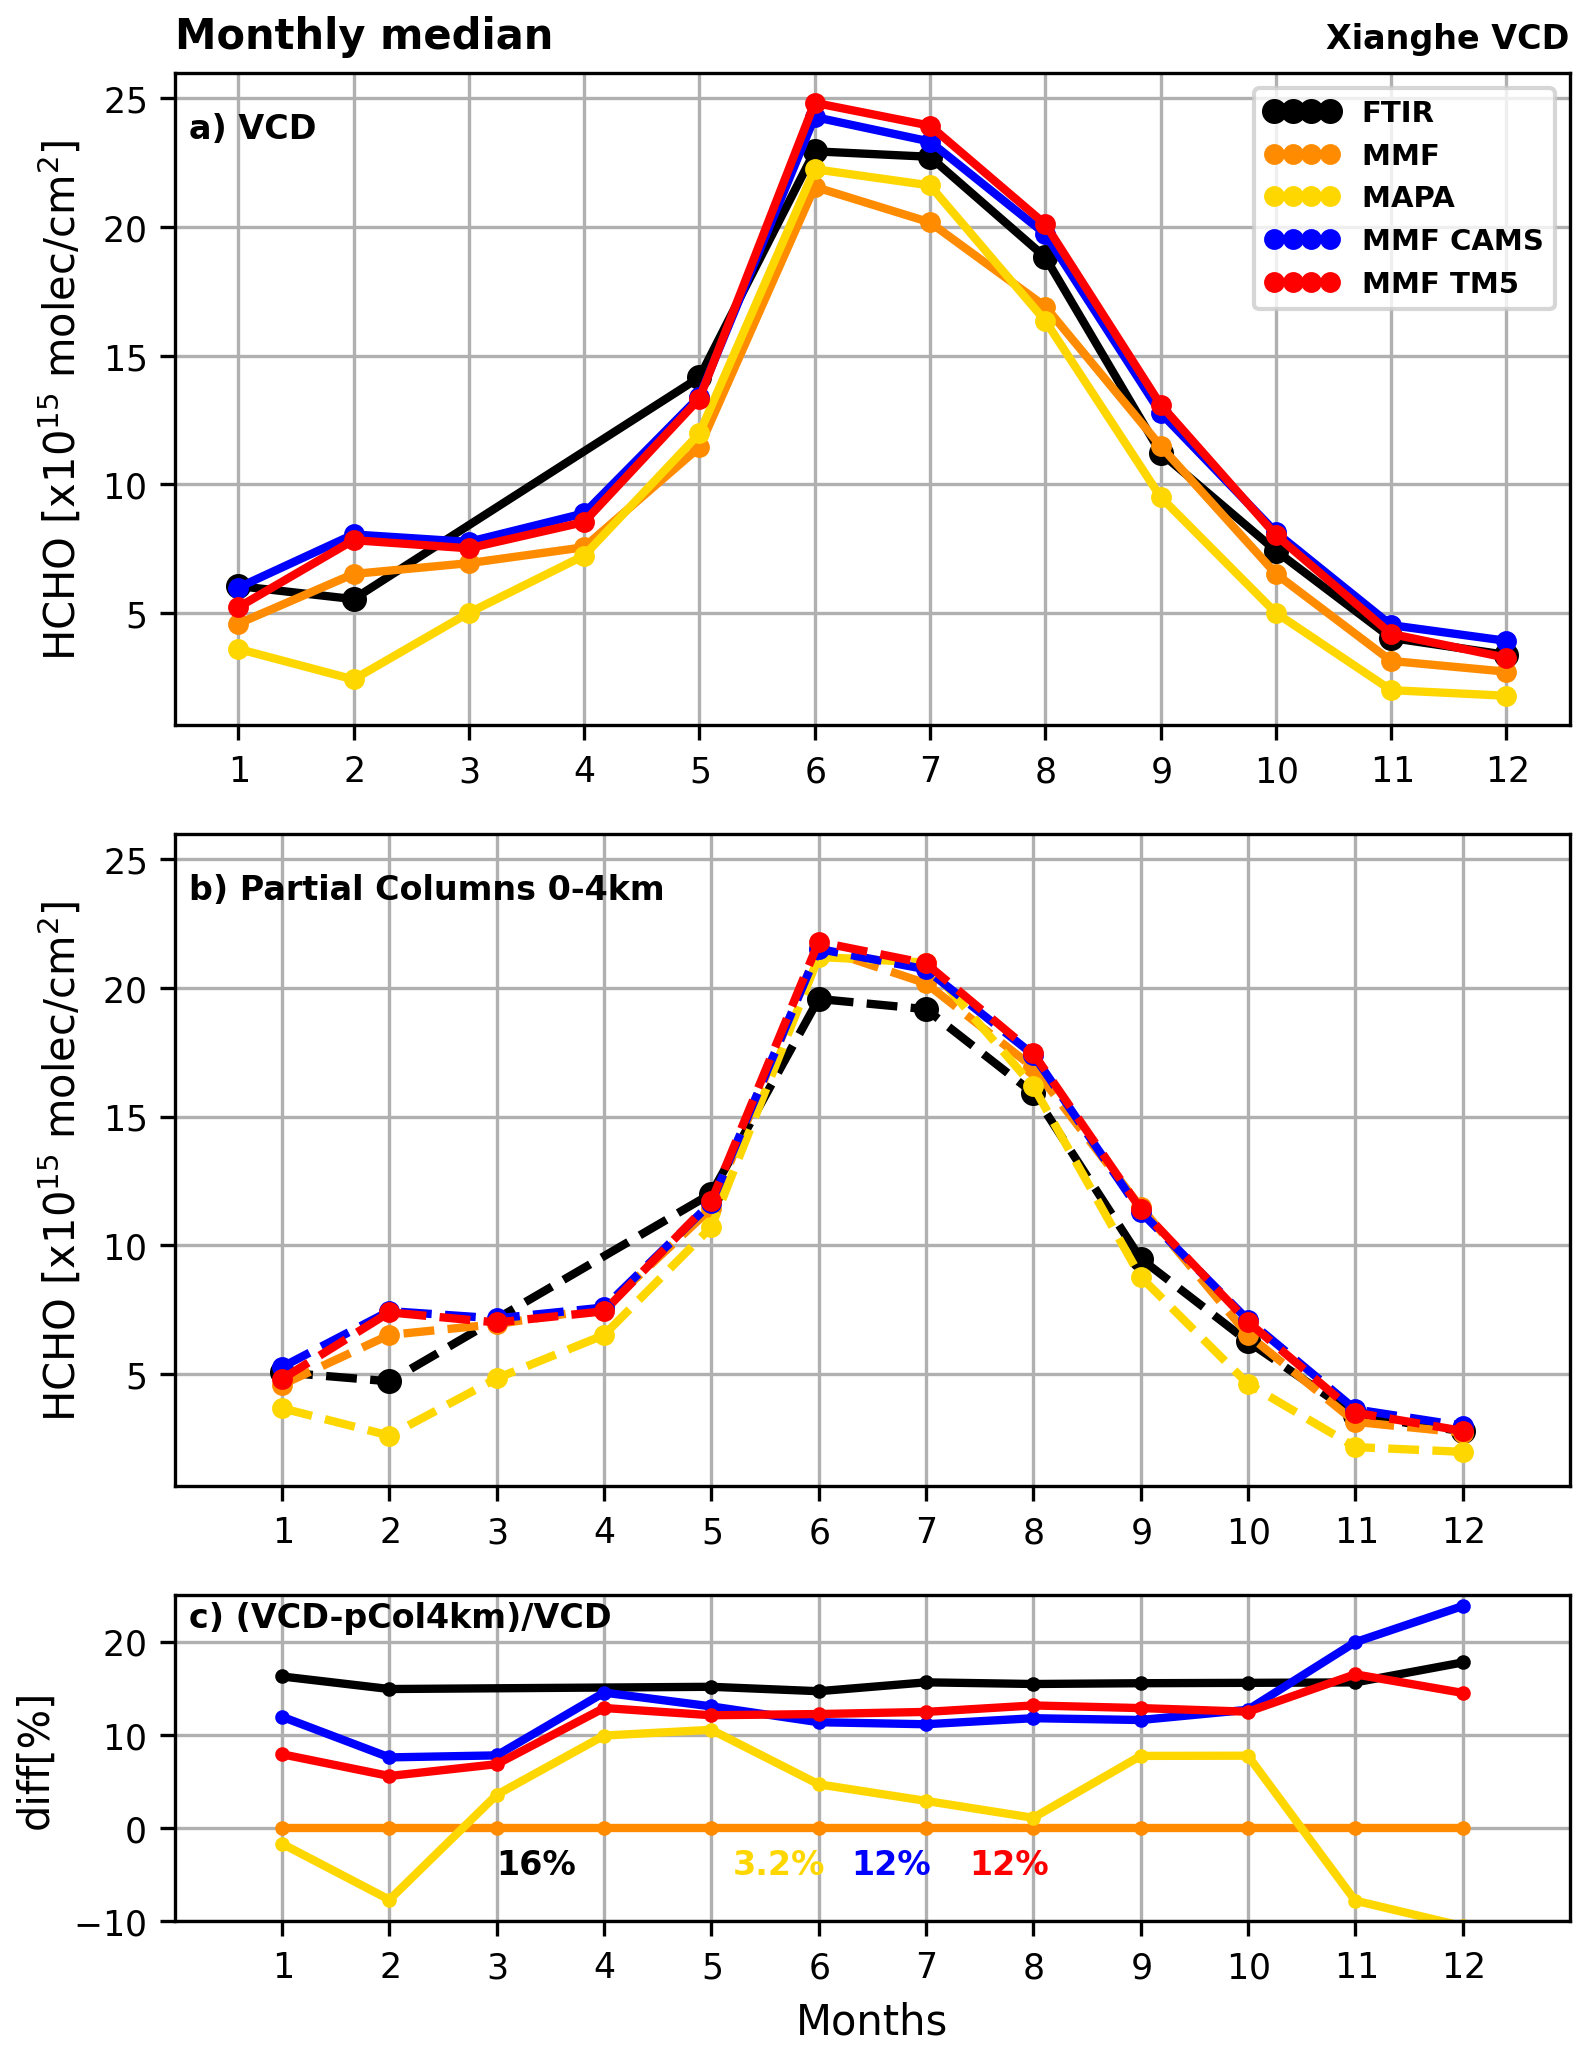
Figure A3Monthly averaged HCHO (a) VCD and (b) 0–4 km partial columns from FTIR and MAX-DOAS MMF, MAPA and when using CAMS or TM5 as a priori profiles. Panel (c) presents the differences between VCD and the 0–4 km partial columns.
Figure A3 present the monthly averages of the MAX-DOAS and FTIR data for the VCD and the partial columns between ground and 4 km (pCol4km). It can be seen that the seasonality is very coherent between the different datasets, with winter/autumn values between 4 and 5 × 10¹⁵ molec. cm−2 and summer values around 20 to 25 × 1015 molec. cm−2. The retrieved VCD can differ significantly, with lower columns for MAPA in most months except in summer, while the pCol4km are more coherent along the year, sign of good consistency of the retrieved MAX-DOAS concentrations in the first 4 km, where it is sensitive. MAPA pCol4km are smaller in the winter/autumn months (September to December and January to March). The difference of VCD vs. pCol4km is shown in the lower panel of Fig. A3. For the default MAX-DOAS MMF, VCD and pCol4km are the same by construction of the exponentially decreasing a priori, zero above 4 km. For the FTIR, the VCD vs. pCol4km difference is of about 16 % over the year, as it is also clearly visible in Fig. 6. For the MAX-DOAS the contribution varies depending on the algorithm, but are generally smaller and more variables over the year, with also negative VCD minus pCol4km for MAPA.
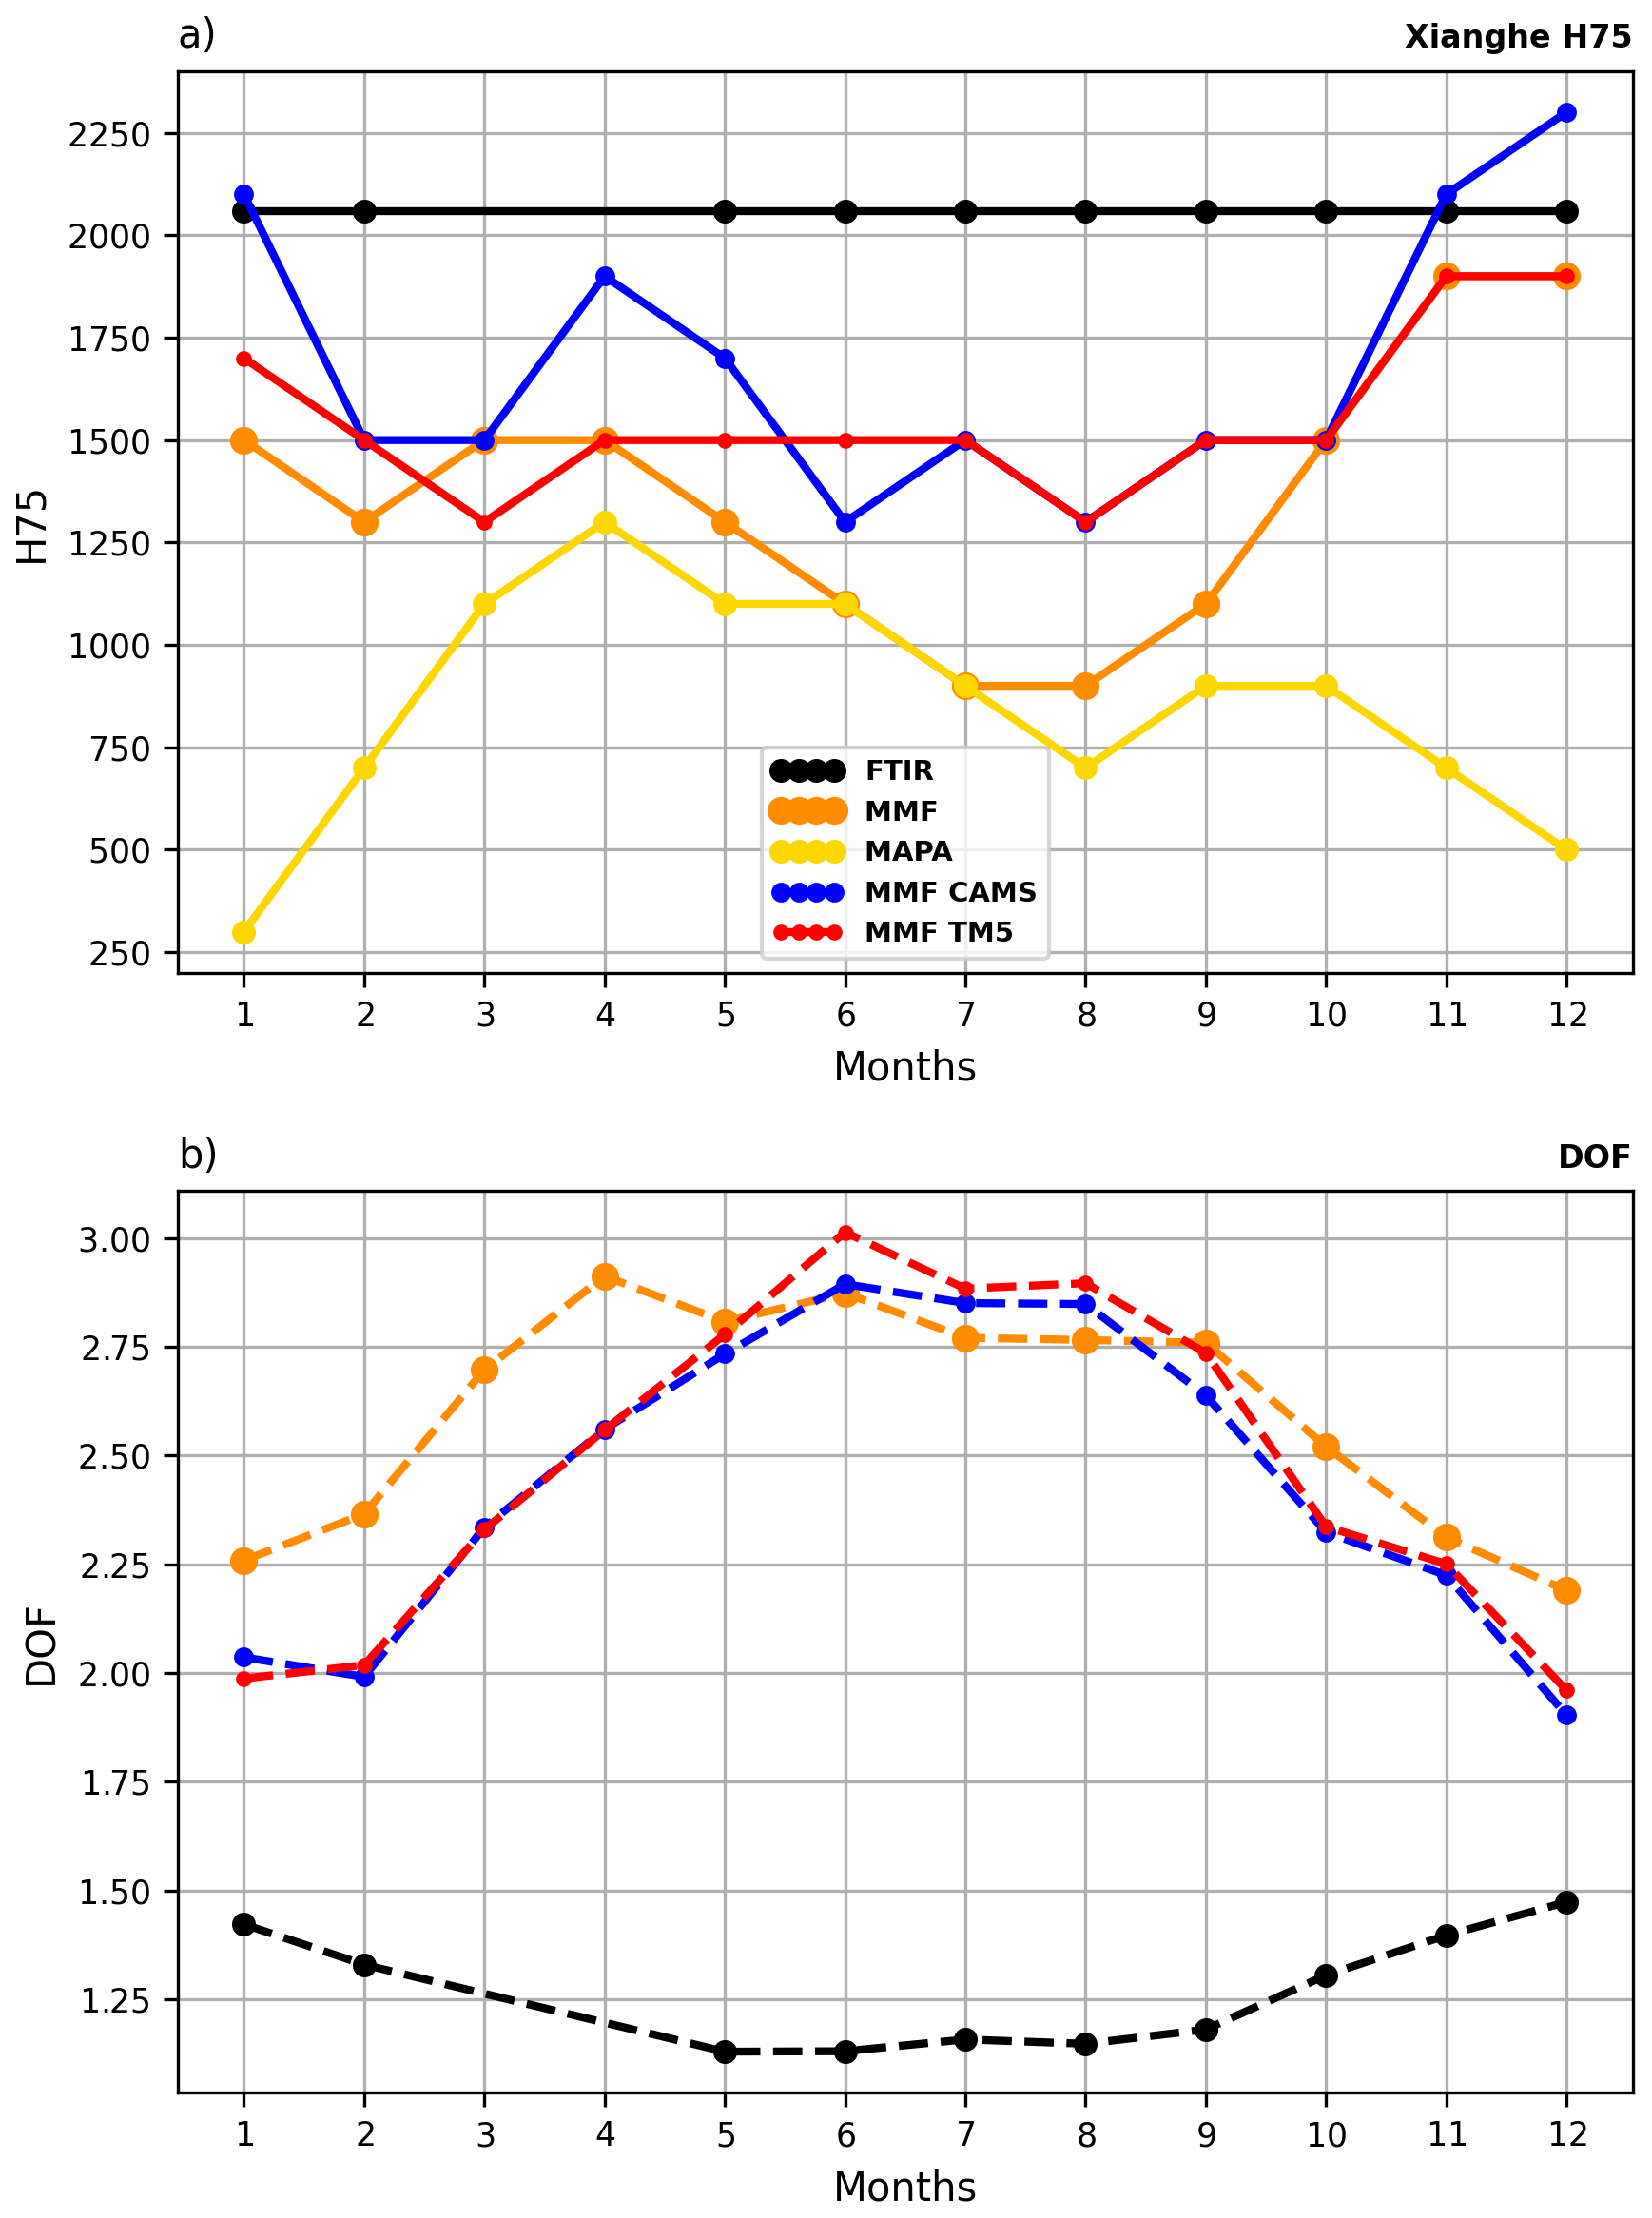
Figure A4Monthly averaged HCHO (a) H75 and (b) DOF (when relevant) from FTIR and MAX-DOAS MMF, MAPA and when using CAMS or TM5 as a priori profiles.
Figure A4 presents in a similar way the monthly median H75 values (i.e. the altitudes where the cumulative partial column reach 75 % of the retrieved column profile) and DOFs. It is clear that FTIR data always have a larger H75 value (calculated on the full profile) than the MAX-DOAS ones (calculated on the retrieved profile up to 4 km). MAPA results always show smaller values, on average. The smaller the H75 value is, the more the profile is peaked to the surface. For the DOFs, the seasonal sensitivities of the MAX-DOAS and of the FTIR are opposite: the MAX-DOAS is more sensitive in the summer months, when the FTIR has the smallest DOFs. There are substantial differences between the MMF and MAPA profiles, both in terms of profile shape and magnitude, with significant differences for the VCD and pCol4km in winter (DJF) and autumn (SON). In those seasons the H75 are also very different between MMF and MAPA (i.e., 1.7 and 0.5 km respectively in winter). The winter and autumn MAPA value H75 is much smaller than in spring or summer and compared to the other datasets. This partly explains the smaller MAPA columns in comparison to DS data seen in Fig. 4, especially in winter. The MMF retrievals with model profiles as a priori have typically larger VCD with coherent pCol4km (as expected by the ghost column inclusion above 4 km) with profiles shape relatively similar to the FTIR ones (H75 increases and profiles less peaked at the surface) compared to MMF default, and even more different than MAPA. The MAPA H75 values would imply HCHO concentrations strongly peaked to the surface, while the other retrievals suggest HCHO extending beyond the boundary layer height.
More robust comparison, taking into account coincident points, retrieved profiles and vertical sensitivities is presented in Sect. 3.2.1 and 3.2.2. Figure A6 is the corresponding figure to Fig. 12 for MMF TM5 vs. FTIR including smoothing. We can see that the difference between the two model cases is essentially in winter time, where the retrieved MAX-DOAS columns starting from the CAMS a priori profile are about 10 % closer to the FTIR ones (−17.7 % instead of −25.8 %) before smoothing, and a bit larger than FTIR after smoothing (−4.3 % instead of 0.7 %) than when starting from the TM5 a priori.
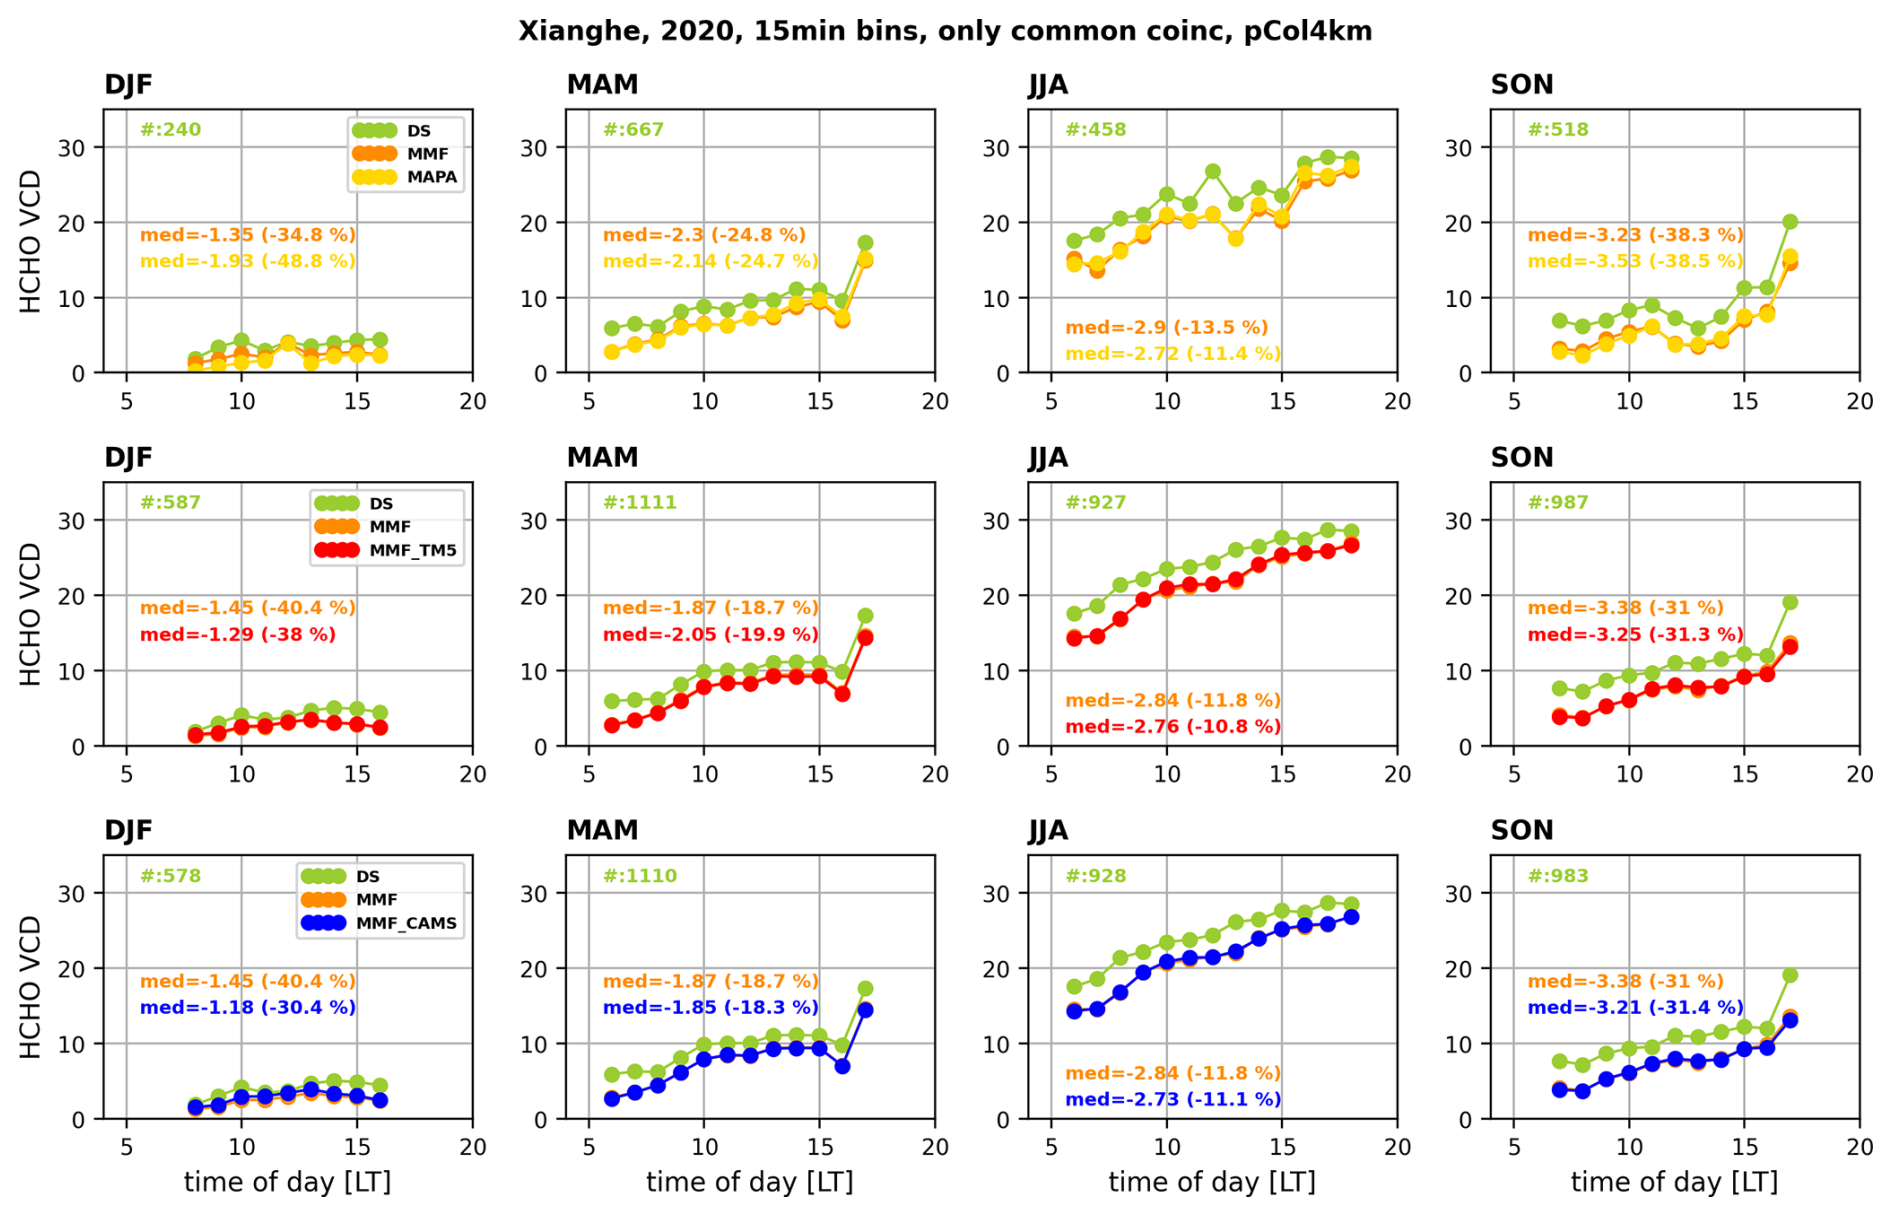
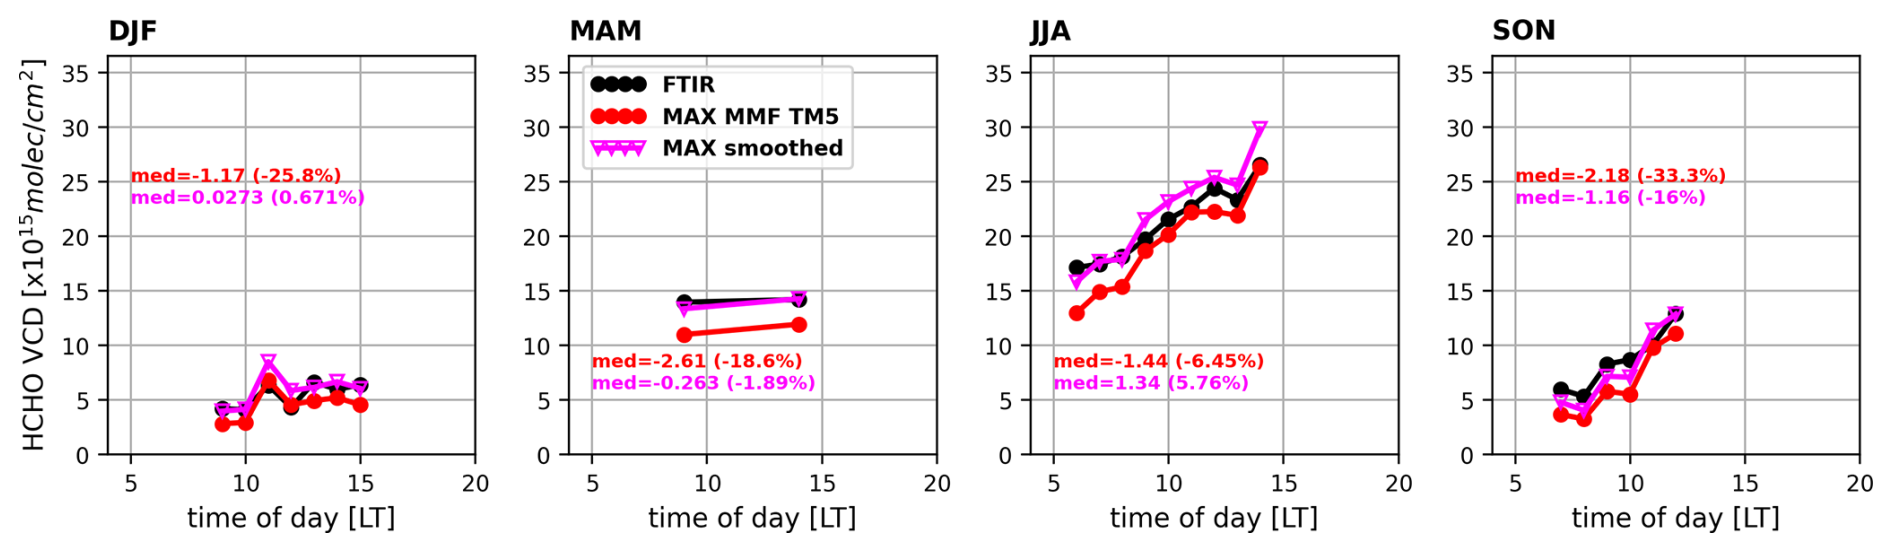
Figure A6FTIR and MAX-DOAS (TM5 a priori test case) HCHO VCD median diurnal variations per seasons. Both the original MAX-DOAS TM5 (red) and the substituted and smoothed one (magenta) are shown. Median statistics of the MAX-DOAS minus FTIR absolute and relative differences are given for each season in the corresponding color. A minimum number of 5 points per hourly bin is required.
The Xianghe FTIR HCHO data (https://doi.org/10.60897/ndacc.xianghe_ftir.h2co_cas.iap001_rd, Zhou et al., 2024b) are available through the NDACC rapid delivery database (https://www-air.larc.nasa.gov/missions/ndacc/, last access: 12 February 2026). The MAX-DOAS data (https://doi.org/10.18758/79K62VRM, Friedrich et al., 2026; https://doi.org/10.18758/EX6DPIFK, Pinardi et al., 2026a; https://doi.org/10.18758/6ULMAD6R, Pinardi et al., 2026b) and direct-sun UV data (https://doi.org/10.18758/S4A40K11, Van Roozendael and Pinardi, 2026) are available on the BIRA-IASB data repository. The models HCHO profiles are available as part of the ESA CCI+p L3 datasets v1 for TM5 (https://doi.org/10.18758/H2V1UO6X, De Smedt et al., 2024) and v2 for CAMS (https://doi.org/10.18758/BF145884, De Smedt et al., 2025).
GP carried out the investigations and wrote the manuscript. MVR, MMF, CV and BL contributed input and advise at all stages of the scientific discussions and of the manuscript writing. MMF, GP and CF prepared the ground-based MAX-DOAS FRM4DOAS data and MMF tests, MVR the direct sun, CV and BL the FTIR data. SB and TW are responsible of the MAPA data. CH, CV, TW and MZ installed the ground-based instruments and or supervised the instruments operation. IDS prepared the model data around the site. All co-authors revised and commented on the manuscript.
At least one of the (co-)authors is a member of the editorial board of Atmospheric Measurement Techniques. The peer-review process was guided by an independent editor, and the authors also have no other competing interests to declare.
Publisher's note: Copernicus Publications remains neutral with regard to jurisdictional claims made in the text, published maps, institutional affiliations, or any other geographical representation in this paper. The authors bear the ultimate responsibility for providing appropriate place names. Views expressed in the text are those of the authors and do not necessarily reflect the views of the publisher.
Part of the reported work was carried out in the framework of the ESA FRM4DOAS-2.0 project, the ESA ATM-MPC TROPOMI validation activities and of the EUMETSAT AC SAF Continuous Development and Operations Phase (CDOP-4). We would like to thank Nicolas Theys and François Hendrick for their support and advises at different stages of the study.
This research has been supported by the European Space Agency (grant nos. 4000118181/16/I-EF, 4000135355/21/I-DT-Ir, and 4000117151/16/I-LG), the European Organization for the Exploitation of Meteorological Satellites (grant no. AC SAF CDOP-4), and the Belgian Federal Science Policy Office (grant no. PRODEX B-ACSAF). The FTIR HCHO measurements at Xianghe are supported by the China's national key research and development program (grant no. 2023YFC3705202) and the State Key Laboratory of Atmospheric Environment and Extreme Meteorology (grant no. 2024QN04).
This paper was edited by Lok Lamsal and reviewed by two anonymous referees.
Atkinson, R.: Atmospheric chemistry of VOCs and NOx, Atmos. Environ., 34, 2063–2101, https://doi.org/10.1016/S1352-2310(99)00460-4, 2000. a
Ayazpour, Z., González Abad, G., Nowlan, C. R., Sun, K., Kwon, H.-A., Chan Miller, C., Chong, H., Wang, H., Liu, X., Chance, K., O'Sullivan, E., Zhu, L., Vigouroux, C., De Smedt, I., Stremme, W., Hannigan, J. W., Notholt, J., Sun, X., Palm, M., Petri, C., Strong, K., Röhling, A. N., Mahieu, E., Smale, D., Té, Y., Morino, I., Murata, I., Nagahama, T., Kivi, R., Makarova, M., Jones, N., Sussmann, R., and Zhou, M.: Aura Ozone Monitoring Instrument (OMI) Collection 4 Formaldehyde Products, Earth and Space Science, 12, e2024EA003792, https://doi.org/10.1029/2024EA003792, 2025. a
Bae, K., Song, C.-K., Van Roozendael, M., Richter, A., Wagner, T., Merlaud, A., Pinardi, G., Friedrich, M. M., Fayt, C., Dimitropoulou, E., Lange, K., Bösch, T., Zilker, B., Latsch, M., Behrens, L. K., Ziegler, S., Ripperger-Lukosiunaite, S., Kuhn, L., Lauster, B., Reischmann, L., Uhlmannsiek, K., Cede, A., Tiefengraber, M., Gebetsberger, M., Park, R. J., Lee, H., Hong, H., Chang, L.-S., and Jeon, K.: Validation of GEMS operational v2.0 total column NO2 and HCHO during the GMAP/SIJAQ campaign, Science of The Total Environment, 974, 179190, https://doi.org/10.1016/j.scitotenv.2025.179190, 2025. a, b, c
Beirle, S., Dörner, S., Donner, S., Remmers, J., Wang, Y., and Wagner, T.: The Mainz profile algorithm (MAPA), Atmos. Meas. Tech., 12, 1785–1806, https://doi.org/10.5194/amt-12-1785-2019, 2019. a, b, c, d
Benavent, N., Garcia-Nieto, D., Wang, S., and Saiz-Lopez, A.: MAX-DOAS measurements and vertical profiles of glyoxal and formaldehyde in Madrid, Spain, Atmos. Environ., 199, 357–367, https://doi.org/10.1016/j.atmosenv.2018.11.047, 2019. a
Cazorla, M., Wolfe, G. M., Bailey, S. A., Swanson, A. K., Arkinson, H. L., and Hanisco, T. F.: A new airborne laser-induced fluorescence instrument for in situ detection of formaldehyde throughout the troposphere and lower stratosphere, Atmos. Meas. Tech., 8, 541–552, https://doi.org/10.5194/amt-8-541-2015, 2015. a
Cede, A., Herman, J., Richter, A., Krotkov, N., and Burrows, J.: Measurements of nitrogen dioxide total column amounts using a Brewer double spectrophotometer in direct Sun mode, Journal of Geophysical Research: Atmospheres, 111, https://doi.org/10.1029/2005JD006585, 2006. a
Chan, K. L., Wiegner, M., van Geffen, J., De Smedt, I., Alberti, C., Cheng, Z., Ye, S., and Wenig, M.: MAX-DOAS measurements of tropospheric NO2 and HCHO in Munich and the comparison to OMI and TROPOMI satellite observations, Atmos. Meas. Tech., 13, 4499–4520, https://doi.org/10.5194/amt-13-4499-2020, 2020. a, b
Chan, K. L., Valks, P., Heue, K.-P., Lutz, R., Hedelt, P., Loyola, D., Pinardi, G., Van Roozendael, M., Hendrick, F., Wagner, T., Kumar, V., Bais, A., Piters, A., Irie, H., Takashima, H., Kanaya, Y., Choi, Y., Park, K., Chong, J., Cede, A., Frieß, U., Richter, A., Ma, J., Benavent, N., Holla, R., Postylyakov, O., Rivera Cárdenas, C., and Wenig, M.: Global Ozone Monitoring Experiment-2 (GOME-2) daily and monthly level-3 products of atmospheric trace gas columns, Earth Syst. Sci. Data, 15, 1831–1870, https://doi.org/10.5194/essd-15-1831-2023, 2023. a
Chance, K. and Kurucz, R.: An improved high-resolution solar reference spectrum for earth's atmosphere measurements in the ultraviolet, visible, and near infrared, Journal of Quantitative Spectroscopy and Radiative Transfer, 111, 1289–1295, https://doi.org/10.1016/j.jqsrt.2010.01.036, 2010. a, b, c
Chong, K., Wang, Y., Liu, C., Gao, Y., Boersma, K. F., Tang, J., and Wang, X.: Remote Sensing Measurements at a Rural Site in China: Implications for Satellite NO2 and HCHO Measurement Uncertainty and Emissions From Fires, Journal of Geophysical Research: Atmospheres, 129, e2023JD039310, https://doi.org/10.1029/2023JD039310, 2024. a
Clémer, K., Van Roozendael, M., Fayt, C., Hendrick, F., Hermans, C., Pinardi, G., Spurr, R., Wang, P., and De Mazière, M.: Multiple wavelength retrieval of tropospheric aerosol optical properties from MAXDOAS measurements in Beijing, Atmos. Meas. Tech., 3, 863–878, https://doi.org/10.5194/amt-3-863-2010, 2010. a, b, c
Compernolle, S., Verhoelst, T., Pinardi, G., Granville, J., Hubert, D., Keppens, A., Niemeijer, S., Rino, B., Bais, A., Beirle, S., Boersma, F., Burrows, J. P., De Smedt, I., Eskes, H., Goutail, F., Hendrick, F., Lorente, A., Pazmino, A., Piters, A., Peters, E., Pommereau, J.-P., Remmers, J., Richter, A., van Geffen, J., Van Roozendael, M., Wagner, T., and Lambert, J.-C.: Validation of Aura-OMI QA4ECV NO2 climate data records with ground-based DOAS networks: the role of measurement and comparison uncertainties, Atmos. Chem. Phys., 20, 8017–8045, https://doi.org/10.5194/acp-20-8017-2020, 2020. a
Danckaert, T., Fayt, C., Van Roozendael, M., De Smedt, I., Letocart, V., Merlaud, A., and Pinardi, G.: QDOAS Software user manual, September, Royal Belgian Institute for Space Aeronomy (BIRA), Brussel, http://uv-vis.aeronomie.be/software/QDOAS/QDOAS_manual.pdf (last access: 12 February 2026), 2017. a
De Smedt, I., Stavrakou, T., Hendrick, F., Danckaert, T., Vlemmix, T., Pinardi, G., Theys, N., Lerot, C., Gielen, C., Vigouroux, C., Hermans, C., Fayt, C., Veefkind, P., Müller, J.-F., and Van Roozendael, M.: Diurnal, seasonal and long-term variations of global formaldehyde columns inferred from combined OMI and GOME-2 observations, Atmos. Chem. Phys., 15, 12519–12545, https://doi.org/10.5194/acp-15-12519-2015, 2015. a, b
De Smedt, I., Pinardi, G., Vigouroux, C., Compernolle, S., Bais, A., Benavent, N., Boersma, F., Chan, K.-L., Donner, S., Eichmann, K.-U., Hedelt, P., Hendrick, F., Irie, H., Kumar, V., Lambert, J.-C., Langerock, B., Lerot, C., Liu, C., Loyola, D., Piters, A., Richter, A., Rivera Cárdenas, C., Romahn, F., Ryan, R. G., Sinha, V., Theys, N., Vlietinck, J., Wagner, T., Wang, T., Yu, H., and Van Roozendael, M.: Comparative assessment of TROPOMI and OMI formaldehyde observations and validation against MAX-DOAS network column measurements, Atmos. Chem. Phys., 21, 12561–12593, https://doi.org/10.5194/acp-21-12561-2021, 2021. a, b
De Smedt, I., Vlietinck, J., Yu, H., Theys, N., Danckaert, T., and Van Roozendael, M.: CCI+P HCHO tropospheric column L3 data from OMI, v1 (Version 1), Royal Belgian Institute for Space Aeronomy [data set], https://doi.org/10.18758/H2V1UO6X, 2024. a
De Smedt, I., Vlietinck, J., YU, H., Theys, N., Danckaert, T., and Van Roozendael, M.: CCI+P HCHO tropospheric column L3 data from OMI, v2 (Version 2), Royal Belgian Institute for Space Aeronomy [data set], https://doi.org/10.18758/BF145884, 2025. a
Deutschmann, T., Beirle, S., Frieß, U., Grzegorski, M., Kern, C., Kritten, L., Platt, U., Prados-Román, C., Puķīte, J., Wagner, T., Werner, B., and Pfeilsticker, K.: The Monte Carlo atmospheric radiative transfer model McArtim: Introduction and validation of Jacobians and 3D features, Journal of Quantitative Spectroscopy and Radiative Transfer, 112, 1119–1137, https://doi.org/10.1016/j.jqsrt.2010.12.009, 2011. a
Eskes, H. J. and Boersma, K. F.: Averaging kernels for DOAS total-column satellite retrievals, Atmos. Chem. Phys., 3, 1285–1291, https://doi.org/10.5194/acp-3-1285-2003, 2003. a
Finkenzeller, H. and Volkamer, R.: O2–O2 CIA in the gas phase: Cross-section of weak bands, and continuum absorption between 297–500 nm, Journal of Quantitative Spectroscopy and Radiative Transfer, 279, 108063, https://doi.org/10.1016/j.jqsrt.2021.108063, 2022. a
Finlayson-Pitts, B. J. and Pitts, J. N.: Chemistry of the Upper and Lower Atmosphere: Theory, Experiments and Applications, Academic Press, San Diego, https://doi.org/10.1016/B978-012257060-5/50010-1, 2000. a
Fleischmann, O. C., Hartmann, M., Burrows, J. P., and Orphal, J.: New ultraviolet absorption cross-sections of BrO at atmospheric temperatures measured by time-windowing Fourier transform spectroscopy, Journal of Photochemistry and Photobiology A: Chemistry, 168, 117–132, https://doi.org/10.1016/j.jphotochem.2004.03.026, 2004. a, b
Franco, B., Hendrick, F., Van Roozendael, M., Müller, J.-F., Stavrakou, T., Marais, E. A., Bovy, B., Bader, W., Fayt, C., Hermans, C., Lejeune, B., Pinardi, G., Servais, C., and Mahieu, E.: Retrievals of formaldehyde from ground-based FTIR and MAX-DOAS observations at the Jungfraujoch station and comparisons with GEOS-Chem and IMAGES model simulations, Atmos. Meas. Tech., 8, 1733–1756, https://doi.org/10.5194/amt-8-1733-2015, 2015. a, b
Friedrich, M. M., Rivera, C., Stremme, W., Ojeda, Z., Arellano, J., Bezanilla, A., García-Reynoso, J. A., and Grutter, M.: NO2 vertical profiles and column densities from MAX-DOAS measurements in Mexico City, Atmos. Meas. Tech., 12, 2545–2565, https://doi.org/10.5194/amt-12-2545-2019, 2019. a, b, c, d
Friedrich, M., Van Roozendael, M., FAYT, C., and Pinardi, G.: Xianghe HCHO MAX-DOAS MMF and MAPA data from the FRM4DOAS processing system, 2018–2021 (Version 1), Royal Belgian Institute for Space Aeronomy [data set], https://doi.org/10.18758/79K62VRM, 2026. a
Frieß, U., Monks, P. S., Remedios, J. J., Rozanov, A., Sinreich, R., Wagner, T., and Platt, U.: MAX-DOAS O4 measurements: A new technique to derive information on atmospheric aerosols: 2. Modeling studies, Journal of Geophysical Research: Atmospheres, 111, https://doi.org/10.1029/2005JD006618, 2006. a, b, c
Frieß, U., Beirle, S., Alvarado Bonilla, L., Bösch, T., Friedrich, M. M., Hendrick, F., Piters, A., Richter, A., van Roozendael, M., Rozanov, V. V., Spinei, E., Tirpitz, J.-L., Vlemmix, T., Wagner, T., and Wang, Y.: Intercomparison of MAX-DOAS vertical profile retrieval algorithms: studies using synthetic data, Atmos. Meas. Tech., 12, 2155–2181, https://doi.org/10.5194/amt-12-2155-2019, 2019. a, b
Fu, W., Zhu, L., Kwon, H.-A., Park, R. J., Lee, G. T., De Smedt, I., Liu, S., Li, X., Chen, Y., Pu, D., Li, J., Zuo, X., Zhang, P., Li, Y., Yan, Z., Zhang, X., Zhang, J., Wu, X., Shen, H., Ye, J., Wang, C., Fu, T.-M., and Yang, X.: Evaluating GEMS HCHO Retrievals With TROPOMI Product, Pandora Observations, and GEOS-Chem Simulations, Earth and Space Science, 12, e2024EA003894, https://doi.org/10.1029/2024EA003894, 2025. a, b, c
Garcia, R. R., Marsh, D. R., Kinnison, D. E., Boville, B. A., and Sassi, F.: Simulation of secular trends in the middle atmosphere, 1950–2003, Journal of Geophysical Research: Atmospheres, 112, https://doi.org/10.1029/2006JD007485, 2007. a
Gratsea, M., Vrekoussis, M., Richter, A., Wittrock, F., Schönhardt, A., Burrows, J., Kazadzis, S., Mihalopoulos, N., and Gerasopoulos, E.: Slant column MAX-DOAS measurements of nitrogen dioxide, formaldehyde, glyoxal and oxygen dimer in the urban environment of Athens, Atmos. Environ., 135, 118–131, https://doi.org/10.1016/j.atmosenv.2016.03.048, 2016. a
Ha, E. S., Park, R. J., Kwon, H.-A., Lee, G. T., Lee, S. D., Shin, S., Lee, D.-W., Hong, H., Lerot, C., De Smedt, I., Danckaert, T., Hendrick, F., and Irie, H.: First evaluation of the GEMS glyoxal products against TROPOMI and ground-based measurements, Atmos. Meas. Tech., 17, 6369–6384, https://doi.org/10.5194/amt-17-6369-2024, 2024. a
Hak, C., Pundt, I., Trick, S., Kern, C., Platt, U., Dommen, J., Ordóñez, C., Prévôt, A. S. H., Junkermann, W., Astorga-Lloréns, C., Larsen, B. R., Mellqvist, J., Strandberg, A., Yu, Y., Galle, B., Kleffmann, J., Lörzer, J. C., Braathen, G. O., and Volkamer, R.: Intercomparison of four different in-situ techniques for ambient formaldehyde measurements in urban air, Atmos. Chem. Phys., 5, 2881–2900, https://doi.org/10.5194/acp-5-2881-2005, 2005. a
Heckel, A., Richter, A., Tarsu, T., Wittrock, F., Hak, C., Pundt, I., Junkermann, W., and Burrows, J. P.: MAX-DOAS measurements of formaldehyde in the Po-Valley, Atmos. Chem. Phys., 5, 909–918, https://doi.org/10.5194/acp-5-909-2005, 2005. a
Hendrick, F., Barret, B., Van Roozendael, M., Boesch, H., Butz, A., De Mazière, M., Goutail, F., Hermans, C., Lambert, J.-C., Pfeilsticker, K., and Pommereau, J.-P.: Retrieval of nitrogen dioxide stratospheric profiles from ground-based zenith-sky UV-visible observations: validation of the technique through correlative comparisons, Atmos. Chem. Phys., 4, 2091–2106, https://doi.org/10.5194/acp-4-2091-2004, 2004. a, b
Hendrick, F., Müller, J.-F., Clémer, K., Wang, P., De Mazière, M., Fayt, C., Gielen, C., Hermans, C., Ma, J. Z., Pinardi, G., Stavrakou, T., Vlemmix, T., and Van Roozendael, M.: Four years of ground-based MAX-DOAS observations of HONO and NO2 in the Beijing area, Atmos. Chem. Phys., 14, 765–781, https://doi.org/10.5194/acp-14-765-2014, 2014. a, b, c
Hendrick, F., Fayt, C., Friedrich, M., Friess, U., Richter, A., Beirle, S., Wagner, T., and Wang, Y.: Fiducial Reference Measurements for Ground-Based DOAS Air-Quality Observations, Deliverable D6: MAXDOAS Algorithm ATBD, Tech. Rep. 4000118181, Royal Belgian Institute for Space Aeronomy (BIRA), Brussel, https://frm4doas.aeronomie.be/ProjectDir/Deliverables/FRM4DOAS_D6_MAXDOAS_Algorithm_ATBD_v02_20180130.pdf (last access: 12 February 2026), 2018. a
Herman, J. and Mao, J.: Seasonal variation of total column formaldehyde, nitrogen dioxide, and ozone over various Pandora spectrometer sites with a comparison of OMI and diurnally varying DSCOVR-EPIC satellite data, Atmos. Meas. Tech., 18, 4165–4182, https://doi.org/10.5194/amt-18-4165-2025, 2025. a, b
Herman, J., Spinei, E., Fried, A., Kim, J., Kim, J., Kim, W., Cede, A., Abuhassan, N., and Segal-Rozenhaimer, M.: NO2 and HCHO measurements in Korea from 2012 to 2016 from Pandora spectrometer instruments compared with OMI retrievals and with aircraft measurements during the KORUS-AQ campaign, Atmos. Meas. Tech., 11, 4583–4603, https://doi.org/10.5194/amt-11-4583-2018, 2018. a
Hönninger, G., von Friedeburg, C., and Platt, U.: Multi axis differential optical absorption spectroscopy (MAX-DOAS), Atmos. Chem. Phys., 4, 231–254, https://doi.org/10.5194/acp-4-231-2004, 2004. a, b
Hoque, H. M. S., Irie, H., and Damiani, A.: First MAX-DOAS Observations of Formaldehyde and Glyoxal in Phimai, Thailand, Journal of Geophysical Research: Atmospheres, 123, 9957–9975, https://doi.org/10.1029/2018JD028480, 2018a. a
Hoque, H. M. S., Irie, H., Damiani, A., Rawat, P., and Naja, M.: First Simultaneous Observations of Formaldehyde and Glyoxal by MAX-DOAS in the Indo-Gangetic Plain Region, SOLA, 14, 159–164, https://doi.org/10.2151/sola.2018-028, 2018b. a
Inness, A., Ades, M., Agustí-Panareda, A., Barré, J., Benedictow, A., Blechschmidt, A.-M., Dominguez, J. J., Engelen, R., Eskes, H., Flemming, J., Huijnen, V., Jones, L., Kipling, Z., Massart, S., Parrington, M., Peuch, V.-H., Razinger, M., Remy, S., Schulz, M., and Suttie, M.: The CAMS reanalysis of atmospheric composition, Atmos. Chem. Phys., 19, 3515–3556, https://doi.org/10.5194/acp-19-3515-2019, 2019. a
Irie, H., Kanaya, Y., Akimoto, H., Iwabuchi, H., Shimizu, A., and Aoki, K.: First retrieval of tropospheric aerosol profiles using MAX-DOAS and comparison with lidar and sky radiometer measurements, Atmos. Chem. Phys., 8, 341–350, https://doi.org/10.5194/acp-8-341-2008, 2008. a
Irie, H., Hoque, H. M. S., Damiani, A., Okamoto, H., Fatmi, A. M., Khatri, P., Takamura, T., and Jarupongsakul, T.: Simultaneous observations by sky radiometer and MAX-DOAS for characterization of biomass burning plumes in central Thailand in January–April 2016, Atmos. Meas. Tech., 12, 599–606, https://doi.org/10.5194/amt-12-599-2019, 2019. a
Ji, D., Zhou, M., Wang, P., Yang, Y., Wang, T., Sun, X., Hermans, C., Yao, B., and Wang, G.: Deriving Temporal and Vertical Distributions of Methane in Xianghe Using Ground-based Fourier Transform Infrared and Gas-analyzer Measurements, Adv. Atmos. Sci., 37, 597–607, https://doi.org/10.1007/s00376-020-9233-4, 2020. a
Jiao, P., Xing, C., Li, Y., Ji, X., Tan, W., Li, Q., Liu, H., and Liu, C.: A dataset of ground-based vertical profile observations of aerosol, NO2, and HCHO from the hyperspectral vertical remote sensing network in China (2019–2023), Earth Syst. Sci. Data, 17, 3167–3187, https://doi.org/10.5194/essd-17-3167-2025, 2025. a
Jones, N. B., Riedel, K., Allan, W., Wood, S., Palmer, P. I., Chance, K., and Notholt, J.: Long-term tropospheric formaldehyde concentrations deduced from ground-based fourier transform solar infrared measurements, Atmos. Chem. Phys., 9, 7131–7142, https://doi.org/10.5194/acp-9-7131-2009, 2009. a
Karagkiozidis, D., Friedrich, M. M., Beirle, S., Bais, A., Hendrick, F., Voudouri, K. A., Fountoulakis, I., Karanikolas, A., Tzoumaka, P., Van Roozendael, M., Balis, D., and Wagner, T.: Retrieval of tropospheric aerosol, NO2, and HCHO vertical profiles from MAX-DOAS observations over Thessaloniki, Greece: intercomparison and validation of two inversion algorithms, Atmos. Meas. Tech., 15, 1269–1301, https://doi.org/10.5194/amt-15-1269-2022, 2022. a, b, c
Kreher, K., Van Roozendael, M., Hendrick, F., Apituley, A., Dimitropoulou, E., Frieß, U., Richter, A., Wagner, T., Lampel, J., Abuhassan, N., Ang, L., Anguas, M., Bais, A., Benavent, N., Bösch, T., Bognar, K., Borovski, A., Bruchkouski, I., Cede, A., Chan, K. L., Donner, S., Drosoglou, T., Fayt, C., Finkenzeller, H., Garcia-Nieto, D., Gielen, C., Gómez-Martín, L., Hao, N., Henzing, B., Herman, J. R., Hermans, C., Hoque, S., Irie, H., Jin, J., Johnston, P., Khayyam Butt, J., Khokhar, F., Koenig, T. K., Kuhn, J., Kumar, V., Liu, C., Ma, J., Merlaud, A., Mishra, A. K., Müller, M., Navarro-Comas, M., Ostendorf, M., Pazmino, A., Peters, E., Pinardi, G., Pinharanda, M., Piters, A., Platt, U., Postylyakov, O., Prados-Roman, C., Puentedura, O., Querel, R., Saiz-Lopez, A., Schönhardt, A., Schreier, S. F., Seyler, A., Sinha, V., Spinei, E., Strong, K., Tack, F., Tian, X., Tiefengraber, M., Tirpitz, J.-L., van Gent, J., Volkamer, R., Vrekoussis, M., Wang, S., Wang, Z., Wenig, M., Wittrock, F., Xie, P. H., Xu, J., Yela, M., Zhang, C., and Zhao, X.: Intercomparison of NO2, O4, O3 and HCHO slant column measurements by MAX-DOAS and zenith-sky UV–visible spectrometers during CINDI-2, Atmos. Meas. Tech., 13, 2169–2208, https://doi.org/10.5194/amt-13-2169-2020, 2020. a, b, c
Kumar, V., Beirle, S., Dörner, S., Mishra, A. K., Donner, S., Wang, Y., Sinha, V., and Wagner, T.: Long-term MAX-DOAS measurements of NO2, HCHO, and aerosols and evaluation of corresponding satellite data products over Mohali in the Indo-Gangetic Plain, Atmos. Chem. Phys., 20, 14183–14235, https://doi.org/10.5194/acp-20-14183-2020, 2020. a
Kwon, H.-A., Abad, G. G., Nowlan, C. R., Chong, H., Souri, A. H., Vigouroux, C., Röhling, A., Kivi, R., Makarova, M., Notholt, J., Palm, M., Winkler, H., Té, Y., Sussmann, R., Rettinger, M., Mahieu, E., Strong, K., Lutsch, E., Yamanouchi, S., Nagahama, T., Hannigan, J. W., Zhou, M., Murata, I., Grutter, M., Stremme, W., De Mazière, M., Jones, N., Smale, D., and Morino, I.: Validation of OMPS Suomi NPP and OMPS NOAA-20 Formaldehyde Total Columns With NDACC FTIR Observations, Earth and Space Science, 10, e2022EA002778, https://doi.org/10.1029/2022EA002778, 2023. a
Lange, K., Richter, A., Bösch, T., Zilker, B., Latsch, M., Behrens, L. K., Okafor, C. M., Bösch, H., Burrows, J. P., Merlaud, A., Pinardi, G., Fayt, C., Friedrich, M. M., Dimitropoulou, E., Van Roozendael, M., Ziegler, S., Ripperger-Lukosiunaite, S., Kuhn, L., Lauster, B., Wagner, T., Hong, H., Kim, D., Chang, L.-S., Bae, K., Song, C.-K., Park, J.-U., and Lee, H.: Validation of GEMS tropospheric NO2 columns and their diurnal variation with ground-based DOAS measurements, Atmos. Meas. Tech., 17, 6315–6344, https://doi.org/10.5194/amt-17-6315-2024, 2024. a
Lee, G. T., Park, R. J., Kwon, H.-A., Ha, E. S., Lee, S. D., Shin, S., Ahn, M.-H., Kang, M., Choi, Y.-S., Kim, G., Lee, D.-W., Kim, D.-R., Hong, H., Langerock, B., Vigouroux, C., Lerot, C., Hendrick, F., Pinardi, G., De Smedt, I., Van Roozendael, M., Wang, P., Chong, H., Cho, Y., and Kim, J.: First evaluation of the GEMS formaldehyde product against TROPOMI and ground-based column measurements during the in-orbit test period, Atmos. Chem. Phys., 24, 4733–4749, https://doi.org/10.5194/acp-24-4733-2024, 2024. a, b, c
Lee, H., Ryu, J., Irie, H., Jang, S.-H., Park, J., Choi, W., and Hong, H.: Investigations of the Diurnal Variation of Vertical HCHO Profiles Based on MAX-DOAS Measurements in Beijing: Comparisons with OMI Vertical Column Data, Atmosphere, 6, 1816–1832, https://doi.org/10.3390/atmos6111816, 2015. a
Lerot, C., Hendrick, F., Van Roozendael, M., Alvarado, L. M. A., Richter, A., De Smedt, I., Theys, N., Vlietinck, J., Yu, H., Van Gent, J., Stavrakou, T., Müller, J.-F., Valks, P., Loyola, D., Irie, H., Kumar, V., Wagner, T., Schreier, S. F., Sinha, V., Wang, T., Wang, P., and Retscher, C.: Glyoxal tropospheric column retrievals from TROPOMI – multi-satellite intercomparison and ground-based validation, Atmos. Meas. Tech., 14, 7775–7807, https://doi.org/10.5194/amt-14-7775-2021, 2021. a
Mahieu, E., Zander, R., Delbouille, L., Demoulin, P., Roland, G., and Servais, C.: Observed Trends in Total Vertical Column Abundances of Atmospheric Gases from IR Solar Spectra Recorded at the Jungfraujoch, Journal of Atmospheric Chemistry, 28, 227–243, https://doi.org/10.1023/A:1005854926740, 1997. a
Meller, R. and Moortgat, G. K.: Temperature dependence of the absorption cross sections of formaldehyde between 223 and 323 K in the wavelength range 225–375 nm, Journal of Geophysical Research: Atmospheres, 105, 7089–7101, https://doi.org/10.1029/1999JD901074, 2000. a, b, c
Merlaud, A., Belegante, L., Constantin, D.-E., Den Hoed, M., Meier, A. C., Allaart, M., Ardelean, M., Arseni, M., Bösch, T., Brenot, H., Calcan, A., Dekemper, E., Donner, S., Dörner, S., Balanica Dragomir, M. C., Georgescu, L., Nemuc, A., Nicolae, D., Pinardi, G., Richter, A., Rosu, A., Ruhtz, T., Schönhardt, A., Schuettemeyer, D., Shaiganfar, R., Stebel, K., Tack, F., Nicolae Vâjâiac, S., Vasilescu, J., Vanhamel, J., Wagner, T., and Van Roozendael, M.: Satellite validation strategy assessments based on the AROMAT campaigns, Atmos. Meas. Tech., 13, 5513–5535, https://doi.org/10.5194/amt-13-5513-2020, 2020. a
Müller, J.-F., Stavrakou, T., Oomen, G.-M., Opacka, B., De Smedt, I., Guenther, A., Vigouroux, C., Langerock, B., Aquino, C. A. B., Grutter, M., Hannigan, J., Hase, F., Kivi, R., Lutsch, E., Mahieu, E., Makarova, M., Metzger, J.-M., Morino, I., Murata, I., Nagahama, T., Notholt, J., Ortega, I., Palm, M., Röhling, A., Stremme, W., Strong, K., Sussmann, R., Té, Y., and Fried, A.: Bias correction of OMI HCHO columns based on FTIR and aircraft measurements and impact on top-down emission estimates, Atmos. Chem. Phys., 24, 2207–2237, https://doi.org/10.5194/acp-24-2207-2024, 2024. a, b
Notholt, J., Toon, G. C., Lehmann, R., Sen, B., and Blavier, J.-F.: Comparison of Arctic and Antarctic trace gas column abundances from ground-based Fourier transform infrared spectrometry, Journal of Geophysical Research: Atmospheres, 102, 12863–12869, https://doi.org/10.1029/97JD00358, 1997. a
Oomen, G.-M., Müller, J.-F., Stavrakou, T., De Smedt, I., Blumenstock, T., Kivi, R., Makarova, M., Palm, M., Röhling, A., Té, Y., Vigouroux, C., Friedrich, M. M., Frieß, U., Hendrick, F., Merlaud, A., Piters, A., Richter, A., Van Roozendael, M., and Wagner, T.: Weekly derived top-down volatile-organic-compound fluxes over Europe from TROPOMI HCHO data from 2018 to 2021, Atmos. Chem. Phys., 24, 449–474, https://doi.org/10.5194/acp-24-449-2024, 2024. a, b
Park, J., Lee, H., Kim, J., Herman, J., Kim, W., Hong, H., Choi, W., Yang, J., and Kim, D.: Retrieval Accuracy of HCHO Vertical Column Density from Ground-Based Direct-Sun Measurement and First HCHO Column Measurement Using Pandora, Remote Sensing, 10, https://doi.org/10.3390/rs10020173, 2018. a
Paton-Walsh, C., Deutscher, N. M., Griffith, D. W. T., Forgan, B. W., Wilson, S. R., Jones, N. B., and Edwards, D. P.: Trace gas emissions from savanna fires in northern Australia, Journal of Geophysical Research: Atmospheres, 115, https://doi.org/10.1029/2009JD013309, 2010. a
Peters, E., Wittrock, F., Großmann, K., Frieß, U., Richter, A., and Burrows, J. P.: Formaldehyde and nitrogen dioxide over the remote western Pacific Ocean: SCIAMACHY and GOME-2 validation using ship-based MAX-DOAS observations, Atmos. Chem. Phys., 12, 11179–11197, https://doi.org/10.5194/acp-12-11179-2012, 2012. a
Pinardi, G., Van Roozendael, M., Abuhassan, N., Adams, C., Cede, A., Clémer, K., Fayt, C., Frieß, U., Gil, M., Herman, J., Hermans, C., Hendrick, F., Irie, H., Merlaud, A., Navarro Comas, M., Peters, E., Piters, A. J. M., Puentedura, O., Richter, A., Schönhardt, A., Shaiganfar, R., Spinei, E., Strong, K., Takashima, H., Vrekoussis, M., Wagner, T., Wittrock, F., and Yilmaz, S.: MAX-DOAS formaldehyde slant column measurements during CINDI: intercomparison and analysis improvement, Atmos. Meas. Tech., 6, 167–185, https://doi.org/10.5194/amt-6-167-2013, 2013. a, b, c, d, e, f
Pinardi, G., Van Roozendael, M., Hendrick, F., Theys, N., Abuhassan, N., Bais, A., Boersma, F., Cede, A., Chong, J., Donner, S., Drosoglou, T., Dzhola, A., Eskes, H., Frieß, U., Granville, J., Herman, J. R., Holla, R., Hovila, J., Irie, H., Kanaya, Y., Karagkiozidis, D., Kouremeti, N., Lambert, J.-C., Ma, J., Peters, E., Piters, A., Postylyakov, O., Richter, A., Remmers, J., Takashima, H., Tiefengraber, M., Valks, P., Vlemmix, T., Wagner, T., and Wittrock, F.: Validation of tropospheric NO2 column measurements of GOME-2A and OMI using MAX-DOAS and direct sun network observations, Atmos. Meas. Tech., 13, 6141–6174, https://doi.org/10.5194/amt-13-6141-2020, 2020. a
Pinardi, G., Friedrich, M., Van Roozendael, M., and Fayt, C.: Xianghe HCHO MAX-DOAS MMF data with monthly TM5 model profiles as a priori (Version 1), Royal Belgian Institute for Space Aeronomy [data set], https://doi.org/10.18758/EX6DPIFK, 2026a. a
Pinardi, G., Friedrich, M., Van Roozendael, M., and Fayt, C.: Xianghe HCHO MAX-DOAS MMF data with monthly CAMS model profiles as a priori (Version 1), Royal Belgian Institute for Space Aeronomy [data set], https://doi.org/10.18758/6ULMAD6R, 2026b. a
Piters, A. J. M., Boersma, K. F., Kroon, M., Hains, J. C., Van Roozendael, M., Wittrock, F., Abuhassan, N., Adams, C., Akrami, M., Allaart, M. A. F., Apituley, A., Beirle, S., Bergwerff, J. B., Berkhout, A. J. C., Brunner, D., Cede, A., Chong, J., Clémer, K., Fayt, C., Frieß, U., Gast, L. F. L., Gil-Ojeda, M., Goutail, F., Graves, R., Griesfeller, A., Großmann, K., Hemerijckx, G., Hendrick, F., Henzing, B., Herman, J., Hermans, C., Hoexum, M., van der Hoff, G. R., Irie, H., Johnston, P. V., Kanaya, Y., Kim, Y. J., Klein Baltink, H., Kreher, K., de Leeuw, G., Leigh, R., Merlaud, A., Moerman, M. M., Monks, P. S., Mount, G. H., Navarro-Comas, M., Oetjen, H., Pazmino, A., Perez-Camacho, M., Peters, E., du Piesanie, A., Pinardi, G., Puentedura, O., Richter, A., Roscoe, H. K., Schönhardt, A., Schwarzenbach, B., Shaiganfar, R., Sluis, W., Spinei, E., Stolk, A. P., Strong, K., Swart, D. P. J., Takashima, H., Vlemmix, T., Vrekoussis, M., Wagner, T., Whyte, C., Wilson, K. M., Yela, M., Yilmaz, S., Zieger, P., and Zhou, Y.: The Cabauw Intercomparison campaign for Nitrogen Dioxide measuring Instruments (CINDI): design, execution, and early results, Atmos. Meas. Tech., 5, 457–485, https://doi.org/10.5194/amt-5-457-2012, 2012. a, b
Platt, U. and Stutz, J.: Differential Optical Absorption Spectroscopy, Springer, Berlin Heidelberg, https://doi.org/10.1017/CBO9781107415324.004, 2008. a
Rawat, P., Naja, M., Rajwar, M. C., Irie, H., Lerot, C., Kumar, M., and Lal, S.: Long-term observations of NO2, SO2, HCHO, and CHOCHO over the Himalayan foothills: Insights from MAX-DOAS, TROPOMI, and GOME-2, Atmos. Environ., 336, 120746, https://doi.org/10.1016/j.atmosenv.2024.120746, 2024. a
Rawat, P., Crawford, J. H., Travis, K. R., Judd, L. M., Demetillo, M. A. G., Valin, L. C., Szykman, J. J., Whitehill, A., Baumann, E., and Hanisco, T. F.: Maximizing the scientific application of Pandora column observations of HCHO and NO2, Atmos. Meas. Tech., 18, 2899–2917, https://doi.org/10.5194/amt-18-2899-2025, 2025. a
Rivera Cárdenas, C., Guarín, C., Stremme, W., Friedrich, M. M., Bezanilla, A., Rivera Ramos, D., Mendoza-Rodríguez, C. A., Grutter, M., Blumenstock, T., and Hase, F.: Formaldehyde total column densities over Mexico City: comparison between multi-axis differential optical absorption spectroscopy and solar-absorption Fourier transform infrared measurements, Atmos. Meas. Tech., 14, 595–613, https://doi.org/10.5194/amt-14-595-2021, 2021. a, b, c, d
Rodgers, C. D.: Inverse Methods for Atmospheric Sounding: Theory and Practice, World Scientific, https://doi.org/10.1142/3171, 2000. a, b, c, d, e
Rodgers, C. D. and Connor, B. J.: Intercomparison of remote sounding instruments, Journal of Geophysical Research: Atmospheres, 108, https://doi.org/10.1029/2002JD002299, 2003. a, b, c, d
Rothman, L., Gordon, I., Babikov, Y., Barbe, A., Chris Benner, D., Bernath, P., Birk, M., Bizzocchi, L., Boudon, V., Brown, L., Campargue, A., Chance, K., Cohen, E., Coudert, L., Devi, V., Drouin, B., Fayt, A., Flaud, J.-M., Gamache, R., Harrison, J., Hartmann, J.-M., Hill, C., Hodges, J., Jacquemart, D., Jolly, A., Lamouroux, J., Le Roy, R., Li, G., Long, D., Lyulin, O., Mackie, C., Massie, S., Mikhailenko, S., Müller, H., Naumenko, O., Nikitin, A., Orphal, J., Perevalov, V., Perrin, A., Polovtseva, E., Richard, C., Smith, M., Starikova, E., Sung, K., Tashkun, S., Tennyson, J., Toon, G., Tyuterev, V., and Wagner, G.: The HITRAN2012 molecular spectroscopic database, Journal of Quantitative Spectroscopy and Radiative Transfer, 130, 4–50, https://doi.org/10.1016/j.jqsrt.2013.07.002, 2013. a
Ryan, R. G., Silver, J. D., Querel, R., Smale, D., Rhodes, S., Tully, M., Jones, N., and Schofield, R.: Comparison of formaldehyde tropospheric columns in Australia and New Zealand using MAX-DOAS, FTIR and TROPOMI, Atmos. Meas. Tech., 13, 6501–6519, https://doi.org/10.5194/amt-13-6501-2020, 2020. a, b, c, d, e
Schreier, S. F., Richter, A., Peters, E., Ostendorf, M., Schmalwieser, A. W., Weihs, P., and Burrows, J. P.: Dual ground-based MAX-DOAS observations in Vienna, Austria: Evaluation of horizontal and temporal NO2, HCHO, and CHOCHO distributions and comparison with independent data sets, Atmos. Environ. X, 5, 100059, https://doi.org/10.1016/j.aeaoa.2019.100059, 2020. a
Sebol, A., Wolfe, G., Canty, T., St. Clair, J., Delaria, E., Kaiser, J., Desai, N., Rollins, A., Waxman, E., Zuraski, K., Place, B., Pandey, A., Singh, A., Ring, A., Gatebe, C., and Dean-Day, J.: Evaluation of Pandora HCHO and NO2 with Airborne In Situ Observations, EGUsphere [preprint], https://doi.org/10.5194/egusphere-2025-5261, 2025. a, b
Sen, P. K.: Estimates of the regression coefficient based on Kendall's tau, J. Am. Stat. Assoc., 63, 1379–1389, https://doi.org/10.2307/2285891, 1968. a
Serdyuchenko, A., Gorshelev, V., Weber, M., Chehade, W., and Burrows, J. P.: High spectral resolution ozone absorption cross-sections – Part 2: Temperature dependence, Atmos. Meas. Tech., 7, 625–636, https://doi.org/10.5194/amt-7-625-2014, 2014. a, b
Sha, M. K., Langerock, B., Blavier, J.-F. L., Blumenstock, T., Borsdorff, T., Buschmann, M., Dehn, A., De Mazière, M., Deutscher, N. M., Feist, D. G., García, O. E., Griffith, D. W. T., Grutter, M., Hannigan, J. W., Hase, F., Heikkinen, P., Hermans, C., Iraci, L. T., Jeseck, P., Jones, N., Kivi, R., Kumps, N., Landgraf, J., Lorente, A., Mahieu, E., Makarova, M. V., Mellqvist, J., Metzger, J.-M., Morino, I., Nagahama, T., Notholt, J., Ohyama, H., Ortega, I., Palm, M., Petri, C., Pollard, D. F., Rettinger, M., Robinson, J., Roche, S., Roehl, C. M., Röhling, A. N., Rousogenous, C., Schneider, M., Shiomi, K., Smale, D., Stremme, W., Strong, K., Sussmann, R., Té, Y., Uchino, O., Velazco, V. A., Vigouroux, C., Vrekoussis, M., Wang, P., Warneke, T., Wizenberg, T., Wunch, D., Yamanouchi, S., Yang, Y., and Zhou, M.: Validation of methane and carbon monoxide from Sentinel-5 Precursor using TCCON and NDACC-IRWG stations, Atmos. Meas. Tech., 14, 6249–6304, https://doi.org/10.5194/amt-14-6249-2021, 2021. a
Song, Y., Xing, C., Liu, C., Lin, J., Wu, H., Liu, T., Lin, H., Zhang, C., Tan, W., Ji, X., Liu, H., and Li, Q.: Evaluation of transport processes over North China Plain and Yangtze River Delta using MAX-DOAS observations, Atmos. Chem. Phys., 23, 1803–1824, https://doi.org/10.5194/acp-23-1803-2023, 2023. a
Spinei, E., Whitehill, A., Fried, A., Tiefengraber, M., Knepp, T. N., Herndon, S., Herman, J. R., Müller, M., Abuhassan, N., Cede, A., Richter, D., Walega, J., Crawford, J., Szykman, J., Valin, L., Williams, D. J., Long, R., Swap, R. J., Lee, Y., Nowak, N., and Poche, B.: The first evaluation of formaldehyde column observations by improved Pandora spectrometers during the KORUS-AQ field study, Atmos. Meas. Tech., 11, 4943–4961, https://doi.org/10.5194/amt-11-4943-2018, 2018. a
Spinei, E., Tiefengraber, M., Müller, M., Gebetsberger, M., Cede, A., Valin, L., Szykman, J., Whitehill, A., Kotsakis, A., Santos, F., Abbuhasan, N., Zhao, X., Fioletov, V., Lee, S. C., and Swap, R.: Effect of polyoxymethylene (POM-H Delrin) off-gassing within the Pandora head sensor on direct-sun and multi-axis formaldehyde column measurements in 2016–2019, Atmos. Meas. Tech., 14, 647–663, https://doi.org/10.5194/amt-14-647-2021, 2021. a
Spurr, R. J., Kurosu, T. P., and Chance, K. V.: A linearized discrete ordinate radiative transfer model for atmospheric remote-sensing retrieval, Journal of Quantitative Spectroscopy and Radiative Transfer, 68, 689–735, https://doi.org/10.1016/S0022-4073(00)00055-8, 2001. a
Stavrakou, T., Müller, J.-F., De Smedt, I., Van Roozendael, M., van der Werf, G. R., Giglio, L., and Guenther, A.: Evaluating the performance of pyrogenic and biogenic emission inventories against one decade of space-based formaldehyde columns, Atmos. Chem. Phys., 9, 1037–1060, https://doi.org/10.5194/acp-9-1037-2009, 2009. a
St. Clair, J. M., Swanson, A. K., Bailey, S. A., Wolfe, G. M., Marrero, J. E., Iraci, L. T., Hagopian, J. G., and Hanisco, T. F.: A new non-resonant laser-induced fluorescence instrument for the airborne in situ measurement of formaldehyde, Atmos. Meas. Tech., 10, 4833–4844, https://doi.org/10.5194/amt-10-4833-2017, 2017. a
Stutz, J., Kim, E. S., Platt, U., Bruno, P., Perrino, C., and Febo, A.: UV-visible absorption cross sections of nitrous acid, Journal of Geophysical Research: Atmospheres, 105, 14585–14592, https://doi.org/10.1029/2000JD900003, 2000. a
Thalman, R. and Volkamer, R.: Temperature dependent absorption cross-sections of O2–O2 collision pairs between 340 and 630 nm and at atmospherically relevant pressure, Phys. Chem. Chem. Phys., 15, 15371–15381, https://doi.org/10.1039/C3CP50968K, 2013. a
Theil, H.: A rank-invariant method of linear and polynomial regression analysis, Nederl. Akad. Wetensch., Proc., 53, 386–392, 1950. a
Theys, N., De Smedt, I., van Gent, J., Danckaert, T., Wang, T., Hendrick, F., Stavrakou, T., Bauduin, S., Clarisse, L., Li, C., Krotkov, N., Yu, H., Brenot, H., and Van Roozendael, M.: Sulfur dioxide vertical column DOAS retrievals from the Ozone Monitoring Instrument: Global observations and comparison to ground-based and satellite data, Journal of Geophysical Research: Atmospheres, 120, 2470–2491, https://doi.org/10.1002/2014JD022657, 2015. a
Theys, N., Fioletov, V., Li, C., De Smedt, I., Lerot, C., McLinden, C., Krotkov, N., Griffin, D., Clarisse, L., Hedelt, P., Loyola, D., Wagner, T., Kumar, V., Innes, A., Ribas, R., Hendrick, F., Vlietinck, J., Brenot, H., and Van Roozendael, M.: A sulfur dioxide Covariance-Based Retrieval Algorithm (COBRA): application to TROPOMI reveals new emission sources, Atmos. Chem. Phys., 21, 16727–16744, https://doi.org/10.5194/acp-21-16727-2021, 2021. a
Tikhonov, A. N.: On the solution of ill-posed problems and the method of regularization, Dokl. Akad. Nauk SSSR, 151, 501–504, 1963. a
Tirpitz, J.-L., Frieß, U., Hendrick, F., Alberti, C., Allaart, M., Apituley, A., Bais, A., Beirle, S., Berkhout, S., Bognar, K., Bösch, T., Bruchkouski, I., Cede, A., Chan, K. L., den Hoed, M., Donner, S., Drosoglou, T., Fayt, C., Friedrich, M. M., Frumau, A., Gast, L., Gielen, C., Gomez-Martín, L., Hao, N., Hensen, A., Henzing, B., Hermans, C., Jin, J., Kreher, K., Kuhn, J., Lampel, J., Li, A., Liu, C., Liu, H., Ma, J., Merlaud, A., Peters, E., Pinardi, G., Piters, A., Platt, U., Puentedura, O., Richter, A., Schmitt, S., Spinei, E., Stein Zweers, D., Strong, K., Swart, D., Tack, F., Tiefengraber, M., van der Hoff, R., van Roozendael, M., Vlemmix, T., Vonk, J., Wagner, T., Wang, Y., Wang, Z., Wenig, M., Wiegner, M., Wittrock, F., Xie, P., Xing, C., Xu, J., Yela, M., Zhang, C., and Zhao, X.: Intercomparison of MAX-DOAS vertical profile retrieval algorithms: studies on field data from the CINDI-2 campaign, Atmos. Meas. Tech., 14, 1–35, https://doi.org/10.5194/amt-14-1-2021, 2021. a, b, c, d
Vandaele, A. C., Hermans, C., Simon, P. C., Carleer, M., Colin, R., Fally, S., Mérienne, M. F., Jenouvrier, A., and Coquart, B.: Measurements of the NO2 absorption cross-section from 42 000 cm−1 to 10 000 cm−1 (238-1000 nm) at 220 K and 294 K, J. Quant. Spectrosc. Radiat. Transf., 59, 171–184, https://doi.org/10.1016/S0022-4073(97)00168-4, 1998. a, b
Van Roozendael, M. and Pinardi, G.: Xianghe HCHO direct sun data (Version 1), Royal Belgian Institute for Space Aeronomy [data set], https://doi.org/10.18758/S4A40K11, 2026. a
Van Roozendael, M., Hendrick, F., Friedrich, M. M., Fayt, C., Bais, A., Beirle, S., Bösch, T., Navarro Comas, M., Friess, U., Karagkiozidis, D., Kreher, K., Merlaud, A., Pinardi, G., Piters, A., Prados-Roman, C., Puentedura, O., Reischmann, L., Richter, A., Tirpitz, J.-L., Wagner, T., Yela, M., and Ziegler, S.: Fiducial Reference Measurements for Air Quality Monitoring Using Ground-Based MAX-DOAS Instruments (FRM4DOAS), Remote Sensing, 16, https://doi.org/10.3390/rs16234523, 2024. a, b, c, d, e, f
Verhoelst, T., Compernolle, S., Pinardi, G., Lambert, J.-C., Eskes, H. J., Eichmann, K.-U., Fjæraa, A. M., Granville, J., Niemeijer, S., Cede, A., Tiefengraber, M., Hendrick, F., Pazmiño, A., Bais, A., Bazureau, A., Boersma, K. F., Bognar, K., Dehn, A., Donner, S., Elokhov, A., Gebetsberger, M., Goutail, F., Grutter de la Mora, M., Gruzdev, A., Gratsea, M., Hansen, G. H., Irie, H., Jepsen, N., Kanaya, Y., Karagkiozidis, D., Kivi, R., Kreher, K., Levelt, P. F., Liu, C., Müller, M., Navarro Comas, M., Piters, A. J. M., Pommereau, J.-P., Portafaix, T., Prados-Roman, C., Puentedura, O., Querel, R., Remmers, J., Richter, A., Rimmer, J., Rivera Cárdenas, C., Saavedra de Miguel, L., Sinyakov, V. P., Stremme, W., Strong, K., Van Roozendael, M., Veefkind, J. P., Wagner, T., Wittrock, F., Yela González, M., and Zehner, C.: Ground-based validation of the Copernicus Sentinel-5P TROPOMI NO2 measurements with the NDACC ZSL-DOAS, MAX-DOAS and Pandonia global networks, Atmos. Meas. Tech., 14, 481–510, https://doi.org/10.5194/amt-14-481-2021, 2021. a
Viatte, C., Strong, K., Walker, K. A., and Drummond, J. R.: Five years of CO, HCN, C2H6, C2H2, CH3OH, HCOOH and H2CO total columns measured in the Canadian high Arctic, Atmos. Meas. Tech., 7, 1547–1570, https://doi.org/10.5194/amt-7-1547-2014, 2014. a
Vigouroux, C., Hendrick, F., Stavrakou, T., Dils, B., De Smedt, I., Hermans, C., Merlaud, A., Scolas, F., Senten, C., Vanhaelewyn, G., Fally, S., Carleer, M., Metzger, J.-M., Müller, J.-F., Van Roozendael, M., and De Mazière, M.: Ground-based FTIR and MAX-DOAS observations of formaldehyde at Réunion Island and comparisons with satellite and model data, Atmos. Chem. Phys., 9, 9523–9544, https://doi.org/10.5194/acp-9-9523-2009, 2009. a, b, c, d, e
Vigouroux, C., Bauer Aquino, C. A., Bauwens, M., Becker, C., Blumenstock, T., De Mazière, M., García, O., Grutter, M., Guarin, C., Hannigan, J., Hase, F., Jones, N., Kivi, R., Koshelev, D., Langerock, B., Lutsch, E., Makarova, M., Metzger, J.-M., Müller, J.-F., Notholt, J., Ortega, I., Palm, M., Paton-Walsh, C., Poberovskii, A., Rettinger, M., Robinson, J., Smale, D., Stavrakou, T., Stremme, W., Strong, K., Sussmann, R., Té, Y., and Toon, G.: NDACC harmonized formaldehyde time series from 21 FTIR stations covering a wide range of column abundances, Atmos. Meas. Tech., 11, 5049–5073, https://doi.org/10.5194/amt-11-5049-2018, 2018. a, b, c, d, e, f, g, h
Vigouroux, C., Langerock, B., Bauer Aquino, C. A., Blumenstock, T., Cheng, Z., De Mazière, M., De Smedt, I., Grutter, M., Hannigan, J. W., Jones, N., Kivi, R., Loyola, D., Lutsch, E., Mahieu, E., Makarova, M., Metzger, J.-M., Morino, I., Murata, I., Nagahama, T., Notholt, J., Ortega, I., Palm, M., Pinardi, G., Röhling, A., Smale, D., Stremme, W., Strong, K., Sussmann, R., Té, Y., van Roozendael, M., Wang, P., and Winkler, H.: TROPOMI–Sentinel-5 Precursor formaldehyde validation using an extensive network of ground-based Fourier-transform infrared stations, Atmos. Meas. Tech., 13, 3751–3767, https://doi.org/10.5194/amt-13-3751-2020, 2020. a, b, c, d, e
Vlemmix, T., Hendrick, F., Pinardi, G., De Smedt, I., Fayt, C., Hermans, C., Piters, A., Wang, P., Levelt, P., and Van Roozendael, M.: MAX-DOAS observations of aerosols, formaldehyde and nitrogen dioxide in the Beijing area: comparison of two profile retrieval approaches, Atmos. Meas. Tech., 8, 941–963, https://doi.org/10.5194/amt-8-941-2015, 2015. a, b, c, d, e, f
Wagner, T., Dix, B., Friedeburg, C. v., Frieß, U., Sanghavi, S., Sinreich, R., and Platt, U.: MAX-DOAS O4 measurements: A new technique to derive information on atmospheric aerosols; Principles and information content, J. Geophys. Res., 109, D22205, https://doi.org/10.1029/2004JD004904, 2004. a, b
Wagner, T., Deutschmann, T., and Platt, U.: Determination of aerosol properties from MAX-DOAS observations of the Ring effect, Atmos. Meas. Tech., 2, 495–512, https://doi.org/10.5194/amt-2-495-2009, 2009. a
Wagner, T., Beirle, S., Brauers, T., Deutschmann, T., Frieß, U., Hak, C., Halla, J. D., Heue, K. P., Junkermann, W., Li, X., Platt, U., and Pundt-Gruber, I.: Inversion of tropospheric profiles of aerosol extinction and HCHO and NO2 mixing ratios from MAX-DOAS observations in Milano during the summer of 2003 and comparison with independent data sets, Atmos. Meas. Tech., 4, 2685–2715, https://doi.org/10.5194/amt-4-2685-2011, 2011. a, b
Wagner, T., Beirle, S., Benavent, N., Bösch, T., Chan, K. L., Donner, S., Dörner, S., Fayt, C., Frieß, U., García-Nieto, D., Gielen, C., González-Bartolome, D., Gomez, L., Hendrick, F., Henzing, B., Jin, J. L., Lampel, J., Ma, J., Mies, K., Navarro, M., Peters, E., Pinardi, G., Puentedura, O., Puķīte, J., Remmers, J., Richter, A., Saiz-Lopez, A., Shaiganfar, R., Sihler, H., Van Roozendael, M., Wang, Y., and Yela, M.: Is a scaling factor required to obtain closure between measured and modelled atmospheric O4 absorptions? An assessment of uncertainties of measurements and radiative transfer simulations for 2 selected days during the MAD-CAT campaign, Atmos. Meas. Tech., 12, 2745–2817, https://doi.org/10.5194/amt-12-2745-2019, 2019. a
Wang, T., Hendrick, F., Wang, P., Tang, G., Clémer, K., Yu, H., Fayt, C., Hermans, C., Gielen, C., Müller, J.-F., Pinardi, G., Theys, N., Brenot, H., and Van Roozendael, M.: Evaluation of tropospheric SO2 retrieved from MAX-DOAS measurements in Xianghe, China, Atmos. Chem. Phys., 14, 11149–11164, https://doi.org/10.5194/acp-14-11149-2014, 2014. a
Wang, Y., Beirle, S., Lampel, J., Koukouli, M., De Smedt, I., Theys, N., Li, A., Wu, D., Xie, P., Liu, C., Van Roozendael, M., Stavrakou, T., Müller, J.-F., and Wagner, T.: Validation of OMI, GOME-2A and GOME-2B tropospheric NO2, SO2 and HCHO products using MAX-DOAS observations from 2011 to 2014 in Wuxi, China: investigation of the effects of priori profiles and aerosols on the satellite products, Atmos. Chem. Phys., 17, 5007–5033, https://doi.org/10.5194/acp-17-5007-2017, 2017. a
Wang, Y., Dörner, S., Donner, S., Böhnke, S., De Smedt, I., Dickerson, R. R., Dong, Z., He, H., Li, Z., Li, Z., Li, D., Liu, D., Ren, X., Theys, N., Wang, Y., Wang, Y., Wang, Z., Xu, H., Xu, J., and Wagner, T.: Vertical profiles of NO2, SO2, HONO, HCHO, CHOCHO and aerosols derived from MAX-DOAS measurements at a rural site in the central western North China Plain and their relation to emission sources and effects of regional transport, Atmos. Chem. Phys., 19, 5417–5449, https://doi.org/10.5194/acp-19-5417-2019, 2019. a
Wei, C.-B., Yu, G.-H., Cao, L.-M., Han, H.-X., Xia, S.-Y., and Huang, X.-F.: Tempo-spacial variation and source apportionment of atmospheric formaldehyde in the Pearl River Delta, China, Atmos. Environ., 312, 120016, https://doi.org/10.1016/j.atmosenv.2023.120016, 2023. a
Williams, J. E., Boersma, K. F., Le Sager, P., and Verstraeten, W. W.: The high-resolution version of TM5-MP for optimized satellite retrievals: description and validation, Geosci. Model Dev., 10, 721–750, https://doi.org/10.5194/gmd-10-721-2017, 2017. a
Wittrock, F., Oetjen, H., Richter, A., Fietkau, S., Medeke, T., Rozanov, A., and Burrows, J. P.: MAX-DOAS measurements of atmospheric trace gases in Ny-Ålesund - Radiative transfer studies and their application, Atmos. Chem. Phys., 4, 955–966, https://doi.org/10.5194/acp-4-955-2004, 2004. a
Wolfe, G. M., Kaiser, J., Hanisco, T. F., Keutsch, F. N., de Gouw, J. A., Gilman, J. B., Graus, M., Hatch, C. D., Holloway, J., Horowitz, L. W., Lee, B. H., Lerner, B. M., Lopez-Hilifiker, F., Mao, J., Marvin, M. R., Peischl, J., Pollack, I. B., Roberts, J. M., Ryerson, T. B., Thornton, J. A., Veres, P. R., and Warneke, C.: Formaldehyde production from isoprene oxidation across NOx regimes, Atmos. Chem. Phys., 16, 2597–2610, https://doi.org/10.5194/acp-16-2597-2016, 2016. a, b
Yang, Y., Zhou, M., Langerock, B., Sha, M. K., Hermans, C., Wang, T., Ji, D., Vigouroux, C., Kumps, N., Wang, G., De Mazière, M., and Wang, P.: New ground-based Fourier-transform near-infrared solar absorption measurements of XCO2, XCH4 and XCO at Xianghe, China, Earth Syst. Sci. Data, 12, 1679–1696, https://doi.org/10.5194/essd-12-1679-2020, 2020. a
Yombo Phaka, R., Merlaud, A., Pinardi, G., Friedrich, M. M., Van Roozendael, M., Müller, J.-F., Stavrakou, T., De Smedt, I., Hendrick, F., Dimitropoulou, E., Bopili Mbotia Lepiba, R., Phuku Phuati, E., Djibi, B. L., Jacobs, L., Fayt, C., Mbungu Tsumbu, J.-P., and Mahieu, E.: Ground-based Multi-AXis Differential Optical Absorption Spectroscopy (MAX-DOAS) observations of NO2 and H2CO at Kinshasa and comparisons with TROPOMI observations, Atmos. Meas. Tech., 16, 5029–5050, https://doi.org/10.5194/amt-16-5029-2023, 2023. a, b, c
Zhao, T., Mao, J., Zhao, X., Pandey, A., Shah, V., Knowland, K. E., Kaiser, J., Tiefengraber, M., Gebetsberger, M., Cede, A., Spinei, E., and Hanisco, T. F.: Summertime Diurnal Variability of Formaldehyde Over the Contiguous United States: Constraints From Pandonia Global Network, Geophysical Research Letters, 52, e2025GL116033, https://doi.org/10.1029/2025GL116033, 2025. a, b
Zhou, M., Langerock, B., Vigouroux, C., Dils, B., Hermans, C., Kumps, N., Nan, W., Metzger, J.-M., Mahieu, E., Wang, T., Wang, P., and De Mazière, M.: Tropospheric and stratospheric NO retrieved from ground-based Fourier-transform infrared (FTIR) measurements, Atmos. Meas. Tech., 14, 6233–6247, https://doi.org/10.5194/amt-14-6233-2021, 2021. a
Zhou, M., Langerock, B., Wang, P., Vigouroux, C., Ni, Q., Hermans, C., Dils, B., Kumps, N., Nan, W., and De Mazière, M.: Understanding the variations and sources of CO, C2H2, C2H6, H2CO, and HCN columns based on 3 years of new ground-based Fourier transform infrared measurements at Xianghe, China, Atmos. Meas. Tech., 16, 273–293, https://doi.org/10.5194/amt-16-273-2023, 2023. a, b
Zhou, M., Wang, P., Dils, B., Langerock, B., Toon, G., Hermans, C., Nan, W., Cheng, Q., and De Mazière, M.: Atmospheric propane (C3H8) column retrievals from ground-based FTIR observations in Xianghe, China, Atmos. Meas. Tech., 17, 6385–6396, https://doi.org/10.5194/amt-17-6385-2024, 2024a. a
Zhou, M., Vigouroux, C., De Mazière, M., and Langerock, B.: Formaldehyde (HCHO) groundbased remote sensing data from the FTIR instrument CAS.IAP001 at Xianghe, version RD, The Network for the Detection of Atmospheric Composition Change (NDACC) [data set], https://doi.org/10.60897/ndacc.xianghe_ftir.h2co_cas.iap001_rd, 2024b. a