the Creative Commons Attribution 4.0 License.
the Creative Commons Attribution 4.0 License.
 | 12 Mar 2026
Enhanced characterization of SO2 plume height and column density using the second UV spectral band of TROPOMI
Lorenzo Fabris
Nicolas Theys
Lieven Clarisse
Bruno Franco
Jonas Vlietinck
Huan Yu
Hugues Brenot
Thomas Danckaert
Pascal Hedelt
Michel Van Roozendael
Volcanic emissions of sulfur dioxide (SO2) affect the environment, climate, and society. Their detection and quantification rely extensively on remote sensing techniques, which are used to track SO2 and monitor volcanic activity worldwide. In particular, nadir-viewing satellites measuring total SO2 vertical column densities (VCDs) have provided valuable insights into volcanic emissions for decades. However, the determination of the SO2 layer height (LH) is more challenging. In this study, we present an improved SO2 LH (and VCD) retrieval algorithm, applicable to the second UV spectral band (BD2) of the TROPOspheric Monitoring Instrument (TROPOMI). This band exhibits a stronger SO2 absorption than the third band (BD3) that is traditionally used for SO2 retrievals. To assess the impact of various spectral, atmospheric, and observation conditions, we conducted sensitivity analyses from a set of synthetic spectra representative of TROPOMI measurements using the Look-Up Table COvariance-Based Retrieval Algorithm (LUT-COBRA). Our results demonstrate that BD2 retrievals result in more accurate estimates of the SO2 heights and columns, particularly in the upper troposphere and lower stratosphere (UTLS), with LH errors reduced by at least a factor of 2. The algorithm was applied to real TROPOMI observations of volcanic eruptions and degassing episodes, and compared to BD3 retrievals. BD2 shows an improved sensitivity, with less noise, and a detection limit as low as 2 DU, surpassing the current operational TROPOMI SO2 product by an order of magnitude. Furthermore, our plume height estimates align closely with independent measurements from the Infrared Atmospheric Sounding Interferometer (IASI) and Microwave Limb Sounder (MLS), confirming the reliability of the approach.
- Article
(12631 KB) - Full-text XML
- BibTeX
- EndNote


Sulfur dioxide (SO2) is an important trace gas emitted by volcanoes. Once released into the atmosphere, it undergoes oxidation, leading to the formation of sulfate aerosols that can significantly impact aviation (Schmidt et al., 2014; Kristiansen et al., 2024), human health (Carlsen et al., 2021; Heaviside et al., 2021), ecosystems (Tortini et al., 2017; Weiser et al., 2022), climate (Robock, 2000; Haywood and Boucher, 2000; Solomon et al., 2011; Santer et al., 2014; Marshall et al., 2025), and atmospheric chemistry (Stevenson et al., 2003; Lamotte et al., 2021). Among the volcanic ejecta (i.e., rock fragments, ash, water vapour, carbon dioxide, and trace gases), SO2 is one of the most abundant. It is readily detectable using ultraviolet (UV) and thermal infrared (TIR) remote sensing techniques (Kern et al., 2013; Theys et al., 2013).
Ground-based instruments can be used to study volcanic emissions (Galle et al., 2010; Scollo et al., 2014), but their limited coverage restricts the analysis to small eruptions and leaves many volcanoes worldwide unmonitored. Space nadir-viewing sensors represent an excellent alternative, and have yielded key information on the total SO2 vertical column density (VCD) for more than 40 years (Carn et al., 2016). However, the retrieval of the layer height (LH), defined as the altitude at which the plume concentration peaks, is a more recent advancement, although essential for several applications. Indeed, information on the SO2 height can serve as a proxy for volcanic ash (Thomas and Prata, 2011), and tracking SO2 clouds is therefore crucial for air traffic safety, as SO2 and colocated aerosols can cause long-term damage to aircraft engines (Carn et al., 2009; Sears et al., 2013). Beyond operational concerns, the plume altitude is a key parameter in atmospheric and climate models, as it helps to further evaluate the transport, chemical transformation, and effects of volcanic gas emissions on air quality (Schmidt et al., 2015; Milford et al., 2023) and radiative forcing (Fuglestvedt et al., 2024; Zhuo et al., 2024; Axebrink et al., 2025). From a volcanological perspective, the knowledge of SO2 LH also provides deeper insights into eruption dynamics, including eruption type, emission rate, intensity, and underlying processes (Mastin et al., 2009). Moreover, because satellite SO2 retrievals are sensitive to the assumed vertical distribution of sulfur dioxide, reliably determining the plume height is crucial to quantify the estimates of volcanic SO2 emissions (Yang et al., 2010).
In the thermal infrared, using respectively the Infrared Atmospheric Sounding Interferometer (IASI; Clerbaux et al., 2009) and the Cross-track Infrared Sounder (CrIS; Zavyalov et al., 2011), Carboni et al. (2012), Clarisse et al. (2014), and Hyman and Pavolonis (2020) have retrieved SO2 heights with an excellent sensitivity in the upper troposphere and lower stratosphere (UTLS), even for SO2 VCDs as low as 1 DU (Dobson Unit; 1 DU = 2.69×10¹⁶ molec. cm−2). Nonetheless, at altitudes below 5 km, the sensitivity to SO2 considerably decreases due to a strong absorption by water vapour in the infrared and an overall reduced thermal contrast.
In comparison, SO2 LH retrievals in the ultraviolet are less developed. The pioneering UV fitting algorithms, based on full radiative transfer simulations, have been applied to measurements from the Ozone Monitoring Instrument (OMI; Levelt et al., 2006) by Yang et al. (2010) and the Global Ozone Monitoring Experiment-2 (GOME-2; Munro et al., 2016) by Nowlan et al. (2011). Such retrieval schemes are time-consuming, and the reported results lack accuracy and precision. Another approach, the Full-Physics Inverse Learning Machine (FP_ILM) algorithm, has been developed and tested on GOME-2 by Efremenko et al. (2017), the TROPOspheric Monitoring Instrument (TROPOMI) onboard the Sentinel-5 Precursor (S-5P) platform (Veefkind et al., 2012) by Hedelt et al. (2019), and OMI by Fedkin et al. (2021). This method, based on machine learning schemes, is computationally efficient and is now implemented in the TROPOMI operational processing system. However, the FP_ILM algorithm is only sensitive to SO2 height for VCDs larger than 20 DU, limiting its application to relatively large volcanic events.
Recently, the retrieval of the SO2 slant column density (SCD) from TROPOMI has been greatly improved through the development of the COvariance-Based Retrieval Algorithm (COBRA; Theys et al., 2021), which notably results in a strong reduction of the retrieval noise. This advancement has naturally led to the development of an extension for the plume height retrievals by Theys et al. (2022), which combines COBRA with an iterative look-up table approach (LUT-COBRA) to reconstruct the SO2 signal. Interestingly, this algorithm can derive SO2 LHs for VCDs as low as about 5 DU.
Here, our main objective is to further develop LUT-COBRA to get a fast, accurate, precise, and more sensitive retrieval algorithm, especially for low SO2 columns and SO2 plumes in the UTLS. To achieve this, we exploit the second UV spectral band (BD2) of TROPOMI, that covers wavelengths below 310 nm, where SO2 exhibits strong absorption features, and which offers better spectral performance than the third UV band (BD3) conventionally used for SO2 retrievals (Hedelt et al., 2019; Theys et al., 2022). As a matter of fact, short UV wavelengths have been commonly used for ozone (O3) profile retrievals (Veefkind et al., 2021), e.g., by Mettig et al. (2021), who exploited TROPOMI measurements between 270 and 329 nm and demonstrated high-quality retrievals. Since a single molecule of SO2 absorbs nearly twice as strongly as a molecule of O3 in the short UV (McPeters, 1993), this strategy has the potential to provide a better sensitivity than the BD3 retrievals of Theys et al. (2022). As a first step, we generated a set of SO2 spectra under typical TROPOMI measurement conditions to assess the sensitivity of LUT-COBRA in BD2, and study the impact of different spectral, atmospheric, and observation conditions on the retrieval quality. From this synthetic framework, we designed an optimal look-up table and further refined our algorithm to analyze real TROPOMI BD2 measurements.
This paper is organized as follows. Section 2 presents the TROPOMI instrument and the methodology to improve SO2 retrievals. Section 3 provides the theoretical basis of LUT-COBRA, followed by an overview of the sensitivity tests. In Sect. 4, we describe the developments made to our algorithm to process actual TROPOMI BD2 measurements and discuss the main results for various examples of volcanic emissions, comparing our retrievals with available correlative data, such as TROPOMI in BD3, IASI, and the Microwave Limb Sounder (MLS; Waters et al., 2006). In conclusion, Sect. 5 summarizes the key points of our study and outlines possible future steps.
TROPOMI is a hyperspectral nadir-viewing sensor onboard the Sentinel-5 Precursor satellite, launched in 2017 as part of a European Space Agency (ESA) and Copernicus program. This spectrometer performs daily measurements of the solar radiation reflected by the Earth surface and backscattered by the atmosphere. It employs 8 spectral bands covering the ultraviolet, visible (VIS), near-infrared (NIR), and shortwave infrared (SWIR) spectral regions to retrieve information on tropospheric and stratospheric trace gas constituents, such as HCHO (De Smedt et al., 2018), CO (Borsdorff et al., 2018), NO2 (van Geffen et al., 2020), CH4 (Lorente et al., 2021), O3 (Spurr et al., 2018), and SO2 (Theys et al., 2017, 2019), as well as on aerosol (Torres et al., 2020) and cloud (Loyola et al., 2018) properties from local to global scales. The S-5P platform operates on a polar orbit at an altitude of approximately 800 km, crossing the equator at 13:30 LT (local time) and acquiring data over a 2600 km wide swath. In this work, we compare the UV spectral bands 2 and 3, for which the swath is divided into 448 and 450 across-track positions (or “rows”), respectively. This configuration ensures a high spatial resolution, with a ground pixel size at nadir of 3.5×5.5 km2 (across-track × along-track). Additional details about the TROPOMI design and specifications can be found in Veefkind et al. (2012).
While SO2 is traditionally retrieved between 310 and 340 nm (Hedelt et al., 2019; Theys et al., 2021, 2022), here we leverage wavelengths below 310 nm to benefit from the strong SO2 differential absorption features (see Fig. 1a). For TROPOMI, this means exploiting the second band instead of the third one. BD2 spans wavelengths from 300 to 326 nm with a spectral sampling of 0.065 nm, whereas BD3 covers longer wavelengths, between 310 and 405 nm with a coarser sampling step of 0.2 nm. BD2 also has a finer spectral resolution of 0.5 nm, compared to the 0.55 nm of BD3, according to Veefkind et al. (2012). These characteristics suggest that BD2 provides more information per wavelength than BD3. However, a notable limitation of this second band, as highlighted in Fig. 1a, is the strong ozone absorption at shorter UV wavelengths. In addition, Fig. 1b shows that the signal-to-noise ratio also decreases below 310 nm, resulting in higher noise levels. Note that between 310 and 320 nm, the BD2 SNR resampled to the coarser BD3 spectral sampling appears higher than the native BD3 SNR.
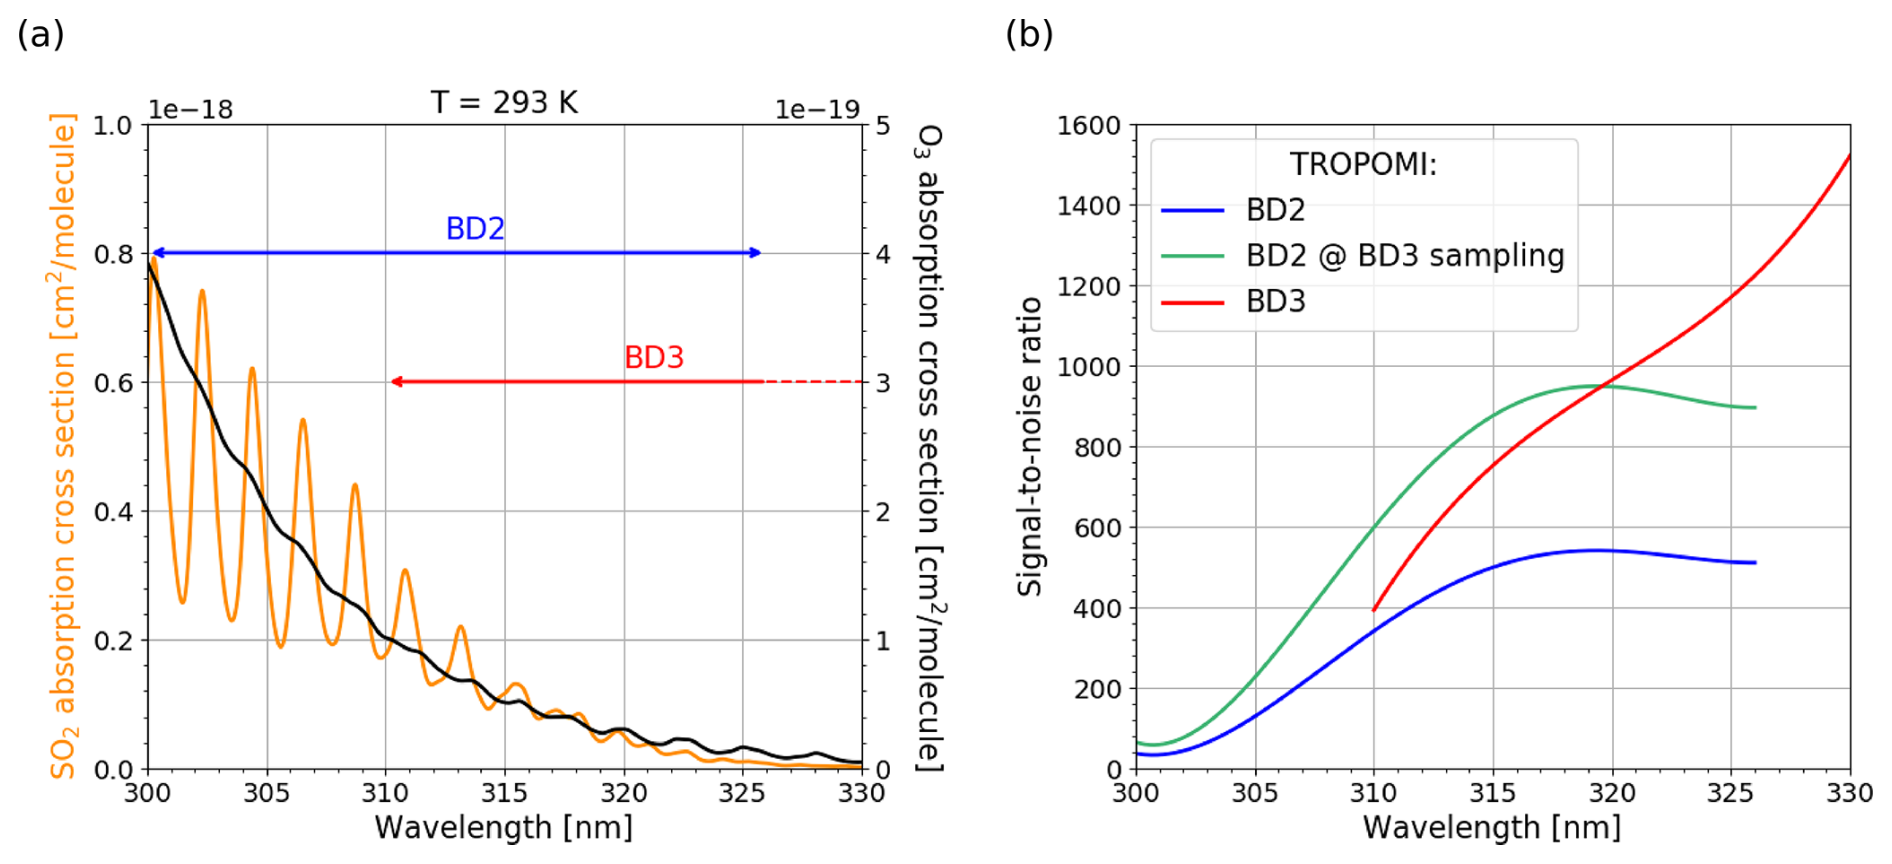
Figure 1(a) Absorption cross sections (ACS) of SO2 (in orange) from Bogumil et al. (2003) and O3 (in black) from Serdyuchenko et al. (2014), for a temperature (T) of 293 K. For illustration purposes, the data are convolved using a Gaussian function with a standard deviation of 0.5 nm. (b) Signal-to-noise ratio (SNR) estimated from TROPOMI Level-1 data for the second (in blue) and third (in red) UV spectral bands. The BD2 SNR scaled to the BD3 spectral sampling (in green) is also shown.
As a test case, we retrieved the SO2 SCD from both TROPOMI bands using COBRA (Theys et al., 2021). The results are illustrated in Fig. 2a and b for the third and second bands, respectively. These measurements, taken on 18 January 2022, highlight the volcanic degassing of Popocatepetl and Wolf (see Table 4) in the western tropics. The SCDs from both bands are in excellent agreement, with a standard deviation of 0.37 DU for the difference between BD3 and BD2, considering only pixels where both exceed 0.5 DU. Moreover, we find the retrieval noise to be significantly reduced in BD2 compared to BD3, with SCD standard deviations of 0.13 and 0.30 DU, respectively, between 10–11° N, a SO2-free region. This is promising and suggests better performance in the second band, despite the greater contribution of ozone (see Fig. 1a) and the lower SNR (see Fig. 1b) around 305 nm. The improvement is mainly attributed to the stronger SO2 absorption, combined with an excellent spectral sampling in BD2, approximately three times better than in BD3. Encouraged by these results, we applied a similar strategy to retrieve the SO2 plume height and vertical column density. The next section describes the retrieval approach and provides an overview of the synthetic sensitivity tests performed on the algorithm to evaluate its performance.
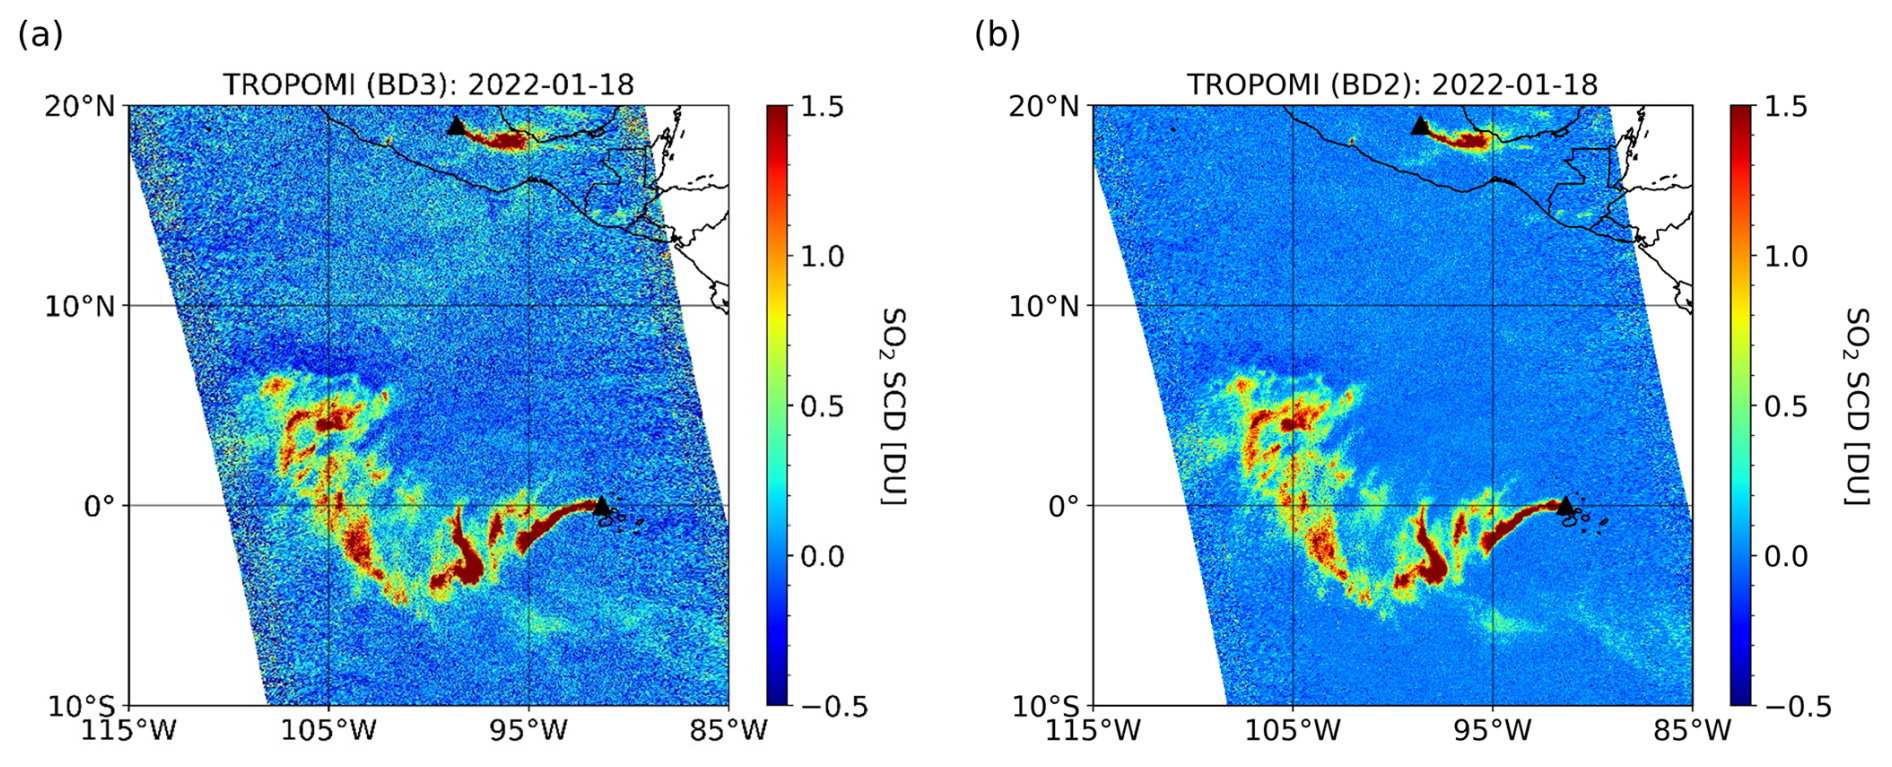
Figure 2SO2 slant column density retrieved from TROPOMI UV measurements performed on 18 January 2022, using BD3 (310–326 nm) in (a) and BD2 (305–320 nm) in (b). Black triangles indicate the locations of the Popocatepetl and Wolf volcanoes (see Table 4).
3.1 LUT-COBRA description
Our TROPOMI BD2 retrieval algorithm relies on the Look-Up Table COvariance-Based Retrieval Algorithm (LUT-COBRA), previously developed by Theys et al. (2022) for BD3. Here, we review the theoretical foundations of this approach. Comprehensive discussions on the joint retrieval of SO2 plume heights and column densities can be found in Yang et al. (2010).
Let y denote the total slant optical depth (SOD) at the top of the atmosphere (TOA), defined as the negative logarithmic ratio between the measured wavelength-calibrated radiance I and irradiance I0, that is . A general formulation is
where describes the SO2 slant optical depth, ybckg the background contribution (e.g., from O3 absorption), and ϵ the measurement error. The total SOD can be approximated by the following Taylor expansion,
with the SOD at the linearization point i, [ΔVCD, ΔLH] the increments in column density and plume height, and the associated partial derivatives (Jacobians).
Equation (2) can be solved with LUT-COBRA, an iterative method that models the SO2 spectrum through a look-up table containing precomputed SO2 SODs and Jacobians for a wide range of scenarios. Basically, the algorithm starts by extracting these data for conditions close to the measurements, and taking into account a priori values for the LH and VCD. Each iteration then refines the estimates of SO2 height and column density, which are subsequently used to update the optical depths and Jacobians. This process is repeated until convergence to the solution , given by
where ki is a two-column matrix of SO2 Jacobians, and all the contributions other than SO2 are treated through a generalized error covariance matrix S and its associated mean spectrum . Indeed, LUT-COBRA does not directly fit the background, but instead, it considers an ensemble of N measured spectra () that are unaffected by SO2. These spectra are characterized by a mean optical depth , so that,
is used to statistically represent the combined error term ybckg+ϵ of Eq. (1). Moreover, the retrieval errors, calculated as the square root of the diagonal elements of the solution covariance matrix, i.e.,
can be used to describe the quality of the solutions found by the algorithm, as demonstrated below.
3.2 Simulation conditions and algorithm settings
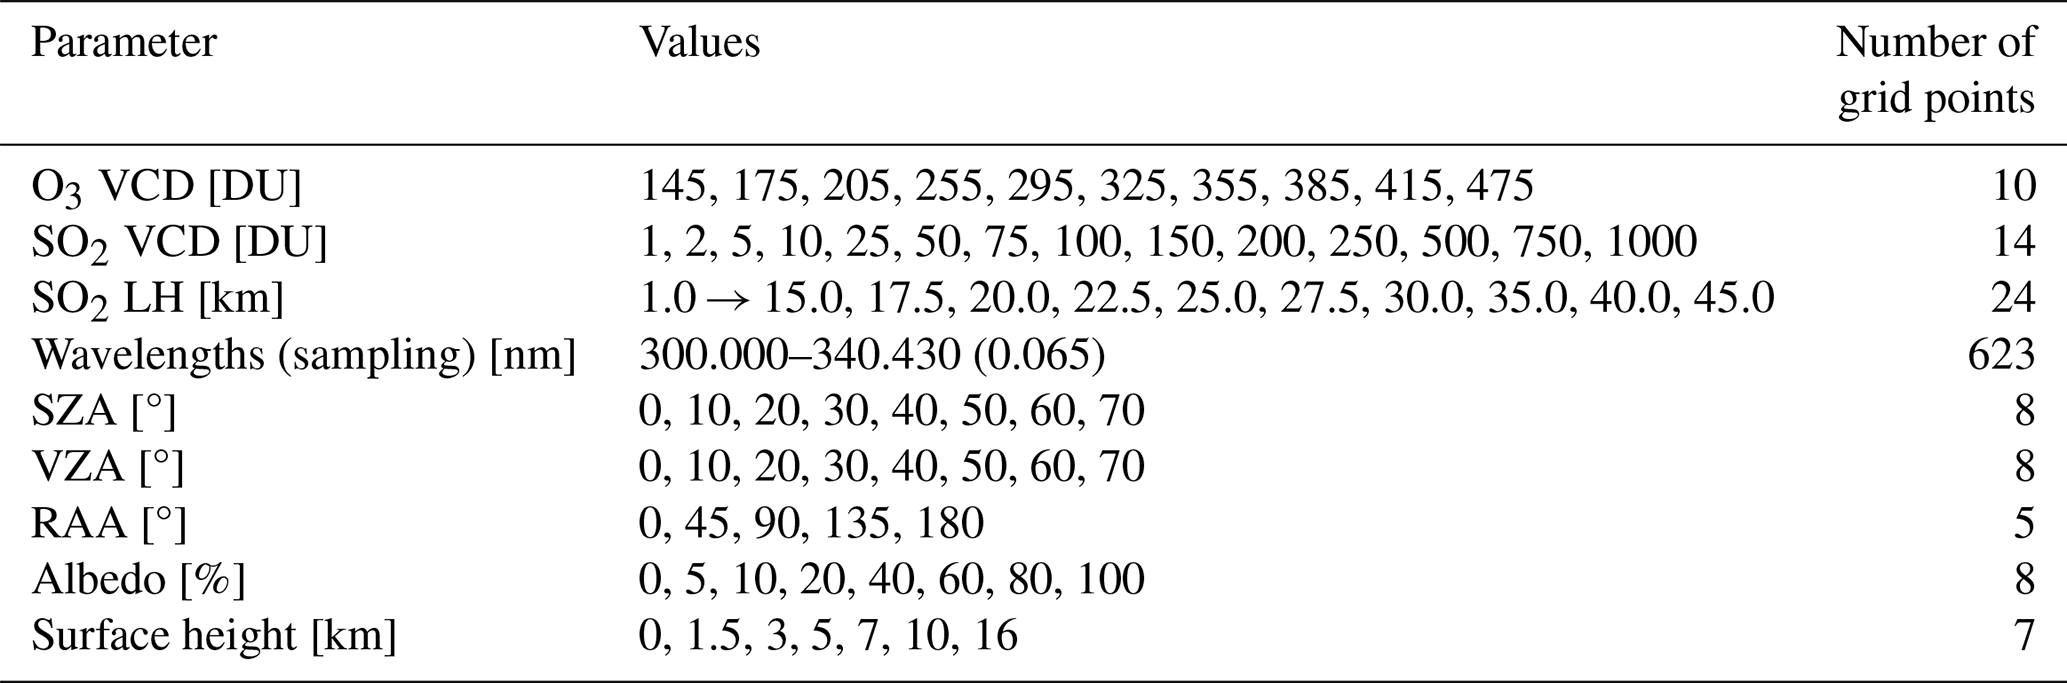
To evaluate the performance of LUT-COBRA across different wavelength ranges (i.e., spectral bands), a set of synthetic spectra was generated using the Linearized Discrete Ordinate Radiative Transfer (LIDORT) scalar model (Spurr and Christi, 2019). Although LIDORT neglects polarization effects, these typically alter TOA radiances by less than 5 % (Lerot et al., 2014; Escribano et al., 2019), mainly in a spectrally smoothed way, suggesting only a minor influence on the retrievals. Simulations were performed under typical TROPOMI measurement conditions between 300 and 330 nm, with a spectral sampling of 0.065 nm for BD2 and 0.2 nm for BD3. The observation conditions were arbitrarily fixed to a solar zenith angle (SZA) of 10°, a viewing zenith angle (VZA) of 0°, a relative azimuth angle (RAA) of 0°, a surface height of 0 km, and a surface albedo of 5 %. It should be noted that clouds, aerosols, and rotational Raman scattering were not included in this study. While these factors may introduce uncertainties of a few percent in the radiative transfer (Yang et al., 2010; Fedkin et al., 2021), and up to 5 km bias on the SO2 LH for highly absorbing aerosols collocated with SO2, our aim was to maintain a simple and controlled synthetic framework. Furthermore, we used the US Standard (US STD) atmospheric profiles of ozone, temperature, pressure, and air density (Anderson, 1986). For sulfur dioxide, a Gaussian function with a standard deviation of 0.5 km was applied to various combinations of SO2 heights and columns. Each profile was actually centered on a specific layer height, ranging from 1 to 25 km in 1 km increments, and from 25 to 45 km in 5 km increments, and was scaled to the following VCDs: 1, 2, 5, 10, 15, 20, 25, 30, 40, 50, 75, 100, 125, 175, 250, and 300 DU. For high SO2 columns, a coarser sampling of VCD nodes was used to limit the total number of simulations. However, sensitivity tests indicate that interpolation errors in the SODs and Jacobians are negligible under these conditions, with differences of less than 0.5 % in the radiative transfer, even at shorter UV wavelengths. These profiles were interpolated on an altitude grid from 0 to 50 km, with steps of 0.5 km up to 28 km, then 1 km. The temperature-dependent absorption cross sections of ozone by Serdyuchenko et al. (2014) and sulfur dioxide by Bogumil et al. (2003) were used as input to the simulations, after convolution with a Gaussian function characterized by a standard deviation of 0.47 nm to approximate the TROPOMI Instrument Spectral Response Function (ISRF) in the UV. It is important to stress that the above description stands for our “baseline” set of synthetic spectra. In addition, to investigate the role of influencing quantities, this reference set is complemented by many other synthetic spectra corresponding to perturbed conditions in terms of atmospheric profiles (e.g., temperature, pressure and air density, O3 and SO2), absorption cross-section datasets, albedos, and surface heights. This will be further addressed in Sect. 3.3 and Appendix A.
With this configuration in mind, we processed the simulated spectra for each condition. The outputs comprise the SO2-free radiance, , which only includes O3 absorption, and the combined radiance, , which includes absorption from both SO2 and O3. These spectra were then used to compute the SO2 SOD as,
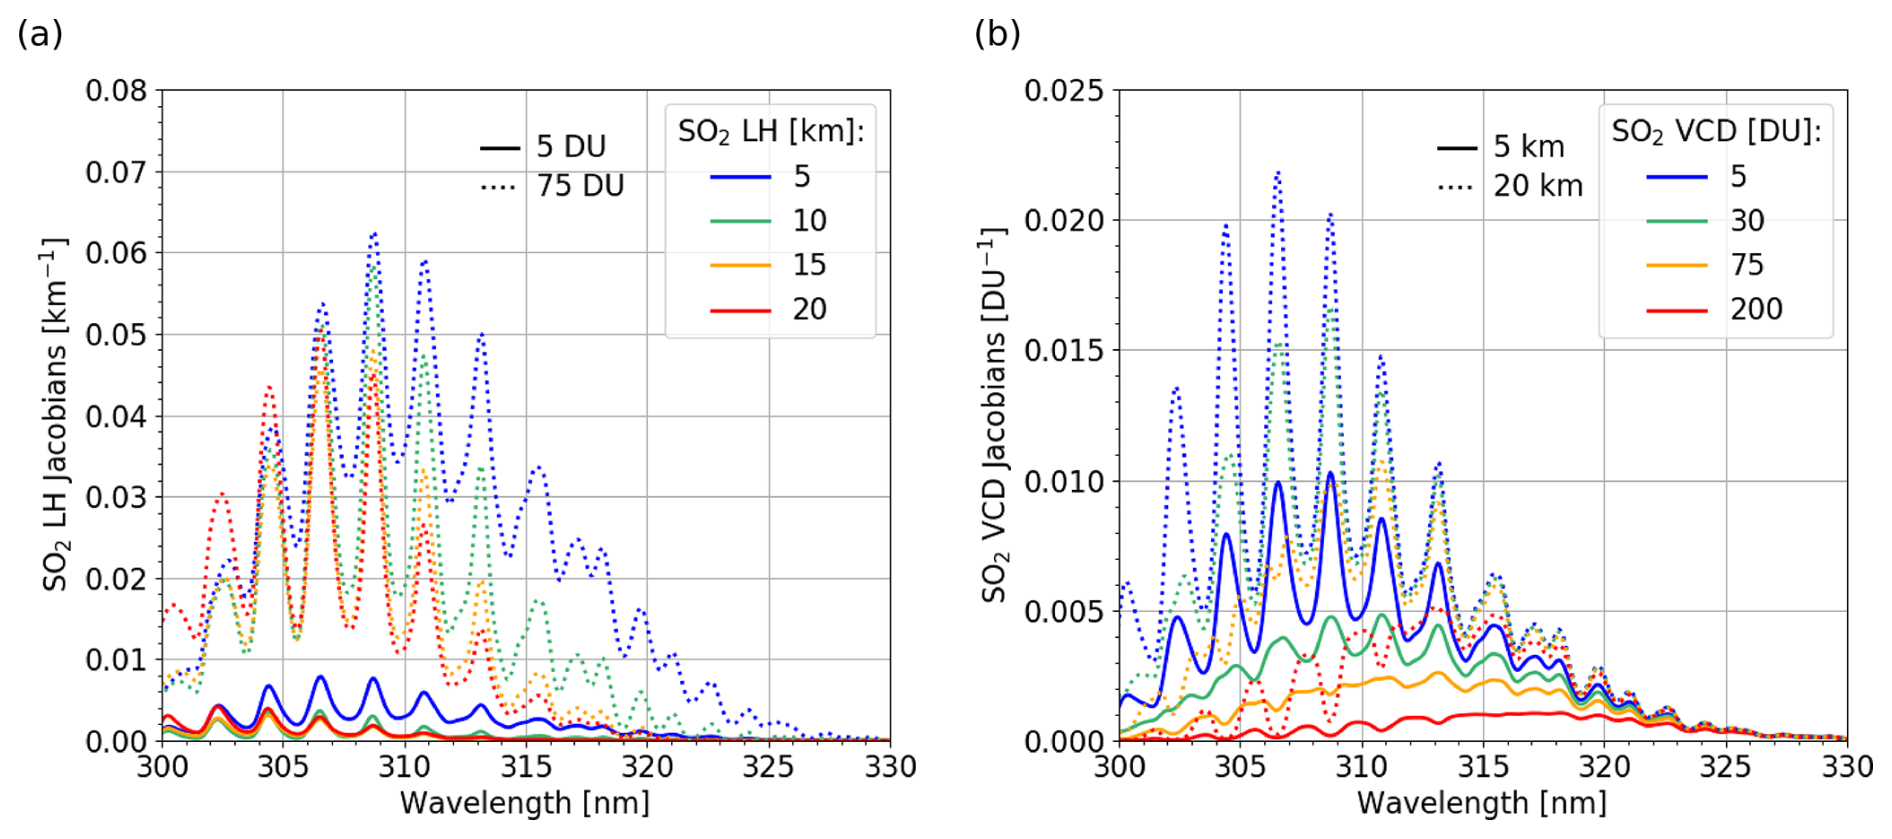
From the different combinations of plume heights and column densities, the LH and VCD Jacobians in Eq. (2) were derived by finite difference. As an example, the dependence of the SO2 SOD on the SO2 altitude and column density is presented on Fig. 3 for various SO2 profiles. Overall, the results are in line with the findings of Yang et al. (2010) and Nowlan et al. (2011). In particular, the sensitivity to the plume height increases with higher SO2 abundances, as the signal becomes more pronounced. The LH Jacobians are also more intense for lower-altitude plumes. This can be attributed to the strong vertical gradient of the air mass factors in the lower atmosphere (see Fig. B1 in Appendix B), where the measurement sensitivity increases rapidly with the altitude. As a result, small changes in plume height induce significant variations in the SO2 signal, leading to larger LH Jacobians in that region. In contrast, the VCD Jacobians tend to be larger for higher-altitude plumes, where the AMFs, and thus the sensitivity to the SO2 column, are higher. However, their amplitude decreases with an increasing SO2 column, due to the non-linear nature of SO2 absorption, which leads to a saturation of the signal. Overall, for both Jacobians, the results indicate an improved performance below 310 nm, consistent with the discussions of Sect. 2. This is especially evident for high plume heights (above 15 km), as noted by Yang et al. (2010).
In a next step, the calculated SO2 SOD and Jacobians were incorporated into a small look-up table. Before the retrievals, noise levels, representative of BD2 or BD3, could be added to the synthetic spectra to be fitted, as
where yn is a spectrum of random real numbers sampled from a univariate Gaussian distribution with mean 0 and variance 1. In case such noise was introduced, we considered a diagonal covariance matrix, with for the ith wavelength, consistent with the data shown in Fig. 1b. In the absence of noise, however, we used a unit covariance matrix for the retrievals. Note that for the synthetic retrievals, we assumed the background contribution to be perfectly known, which means that SO2 spectra, instead of total spectra, were fitted (see Eq. A1). In practice, the algorithm is considered to have converged when the variation in plume height is less than 0.25 km and the change in VCD is below 5 % between successive iterations. To ensure realistic solutions and computational efficiency, the number of iterations is limited to 10. Results of these synthetic tests are presented below.
3.3 Synthetic retrievals and error analysis
In this section, we first evaluate the performance of LUT-COBRA for both UV bands of TROPOMI, accounting for their respective spectral characteristics in terms of sampling, resolution, and SNR (see Sect. 2). Then, we assess the systematic errors on the retrievals by perturbing input data of the radiative transfer. These synthetic analyses were carried out to understand how the algorithm responds to forward model and measurement uncertainties. Spectra in BD2 and BD3 were computed from different input SO2 VCDs and LHs, detailed in Table 1.
Table 1Overview of the SO2 VCDs and LHs as well as the corresponding a priori values provided as input to LUT-COBRA.
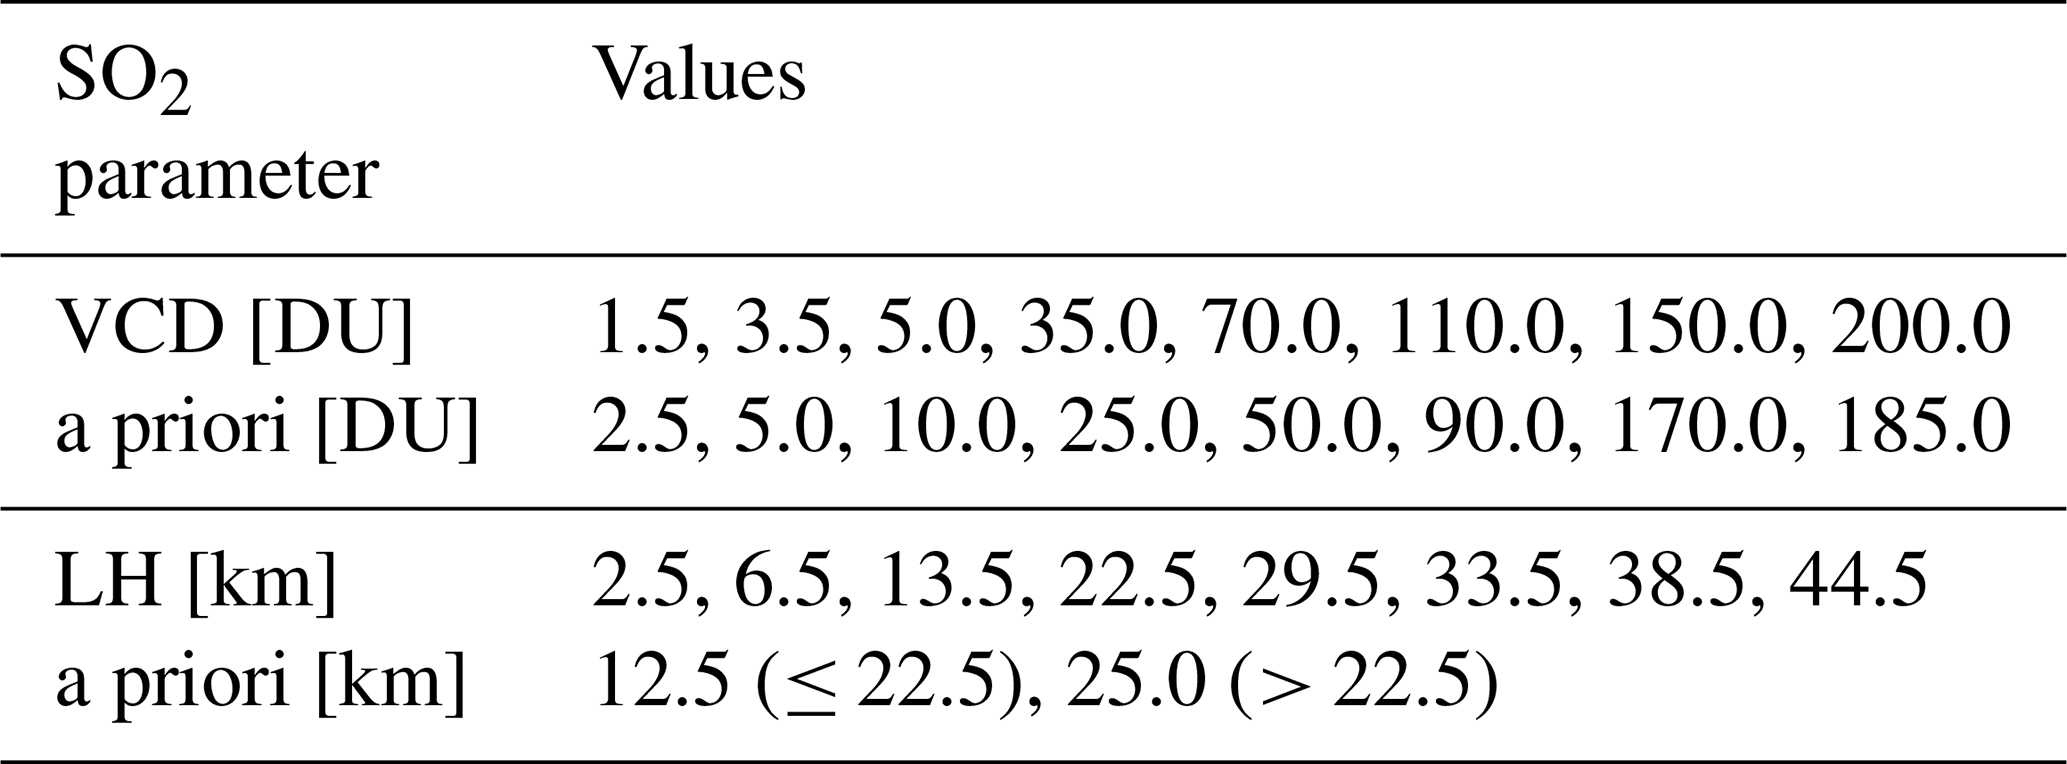
The a priori inputs were arbitrarily selected, but our tests have revealed that this choice has a negligible impact on the retrieval quality. Figure 4 summarizes the resulting biases for the LH and VCD, in both bands, averaged over 100 noisy spectra. It can be seen that the LH and VCD biases are globally reduced in BD2, especially for lower SO2 heights and column densities. They are typically within the convergence criteria (0.25 km for the LH and 5 % for the VCD) of the algorithm. We also observe that the standard deviations of the retrievals are, as expected, greatly reduced compared to BD3. Figure 4 thus demonstrates a better accuracy and indicates that, in principle, there is no fundamental limitation in retrieving the SO2 plume height and column density from the TROPOMI BD2.
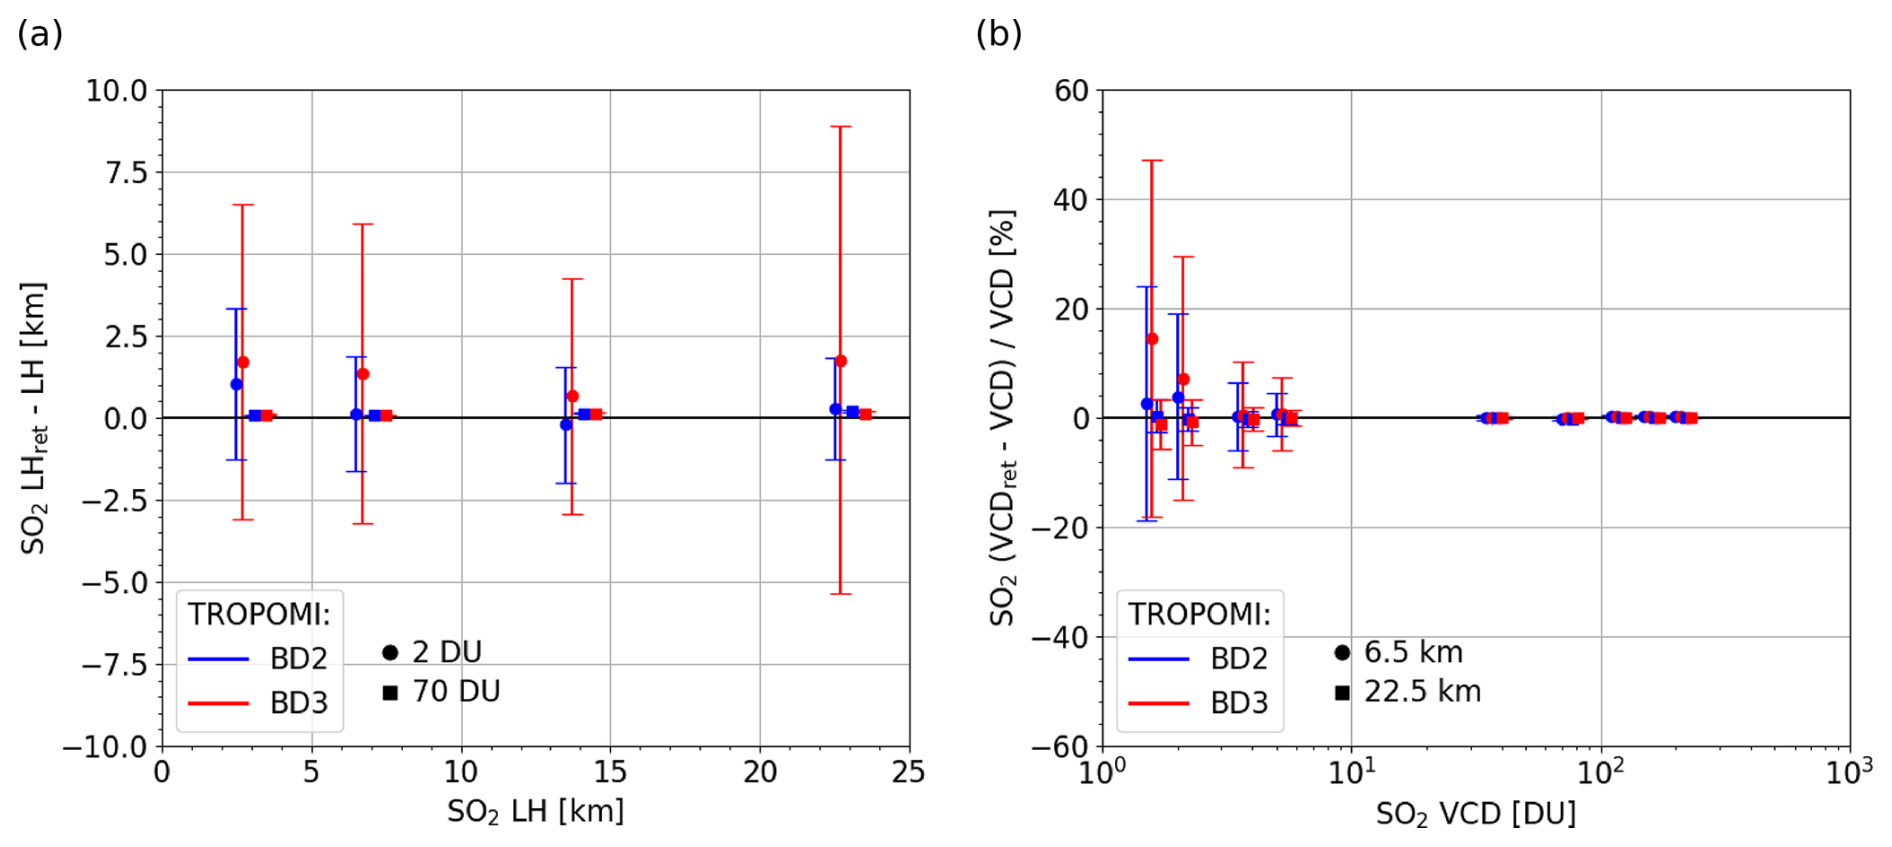
Figure 4(a) Absolute difference between the retrieved and expected SO2 LHs as a function of the input parameters. (b) Relative difference between the retrieved and expected SO2 VCDs, expressed as a percentage, and shown as a function of the input parameters. In both cases, retrievals are performed using synthetic spectra with added noise, in BD2 (305–320 nm, blue) and BD3 (310–326 nm, red). Circles and squares indicate the corresponding SO2 VCDs or LHs. Error bars represent the standard deviation associated with each retrieval. Note that the data are slightly offset along the x axis for clarity.
A key question is whether BD2 can enhance the retrieval precision compared to BD3. To investigate this, we estimated the SO2 LH retrieval error, as defined in Eq. (5), for both bands. The results, given in Fig. 5, correspond to a prescribed SO2 column of 2 DU, with plume heights going from the lower troposphere to the upper stratosphere. For BD2, retrieval errors are shown for different fitting ranges, varying the lower wavelength while keeping the upper limit fixed at 320 nm. In contrast, BD3 is evaluated using a single spectral range (310–326 nm), similar to Theys et al. (2022). From Fig. 5, it can be concluded that the use of BD2 results in a remarkable improvement in precision compared to BD3. When the same lower wavelength limit (310 nm) is applied, BD2 already shows slightly lower LH errors in the UTLS relative to BD3, confirming the positive impact of the finer spectral sampling. Figure 5 further demonstrates that extending the BD2 spectral range to shorter wavelengths significantly enhances the retrieval performance, particularly for high-altitude plumes (i.e., above 25 km). For a lower limit of 305 nm, the retrieval error is reduced by approximately a factor of 2. This is consistent with the behaviour observed for the air mass factors (see Fig. B1). At high altitudes, AMFs are greater for wavelengths larger than 310 nm, but they vary less, whereas the information on the plume height primarily comes from this weak altitude dependence and, indirectly, from the temperature dependence of the SO2 absorption cross sections. However, for shorter wavelengths (or higher SO2 VCDs), the height dependence of the sensitivity functions is increasing. The algorithm is therefore able to extract information more easily from the spectrum, thereby reducing retrieval errors. On the other hand, including shorter wavelengths in the fit may introduce significant systematic errors in the retrieval. In the remainder of this section, we evaluate the potential sources of uncertainty (e.g., on ozone) and estimate the associated errors.
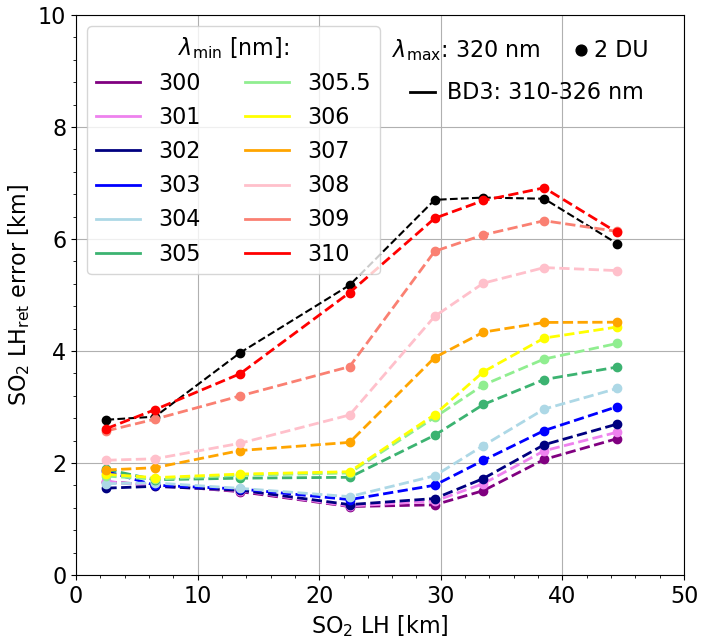
Figure 5BD2 (in colours) retrieval errors of SO2 LH for different lower limits of the fitting spectral range, with the upper limit fixed at 320 nm. Results are compared with those from BD3 (in black) using a 310–326 nm fitting window. All errors are shown for a SO2 VCD of 2 DU.
In this context, the sensitivity of LUT-COBRA in BD2 was tested by inverting noise-free spectra simulated with a single deviation from the baseline conditions of our look-up table (see Sect. 3.2). These perturbations were applied to atmospheric parameters, including temperature, air density (pressure), O3 and SO2 profiles, as well as to the SO2 absorption cross sections, albedo, and surface height. In each case, variations of different magnitudes were applied, as indicated in Table 2.
Bogumil et al. (2003)(Birk and Wagner, 2018)Table 2Overview of all the sensitivity tests of LUT-COBRA. Analyses performed without noise in TROPOMI BD2, over the following fitting spectral range (sampling): 305–320 nm (0.065 nm). For the baseline conditions, US STD denotes the US Standard data from Anderson (1986). The profile notation stands for North (NH) or South (SH) Hemisphere, at mid- (±30–60°) or polar (±60–90°) latitudes during the Winter–Spring (WS) or Summer–Fall (SF) seasons. These data are drawn from the climatology of Lamsal et al. (2004).
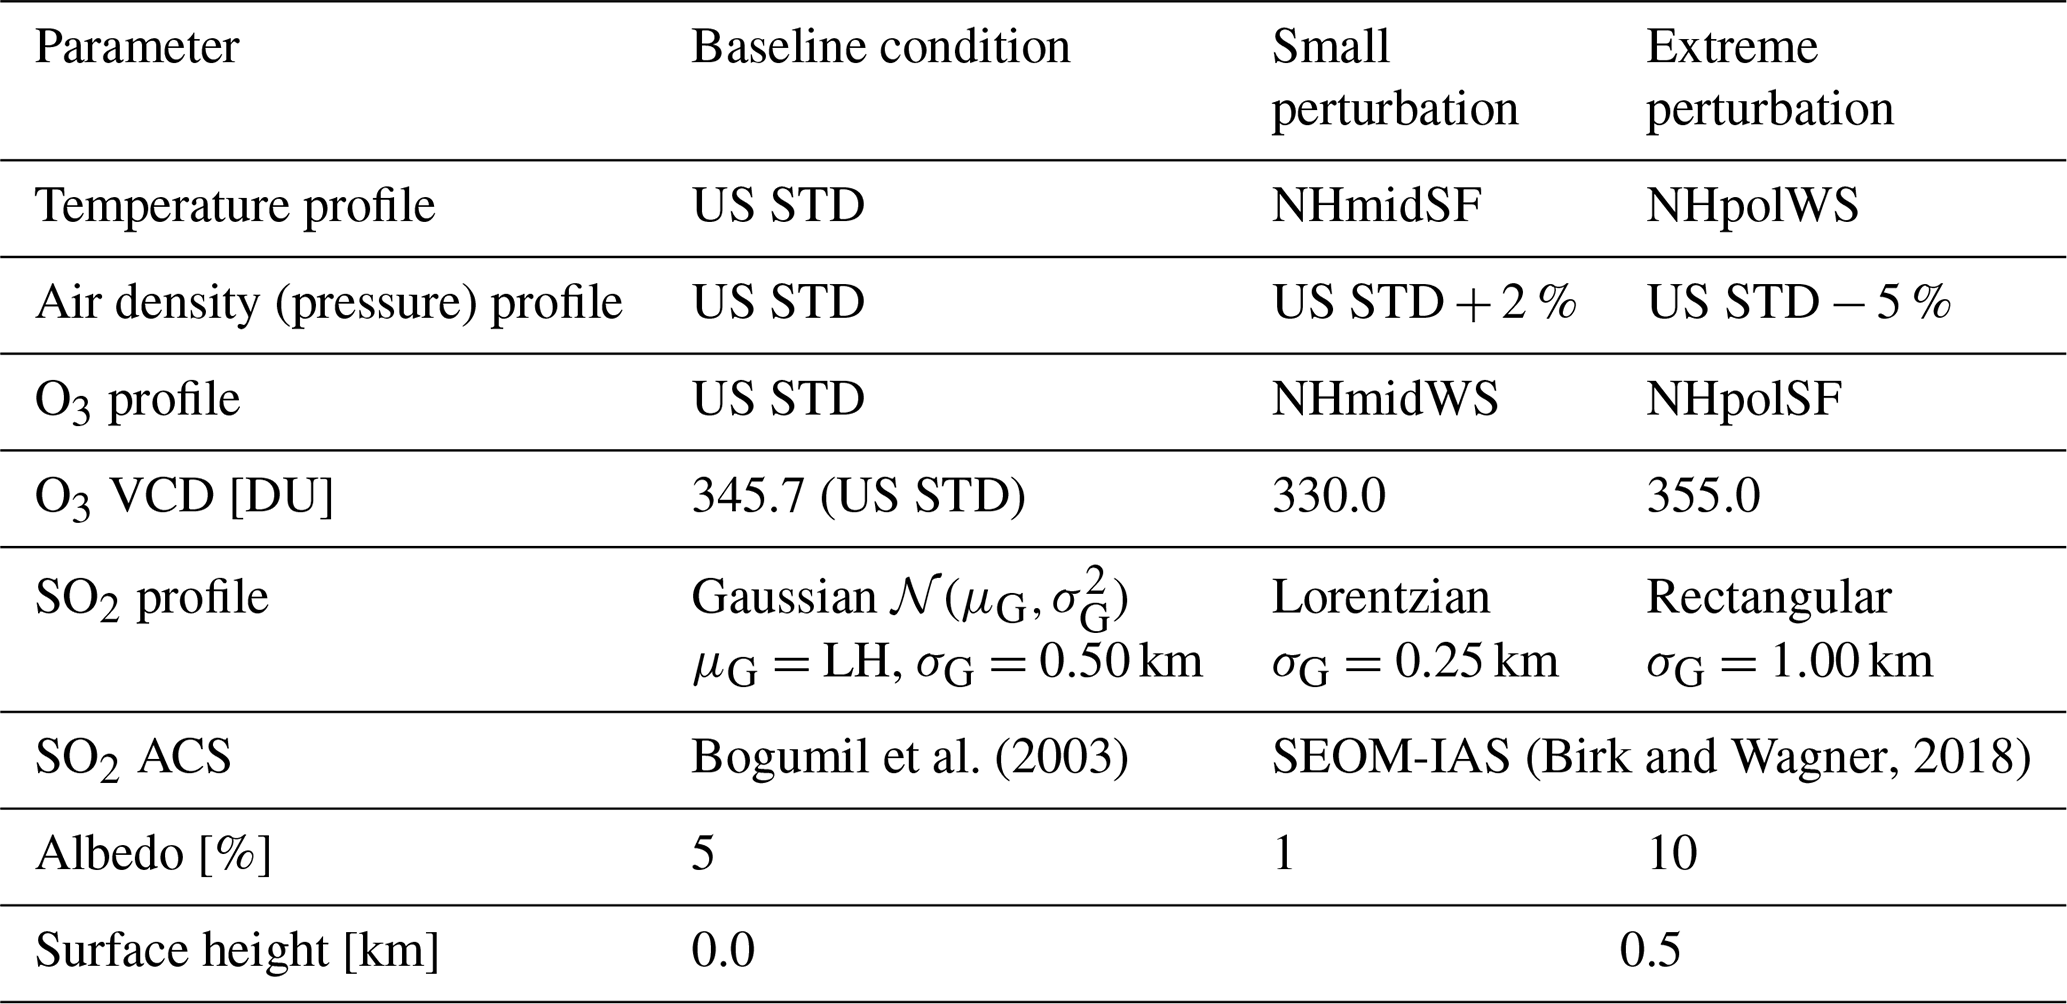
For the temperature, we used the climatology of Lamsal et al. (2004), selecting profiles representative of different seasons in the northern hemisphere. Note that we also analyzed a case in the tropics (not reported in Table 2). These distributions, originally provided for different ozone column densities, were interpolated to a fixed VCD of 345.7 DU (matching the standard value) so that only the shape of the profile differs from our baseline conditions. The effect of air density and pressure, in turn, was evaluated by adjusting the air concentration in each layer of the US Standard atmosphere (Anderson, 1986), as defined in our LUT. Regarding the ozone contribution, we examined two sources of uncertainty: the shape of its profile and the corresponding VCD. Given the strong O3 absorption in BD2, a broader range of scenarios was explored. For the vertical distribution, we considered four profiles (Lamsal et al., 2004), spanning latitudes from 30° S to 90° N (tropics and southern hemisphere profiles are not listed in Table 2) and all seasons. As with the temperature analysis, these profiles were scaled to the standard O3 VCD to test the effect of a change in profile shape independently. Afterwards, to assess the impact of the VCD, we tested values ranging from 310 to 380 DU (only two cases are provided in Table 2), while keeping the same standard profile shape. For SO2, we investigated the impact of different vertical distributions by fitting spectra corresponding to rectangular, Lorentzian, and Gaussian profiles of varying standard deviations (σG), for the LHs and VCDs given in Table 1. The influence of the SO2 absorption cross sections was also studied, by comparing the SEOM-IAS (Birk and Wagner, 2018) dataset with that from Bogumil et al. (2003). Finally, we looked at uncertainties related to observation conditions, in particular the albedo and surface height.
All the above sensitivity analyses were performed within the 305–320 nm spectral range, selected as an optimal balance, minimizing LH retrieval errors (see Fig. 5) and reducing systematic uncertainties related to the ozone absorption. Figure 6 summarizes the mean systematic errors on the retrieved LHs and VCDs, assuming extreme and more realistic (see Table 2) perturbations in each case, for a relatively low column density (5 DU) and UTLS altitude (13.5 km).
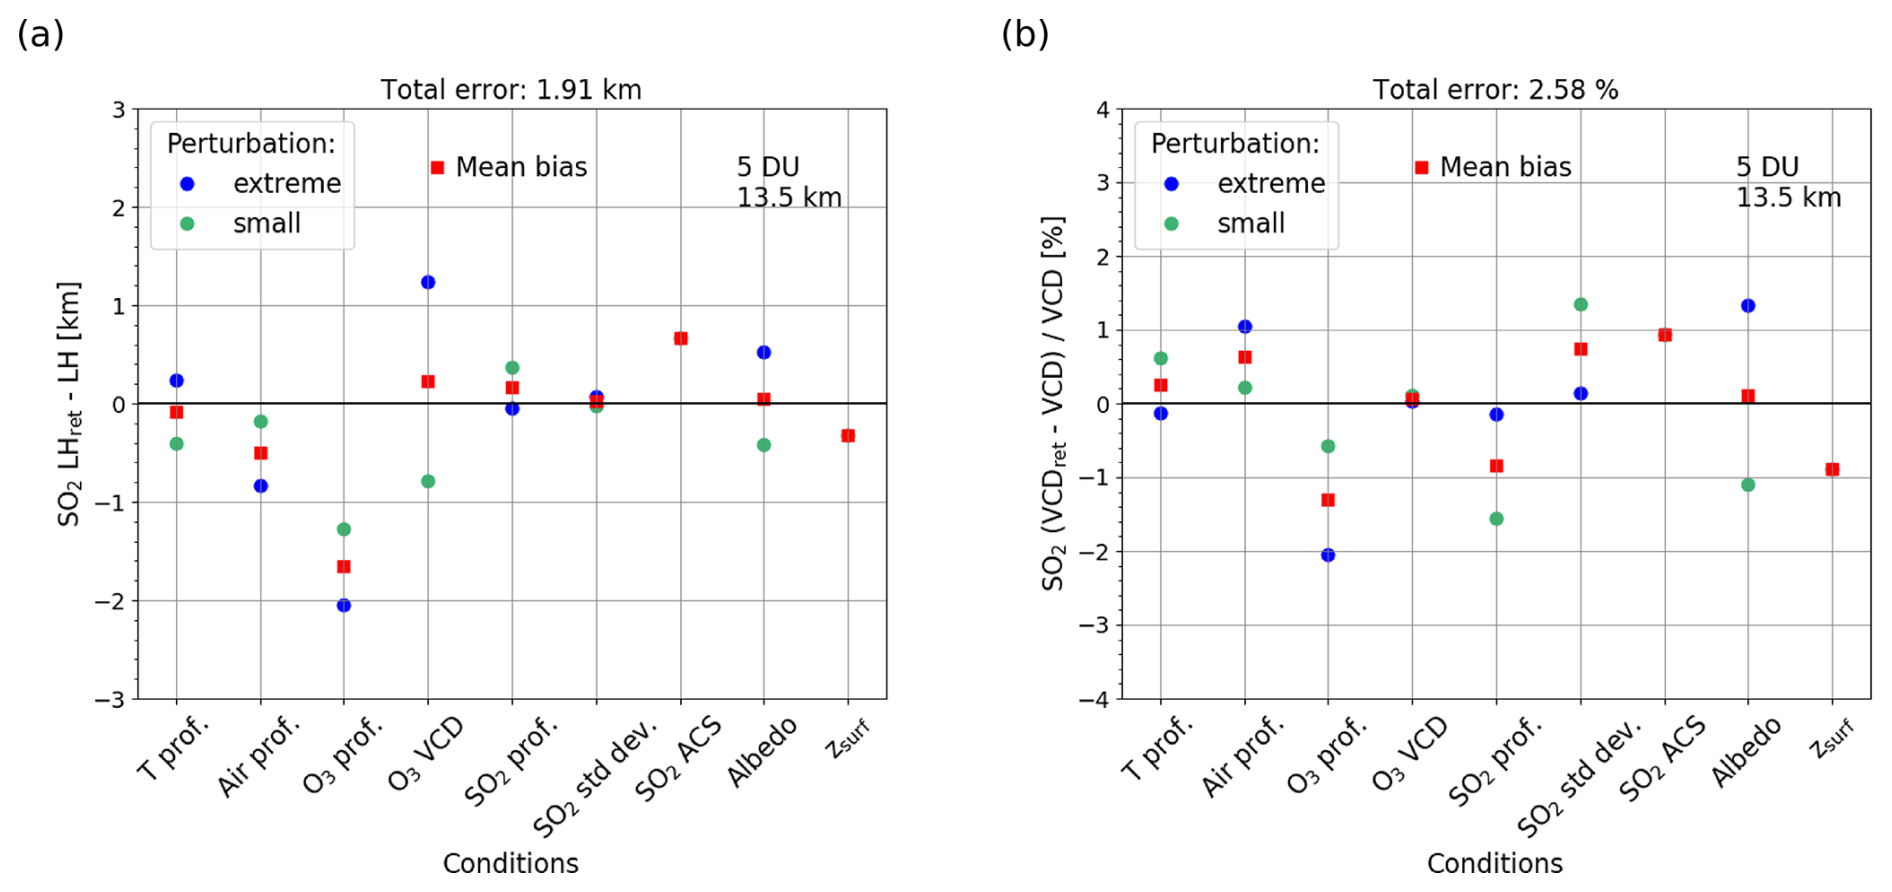
Figure 6BD2 LUT-COBRA retrieved biases for the LH (a) and VCD (b), considering a SO2 height of 13.5 km and column density of 5 DU as solutions. In particular, the results are shown for perturbations on the temperature (T prof.) and air density/pressure (Air prof.) profiles, O3 vertical distribution (O3 prof.) and its VCD, SO2 profile type (SO2 prof.) and its standard deviation (SO2 std dev.), SO2 absorption cross section (SO2 ACS), albedo and surface height (zsurf).
Overall, the total systematic errors are estimated by combining the individual effects of each source of uncertainty in quadrature, yielding 1.91 km for the LH and 2.58 % for the VCD. Since some contributions are partially correlated (e.g., temperature and air density profiles, or the O3 profile and its VCD), these values should be interpreted as indicative and approximate estimates of the total error. The temperature, pressure and air density, as well as the sulfur dioxide profiles appear to have a negligible impact on the retrieval accuracy. Similarly, the albedo and surface height have little effect on the quality of the results, especially since these two observation conditions are generally well constrained in practice. In contrast, the choice of SO2 absorption cross-section dataset has a more important influence on the retrieved solutions, particularly for the plume height. A comparison of the two datasets (see Fig. C1) shows that their temperature dependence is similar, but the dataset from Birk and Wagner (2018) assumes a stronger SO2 absorption than that of Bogumil et al. (2003), especially below 310 nm. As a result, SO2 air mass factors, as defined by Eq. (B1), decrease at the wavelengths with the highest absorption. Since the SO2 SOD depends on the product of the AMFs and ACS, the fitted signal is “smoothed”, ultimately leading to systematically higher SO2 LH. Importantly, we observe from Fig. 6, that the ozone profile, particularly its vertical shape, plays a key role on the retrievals, as expected given its strong absorption at shorter UV wavelengths. Nevertheless, the obtained LH and VCD biases remain relatively modest. Note that we conducted further tests using alternative baseline conditions (i.e., with various look-up tables) for the temperature, O3 profile, SO2 ACS, and albedo. These complementary analyses are detailed in Table A1 and lead to consistent conclusions. The results are therefore promising, but they highlight the need to mitigate the influence of ozone. Our strategy to better account for its strong contribution is described in Sect. 4.1.
4.1 Algorithm developments
Following the synthetic analyses, we developed a more comprehensive look-up table and refined LUT-COBRA for application to actual TROPOMI BD2 observations. As explained in Sect. 3.1, a LUT is a set of pre-calculated SO2 spectra for various conditions, which allows efficient retrievals by avoiding the computational cost of online radiative transfer simulations. In this updated LUT, we considered a broader range of scenarios, with particular emphasis on the role of ozone, which emerged as a key factor affecting the retrieval quality (see Sect. 3.3). As a first step, we performed a statistical analysis of atmospheric profiles, including temperature, air density, and ozone. Our objective was to build a compact set of representative O3 profiles parametrized based on the total ozone column only. This was motivated by the need to limit the LUT size while adequately representing the ozone profile variability in the retrievals. The idea of using the O3 VCD to inform about the shape of the O3 profile is not new (Labow et al., 2015 and references therein). It has been extensively used for satellite total ozone retrievals (e.g., by Lerot et al., 2014) and, in our application, has the potential to reduce the uncertainties around the O3 profile (see Fig. 6), given that the total ozone column is retrieved from TROPOMI with an excellent accuracy (Garane et al., 2019). To this aim, we used the climatology of Lamsal et al. (2004) that provides vertical distributions of temperature and ozone density for several O3 VCDs, latitudes, and seasons. From these data, we derived the following mean atmospheric profiles,
with the vertical distribution (of temperature, air density or ozone) for a VCD i, latitude j and season k, and a corresponding weighting factor which is calculated from a frequency distribution based on the OMI Level-3 ozone product (Bhartia, 2012). As an example, Fig. 7a shows the mean ozone density profile for 385 DU, resulting from different contributions, with their respective weighting factors. This highlights the regions and seasons where such a high concentration of ozone is most likely to be found. Similarly, Fig. 7b presents the calculated mean ozone distributions for various column densities. They thus correspond to the most probable profiles for such O3 VCDs, and it can be seen that the O3 peak shifts towards lower altitudes as its concentration increases, providing valuable information about the profile shape that helps reduce the associated uncertainties in the SO2 retrievals.
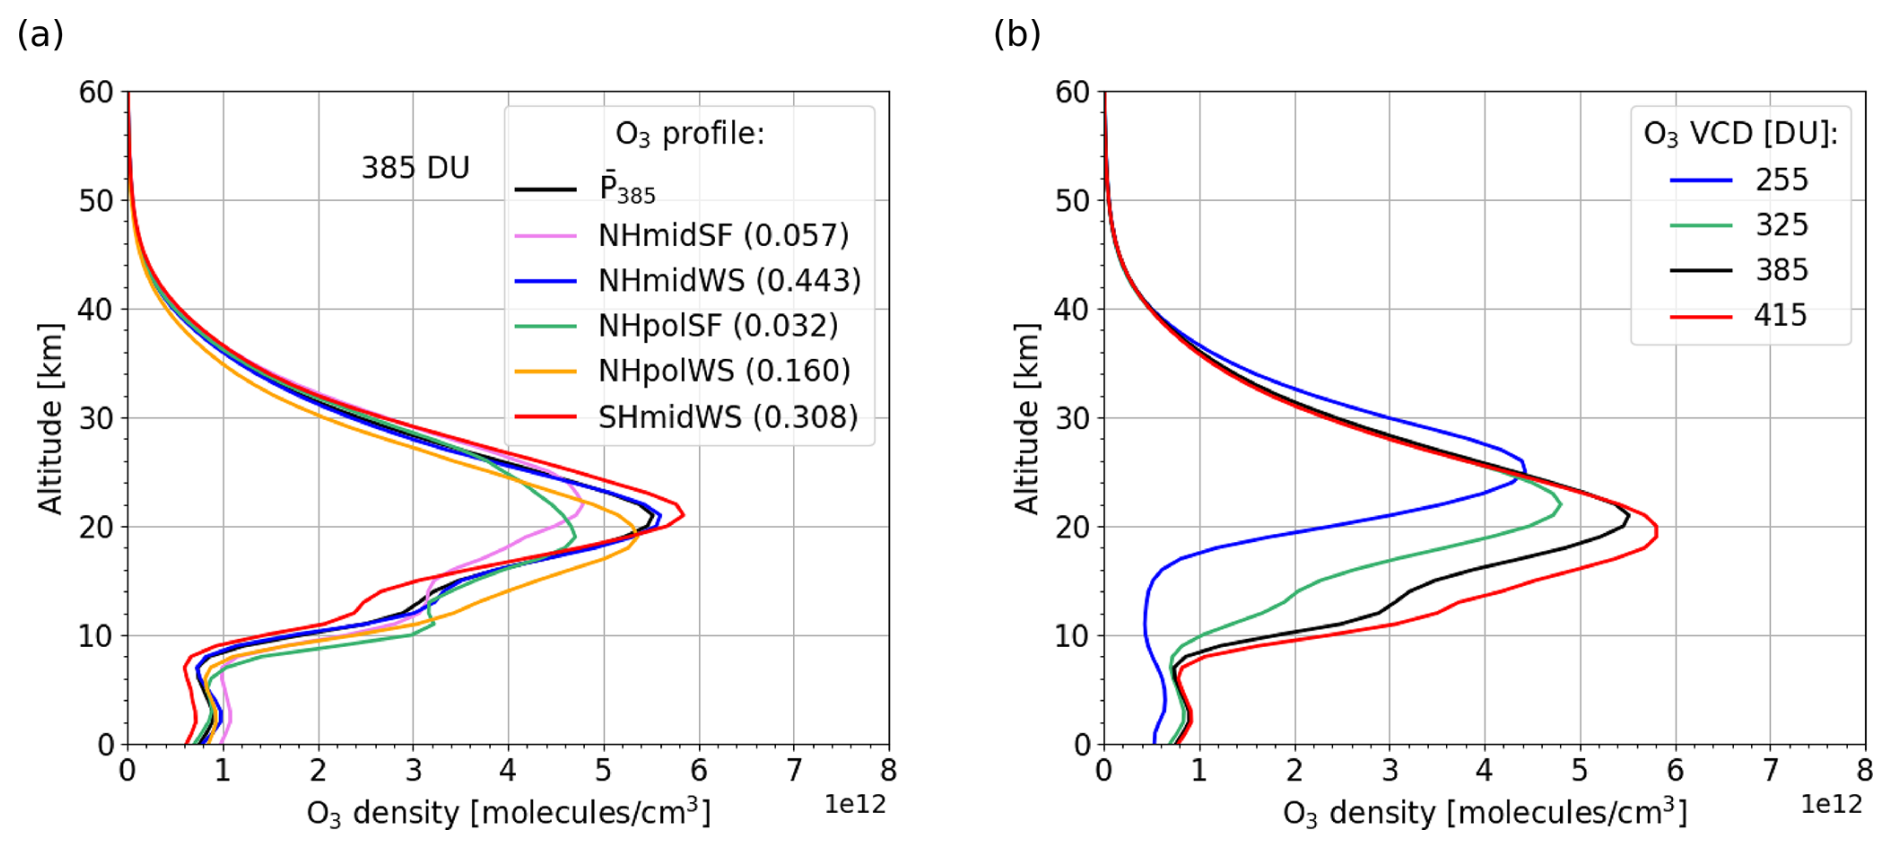
Figure 7(a) O3 density profiles for various latitudes and seasons (in colours), considering an O3 VCD of 385 DU. The profile notation stands for North (NH) or South (SH) Hemisphere, at mid- (±30–60°) or polar (±60–90°) latitudes during the Winter–Spring (WS) or Summer–Fall (SF) seasons. The weighting factor is indicated in parentheses for each distribution. The mean profile (in black) is also shown. (b) Mean O3 profiles generated for different O3 VCDs.
Accordingly, we calculated mean O3 profiles for different O3 column densities, summarized in Table 3. For consistency, mean air density and temperature profiles were computed using the same approach. These mean profiles were then used as input for radiative transfer simulations, covering a wide range of conditions (see Table 3). In total, approximately 60×106 total radiance spectra and 180×103 O3 radiance spectra were produced using a high-performance computer (HPC). Note that we considered the same absorption cross-section datasets as previously (see Sect. 3.2) for ozone (Serdyuchenko et al., 2014) and sulfur dioxide (Bogumil et al., 2003). However, these spectral data were pre-convolved here with a 0.05 nm box-car function, sampled at 0.065 nm and interpolated to the mean temperatures. Afterwards, the simulated radiances were exploited to calculate the SO2 optical depths and Jacobians. These data were convolved with the TROPOMI IRSF (varying as a function of the detector row) and corrected for the solar-I0 effect (Aliwell et al., 2022), before being incorporated into a comprehensive look-up table to analyze TROPOMI BD2 measurements.
Table 3Physical parameters that define the SO2 slant optical depth look-up table.
The retrieval of SO2 LH and VCD in BD2 is fundamentally the same as in BD3. The core of the algorithm is explained in more detail by Theys et al. (2022) and here we only describe the new developments applied to LUT-COBRA.
First, one needs to determine the parameters related to the reflection (i.e., albedo and surface height), geometry (i.e., SZA, VZA, RAA), and O3 amount corresponding to a measured spectrum. These pieces of information are essential for the retrievals. Indeed, during the process, a sub-LUT depending only on the SO2 LH and VCD, and representative of the measurements, is extracted by linear interpolation. The observation angles can usually be derived from the TROPOMI Level-1 files. For both the albedo and surface height, we assumed a Lambertian equivalent reflector (LER), similar to Theys et al. (2022), and characterized by effective parameters. This model provides a simplified representation of the complex mechanisms of reflection by the surface, clouds, and aerosols. In BD3, the effective height is computed from the surface and cloud altitudes weighted by the cloud fraction, based on data from the TROPOMI Level-2 product. The effective albedo, on the other hand, is calculated from the reflectance at 340 nm, a spectral region free from any absorption by sulfur dioxide or ozone to ensure a correct computation. Regarding the O3 input, the corresponding operational offline TROPOMI Level-2 product (Spurr et al., 2018) is utilized. In addition, as outlined in Sect. 3.1, a priori values on the sulfur dioxide plume height and column density have to be provided to LUT-COBRA. The SO2 LH a priori is set to 7 km, or LER height + 2 km if the LER height is higher than 5 km, and the prior VCD is defined from the SOD and AMF found in the operational TROPOMI SO2 column product, assuming an altitude of 7 km. However, all these input data are not available in BD2 and must therefore be read from BD3. It is important to remind that the two bands do not share the same number of across-track positions (as explained in Sect. 2), and there is also a shift in the flight direction (along-track positions). We performed this BD3-to-BD2 transition by directly interpolating the BD3 data into BD2 using the coordinates (latitudes and longitudes) provided in TROPOMI Level-1 files. This approach proved to be a good approximation, while simplifying our script and optimizing the computation time.
Once all BD2-interpolated data are obtained, the covariance matrix needed for the retrieval (Eq. 4) is calculated for each row. A set of SO2-free radiance spectra measured arbitrary for 300 pixels along the flight direction is selected for a given orbit. The SO2 VCDs and corresponding retrieval errors from the TROPOMI Level-2 product are used to filter the pixels, discarding those with SO2 VCDs > 2.5 × VCD errors. Note that to ensure a robust construction of the covariance matrix, at least 100 spectra must be included. However, we observed that the covariance matrix, as described in Eq. (3), sometimes becomes ill-conditioned in BD2, resulting in unphysical values in the inverse matrix for some wavelengths, and thereby compromising the retrievals. To address this issue, we performed an eigen-decomposition of the covariance matrix, and refined the inverse of the covariance matrix by discarding eigenvalues of S that were too small, as
where λi and vi corresponds to the eigenvalue and eigenvector of S, n is the number of wavelengths, k denotes the threshold beyond which S−1 presents erroneous values. This correction, described in more detail by Clarisse et al. (2023), ensures that the inverse matrix is calculated correctly and avoids inconsistent retrieval errors. Tests were performed to identify the threshold minimizing the errors, and a value of 10−7 on the eigenvalues was found, corresponding approximately to the precision of single-precision floating-point residuals. The procedure was thus applied systematically to all spectra, with typically less than 30 % of eigenvalues discarded to stabilize the inversion, depending on the conditioning of the covariance matrix.
The data were subsequently provided to LUT-COBRA, initiating the fitting process. Note that our analysis is restricted to measurements with SZAs below 65°, in order to avoid conditions of strong ozone absorption that could complicate the retrievals. It should also be mentioned that the algorithm may return values outside the predefined grids (see Table 3) for some iterations. In such cases, the SO2 height is set to surface height + 1 km or grid maximum − 1 km for the next iteration, depending on whether it falls below or above the limits. Similarly, if the derived SO2 column density lies outside the VCD grid, the algorithm reverts to the a priori value for the next iteration.
4.2 Results and comparisons with satellite observations
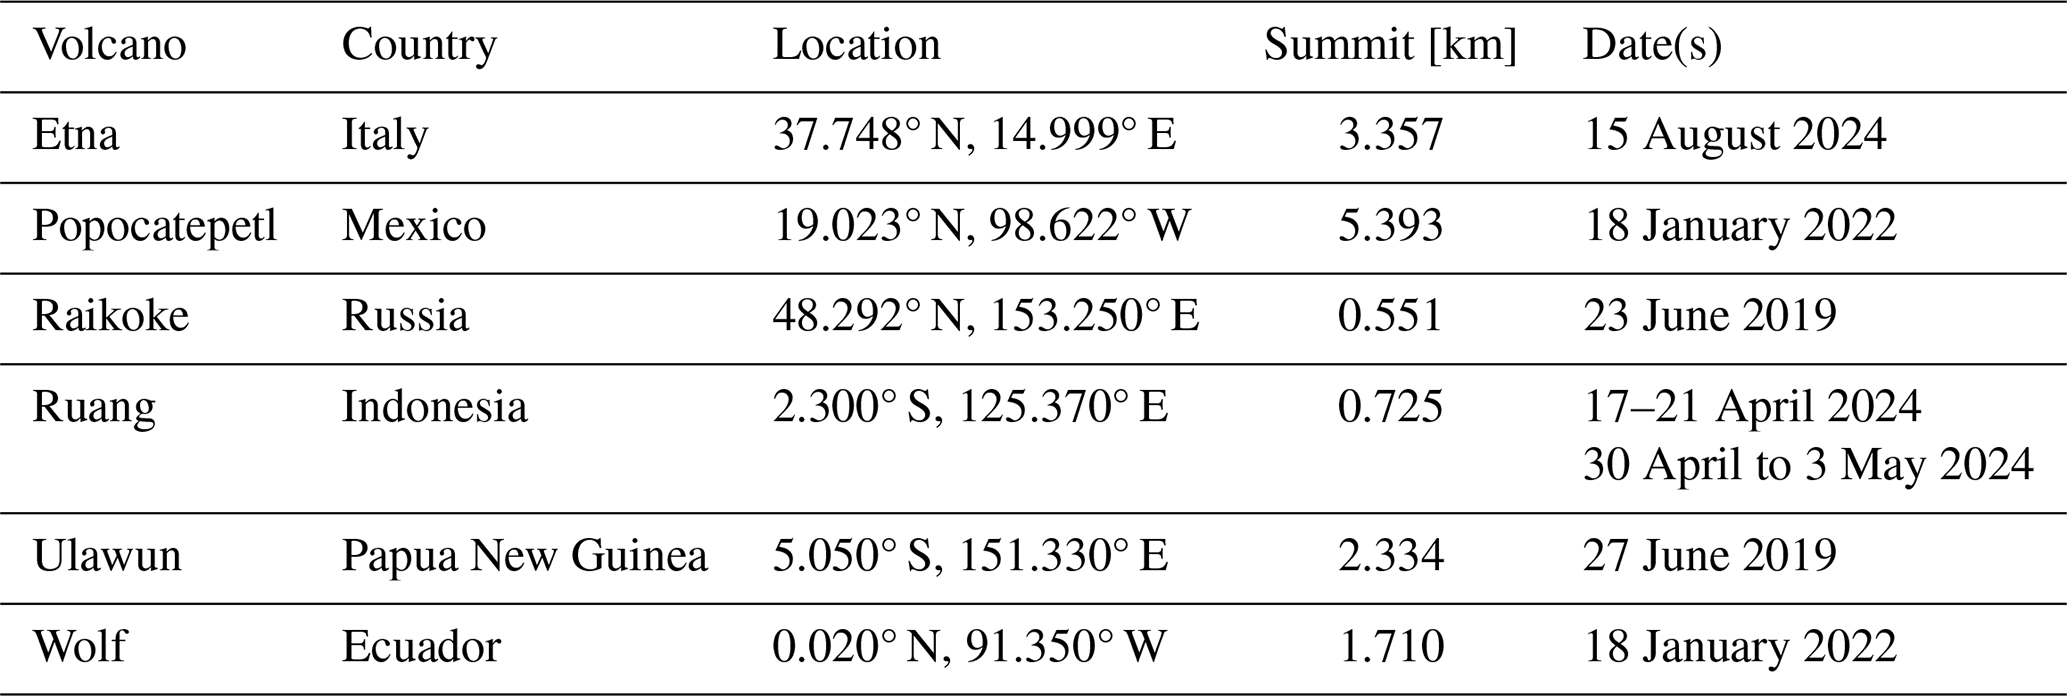
In this section, we analyze the SO2 LHs and VCDs retrieved from various TROPOMI BD2 observations of volcanic eruptions, as summarized in Table 4. These results are compared with BD3 estimates from LUT-COBRA (Theys et al., 2022) and the operational product (Hedelt et al., 2019), as well as with SO2 measurements from IASI (Clarisse et al., 2014) and MLS (Pumphrey et al., 2015).
Table 4Overview of the volcanic emissions analyzed with our TROPOMI BD2 SO2 plume height retrieval algorithm.
4.2.1 Raikoke (June 2019)
As a first case, we examined the SO2 plume a few days after the eruption of the Raikoke volcano on 21 June 2019. This explosive event, which was the first activity of the volcano in nearly 95 years, lasted about 24 h, injecting a substantial amount of sulfur dioxide, over 1.5 Tg, up to altitudes of 11 km and beyond (Cai et al., 2022; Vernier et al., 2024). The plume rapidly dispersed across the northern hemisphere, attracting a large scientific interest due to its impact on the environment and atmospheric composition (Grishin et al., 2021; de Leeuw et al., 2021). Such an eruption is particularly well-suited to assess the reliability of our approach, as the large SO2 abundances facilitate the determination of the plume height.
We first tested different spectral fitting windows and found that the 305–326 nm interval was optimal to capture the strong SO2 absorption in the short UV and minimize the O3 (and noise) contribution, thereby enhancing the measurement sensitivity. BD3 LUT-COBRA has a reported detection limit of 5 DU, and the current S-5P operational product is much less sensitive below 20 DU, whereas our algorithm can detect SO2 plumes down to 2 DU. Owing to this improvement, more detailed spatial and vertical information on the SO2 plume can be obtained. This wavelength range is therefore adopted for all subsequent cases. Moreover, for the following analyses, only pixels with retrieved LH errors below 2.5 km are considered.
Figure 8 presents the retrieved SO2 heights and column densities from BD2 and BD3 on 23 June 2019. We can see that the LHs and VCDs of both bands agree very well. The LHs in BD2 seem slightly lower than in BD3 but the plume filaments are better captured in BD2 data, indicating a better sensitivity. To further assess the consistency of our algorithm, we calculated the number of retrieved LHs and VCDs from both bands within bins of 1 km × 1 km and 10 DU × 10 DU, respectively, and performed a linear regression. The results, shown in Fig. 9, demonstrate a good agreement between the two products, which both identify the main characteristics of the SO2 plume, and support the reliability of LUT-CORA across the two spectral bands.
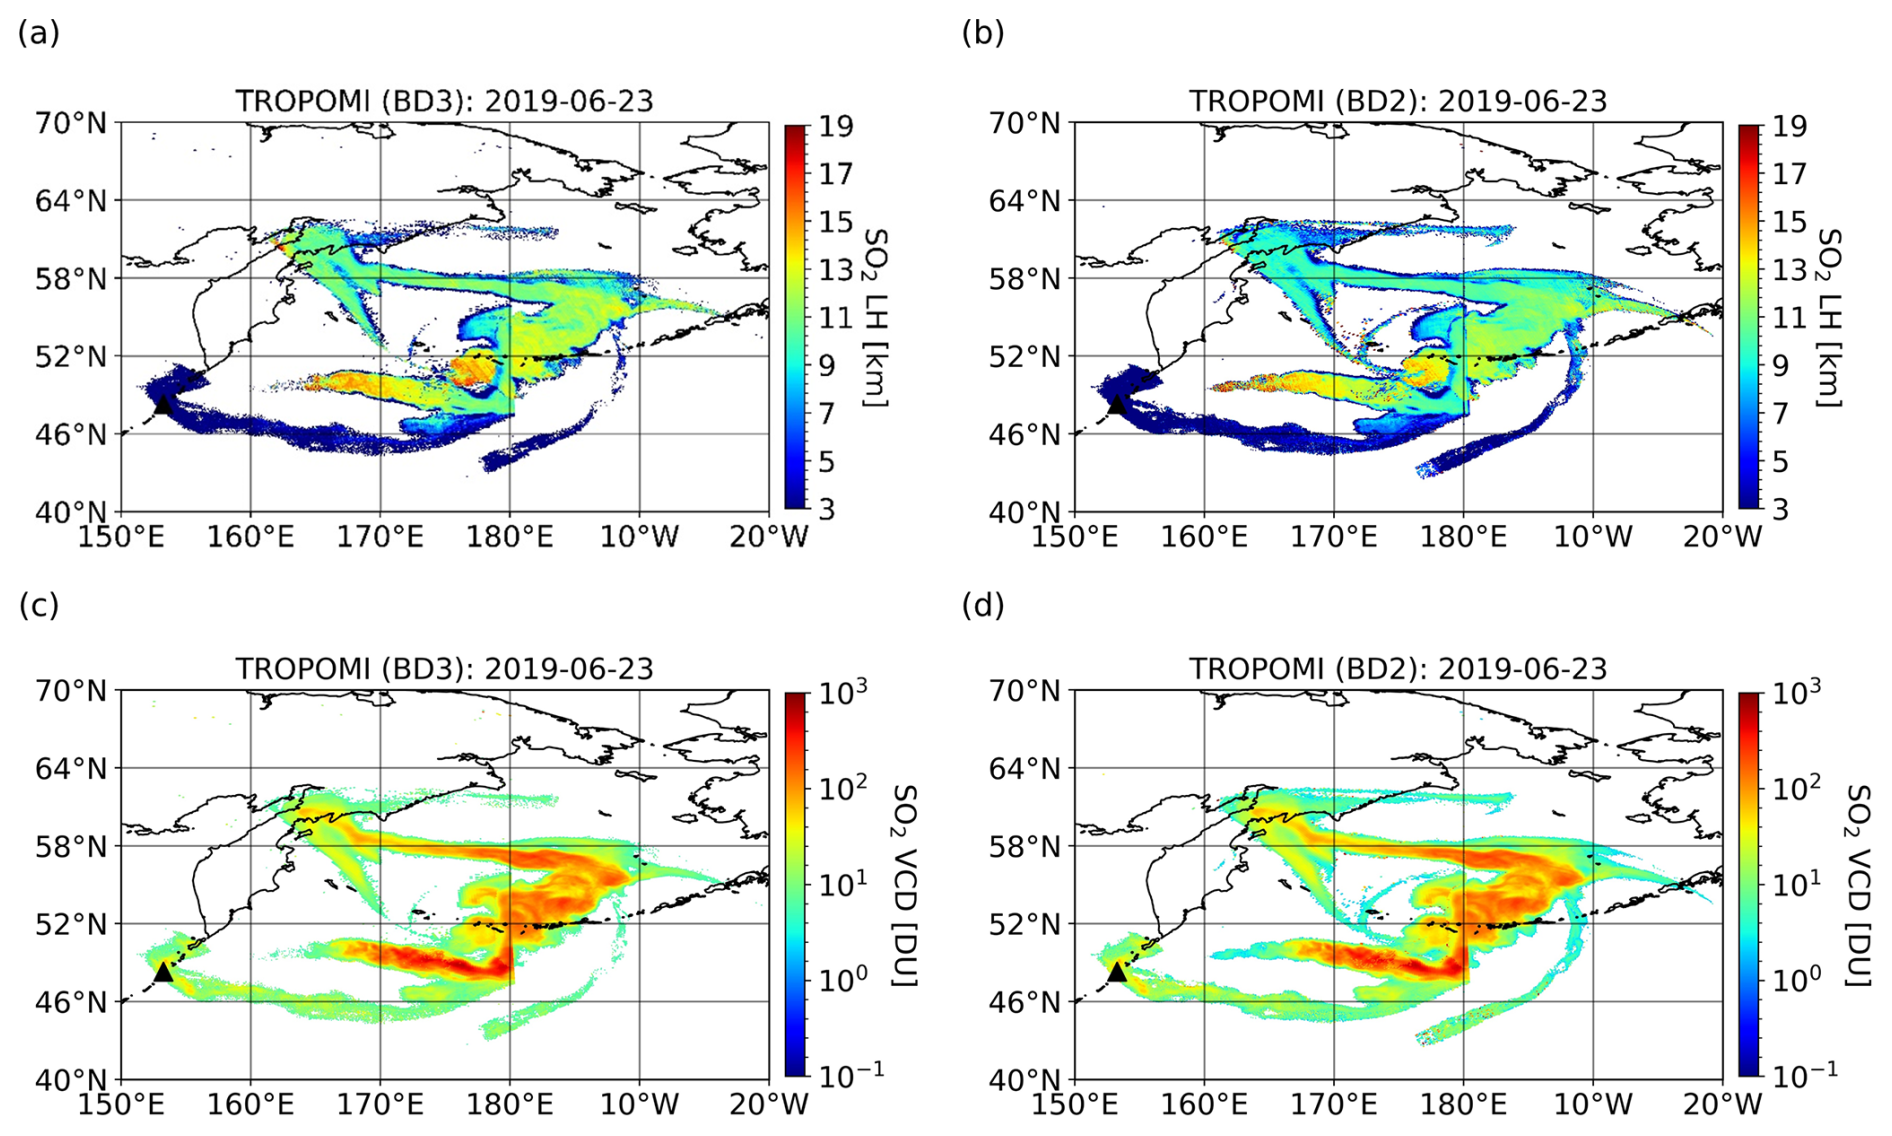
Figure 8SO2 retrievals from TROPOMI UV measurements on 23 June 2019 for the Raikoke eruption (see Table 4). Panels (a) and (b) show the LHs retrieved using BD3 (310–326 nm) and BD2 (305–326 nm), respectively. Panels (c) and (d) display the corresponding VCDs. The volcano location is marked by a black triangle.
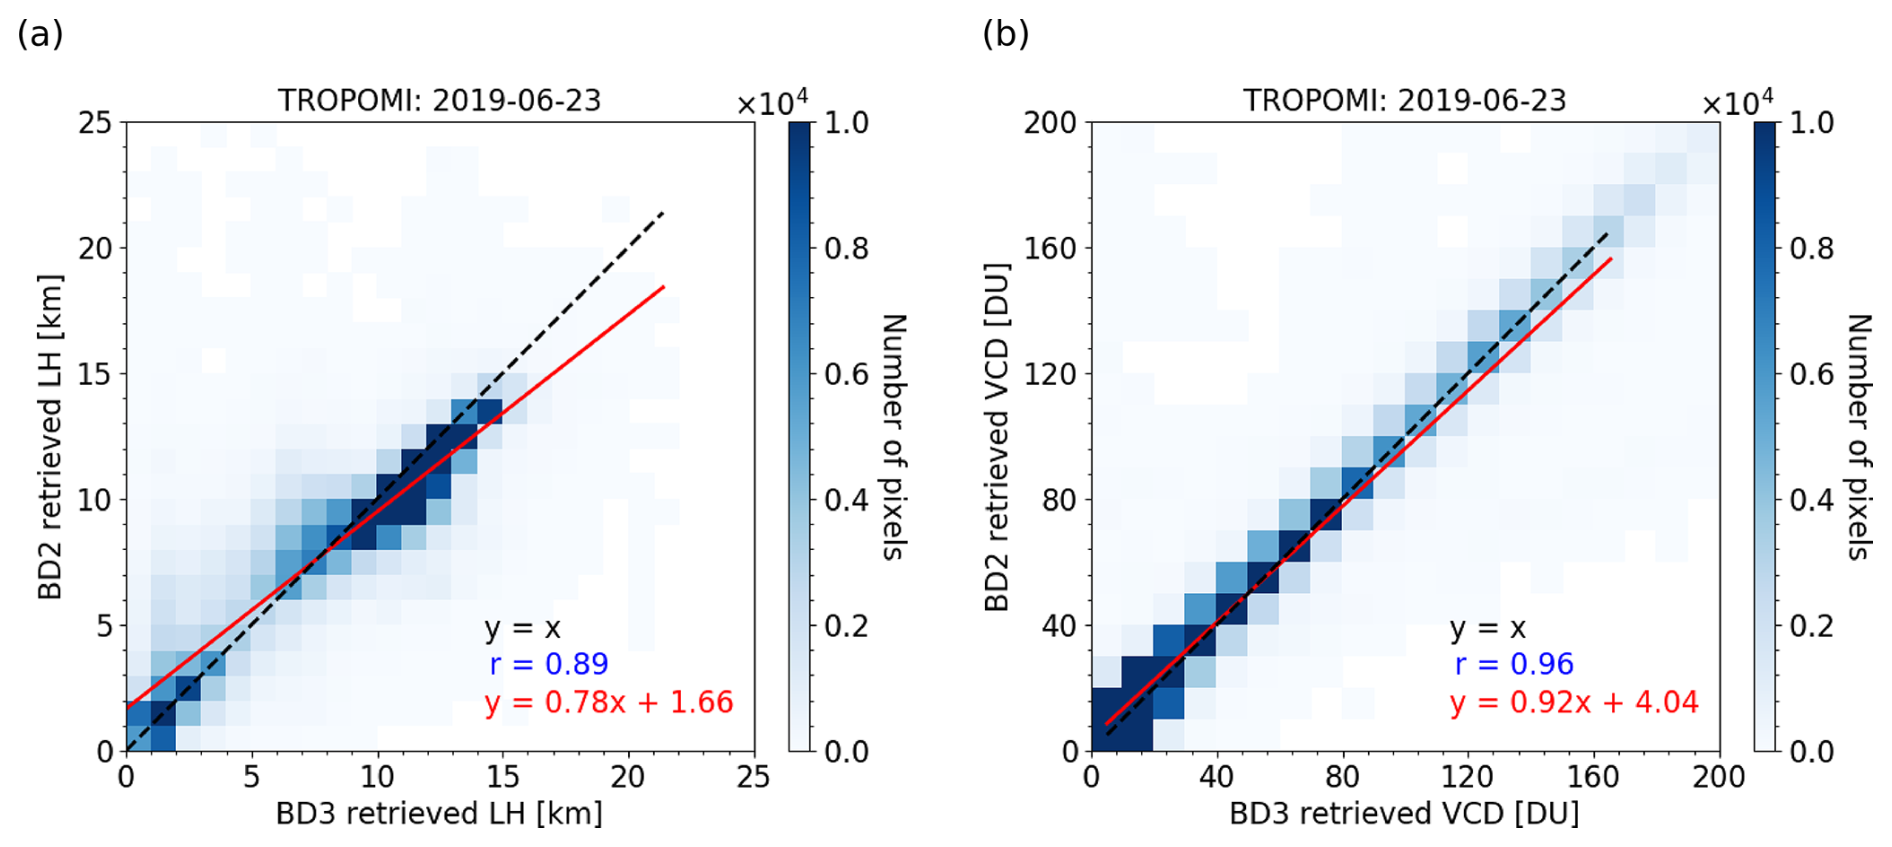
Figure 9SO2 LHs per 1 km × 1 km bin (a) and VCDs per 10 DU × 10 DU bin (b) retrieved from TROPOMI BD3 (310–326 nm) and BD2 (305–326 nm) measurements on 23 June 2019 for the Raikoke eruption (see Table 4). Each plot includes the 1:1 line (y=x), the correlation coefficient (r), and the linear fit ().
4.2.2 Etna (August 2024)
To investigate whether BD2 can enhance the retrieval performance in cases of low SO2 VCDs in the UTLS, we focused on Mount Etna, Sicily, one of the most active volcanoes in Europe. During the summer of 2024, the volcano experienced a few minor eruptions, releasing SO2 amounts generally below 10 DU, at altitudes below 10 km. One of the most intense emissions were recorded on 15 August (Sennert, 2024). For that day, the SO2 columns were relatively small, ranging from 6 to 40 DU, and the plume peak was at about 8 km, making it a relevant case study to assess the retrieval sensitivity under challenging conditions.
Figure 10 presents SO2 maps derived from TROPOMI BD3 observations using LUT-COBRA and FP_ILM. As recommended by Hedelt et al. (2023), a quality assurance threshold of 0.5 was applied to the operational product, while the suggested LH validity flag, designed for pixels with high SO2 columns (typically above 15 DU) and retrieval errors exceeding 2 km, was omitted to preserve enough pixels and allow a meaningful comparison with LUT-COBRA. Overall, the two algorithms agree well, displaying similar patterns as well as consistent layer heights and column densities. Also shown in Fig. 10 are the results from BD2, compared to IASI-C measurements (version 4.1) for the descending (AM) orbit. We observe that BD2 values closely match BD3 results for common pixels while providing additional insights, particularly in the region between 17.5–22° E and 37–41° N, where plume features absent in BD3 are detected by BD2. This can be directly attributed to the better detection limit of our algorithm (i.e., VCD as low as 2 DU). In this region, the scatter in BD2 LH is quite strong due to the low SO2 column amount, reflecting a reduced sensitivity. However, the mean plume height and column remain well constrained over the region, with BD2 estimates of 10.75 km and 3.53 DU, respectively, while IASI-C indicates a mean peak height of 10.45 km and column density of 2.32 DU. Our algorithm is therefore consistent with TIR observations. These results are further supported by retrieval errors that remain below 1.5 km for the layer height and 1 DU for the column density in BD2, which is in line with the synthetic tests presented in Sect. 3.3 and confirms the robustness of our method.
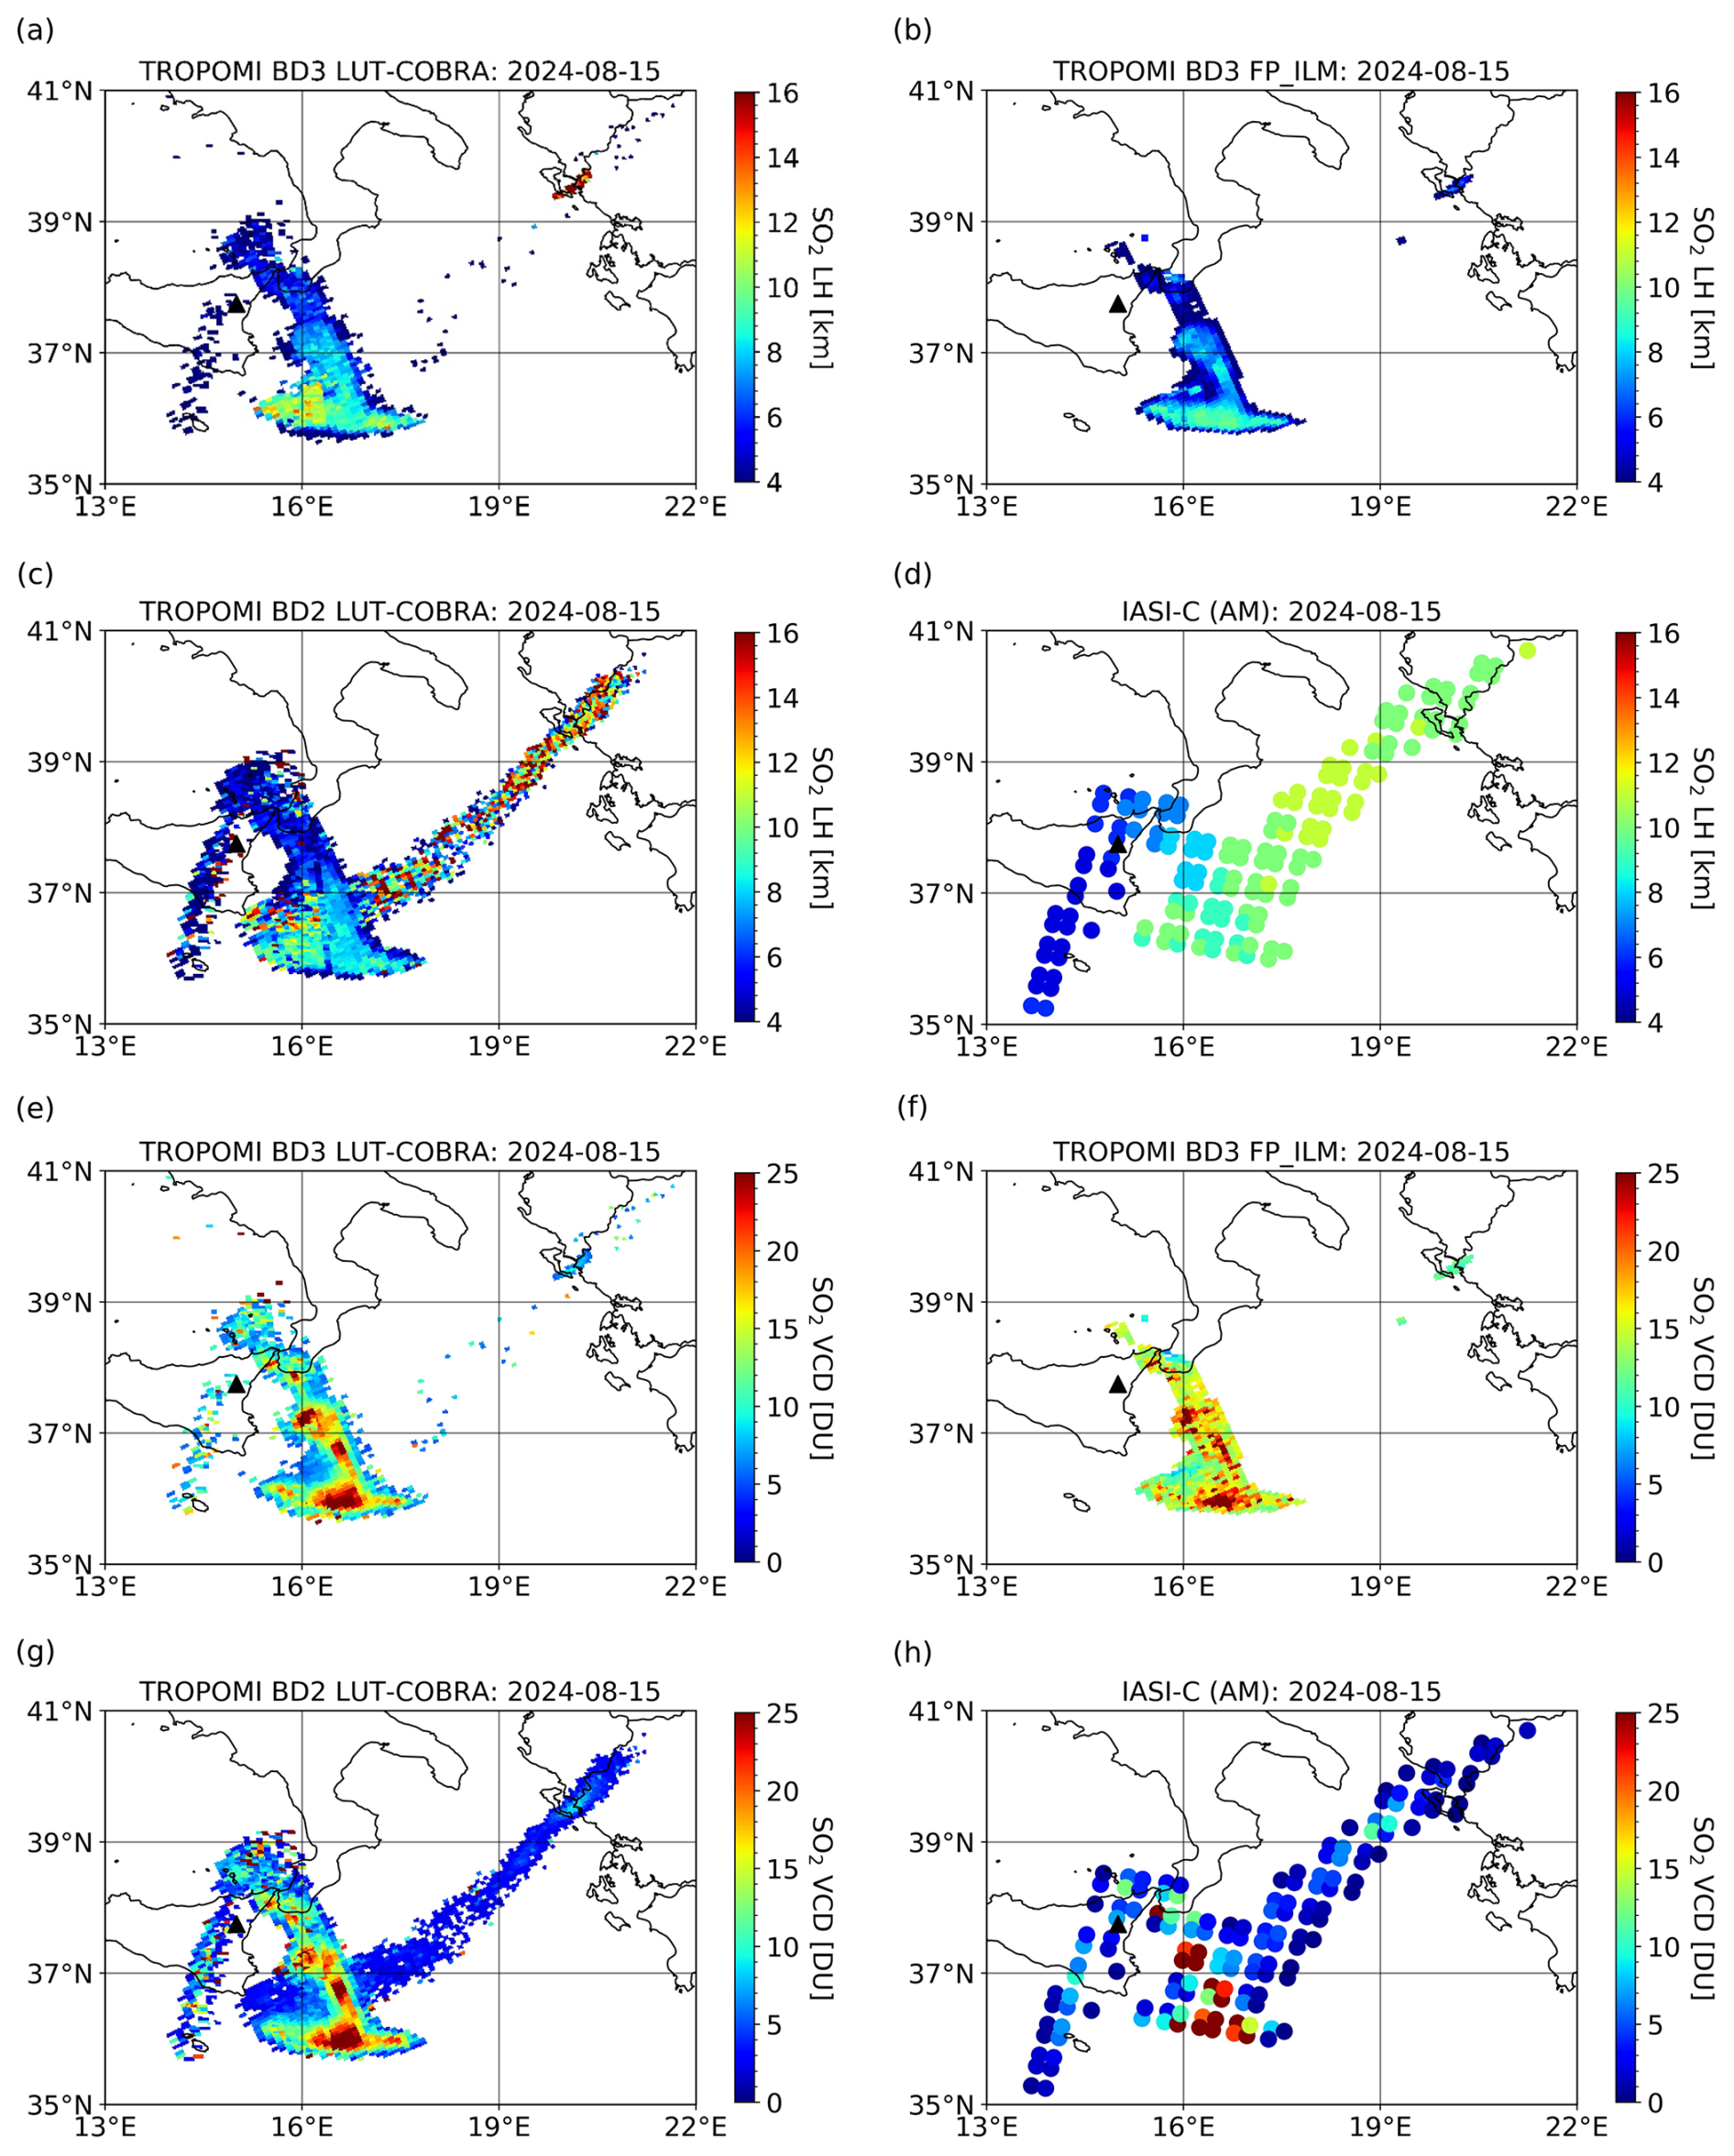
Figure 10SO2 retrievals from TROPOMI and IASI-C measurements on 15 August 2024 for the Etna eruption (see Table 4). Panels (a) and (b) show the LHs obtained from TROPOMI BD3 using LUT-COBRA and the operational product, respectively. Panel (c) presents the BD2 results, and panel (d) the observations from the descending (AM) orbit of IASI-C. The corresponding SO2 VCDs are displayed in panels (e)–(h). The volcano location is marked by a black triangle.
4.2.3 Ruang (April–May 2024)
Then, to further illustrate the added value of BD2, we applied our algorithm to a case involving dispersed plumes. More specifically, we analyzed the volcanic eruptions of Ruang, Indonesia, on 17 and 30 April 2024. In the days following these events, the SO2 plume spread across the tropical region was observed reaching altitudes of about 20 km, with column densities up to 20 DU (Dodangodage et al., 2025). Under these conditions, the BD3 algorithm struggles to retrieve the SO2 plume height, likely due to the reduced SO2 signal. In contrast, BD2 LUT-COBRA, with its improved sensitivity, offers a clearer depiction of the plume dispersion and height.
Figure 11 shows the SO2 LHs retrieved from TROPOMI BD3 and BD2 measurements, along with the observations from IASI-B, on 19 April and 1 May 2024. For the first eruptive event, the plume is more dispersed, which results in significant noise (i.e., pixels with unrealistically low and high LH values) in BD3. Conversely, the plume from the second eruption is more compact, and although BD3 LUT-COBRA performs slightly better, there is still noticeable noise. BD2, however, provides a greater number of valid pixels with height information and significantly reduces the surrounding noise for both dates. Furthermore, it can be seen that SO2 heights in BD2 are slightly lower than in BD3 for common pixels, by about 1–2 km. Interestingly, the BD2 results are largely consistent with the observations from IASI-B, which measured peak heights of approximately 17 km on 19 April and 1 May. The comparison with IASI is particularly relevant, as thermal infrared measurements are highly sensitive to plume heights in the mid- to upper troposphere and lower stratosphere. This consistency between our BD2 algorithm and IASI retrievals suggests that our method better represents the overall structure of the plume, especially at higher altitudes, compared to BD3. This is expected, given that the air mass factors are almost constant at such altitude for longer wavelengths, as already explained in Sect. 3.3 and shown in Fig. B1.
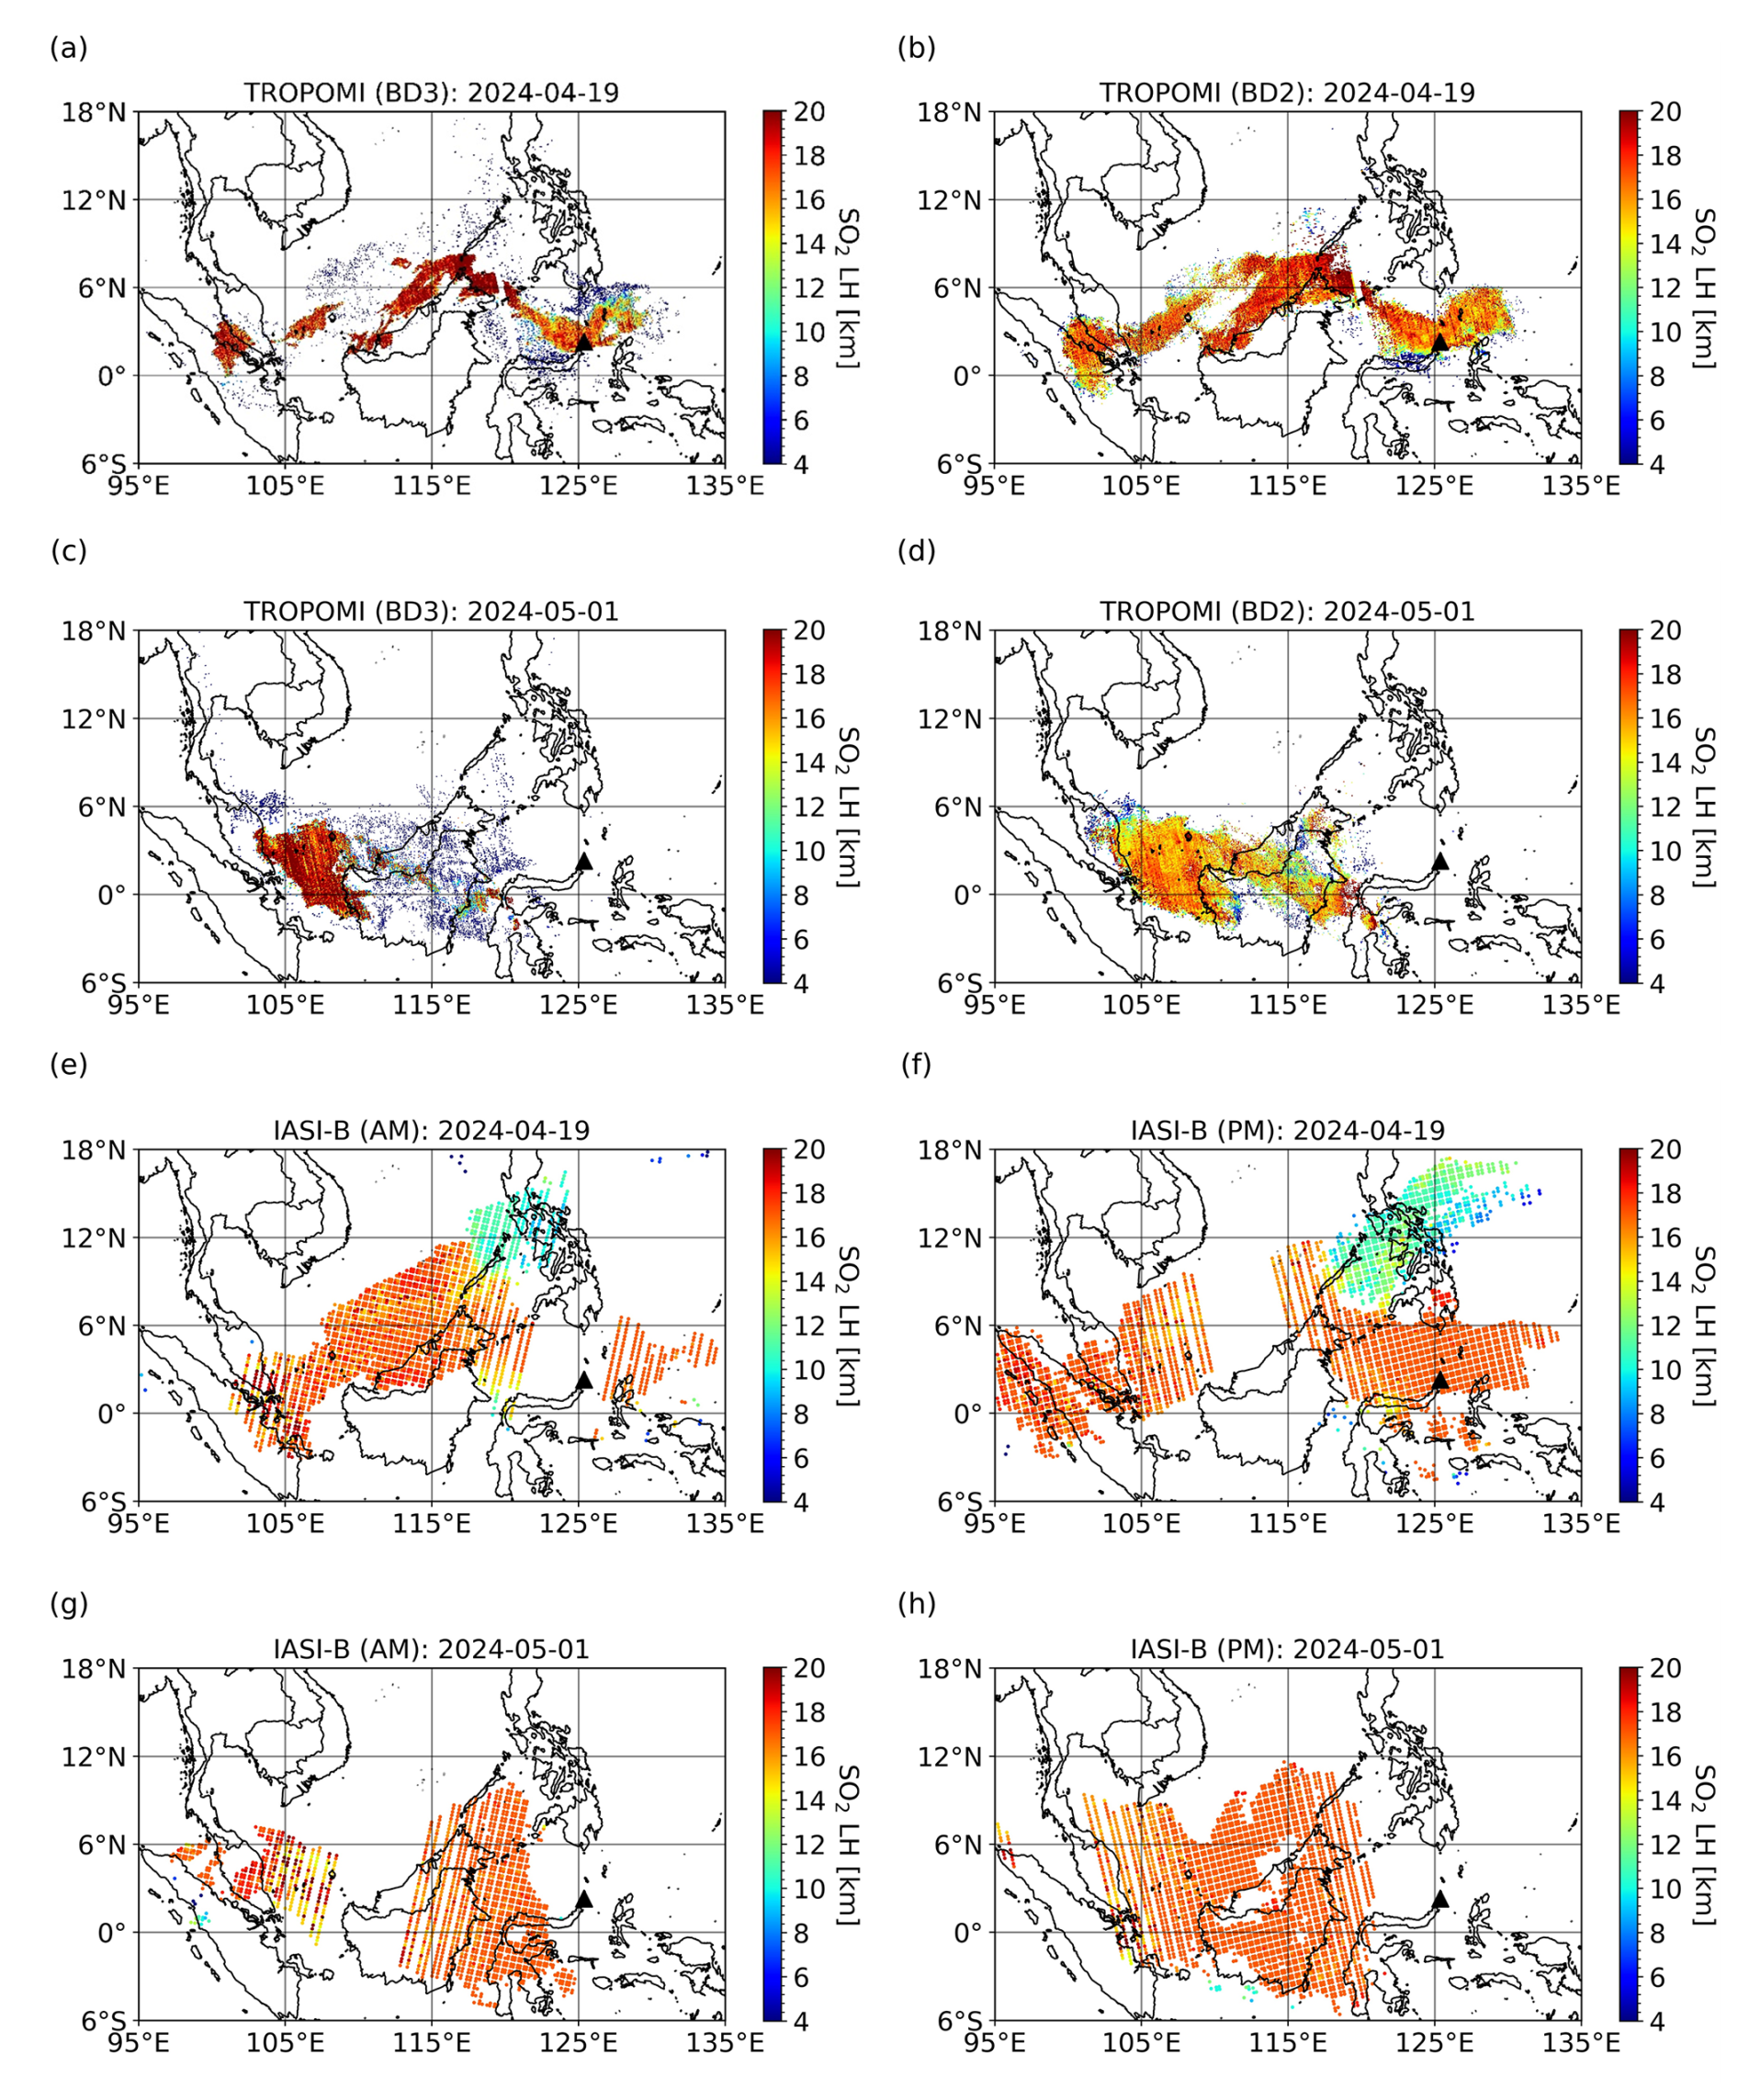
Figure 11SO2 LHs retrieved from TROPOMI and IASI-B measurements for the 2024 Ruang eruptions (see Table 4). Panels (a) and (b) show the results from TROPOMI on 19 April using BD3 (310–326 nm) and BD2 (305–326 nm), respectively. Panels (c) and (d) present the corresponding TROPOMI LHs on 1 May. Panels (e) and (f) display the LHs retrieved from IASI-B on 19 April during the descending (AM) and ascending (PM) orbits, respectively. Panels (g) and (h) show the corresponding IASI-B LHs on 1 May. The volcano location is marked by a black triangle.
Moreover, we derived the SO2 mass distribution (i.e., SO2 columns weighted by the pixel area at each altitude) from IASI and TROPOMI measurements, including both the current operational product and LUT-COBRA results. This is illustrated in Fig. 12. Here, the retrieval method from Hedelt et al. (2019) exhibits significant discrepancies, with plume height values substantially underestimated compared to LUT-COBRA and IASI. As previously mentioned, IASI detects a peak near the tropopause, a feature also captured by our algorithm, whereas BD3 LUT-COBRA estimates that a larger portion of the plume resides at higher altitudes in the stratosphere. We also note that the BD3 results capture a non-negligible SO2 layer below 2 km but this is unlikely to be true and results from low retrieval sensitivity for the corresponding pixels. Regarding the total SO2 mass (see Fig. 12), BD3 LUT-COBRA and IASI retrievals provide comparable results, while our BD2 algorithm derives a higher value. This can be explained by the greater number of detected SO2 pixels in BD2 compared to BD3, as a result of the improved sensitivity of our approach. This leads the algorithm to infer a higher total mass. The discrepancy with IASI mainly arises from the instrument's partial coverage, suggesting that the plume may not be fully captured because of gaps between successive orbits. It is worth noting that when the total SO2 masses are recalculated, neglecting the SO2 below approximately 5 km (not sounded by IASI or presumably erroneously retrieved by TROPOMI), we obtain 166.28 kt on 19 April, and 139.86 kt on 1 May, aligning more closely with the IASI estimates.
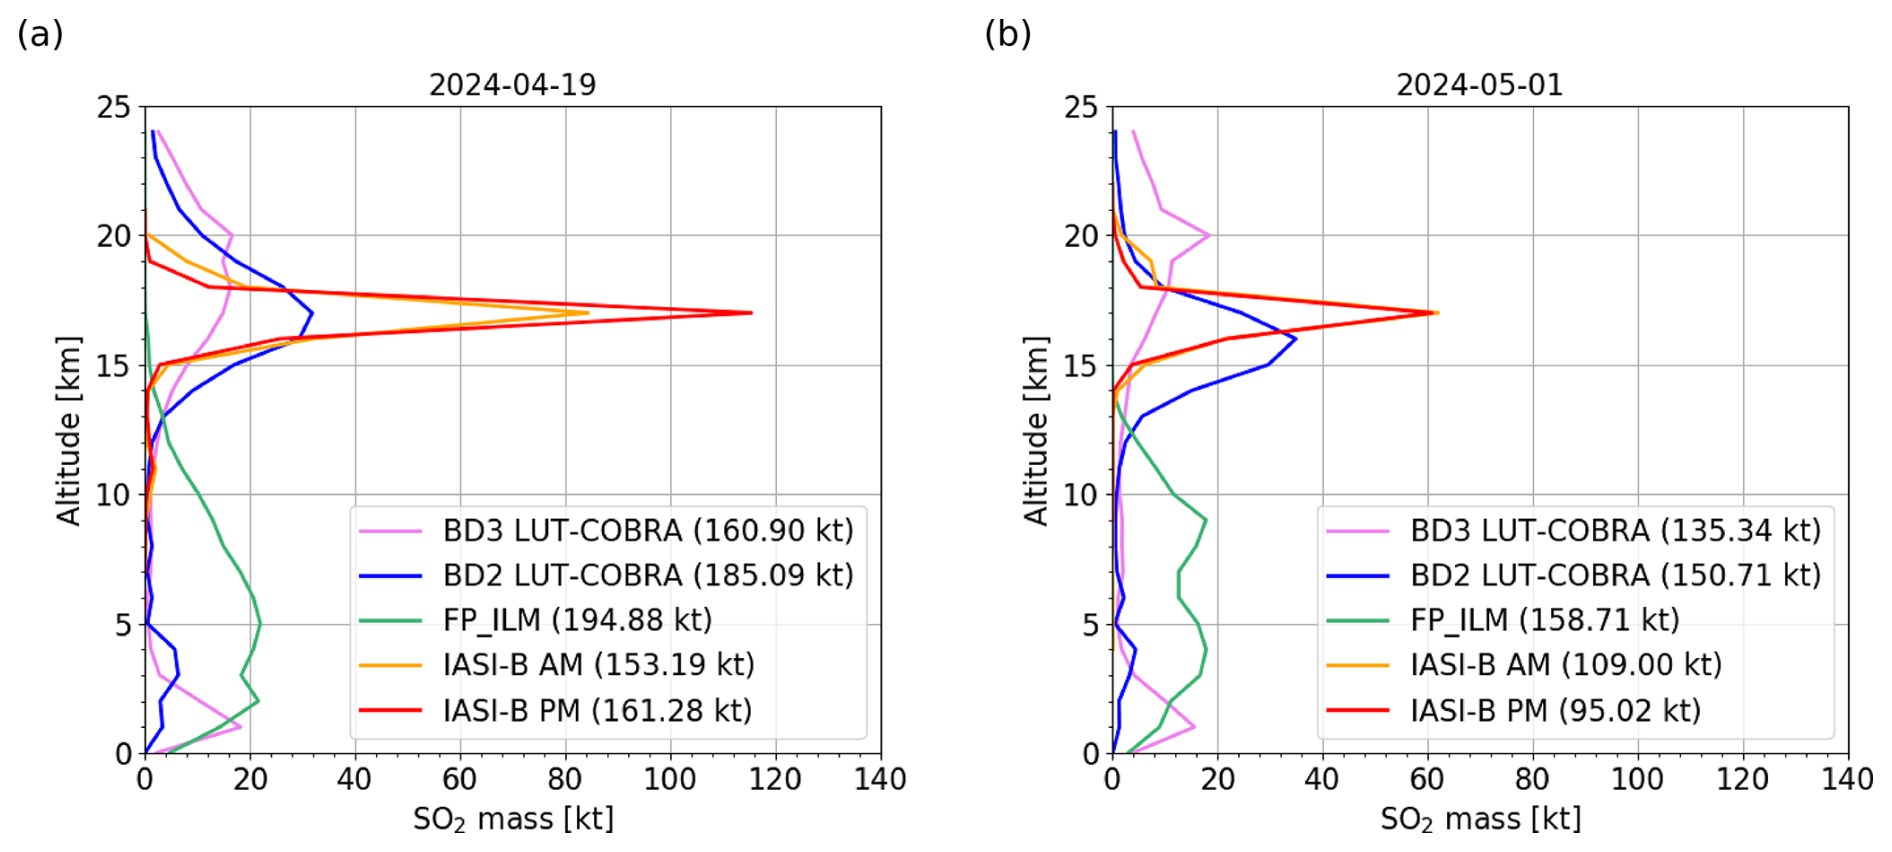
Figure 12SO2 vertical mass profiles on 19 April (a) and 1 May 2024 (b) for the Ruang eruptions (see Table 4), derived from IASI-B measurements, as well as from TROPOMI observations using BD3 and BD2 LUT-COBRA, and the operational product. The total mass corresponding to each dataset is indicated in parentheses.
To further evaluate our retrievals, we analyzed SO2 measurements from the MLS instrument over the same period. Specifically, we used version 5.1 data and applied the recommended selection criteria (Livesey et al., 2022), along with a minimum threshold on the SO2 mixing ratio of 25 (unitless). The SO2 density profiles derived from the ascending (daytime) and descending (nighttime) orbits are shown in Fig. 13, comparing data with a quality flag (q) greater than 0.95 (as recommended by Livesey et al., 2022) and data selected with a less restrictive threshold of 0.6. Note that we used the tropical atmospheric profiles of Lamsal et al. (2004) to convert the results from pressure to altitude. Despite its limited vertical resolution for SO2 (of approximately 3 km), the MLS observations are globally consistent with both our retrievals and those from IASI (see Fig. 12). On 19 April, MLS indeed detects a LH near 17 km during the night, regardless of the quality flag, and a comparable height during the day when exploiting the lower-quality data. Similarly, on 1 May, a peak is observed around 15 km in all daytime measurements and in nighttime data when using the lower threshold. Although less accurate, these results are nonetheless convincing and demonstrate that our algorithm can derive SO2 plume heights in good agreement with independent satellite observations.
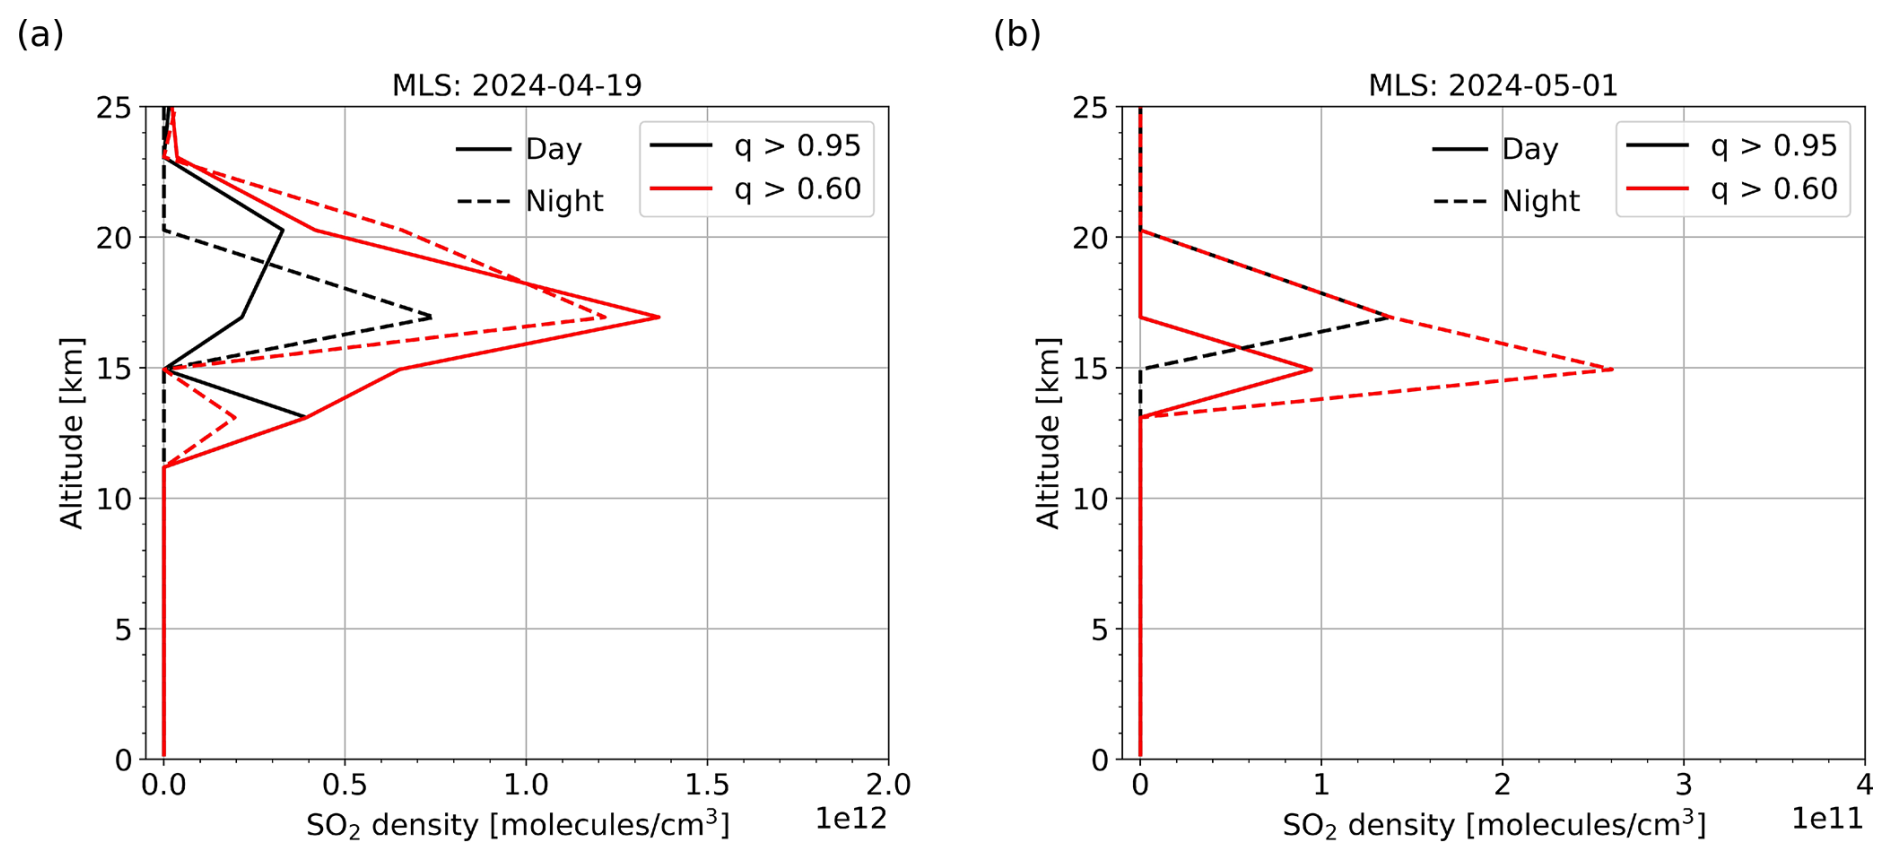
Figure 13SO2 vertical density profiles retrieved from MLS measurements on 19 April (a) and 1 May 2024 (b) for the Ruang eruptions (see Table 4). For each day, comparisons are made between daytime and nighttime observations, for different values of the quality flag (q) used for data selection.
4.2.4 Ulawun (June 2019)
Finally, as an additional demonstration case, we also studied the volcanic eruption of Ulawun on 27 June 2029, which exhibited characteristics similar to the Ruang eruptions in terms of SO2 column densities and altitudes reached. A comparison of the SO2 LHs retrieved from TROPOMI in both bands is shown on Fig. 14 and reveals similar results. Our BD2 algorithm provides more detailed vertical information on the plume compared to BD3, showing a better agreement with IASI. The retrieval errors are also significantly lower in BD2, further supporting the enhanced precision and reliability of our approach.
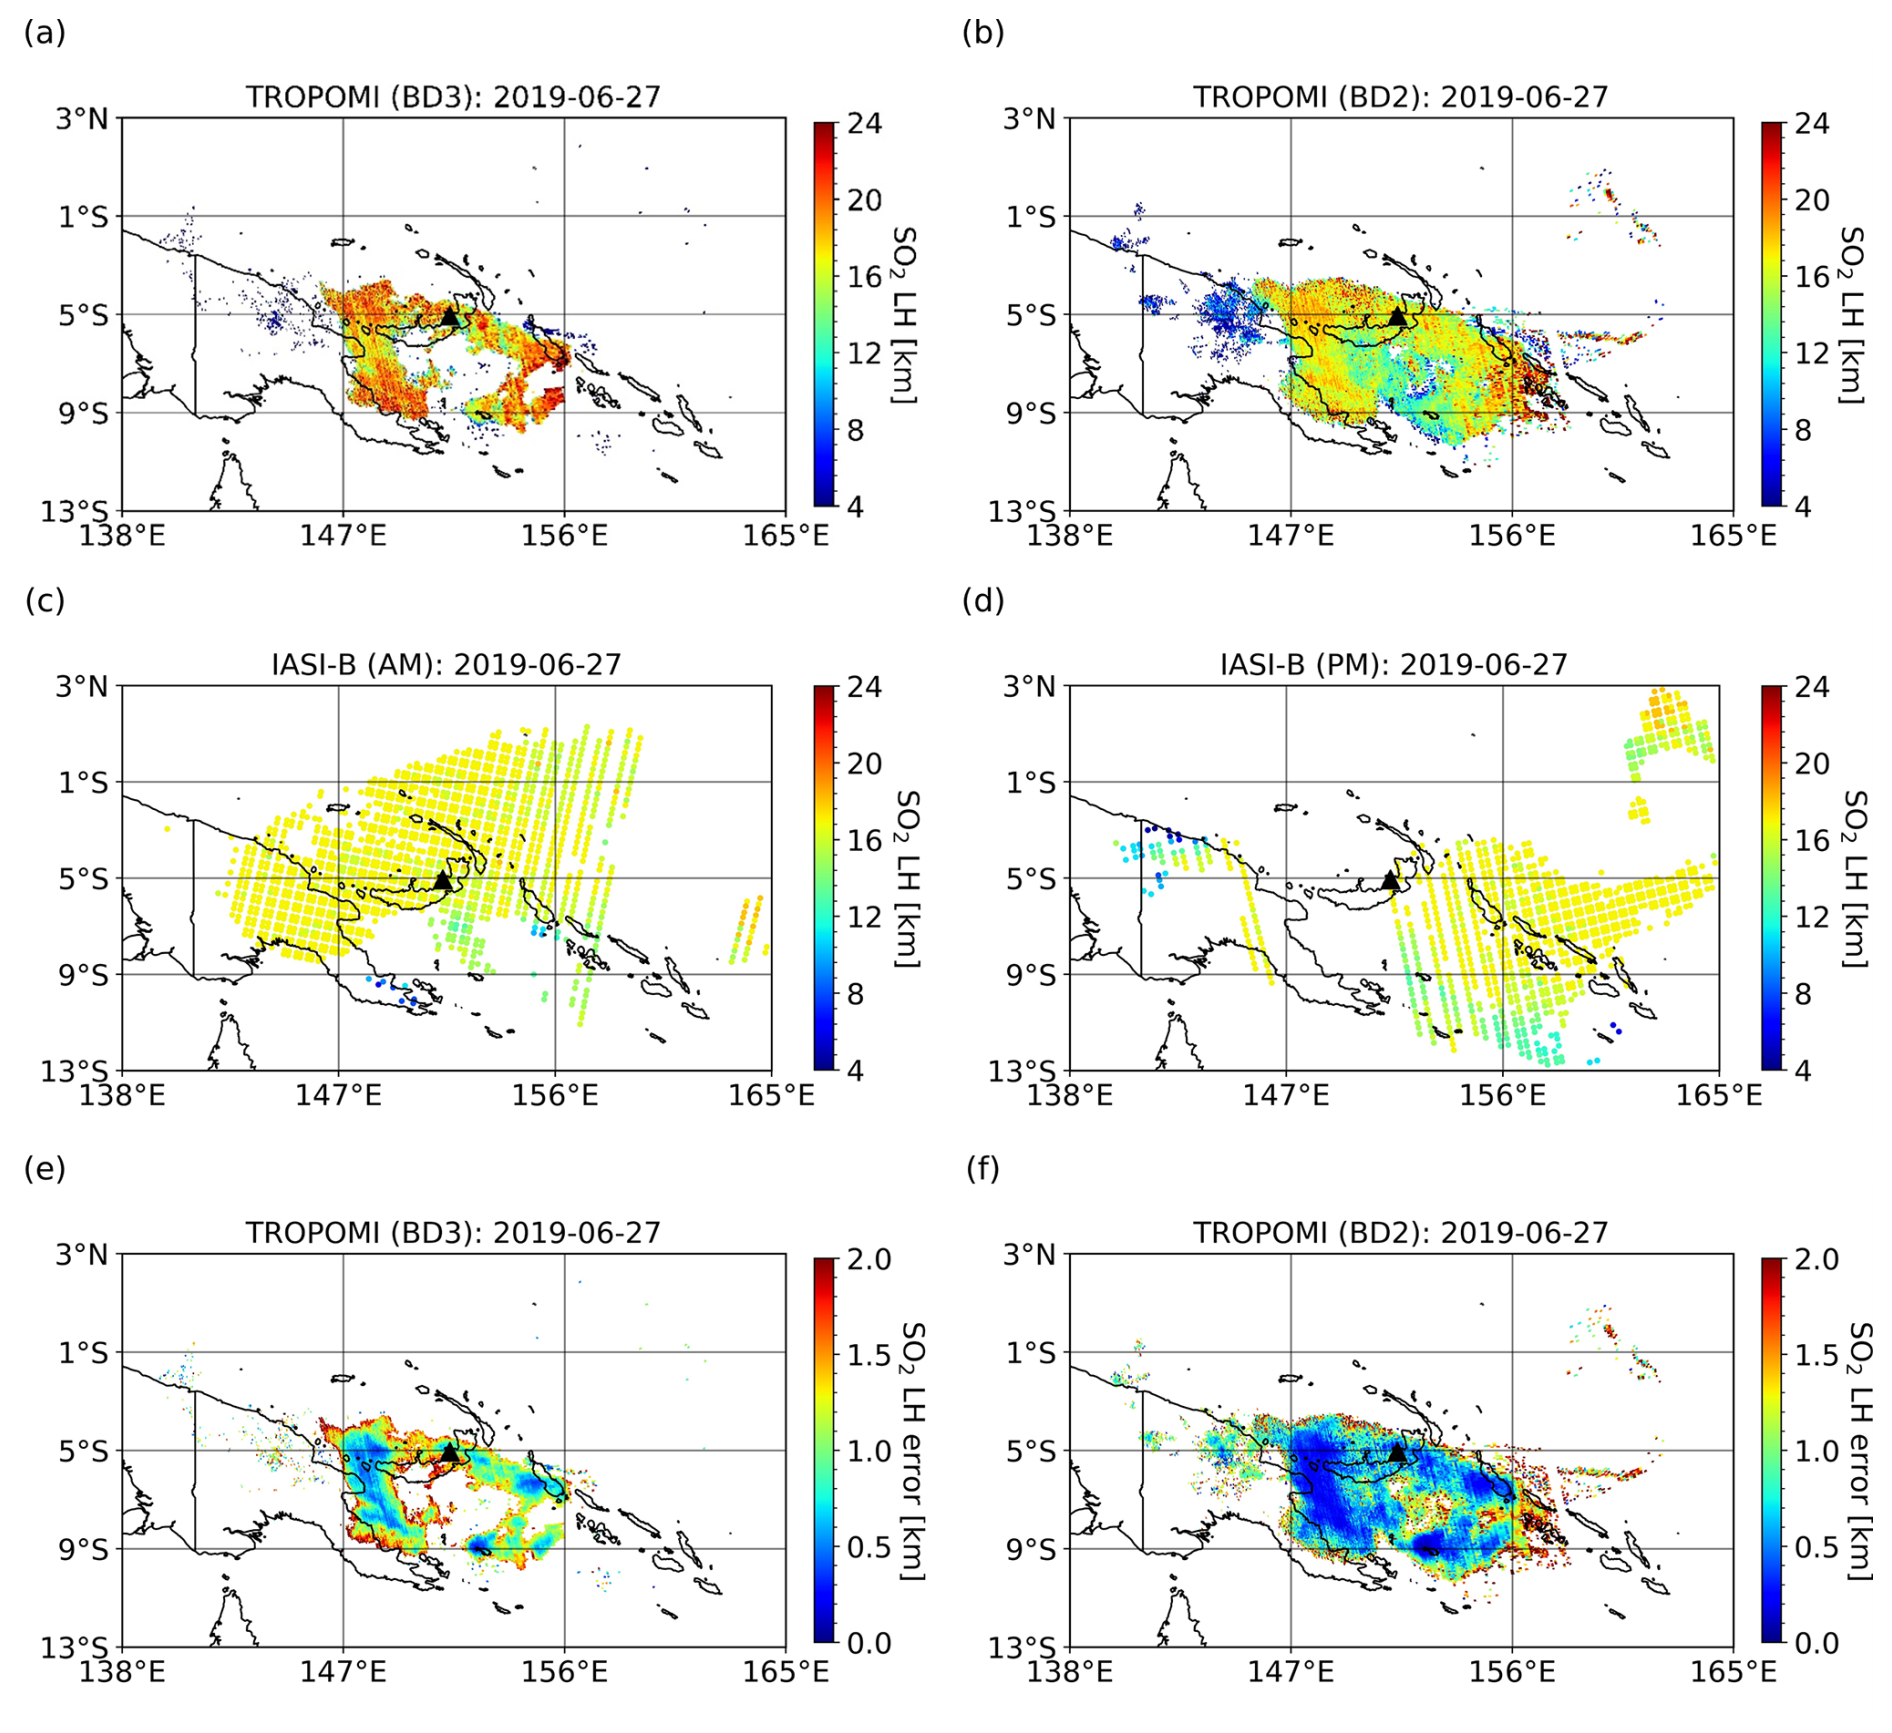
Figure 14SO2 retrievals from TROPOMI and IASI-B measurements on 27 June 2019 for the Ulawun eruption (see Table 4). Panels (a) and (b) show the LHs retrieved from BD3 (310–326 nm) and BD2 (305–326 nm), respectively, while panels (c) and (d) display the LHs obtained from IASI-B during the descending (AM) and ascending (PM) orbits, respectively, on the same dates. Panels (e) and (f) show the LH errors of BD3 and BD2. The volcano location is indicated by black triangles.
In Fig. 15a, we show the SO2 mass profiles derived from TROPOMI and IASI observations, while Fig. 15b presents the corresponding distributions from MLS daytime and nighttime measurements for the Ulawun eruption. The SO2 vertical distribution retrieved from BD2 is in better agreement with IASI (see Fig. 14) than BD3, whether using LUT-COBRA or the S-5P operational product, with an estimated plume height around 17 km. The differences in total SO2 mass between LUT-COBRA and FP_ILM are mainly due to the limited sensitivity of the operational product at such altitudes and low concentrations, resulting in only a few SO2 pixels being detected. The explanation for the discrepancies between TROPOMI and IASI is similar to that discussed for the Ruang case. Despite these differences, it can be seen that the SO2 profile retrieved from BD2 also aligns with the MLS profiles, showing a peak altitude near 15 km, regardless of the observation time or the applied quality flag.
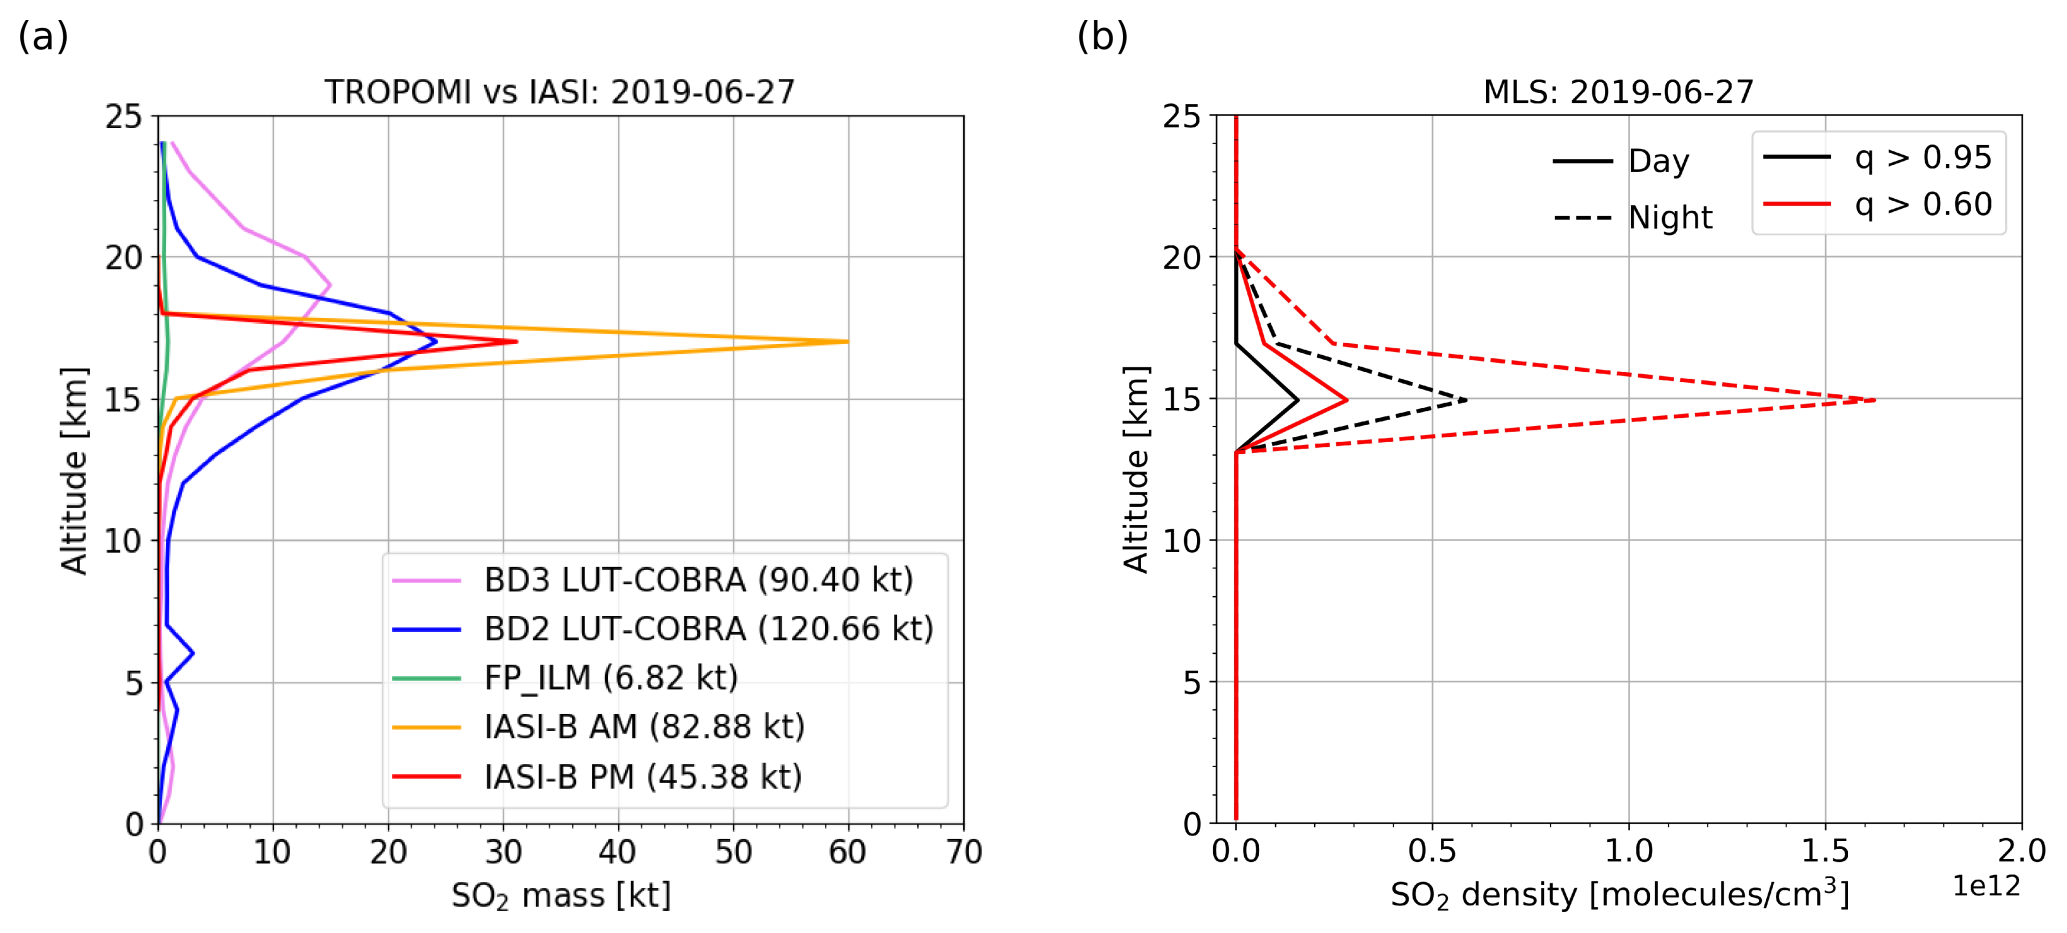
Figure 15(a) SO2 vertical mass profiles on 27 June 2019 for the Ulawun eruption (see Table 4), retrieved from IASI-B measurements, as well as from TROPOMI observations using BD3 and BD2 LUT-COBRA, and the operational product. The total mass corresponding to each dataset is indicated in parentheses. (b) SO2 vertical density profiles derived from MLS daytime and nighttime observations, using different quality flags (q) for data selection, for the same event.
In this study, we significantly improved the sensitivity of TROPOMI SO2 layer height and vertical column density retrievals. Originally developed for BD3 by Theys et al. (2022), we extended LUT-COBRA to BD2. This adaptation leverages the stronger SO2 absorption at shorter UV wavelengths and the superior spectral performance of TROPOMI in BD2 (mostly in terms of spectral sampling). We first demonstrated the benefit of BD2 by retrieving SO2 slant columns using the classical COBRA scheme (Theys et al., 2021). Results show excellent agreement between both spectral bands, and demonstrate better sensitivity to SO2 in BD2. In a second step, we conducted a wide sensitivity analysis for the SO2 layer height retrieval, based on simulated spectra, covering various spectral, atmospheric, and observation conditions typical of TROPOMI measurements. We showed that, despite the increased noise and ozone absorption below 310 nm, the TROPOMI BD2 could be reliably used for SO2 layer height retrievals, with retrieval errors reduced by at least a factor of 2 compared to BD3, the most important gain in sensitivity being in the UTLS. The sensitivity analyses also revealed that uncertainties on many input parameters, like the temperature, pressure and air density, the exact SO2 profile shape, surface height, and albedo have moderate influence on the retrieval quality. In contrast, we found that uncertainty on the SO2 absorption cross sections at short UV wavelengths can lead to non-negligible systematic biases on the SO2 layer height of about 0.7 km. This would deserve more attention in the future. Unsurprisingly, we also found that uncertainties on ozone profiles significantly impact the retrieved layer heights. Overall, the estimated systematic errors, considering extreme and small perturbations of all the investigate parameters, were 1.91 km for the SO2 LH and 2.58 % for the VCD, which is promising. To mitigate the impact of ozone, we derived mean ozone profiles for different ozone columns using the climatology of Lamsal et al. (2004) and generated an extensive look-up table of spectra covering more than 60 million conditions. Following numerical refinements, our algorithm was applied to real TROPOMI measurements for several volcanic events. The 2019 Raikoke eruption served as an ideal test case due to the high SO2 abundances released in the UTLS. From this event, we identified an optimized fitting window (305–326 nm) that maximizes the sensitivity to SO2 absorption while minimizing systematic errors due to ozone profile uncertainties. The detection limit was determined to be 2 DU, a significant improvement over the 5 DU of BD3 LUT-COBRA and 20 DU of the S-5P operational product. Overall, the retrieval results reveal a good consistency between both bands. We also analyzed the Etna eruption on 15 August 2024, a more challenging scenario with lower SO2 amounts. The BD2 retrievals closely match those from BD3 LUT-COBRA and the operational TROPOMI product, but provide a more detailed spatial representation, due to the improved detection limit. Additional case studies, including the 2024 Ruang and 2019 Ulawun tropical eruptions, confirm that BD2 retrievals are of much better quality that in BD3. Retrievals in BD2 capture more dispersed SO2 plumes with slightly lower LH estimates than in BD3 but in better agreement with independent IASI and MLS measurements. The SO2 mass estimates from our algorithm are systematically higher than those from BD3 TROPOMI and IASI, likely due to the increased number of valid pixels (in comparison to BD3) and improved spatial coverage (compared to TIR measurements). The cases of Ruang and Ulawun also show that our SO2 height retrievals outperform the operational product. The latter apparently fails to reproduce the SO2 height at the tropical tropopause level. The main limitations likely stem from the intrinsically low vertical sensitivity of BD3 at these altitudes and the decreased sensitivity of the FP_ILM algorithm for lower SO2 columns.
Future developments will focus on the following aspects:
-
We plan to extend our set of synthetic spectra by including volcanic aerosols (ash or sulphate) and assess their impact on the retrievals. As discussed in Section 3.2, aerosols may introduce non-negligible additional uncertainties in the retrieved SO2 heights when collocated with the plume. The expansion of our code to analyze more complex volcanic eruptions (like the eruption of Hunga Tonga) and treating aerosols explicitly are a longer-term and challenging objective.
-
We also plan to combine the Optimal Estimation Method (OEM) of Rodgers (2000) with LUT-COBRA to further mitigate uncertainties related to ozone absorption and possibly other parameters. We have performed initial tests on synthetic spectra and found a considerable reduction of the LH and VCD biases.
-
By processing the full time-series of TROPOMI, we plan to study long-term degassing changes at the global scale, by exploiting the combination of sensitive SO2 height and column retrievals. This would also contribute to improve our understanding of the global sulfur budget, and of volcanic and atmospheric processes. Beyond volcanic sources, we also intend to test our algorithm on anthropogenic SO2 scenes.
-
It is an objective to extend the validation to more cases. One possibility is to compare the results with dispersion modelling results from the Plume_traj toolkit (Pardini et al., 2017, 2018; Queißer et al., 2019).
The synthetic tests were conducted under the assumption that the background contribution was well-known (i.e., ). From Eqs. (1) and (3), we thus have
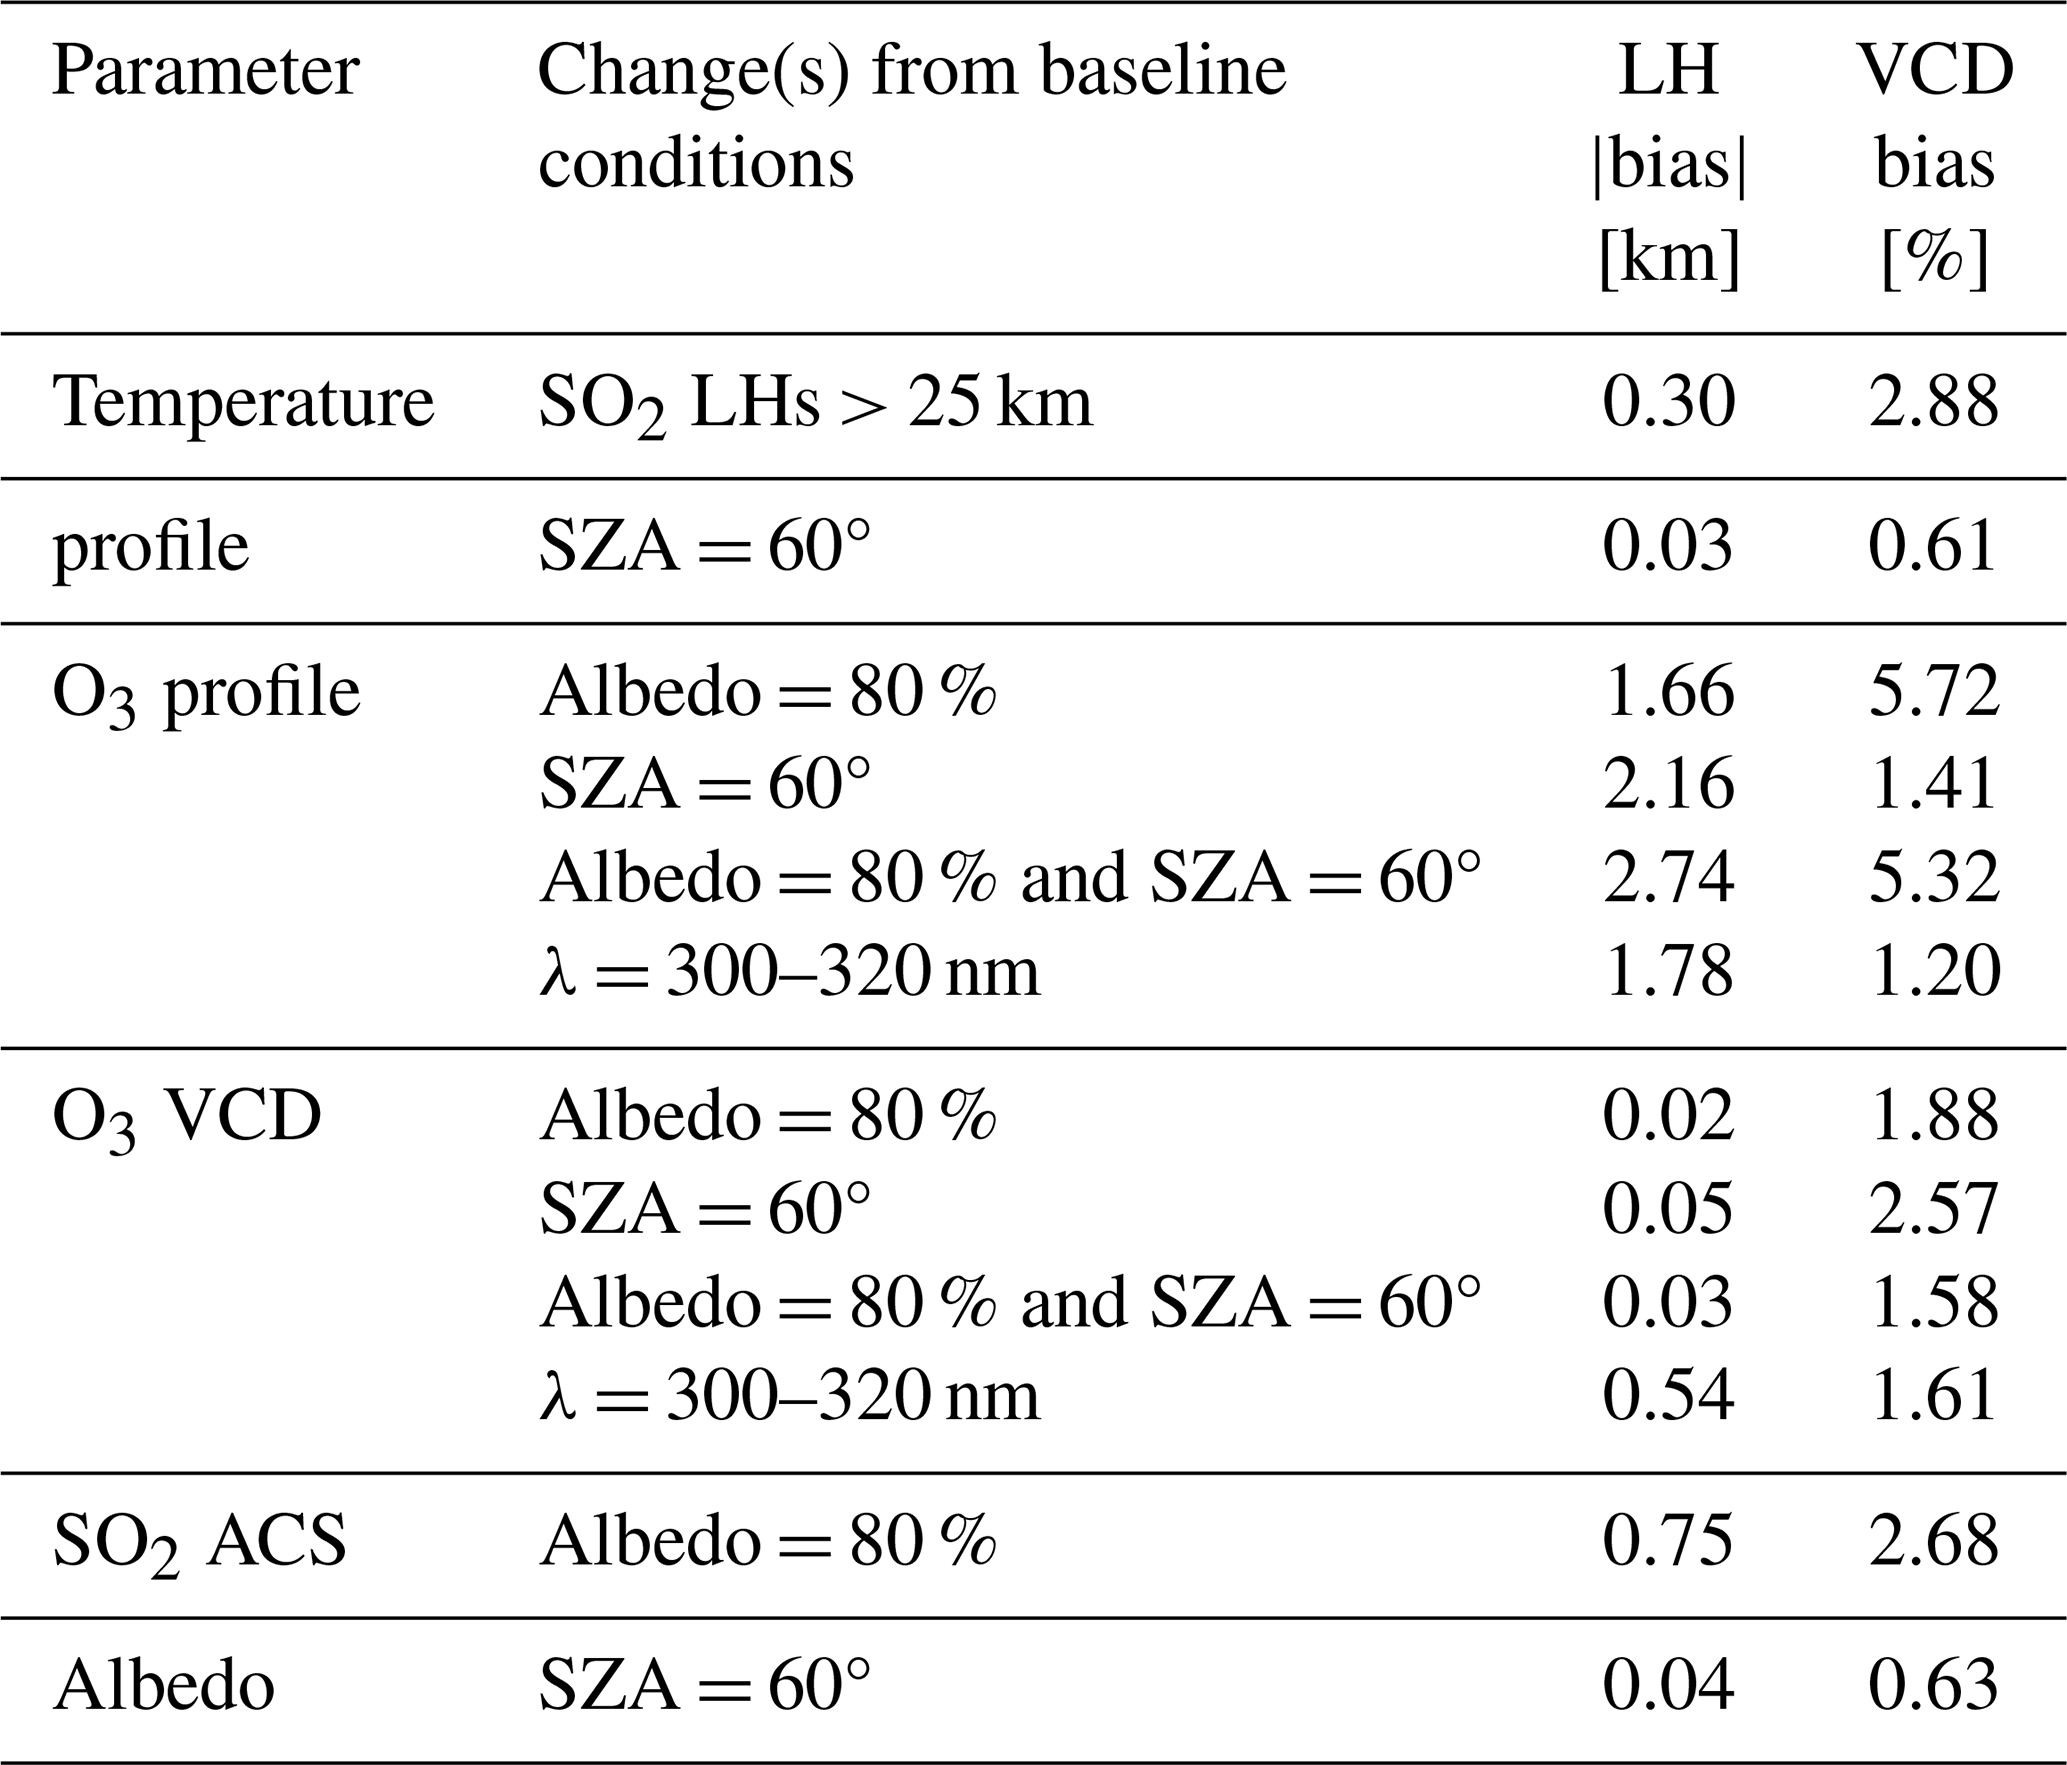
This means that SO2 spectra, rather than total (SO2 + O3) spectra, were processed. In addition to the analyses described in Sect. 3.3, other tests were conducted using alternative look-up table conditions. Table A1 presents the changes made to the baseline conditions, along with the estimated retrieval errors for the same perturbed conditions as in Table 2, assuming a SO2 height of 13.5 km and column density of 5 DU.
Table A1Overview of the additional sensitivity tests of LUT-COBRA in BD2, considering different look-up table parameters. The results are given for a SO2 column density of 5 DU and an altitude of 13.5 km.
The SO2 AMFs can be calculated as
where and correspond respectively to the radiance with and without the sulfur dioxide contribution, and σλ stands for the SO2 absorption cross sections. Figure B1 shows SO2 AMF vertical profiles for various wavelengths and SO2 VCDs.
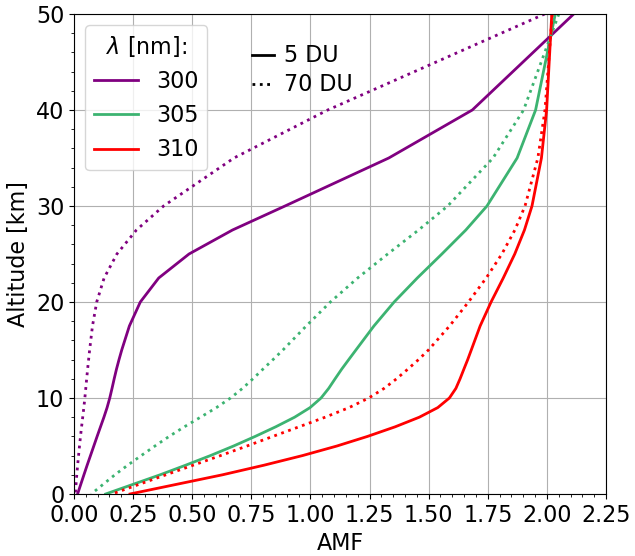
Figure B1SO2 AMF distributions as a function of the altitude, for different wavelengths and SO2 VCDs.
Figure C1 makes a comparison between the SO2 absorption cross sections from Bogumil et al. (2003), used in our look-up tables, and those from Birk and Wagner (2018).
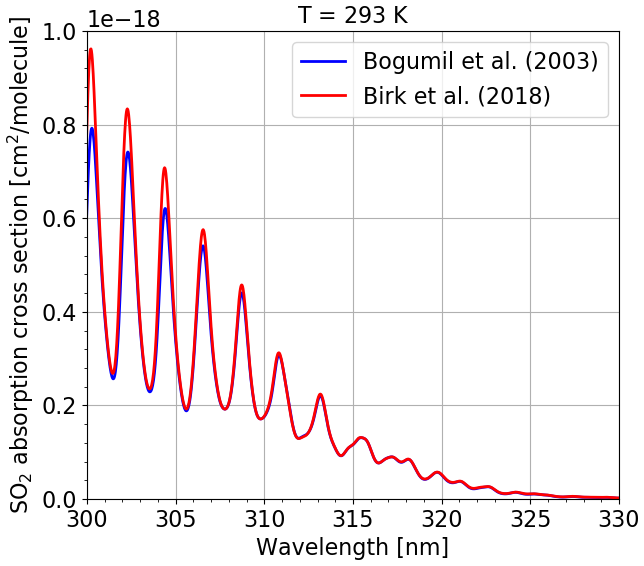
Figure C1Comparison of the SO2 absorption cross sections from Bogumil et al. (2003) and Birk and Wagner (2018), for a temperature (T) of 293 K.
The BD2 and BD3 (LUT-)COBRA datasets used in this study are available via Zenodo at https://doi.org/10.5281/zenodo.16892522 (Fabris, 2025). The reprocessed operational TROPOMI SO2 plume height product is freely available for the full TROPOMI timeframe via the Copernicus Data Space Ecosystem at https://dataspace.copernicus.eu (last access: 14 August 2025). IASI data are available from LC and BF upon request. MLS data are publicly accessible via the NASA GES DISC at https://disc.gsfc.nasa.gov/datasets (last access: 14 August 2025).
LF prepared the manuscript and figures with inputs from all co-authors. He performed the sensitivity analyses, developed the BD2 version of LUT-COBRA and analyzed the volcanic emissions. NT supervised the research, advised on the BD3-to-BD2 transition of LUT-COBRA, and supported the interpretation of synthetic tests and satellite intercomparisons. LC and BF supplied the IASI data and contributed to their analysis. JV assisted with the optimization of the retrieval codes and the generation of the comprehensive look-up table for the TROPOMI BD2 algorithm using HPC resources. HY helped for the radiative transfer simulations with LIDORT. HB supported the selection of volcanic events. TD shared his expertise for the adaptation of LUT-COBRA to BD2. PH provided the TROPOMI SO2 product for the 2018–2024 timeframe. MVR offered constructive comments on the manuscript. All (co-)authors contributed to its review and refinement.
At least one of the (co-)authors is a member of the editorial board of Atmospheric Measurement Techniques. The peer-review process was guided by an independent editor, and the authors also have no other competing interests to declare.
Publisher's note: Copernicus Publications remains neutral with regard to jurisdictional claims made in the text, published maps, institutional affiliations, or any other geographical representation in this paper. The authors bear the ultimate responsibility for providing appropriate place names. Views expressed in the text are those of the authors and do not necessarily reflect the views of the publisher.
We thank EU, ESA, KNMI, and DLR for the TROPOMI/S-5P Level-1 and Level-2 products. We also thank Lieven Clarisse and Bruno Franco for the IASI data. Lieven Clarisse is a Senior Research Associate supported by the Belgian F.R.S.-FNRS.
This study was supported by ESA and BELSPO, in particular through the Climate Change Initiative Precursors_cciC project, the ATM-MPC project, and the TROPOMI-related PRODEX TRACE-S5P project.
This paper was edited by Natalya Kramarova and reviewed by two anonymous referees.
Aliwell, S. R., Van Roozendael, M., Johnston, P. V., Richter, A., Wagner, T., Arlander, D. W., Burrows, J. P., Fish, D. J., Jones, R. L., Tørnkvist, K. K., Lambert, J., Pfeilsticker, K., and Pundt, I.: Analysis for BrO in zenith‐sky spectra: An intercomparison exercise for analysis improvement, J. Geophys. Res.-Atmos., 107, https://doi.org/10.1029/2001JD000329, 2022. a
Anderson, G., Clough, S., Kneizys, F., Chetwynd, J., and Shettle, E.: AFGL Atmospheric Constituent Profiles (0.120km), Air Force Geophysics Laboratory, Hanscom AFB, MA 01731, Tech. Rep., 46 pp., https://apps.dtic.mil/sti/tr/pdf/ADA175173.pdf (last access: 28 January 2025), 1986. a, b, c
Axebrink, E., Sporre, M. K., and Friberg, J.: Impact of SO2 injection profiles on simulated volcanic forcing for the 2009 Sarychev eruptions – investigating the importance of using high-vertical-resolution methods when compiling SO2 data, Atmos. Chem. Phys., 25, 2047–2059, https://doi.org/10.5194/acp-25-2047-2025, 2025. a
Bhartia, P. K.: OMI/Aura TOMS-Like Ozone and Radiative Cloud Fraction Daily L3 Global 0.25×0.25 deg, GES DISC [data set], https://doi.org/10.5067/AURA/OMI/DATA3002, 2012. a
Birk, M. and Wagner, G.: ESA SEOM-IAS – Measurement and ACS database SO2 UV region, Zenodo [data set], https://doi.org/10.5281/ZENODO.1492582,2018. a, b, c, d, e
Bogumil, K., Orphal, J., Homann, T., Voigt, S., Spietz, P., Fleischmann, O. C., Vogel, A., Hartmann, M., Kromminga, H., Bovensmann, H., Frerick, J., and Burrows, J. P.: Measurements of molecular absorption spectra with the SCIAMACHY pre-flight model: instrument characterization and reference data for atmospheric remote-sensing in the 230–2380 nm region, J. Photochem. Photobiol. A, 157, 167–184, https://doi.org/10.1016/S1010-6030(03)00062-5, 2003. a, b, c, d, e, f, g, h
Borsdorff, T., Aan de Brugh, J., Hu, H., Aben, I., Hasekamp, O., and Landgraf, J.: Measuring Carbon Monoxide With TROPOMI: First Results and a Comparison With ECMWF‐IFS Analysis Data, Geophys. Res. Lett., 45, 2826–2832, https://doi.org/10.1002/2018GL077045, 2018. a
Cai, Z., Griessbach, S., and Hoffmann, L.: Improved estimation of volcanic SO2 injections from satellite retrievals and Lagrangian transport simulations: the 2019 Raikoke eruption, Atmos. Chem. Phys., 22, 6787–6809, https://doi.org/10.5194/acp-22-6787-2022, 2022. a
Carboni, E., Grainger, R., Walker, J., Dudhia, A., and Siddans, R.: A new scheme for sulphur dioxide retrieval from IASI measurements: application to the Eyjafjallajökull eruption of April and May 2010, Atmos. Chem. Phys., 12, 11417–11434, https://doi.org/10.5194/acp-12-11417-2012, 2012. a
Carlsen, H. K., Valdimarsdóttir, U., Briem, H., Dominici, F., Finnbjornsdottir, R. G., Jóhannsson, T., Aspelund, T., Gislason, T., and Gudnason, T.: Severe volcanic SO2 exposure and respiratory morbidity in the Icelandic population – a register study, Environ. Health, 20, 23, https://doi.org/10.1186/s12940-021-00698-y, 2021. a
Carn, S., Clarisse, L., and Prata, A.: Multi-decadal satellite measurements of global volcanic degassing, J. Volcanol.-Geoth. Res., 311, 99–134, https://doi.org/10.1016/j.jvolgeores.2016.01.002, 2016. a
Carn, S. A., Krueger, A. J., Krotkov, N. A., Yang, K., and Evans, K.: Tracking volcanic sulfur dioxide clouds for aviation hazard mitigation, Nat. Hazards, 51, 325–343, https://doi.org/10.1007/s11069-008-9228-4, 2009. a
Clarisse, L., Coheur, P.-F., Theys, N., Hurtmans, D., and Clerbaux, C.: The 2011 Nabro eruption, a SO2 plume height analysis using IASI measurements, Atmos. Chem. Phys., 14, 3095–3111, https://doi.org/10.5194/acp-14-3095-2014, 2014. a, b
Clarisse, L., Franco, B., Van Damme, M., Di Gioacchino, T., Hadji-Lazaro, J., Whitburn, S., Noppen, L., Hurtmans, D., Clerbaux, C., and Coheur, P.: The IASI NH3 version 4 product: averaging kernels and improved consistency, Atmos. Meas. Tech., 16, 5009–5028, https://doi.org/10.5194/amt-16-5009-2023, 2023. a
Clerbaux, C., Boynard, A., Clarisse, L., George, M., Hadji-Lazaro, J., Herbin, H., Hurtmans, D., Pommier, M., Razavi, A., Turquety, S., Wespes, C., and Coheur, P.-F.: Monitoring of atmospheric composition using the thermal infrared IASI/MetOp sounder, Atmos. Chem. Phys., 9, 6041–6054, https://doi.org/10.5194/acp-9-6041-2009, 2009. a
de Leeuw, J., Schmidt, A., Witham, C. S., Theys, N., Taylor, I. A., Grainger, R. G., Pope, R. J., Haywood, J., Osborne, M., and Kristiansen, N. I.: The 2019 Raikoke volcanic eruption – Part 1: Dispersion model simulations and satellite retrievals of volcanic sulfur dioxide, Atmos. Chem. Phys., 21, 10851–10879, https://doi.org/10.5194/acp-21-10851-2021, 2021. a
De Smedt, I., Theys, N., Yu, H., Danckaert, T., Lerot, C., Compernolle, S., Van Roozendael, M., Richter, A., Hilboll, A., Peters, E., Pedergnana, M., Loyola, D., Beirle, S., Wagner, T., Eskes, H., van Geffen, J., Boersma, K. F., and Veefkind, P.: Algorithm theoretical baseline for formaldehyde retrievals from S5P TROPOMI and from the QA4ECV project, Atmos. Meas. Tech., 11, 2395–2426, https://doi.org/10.5194/amt-11-2395-2018, 2018. a
Dodangodage, R., Bernath, P. F., Wyatt, M., and Boone, C.: Atmospheric Chemistry Experiment (ACE) satellite observations of aerosols and SO2 emissions from the 2024 Ruang volcanic eruption, J. Quant. Spectrosc. Ra., 333, 109333, https://doi.org/10.1016/j.jqsrt.2024.109333, 2025. a
Efremenko, D. S., Loyola R., D. G., Hedelt, P., and Spurr, R. J. D.: Volcanic SO2 plume height retrieval from UV sensors using a full-physics inverse learning machine algorithm, Int. J. Remote Sens., 38, 1–27, https://doi.org/10.1080/01431161.2017.1348644, 2017. a
Escribano, J., Bozzo, A., Dubuisson, P., Flemming, J., Hogan, R. J., C.-Labonnote, L., and Boucher, O.: A benchmark for testing the accuracy and computational cost of shortwave top-of-atmosphere reflectance calculations in clear-sky aerosol-laden atmospheres, Geosci. Model Dev., 12, 805–827, https://doi.org/10.5194/gmd-12-805-2019, 2019. a
Fabris, L.: SO2 retrievals from TROPOMI BD2 and BD3 measurements, Version 1.0, Zenodo [data set], https://doi.org/10.5281/zenodo.16892522, 2025. a
Fedkin, N. M., Li, C., Krotkov, N. A., Hedelt, P., Loyola, D. G., Dickerson, R. R., and Spurr, R.: Volcanic SO2 effective layer height retrieval for the Ozone Monitoring Instrument (OMI) using a machine-learning approach, Atmos. Meas. Tech., 14, 3673–3691, https://doi.org/10.5194/amt-14-3673-2021, 2021. a, b
Fuglestvedt, H. F., Zhuo, Z., Toohey, M., and Krüger, K.: Volcanic forcing of high-latitude Northern Hemisphere eruptions, npj Clim. Atmos. Sci., 7, https://doi.org/10.1038/s41612-023-00539-4, 2024. a
Galle, B., Johansson, M., Rivera, C., Zhang, Y., Kihlman, M., Kern, C., Lehmann, T., Platt, U., Arellano, S., and Hidalgo, S.: Network for Observation of Volcanic and Atmospheric Change (NOVAC) – A global network for volcanic gas monitoring: Network layout and instrument description, J. Geophys. Res.-Atmos., 115, https://doi.org/10.1029/2009jd011823, 2010. a
Garane, K., Koukouli, M.-E., Verhoelst, T., Lerot, C., Heue, K.-P., Fioletov, V., Balis, D., Bais, A., Bazureau, A., Dehn, A., Goutail, F., Granville, J., Griffin, D., Hubert, D., Keppens, A., Lambert, J.-C., Loyola, D., McLinden, C., Pazmino, A., Pommereau, J.-P., Redondas, A., Romahn, F., Valks, P., Van Roozendael, M., Xu, J., Zehner, C., Zerefos, C., and Zimmer, W.: TROPOMI/S5P total ozone column data: global ground-based validation and consistency with other satellite missions, Atmos. Meas. Tech., 12, 5263–5287, https://doi.org/10.5194/amt-12-5263-2019, 2019. a
Grishin, S., Belousov, A., Belousova, M., Auer, A., and Kozyrev, I.: The 2019 Explosive Eruption of Raikoke Volcanic Island, Kuriles: Pyroclastic Deposits and Their Impact on the Relief and Ecosystems, J. Volcanol. Seismol., 15, 387–398, https://doi.org/10.1134/S074204632105002X, 2021. a
Haywood, J. and Boucher, O.: Estimates of the direct and indirect radiative forcing due to tropospheric aerosols: A review, Rev. Geophys., 38, 513–543, https://doi.org/10.1029/1999RG000078, 2000. a
Heaviside, C., Witham, C., and Vardoulakis, S.: Potential health impacts from sulphur dioxide and sulphate exposure in the UK resulting from an Icelandic effusive volcanic eruption, Sci. Total Environ., 774, 145549, https://doi.org/10.1016/j.scitotenv.2021.145549, 2021. a
Hedelt, P., Efremenko, D. S., Loyola, D. G., Spurr, R., and Clarisse, L.: Sulfur dioxide layer height retrieval from Sentinel-5 Precursor/TROPOMI using FP_ILM, Atmos. Meas. Tech., 12, 5503–5517, https://doi.org/10.5194/amt-12-5503-2019, 2019. a, b, c, d, e
Hedelt, P., Theys, N., Romahn, F., Wagner, T., Lambert, J.-C., Loyola, D., Stein Zweers, D., Dehn, A., and Zehner, C.: S5P Mission Performance Centre Sulphur Dioxide [L2__SO2____], Tech. Rep. no. S5P-MPC-BIRA-PRF-SO2, product version V02.06.01, Deutsches Zentrum für Luft und Raumfahrt (DLR), Royal Belgian Institute for Space Aeronomy (BIRA-IASB), and European Space Agency (ESA), 16 pp., https://sentinels.copernicus.eu/documents/d/sentinel/s5p-mpc-bira-prf-so2_v02-06-01_2-8_20231129_signed (last access: 1 May 2025), 2023. a
Hyman, D. M. and Pavolonis, M. J.: Probabilistic retrieval of volcanic SO2 layer height and partial column density using the Cross-track Infrared Sounder (CrIS), Atmos. Meas. Tech., 13, 5891–5921, https://doi.org/10.5194/amt-13-5891-2020, 2020. a
Kern, C., Werner, C., Elias, T., Sutton, A. J., and Lübcke, P.: Applying UV cameras for SO2 detection to distant or optically thick volcanic plumes, J. Volcanol.-Geoth. Res., 262, 80–89, https://doi.org/10.1016/j.jvolgeores.2013.06.009, 2013. a
Kristiansen, N. I., Witham, C. S., and Beckett, F. M.: A modelling approach for quantifying volcanic sulphur dioxide concentrations at flight altitudes and the potential hazard to aircraft occupants, J. Appl. Volcanol., 13, 7, https://doi.org/10.1186/s13617-024-00144-x, 2024. a
Labow, G. J., Ziemke, J. R., McPeters, R. D., Haffner, D. P., and Bhartia, P. K.: A total ozone‐dependent ozone profile climatology based on ozonesondes and Aura MLS data, J. Geophys. Res.-Atmos., 120, 2537–2545, https://doi.org/10.1002/2014JD022634, 2015. a
Lamotte, C., Guth, J., Marécal, V., Cussac, M., Hamer, P. D., Theys, N., and Schneider, P.: Modeling study of the impact of SO2 volcanic passive emissions on the tropospheric sulfur budget, Atmos. Chem. Phys., 21, 11379–11404, https://doi.org/10.5194/acp-21-11379-2021, 2021. a
Lamsal, L. N., Weber, M., Tellmann, S., and Burrows, J. P.: Ozone column classified climatology of ozone and temperature profiles based on ozonesonde and satellite data, J. Geophys. Res.-Atmos., 109, 2004JD004680, https://doi.org/10.1029/2004JD004680, 2004. a, b, c, d, e, f
Lerot, C., Van Roozendael, M., Spurr, R., Loyola, D., Coldewey‐Egbers, M., Kochenova, S., van Gent, J., Koukouli, M., Balis, D., Lambert, J., Granville, J., and Zehner, C.: Homogenized total ozone data records from the European sensors GOME/ERS‐2, SCIAMACHY/Envisat, and GOME‐2/MetOp‐A, J. Geophys. Res.-Atmos., 119, 1639–1662, https://doi.org/10.1002/2013JD020831, 2014. a, b
Levelt, P., van den Oord, G., Dobber, M., Malkki, A., Visser, H., de Vries, J., Stammes, P., Lundell, J., and Saari, H.: The ozone monitoring instrument, IEEE T. Geosci. Remote, 44, 1093–1101, https://doi.org/10.1109/TGRS.2006.872333, 2006. a
Livesey, N. J., Read, W. G., Wagner, P., Froidevaux, L., Santee, M., Schwartz, M., Lambert, A., Millán Valle, L. F., Pumphrey, H. C., Manney, G., Fuller, R., Jarnot, R., Knosp, B., and Lay, R.: Earth Observing System (EOS), Aura Microwave Limb Sounder (MLS): Version 5.0x Level 2 and 3 data quality and description document, Tech. Rep. JPL D-105336 Rev. B, version 5.0–1.1a, Jet Propulsion Laboratory, California Institute of Technology, https://mls.jpl.nasa.gov/data/v5-0_data_quality_document.pdf (last access: 5 March 2026), 2022. a, b
Lorente, A., Borsdorff, T., Butz, A., Hasekamp, O., aan de Brugh, J., Schneider, A., Wu, L., Hase, F., Kivi, R., Wunch, D., Pollard, D. F., Shiomi, K., Deutscher, N. M., Velazco, V. A., Roehl, C. M., Wennberg, P. O., Warneke, T., and Landgraf, J.: Methane retrieved from TROPOMI: improvement of the data product and validation of the first 2 years of measurements, Atmos. Meas. Tech., 14, 665–684, https://doi.org/10.5194/amt-14-665-2021, 2021. a
Loyola, D. G., Gimeno García, S., Lutz, R., Argyrouli, A., Romahn, F., Spurr, R. J. D., Pedergnana, M., Doicu, A., Molina García, V., and Schüssler, O.: The operational cloud retrieval algorithms from TROPOMI on board Sentinel-5 Precursor, Atmos. Meas. Tech., 11, 409–427, https://doi.org/10.5194/amt-11-409-2018, 2018. a
Marshall, L. R., Schmidt, A., Schurer, A. P., Abraham, N. L., Lücke, L. J., Wilson, R., Anchukaitis, K. J., Hegerl, G. C., Johnson, B., Otto-Bliesner, B. L., Brady, E. C., Khodri, M., and Yoshida, K.: Last-millennium volcanic forcing and climate response using SO2 emissions, Clim. Past, 21, 161–184, https://doi.org/10.5194/cp-21-161-2025, 2025. a
Mastin, L., Guffanti, M., Servranckx, R., Webley, P., Barsotti, S., Dean, K., Durant, A., Ewert, J., Neri, A., Rose, W., Schneider, D., Siebert, L., Stunder, B., Swanson, G., Tupper, A., Volentik, A., and Waythomas, C.: A multidisciplinary effort to assign realistic source parameters to models of volcanic ash-cloud transport and dispersion during eruptions, J. Volcanol.-Geoth. Res., 186, 10–21, https://doi.org/10.1016/j.jvolgeores.2009.01.008, 2009. a
McPeters, R. D.: The atmospheric SO2 budget for Pinatubo derived from Noaa-11 SBUV/2 spectral data, Geophys. Res. Lett., 20, 1971–1974, https://doi.org/10.1029/93GL02360, 1993. a
Mettig, N., Weber, M., Rozanov, A., Arosio, C., Burrows, J. P., Veefkind, P., Thompson, A. M., Querel, R., Leblanc, T., Godin-Beekmann, S., Kivi, R., and Tully, M. B.: Ozone profile retrieval from nadir TROPOMI measurements in the UV range, Atmos. Meas. Tech., 14, 6057–6082, https://doi.org/10.5194/amt-14-6057-2021, 2021. a
Milford, C., Torres, C., Vilches, J., Gossman, A.-K., Weis, F., Suárez-Molina, D., García, O. E., Prats, N., Barreto, Á., García, R. D., Bustos, J. J., Marrero, C. L., Ramos, R., Chinea, N., Boulesteix, T., Taquet, N., Rodríguez, S., López-Darias, J., Sicard, M., Córdoba-Jabonero, C., and Cuevas, E.: Impact of the 2021 La Palma volcanic eruption on air quality: Insights from a multidisciplinary approach, Sci. Total Environ., 869, 161652, https://doi.org/10.1016/j.scitotenv.2023.161652, 2023. a
Munro, R., Lang, R., Klaes, D., Poli, G., Retscher, C., Lindstrot, R., Huckle, R., Lacan, A., Grzegorski, M., Holdak, A., Kokhanovsky, A., Livschitz, J., and Eisinger, M.: The GOME-2 instrument on the Metop series of satellites: instrument design, calibration, and level 1 data processing – an overview, Atmos. Meas. Tech., 9, 1279–1301, https://doi.org/10.5194/amt-9-1279-2016, 2016. a
Nowlan, C. R., Liu, X., Chance, K., Cai, Z., Kurosu, T. P., Lee, C., and Martin, R. V.: Retrievals of sulfur dioxide from the Global Ozone Monitoring Experiment 2 (GOME-2) using an optimal estimation approach: Algorithm and initial validation, J. Geophys. Res., 116, D18301, https://doi.org/10.1029/2011JD015808, 2011. a, b
Pardini, F., Burton, M., de' Michieli Vitturi, M., Corradini, S., Salerno, G., Merucci, L., and Di Grazia, G.: Retrieval and intercomparison of volcanic SO2 injection height and eruption time from satellite maps and ground-based observations, J. Volcanol.-Geoth. Res., 331, 79–91, https://doi.org/10.1016/j.jvolgeores.2016.12.008, 2017. a
Pardini, F., Burton, M., Arzilli, F., La Spina, G., and Polacci, M.: SO2 emissions, plume heights and magmatic processes inferred from satellite data: The 2015 Calbuco eruptions, J. Volcanol.-Geoth. Res., 361, 12–24, https://doi.org/10.1016/j.jvolgeores.2018.08.001, 2018. a
Pumphrey, H. C., Read, W. G., Livesey, N. J., and Yang, K.: Observations of volcanic SO2 from MLS on Aura, Atmos. Meas. Tech., 8, 195–209, https://doi.org/10.5194/amt-8-195-2015, 2015. a
Queißer, M., Burton, M., Theys, N., Pardini, F., Salerno, G., Caltabiano, T., Varnam, M., Esse, B., and Kazahaya, R.: TROPOMI enables high resolution SO2 flux observations from Mt. Etna, Italy, and beyond, Sci. Rep., 9, https://doi.org/10.1038/s41598-018-37807-w, 2019. a
Robock, A.: Volcanic eruptions and climate, Rev. Geophys., 38, 191–219, https://doi.org/10.1029/1998RG000054, 2000. a
Rodgers, C. D.: Inverse methods for atmospheric sounding: theory and practice, no. 2 in Series on atmospheric, oceanic and planetary physics, World Scientific, ISBN 978-981-02-2740-1, 2000. a
Santer, B. D., Bonfils, C., Painter, J. F., Zelinka, M. D., Mears, C., Solomon, S., Schmidt, G. A., Fyfe, J. C., Cole, J. N. S., Nazarenko, L., Taylor, K. E., and Wentz, F. J.: Volcanic contribution to decadal changes in tropospheric temperature, Nat. Geosci., 7, 185–189, https://doi.org/10.1038/ngeo2098, 2014. a
Schmidt, A., Witham, C. S., Theys, N., Richards, N. A. D., Thordarson, T., Szpek, K., Feng, W., Hort, M. C., Woolley, A. M., Jones, A. R., Redington, A. L., Johnson, B. T., Hayward, C. L., and Carslaw, K. S.: Assessing hazards to aviation from sulfur dioxide emitted by explosive Icelandic eruptions, J. Geophys. Res.-Atmos., 119, https://doi.org/10.1002/2014JD022070, 2014. a
Schmidt, A., Leadbetter, S., Theys, N., Carboni, E., Witham, C. S., Stevenson, J. A., Birch, C. E., Thordarson, T., Turnock, S., Barsotti, S., Delaney, L., Feng, W., Grainger, R. G., Hort, M. C., Höskuldsson, Á., Ialongo, I., Ilyinskaya, E., Jóhannsson, T., Kenny, P., Mather, T. A., Richards, N. A. D., and Shepherd, J.: Satellite detection, long‐range transport, and air quality impacts of volcanic sulfur dioxide from the 2014–2015 flood lava eruption at Bárðarbunga (Iceland), J. Geophys. Res.-Atmos., 120, 9739–9757, https://doi.org/10.1002/2015jd023638, 2015. a
Scollo, S., Prestifilippo, M., Pecora, E., Corradini, S., Merucci, L., Spata, G., and Coltelli, M.: Eruption column height estimation of the 2011–2013 Etna lava fountains, Ann. Geophys., 57, 3, https://doi.org/10.4401/ag-6396, 2014. a
Sears, T. M., Thomas, G. E., Carboni, E., A. Smith, A. J., and Grainger, R. G.: SO2 as a possible proxy for volcanic ash in aviation hazard avoidance, J. Geophys. Res.-Atmos., 118, 5698–5709, https://doi.org/10.1002/jgrd.50505, 2013. a
Sennert, S.: Global Volcanism Program|Report on Etna (Italy) – 14 August–20 August 2024, Smithsonian Institution and US Geological Survey, https://volcano.si.edu/ShowReport.cfm?wvar=GVP.WVAR20240814-211060 (last access: 2 May 2025), 2024. a
Serdyuchenko, A., Gorshelev, V., Weber, M., Chehade, W., and Burrows, J. P.: High spectral resolution ozone absorption cross-sections – Part 2: Temperature dependence, Atmos. Meas. Tech., 7, 625–636, https://doi.org/10.5194/amt-7-625-2014, 2014. a, b, c
Solomon, S., Daniel, J. S., Neely, R. R., Vernier, J.-P., Dutton, E. G., and Thomason, L. W.: The Persistently Variable “Background” Stratospheric Aerosol Layer and Global Climate Change, Science, 333, 866–870, https://doi.org/10.1126/science.1206027, 2011. a
Spurr, R. and Christi, M.: The LIDORT and VLIDORT Linearized Scalar and Vector Discrete Ordinate Radiative Transfer Models: Updates in the Last 10 Years, in: Springer Series in Light Scattering, edited by: Kokhanovsky, A., Springer International Publishing, 1–62, ISBN 978-3-030-03444-3, https://doi.org/10.1007/978-3-030-03445-0_1, 2019. a
Spurr, R., Loyola, D., Van Roozendael, M., Lerot, C., Heue, K.-P., and Xu, J.: S5P/TROPOMI Total Ozone ATBD, Tech. Rep. S5P-L2-DLR-ATBD-400A, document for the TROPOMI Total Ozone Column Product, CI-400A-ATBD, Deutsches Zentrum für Luft- und Raumfahrt (DLR) and Royal Belgian Institute for Space Aeronomy (BIRA-IASB), https://sentinels.copernicus.eu/documents/247904/2476257/Sentinel-5P-TROPOMI-ATBD-Total-Ozone/9a153cef-6098-4476-9566-3a6f446bbe20?version=1.2 (last access: 28 March 2025), 2018. a, b
Stevenson, D. S., Johnson, C. E., Collins, W. J., and Derwent, R. G.: The tropospheric sulphur cycle and the role of volcanic SO2, Geol. Soc. Lond. Spec. Publ., 213, 295–305, https://doi.org/10.1144/gsl.sp.2003.213.01.18, 2003. a
Theys, N., Campion, R., Clarisse, L., Brenot, H., van Gent, J., Dils, B., Corradini, S., Merucci, L., Coheur, P.-F., Van Roozendael, M., Hurtmans, D., Clerbaux, C., Tait, S., and Ferrucci, F.: Volcanic SO2 fluxes derived from satellite data: a survey using OMI, GOME-2, IASI and MODIS, Atmos. Chem. Phys., 13, 5945–5968, https://doi.org/10.5194/acp-13-5945-2013, 2013. a
Theys, N., De Smedt, I., Yu, H., Danckaert, T., van Gent, J., Hörmann, C., Wagner, T., Hedelt, P., Bauer, H., Romahn, F., Pedergnana, M., Loyola, D., and Van Roozendael, M.: Sulfur dioxide retrievals from TROPOMI onboard Sentinel-5 Precursor: algorithm theoretical basis, Atmos. Meas. Tech., 10, 119–153, https://doi.org/10.5194/amt-10-119-2017, 2017. a
Theys, N., Hedelt, P., De Smedt, I., Lerot, C., Yu, H., Vlietinck, J., Pedergnana, M., Arellano, S., Galle, B., Fernandez, D., Carlito, C. J. M., Barrington, C., Taisne, B., Delgado-Granados, H., Loyola, D., and Van Roozendael, M.: Global monitoring of volcanic SO2 degassing with unprecedented resolution from TROPOMI onboard Sentinel-5 Precursor, Sci. Rep., 9, 2643, https://doi.org/10.1038/s41598-019-39279-y, 2019. a
Theys, N., Fioletov, V., Li, C., De Smedt, I., Lerot, C., McLinden, C., Krotkov, N., Griffin, D., Clarisse, L., Hedelt, P., Loyola, D., Wagner, T., Kumar, V., Innes, A., Ribas, R., Hendrick, F., Vlietinck, J., Brenot, H., and Van Roozendael, M.: A sulfur dioxide Covariance-Based Retrieval Algorithm (COBRA): application to TROPOMI reveals new emission sources, Atmos. Chem. Phys., 21, 16727–16744, https://doi.org/10.5194/acp-21-16727-2021, 2021. a, b, c, d
Theys, N., Lerot, C., Brenot, H., van Gent, J., De Smedt, I., Clarisse, L., Burton, M., Varnam, M., Hayer, C., Esse, B., and Van Roozendael, M.: Improved retrieval of SO2 plume height from TROPOMI using an iterative Covariance-Based Retrieval Algorithm, Atmos. Meas. Tech., 15, 4801–4817, https://doi.org/10.5194/amt-15-4801-2022, 2022. a, b, c, d, e, f, g, h, i, j
Thomas, H. E. and Prata, A. J.: Sulphur dioxide as a volcanic ash proxy during the April–May 2010 eruption of Eyjafjallajökull Volcano, Iceland, Atmos. Chem. Phys., 11, 6871–6880, https://doi.org/10.5194/acp-11-6871-2011, 2011. a
Torres, O., Jethva, H., Ahn, C., Jaross, G., and Loyola, D. G.: TROPOMI aerosol products: evaluation and observations of synoptic-scale carbonaceous aerosol plumes during 2018–2020, Atmos. Meas. Tech., 13, 6789–6806, https://doi.org/10.5194/amt-13-6789-2020, 2020. a
Tortini, R., van Manen, S., Parkes, B., and Carn, S.: The impact of persistent volcanic degassing on vegetation: A case study at Turrialba volcano, Costa Rica, Int. J. Appl. Earth Obs. Geoinf., 59, 92–103, https://doi.org/10.1016/j.jag.2017.03.002, 2017. a
van Geffen, J., Boersma, K. F., Eskes, H., Sneep, M., ter Linden, M., Zara, M., and Veefkind, J. P.: S5P TROPOMI NO2 slant column retrieval: method, stability, uncertainties and comparisons with OMI, Atmos. Meas. Tech., 13, 1315–1335, https://doi.org/10.5194/amt-13-1315-2020, 2020. a
Veefkind, J. P., Aben, I., McMullan, K., Förster, H., de Vries, J., Otter, G., Claas, J., Eskes, H., de Haan, J., Kleipool, Q., van Weele, M., Hasekamp, O., Hoogeveen, R., Landgraf, J., Snel, R., Tol, P., Ingmann, P., Voors, R., Kruizinga, B., Vink, R., Visser, H., and Levelt, P. F.: TROPOMI on the ESA Sentinel-5 Precursor: A GMES mission for global observations of the atmospheric composition for climate, air quality and ozone layer applications, Remote Sens. Environ., 120, 70–83, https://doi.org/10.1016/j.rse.2011.09.027, 2012. a, b, c
Veefkind, J. P., Keppens, A., and de Haan, J.: TROPOMI ATBD Ozone Profile, Tech. Rep. S5P-KNMI-L2-0004-RP, CI-7340-ATBD, Royal Netherlands Meteorological Institute, https://sentinels.copernicus.eu/documents/247904/2476257/Sentinel-5P-TROPOMI-ATBD-Ozone-Profile.pdf (last access: 7 May 2025), 2021. a
Vernier, J.-P., Aubry, T. J., Timmreck, C., Schmidt, A., Clarisse, L., Prata, F., Theys, N., Prata, A. T., Mann, G., Choi, H., Carn, S., Rigby, R., Loughlin, S. C., and Stevenson, J. A.: The 2019 Raikoke eruption as a testbed used by the Volcano Response group for rapid assessment of volcanic atmospheric impacts, Atmos. Chem. Phys., 24, 5765–5782, https://doi.org/10.5194/acp-24-5765-2024, 2024. a
Waters, J., Froidevaux, L., Harwood, R., Jarnot, R., Pickett, H., Read, W., Siegel, P., Cofield, R., Filipiak, M., Flower, D., Holden, J., Lau, G., Livesey, N., Manney, G., Pumphrey, H., Santee, M., Wu, D., Cuddy, D., Lay, R., Loo, M., Perun, V., Schwartz, M., Stek, P., Thurstans, R., Boyles, M., Chandra, K., Chavez, M., Chen, G.-S., Chudasama, B., Dodge, R., Fuller, R., Girard, M., Jiang, J., Jiang, Y., Knosp, B., LaBelle, R., Lam, J., Lee, K., Miller, D., Oswald, J., Patel, N., Pukala, D., Quintero, O., Scaff, D., Van Snyder, W., Tope, M., Wagner, P., and Walch, M.: The Earth observing system microwave limb sounder (EOS MLS) on the aura Satellite, IEEE T. Geosci. Remote, 44, 1075–1092, https://doi.org/10.1109/TGRS.2006.873771, 2006. a
Weiser, F., Baumann, E., Jentsch, A., Medina, F. M., Lu, M., Nogales, M., and Beierkuhnlein, C.: Impact of Volcanic Sulfur Emissions on the Pine Forest of La Palma, Spain, Forests, 13, 299, https://doi.org/10.3390/f13020299, 2022. a
Yang, K., Liu, X., Bhartia, P. K., Krotkov, N. A., Carn, S. A., Hughes, E. J., Krueger, A. J., Spurr, R. J. D., and Trahan, S. G.: Direct retrieval of sulfur dioxide amount and altitude from spaceborne hyperspectral UV measurements: Theory and application, J. Geophys. Res.-Atmos., 115, 2010JD013982, https://doi.org/10.1029/2010JD013982, 2010. a, b, c, d, e, f
Zavyalov, V. V., Fish, C. S., Bingham, G. E., Esplin, M., Greenman, M., Scott, D., and Han, Y.: Preflight assessment of the cross-track infrared sounder (CrIS) performance, in: SPIE Proceedings, edited by: Meynart, R., Neeck, S. P., and Shimoda, H., SPIE, https://doi.org/10.1117/12.897674, 2011. a
Zhuo, Z., Fuglestvedt, H. F., Toohey, M., and Krüger, K.: Initial atmospheric conditions control transport of volcanic volatiles, forcing and impacts, Atmos. Chem. Phys., 24, 6233–6249, https://doi.org/10.5194/acp-24-6233-2024, 2024. a
- Abstract
- Introduction
- TROPOMI
- SO2 retrievals and sensitivity analyses
- Application of LUT-COBRA to TROPOMI measurements
- Conclusions
- Appendix A: Sensitivity analyses of BD2 LUT-COBRA
- Appendix B: Air mass factor (AMF) calculation and altitude-dependence
- Appendix C: SO2 absorption cross section
- Data availability
- Author contributions
- Competing interests
- Disclaimer
- Acknowledgements
- Financial support
- Review statement
- References