the Creative Commons Attribution 4.0 License.
the Creative Commons Attribution 4.0 License.
 | 17 Mar 2026
On the representativeness of the ground-based lidar observations for satellite calibration/validation – the example of the archipelago of Cabo Verde
Konstantinos Rizos
Dimitri Trapon
Ronny Engelmann
Dietrich Althausen
Eleni Marinou
Peristera Paschou
Julian Hofer
Emmanouil Proestakis
Henriette Gebauer
Annett Skupin
Albert Ansmann
Thorsten Fehr
Timon Hummel
Rob Koopman
Vassilis Amiridis
Ulla Wandinger
Holger Baars
Ground-based lidar stations play a vital role in the validation of spaceborne lidar products. While ground-based measurements have a high temporal resolution, they have limited spatial coverage, which potentially imposes implications for the Calibration and Validation (Cal/Val) of the satellite products. Therefore, in this study, we assess the representativeness of a remote ground-based ACTRIS (Aerosol, Clouds, and Trace Gases Research Infrastructure) station, in Mindelo, Cabo Verde by utilizing the continuous observations of a ground-based PollyNET multiwavelength polarization Raman lidar. This station was selected since Cabo Verde has been a key location for the validation of two recent Earth Explorer missions of the European Space Agency (ESA), namely Aeolus and the Earth Cloud, Aerosol and Radiation Explorer (EarthCARE). The islands are located in the Atlantic Ocean, in the outflow region of the African continent with frequent dust outbreaks, but also smoke advection and, thus, along with the local (marine) boundary layer provide an excellent atmospheric laboratory. Continuous, vertically-resolved aerosol measurements are being conducted with the state-of-the-art multiwavelength polarization Raman lidar PollyXT at Mindelo since June 2021. Based on these observations and in combination with the LIdar climatology of Vertical Aerosol Structure for space-based lidar simulation studie (LIVAS) products available at different radii around Mindelo, a statistical analysis of the optical properties was performed to evaluate the representativeness of the station in the context of aerosol profiling Cal/Val activities. Additionally, three case studies, focusing on different distances from the ground-based station, have been closely examined for a more complete and detailed comparison. Our study results indicate that overall the ground-based station in Mindelo can be considered conditionally representative. According to the monthly analysis, at altitudes where the lofted aerosol (dust) layers occur, lidar observations were very representative for radii up to 300 km around the island, while the boundary-layer characteristics varied. Case studies confirmed the long-term results and revealed that lidar observations of lofted aerosol layers can be representative for radii up to 100 km around Mindelo and at the same time highlighted the importance of spatiotemporal homogeneity of the target. From our findings and especially for the Cabo Verde region, we conclude that it is better to use monthly averaged aerosol profiles for the validation of spaceborne profiles over long times rather than using single overpasses, as representativeness cannot be guaranteed for the latter without additional measures. Thus, using fixed radii around a certain ground site (as e.g., the frequently used 100 km) for validation activities seems to be inappropriate for profile-to-profile comparison without any further considerations. However, we show in our case studies that if representativeness can be guaranteed, also single-profile validation is possible and has its own valuable potential. Additionally, the proposed study can serve as a calibration/validation tool for the remote sensing facilities of the European Aerosol Research Lidar Network (EARLINET).
- Article
(18385 KB) - Full-text XML
- BibTeX
- EndNote


The Calibration and Validation (Cal/Val) activities of spaceborne laser profilers for aerosol and cloud products are essential and, often, quite challenging. In particular, the validation of the calibrated and geolocated measurements (usually referred to as Level 1 data) and of the geophysical parameters related to, e.g., aerosol or clouds (Level 2 data) is crucial to ensure a high-quality dataset from any spaceborne platform. Some commonly encountered challenges are the spatiotemporal scales of the targeted features, the resolution of the spaceborne products and the co-location of the spaceborne and the suborbital instrumentation (Amiridis et al., 2025, Chap. 2).
The Cloud-Aerosol Lidar with Orthogonal Polarization (CALIOP) was an elastic-backscatter lidar (532 and 1064 nm) onboard National Aeronautics and Space Administration's (NASA) Cloud-Aerosol Lidar and Infrared Pathfinder Satellite Observations (CALIPSO) satellite, which has provided information on the vertical distribution and the optical and microphysical properties of aerosols and clouds (Winker et al., 2009) from 2006 until 2023. The validation of the CALIOP products was of great importance for the production of a high-quality dataset, especially since CALIOP was not able to perform direct extinction measurements. The lidar ratio (extinction-to-backscatter ratio) typically had to be assumed to enable the retrieval of the backscatter and extinction coefficients from the attenuated backscatter signals. An aerosol typing scheme, tailored to the CALIOP needs was developed (Omar et al., 2005, 2009; Kim et al., 2018; Tackett et al., 2023) and, regardless of the several quality control procedures in place (Winker et al., 2009), the accuracy of the extinction retrievals was dependent on this typing scheme. Because of this, validation of CALIOP's products was particularly necessary and it was performed by means of direct comparisons with ground-based and airborne measurements.
McGill et al. (2007) performed an initial validation of the CALIPSO Level 1 and 2 products (Hostetler et al., 2006; Winker et al., 2006) by comparing the spaceborne lidar data with data from the Cloud Physics Lidar (CPL), a mobile lidar operating at 1064, 532 and 355 nm onboard the high-altitude NASA ER-2 aircraft, following the suborbital track of CALIPSO. Results showed that the CALIPSO-derived attenuated backscatter profiles agreed well with the ones from CPL, thus confirming that CALIOP was well calibrated and that the algorithms were performing as expected. Good agreement was found for other CALIPSO products, including aerosol layer detection. Throughout the mission's lifetime, extensive collocated underflights (see https://www-air.larc.nasa.gov/missions/calipso-hsrl-underflights/index.html, last access: 17 February 2026) of the NASA Langley Research Center airborne high-spectral-resolution lidars (HSRLs) took place to assess CALIOP's calibration accuracy (Powell et al., 2009; Rogers et al., 2011; Kar et al., 2018; Vaughan et al., 2019), aerosol classification and lidar ratio algorithm (Omar et al., 2009; Burton et al., 2013), CALIOP aerosol lidar ratio and aerosol optical depth (AOD) retrievals (Josset et al., 2011; Rogers et al., 2014; Ferrare et al., 2023; Ryan et al., 2024) and CALIOP retrievals of aerosol extinction profiles (McPherson et al., 2010; Burton et al., 2010; McPherson and Reagan, 2016; Painemal et al., 2019).
Ground-based systems were also used as part of the validation efforts for CALIPSO, as shown in Mamouri et al. (2009), where the CALIPSO Level 1 attenuated backscatter coefficient profiles were validated using co-located observations performed with a ground-based lidar in Athens, Greece. Wu et al. (2011) performed ground-based lidar measurements in Hefei and the measured attenuated backscatter (at 532 and 1064 nm) and volume depolarization ratio profiles (532 nm) were compared with the ones acquired by CALIPSO. Both studies added valuable information regarding the quality of the CALIPSO products. In addition, ground-based lidar networks such as the European Aerosol Research Lidar Network (EARLINET; Pappalardo et al., 2014) contributed to the Cal/Val activities through coordinated measurements (Mona et al., 2009; Pappalardo et al., 2010; Papagiannopoulos et al., 2016).
Aeolus, equipped with the 355 nm HSRL Atmospheric LAser Doppler INstrument (ALADIN), was the first spaceborne Doppler wind lidar (Stoffelen et al., 2006). The mission was launched in 2018 by the European Space Agency (ESA) and within a lifetime of almost five years, ALADIN was established as the first spaceborne lidar able to directly measure extinction profiles and aerosol optical properties as spin-off products (Flament et al., 2021; Baars et al., 2021). Within the framework of the Aeolus Cal/Val, the Joint Aeolus Tropical Atlantic Campaign (JATAC) was organized by ESA and NASA. The campaign comprised of several components, deployed at Cabo Verde (at two-month phases, June and September of 2021 and 2022) and at the U.S. Virgin Islands (2021). Ground-based, aircraft and balloon measurements were conducted, targeting different objectives, such as the assessment of the quality of the Aeolus products (e.g., Lux et al., 2022; Witschas et al., 2022b) and the validation of the several wind- and aerosol-related products (e.g., Borne et al., 2024; Paschou et al., 2025; Trapon et al., 2025). Independent validation efforts were also performed at various locations around the globe, focusing mainly (but not only) on wind products, which compared to aerosol-related products are a more straightforward validation target (e.g., Witschas et al., 2022a; Abril-Gago et al., 2023; Baars et al., 2023; Gkikas et al., 2023; Ratynski et al., 2023).
Apart from the validation of Aeolus data, JATAC primar goals included the study of tropical storms and cyclone formation in the Tropical Atlantic, the study of the interaction between dust particles, wind and clouds, as well as the preparation for future Earth Explorer missions, such as EarthCARE (Earth Cloud, Aerosol and Radiation Explorer; Wehr et al., 2023). In this study, focus is given on the ground-based component of JATAC, which involved several institutes including the Leibniz Institute for Tropospheric Research (TROPOS), the National Observatory of Athens (NOA), the National Institute for Research and Development for Optoelectronics (INOE), and the National Research Council of Italy – IMAA (CNR-IMAA). This ground-based component, named ASKOS (Marinou et al., 2023), was conducted in Mindelo, on the island of São Vicente, Cabo Verde and the operations included remote-sensing measurements from a complete aerosol and cloud remote sensing facility of ACTRIS (Aerosol, Clouds, and Trace Gases Research Infrastructure; Laj et al., 2024) and in situ measurements from a light aircraft and an unmanned aerial vehicle (UAV).
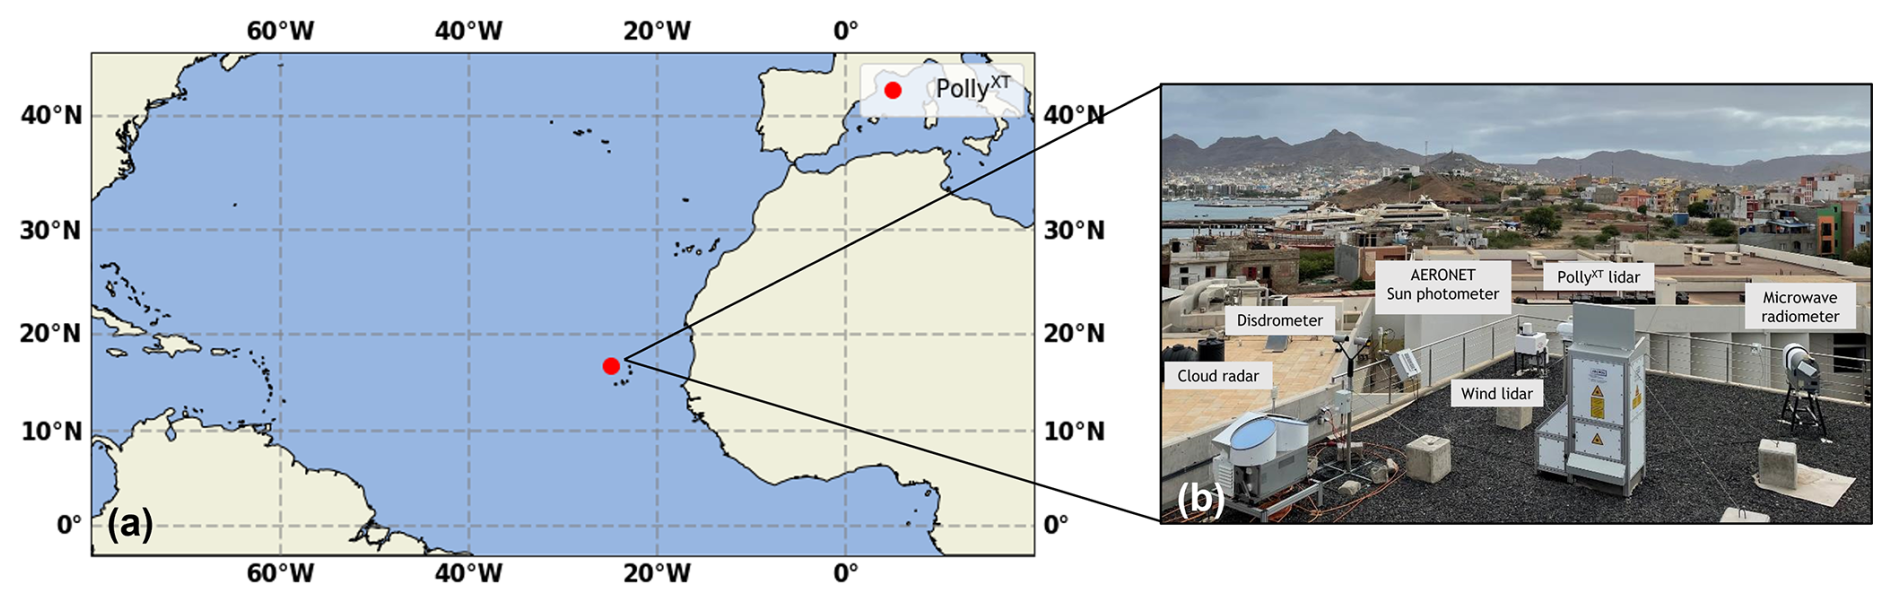
Figure 1(a) Location of the PollyXT lidar system (red dot) and (b) complete instrumentation of the ACTRIS station at OSCM, Mindelo, Cabo Verde (image source: Holger Baars).
The ACTRIS facility located at the Ocean Science Center Mindelo (OSCM) and the instrumentation which was available during the ASKOS campaign are both depicted in Fig. 1. The multiwavelength polarization Raman lidar PollyXT (Baars et al., 2016; Engelmann et al., 2016) has been measuring the vertical distribution and optical properties of aerosol continuously since June 2021. The rest of the instrumentation included a scanning Doppler wind lidar (HALO), a microwave radiometer, a cloud radar (part of ESA's 94 GHz Miniature Network for EarthCARE Reference Measurements – FRM4Radar), a disdrometer, and a sun photometer (part of the Aerosol Robotic Network- AERONET; Holben et al., 1998). ESA's reference lidar for the Cal/Val of Aeolus, eVe (Paschou et al., 2022), was also measuring during the intensive ASKOS months (not part of the ACTRIS facility). The complete ASKOS dataset (Amiridis et al., 2023), which includes data from multiple instruments optimized for a synergistic usage, has been used mainly for the validation of the aerosol products derived from Aeolus (Paschou et al., 2025; Rizos et al., 2026), but also for wind data assimilation (Georgiou et al., 2023).
JATAC and ASKOS did not only serve as a Cal/Val experiment for Aeolus and supported scientific advances on the interaction of wind, dust and clouds, but provided valuable lessons for ESA's next atmospheric mission, EarthCARE, which is a joint mission of ESA and the Japanese Aerospace Exploration Agency (JAXA) launched in May 2024. EarthCARE's highly sophisticated and complex payload includes an ATmospheric LIDar (ATLID), a Cloud Profiling Radar (CPR), a Multi-Spectral Imager (MSI) and a Broad-Band Radiometer (BBR; Illingworth et al., 2015; Wehr et al., 2023). Optimized for synergistic usage, products include, among others, profiles of clouds, aerosols and precipitation along with co-located radiative flux measurements (Wehr et al., 2023; Eisinger et al., 2024).
Shortly after EarthCARE's launch, from 10 August to 30 September 2024, several campaigns took place on the Cabo Verde islands, Barbados and all across the Atlantic Ocean, under the umbrella of the project titled Organized Convection and EarthCARE Studies over the Tropical Atlantic (ORCESTRA, https://orcestra-campaign.org/orcestra.html, last access: 17 February 2026). TROPOS joined ORCESTRA, with a dedicated sub-campaign named CLARINET (CLoud and Aerosol Remote sensing for EarThcare, https://orcestra-campaign.org/clarinet.html, last access: 17 February 2026). The observations collected from the ACTRIS remote sensing facility supported other ORCESTRA sub-campaigns and are currently analysed and used to validate EarthCARE measurements.
Regardless of the several campaigns designed to assist and organize the different Cal/Val activities from the community, only the study of Gimmestad et al. (2017) has attempted to assess the degree to which ground-based observations can accurately reflect the atmospheric conditions over a larger scale (e.g., over several kilometers away). Spatial representativeness is especially important for aerosol that can exhibit high spatial heterogeneity and, depending on the aerosol type and meteorology, can have short residence time in the atmosphere (Martell and Moore, 1974; Giorgi and Chameides, 1986).
The profound importance of the Cabo Verde islands on Cal/Val activities, due to the islands being located in the outflow region of the African continent, along with the open issue of spatial representativeness motivated this study. In the following section, the data used to assess the representativeness of the ground-based PollyXT measurements are presented, in addition to the study domain and the methodology. The main findings of the study, i.e., the monthly comparisons between the ground-based and spaceborne optical profiles are presented in Sect. 3. In the same section, three case studies are analysed to examine in detail the issue of spatial inhomogeneity and to reveal potential averaging-induced biases. The concluding remarks and an outlook are presented in Sect. 4.
2.1 Ground-based and spaceborne datasets
2.1.1 PollyXT
The aerosol remote sensing component (Fig. 1) of the ACTRIS Observational Platform CVAO (Cabo Verde Atmospheric Observatory) includes an automated state-of-the-art PollyXT multiwavelength polarization Raman lidar (Baars et al., 2016; Engelmann et al., 2016) among other instruments. As every PollyXT lidar, this lidar system is also part of the voluntary, scientific, global lidar network PollyNET (https://polly.tropos.de/, last access: 17 February 2026).
PollyXT utilizes a Nd:YAG laser which emits light at three different wavelengths, 355, 532 and 1064 nm, while the receiver consists of 15 channels, which enables measurements of elastic (355, 532 and 1064 nm) and inelastic (Raman) backscatter (387, 607 and 1058 nm from nitrogen for aerosols and 407 nm from water vapor) and the depolarization state of the backscatter light (at 355, 532 and 1064 nm). A near-range telescope allows the detection of backscattered light at 355, 387, 532 and 607 nm from about 60–80 m above ground level (a.g.l.). The vertical resolution of the acquired data is 7.5 m and the temporal resolution is 30 s (Engelmann et al., 2016). The multiwavelength capabilities of the PollyXT lidar systems allow for comparisons with all spaceborne lidars (i.e., CALIOP, ALADIN, ATLID). An in-depth description of the specific lidar system located at Mindelo, together with a discussion of the uncertainties associated with the aerosol optical properties is provided in Gebauer et al. (2024).
The vertically-resolved aerosol optical properties are derived automatically by the PollyNET Processing Chain (PPC; Klamt et al., 2024) for both daytime and nighttime measurements using both the Raman and Klett methodologies. This automatic lidar calibration and processing tool, tailored for the PollyNET lidar systems, provides among others vertical profiles of optical properties in near-real-time (NRT). Quicklooks of NRT products can be found at https://polly.tropos.de/.
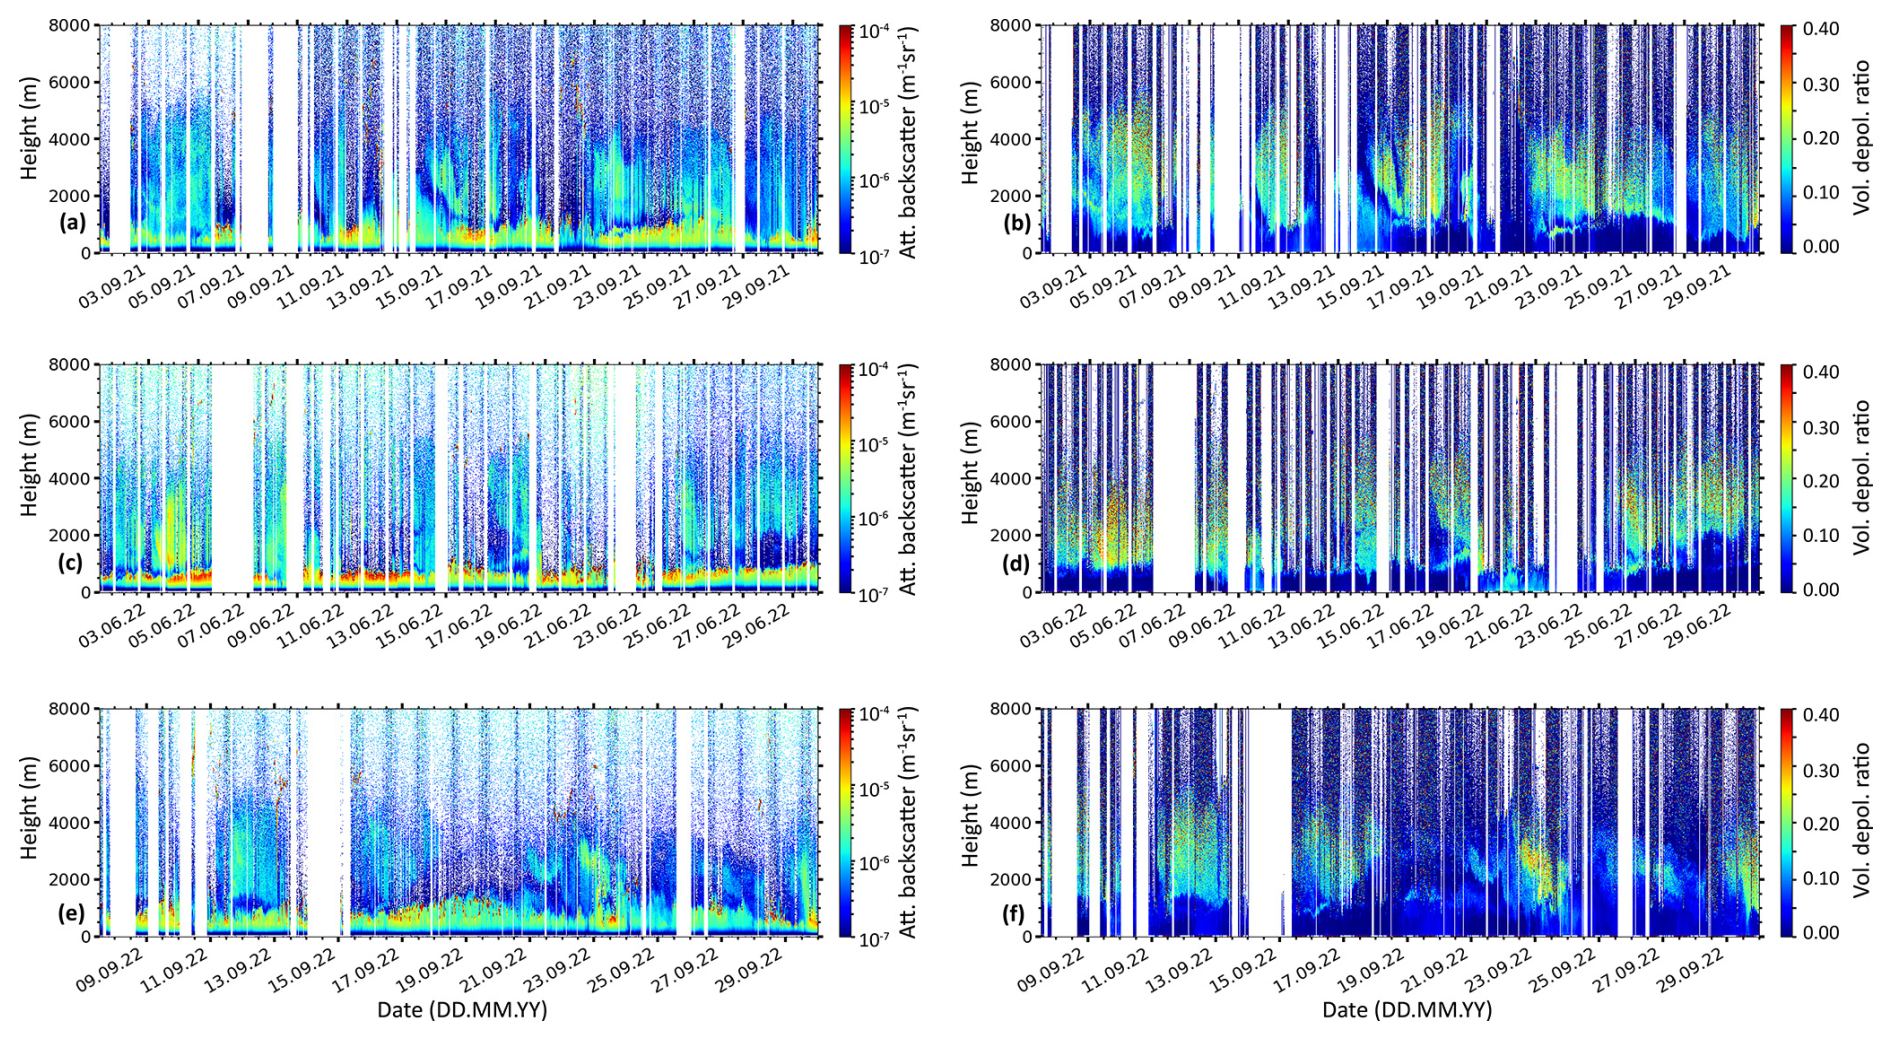
Figure 2Overview of the range-corrected signal at 1064 nm (a, c, e) and volume depolarization ratio at 532 nm (b, d, f) as retrieved from the PollyXT lidar during the ASKOS operations in September 2021 (a, b), June 2022 (c, d), and September 2022 (e, f). No atmospheric data are available during regular depolarization calibration periods, instrument maintenance and during summer daily between 12:30 and 15:30 UTC, due to the location of the instrument with respect to the solar zenith angle (white gaps).
The lidar data considered in this study were collected continuously during the intense campaign periods of ASKOS in 2021 and 2022 in Mindelo, Cabo Verde. Figure 2 shows the aerosol-related PollyXT measurements during the ASKOS intensive measurement periods, which are September 2021, June 2022 and September 2022. June 2021 is not considered due to the fact that the instruments were being set up only towards the end of the month because of COVID-19 restrictions at this time, leading to limited measurement availability. By combining the information from the attenuated backscatter signals (Fig. 2a, c, e) with the volume depolarization ratio (Fig. 2b, d, f), the aerosol conditions above Mindelo can be quickly assessed. In all three periods, lofted aerosol layers occurring at altitudes up to almost 6 km were frequently observed. The elevated attenuated backscatter and volume depolarization ratio values are indicative for non-spherical scatterers, i.e., desert dust aerosol. Below the lofted dust layers, a marine boundary layer (MBL) was extending up to altitudes of approximately 1 km. The MBL is assumed to be mostly dust-free, since the observed depolarization ratio is low, indicating the presence of non-depolarizing spherical particles. The recent study of Shrestha et al. (2026) however, suggests that desert dust is internally mixed with sea salt at lower, humid altitudes within the MBL, resulting in lower depolarization ratios. To explore this possibility we would need to derive color ratios from the multiwavelength PollyXT measurements, which is out of the scope of this study. The presence of liquid-water and mixed-phase clouds within the MBL was rather frequent during all three months, as indicated by the high values of the attenuated backscatter coefficient and the complete attenuation of the signal above the cloud base (Fig. 2a, c, e).
In September 2021, three periods with different atmospheric conditions are clearly visible (Fig. 2a, b). Between the 8 and 13 September 2021, a very homogeneous dust layering was observed at altitudes up to 5.5 km. During the period between the 14 and 18 September, complex horizontal and vertical dust structures were observed, accompanied with high AOD values (500 nm, not shown here). These layers contained aerosol mixtures of dust and pollution. From 20 September onwards until the end of September 2021, the atmospheric conditions at Mindelo were influenced by the volcanic eruption of Cumbre Vieja at La Palma, Canary Islands, Spain (Gebauer et al., 2024). In the sulfate-dominated planetary boundary layer (PBL), the particle extinction coefficient and lidar ratio were particularly high.
As anticipated, several dust events were observed during both months of the ASKOS 2022 (June and September), which have been also investigated in terms of optical properties in Gebauer et al. (2026). The 500 nm AOD during those events was high, reaching values up to 0.7, while during the last dust event of September 2022 (21–25 September) the AOD reached values up to 1.
2.1.2 LIVAS
The LIdar climatology of Vertical Aerosol Structure for space-based lidar simulation studies (LIVAS) is a Climate Data Record (CDR) of global, 3-D, multiwavelength aerosol and cloud optical properties (Amiridis et al., 2013, 2015; Marinou et al., 2017) funded by ESA. The LIVAS database is developed based on CALIPSO observations at 532 and 1064 nm and includes the wavelength-converted aerosol optical properties from 532 nm to the LIVAS wavelengths, i.e., 355, 1570 and 2050 nm. The spectral conversion is performed by utilizing the backscatter- and extinction-related Ångström exponent (Å, either ground-based derived from EARLINET (Pappalardo et al., 2014), or from several optical models; see Table 2 of Amiridis et al., 2015), a quantity that is aerosol-type-dependent (Floutsi et al., 2023). LIVAS products include the pure dust and total-aerosol backscatter and extinction coefficients (at several wavelengths), as well as the particle linear depolarization ratio at different vertical smoothing lengths. The mass concentration of pure dust is also provided. The well-established LIVAS products have been used in several studies, facilitating the evaluation of climate and aerosol models (Tsikerdekis et al., 2017; Drakaki et al., 2022; Ryder et al., 2024).
The LIVAS dataset used in this study has been derived based on the CALIPSO Level 2 (L2), version 4.5 profiles from June 2006 to June 2023. Mean profiles of aerosol properties have been calculated considering different radii from the ACTRIS ground-based station in Mindelo. More details on the study region are given in Sect. 2.2. The resulting LIVAS dataset is provided with a vertical resolution of 60 m for the atmospheric height range between the surface and 20 km.
2.2 Methodology
To assess the degree at which the PollyXT observations at Mindelo can be considered representative for Cal/Val purposes in the region of Cabo Verde, a comparison of the PollyXT and the LIVAS-derived 532 nm backscatter coefficient profiles was performed. First, a study domain had to be selected, which is shown in Fig. 3. It is defined by concentric circles of radii ranging from 20 to 300 km with an incremental step of 20 km from the location of the PollyXT lidar in Mindelo (indicated by a red dot in Fig. 3). The radii were selected such as to cover different satellite overpass scenarios, ranging from a very close overpass (radius less than 20 km) to a rather distant overpass (radius greater than 100 and up to 300 km). Additionally, a maximum radius of 300 km was chosen as to include the southernmost islands of the archipelago (Sotavento Islands).
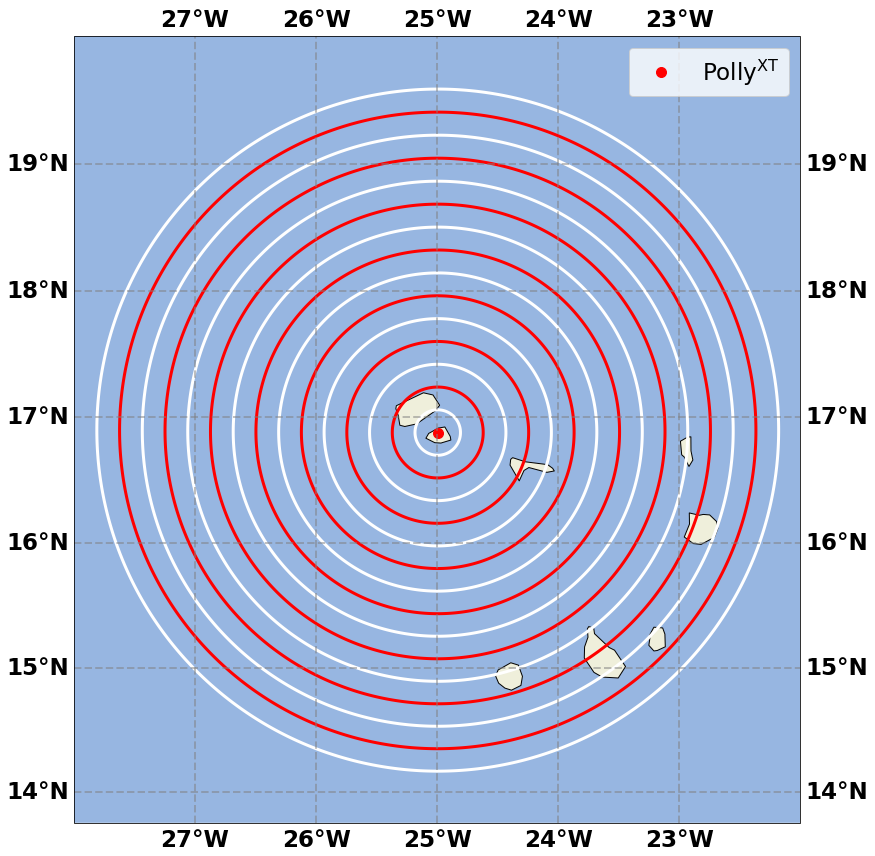
Figure 3Study domain, including the location of the ACTRIS ground-based station in Mindelo, Cabo Verde (red dot). The radii around the station range from 20 to 300 km, with an incremental step of 20 km.
Second, both datasets were prepared for the comparison. For each ASKOS month, all available automatically-derived PollyXT cloud-free particle backscatter coefficient profiles at 532 nm (only Raman retrievals were considered, mostly corresponding to nighttime measurements) were collected and averaged, resulting in a single monthly-averaged height-resolved aerosol-only profile. Note that therein the particle backscatter coefficient is subsequently referred to as backscatter. Similarly for LIVAS, all CALIPSO overpasses that were within the study domain were automatically aggregated in the LIVAS dataset (see also Sect. 2.1). Then, monthly-mean profiles of the 532 nm backscatter coefficient were calculated taking into consideration all the data within the radii around the ground-based station. It should be noted that the number of CALIPSO overpasses is not the same as the number of profiles examined for a given LIVAS grid cell, since an overpass contains multiple profiles.
To prove that the averaging performed in the aforementioned backscatter coefficient profiles from both datasets is not introducing any biases in our study, three case studies with overpasses at different distances from the ground-based station and varying atmospheric conditions have been analysed and are presented in detail below. The case studies were specifically selected to explore the impact of the vertical and horizontal variability of the target.
2.3 Air mass source attribution
The Hybrid Single-Particle Lagrangian Integrated Trajectory model (HYSPLIT; Stein et al., 2015; HYSPLIT, 2026) with meteorological input from the Global Data Assimilation System (GDAS; GDAS, 2026) in 1° spatial resolution, provided by the US National Weather Service's National Centers for Environmental Prediction (NCEP), was used to identify the origin of the air masses that were observed above Mindelo during the ASKOS intensive periods. For each month, two 168 h (i.e., 7 d) backward trajectories were calculated per day (at 06:00 and 18:00 UTC) arriving at the Mindelo station at an altitude of 3 km a.g.l. The altitude was chosen since, based on visual inspection of the observations of Fig. 2, in most cases it coincides with the center of the lofted aerosol layers and at the same time captures lofted layers that did not reach much higher altitudes. The choice of the 3 km altitude is further supported by the study of Gebauer et al. (2026), which, among others, examined the temporal evolution of the vertical extent of the lofted aerosol layers at the same ground-based station and found that the average center of the lofted aerosol layers is around 2.9 km (for the period July 2021 to August 2023). A cluster analysis was then performed on a monthly basis, as shown in Fig. 4. The analysis was performed for 3, 4 and 5 clusters, however, only the results based on 3 classes are shown here, as this number of clusters was found to represent the main sources of the air masses sufficiently.
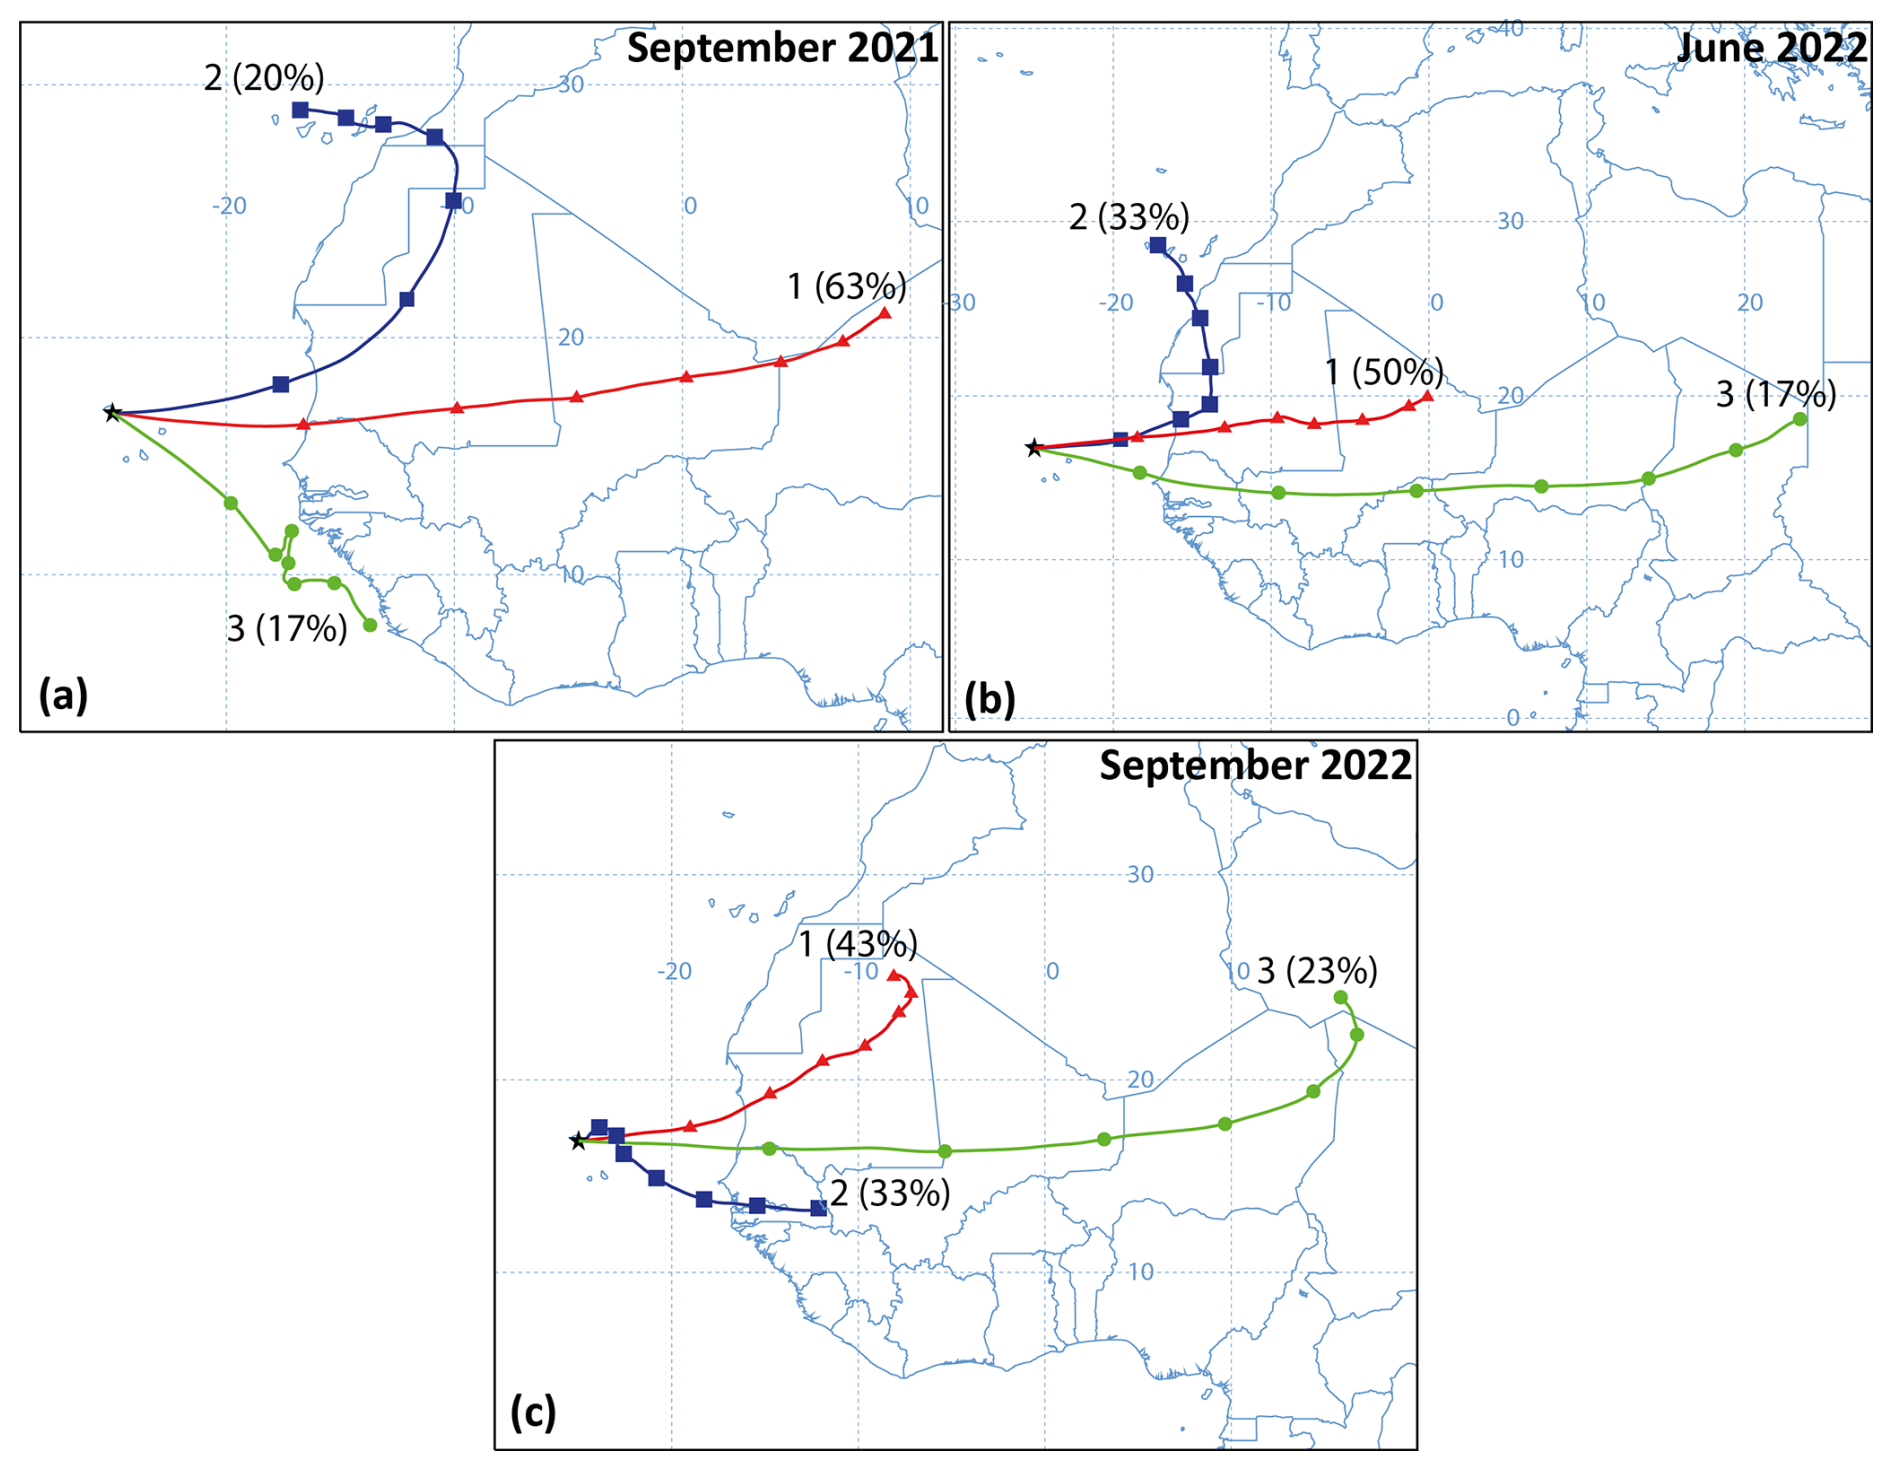
Figure 4HYSPLIT cluster analysis for September 2021 (a), June 2022 (b) and September 2022 (c) based on daily 168 h backward trajectories arriving at Mindelo (black star) at 3 km altitude. The cluster number, along with the percentage of the mean trajectories is indicated.
The mean trajectories (expressed in %) of each cluster are shown in Fig. 4 for September 2021, June 2022 and September 2022 (Fig. 4a, b and c, respectively). During September 2021 (Fig. 4a), the majority of the air masses originated from Western Africa (63 %), a known source of mineral dust and biomass-burning aerosol (Tesche et al., 2009). The second most-dominant air mass cluster originated from North Africa (20 %) and crossed parts of Western Africa. A small fraction (17 %) of the air masses arriving at Mindelo in September 2021 originated from the North Atlantic Ocean coastline of Sierra Leone, Guinea and Guinea-Bissau.
The cluster analysis of the backward trajectories revealed a similar pattern for June and September 2022 (Fig. 4b and c, respectively). Most of the air masses originated from Western Africa (50 % and 43 % for the months of June and September, respectively).
The observations of the lofted aerosol layers from PollyXT (Fig. 2) in combination with the backtrajectory information revealed that the air masses were mostly directly advected from Western Africa, suggest that the observed aerosol particles were either pure dust or a mixture of dust with biomass-burning and sea-salt particles.
3.1 Long-term optical profiles from LIVAS from 2006 to 2023
Over the course of 17 years, from June 2006 to June 2023, a total number of 232 909 CALIPSO profiles were acquired within a radius of 300 km from Mindelo. Less than half of the aforementioned profiles were flagged as cloud-free (approximately 46 %, i.e., 108 034 profiles). The exact number of available profiles per radius (total and cloud-free) is given in Table A1.
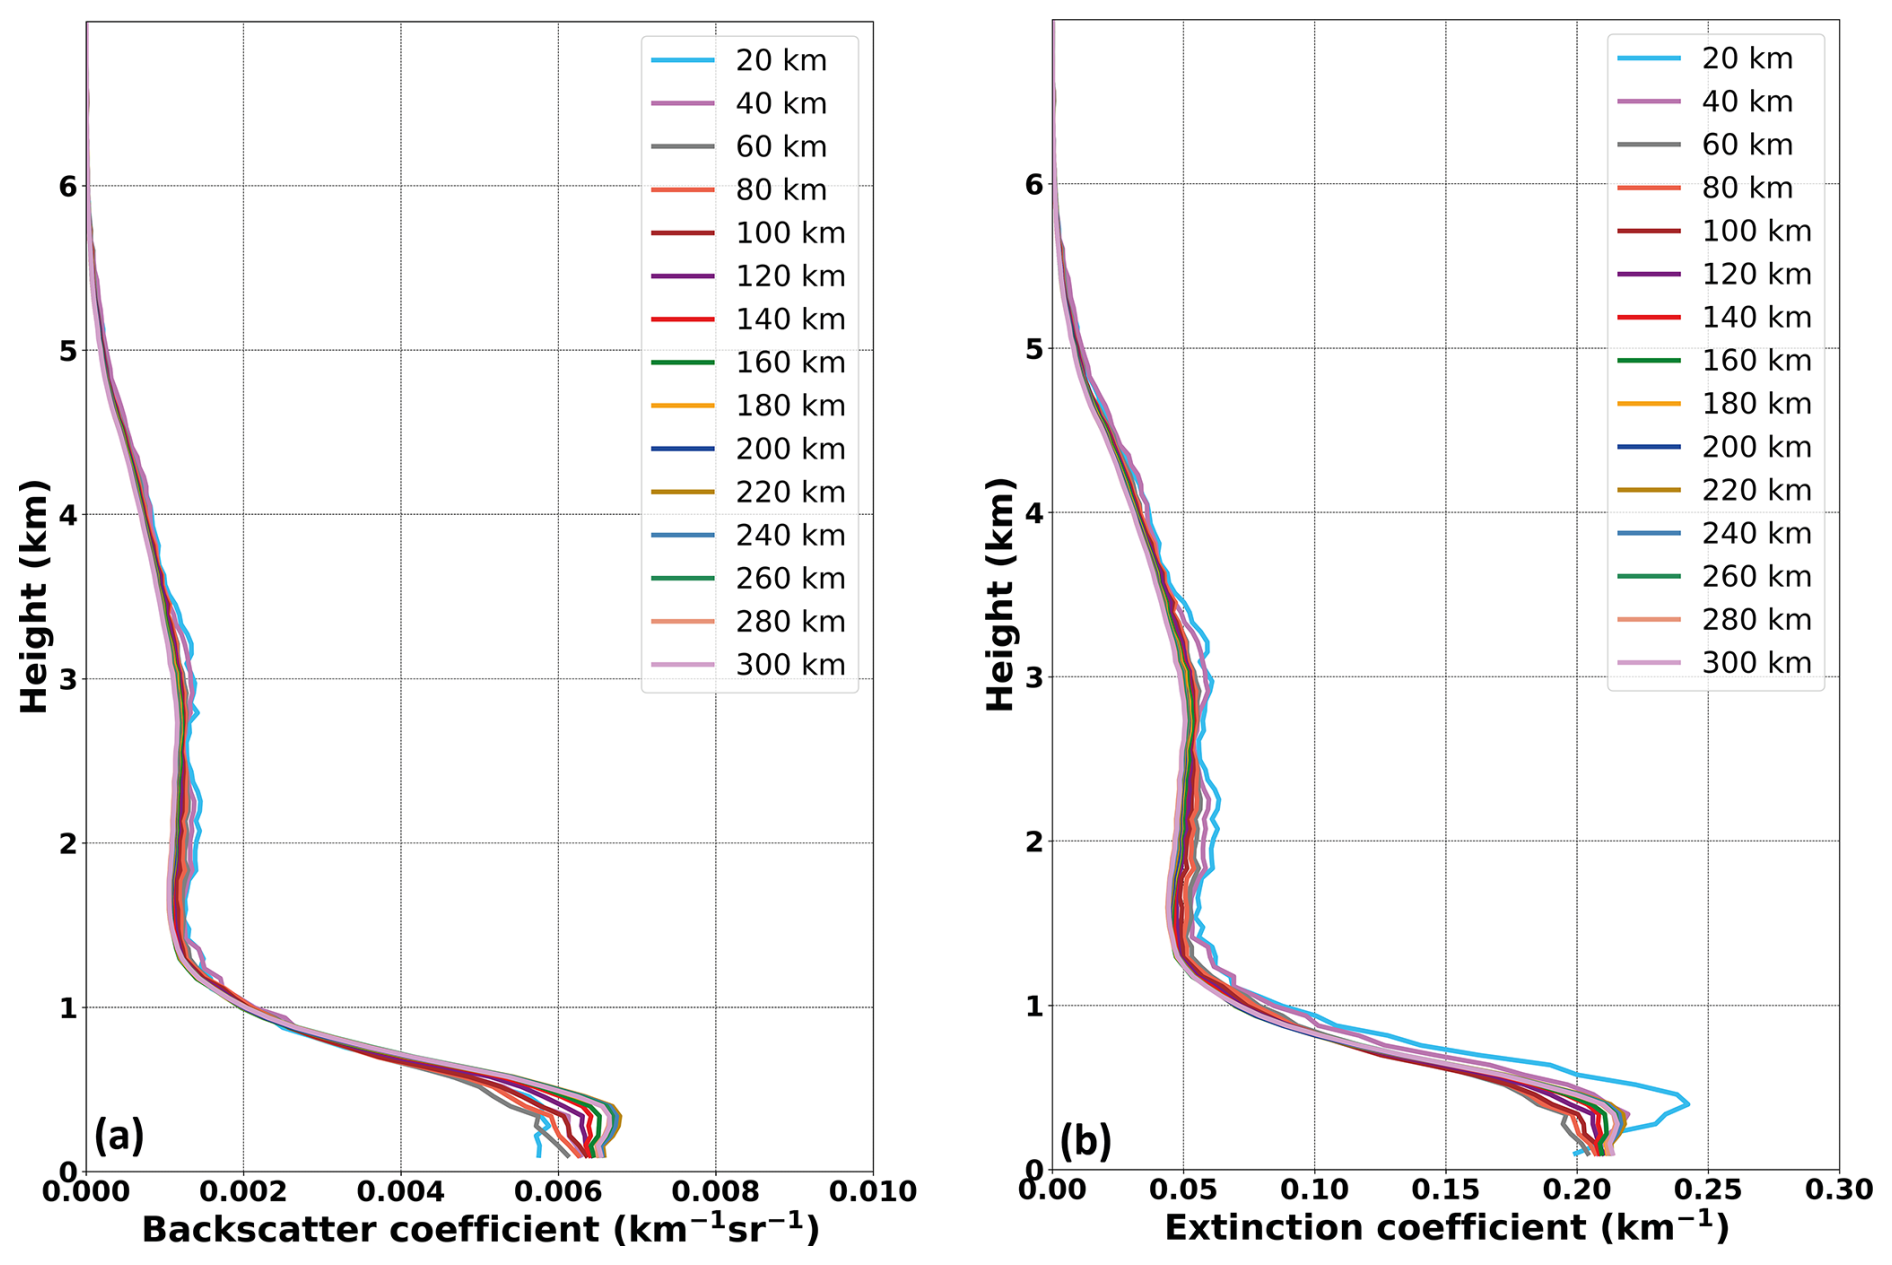
Figure 517-year average (2006–2023) backscatter (a) and extinction (b) coefficients (532 nm) from LIVAS (total aerosol product), as a function of distance from the Mindelo station.
The cloud-free optical profiles were first classified according to their distance to the Mindelo station and then averaged per radius and are presented in Fig. 5. Overall, the backscatter and extinction profiles per radius exhibit a very similar vertical structure, independently of the distance to the station, revealing that the atmosphere around Mindelo is comparably homogeneous. Both the backscatter (Fig. 5a) and the extinction coefficients (Fig. 5b) reach maximum values within the PBL. The average PBL top height appears to be around 0.5 km. Above that height and up to approximately 1.3 km, both optical parameters decrease, indicating the transitioning zone between the PBL and the lofted aerosol layers. Between 1.3 and 5 km, both the backscatter and the extinction coefficients reach two secondary maxima, which is indicative of the presence of one or more lofted aerosol layers.
The backscatter coefficient maximum values occurring within the PBL are increasing with increasing distance from the station. The same holds for the mean extinction coefficient, but for radii greater than 40 km. However, this aforementioned relationship should be interpreted cautiously, as there might be an effect of the increased sample size, leading to a decreased variability within the sampling distribution. As there are much less profiles used for the mean profiles for radii below 40 km compared to larger radii (see Table A1), the average profiles for small radii are much more dominated by single events compared to the profiles for larger radii. The mean extinction coefficient observed at distances smaller than 40 km from the Mindelo station exhibits the highest values. The maximum mean extinction coefficient for radii less or equal to 20 km could be associated to several reasons including the predominance of fine-mode aerosol particles of anthropogenic origin from the island of São Vicente and, thus, the potentially wrong lidar ratio assignment by the CALIPSO aerosol subtype selection scheme (Kim et al., 2018). It should be noted that in the following section (Sect. 3.2), the monthly variability of the extinction coefficient as a function of distance from the Mindelo station will not be examined, solely due to the fact that it is influenced by the aerosol subtype selection scheme (Kim et al., 2018), a typical problem for elastic backscatter lidars. Therefore, we consider only backscatter profiles.
3.2 Monthly comparison with PollyXT profiles
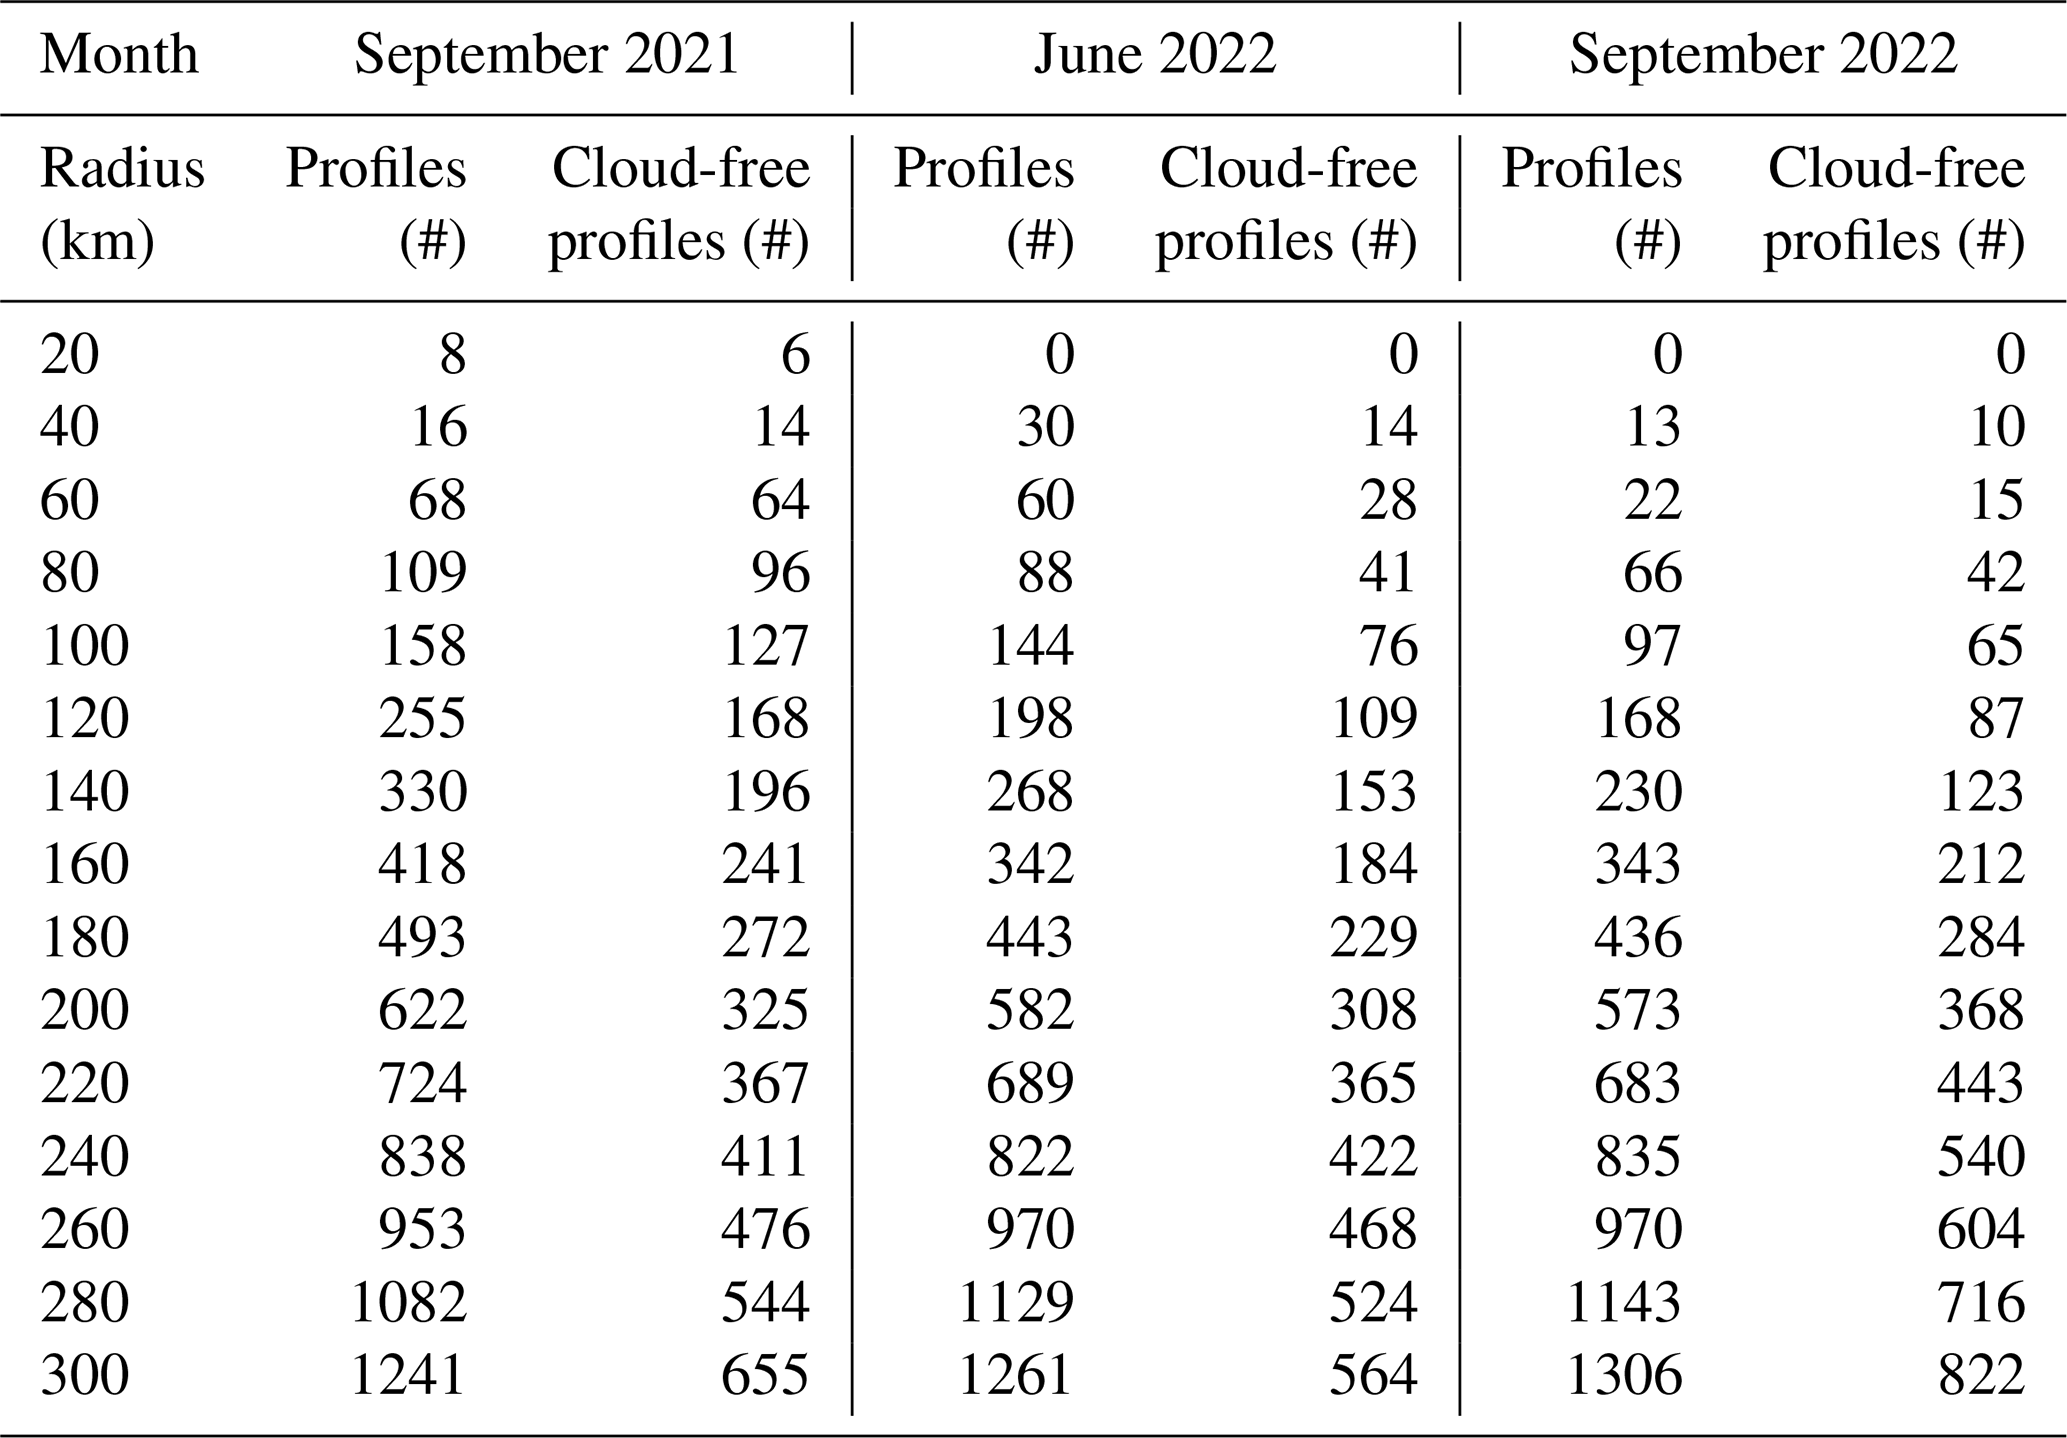
A total number of 1241, 1261 and 1306 LIVAS profiles were identified within the 300 km radius from the Mindelo station during September 2021, June 2022 and September 2022, respectively. Approximately 53 %, 45 % and 63 % of the aforementioned profiles (for the months of September 2021, June 2022 and September 2022, respectively) were cloud-free and used further for the comparison with the cloud-free PollyXT profiles. Similarly to Sect. 3.1, the cloud-free profiles were classified according to their distance to the Mindelo station and respective statistics such as the mean, median and associated erros were calculated. The exact number of profiles from both LIVAS and PollyXT datasets are provided in Tables A2 and B1, respectively. Only the backscatter coefficient at 532 nm is considered here, since it is a property less affected by the a-priori choice of the lidar ratio.
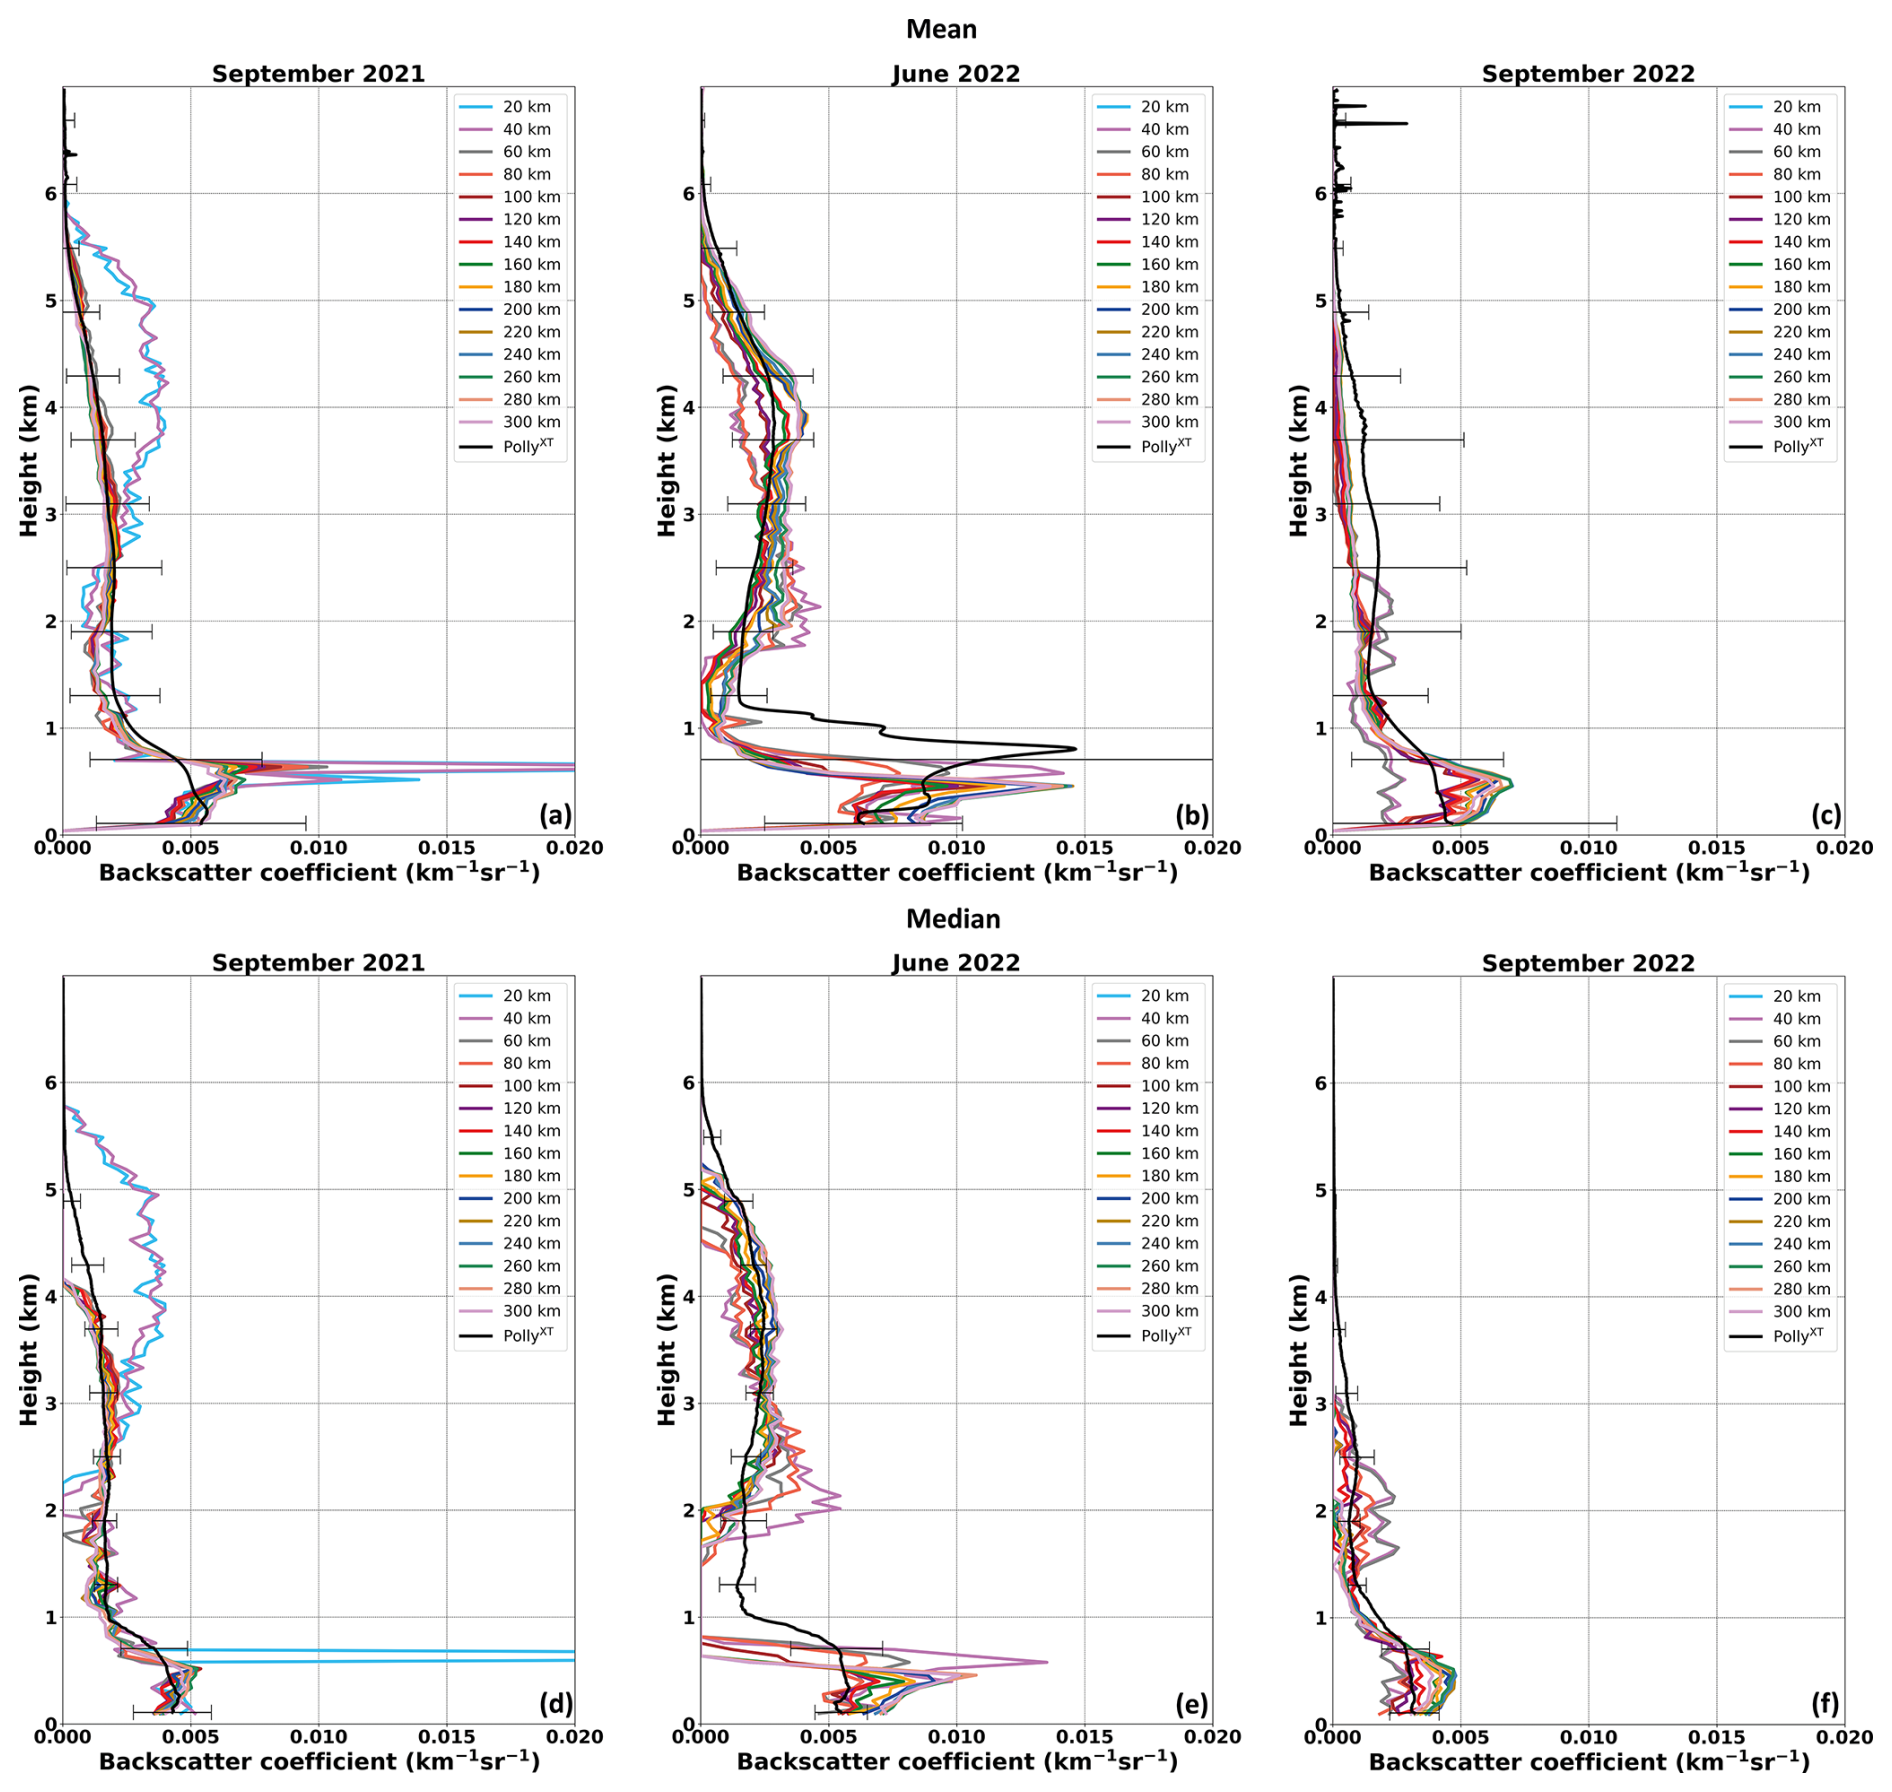
Figure 6Monthly mean (a–c) and median (d–f) backscatter coefficient at 532 nm for September 2021 (a, d), June 2022 (b, e) and September 2022 (c, f) from the LIVAS dataset for different radii around Mindelo (colored solid lines) and as derived from the PollyXT lidar system (solid black line). The uncertainties of the PollyXT data correspond to the standard deviation.
Figure 6 shows the monthly mean and median backscatter coefficient comparison for the ASKOS months (regression statistics provided in Table C1). For September 2021, both the mean and median LIVAS backscatter coefficient profiles at 532 nm (Fig. 6a and d, respectively) reach their maximum values at an altitude of approximately 0.5 km, regardless of the distance of the profiles to the station. The extremely high values of the mean LIVAS backscatter coefficient for radii less than 60 km can be associated with potential cloud contamination, or outliers. The median (Fig. 6d), which is a more robust measure in case of outliers, does not follow a similar structure with the mean for the same radii, further supporting that statement. In particular, given the high values of the median LIVAS backscatter coefficient for a radius less than 20 km, we can conclude that most likely some (or even all) of the six (Table A2) LIVAS profiles were in fact cloud contaminated. The PollyXT-derived mean and median backscatter coefficient (black line in Fig. 6a and d) reach maximum values also within the PBL, but at a lower altitude of 0.2 km and exhibit slightly lower mean and median values ranging between 0.001 and 0.009 and 0.003 and 0.006 km−1 sr−1, respectively. The high standard deviation and median absolute deviation values accompanying the PollyXT data below 1 km are simply an indicator for the strong variability of aerosol load expected in the PBL.
Similar pattern for the PBL is observed in September 2022 as well (Fig. 6c and f). The mean and median LIVAS backscatter coefficient reach values up to 0.007 and around 0.005 km−1 sr−1, respectively at an altitude of approximately 0.5 km for a maximum radius of 160 km from Mindelo. No large deviations between the mean and the median are observed for this month, indicating that only a few profiles could be affected by clouds. The corresponding mean and median PollyXT backscatter coefficient reach their maximum values of 0.0045 and 0.0035 km−1 sr−1, respectively at approximately 0.4 km altitude. However, the monthly mean LIVAS backscatter coefficient profiles that correspond to a radius of 40 and 60 km (purple and gray lines in Fig. 6c, respectively) appear to be much lower than the rest of the profiles (note that no profile within 20 km was available during this month). The same behavior, but much less pronounced is also visible in the median profiles (Fig. 6f). This is a sampling size artifact, related to the few number of profiles available at radii less than 60 km.
In June 2022, the backscatter coefficient exhibits a double maxima within the PBL, which is especially pronounced in the mean profiles (Fig. 6b). For the LIVAS data, the first maximum occurs at 0.3 km altitude and the second one approximately at 0.5 km. The maximum occurrence of the PollyXT data coincides with the first maximum from the LIVAS dataset, however, the occurrence of the second maximum is slightly shifted for the PollyXT data, occurring at an altitude of 0.8 km. Given that the aforementioned maxima are less pronounced in the median profiles (Fig. 6e) it can be concluded that either they can be associated with artifacts in the cloud screening routines of both datasets or that they are occurring due to the different spatiotemporal resolutions of the datasets or that they are associated with different events. In addition, it should be noted that for June 2022 the median profiles of the LIVAS backscatter coefficient at 532 nm at altitudes between approximately 1 and 1.8 km were zero. This happens because at this altitude there were several CALIPSO aerosol profiles with features classified as clear air. By default in the LIVAS production, these clean air features are set to zero. PollyXT does not confirm this, as a particle backscatter is observed. Thus, we conclude that CALIPSO was too weak at the end of its lifetime to resolve these aerosol layers close to the ground.
The comparison results are very satisfactory for the altitude range of 1.5 to 5 km, at which lofted aerosol layers typically corresponding to the Saharan Air Layer (SAL), are frequently observed. Especially for June 2022, the agreement between the two datasets was excellent (Fig. 6b and e from 2 km onwards). In September 2021 (Fig. 6a), the PollyXT-derived mean backscatter coefficient compared well against the LIVAS profiles, with the exception of profiles being less than 40 km away from Mindelo (Fig. 6b, light blue and purple lines, respectively). For those distances (20 and 40 km), the LIVAS-derived backscatter coefficient is severely overestimated compared to the rest of the LIVAS data (corresponding to distances grater than 40 km) and to the PollyXT data, due to the few profiles (6 and 14 cloud-free profiles, respectively). This pattern is not visible in the median profiles (Fig. 6d), with the exception of the profiles that are within 20 km from the ground-based station. The monthly mean and median backscatter coefficient at this altitude range appears to be underestimated by the LIVAS dataset for September 2022 (Fig. 6c and f, respectively) compared to the one derived from the PollyXT lidar. This underestimation is not linked to the sampling size, as it occurs regardless of the distance to the Mindelo station. It is probably related to the end-of-lifetime performance of CALIOP (Tackett et al., 2025). Additionally, the two LIVAS backscatter-coefficient maxima occurring at approximately 1.5 and 2.3 km altitude for radii between 40–60 km are cloud-screening-related artifacts.
From the presented monthly comparison of the LIVAS dataset with the PollyXT dataset, several conclusions can be drawn with respect to validation strategies already. Firstly, the importance of the sampling size should be highlighted. The usage of more spaceborne-derived profiles over an extended radius should be prioritized since it is increasing the representativeness of the samples for the mean monthly atmospheric conditions. In addition, our analysis indicates that mean long-term ground-based observations perform better over the respective median values for the validation of mean profiles derived from satellite observations. The mean backscatter coefficient profiles (Fig. 6a, b and c) captured better the aerosol vertical distribution, while the median profiles (Fig. 6d, e and f) underestimated the aerosol layer top height.
3.3 Case studies
To assess the representativeness of the station in terms of direct single profile comparison, three case studies have been examined from the three intensive ASKOS months. The cases were selected based primarily on the proximity of the CALIPSO overpass to the ACTRIS ground-based station (ranging from as close as 6.50 km and up to 129.10 km) and secondarily on the atmospheric conditions that prevailed during that day. The maximum distance of 129.10 km of the CALIPSO overpass to the ground-based station was chosen intentionally, such as to exceed the radius threshold of 100 km, which is commonly used by the Cal/Val communities for the validation of spaceborne profilers (Baars et al., 2023; Amiridis et al., 2025). The first case study, on 5 September 2021 (Sect. 3.3.1), examines a close overpass of CALIPSO around the ground-based station at Mindelo with a distance of 6.5 km, while a homogeneous dust layer was present. The second case is from 17 June 2022 (Sect. 3.3.2) and the distance between the CALIPSO ground track and the ground site was 86.5 km. In contrast to the first case, the lofted aerosol layers on 17 June 2022 contained dusty mixtures. In the last case study, 11 September 2022, the distance between the CALIPSO overpass and the ground-based station is 129.1 km and similarly to the first case, here, a lofted layer containing desert dust was observed too.
3.3.1 5 September 2021
The first closest CALIPSO overpass examined here occurred on 5 September 2021 at around 04:16 UTC (nighttime) and it was as close as 6.5 km from the ground-based station at Mindelo. On the same day, the ground-based lidar observations revealed a rather dense and stable dust layer over Mindelo with cloud-free conditions during the overpass (Fig. 7). The vertically-resolved attenuated backscatter coefficient at 1064 nm and volume depolarization ratio at 532 nm as derived from the PollyXT lidar between 00:00 and 11:00 UTC are shown in Fig. 7a and b, respectively. The PBL, extending up to an altitude of 600–800 m, is characterized by moderate backscatter coefficient and lidar ratio values (approximately 50–60 sr at 355 and 532 nm, not shown here) and low particle linear depolarization ratio values (around 10 % at 532 nm, not shown here), indicating the presence of an aerosol mixture containing mostly spherical marine particles mixed with non-spherical desert dust particles. Between 05:30 and 08:00 UTC, low-level clouds formed at the top of the PBL, which caused signal attenuation above the cloud base. Above the PBL and up to almost 6 km altitude, the desert dust layer is located, as indicated by the particle linear depolarization ratio values that reached values up to 30% at 532 nm.
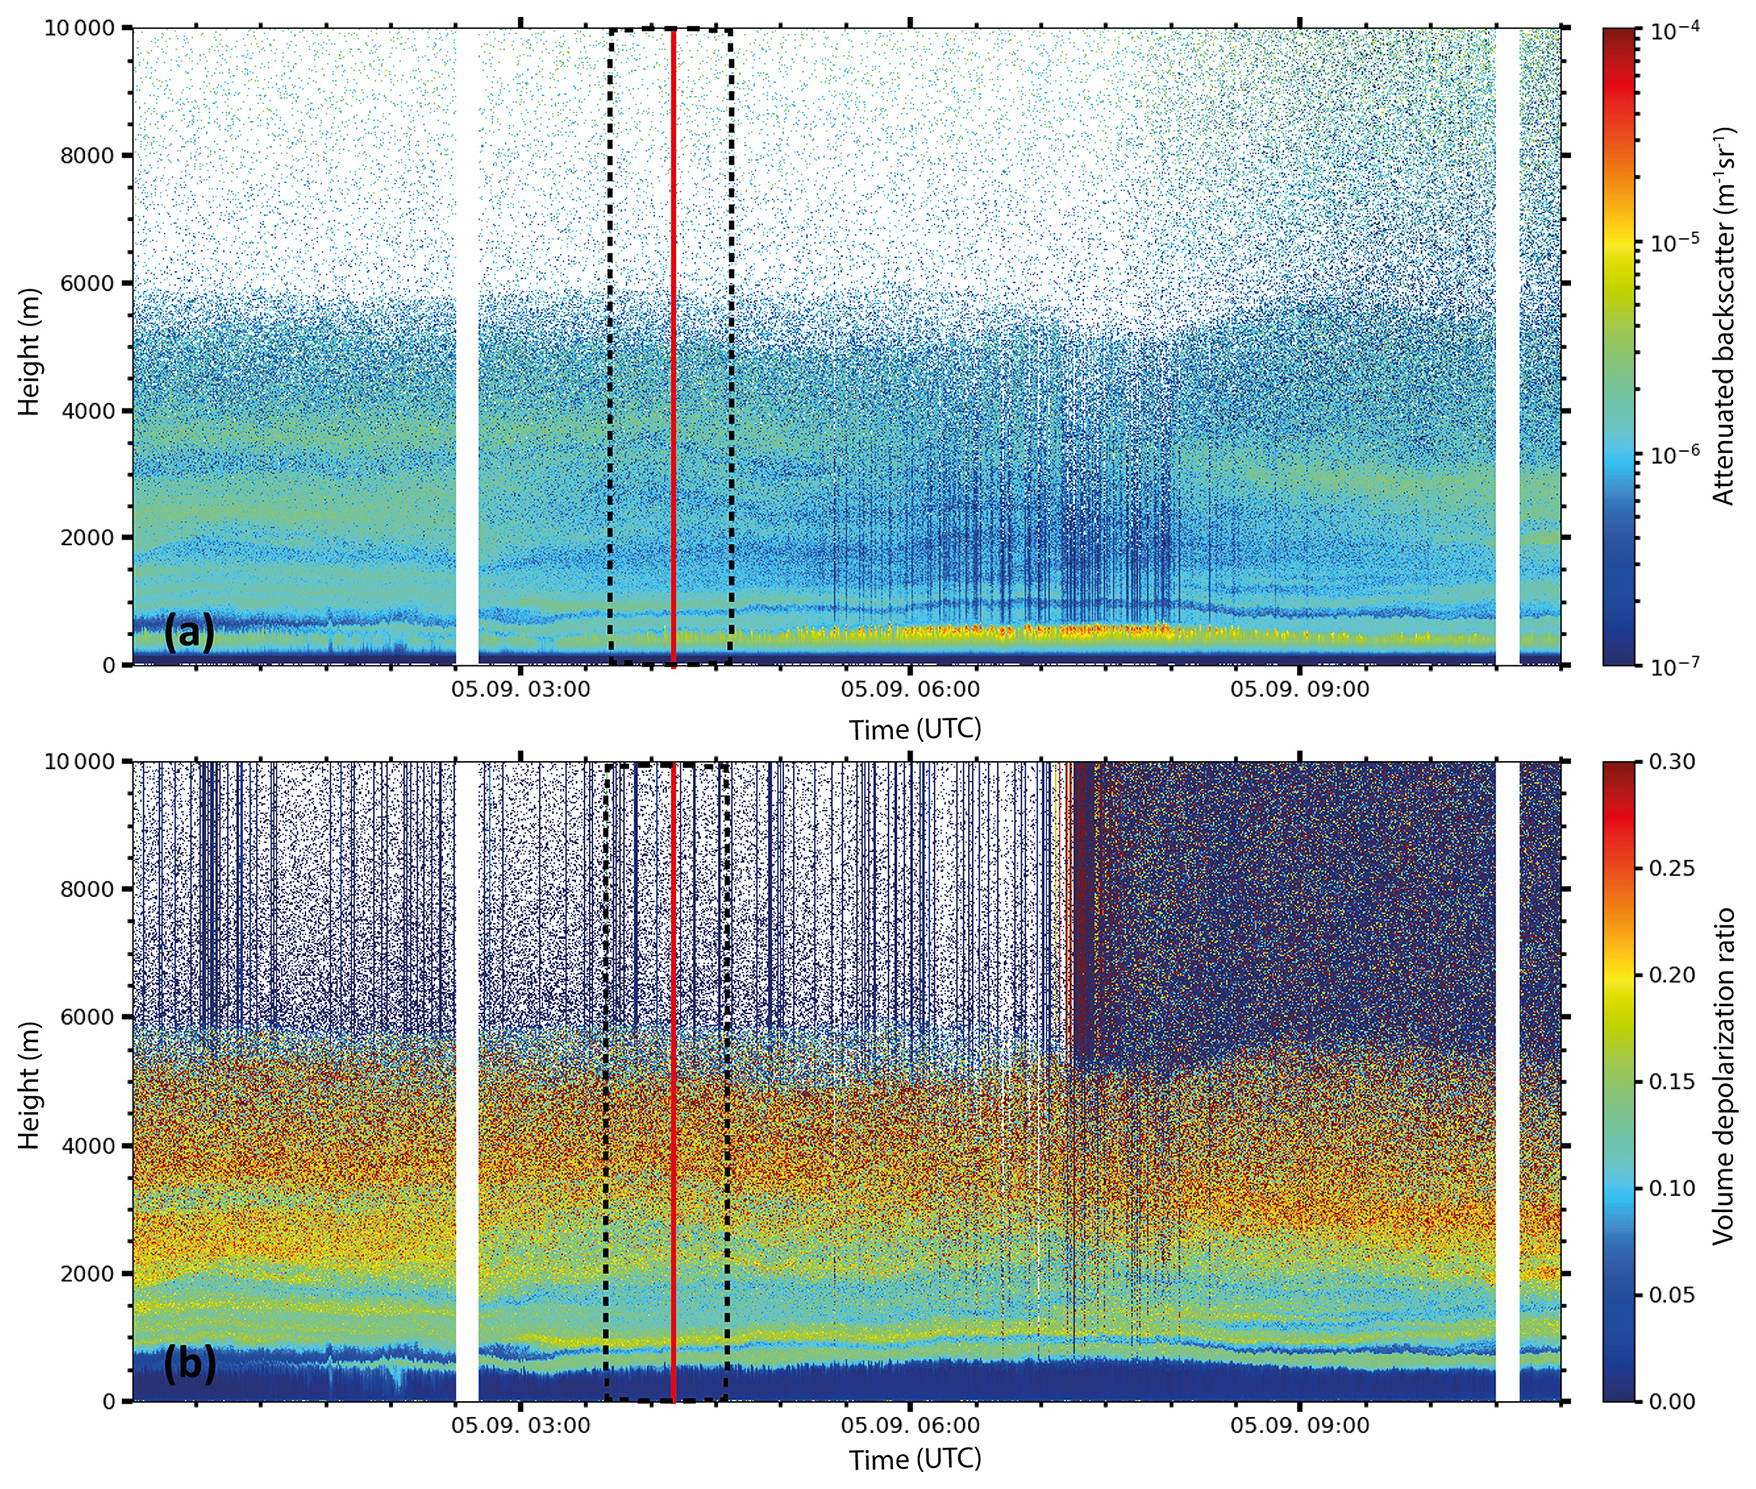
Figure 7Overview of the atmospheric conditions in terms of (a) range-corrected signal at 1064 nm and (b) linear volume depolarization ratio at 532 nm at Mindelo, Cabo Verde, on 5 September 2021 between 00:00 and 11:00 UTC. The red line indicates the time of the CALIPSO overpass, while the black dashed lines indicate the time interval used for the PollyXT retrievals. No data are available during regular depolarization calibration periods (white bars).
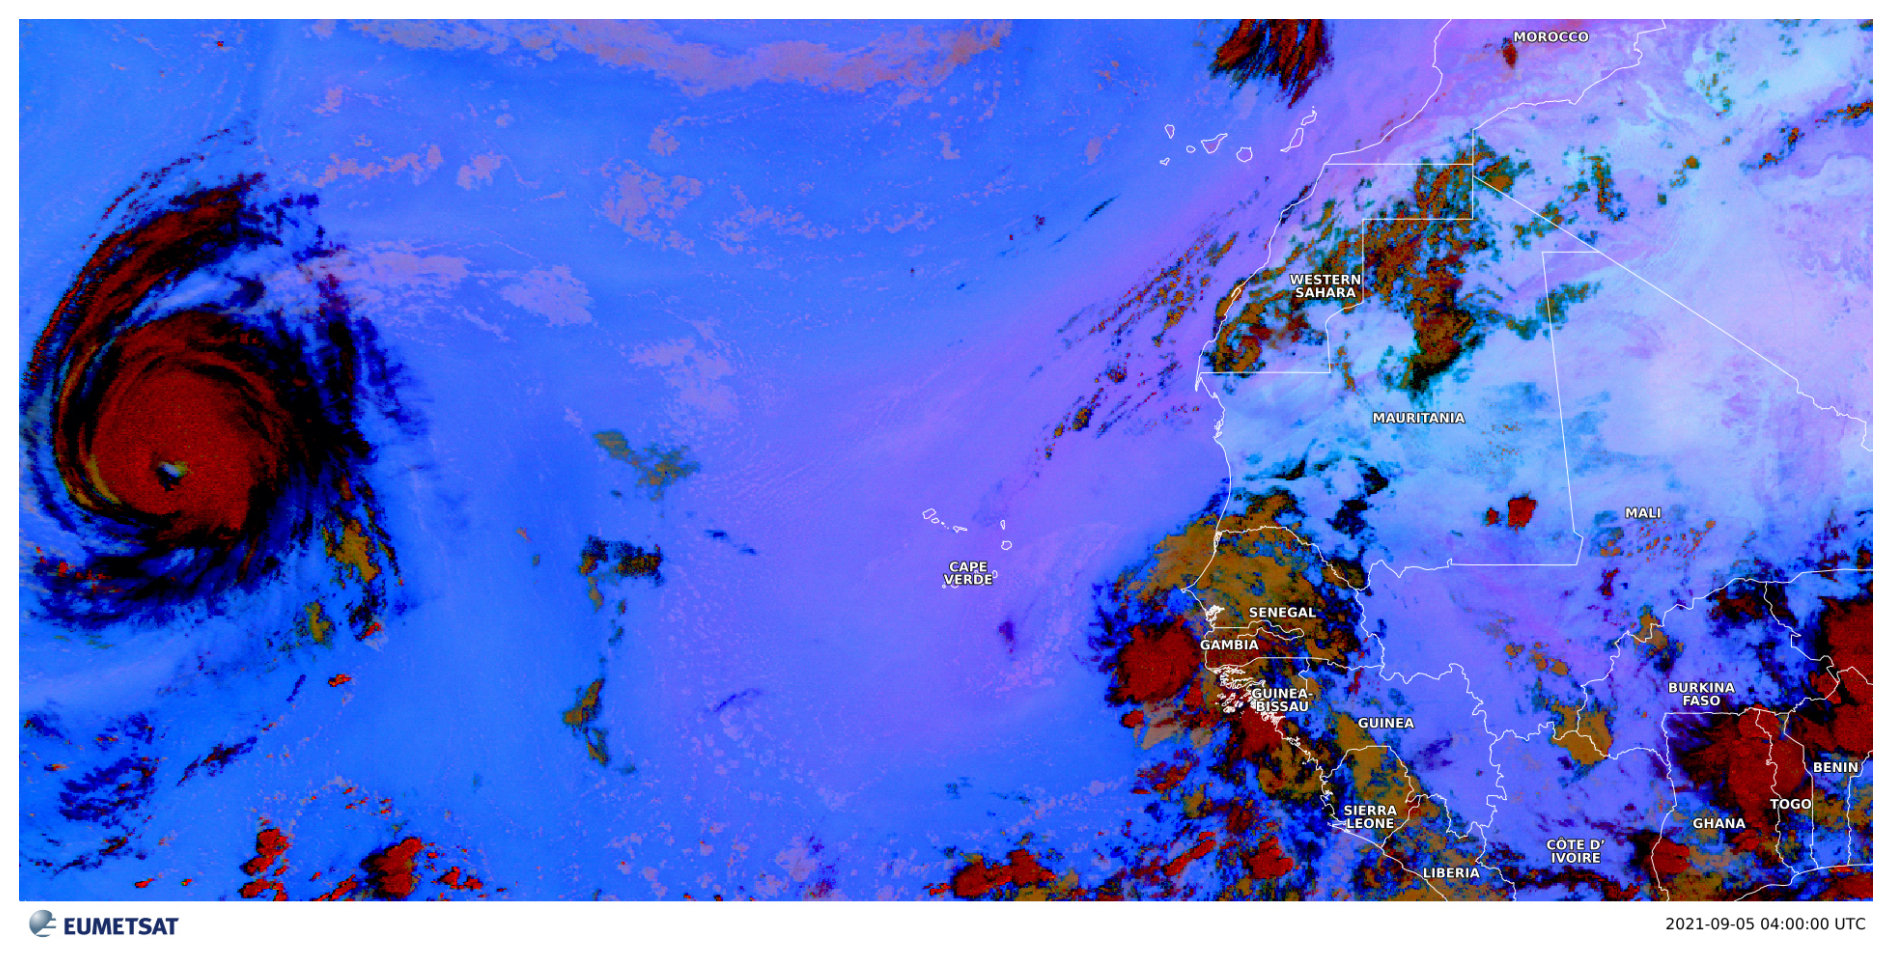
Figure 8MSG-SEVIRI Dust product for 5 September 2021 at 04:00 UTC. Pink to violet colors indicate dust layers. Data accessed via the Eumetview platform (https://view.eumetsat.int/, last access: 17 February 2026).
The dust layer on 5 September 2021 was also captured by the MSG's (Meteosat Second Generation) SEVIRI (Spinning Enhanced Visible and Infrared Imager) Dust product and is depicted in Fig. 8 (at 04:00 UTC, a few minutes prior to the overpass). The product is an RGB (Red, Green, Blue) composite based on infrared channel data (IR8.7, IR10.8 and IR12.0) and has been created to monitor the evolution of dust storms. Pink to violet colors indicate dust. It can be seen that the dust layer observed above Mindelo appears to have a greater extent, covering all the Cabo Verde islands and the archipelago around them for a radius of at least 600 km, exhibiting high spatial homogeneity.
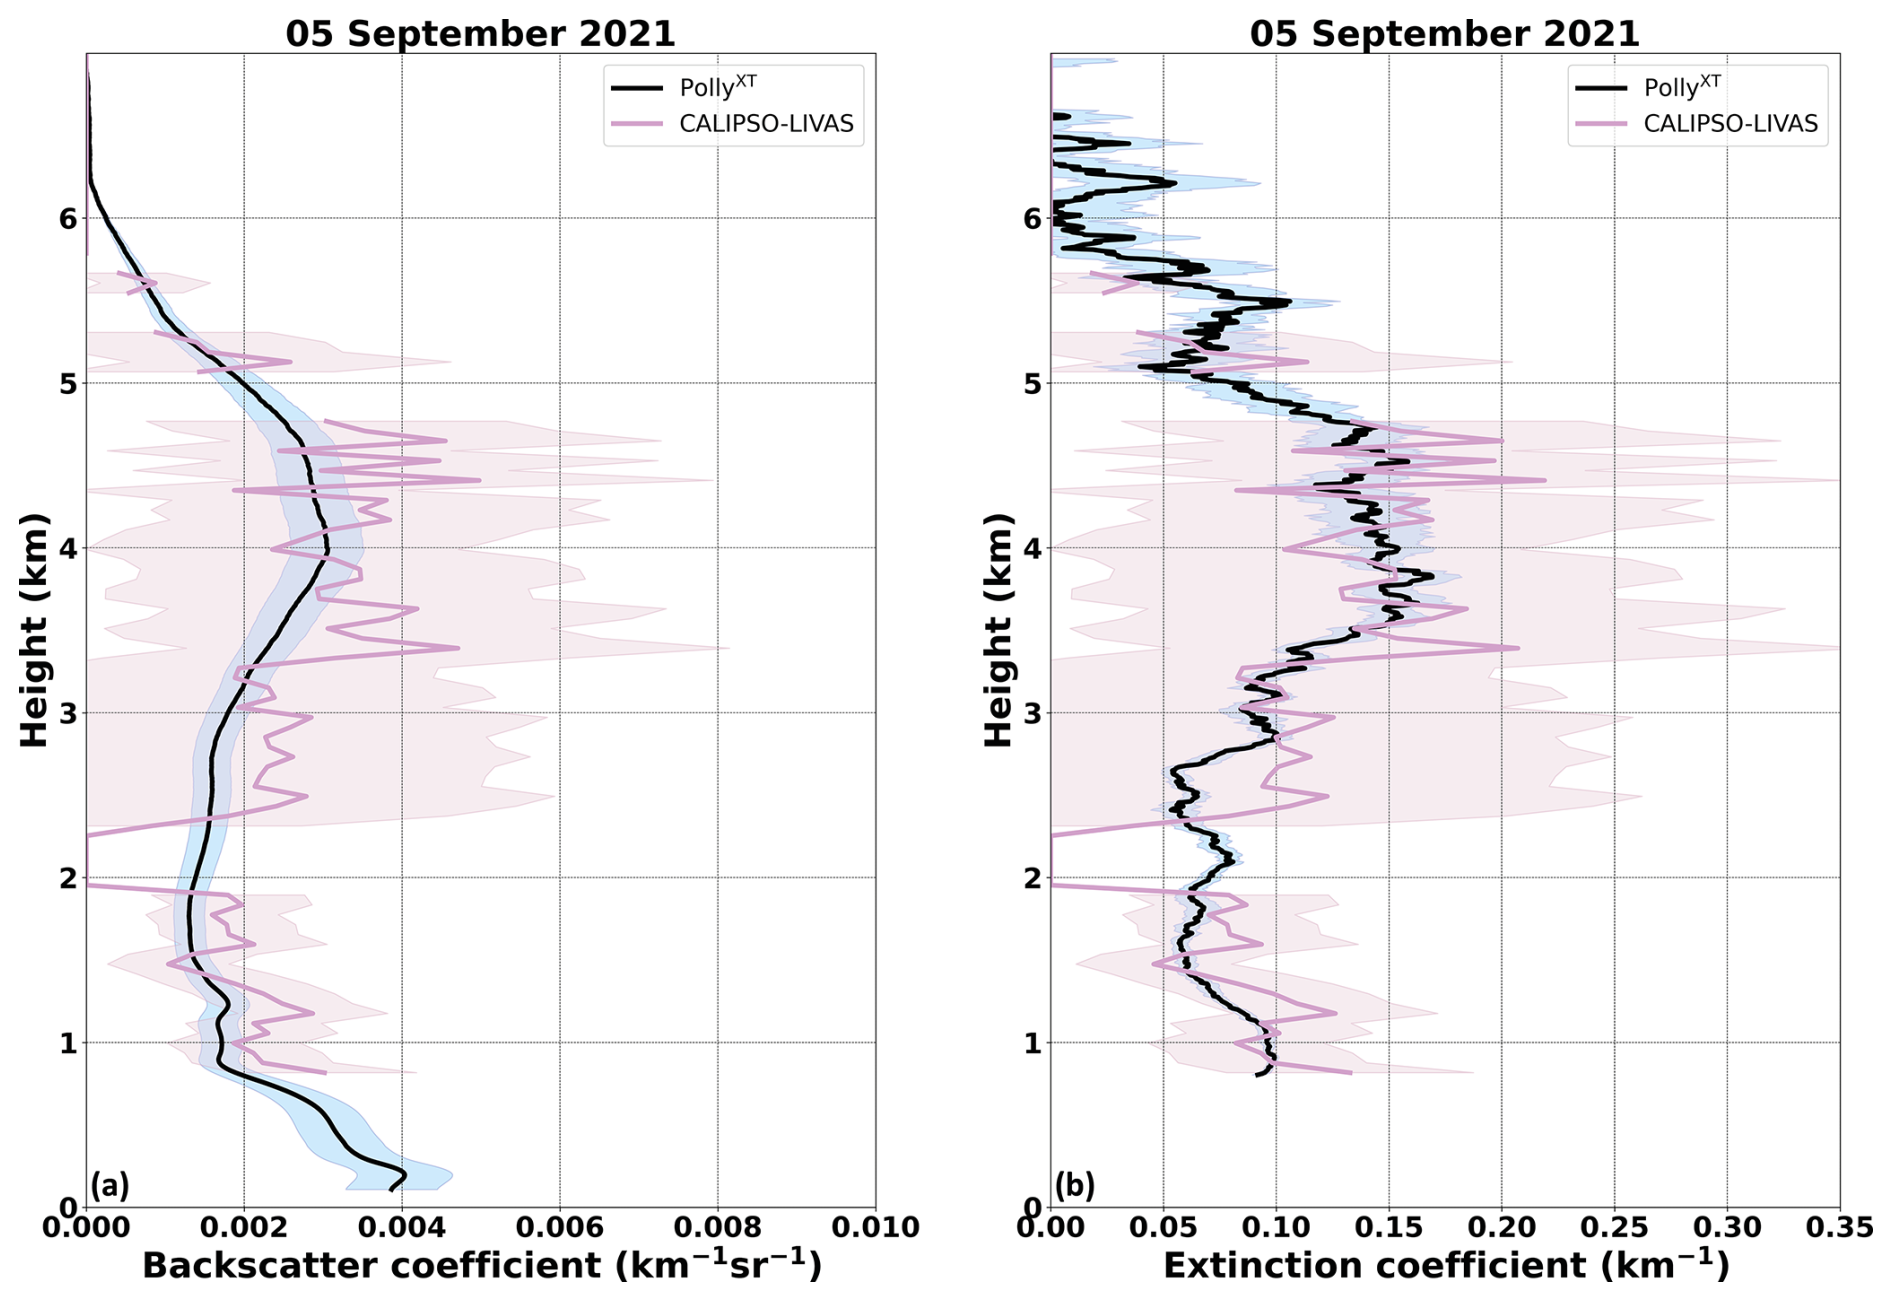
Figure 9Backscatter (a) and extinction (b) coefficient profiles at 532 nm as derived from the PollyXT Raman lidar (black lines) and from the CALIPSO-LIVAS database (lila lines) for the case of 5 September 2021. The PollyXT and CALIPSO-LIVAS associated uncertainties are indicated with blue and pink shaded areas, respectively.
The PollyXT and LIVAS optical profile comparison is shown in Fig. 9. The PollyXT-derived optical properties were retrieved with the Raman method for an 1 h cloud-free interval (03:41–04:40 UTC), coinciding with the CALIPSO overpass at 04:16 UTC. While the PollyXT products are available at three wavelengths (355, 532 and 1064 nm), for the purposes of this comparison, we focus only on the 532 nm wavelength. Overall, we observe an excellent agreement within the uncertainty range for both the backscatter (Fig. 9a) and the extinction coefficients (Fig. 9b) for the whole profile, with the exception of the altitude range between 1.95 and 2.22 km, where LIVAS profiles were zero (as discussed above, CALIPSO was most probably unable to detect such aerosol layers close to the ground; Tackett et al., 2025). The monthly comparisons (see Sect. 3.2) revealed deviations in the two datasets for the PBL (altitudes less than 1 km), however, this is not the case for this specific case study, which exhibits very homogeneous atmospheric conditions and takes into account the closest CALIPSO overpass, with a distance of only 6.5 km from the ground-based station.
Above the PBL, we observe a very good agreement at altitudes between approximately 3 and 4.5 km, which confirms the findings of the monthly comparisons (Sect. 3.2). An excellent agreement is observed at the same altitudes for the extinction coefficient, which clearly demonstrates the retrieval improvements induced by the revised lidar ratio selection algorithm (Kim et al., 2018) and the correct aerosol typing performed for this case of almost pure Saharan dust.
3.3.2 17 June 2022
The second case examined here corresponds to 17 June 2022. For this case, the CALIPSO overpass occurred at approximately 16:16 UTC (daytime) and the minimum distance from the ground-based station was 86.54 km.
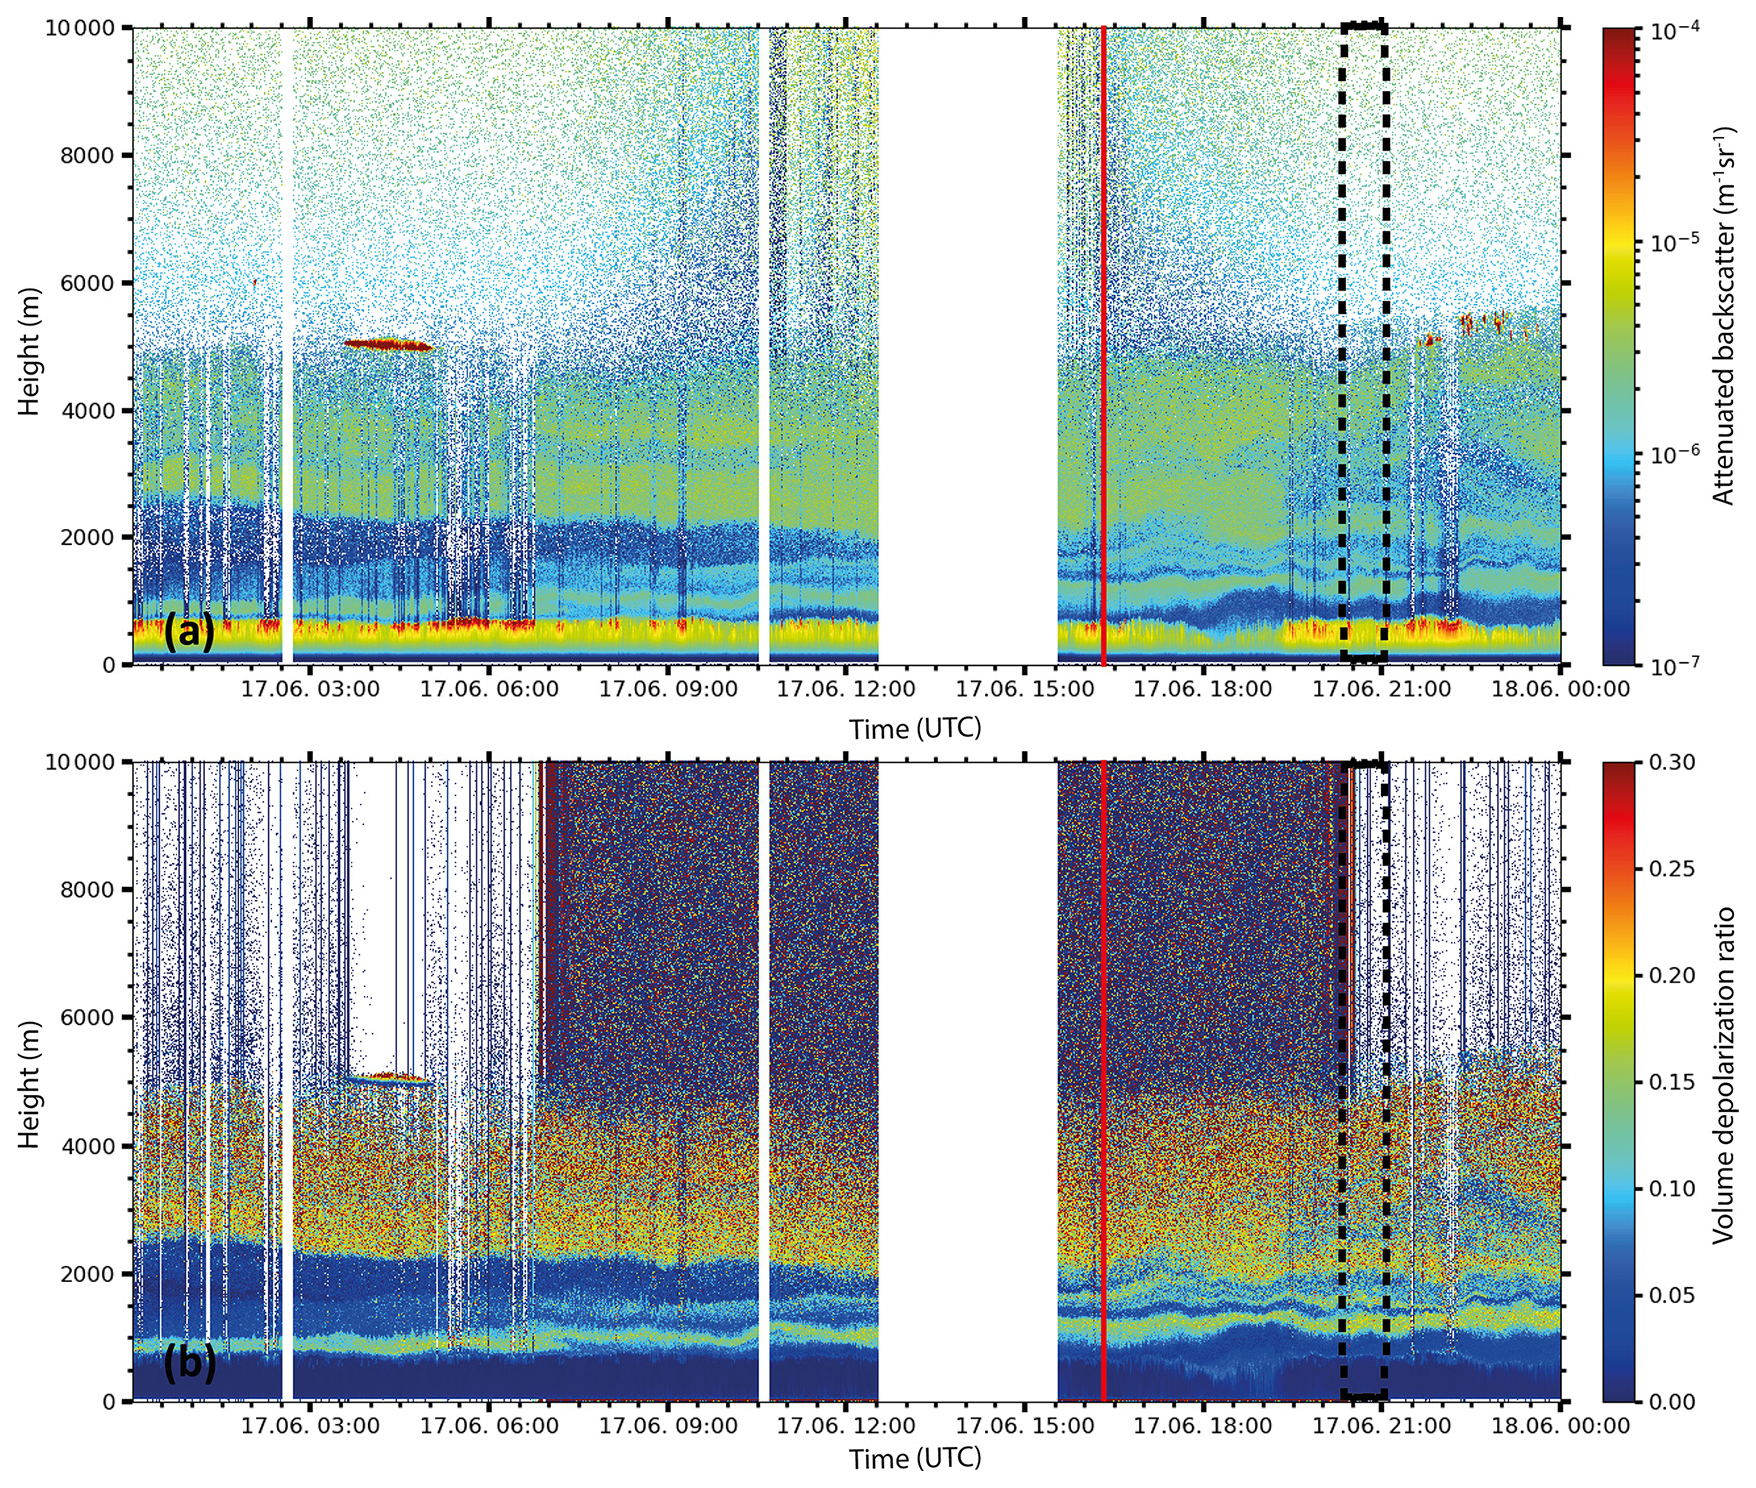
Figure 10Similarly to Fig. 7, but for 17 June 2022 between 00:00 and 24:00 UTC. No data (white bars) are available during regular depolarization calibration periods and between 12:30 and 15:30 UTC, due to the location of the instrument with respect to the solar zenith angle.
Figure 10 depicts the atmospheric conditions over Mindelo for that day. Based on the attenuated backscatter coefficient at 1064 nm (Fig. 10, top panel), we can conclude that the PBL was as usually shallow, reaching altitudes up to 750 m and containing marine particles, as indicated by the low values of the depolarization ratio (Fig. 10, bottom panel). Above the PBL and up to an altitude of 2 km, several aerosol layers were present, stack on top of one another. These aerosol layers are characterized by moderate to low values of attenuated backscatter coefficient and moderate depolarization values, indicating the presence of a mixture of dust and marine aerosol or even dehumidified marine aerosols (Haarig et al., 2017; Bohlmann et al., 2018). Low-level clouds formed at the top of the PBL occasionally throughout the day, but especially during nighttime hours. Above 2 km, the predominance of dust-dominated aerosol is evident in a geometrically thick aerosol layer that extends up to 5 km in altitude. The layer is also visible in the SEVIRI Dust product and it appears to be rather spatially homogeneous (Fig. D1). Mid-altitude clouds, forming at the top of the dust layer, were observed between 03:00 and 06:00 UTC and between 21:30 and 23:00 UTC.
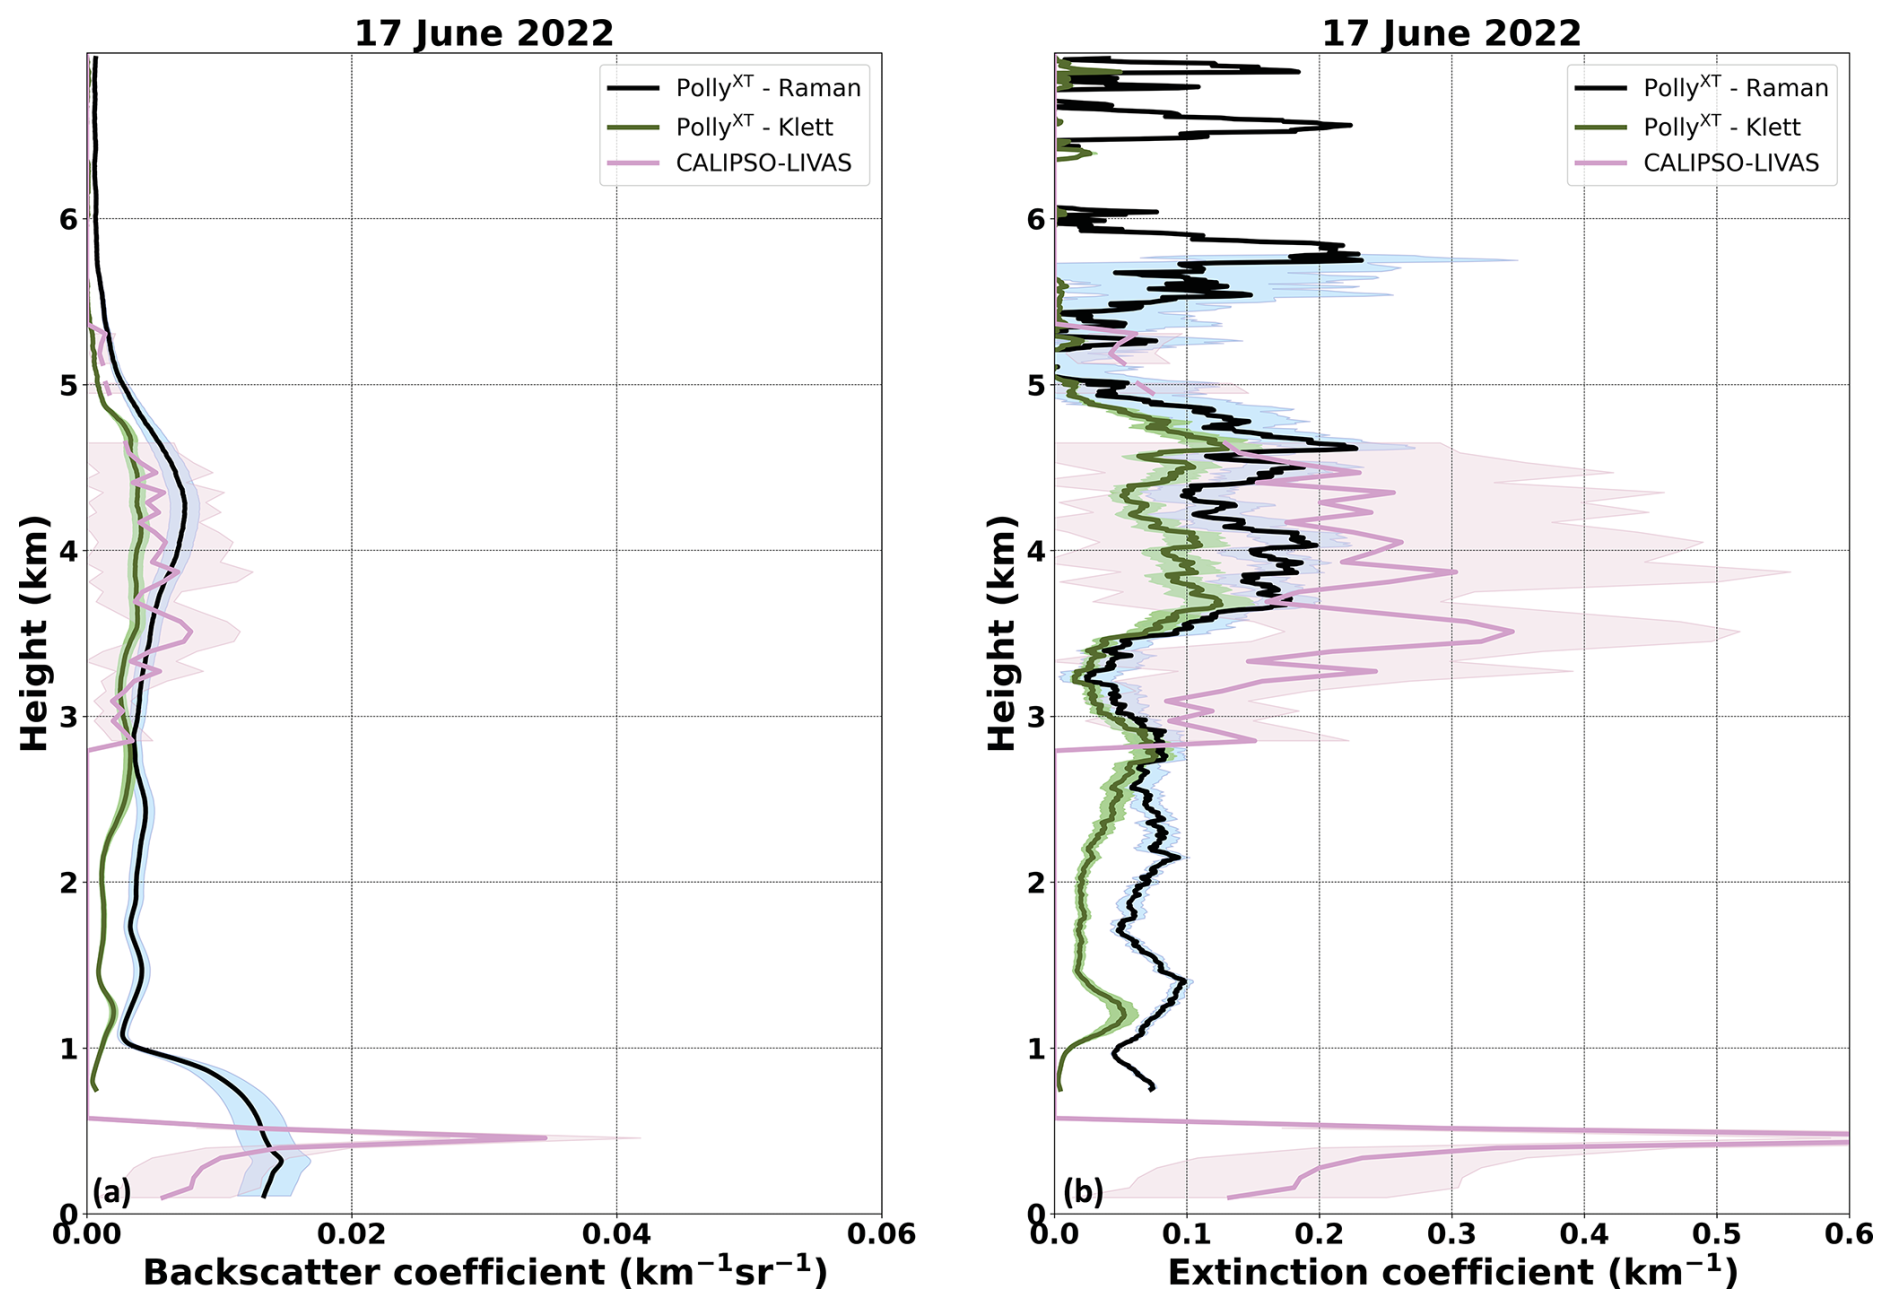
Figure 11Same as Fig. 9, but for the case of 17 June 2022. Additionally, the Klett-retrieved profiles are shown (dark olive green solid line), along with the associated uncertainties (green shaded area). Time intervals for the Raman and Klett retrievals are 20:24–21:01 and 16:34–17:34 UTC, respectively.
The closest available Raman-based optical parameters from the PollyXT lidar were retrieved automatically by the PPC, for the time period 20:24–21:01 UTC, and the comparison between the PollyXT and CALIPSO-LIVAS backscatter and extinction profiles is shown in Fig. 11. Additionally, since it is a daytime overpass, the Klett-based optical parameters from 16:34–17:34 UTC (also automatically retrieved by the PPC with a pre-set lidar ratio of 40 sr) are also examined and shown in Fig. 11 (the time period for the Klett retrieval is not indicated in Fig. 10). A good agreement is observed for the backscatter coefficient (at 532 nm and for both Raman and Klett retrievals) at altitudes between 2.8–5 km. The difference between the aerosol profiles during daytime and nighttime is also an indication of the variability of the optical properties of the dust plume on this day. Nevertheless, considering the uncertainties, both profiles (backscatter and extinction) agree well with the LIVAS profile. Larger discrepancies were observed within the PBL and up to 2.8 km (Fig. 11a). The geometrically thin aerosol layers above the PBL are not captured by CALIPSO (Tackett et al., 2025), instead, they were classified as clean air and, hence, set to 0 by the LIVAS production rules. The differences between the Raman and Klett solutions are caused by the fixed lidar ratio of 40 sr, which is used for the automatic processing and is valid for dust but not for marine aerosol and its mixtures (see Floutsi et al., 2023) and the incomplete overlap of the lidar below 900 m, which is not corrected in the automatic processing. Thus, the deviation between the ground-based profiles are due to methodological issues and not due to a stronger temporal inhomogeneity. Given the facts discussed above, the observed discrepancies between the ground-based lidar and CALIOP within the PBL could be attributed to spatial inhomogeneity and most likely to a potential cloud contamination within the LIVAS database. In Fig. 10, a low-level cloud can be identified at 500 m shortly after 16:00 UTC (exactly at the altitude at which the CALIPSO-LIVAS backscatter coefficient maximum occurs). The extinction coefficient from both data sources is shown in Fig. 11b. Before discussing the extinction coefficient comparison, it should be noted that the Klett-based extinction coefficient has been calculated by using the nighttime lidar ratio measured from 20:24–21:01 UTC. The extinction coefficient derived from the CALIPSO-LIVAS data is slightly overestimating the aerosol load at the altitude range of 3–4.5 km, but agrees within the given uncertainties with both the Raman- and the Klett-based PollyXT retrievals. Given the differences between the daytime and nighttime profiles from PollyXT, but also considering the backscatter comparison, spatiotemporal inhomogeneity seems to be the only reason affecting the comparison. One other plausible explanation for the extinction differences is the lidar ratio used for the CALIPSO extinction retrieval. An aerosol subtype missclassification (e.g., polluted dust instead of dust) might have triggered the selection of a higher aerosol lidar ratio, thus, resulting in higher extinction coefficient values.
3.3.3 11 September 2022
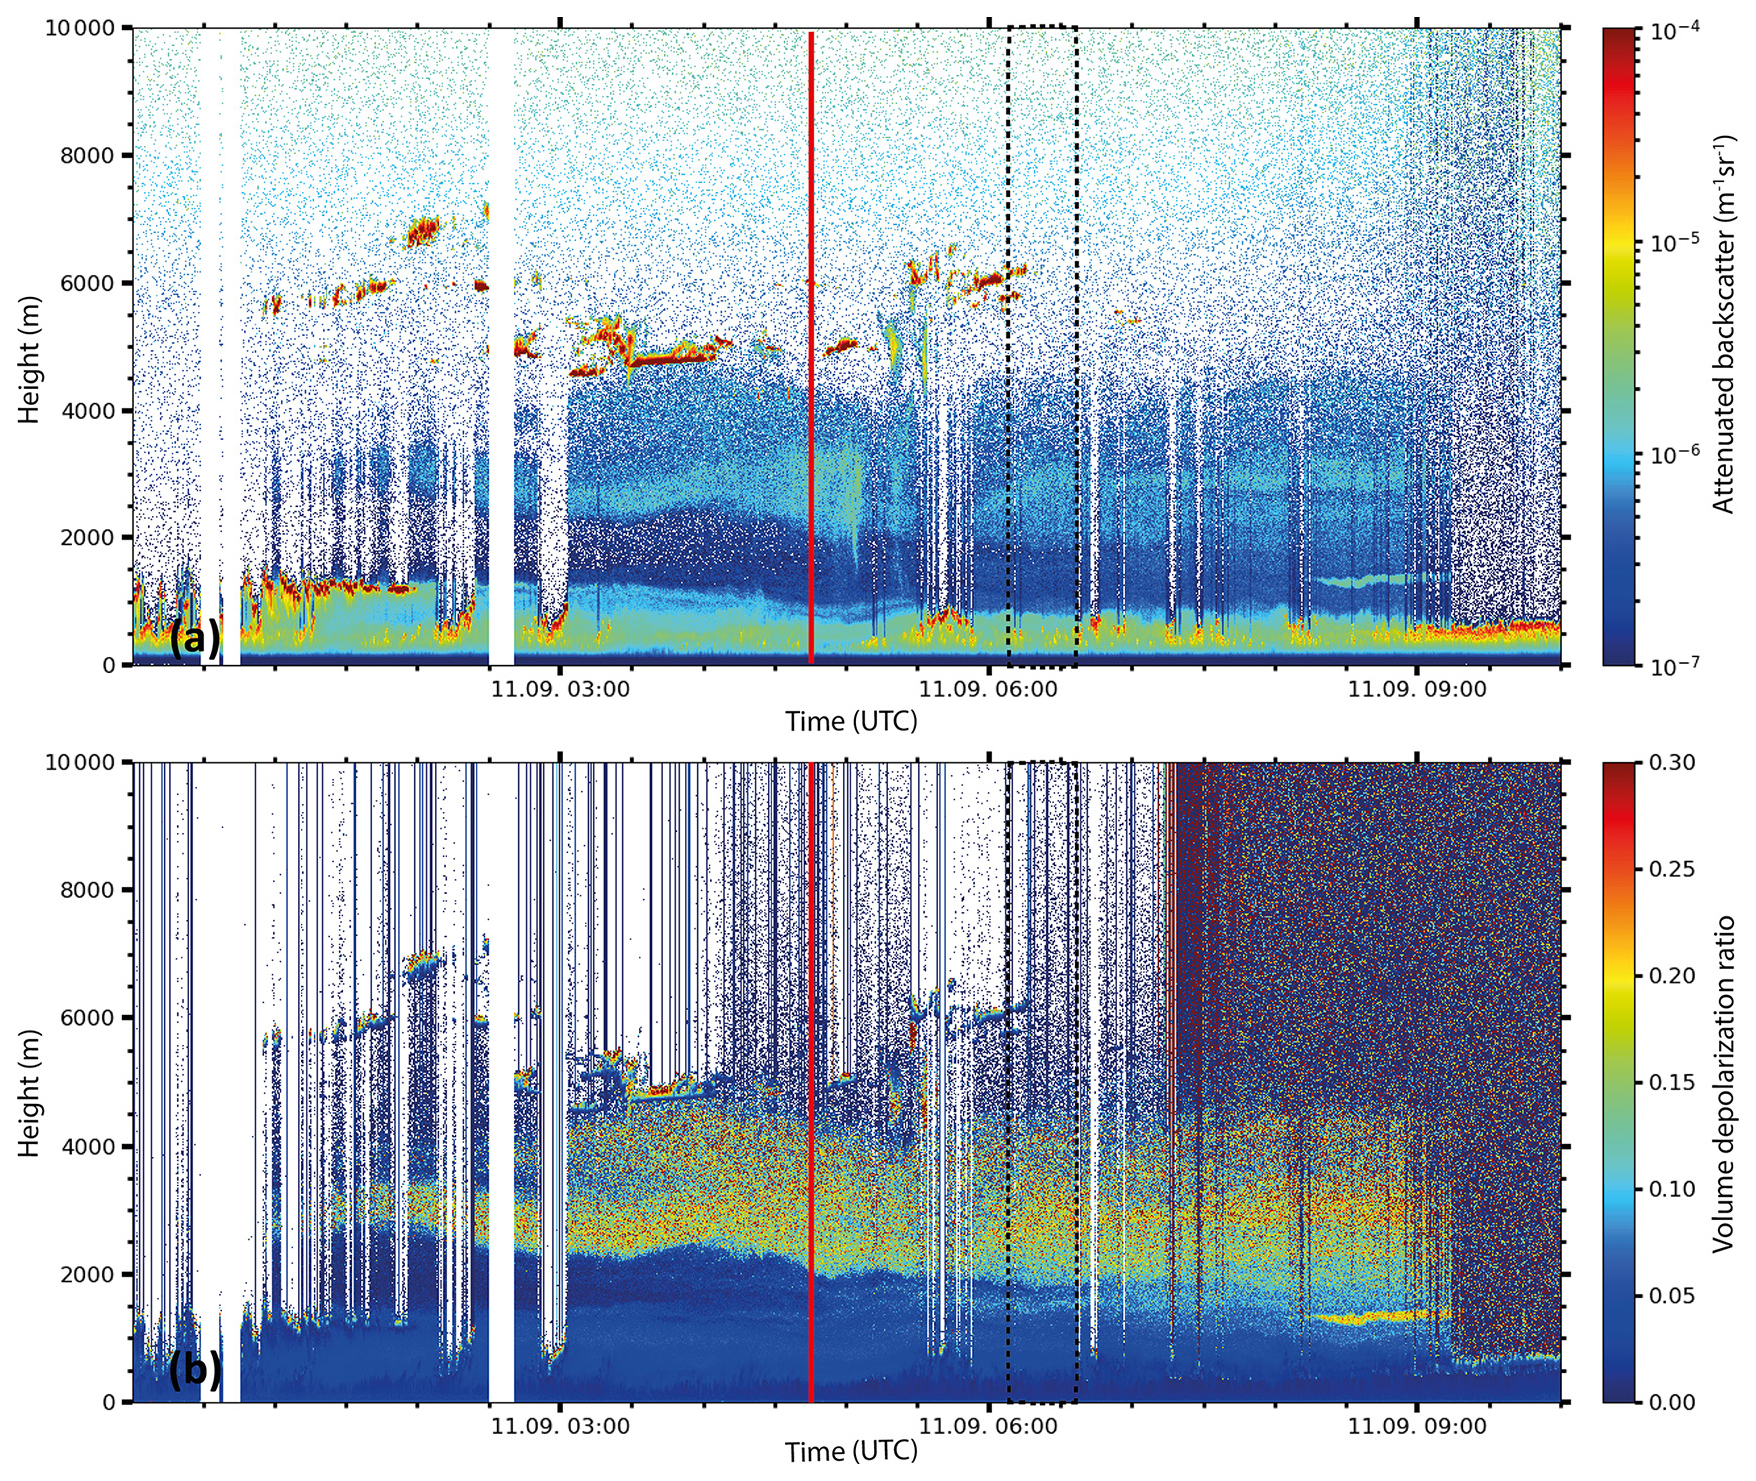
For the third case, an overpass with a minimum distance to the ground-based station that exceeds the commonly-used radius of 100 km was chosen. The selected CALIPSO overpass occurred on 11 September 2022 at approximately 04:44 UTC. The minimum distance between the CALIPSO overpass and the ground-based stations was 129.1 km. Figure 12 depicts the atmospheric conditions over Mindelo. A dust plume reached the Mindelo ground-based station at approximately 01:00 UTC and evolved in a rather dense and stable dust layer at approximately 14:00 UTC (not shown here), as indicated by the attenuated backscatter coefficient at 1064 nm and the volume depolarization ratio at 532 nm (Fig. 12a and b, respectively). A characteristic marine boundary layer is present at altitudes below 2 km with a frequent occurrence of low-level clouds until 13:00 UTC. At the early hours of 11 September 2022, scattered mid-level clouds were also present at altitudes between 5 and 7 km. These clouds are also captured by the SEVIRI Dust product (Fig. D2, yellow colors).
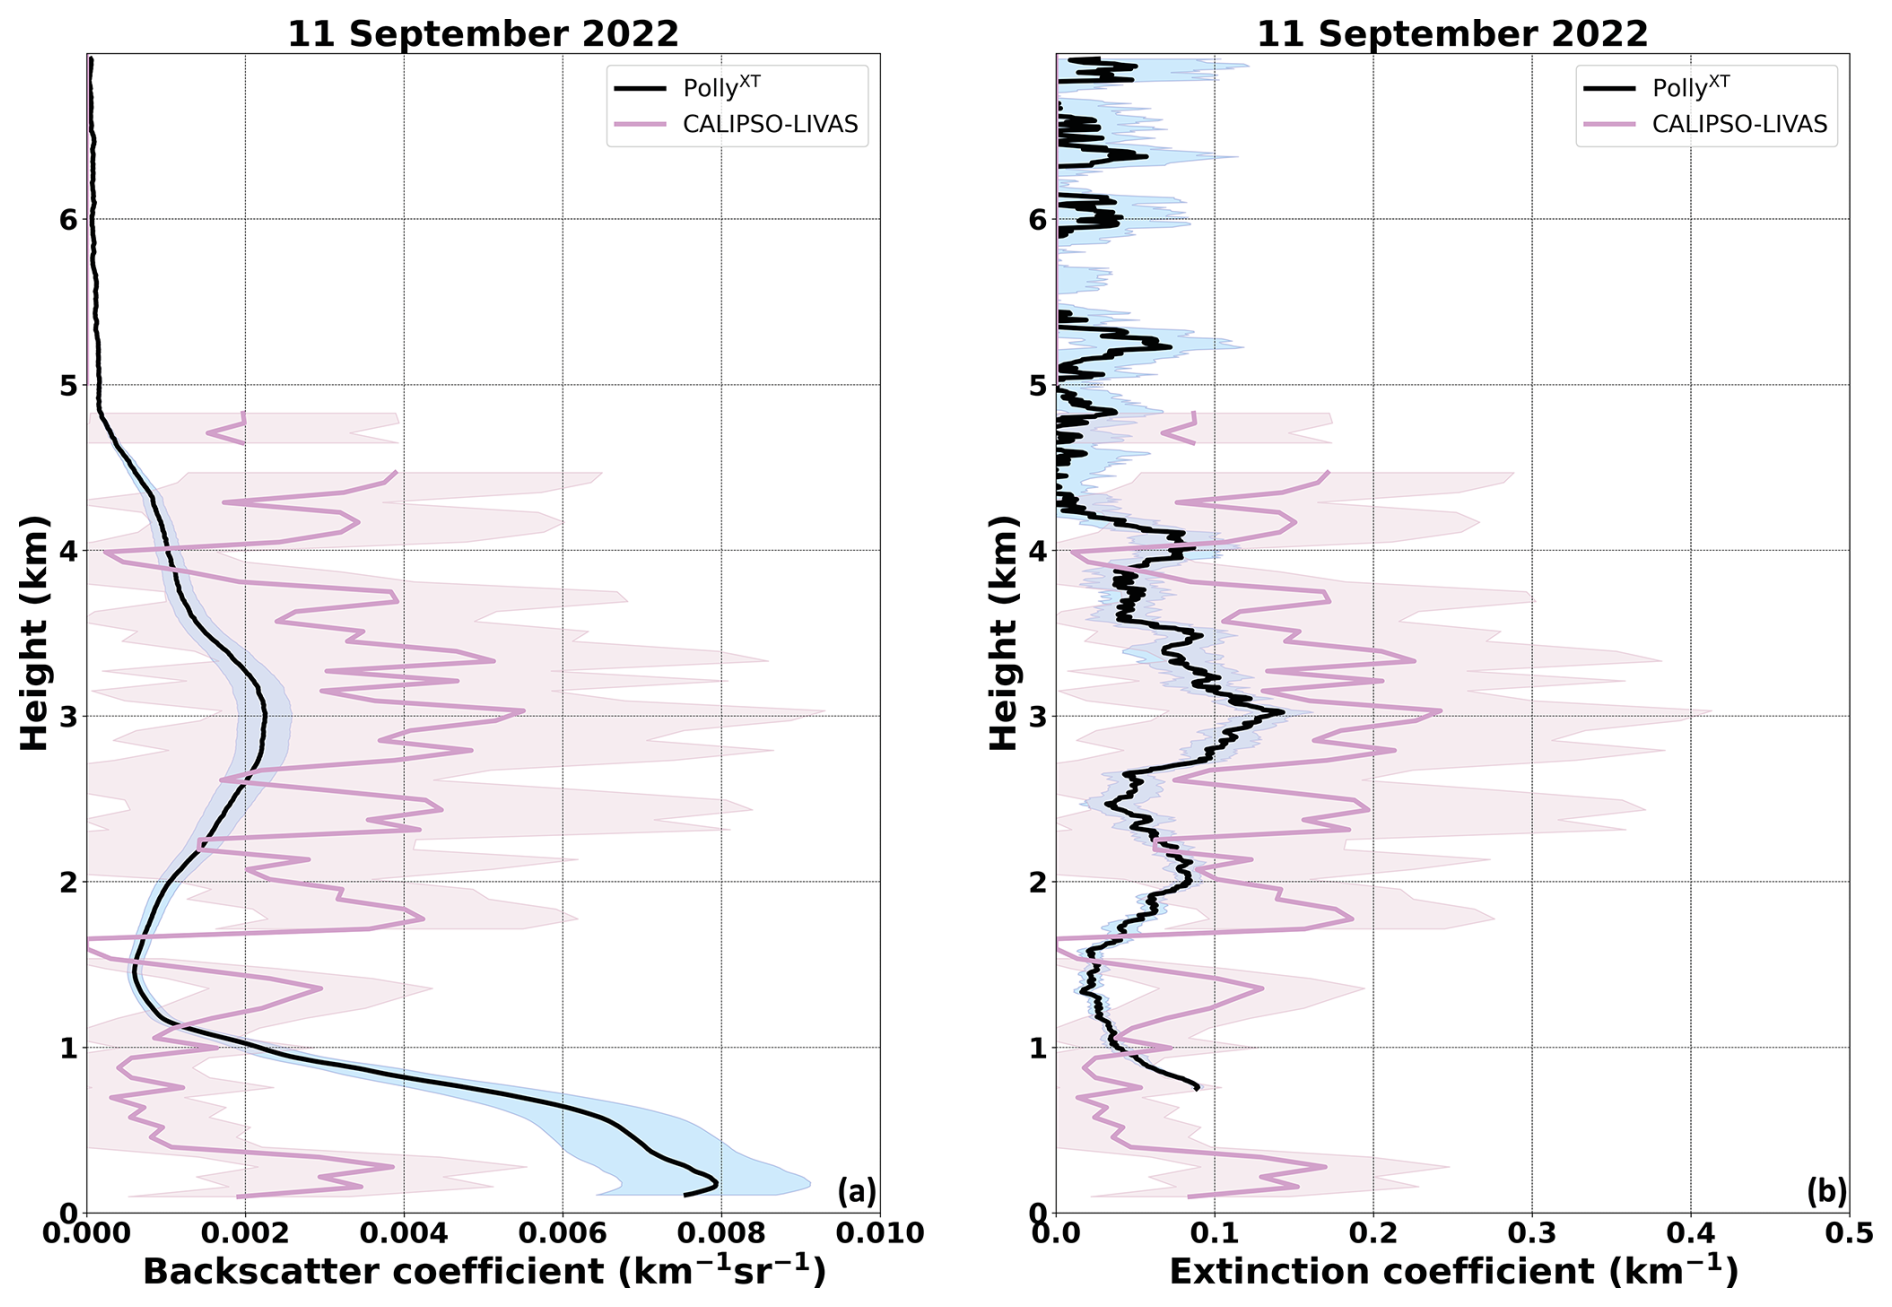
The PollyXT and LIVAS backscatter and extinction coefficient profile comparison is shown in Fig. 13a and b, respectively. The closest available, automatically-retrieved Raman-based optical parameters from the PollyXT lidar were from the time period 06:16–06:35 UTC. The CALIPSO-LIVAS backscatter coefficient is underestimating the aerosol load in the PBL, while agreement between the LIVAS and the PollyXT wihin errors at altitudes between 1.7 and 4.5 km is found, however with the tendency of higher values measured by CALIPSO. The same pattern is also observed for the extinction coefficient. The observed discrepancies can be attributed to the spatial inhomogeneity of the dust plume as indicated in Fig. D2, rather than CALIPSO aerosol subtype missclassification. In the SEVIRI Dust product image (Fig. D2), an enhancement of the intensity of the dust towards the north-west from Mindelo is clearly seen, explaining the higher values seen by CALIPSO. Thus, for this case, simple representativeness of the atmospheric conditions between the satellite-based and the ground-based observation cannot be considered and would require much more sophisticated approaches, such as dispersion modeling.
By utilizing 17 complete years of CALIPSO overpasses, from 2006 till 2022 and within a 300 km radius from the ACTRIS ground-based station in Mindelo, Cabo Verde, the average atmospheric conditions in terms of aerosol were characterized to check to which degree the ground-based fixed lidar measurements are representative, in the context of satellite-based lidar Cal/Val activities. We utilized continuous multiwavelength PollyXT Raman lidar measurements at Mindelo, to assess how monthly mean profiles, as well as single case studies, can be used for spaceborne profiles validation. Our results indicate that the representativeness in this specific geographic region is primarily affected by the spatial homogeneity of the observable target and secondary by the co-location of the ground-based and spaceborne instrumentation.
Cabo Verde is well suited for validation of spaceborne aerosol profiles, in particular for aerosol layers above the MBL. Measurements conducted in Mindelo by ground-based lidars like the PollyXT Raman lidar system are shown to be representative for a radius of roughly 300 km in the usually-occurring lofted aerosol layers (in the SAL) when considering the monthly averages. In the free troposphere above the PBL, particles transported from source regions (e.g., desert dust layers) dominate the aerosol load throughout the year. But also the frequently used radius threshold of 100 km seems to be appropriate in the case of Mindelo. The stable atmospheric stratification hinders vertical mixing and leads to homogeneous aerosol layers making it an ideal place for performing validation activities. On the contrary, the monthly averaged results for the PBL showed higher variability with increasing radius indicating that targets within the PBL, which are mostly originating from local sources, are naturally more susceptible to spatiotemporal variability. The aforementioned results are in agreement with the study of Gimmestad et al. (2017), which report that a ground track offset of less than 100 km does not guarantee a successful comparison, especially in the PBL, due to aerosol inhomogeneity. The long-term, i.e., monthly analysis results highlight the importance of the sample size. It was shown that monthly averages obtained from less than approximately 40 km radius were not as representative, due to the limited number of samples, as the monthly mean values obtained by applying a larger radius and, thus, including much more spaceborne profiles. In conclusion, for the long-term validation of spaceborne aerosol profiles, it is better to use monthly averaged ground-based lidar profiles rather than single profiles during the overpasses, as for the latter ones, representativeness cannot be guaranteed and may lead to wrong conclusions. If, however, representativeness can be guaranteed, as shown in our first case study, also single profile validation is possible and has its own potentials, but if not, it may lead to wrong conclusions as shown for the third case study. But generally, for the long-term assessment of the spaceborne instrument performance, it seems to be more appropriate to use monthly-mean profiles and in turn increase the radius around the station to increase sample size and, thus, introduce representativeness. While the results of this study are in the first instance valid for the Cabo Verde region only, it is known that representativeness is challenging for all ground-based stations when validating spaceborne profilers. Thus, similar studies for other geographic regions should be made in the future. Nevertheless, our study highlights that Cabo Verde, with its omnipresent lofted aerosol layer in the SAL, is well-suited for long-term validation of spaceborne aerosol profiles from the ground. At other ground-based measurement sites, the network approach consisting of multiple stations (e.g., ACTRIS; Baars et al., 2026) might be a good approach to overcome potential representativeness shortcomings and could be investigated in a similar way to the study presented here for Mindelo/Cabo Verde.
The results of this study underline the importance of the careful evaluation of the spatial and temporal homogeneity, with respect to the validation of aerosol and cloud profilers, e.g., EarthCARE, as also highlighted in a dedicated Best Practice Document (Amiridis et al., 2025). Currently, several Cal/Val teams from around the globe are actively working on the validation of L1 and L2 EarthCARE products from all instruments (Eisinger et al., 2024). As a common practice, the EarthCARE Cal/Val community uses frequently in the first instance a maximum radius of 100 km around the ground station for validation. According to this study, the maximum radius that can be used depends on the validation approach and determines which criteria to set. For monthly averaged profiles, larger radii might be more appropriate, while for single profile validation, much smaller radii or additional approaches, such as backtrajectories or dispersion modeling, might be needed to consider the comparison as representative. Therefore, this study can be considered as a pilot study and the methodology could be applied to other stations as well, to investigate the spatial variability of the atmospheric targets in different geographic regions and create effective Cal/Val strategies. Additionally, the study can be used as a tool to assess the spatiotemporal homogeneity of natural and anthropogenic aerosol, which has also air quality implications.
Table A1 presents the total number of available LIVAS profiles (including clouds) and cloud-free profiles that were identified at different radii around the ground-based station in Mindelo, Cabo Verde between 2006 and 2023. The number of total and cloud-free LIVAS profiles only for the ASKOS intensive period is shown in Table A2.
Table A1Number of total and cloud-free LIVAS profiles for different radii around Mindelo station for the period 2006–2023.
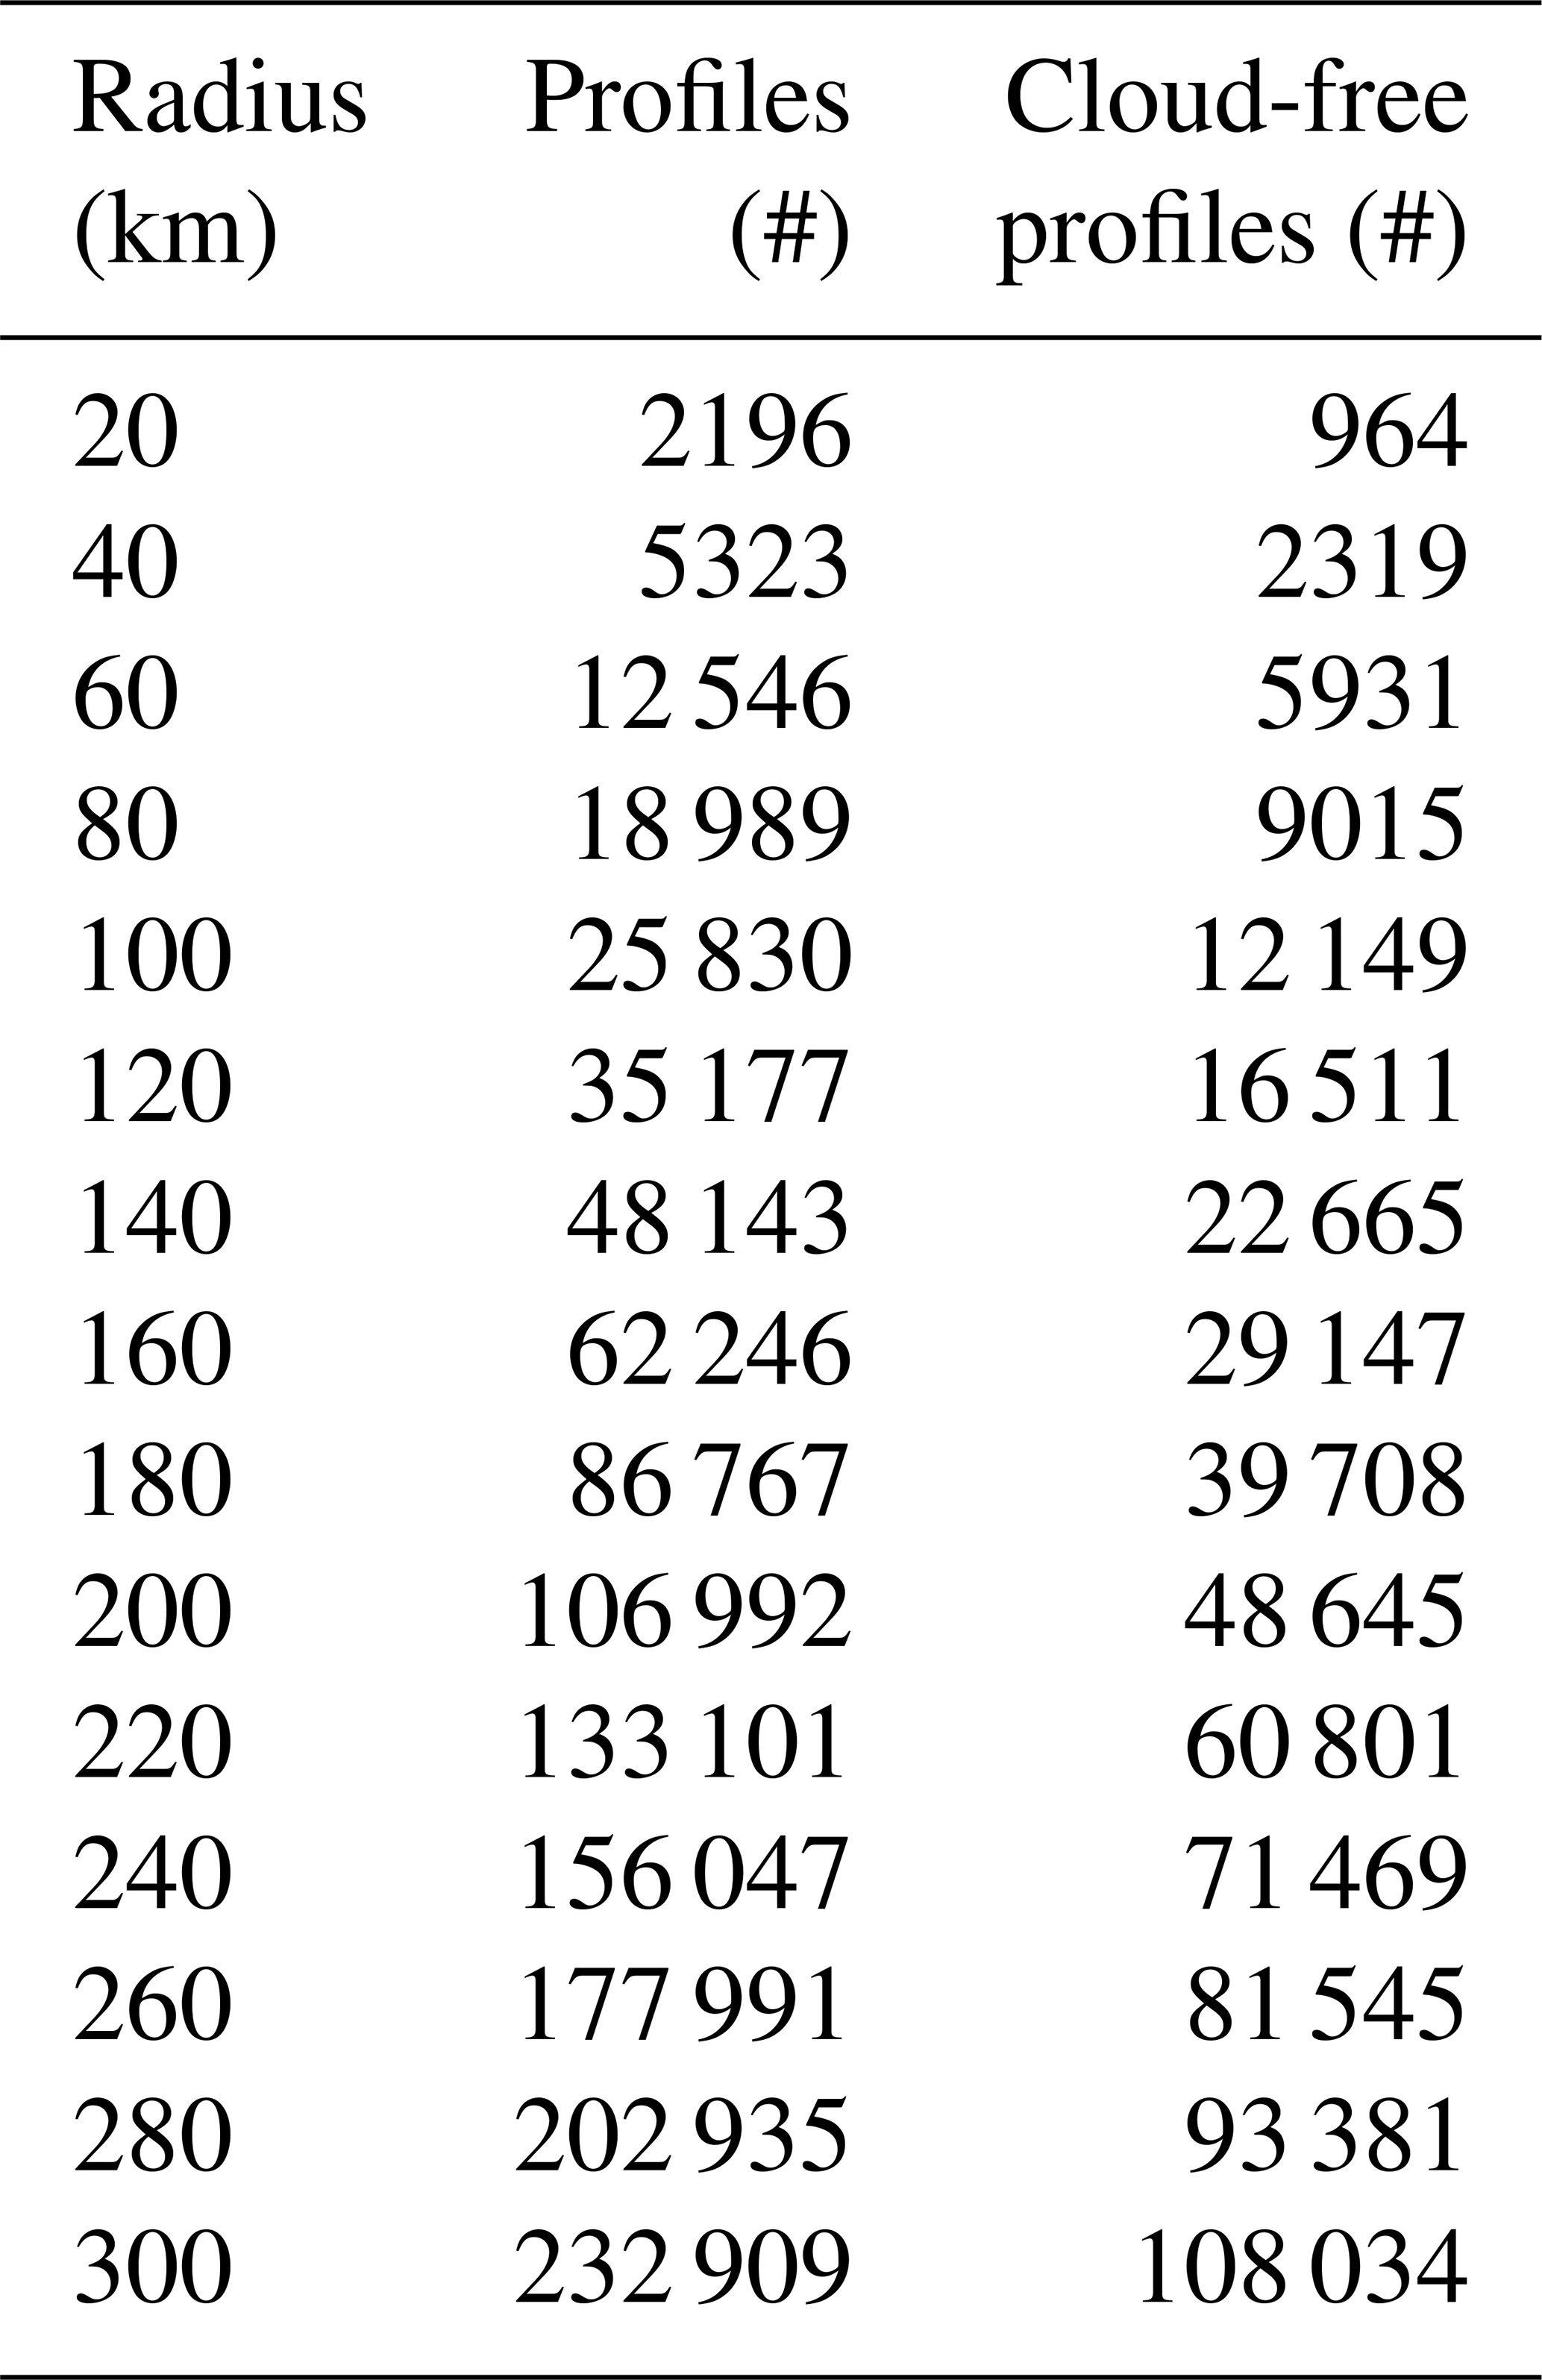
Table A2Number of total and cloud-free LIVAS profiles for different radii around Mindelo station during the ASKOS intensive periods.
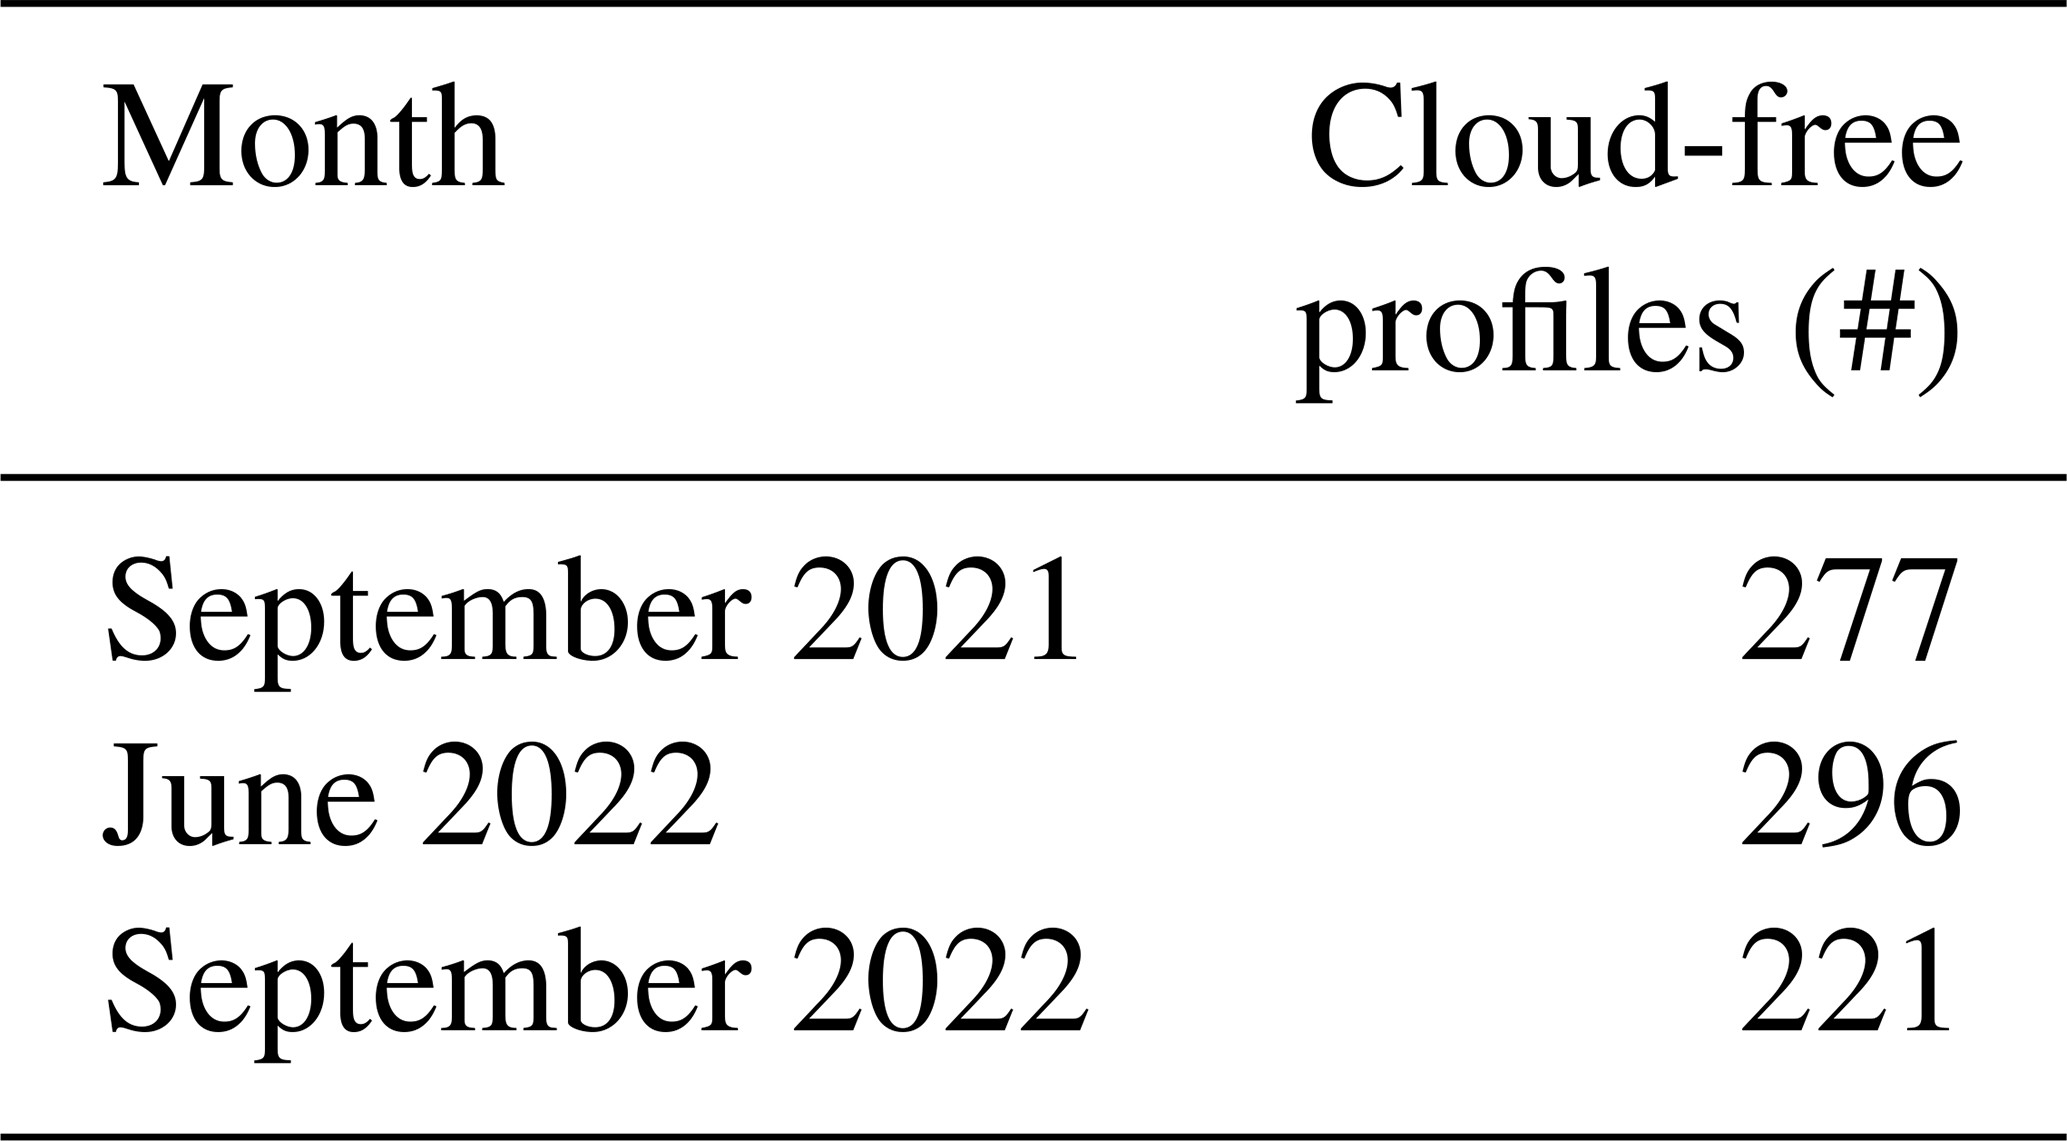
The total number of cloud-free profiles that were derived by the PollyXT lidar measurements during the ASKOS intensive phases in Mindelo, Cabo Verde is shown in Table B1.
Table B1Number of cloud-free optical profiles as derived from the PollyXT lidar measurements at Mindelo for the respective ASKOS months.
The vertical resolution of the PollyXT and the LIVAS data differs, as already mentioned in Sect. 2.1. Therefore, the high resolution PollyXT data were transformed to a coarser resolution to allow for a one-to-one comparison. Approximately eight PollyXT height bins correspond to one LIVAS height bin.
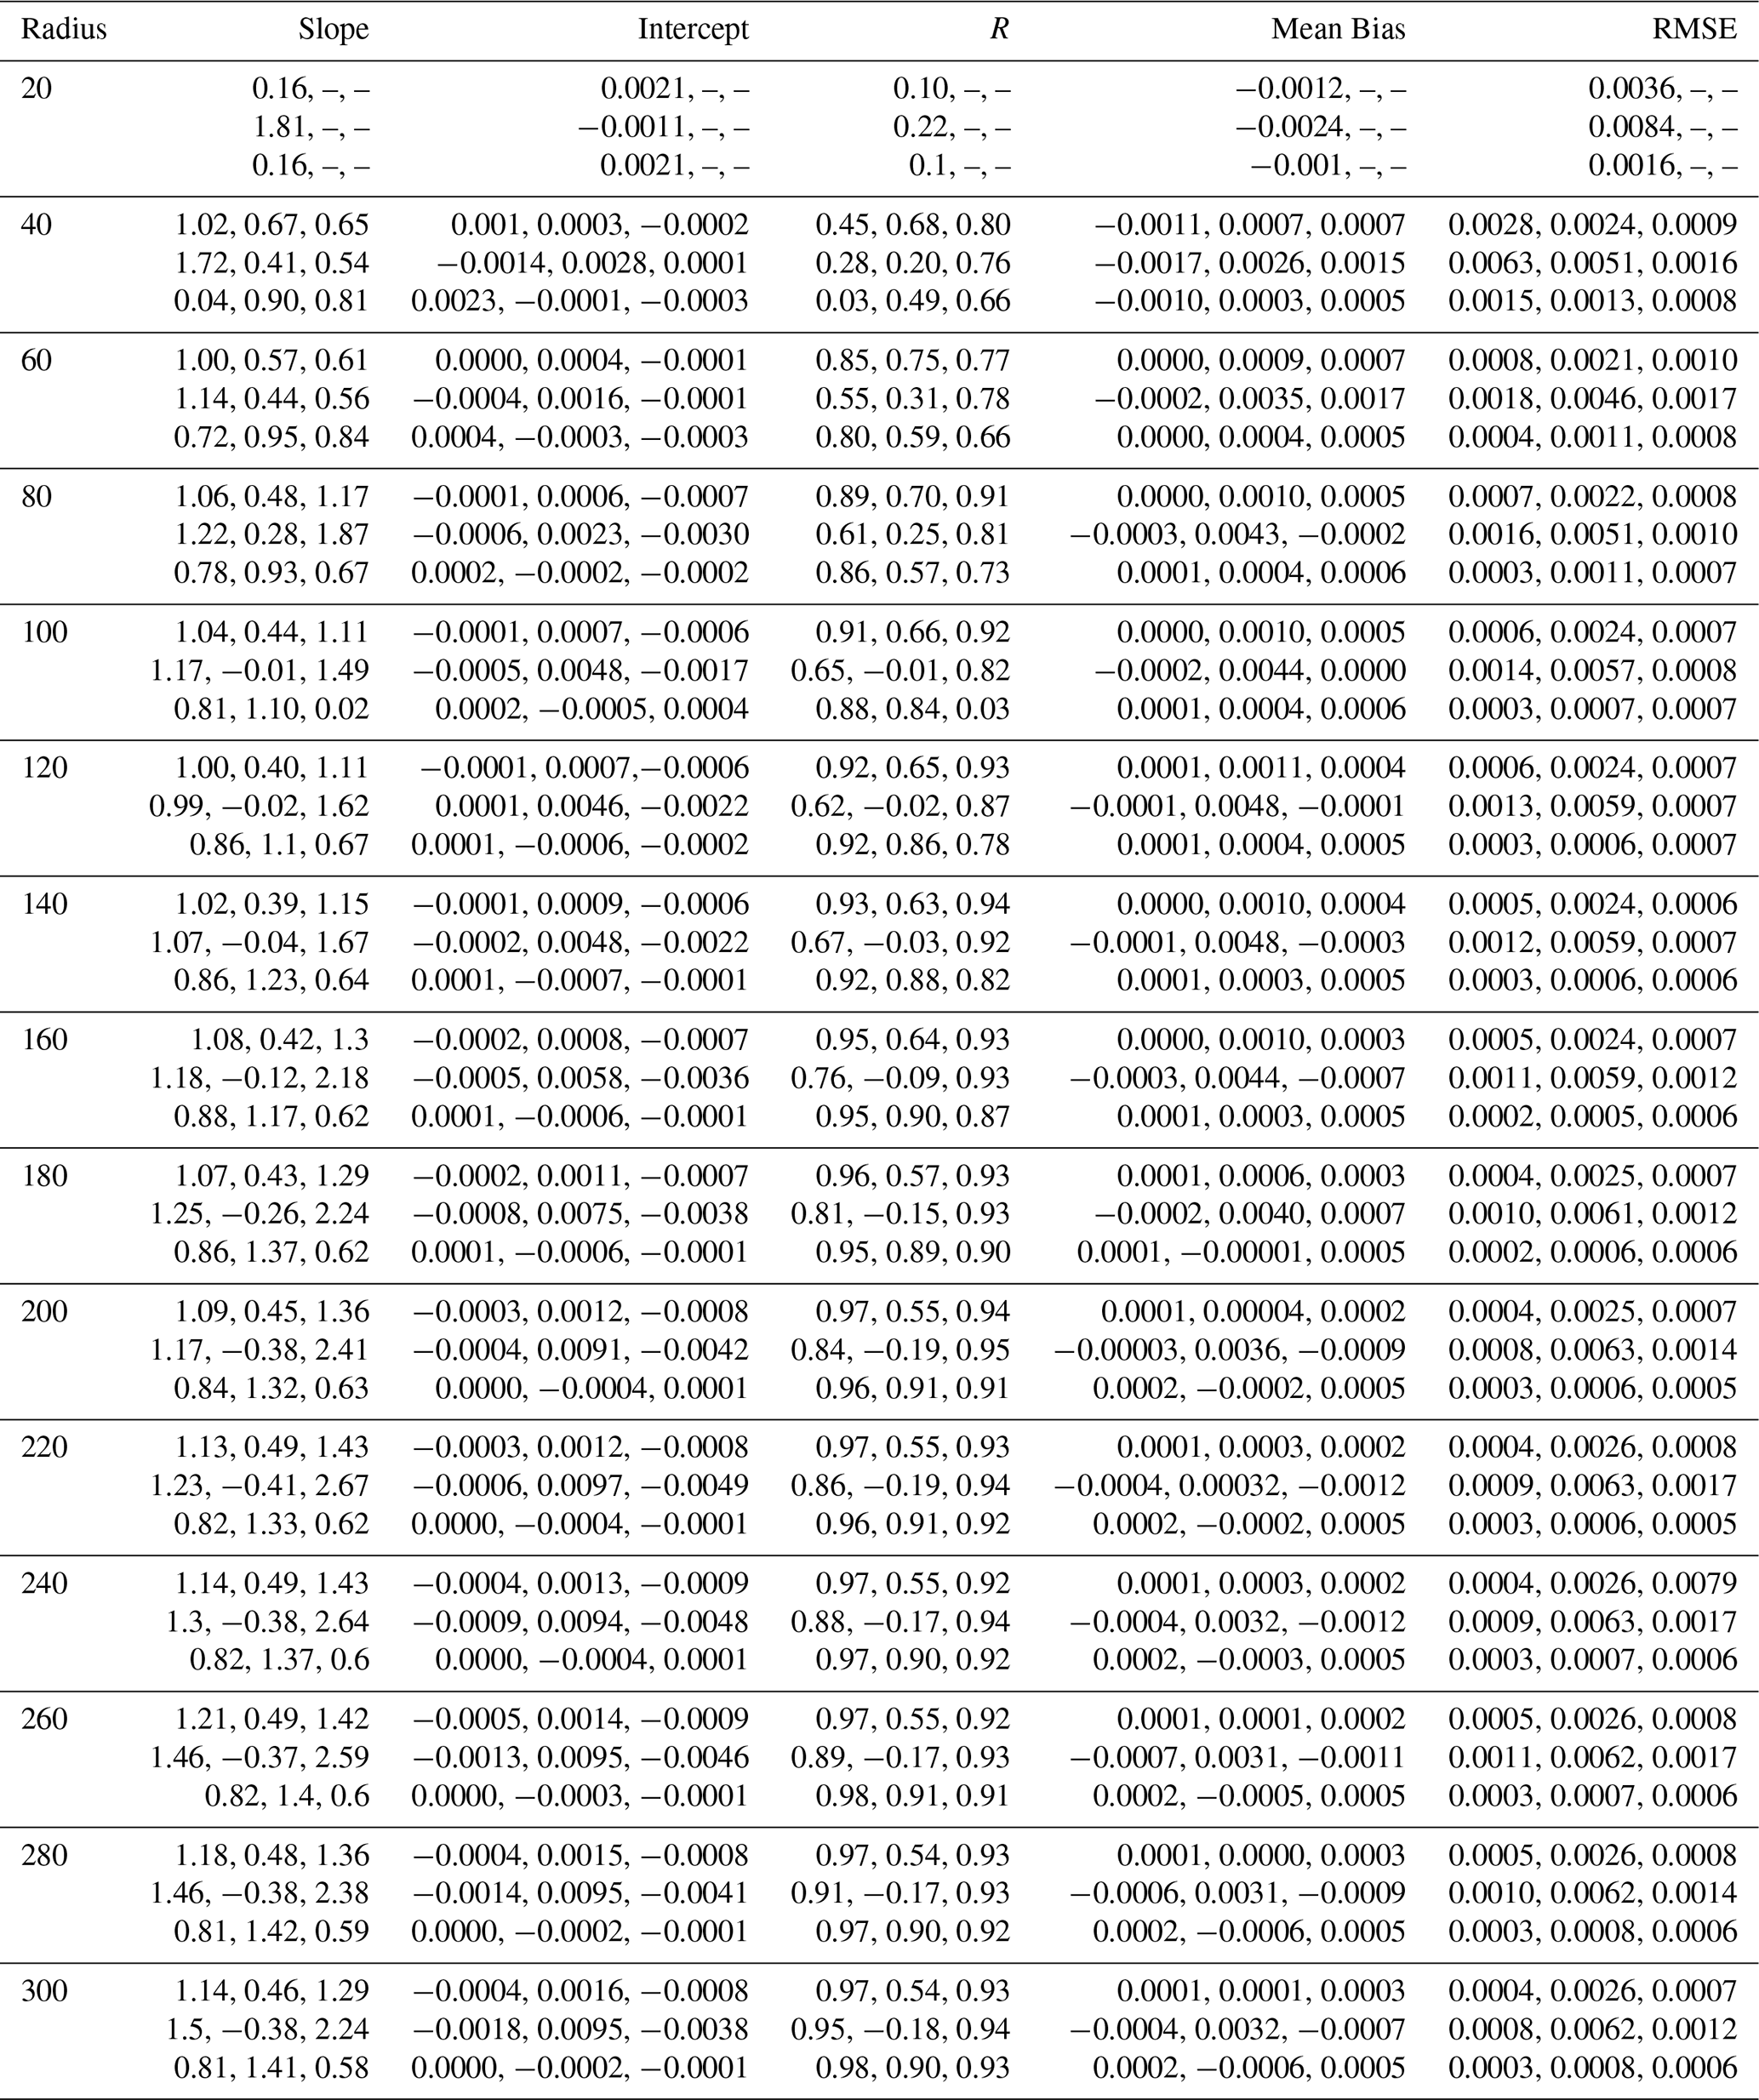
Table C1Regression statistics (slope, intercept, correlation coefficient) as well as mean bias and root mean square error, as a function of radius for September 2021, June 2022 and September 2022 (separated by a comma). For each radius we report these metrics for the whole profile (first row), PBL (second row) and finally, lofted aerosol layer from 1–6 km (third row).
The MSG-SEVIRI dust product for 17 June 2022 and 11 September 2022 (see Sect. 3.3.2 and 3.3.3, respectively) is shown in Figs. D1 and D2, respectively. Pink to violet colors indicate dust layers.
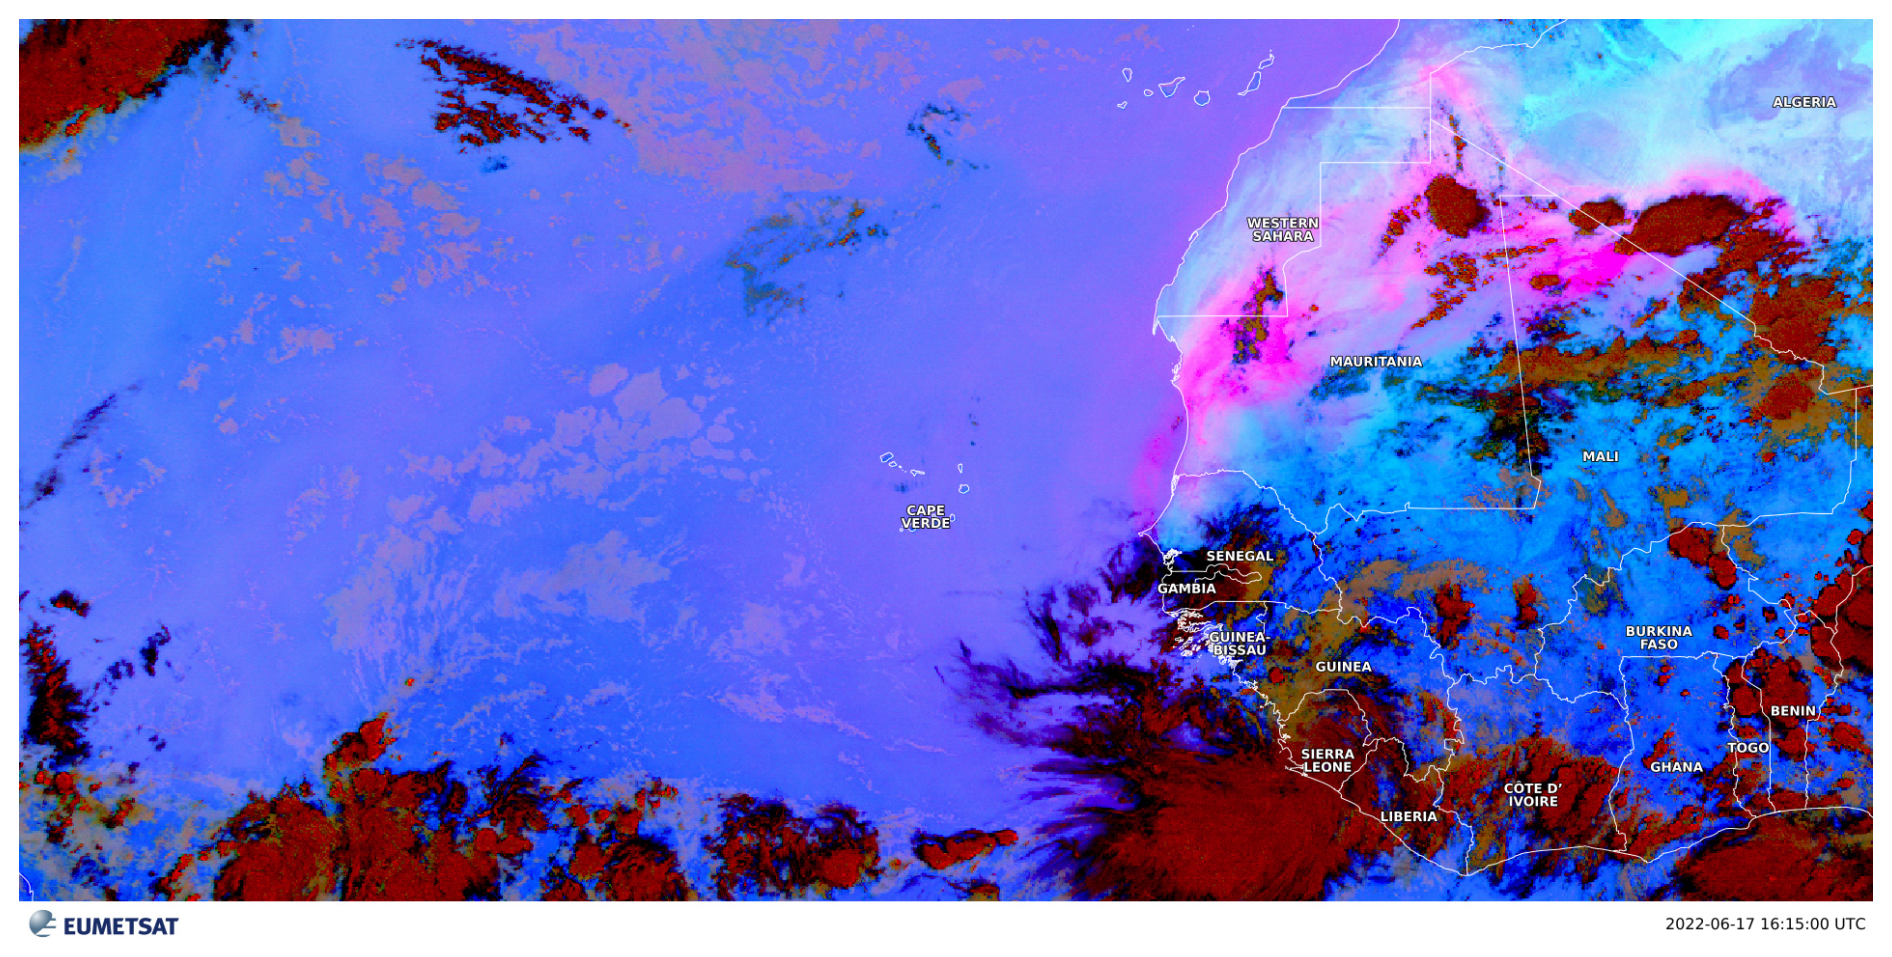
Figure D1Same as Fig. 8, but for 17 June 2022 at 16:15 UTC.
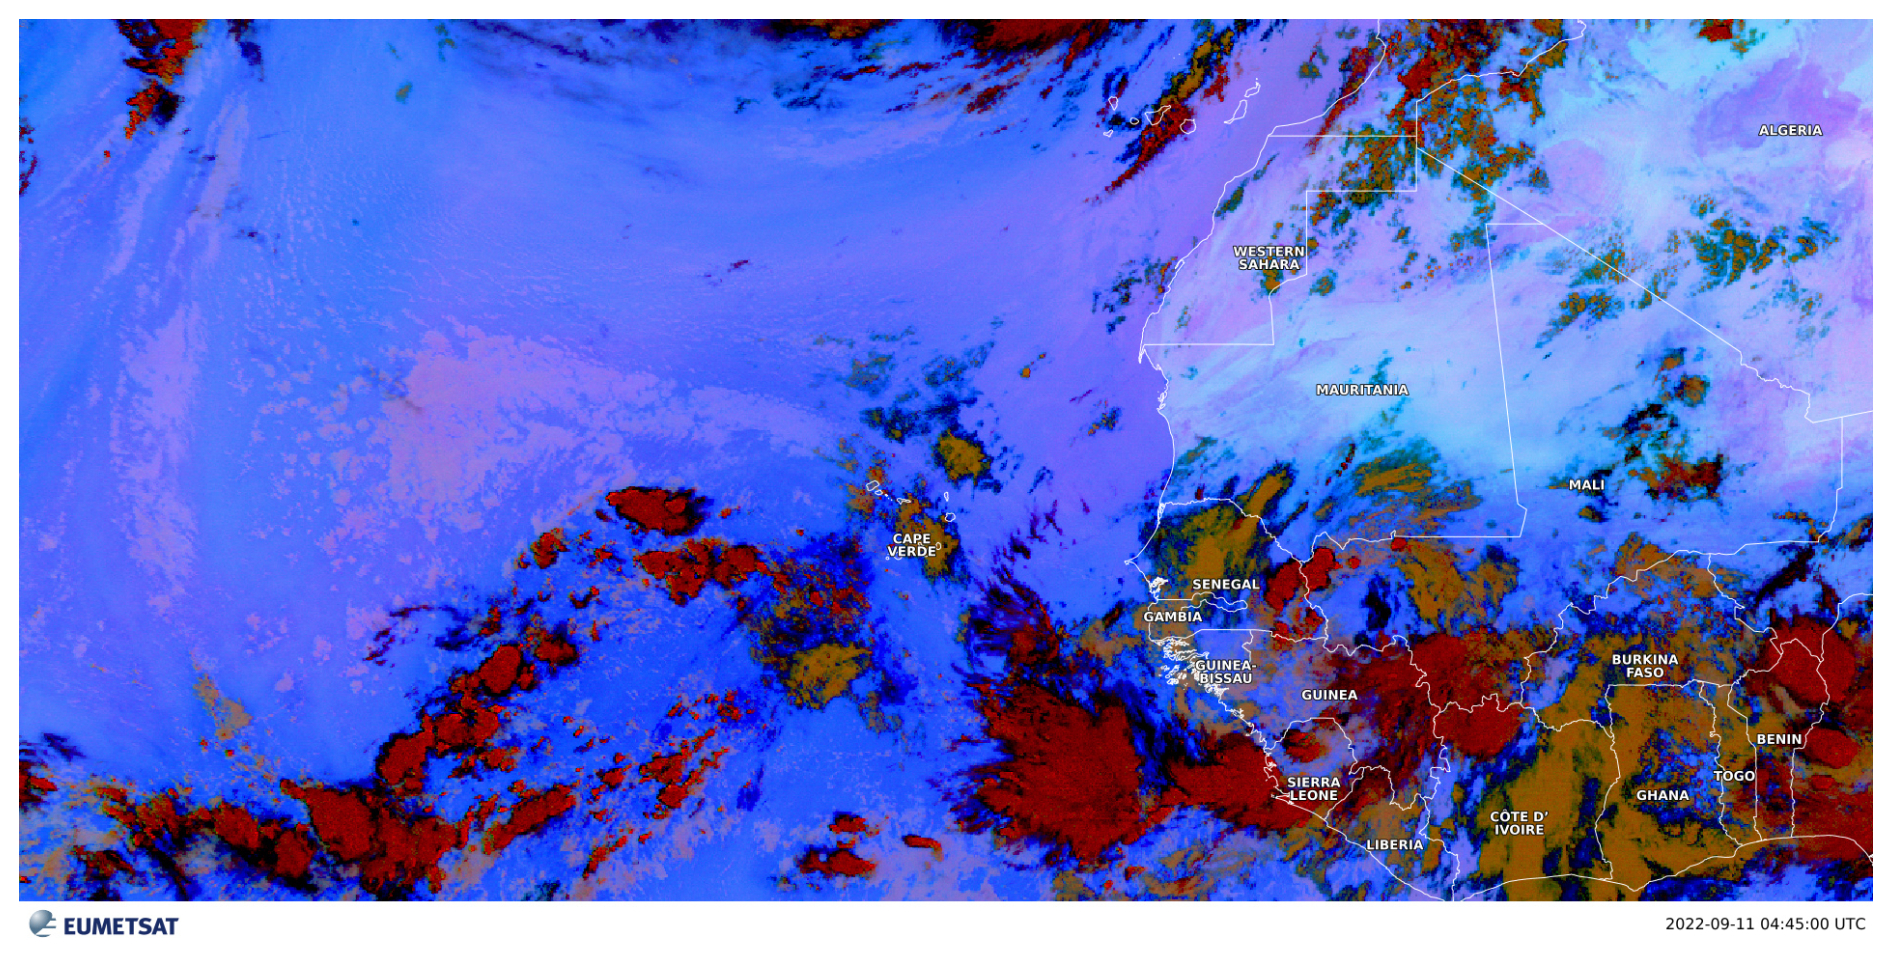
Figure D2Same as Fig. 8, but for 11 September 2022 at 04:45 UTC.
For the lidar data visualization (Figs. 7, 10 and 12), pyLARDA was used (https://doi.org/10.5281/zenodo.4721311, Bühl et al., 2021).
The complete ASKOS dataset is available via the ESA Atmospheric Validation Data Centre under (https://doi.org/10.60621/jatac.campaign.2021.2022.caboverde, Amiridis et al., 2023). Quicklooks of the PollyXT lidar products are publicly available at https://polly.tropos.de/. The LIVAS dataset and products are available upon request from Konstantinos Rizos (k.rizos@noa.gr).
AAF analysed the data and drafted the manuscript together with HB. KR derived and provided the LIVAS data. RE, EM, PP, DT, AS, TF, VA and HB were actively involved in the ASKOS campaign. JH performed the backtrajectory analysis. AA, HB and UW contributed to the scientific discussion. All co-authors contributed to the manuscript preparation.
At least one of the (co-)authors is a member of the editorial board of Atmospheric Measurement Techniques. The peer-review process was guided by an independent editor, and the authors also have no other competing interests to declare.
Publisher's note: Copernicus Publications remains neutral with regard to jurisdictional claims made in the text, published maps, institutional affiliations, or any other geographical representation in this paper. The authors bear the ultimate responsibility for providing appropriate place names. Views expressed in the text are those of the authors and do not necessarily reflect the views of the publisher.
This article is part of the special issue “The Joint Aeolus Tropical Atlantic Campaign (JATAC) (AMT/ACP inter-journal SI)”. It is not associated with a conference.
EM acknowledges support by the PANGEA4CalVal project (Grant Agreement 101079201) funded by the European Union. The authors gratefully acknowledge the NOAA Air Resources Laboratory (ARL) for the provision of the HYSPLIT transport and dispersion model used in this publication and wish to thank the OSCM team for their infrastructural support and logistics during the ASKOS operations and beyond.
This research has been supported by the Bundesministerium für Forschung, Technologie und Raumfahrt (grant no. 01LK2001A), the Bundesministerium für Wirtschaft und Energie (grant no. 50EE1721C), and the European Space Agency (grant no. ESA RFP/3-17843/22/I-NS).
This paper was edited by Marco Gaetani and reviewed by two anonymous referees.
Abril-Gago, J., Ortiz-Amezcua, P., Bermejo-Pantaleón, D., Andújar-Maqueda, J., Bravo-Aranda, J. A., Granados-Muñoz, M. J., Navas-Guzmán, F., Alados-Arboledas, L., Foyo-Moreno, I., and Guerrero-Rascado, J. L.: Validation activities of Aeolus wind products on the southeastern Iberian Peninsula, Atmos. Chem. Phys., 23, 8453–8471, https://doi.org/10.5194/acp-23-8453-2023, 2023. a
Amiridis, V., Wandinger, U., Marinou, E., Giannakaki, E., Tsekeri, A., Basart, S., Kazadzis, S., Gkikas, A., Taylor, M., Baldasano, J., and Ansmann, A.: Optimizing CALIPSO Saharan dust retrievals, Atmos. Chem. Phys., 13, 12089–12106, https://doi.org/10.5194/acp-13-12089-2013, 2013. a
Amiridis, V., Marinou, E., Tsekeri, A., Wandinger, U., Schwarz, A., Giannakaki, E., Mamouri, R., Kokkalis, P., Binietoglou, I., Solomos, S., Herekakis, T., Kazadzis, S., Gerasopoulos, E., Proestakis, E., Kottas, M., Balis, D., Papayannis, A., Kontoes, C., Kourtidis, K., Papagiannopoulos, N., Mona, L., Pappalardo, G., Le Rille, O., and Ansmann, A.: LIVAS: a 3-D multi-wavelength aerosol/cloud database based on CALIPSO and EARLINET, Atmos. Chem. Phys., 15, 7127–7153, https://doi.org/10.5194/acp-15-7127-2015, 2015. a, b
Amiridis, V., Marinou, E., Paschou, P., Baars, H., Pirloaga, R., Engelmann, R., Tsekeri, A., Tsikoudi, I., Daskalopoulou, V., Kazadzis, S., Skupin, A., Marenco, F., Kezoudi, M., Kouklaki, D., Siomos, N., Floutsi, A. A., Metallinos, S., Spanakis Misirlis, V., Raptis, P., Althausen, D., Seifert, P., Nemuc, A., Antonescu, B., Papetta, A., and Wandinger, U.: ASKOS Campaign Dataset, ESA Atmospheric Validation Data Centre [data set], https://doi.org/10.60621/jatac.campaign.2021.2022.caboverde, 2023. a, b
Amiridis, V., Marinou, E., Hostetler, C., Koopman, R., Cecil, D., Moisseev, D., Tackett, J., Groß, S., Baars, H., Redemann, J., Marenco, F., Baldini, L., Tanelli, S., Fielding, M., Janiskova, M., Tanaka, T., O'Connor, E., Fjaeraa, A. M., Paschou, P., Voudouri, K. A., Ferrare, R., Burton, S., Schuster, G., Kato, S., Winker, D., Shook, M., Bley, S., Haarig, M., Floutsi, A. A., Wandinger, U., Trapon, D., Pfitzenmaier, L., Papagiannopoulos, N., Mona, L., Posselt, D., Mason, S., Rennie, M., Benedetti, A., Hogan, R., Sogacheva, L., Balis, D., Michailidis, K., van Zadelhoff, G.-J., Nowottnick, E., Yorks, J., Mroz, K., Donovan, D., L'Ecuyer, T., Okamoto, H., Sato, K., Henderson, D., Nishikawa, T., Barker, H., Cole, J., Qu, Z., Clerbaux, N., Nakajima, T., Chase, R., Wolff, D., Landulfo, E., Kirstetter, P.-E., Mather, J., Ohigashi, T., Ryder, C., Tzallas, V., Tsikoudi, I., Tsekeri, A., Tsichla, M., Koutsoupi, I., Kubota, T., Siomos, N., Takahashi, N., Horie, H., Suzuki, K., Mace, J., McLean, W., Borderies, M., Mangla, R., Escribano, J., Moradi, I., Zhang, J., Juli, R., Ikuta, Y., Marbach, T., Bojkov, B., Accadia, C., Fougnie, B., Spezzi, L., Bozzo, A., Chimot, J., Jafariserajehlou, S., Flament, T., Mattioli, V., Strandgren, J., Barlakas, V., and Kollias, P.: Best Practice Protocol for the validation of Aerosol, Cloud, and Precipitation Profiles (ACPPV), Zenodo, https://doi.org/10.5281/zenodo.15025627, 2025. a, b, c
Baars, H., Kanitz, T., Engelmann, R., Althausen, D., Heese, B., Komppula, M., Preißler, J., Tesche, M., Ansmann, A., Wandinger, U., Lim, J.-H., Ahn, J. Y., Stachlewska, I. S., Amiridis, V., Marinou, E., Seifert, P., Hofer, J., Skupin, A., Schneider, F., Bohlmann, S., Foth, A., Bley, S., Pfüller, A., Giannakaki, E., Lihavainen, H., Viisanen, Y., Hooda, R. K., Pereira, S. N., Bortoli, D., Wagner, F., Mattis, I., Janicka, L., Markowicz, K. M., Achtert, P., Artaxo, P., Pauliquevis, T., Souza, R. A. F., Sharma, V. P., van Zyl, P. G., Beukes, J. P., Sun, J., Rohwer, E. G., Deng, R., Mamouri, R.-E., and Zamorano, F.: An overview of the first decade of PollyNET: an emerging network of automated Raman-polarization lidars for continuous aerosol profiling, Atmos. Chem. Phys., 16, 5111–5137, https://doi.org/10.5194/acp-16-5111-2016, 2016. a, b
Baars, H., Radenz, M., Floutsi, A. A., Engelmann, R., Althausen, D., Heese, B., Ansmann, A., Flament, T., Dabas, A., Trapon, D., Reitebuch, O., Bley, S., and Wandinger, U.: Californian Wildfire Smoke Over Europe: A First Example of the Aerosol Observing Capabilities of Aeolus Compared to Ground-Based Lidar, Geophys. Res. Lett., 48, https://doi.org/10.1029/2020GL092194, 2021. a
Baars, H., Walchester, J., Basharova, E., Gebauer, H., Radenz, M., Bühl, J., Barja, B., Wandinger, U., and Seifert, P.: Long-term validation of Aeolus L2B wind products at Punta Arenas, Chile, and Leipzig, Germany, Atmos. Meas. Tech., 16, 3809–3834, https://doi.org/10.5194/amt-16-3809-2023, 2023. a, b
Baars, H., Marinou, E., Mona, L., O'Connor, E., Rusli, S., Koopman, R., Fjæraa, A. M., and Nicolae, D.: The European preparation activities for the EarthCARE validation in the framework of ACTRIS/ATMO-ACCESS, 31st International Laser Radar Conference (ILRC-31) together with the 22nd Coherent Laser Radar Conference (CLRC), in preparation, 2026. a
Bohlmann, S., Baars, H., Radenz, M., Engelmann, R., and Macke, A.: Ship-borne aerosol profiling with lidar over the Atlantic Ocean: from pure marine conditions to complex dust–smoke mixtures, Atmos. Chem. Phys., 18, 9661–9679, https://doi.org/10.5194/acp-18-9661-2018, 2018. a
Borne, M., Knippertz, P., Weissmann, M., Witschas, B., Flamant, C., Rios-Berrios, R., and Veals, P.: Validation of Aeolus L2B products over the tropical Atlantic using radiosondes, Atmos. Meas. Tech., 17, 561–581, https://doi.org/10.5194/amt-17-561-2024, 2024. a
Bühl, J., Radenz, M., Schimmel, W., Vogl, T., Röttenbacher, J., and Lochmann, M.: pyLARDA v3.2, Zenodo [code], https://doi.org/10.5281/zenodo.4721311, 2021. a
Burton, S. P., Ferrare, R. A., Hostetler, C. A., Hair, J. W., Kittaka, C., Vaughan, M. A., Obland, M. D., Rogers, R. R., Cook, A. L., Harper, D. B., and Remer, L. A.: Using airborne high spectral resolution lidar data to evaluate combined active plus passive retrievals of aerosol extinction profiles, J. Geophys. Res.-Atmos., 115, https://doi.org/10.1029/2009JD012130, 2010. a
Burton, S. P., Ferrare, R. A., Vaughan, M. A., Omar, A. H., Rogers, R. R., Hostetler, C. A., and Hair, J. W.: Aerosol classification from airborne HSRL and comparisons with the CALIPSO vertical feature mask, Atmos. Meas. Tech., 6, 1397–1412, https://doi.org/10.5194/amt-6-1397-2013, 2013. a
Drakaki, E., Amiridis, V., Tsekeri, A., Gkikas, A., Proestakis, E., Mallios, S., Solomos, S., Spyrou, C., Marinou, E., Ryder, C. L., Bouris, D., and Katsafados, P.: Modeling coarse and giant desert dust particles, Atmos. Chem. Phys., 22, 12727–12748, https://doi.org/10.5194/acp-22-12727-2022, 2022. a
Eisinger, M., Marnas, F., Wallace, K., Kubota, T., Tomiyama, N., Ohno, Y., Tanaka, T., Tomita, E., Wehr, T., and Bernaerts, D.: The EarthCARE mission: science data processing chain overview, Atmos. Meas. Tech., 17, 839–862, https://doi.org/10.5194/amt-17-839-2024, 2024. a, b
Engelmann, R., Kanitz, T., Baars, H., Heese, B., Althausen, D., Skupin, A., Wandinger, U., Komppula, M., Stachlewska, I. S., Amiridis, V., Marinou, E., Mattis, I., Linné, H., and Ansmann, A.: The automated multiwavelength Raman polarization and water-vapor lidar PollyXT: the neXT generation, Atmos. Meas. Tech., 9, 1767–1784, https://doi.org/10.5194/amt-9-1767-2016, 2016. a, b, c
Ferrare, R., Hair, J., Hostetler, C., Shingler, T., Burton, S. P., Fenn, M., Clayton, M., Scarino, A. J., Harper, D., Seaman, S., Cook, A., Crosbie, E., Winstead, E., Ziemba, L., Thornhill, L., Robinson, C., Moore, R., Vaughan, M., Sorooshian, A., Schlosser, J. S., Liu, H., Zhang, B., Diskin, G., DiGangi, J., Nowak, J., Choi, Y., Zuidema, P., and Chellappan, S.: Airborne HSRL-2 measurements of elevated aerosol depolarization associated with non-spherical sea salt, Front. Remote Sens., 4, 1143944, https://doi.org/10.3389/frsen.2023.1143944, 2023. a
Flament, T., Trapon, D., Lacour, A., Dabas, A., Ehlers, F., and Huber, D.: Aeolus L2A aerosol optical properties product: standard correct algorithm and Mie correct algorithm, Atmos. Meas. Tech., 14, 7851–7871, https://doi.org/10.5194/amt-14-7851-2021, 2021. a
Floutsi, A. A., Baars, H., Engelmann, R., Althausen, D., Ansmann, A., Bohlmann, S., Heese, B., Hofer, J., Kanitz, T., Haarig, M., Ohneiser, K., Radenz, M., Seifert, P., Skupin, A., Yin, Z., Abdullaev, S. F., Komppula, M., Filioglou, M., Giannakaki, E., Stachlewska, I. S., Janicka, L., Bortoli, D., Marinou, E., Amiridis, V., Gialitaki, A., Mamouri, R.-E., Barja, B., and Wandinger, U.: DeLiAn – a growing collection of depolarization ratio, lidar ratio and Ångström exponent for different aerosol types and mixtures from ground-based lidar observations, Atmos. Meas. Tech., 16, 2353–2379, https://doi.org/10.5194/amt-16-2353-2023, 2023. a, b
GDAS: Global Data Assimilation System, meteorological data base, https://www.ready.noaa.gov/gdas1.php (last access: 17 February 2026), 2026. a
Gebauer, H., Floutsi, A. A., Haarig, M., Radenz, M., Engelmann, R., Althausen, D., Skupin, A., Ansmann, A., Zenk, C., and Baars, H.: Tropospheric sulfate from Cumbre Vieja (La Palma) observed over Cabo Verde contrasted with background conditions: a lidar case study of aerosol extinction, backscatter, depolarization and lidar ratio profiles at 355, 532 and 1064 nm, Atmos. Chem. Phys., 24, 5047–5067, https://doi.org/10.5194/acp-24-5047-2024, 2024. a, b
Gebauer, H., Floutsi, A. A., Hofer, J., Haarig, M., Skupin, A., Engelmann, R., Jimenez, C., Wagner, R., and Baars, H.: Characterization of the annual cycle of atmospheric aerosol over Mindelo, Cabo Verde, by means of continuous multiwavelength lidar observations, Atmos. Chem. Phys., 26, 3439–3465, https://doi.org/10.5194/acp-26-3439-2026, 2026. a, b
Georgiou, T., Rizos, K., Tsikerdekis, A., Proestakis, E., Gkikas, A., Baars, H., Floutsi, A. A., Drakaki, E., Kampouri, A., Marinou, E., Donovan, D., Benedetti, A., McLean, W., Retscher, C., Melas, D., and Amiridis, V.: Utilizing AEOLUS to Improve Dust Transport Modelling, Environ. Sci. Proc., 26, https://doi.org/10.3390/environsciproc2023026193, 2023. a
Gimmestad, G., Forrister, H., Grigas, T., and O'Dowd, C.: Comparisons of aerosol backscatter using satellite and ground lidars: implications for calibrating and validating spaceborne lidar, Sci. Rep., 7, 42337, https://doi.org/10.1038/srep42337, 2017. a, b
Giorgi, F. and Chameides, W. L.: Rainout lifetimes of highly soluble aerosols and gases as inferred from simulations with a general circulation model, J. Geophys. Res.-Atmos., 91, 14367–14376, https://doi.org/10.1029/JD091iD13p14367, 1986. a
Gkikas, A., Gialitaki, A., Binietoglou, I., Marinou, E., Tsichla, M., Siomos, N., Paschou, P., Kampouri, A., Voudouri, K. A., Proestakis, E., Mylonaki, M., Papanikolaou, C.-A., Michailidis, K., Baars, H., Straume, A. G., Balis, D., Papayannis, A., Parrinello, T., and Amiridis, V.: First assessment of Aeolus Standard Correct Algorithm particle backscatter coefficient retrievals in the eastern Mediterranean, Atmos. Meas. Tech., 16, 1017–1042, https://doi.org/10.5194/amt-16-1017-2023, 2023. a
Haarig, M., Ansmann, A., Gasteiger, J., Kandler, K., Althausen, D., Baars, H., Radenz, M., and Farrell, D. A.: Dry versus wet marine particle optical properties: RH dependence of depolarization ratio, backscatter, and extinction from multiwavelength lidar measurements during SALTRACE, Atmos. Chem. Phys., 17, 14199–14217, https://doi.org/10.5194/acp-17-14199-2017, 2017. a
Holben, B. N., Eck, T. F., Slutsker, I., Tanre, D., Buis, J. P., Setzer, A., Vermote, E., Reagan, J. A., Kaufman, Y. J., Nakajima, T., Lavenu, F., Jankowiak, I., and Smirnov, A.: AERONET – A federated instrument network and data archive for aerosol characterization, Remote Sens. Env., 66, 1–16, https://doi.org/10.1016/s0034-4257(98)00031-5, 1998. a
Hostetler, C. A., Liu, Z., Reagan, J., Vaughan, M., Winker, D., Osborn, M., Hunt, W. H., Powell, K. A., and Trepte, C.: CALIOP Algorithm Theoretical Basis Document, Calibration and Level 1 Data Products, PC-SCI-201, https://www-calipso.larc.nasa.gov/resources/project_documentation.php (last access: 17 February 2026), 2006. a
HYSPLIT: HYSPLIT: HYbrid Single-Particle Lagrangian Integrated Trajectory model, backward trajectory calculation tool, https://www.ready.noaa.gov/HYSPLIT.php (last access: 17 February 2026), 2026. a
Illingworth, A. J., Barker, H. W., Beljaars, A., Ceccaldi, M., Chepfer, H., Clerbaux, N., Cole, J., Delanoe, J., Domenech, C., Donovan, D. P., Fukuda, S., Hirakata, M., Hogan, R. J., Huenerbein, A., Kollias, P., Kubota, T., Nakajima, T., Nakajima, T. Y., Nishizawa, T., Ohno, Y., Okamoto, H., Oki, R., Sato, K., Satoh, M., Shephard, M. W., Velázquez-Blázquez, A., Wandinger, U., Wehr, T., and van Zadelhoff, G. J.: THE EARTHCARE SATELLITE The Next Step Forward in Global Measurements of Clouds, Aerosols, Precipitation, and Radiation, B. Am. Meteorol. Soc., 96, 1311–1332, https://doi.org/10.1175/bams-d-12-00227.1, 2015. a
Josset, D., Rogers, R., Pelon, J., Hu, Y., Liu, Z., Omar, A., and Zhai, P.-W.: CALIPSO lidar ratio retrieval over the ocean, Opt. Express, 19, 18696–18706, https://doi.org/10.1364/OE.19.018696, 2011. a
Kar, J., Vaughan, M. A., Lee, K.-P., Tackett, J. L., Avery, M. A., Garnier, A., Getzewich, B. J., Hunt, W. H., Josset, D., Liu, Z., Lucker, P. L., Magill, B., Omar, A. H., Pelon, J., Rogers, R. R., Toth, T. D., Trepte, C. R., Vernier, J.-P., Winker, D. M., and Young, S. A.: CALIPSO lidar calibration at 532 nm: version 4 nighttime algorithm, Atmos. Meas. Tech., 11, 1459–1479, https://doi.org/10.5194/amt-11-1459-2018, 2018. a
Kim, M.-H., Omar, A. H., Tackett, J. L., Vaughan, M. A., Winker, D. M., Trepte, C. R., Hu, Y., Liu, Z., Poole, L. R., Pitts, M. C., Kar, J., and Magill, B. E.: The CALIPSO version 4 automated aerosol classification and lidar ratio selection algorithm, Atmos. Meas. Tech., 11, 6107–6135, https://doi.org/10.5194/amt-11-6107-2018, 2018. a, b, c, d
Klamt, A., Yin, Z., Floutsi, A. A., Griesche, H., Haarig, M., Radenz, M., Jimenez, C., Gast, B., and Baars, H.: PollyNET: Pollynet Processing Chain, Zenodo [code], https://doi.org/10.5281/zenodo.13379737, 2024. a
Laj, P., Lund Myhre, C., Riffault, V., Amiridis, V., Fuchs, H., Eleftheriadis, K., Petäjä, T., Salameh, T., Kivekäs, N., Juurola, E., Saponaro, G., Philippin, S., Cornacchia, C., Alados Arboledas, L., Baars, H., Claude, A., De Mazière, M., Dils, B., Dufresne, M., Evangeliou, N., Favez, O., Fiebig, M., Haeffelin, M., Herrmann, H., Höhler, K., Illmann, N., Kreuter, A., Ludewig, E., Marinou, E., Möhler, O., Mona, L., Eder Murberg, L., Nicolae, D., Novelli, A., O'Connor, E., Ohneiser, K., Petracca Altieri, R. M., Picquet-Varrault, B., van Pinxteren, D., Pospichal, B., Putaud, J.-P., Reimann, S., Siomos, N., Stachlewska, I., Tillmann, R., Voudouri, K. A., Wandinger, U., Wiedensohler, A., Apituley, A., Comerón, A., Gysel-Beer, M., Mihalopoulos, N., Nikolova, N., Pietruczuk, A., Sauvage, S., Sciare, J., Skov, H., Svendby, T., Swietlicki, E., Tonev, D., Vaughan, G., Zdimal, V., Baltensperger, U., Doussin, J.-F., Kulmala, M., Pappalardo, G., Sorvari Sundet, S., and Vana, M.: Aerosol, Clouds and Trace Gases Research Infrastructure (ACTRIS): The European Research Infrastructure Supporting Atmospheric Science, B. Am. Meteorol. Soc., 105, E1098–E1136, https://doi.org/10.1175/BAMS-D-23-0064.1, 2024. a
Lux, O., Witschas, B., Geiß, A., Lemmerz, C., Weiler, F., Marksteiner, U., Rahm, S., Schäfler, A., and Reitebuch, O.: Quality control and error assessment of the Aeolus L2B wind results from the Joint Aeolus Tropical Atlantic Campaign, Atmos. Meas. Tech., 15, 6467–6488, https://doi.org/10.5194/amt-15-6467-2022, 2022. a
Mamouri, R. E., Amiridis, V., Papayannis, A., Giannakaki, E., Tsaknakis, G., and Balis, D. S.: Validation of CALIPSO space-borne-derived attenuated backscatter coefficient profiles using a ground-based lidar in Athens, Greece, Atmos. Meas. Tech., 2, 513–522, https://doi.org/10.5194/amt-2-513-2009, 2009. a
Marinou, E., Amiridis, V., Binietoglou, I., Tsikerdekis, A., Solomos, S., Proestakis, E., Konsta, D., Papagiannopoulos, N., Tsekeri, A., Vlastou, G., Zanis, P., Balis, D., Wandinger, U., and Ansmann, A.: Three-dimensional evolution of Saharan dust transport towards Europe based on a 9-year EARLINET-optimized CALIPSO dataset, Atmos. Chem. Phys., 17, 5893–5919, https://doi.org/10.5194/acp-17-5893-2017, 2017. a
Marinou, E., Paschou, P., Tsikoudi, I., Tsekeri, A., Daskalopoulou, V., Kouklaki, D., Siomos, N., Spanakis-Misirlis, V., Voudouri, K. A., Georgiou, T., Drakaki, E., Kampouri, A., Papachristopoulou, K., Mavropoulou, I., Mallios, S., Proestakis, E., Gkikas, A., Koutsoupi, I., Raptis, I. P., Kazadzis, S., Baars, H., Floutsi, A., Pirloaga, R., Nemuc, A., Marenco, F., Kezoudi, M., Papetta, A., Močnik, G., Díez, J. Y., Ryder, C. L., Ratcliffe, N., Kandler, K., Sudharaj, A., and Amiridis, V.: An Overview of the ASKOS Campaign in Cabo Verde, Environ. Sci. Proc., 26, 200, https://doi.org/10.3390/environsciproc2023026200, 2023. a
Martell, E. and Moore, H.: Tropospheric Aerosol Residence Times: A Critical Review, J. Rech. Atmos. B, 8, 14367–14376, 1974. a
McGill, M. J., Vaughan, M. A., Trepte, C. R., Hart, W. D., Hlavka, D. L., Winker, D. M., and Kuehn, R.: Airborne validation of spatial properties measured by the CALIPSO lidar, J. Geophys. Res.-Atmos., 112, https://doi.org/10.1029/2007JD008768, 2007. a
McPherson, C. J. and Reagan, J. A.: Extension of the constrained ratio approach to aerosol retrievals from elastic-scatter and high spectral resolution lidars, J. Appl. Remote Sens., 10, 036019, https://doi.org/10.1117/1.JRS.10.036019, 2016. a
McPherson, C. J., Reagan, J. A., Schafer, J., Giles, D., Ferrare, R., Hair, J., and Hostetler, C.: AERONET, airborne HSRL, and CALIPSO aerosol retrievals compared and combined: A case study, J. Geophys. Res.-Atmos., 115, https://doi.org/10.1029/2009JD012389, 2010. a
Mona, L., Pappalardo, G., Amodeo, A., D'Amico, G., Madonna, F., Boselli, A., Giunta, A., Russo, F., and Cuomo, V.: One year of CNR-IMAA multi-wavelength Raman lidar measurements in coincidence with CALIPSO overpasses: Level 1 products comparison, Atmos. Chem. Phys., 9, 7213–7228, https://doi.org/10.5194/acp-9-7213-2009, 2009. a
Omar, A. H., Won, J.-G., Winker, D. M., Yoon, S.-C., Dubovik, O., and McCormick, M. P.: Development of global aerosol models using cluster analysis of Aerosol Robotic Network (AERONET) measurements, J. Geophys. Res.-Atmos., 110, https://doi.org/10.1029/2004JD004874, 2005. a
Omar, A. H., Winker, D. M., Vaughan, M. A., Hu, Y., Trepte, C. R., Ferrare, R. A., Lee, K.-P., Hostetler, C. A., Kittaka, C., Rogers, R. R., Kuehn, R. E., and Liu, Z.: The CALIPSO Automated Aerosol Classification and Lidar Ratio Selection Algorithm, J. Atmos. Ocean. Tech., 26, 1994–2014, https://doi.org/10.1175/2009jtecha1231.1, 2009. a, b
Painemal, D., Clayton, M., Ferrare, R., Burton, S., Josset, D., and Vaughan, M.: Novel aerosol extinction coefficients and lidar ratios over the ocean from CALIPSO–CloudSat: evaluation and global statistics, Atmos. Meas. Tech., 12, 2201–2217, https://doi.org/10.5194/amt-12-2201-2019, 2019. a
Papagiannopoulos, N., Mona, L., Alados-Arboledas, L., Amiridis, V., Baars, H., Binietoglou, I., Bortoli, D., D'Amico, G., Giunta, A., Guerrero-Rascado, J. L., Schwarz, A., Pereira, S., Spinelli, N., Wandinger, U., Wang, X., and Pappalardo, G.: CALIPSO climatological products: evaluation and suggestions from EARLINET, Atmos. Chem. Phys., 16, 2341–2357, https://doi.org/10.5194/acp-16-2341-2016, 2016. a
Pappalardo, G., Wandinger, U., Mona, L., Hiebsch, A., Mattis, I., Amodeo, A., Ansmann, A., Seifert, P., Linné, H., Apituley, A., Alados Arboledas, L., Balis, D., Chaikovsky, A., D'Amico, G., De Tomasi, F., Freudenthaler, V., Giannakaki, E., Giunta, A., Grigorov, I., Iarlori, M., Madonna, F., Mamouri, R.-E., Nasti, L., Papayannis, A., Pietruczuk, A., Pujadas, M., Rizi, V., Rocadenbosch, F., Russo, F., Schnell, F., Spinelli, N., Wang, X., and Wiegner, M.: EARLINET correlative measurements for CALIPSO: First intercomparison results, J. Geophys. Res.-Atmos., 115, https://doi.org/10.1029/2009JD012147, 2010. a
Pappalardo, G., Amodeo, A., Apituley, A., Comeron, A., Freudenthaler, V., Linné, H., Ansmann, A., Bösenberg, J., D'Amico, G., Mattis, I., Mona, L., Wandinger, U., Amiridis, V., Alados-Arboledas, L., Nicolae, D., and Wiegner, M.: EARLINET: towards an advanced sustainable European aerosol lidar network, Atmos. Meas. Tech., 7, 2389–2409, https://doi.org/10.5194/amt-7-2389-2014, 2014. a, b
Paschou, P., Siomos, N., Tsekeri, A., Louridas, A., Georgoussis, G., Freudenthaler, V., Binietoglou, I., Tsaknakis, G., Tavernarakis, A., Evangelatos, C., von Bismarck, J., Kanitz, T., Meleti, C., Marinou, E., and Amiridis, V.: The eVe reference polarisation lidar system for the calibration and validation of the Aeolus L2A product, Atmos. Meas. Tech., 15, 2299–2323, https://doi.org/10.5194/amt-15-2299-2022, 2022. a
Paschou, P., Siomos, N., Marinou, E., Gkikas, A., Idrissa, S. M., Quaye, D. T., Fiogbe Attannon, D. D., Voudouri, K. A., Meleti, C., Donovan, D. P., Georgoussis, G., Parrinello, T., Fehr, T., von Bismarck, J., and Amiridis, V.: Validation of the Aeolus L2A products with the eVe reference lidar measurements from the ASKOS/JATAC campaign, Atmos. Meas. Tech., 18, 4731–4754, https://doi.org/10.5194/amt-18-4731-2025, 2025. a, b
Powell, K. A., Hostetler, C. A., Vaughan, M. A., Lee, K.-P., Trepte, C. R., Rogers, R. R., Winker, D. M., Liu, Z., Kuehn, R. E., Hunt, W. H., and Young, S. A.: CALIPSO Lidar Calibration Algorithms. Part I: Nighttime 532 nm Parallel Channel and 532 nm Perpendicular Channel, J. Atmos. Ocean. Technol., 26, 2015–2033, https://doi.org/10.1175/2009JTECHA1242.1, 2009. a
Ratynski, M., Khaykin, S., Hauchecorne, A., Wing, R., Cammas, J.-P., Hello, Y., and Keckhut, P.: Validation of Aeolus wind profiles using ground-based lidar and radiosonde observations at Réunion island and the Observatoire de Haute-Provence, Atmos. Meas. Tech., 16, 997–1016, https://doi.org/10.5194/amt-16-997-2023, 2023. a
Rizos, K., Proestakis, E., Georgiou, T., Gkikas, A., Marinou, E., Paschou, P., Voudouri, K. A., Tsikerdekis, A., Donovan, D. P., van Zadelhoff, G.-J., Benedetti, A., Baars, H., Floutsi, A. A., Benas, N., Stengel, M., Retscher, C., Malina, E., and Amiridis, V.: Derivation and validation of a refined dust product from Aeolus (L2A+), Atmos. Meas. Tech., 19, 699–728, https://doi.org/10.5194/amt-19-699-2026, 2026. a
Rogers, R. R., Hostetler, C. A., Hair, J. W., Ferrare, R. A., Liu, Z., Obland, M. D., Harper, D. B., Cook, A. L., Powell, K. A., Vaughan, M. A., and Winker, D. M.: Assessment of the CALIPSO Lidar 532 nm attenuated backscatter calibration using the NASA LaRC airborne High Spectral Resolution Lidar, Atmos. Chem. Phys., 11, 1295–1311, https://doi.org/10.5194/acp-11-1295-2011, 2011. a
Rogers, R. R., Vaughan, M. A., Hostetler, C. A., Burton, S. P., Ferrare, R. A., Young, S. A., Hair, J. W., Obland, M. D., Harper, D. B., Cook, A. L., and Winker, D. M.: Looking through the haze: evaluating the CALIPSO level 2 aerosol optical depth using airborne high spectral resolution lidar data, Atmos. Meas. Tech., 7, 4317–4340, https://doi.org/10.5194/amt-7-4317-2014, 2014. a
Ryan, R. A., Vaughan, M. A., Rodier, S. D., Tackett, J. L., Reagan, J. A., Ferrare, R. A., Hair, J. W., Smith, J. A., and Getzewich, B. J.: Total column optical depths retrieved from CALIPSO lidar ocean surface backscatter, Atmos. Meas. Tech., 17, 6517–6545, https://doi.org/10.5194/amt-17-6517-2024, 2024. a
Ryder, C. L., Bézier, C., Dacre, H. F., Clarkson, R., Amiridis, V., Marinou, E., Proestakis, E., Kipling, Z., Benedetti, A., Parrington, M., Rémy, S., and Vaughan, M.: Aircraft engine dust ingestion at global airports, Nat. Hazards Earth Syst. Sci., 24, 2263–2284, https://doi.org/10.5194/nhess-24-2263-2024, 2024. a
Shrestha, S., Holz, R. E., Marais, W. J., Buckholtz, Z., Razenkov, I., Eloranta, E., Reid, J. S., Elliott, H. E., Lata, N. N., Cheng, Z., China, S., Blades, E., Ortiz, A. D., Chewitt-Lucas, R., Allen, A., Blades, D., Agrawal, R., Reid, E. A., Ruiz-Plancarte, J., Bucholtz, A., Yamaguchi, R., Wang, Q., Eck, T., Lind, E., Pöhlker, M. L., Ault, A. P., and Gaston, C. J.: Transported African Dust in the Lower Marine Atmospheric Boundary Layer is Internally Mixed with Sea Salt Contributing to Increased Hygroscopicity and a Lower Lidar Depolarization Ratio, Atmos. Chem. Phys., 26, 983–999, https://doi.org/10.5194/acp-26-983-2026, 2026. a
Stein, A. F., Draxler, R. R., Rolph, G. D., Stunder, B. J. B., Cohen, M. D., and Ngan, F.: NOAA's HYSPLIT Atmospheric Transport and Dispersion Modeling System, B. Am. Meteorol. Soc., 96, 2059–2077, https://doi.org/10.1175/bams-d-14-00110.1, 2015. a
Stoffelen, A., Marseille, G. J., Bouttier, F., Vasiljevic, D., de Haan, S., and Cardinali, C.: ADM-Aeolus Doppler wind lidar Observing System Simulation Experiment, Q. J. R. Meteorol. Soc., 132, 1927–1947, https://doi.org/10.1256/qj.05.83, 2006. a
Tackett, J. L., Kar, J., Vaughan, M. A., Getzewich, B. J., Kim, M.-H., Vernier, J.-P., Omar, A. H., Magill, B. E., Pitts, M. C., and Winker, D. M.: The CALIPSO version 4.5 stratospheric aerosol subtyping algorithm, Atmos. Meas. Tech., 16, 745–768, https://doi.org/10.5194/amt-16-745-2023, 2023. a
Tackett, J. L., Ryan, R. A., Garnier, A. E., Kar, J., Getzewich, B. J., Cai, X., Vaughan, M. A., Trepte, C. R., Verhappen, R., Winker, D. M., and Lee, K.-P. A.: Mitigating impacts of low energy laser pulses on CALIOP data products, Atmos. Meas. Tech., 18, 6211–6231, https://doi.org/10.5194/amt-18-6211-2025, 2025. a, b, c
Tesche, M., Ansmann, A., Muller, D., Althausen, D., Engelmann, R., Freudenthaler, V., and Groß, S.: Vertically resolved separation of dust and smoke over Cape Verde using multiwavelength Raman and polarization lidars during Saharan Mineral Dust Experiment 2008, J. Geophys. Res.-Atmos., 114, 14, https://doi.org/10.1029/2009jd011862, 2009. a
Trapon, D., Baars, H., Floutsi, A. A., Bley, S., Haarig, M., Lacour, A., Flament, T., Dabas, A., Nehrir, A. R., Ehlers, F., and Huber, D.: Cross-validations of the Aeolus aerosol products and new developments with airborne high-spectral-resolution lidar measurements above the tropical Atlantic during JATAC, Atmos. Meas. Tech., 18, 3873–3896, https://doi.org/10.5194/amt-18-3873-2025, 2025. a
Tsikerdekis, A., Zanis, P., Steiner, A. L., Solmon, F., Amiridis, V., Marinou, E., Katragkou, E., Karacostas, T., and Foret, G.: Impact of dust size parameterizations on aerosol burden and radiative forcing in RegCM4, Atmos. Chem. Phys., 17, 769–791, https://doi.org/10.5194/acp-17-769-2017, 2017. a
Vaughan, M., Garnier, A., Josset, D., Avery, M., Lee, K.-P., Liu, Z., Hunt, W., Pelon, J., Hu, Y., Burton, S., Hair, J., Tackett, J. L., Getzewich, B., Kar, J., and Rodier, S.: CALIPSO lidar calibration at 1064 nm: version 4 algorithm, Atmos. Meas. Tech., 12, 51–82, https://doi.org/10.5194/amt-12-51-2019, 2019. a
Wehr, T., Kubota, T., Tzeremes, G., Wallace, K., Nakatsuka, H., Ohno, Y., Koopman, R., Rusli, S., Kikuchi, M., Eisinger, M., Tanaka, T., Taga, M., Deghaye, P., Tomita, E., and Bernaerts, D.: The EarthCARE mission – science and system overview, Atmos. Meas. Tech., 16, 3581–3608, https://doi.org/10.5194/amt-16-3581-2023, 2023. a, b, c
Winker, D., Hostetler, C. A., Vaughan, M., and Omar, A. H.: CALIOP Algorithm Theoretical Basis Document, Mission, Instrument, and Algorithms Overview, PC-SCI-202 Part 1, https://www-calipso.larc.nasa.gov/resources/project_documentation.php (last access: 17 February 2026), 2006. a
Winker, D. M., Vaughan, M. A., Omar, A., Hu, Y., Powell, K. A., Liu, Z., Hunt, W. H., and Young, S. A.: Overview of the CALIPSO mission and CALIOP data processing algorithms, J. Atmos. Ocean. Tech., 26, 2310–2323, https://doi.org/10.1175/2009JTECHA1281.1, 2009. a, b
Witschas, B., Lemmerz, C., Geiß, A., Lux, O., Marksteiner, U., Rahm, S., Reitebuch, O., Schäfler, A., and Weiler, F.: Validation of the Aeolus L2B wind product with airborne wind lidar measurements in the polar North Atlantic region and in the tropics, Atmos. Meas. Tech., 15, 7049–7070, https://doi.org/10.5194/amt-15-7049-2022, 2022a. a
Witschas, B., Lemmerz, C., Lux, O., Marksteiner, U., Reitebuch, O., Weiler, F., Fabre, F., Dabas, A., Flament, T., Huber, D., and Vaughan, M.: Spectral performance analysis of the Aeolus Fabry–Pérot and Fizeau interferometers during the first years of operation, Atmos. Meas. Tech., 15, 1465–1489, https://doi.org/10.5194/amt-15-1465-2022, 2022b. a
Wu, D., Wang, Z., Wang, B., Zhou, J., and Wang, Y.: CALIPSO validation using ground-based lidar in Hefei (31.9° N, 117.2° E), China, Appl. Phys. B, 102, 185–195, https://doi.org/10.1007/s00340-010-4243-z, 2011. a
- Abstract
- Introduction
- Data and Methodology
- Results
- Conclusions and Outlook
- Appendix A: Information on the LIVAS dataset
- Appendix B: Number of PollyXT profiles at Mindelo
- Appendix C: PollyXT and LIVAS statistical metrics
- Appendix D: MSG-SEVIRI Dust product
- Code availability
- Data availability
- Author contributions
- Competing interests
- Disclaimer
- Special issue statement
- Acknowledgements
- Financial support
- Review statement
- References