the Creative Commons Attribution 4.0 License.
the Creative Commons Attribution 4.0 License.
 | 19 Mar 2026
MAESTRO instrument operation and performance over two decades in orbit
Jiansheng Zou
C. Thomas McElroy
James R. Drummond
Paul S. Jeffery
MAESTRO (Measurement of Aerosol Extinction in the Stratosphere and Troposphere Retrieved by Occultation), a dual UV (ultraviolet) and Visible-NIR (visible-near-infrared) spectrometer, has been operating aboard the Canadian satellite SCISAT for over 22 years. Recently, MAESTRO version 4.5 volume-mixing-ratio profile data for NO2 and O3 retrieved from the UV channel were released, along with a separate O3 product from the Visible-NIR channel. An aerosol extinction product is currently under development. Motivated by the instrument's longevity, this paper will review MAESTRO's operations and performance over its lifetime, examining the key issues that impact its retrievals of atmospheric constituents. These include: (a) the design of the MAESTRO spectrometer measurement schemes for sunset and sunrise occultations, including the role of long-term changes in the measured spectral intensities from the UV and Visible-NIR spectrometers, (b) the determination of the position of the MAESTRO field of view (FOV) on the Sun, (c) changes in the MAESTRO FOV position during occultations, including the impacts of this on the Level 1 transmittance calculation(s), (d) understanding the relative position between the MAESTRO FOV and the ACE-FTS (Atmospheric Chemistry Experiment – Fourier Transform Spectrometer) FOV which is crucial for incorporating the input ACE-FTS atmosphere data in the Level 2 retrieval, (e) verifying on-orbit the wavelength assignment at the detector arrays affected by a sudden persistent change in the instrument's thermal environment, and (f) the approaches taken to determine the MAESTRO measurement tangent heights, which are the pivotal steps in the MAESTRO retrieval of atmospheric constituents.
- Article
(14911 KB) - Full-text XML
- BibTeX
- EndNote


The MAESTRO instrument (Measurement of Aerosol Extinction in the Stratosphere and Troposphere Retrieved by Occultation; McElroy et al., 2007) is aboard the Canadian SCISAT satellite, alongside the ACE-FTS (Atmospheric Chemistry Experiment – Fourier Transform Spectrometer) instrument, as part of the ACE (Atmospheric Chemistry Experiment) mission (Bernath et al., 2005). MAESTRO uses the widely used solar occultation technique to measure atmospheric absorption spectra. This technique enables the self-calibration of atmospheric absorption spectra, thereby rendering them insensitive to long-term drifts in the instrument's gain (McCormick et al., 1989). They also have high vertical resolution due to the small field of view (FOV) in the limb's elevation direction. The latest MAESTRO measurement products have been compared against other instruments in Jeffery et al. (2025), showing good agreement above 20 km for Visible-NIR O3 data (2.5 %–7.6 % within 20–50 km), slightly poorer agreement for UV O3 data (2.8 %–7.6 % within 20–45 km), and marginal agreement for UV NO2 data (< 27.2 % within 20–40 km), with larger discrepancies below 20 km. In this study we seek to understand the instrument-related differences between UV and Visible-NIR measurements and the altitude dependence of the measured spectral data.
Over the past four decades, there have been several solar occultation UV-Visible-NIR (ultraviolet-visible-near-infrared) spectrometers in orbit, including: SAGE I (1979–1981; McCormick et al., 1989), SAGE II (1984–2005; Damadeo et al., 2013), SAGE III/M3M (2001–2006; Wang et al., 2006), and SAGE III/ISS (2017–present; McCormick et al., 2020); however, MAESTRO was the sole solar occultation instrument in orbit between 2006 and 2017. Using these instruments, a merged continuous occultation record spanning four decades, from 1984 to the present, can be constructed.
The other ACE instrument, ACE-FTS, also uses the solar occultation technique to make measurements and is boresighted with MAESTRO using a common sun tracker. It also has two Imagers, one operating in the Visible and the other at NIR wavelengths, with respective nominal wavelengths of 525 and 1020 nm, which take sun images during solar occultations at a frequency of one image every 0.25 s (Gilbert et al., 2007). The most recent version of the ACE-FTS data, version 5.3 (Boone et al., 2023; https://databace.scisat.ca/level2/ace_v5.3/ (last access: 16 March 2026, registration required), contains volume mixing ratio (VMR) measurements of over 70 atmospheric molecules and isotopologues and aerosol extinction profiles from the ACE Visible and NIR channel Imagers.
MAESTRO measures approximately the same air mass as ACE-FTS but can measure at lower altitudes and with higher vertical resolution than ACE-FTS (McElroy et al., 2007). The main MAESTRO Level 1 and Level 2 data products include: v4.5 NO2 and O3 data (Jeffery et al., 2025; https://databace.scisat.ca/level2/mae_v4.5/, last access: 16 March 2026, registration required), v3.13 aerosol extinction data (Khanal et al., 2025), v3.12.1 aerosol extinction data (Robert et al., 2016), and v2.2 and v3.12.1/2 optical depth data which have been used for independent water vapour retrievals (Sioris et al., 2010a, b, 2016).
The primary focus of this study is to evaluate the in-flight performance of key elements of MAESTRO, to assess the issues that have arisen during operations, and to evaluate the impact of anomalous events on the instrument's health and ability to retrieve atmospheric constituents.
Following a brief overview of the instrument itself in Sect. 2, these elements are addressed in Sect. 3. Section 3.1 presents the operational schemes (termed “action tables”) that define the MAESTRO measurement sequences, with specific attention paid to changes in the beta-angle (the angle between the satellite orbital plane and the Sun-Earth vector), the large dynamic range of integration times over the occultation period, the measurement tangent height range, and the vertical resolution of the instrument. Section 3.2 examines derived information about the UV and Visible-NIR slit positions, which is crucial to an understanding of the MAESTRO measurements, as these slits direct sunlight to the spectrometers and thereby determine the instrument's FOVs over the Sun via their projected positions on the Sun. The slit positions are examined using results from in-flight sun-scan experiments and are compared with pre-flight test data. The relative positions of the MAESTRO's slits to the ACE-FTS FOV on the Sun are also assessed. Section 3.3 further explores the MAESTRO FOV with a case study of the FOV location change on the Sun during an occultation. The impact of temperature variations on the instrument's performance is examined in Sect. 3.4 and 3.5, focusing in the former on periodic variations in temperatures, and in the latter on the thermal impact of the satellite's star tracker failure on 17 June 2015. Within this, the potential of this anomaly to lead to anomalous behaviour in the rotation of the ACE Imagers and the MAESTRO slits is discussed, as well as the assigned wavelengths of the spectrometers. In Sect. 3.6, the stability of the spectrometer over the mission is presented, highlighting the trends of the high sun spectra.
MAESTRO's retrievals are not stand-alone but use ACE-FTS-derived atmospheric temperature and pressure information for each occultation for their input atmosphere. Complicating the use of the ACE-FTS temperature and pressure fields for the MAESTRO retrievals, it was found early in the mission that MAESTRO's time was inconsistent with ACE-FTS (McElroy et al., 2007). This time difference, coupled with uncertainty in the relationship between the observation angles of ACE-FTS and MAESTRO, poses a challenge for MAESTRO retrievals. Section 3.7 discusses several approaches that have used ACE-FTS data as the input atmosphere for MAESTRO retrievals.
A detailed description of the MAESTRO instrument, operational principles, subsystems, and the general retrieval method is given in McElroy et al. (2007). In brief, MAESTRO is composed of two spectrometers, one measuring in the UV (285–565 nm) and the other in the Visible-NIR (515–1015 nm). Each consists of a telescope, lens, slit, concave holographic grating, and a 1024-element photodiode array detector, as schematically displayed in Fig. 1 (McElroy et al., 2007). MAESTRO shares a common sun tracker and optical bore with ACE-FTS. Incoming sunlight passes through the telescope-lens-slit path, is diffracted by the diffraction grating, and reaches the detectors.
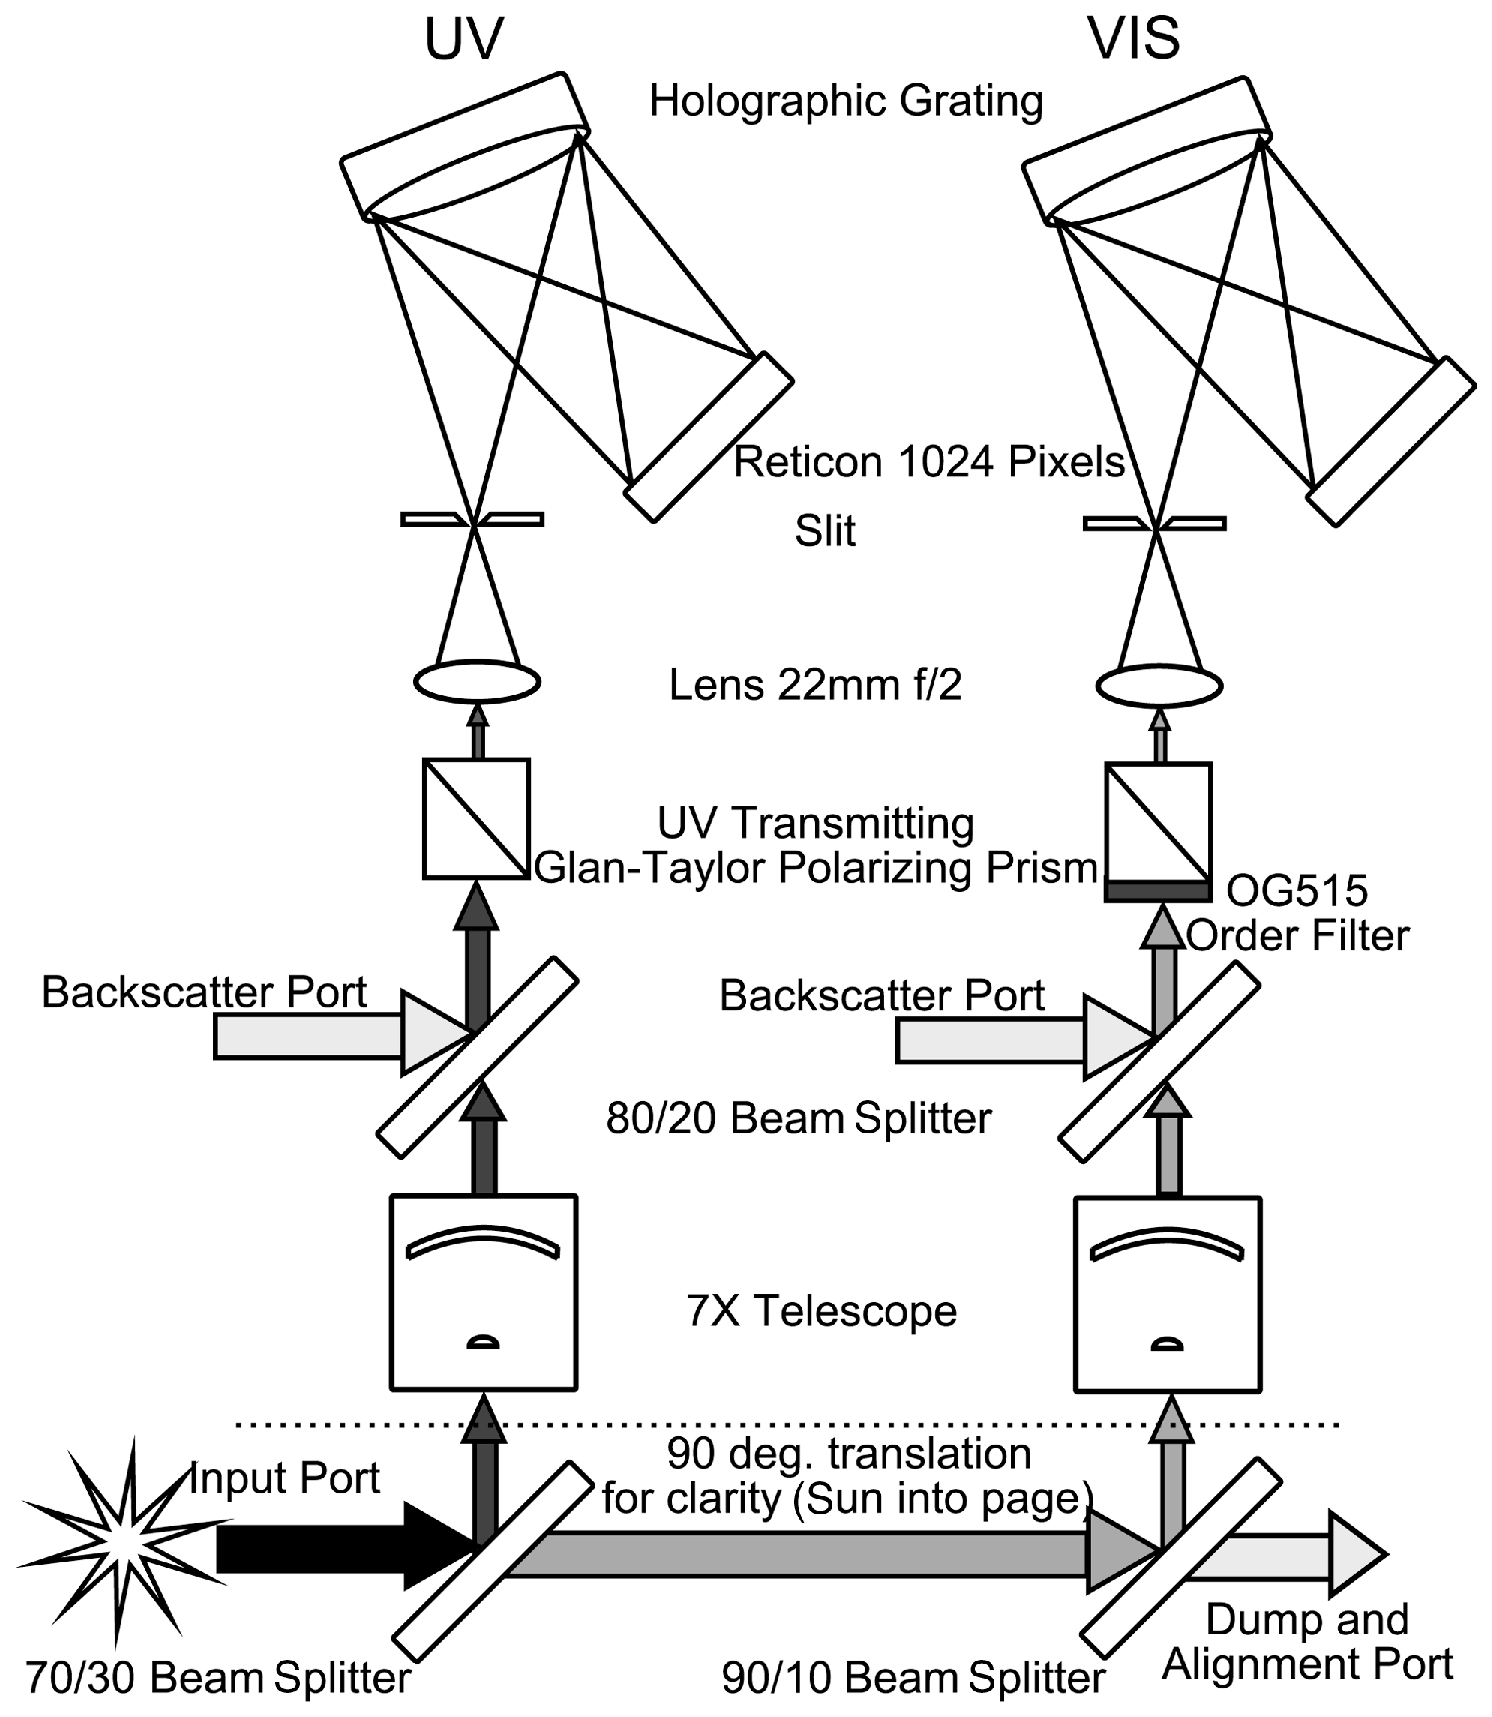
Figure 1A schematic of the MAESTRO instrument with UV and Visible-NIR spectrometers (adapted from McElroy et al., 2007).
MAESTRO's detectors are connected to a field-programmable gate array (FPGA) based microprocessor system with an autonomous FPGA controller and a data readout peripheral, both pre-loaded with the modes and integration times for each spectral measurement. This readout system controls the detector timing, reads the data out through a 16-bit A/D converter, and handles the co-adding of spectra (McElroy et al., 2007). The detector readout boards communicate with the MAESTRO instrument control (MIC) computer through synchronous embedded state machines. During observations, the state machine turns off the microprocessor clock to prevent asynchronous noise. The action table measurement schemes, uploaded from the ground to the MIC via commands from the spacecraft bus, are critical to MAESTRO operation because they define measurement sequences for different scenarios (e.g., sunset, sunrise, high sun, etc.).
3.1 Development of MAESTRO measurement schemes - action tables
MAESTRO's method to capture signals over the extreme dynamic range is described in McElroy et al. (2007) and Nowlan et al. (2007). Crucially, two parameters control the detector readout throughout a measurement sequence: the integration time, i.e., the exposure time of the detector to sunlight and the “grouping” of the 1024 detector pixels. Each group comprises 2n pixels (n = 0–10). Each group is reset simultaneously, and the groups are reset in sequence (all pixels having the same integration time). At the highest intensity, a group is 1 pixel, reset with the shortest integration time (0.148 ms for UV and 0.308 ms for Visible-NIR, as determined by the controller cycle time), and the 1024-pixel array is read out sequentially. At the lowest signal levels with the longest integration time, a single group is the entire 1024-pixel array, and it is reset simultaneously. Between these two extremes, by changing pixel groups (detector modes) and the integration time, the signal-to-noise ratio is optimized throughout the occultation. It takes < 330 ms to complete a full spectral measurement for all altitudes (McElroy et al., 2007).
MAESTRO uses 19 different combinations of pixel groups and integration times during an occultation measurement, named “action tables”, along with their repetition times to collect 80 spectra for atmospheric (0–100 km) and exo-atmospheric measurements (100–150 km and above), for sunrise or the reverse for sunset. It also collects 80 dark-count spectra by taking measurements on the orbit dark side using the same occultation action tables used to measure a zero-irradiance point. Special action tables, such as sun-scans, were created for specific events and tests.
Action tables must account for changes in the observation beta angle, which ranges between 0 and 60°, by specifying measurement durations for the occultations. This can vary from 63 to about 190 s. To account for this, the beta angle range is subdivided and the action table timings for the beta angle sub-ranges are generated from the zero-angle table by extending the time intervals between spectral measurements. The detector modes and integration times for each spectral measurement are kept fixed. The duration of these intervals is based on the centre of the beta angle sub-ranges. Finer sub-ranges lead to more representative measurement durations.
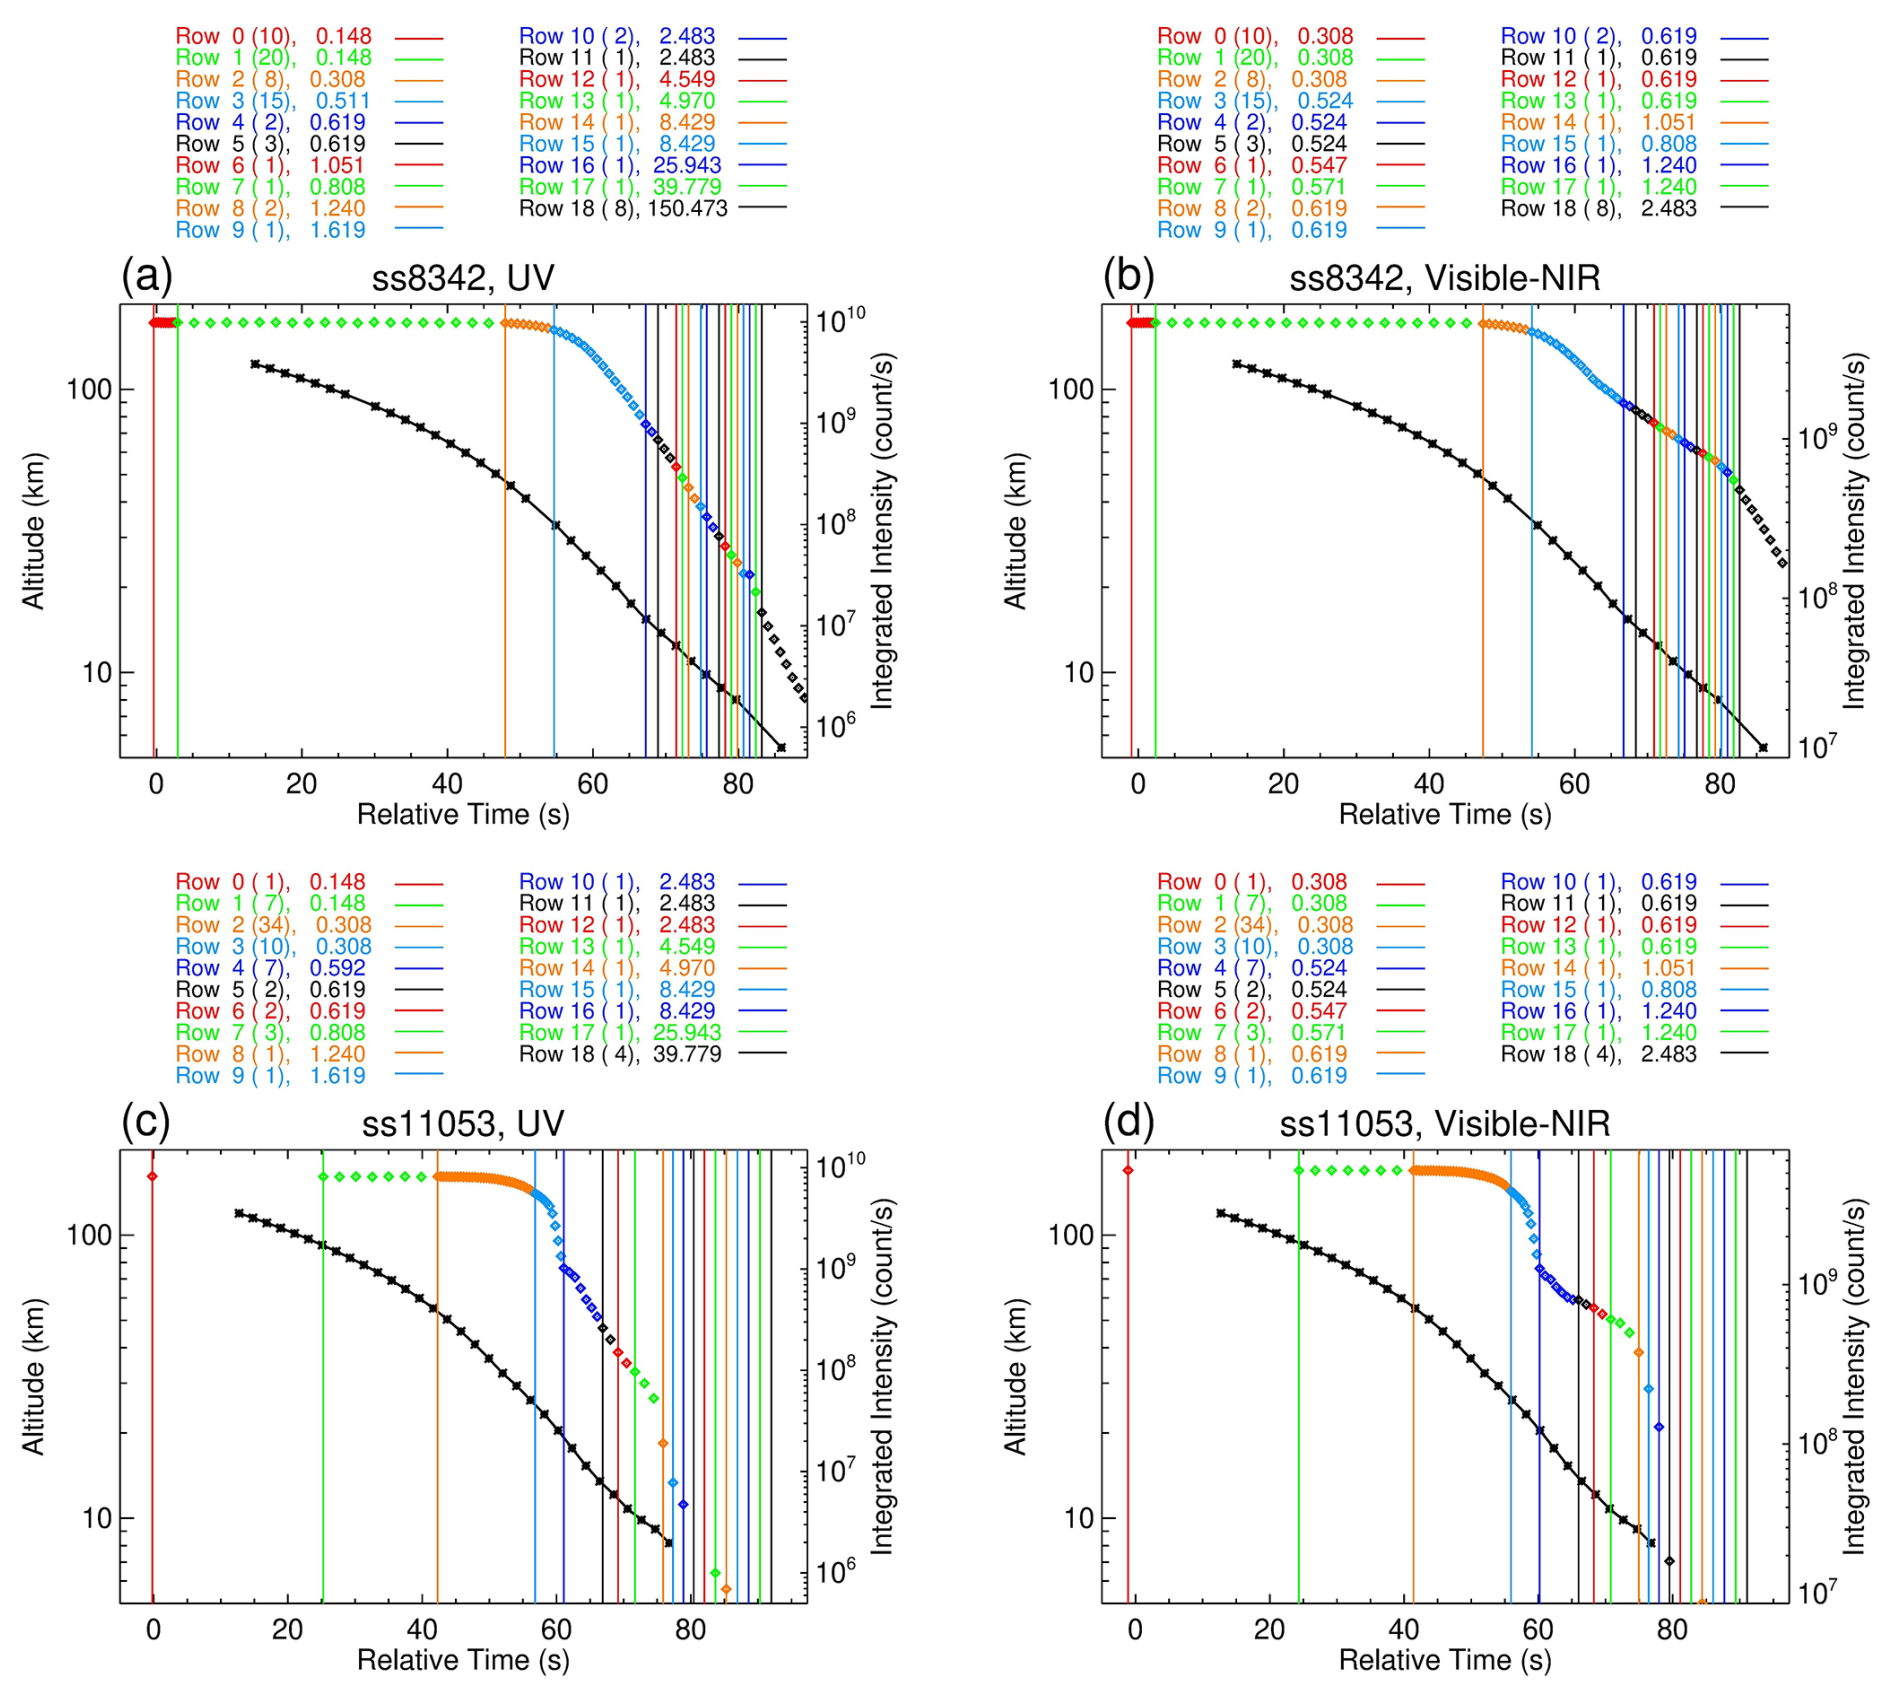
Figure 2MAESTRO spectral measurements during sunset occultations. (a, b) Occultation ss8342 on 1 March 2005, with a 30 km altitude tangent point at 01:38:54Z, located at 80.004° N, 161.137° W, and a beta angle of 38.099°, using an action table from set “A” applicable to the beta angle range of 30–45°. (a) Integrated UV spectrum intensity vs. time, with the colour code specified in the legend above the panel, and the tangent height vs. time curve (black) obtained from ACE-FTS data. MAESTRO and ACE-FTS times are aligned as described in Sect. 3.7. Left y-axis: altitude; right y-axis: integrated spectrum intensity. The coloured text lists the 19 rows of the action table set “A”, each marked by a colour code, with the number of repetitions in parentheses and integration time in milliseconds (ms). Vertical lines denote the start time of each row. (b) Same as panel (a), but for the Visible-NIR channel. (c, d) Occultation ss11053 on 1 September 2005, with a 30 km tangent point at 00:47:12Z, 79.265° S, 152.432° W, and with a beta angle of −38.037°, using an action table from set “B” applicable to the beta angle range of 34–42.5°. Otherwise, the same layout and conventions as panels (a) and (b).
Two sets of action tables were developed for the mission:
-
Set “A” was defined over five beta-angle sub-ranges with bounds at 0, 20, 30, 45, 55, and 60° and used from February 2004 to August 2005. Figure 2a, b show an example of a spectral measurement time sequence from the UV (Fig. 2a) and Visible-NIR (Fig. 2b) spectrometers for observation ss8342 (an observation is catalogued by sunset (ss) or sunrise (sr) and the orbit number) on 1 March 2005 with beta angle 38°. Here, 80 data points of integrated spectrum intensities measured during the sunset occultation are plotted (with a guideline), covering an altitude range from approximately 150 km to near 0 km. The altitude information is taken from the ACE-FTS tangent height data, which are time-tagged (see Sect. 3.7 for a discussion on time-tagging) and cover a range of ∼ 10–120 km. The integration time and the number of repetitions for each row of the action table are shown in the legends of Fig. 2a, b. The integration time for the UV channel varies from 0.148 ms at the high sun to 150.473 ms at the near-zero tangent height, and for the Visible-NIR channel, 0.308 to 2.483 ms. The first 20 exo-atmospheric spectra are averaged for the high-sun reference. Between about 50 and 30 km, 8 spectra are recorded; between 30 and 15 km, 15; and below 15 km, 27. Due to the geometric weighting of absorption in the tangent layer relative to that of the layer above in the spherical atmosphere (McElroy et al., 2007), the vertical resolution of the retrieved profiles is about ∼ 1 km, roughly matching the vertical sampling in the troposphere and stratosphere. Set “A” of action tables was found to have an overly high density of data points recorded at low altitudes (below 15 km), as illustrated in Fig. 2a, b, and there are notable mismatches between the measurement time and the variable occultation time within each beta angle sub-range.
-
Set “B” was developed with more data points at higher altitudes (above 15 km), fewer at lower altitudes (below 15 km), and with more beta angle sub-ranges covering nine intervals with bounds at 0, 10, 25, 34, 42.5, 48.5, 53.2, 56.7, 58.2, and 59.4° and used from August 2005 to now. In addition, a separate scheme of 20 exo-atmospheric spectral measurements above 150 km was produced and included in the “B” tables. Figure 2c, d show an example of a spectral measurement time sequence for observation ss11053 on 1 September 2005 with a beta angle of 38° using “B” tables. One upper limit occultation measurement is taken at 150 km, and most measurement points are now located within the ozone layer. From 50 to 25 km, there are 34 points; from 25 to 20 km, 10; from 20 to 15 km, 7; and below 15 km, 21. On average, there are 1.5 measurements per 1 km. In Fig. 2c, d, very small spectral intensities at very low altitudes, well below the lowest ACE-FTS measurement altitude, are cut off. Compared to table “A” (Fig. 2a, b) with a similar beta angle, the occultation measurement time for table B (Fig. 2c, d) is longer by about 5 s. Hence, the measurements using “B” span a wider altitude range than “A”. Figure 3a, b show the 80 ss11053 spectra (after dark-count calibration) for the UV and Visible-NIR channels. It demonstrates the ability to capture signals across at least three orders of magnitude.
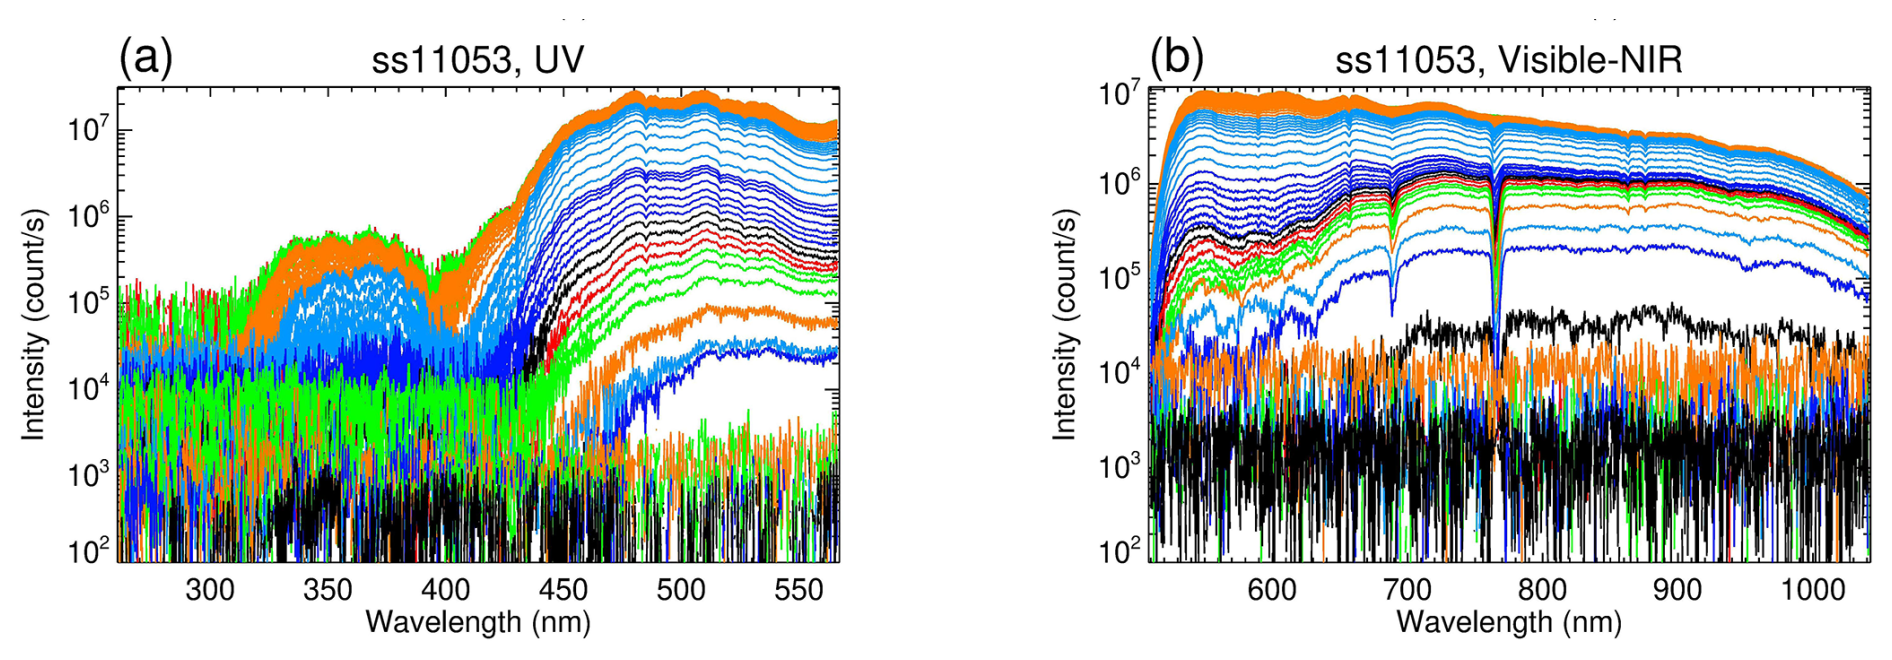
Figure 3The 80 UV (a) and Visible-NIR (b) spectra produced for occultation ss11053 using action table “B” with the same colour code indicated in Fig. 2c and d.
3.2 MAESTRO slits projected on the ACE Imagers
The MAESTRO instrument views the Sun through two separate narrow slits: one for the UV spectrometer and the other for the Visible-NIR spectrometer (Fig. 1). The projection of the slits on the Sun is nominally 0.022° (elevation) × 0.65° (azimuth) for the UV and 0.022° × 0.89° for the Visible-NIR channel (McElroy et al., 2007). The elevation projection is much smaller than the sun diameter, while the azimuth projection is larger, as the sun angular diameter is about 0.5°. Knowing the location of MAESTRO's slits relative to the Sun and to the ACE-FTS FOV is important because the former is needed for accurate Level 1 transmittance calculation and for understanding issues in the Level 1 data, especially for lower altitudes (see Sect. 3.3). At the same time, the latter is important for use of the input ACE-FTS atmosphere (see Sect. 3.7). Ideally, the UV and Visible-NIR slits would (a) be parallel to the Earth's horizon, ensuring that the lines of sight (LOS) through all points on the slit exhibit an almost homogeneous atmospheric distribution, (b) be fixed at the Sun's centre during the occultation to maintain a stable irradiance source from the Sun that is unaffected by the deformation of the solar disk at low altitudes, and (c) overlap with the ACE-FTS FOV, allowing the ACE-FTS derived temperature and pressure profile data to be directly utilized as the MAESTRO input atmosphere.
Pre-launch tests of the slit locations on the ACE Imagers were conducted at the Canadian Space Agency's David Florida Laboratory (DFL), Ottawa, Canada. Following the launch, a series of sun-scan observations were performed by scanning the sun tracker mirror in elevation and azimuth to verify their locations. A sun-scan procedure includes elevation scans (upwards and downwards across the Sun) at zero, positive, and negative azimuth offsets, as well as a separate azimuth scan. Note the sun tracker elevation and azimuth directions are close to, but not identical to, the vertical and horizontal directions relative to the Earth's horizon. They are not orthogonal to each other (see the sun-scan tracks in Fig. 5). The sun-scan measurements took place on 16–17 February, 21 February, 24–25 June, 8 December, and 15–17 December 2004. The relative positions of the MAESTRO slits and the ACE Imagers are fixed, so during these sun scans, images of the Sun are acquired at 4 Hz, enabling the identification of the slit locations on the Sun.
During an elevation scan, as the slit traverses the Sun, the MAESTRO spectral intensities reach their maxima when the slit is centred on the Sun. The location of the maximum is determined for both the UV and Visible-NIR data. Three sets of points are obtained from each of three azimuth offsets, and notionally, these points form a line aligned with the slit.
During an azimuth scan, the slit does not necessarily pass through the centre of the Sun. These scans begin off the Sun, then the intensity increases until the slit encompasses the Sun, indicated by an intensity plateau, before declining as the slit moves off from the Sun. The integrated MAESTRO half-intensity yields the locations of the edges of the slit in the azimuth direction.
Figure 4 illustrates the UV and Visible-NIR integrated intensities measured during a set of sun scans conducted on 8 December 2004, including an elevation scan (Fig. 4a), elevation scans with positive/negative azimuth offsets (Fig. 4b, c), and an azimuth scan (Fig. 4d). There are two peaks in intensity during each elevation scan procedure, one during the upward scan and the other during the downward scan. The positions of the Sun's centre are determined when the UV and Visible-NIR spectra reach their maxima in the elevation scans. For an azimuth scan, the times at the half maximum intensity are identified (Fig. 4d), allowing for the identification of the locations of the slit edges.
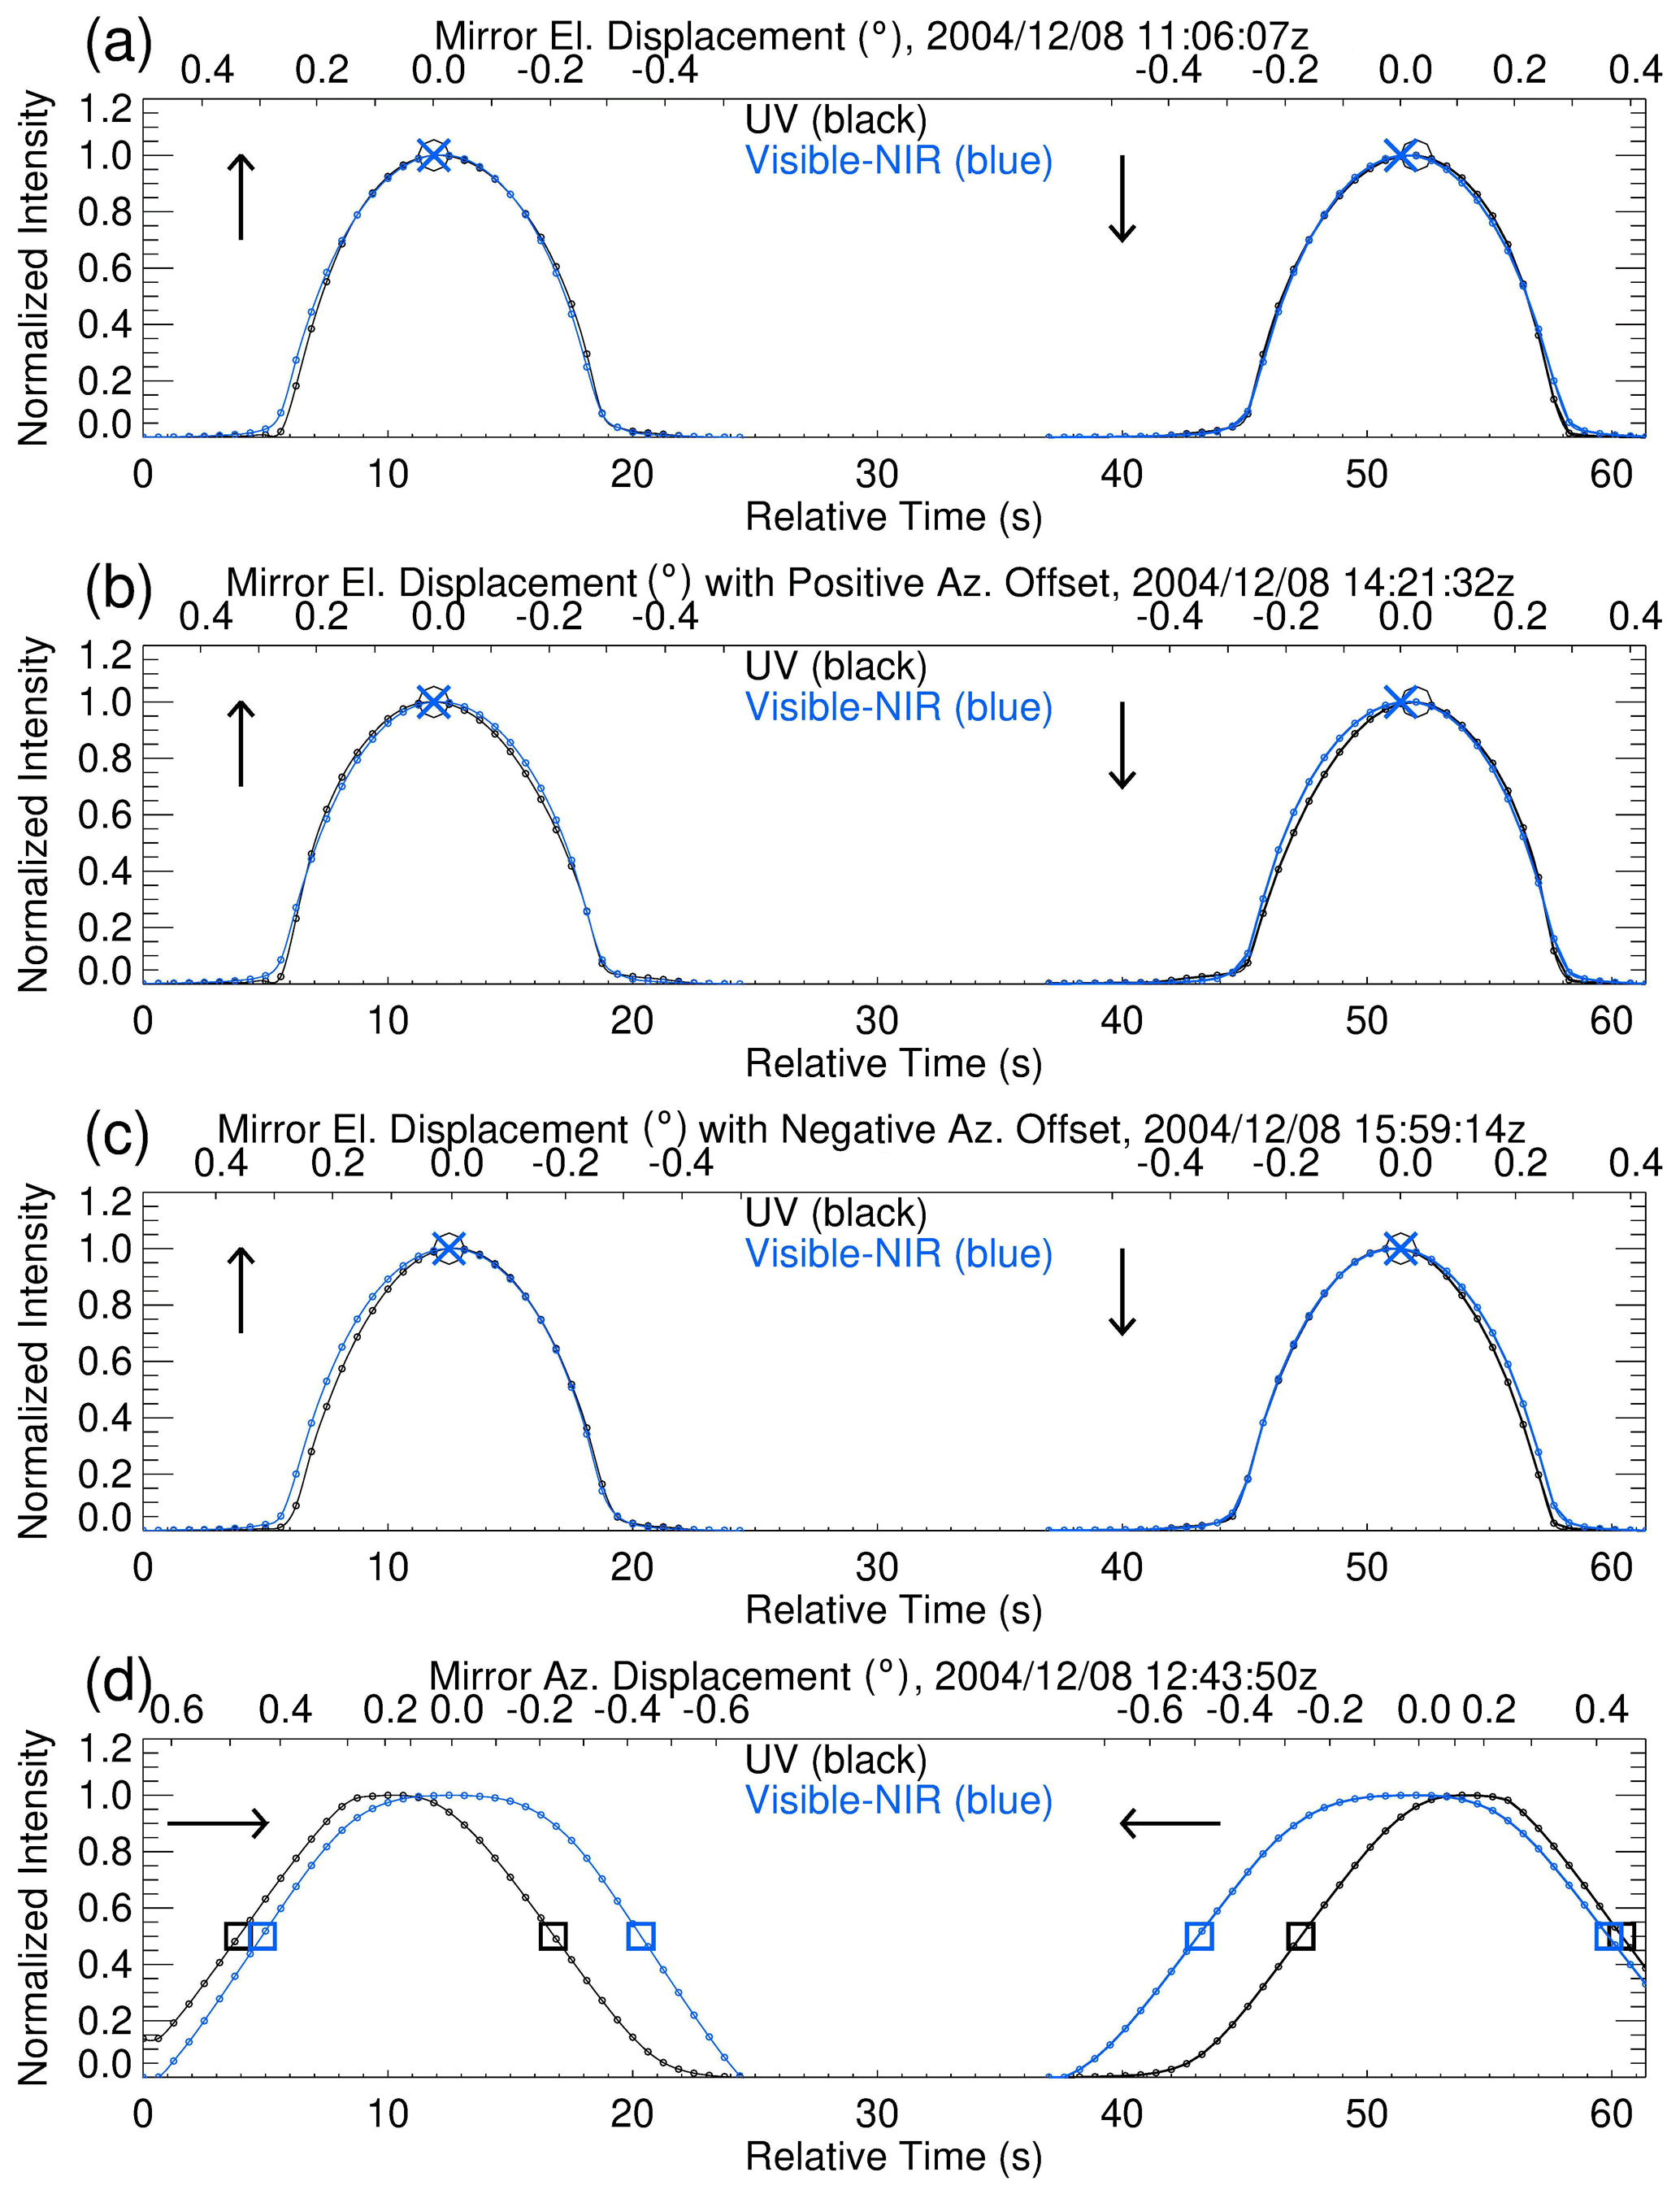
Figure 4From top to bottom, the integrated intensities from the MAESTRO UV (black) and Visible-NIR (blue) spectra recorded during the sun-scans. The top x-axes correspond to the sun tracker mirror displacements, in degrees, scanning in the elevation (El.) direction (a), in the elevation direction with positive (b) and negative (c) azimuth (Az.) offsets, and in the azimuth direction (d). The maximum intensities during the elevation scans are marked with an “x” for UV and a circle for Visible-NIR. Half-maximum intensities during the azimuth scans are marked with squares. The vertical arrows indicate upward and downward elevation scans, while the horizontal arrows indicate azimuth scans to the left and right.
The ACE imager data are used to determine the Sun's center. The intensity in the image center forms a plateau, so the Sun's boundary is identified by constructing a contour line at 15 % of the maximum intensity (the 15 % threshold was empirically determined) and fitted with an ellipse.
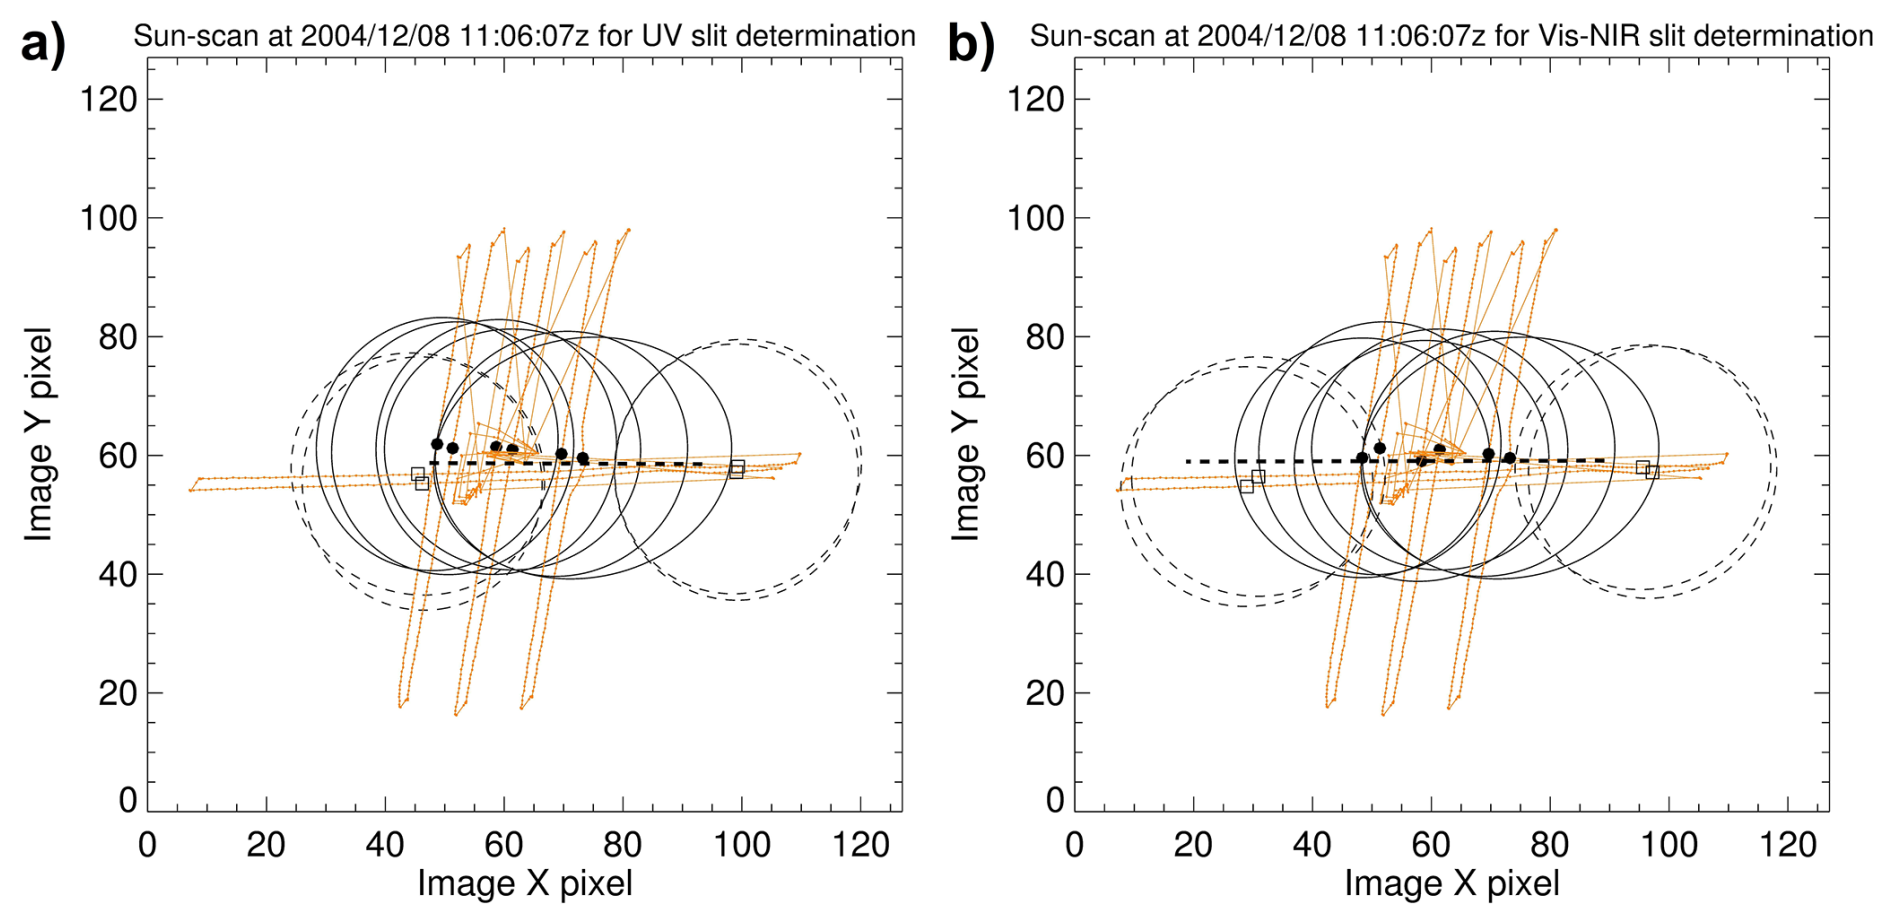
Figure 5The elevation and azimuth sun scans recorded on 8 December 2004 (orange solid straight lines) associated with the MAESTRO UV (a) and Visible-NIR (b) spectrometers. The sun centres (solid dots) and boundaries (solid ellipses) on the ACE NIR Imager are derived at the time when the UV and Visible-NIR slits cross the sun centre during elevation scans. During azimuth scans, the sun centres (open squares) and sun boundaries (dashed ellipses) are determined from the time of the half maxima of UV and Visible-NIR intensities. The dashed straight lines represent the positions of the UV and Visible-NIR slits estimated from the pre-flight test at DFL.
The locations of the slits on the Sun are determined from sun scans and the corresponding images. Figure 5a and b indicate the positions of the sun centres (solid dots) determined by the elevation scans from MAESTRO UV and Visible-NIR spectrometer data, along with the simulated sun boundaries using an ellipse model (solid large ellipses) applied to the ACE NIR Imager data. Each pixel represents a 0.013° field of view. Since the raw images' axes are fixed at 55.5° relative to the Earth's horizon (Gilbert et al., 2007), for straightforward interpretation, the images, along with the slits, are rotated so that the x-axis is parallel to the Earth's horizon. However, it is important to note that the elevation and azimuth scans are only approximately parallel to the rotated images' y- and x-axes.
Using the sun-scans and ACE Imager data, two solid lines are created, representing the MAESTRO UV and Visible-NIR slits. From the azimuth scan, the positions of the half maximum from the UV and Visible-NIR scan data are identified as the endpoints of each slit, marked as squares along with the dashed circles. The slit positions identified during pre-launch ground tests at DFL are the dashed lines.
Figure 6 shows the points on the UV and Visible-NIR slits estimated from the six sets of sun scans conducted in December 2004, the pre-launch tests at DFL, and the ACE-FTS FOV determined during the on-orbit commissioning (Walker et al., 2004). The slits from the DFL test are nearly parallel to the Earth's horizon and are slightly below the centre of the ACE-FTS FOV, which is close to the Sun's centre. For the on-orbit results, the Visible-NIR slit is almost horizontal and centred on the Sun. The UV slit is slightly rotated clockwise, indicating a FOV of 0.04°, larger than the expected 0.022°. It is also shifted in azimuth (to the right in Fig. 6) so that the slit does not encompass the Sun, resulting from an inaccurate alignment of the UV detector array that was not detected during ground testing. This misalignment is likely one reason why the MAESTRO UV O3 data are slightly poorer than the Visible-NIR O3 data (Jeffery et al., 2025), as the incoming irradiance does not originate from a fully complete source. The in-flight measurements are elevated by about 0.026° relative to the pre-launch DFL tests, but the two spectrometers are aligned in elevation and pass through the ACE-FTS FOV. These slit estimates in elevation and azimuth are somewhat imperfect, nevertheless, it appears that the MAESTRO slits changed only slightly through launch.
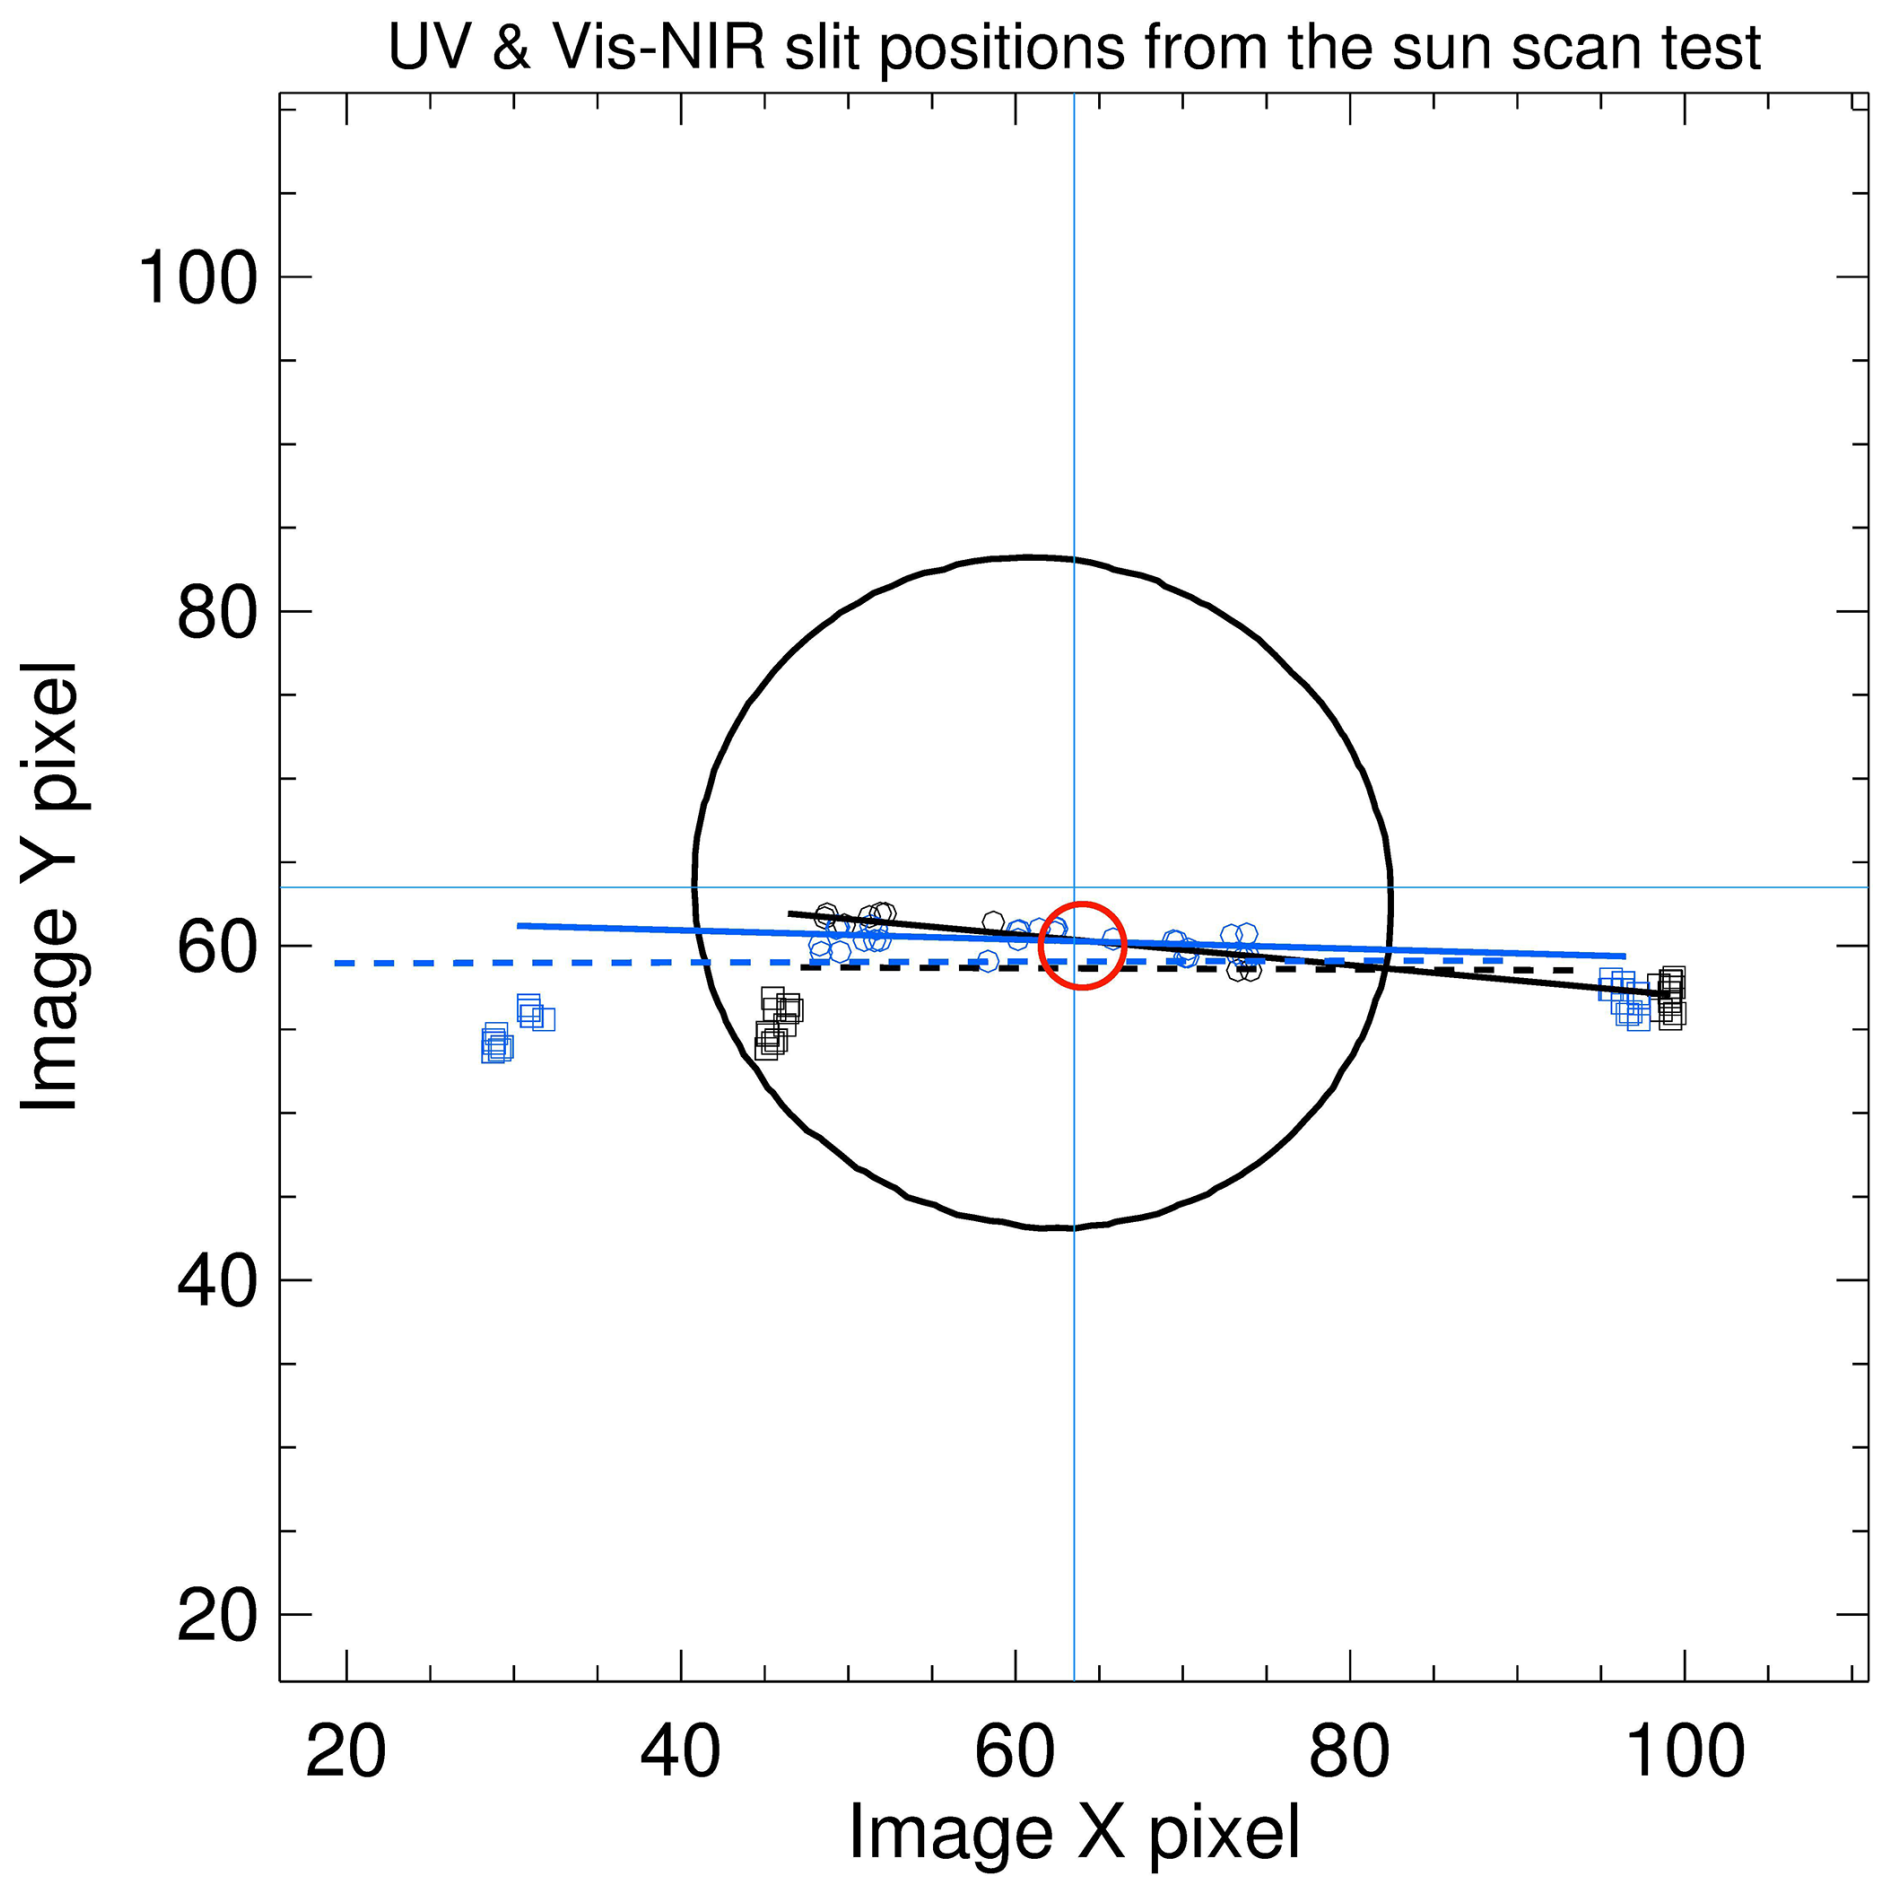
Figure 6The MAESTRO UV (solid black line) and Visible-NIR (solid blue line) slits estimated from six sets of sun scans recorded in December 2004. This plot is a 96 × 96 pixel image, cropped from the central part of the original 128 × 128 pixel image. The circles are the sun centres determined during the elevation scans for both UV (black) and Visible-NIR (blue) spectrometers. The squares represent the sun centres obtained from the azimuth scans for the UV (black) and Visible-NIR (blue) slits used to determine the edges of the slits. The UV (dashed black line) and Visible-NIR (dashed blue line) slits, as estimated from pre-launch tests at DFL, are shown. The red circle is the ACE-FTS FOV, as determined from an early commissioning test. The solid black circle denotes the position of the Sun's boundary.
3.3 The MAESTRO fields of view on the solar disk during occultation
During each occultation, the sun tracker is locked onto the sun centre by a quadrant sensor allowing the ACE Imagers to record solar images while ACE-FTS and MAESTRO take measurements. During sunset (sunrise), the tangent height decreases (increases), and the apparent solar disk shifts due to refraction, but the sun tracker keeps the instruments pointing at the radiometric centre of the Sun. However, at very low tangent heights, the sun image becomes compressed and asymmetric in the elevation direction, and the lower portion compresses more than the upper portion. Figure 7 presents a set of sun images captured by the ACE NIR Imager at tangent altitudes of approximately 100 km (Fig. 7a), 20 km (Fig. 7b), 15 km (Fig. 7c), and 10 km (Fig. 7d) during the sunset occultation measurement ss64172. The MAESTRO UV and Visible-NIR slits, derived from the DFL test (Fig. 6), are superimposed onto the solar disk. For uncertain reasons, the solar disk in the NIR image at high solar elevation is not quite a perfect circle (Fig. 7a) (Gilbert et al., 2007) with the ratio of the minor to major axes at about 0.95 when fitting the sun boundary to an ellipse (Fig. 8b).

Figure 7Sun images for ss64172 captured by the ACE NIR Imager at tangent altitudes of 100 km (a), 20 km (b), 15 km (c), and 10 km (d) for ss64172. The yellow contour represents 15 % of the peak intensity, marking the Sun's boundary, and is fitted with an ellipse (red). The UV (blue dashed line) and Visible-NIR (light blue dashed line) slits, obtained from the pre-launch DFL test (Fig. 6), are superimposed.
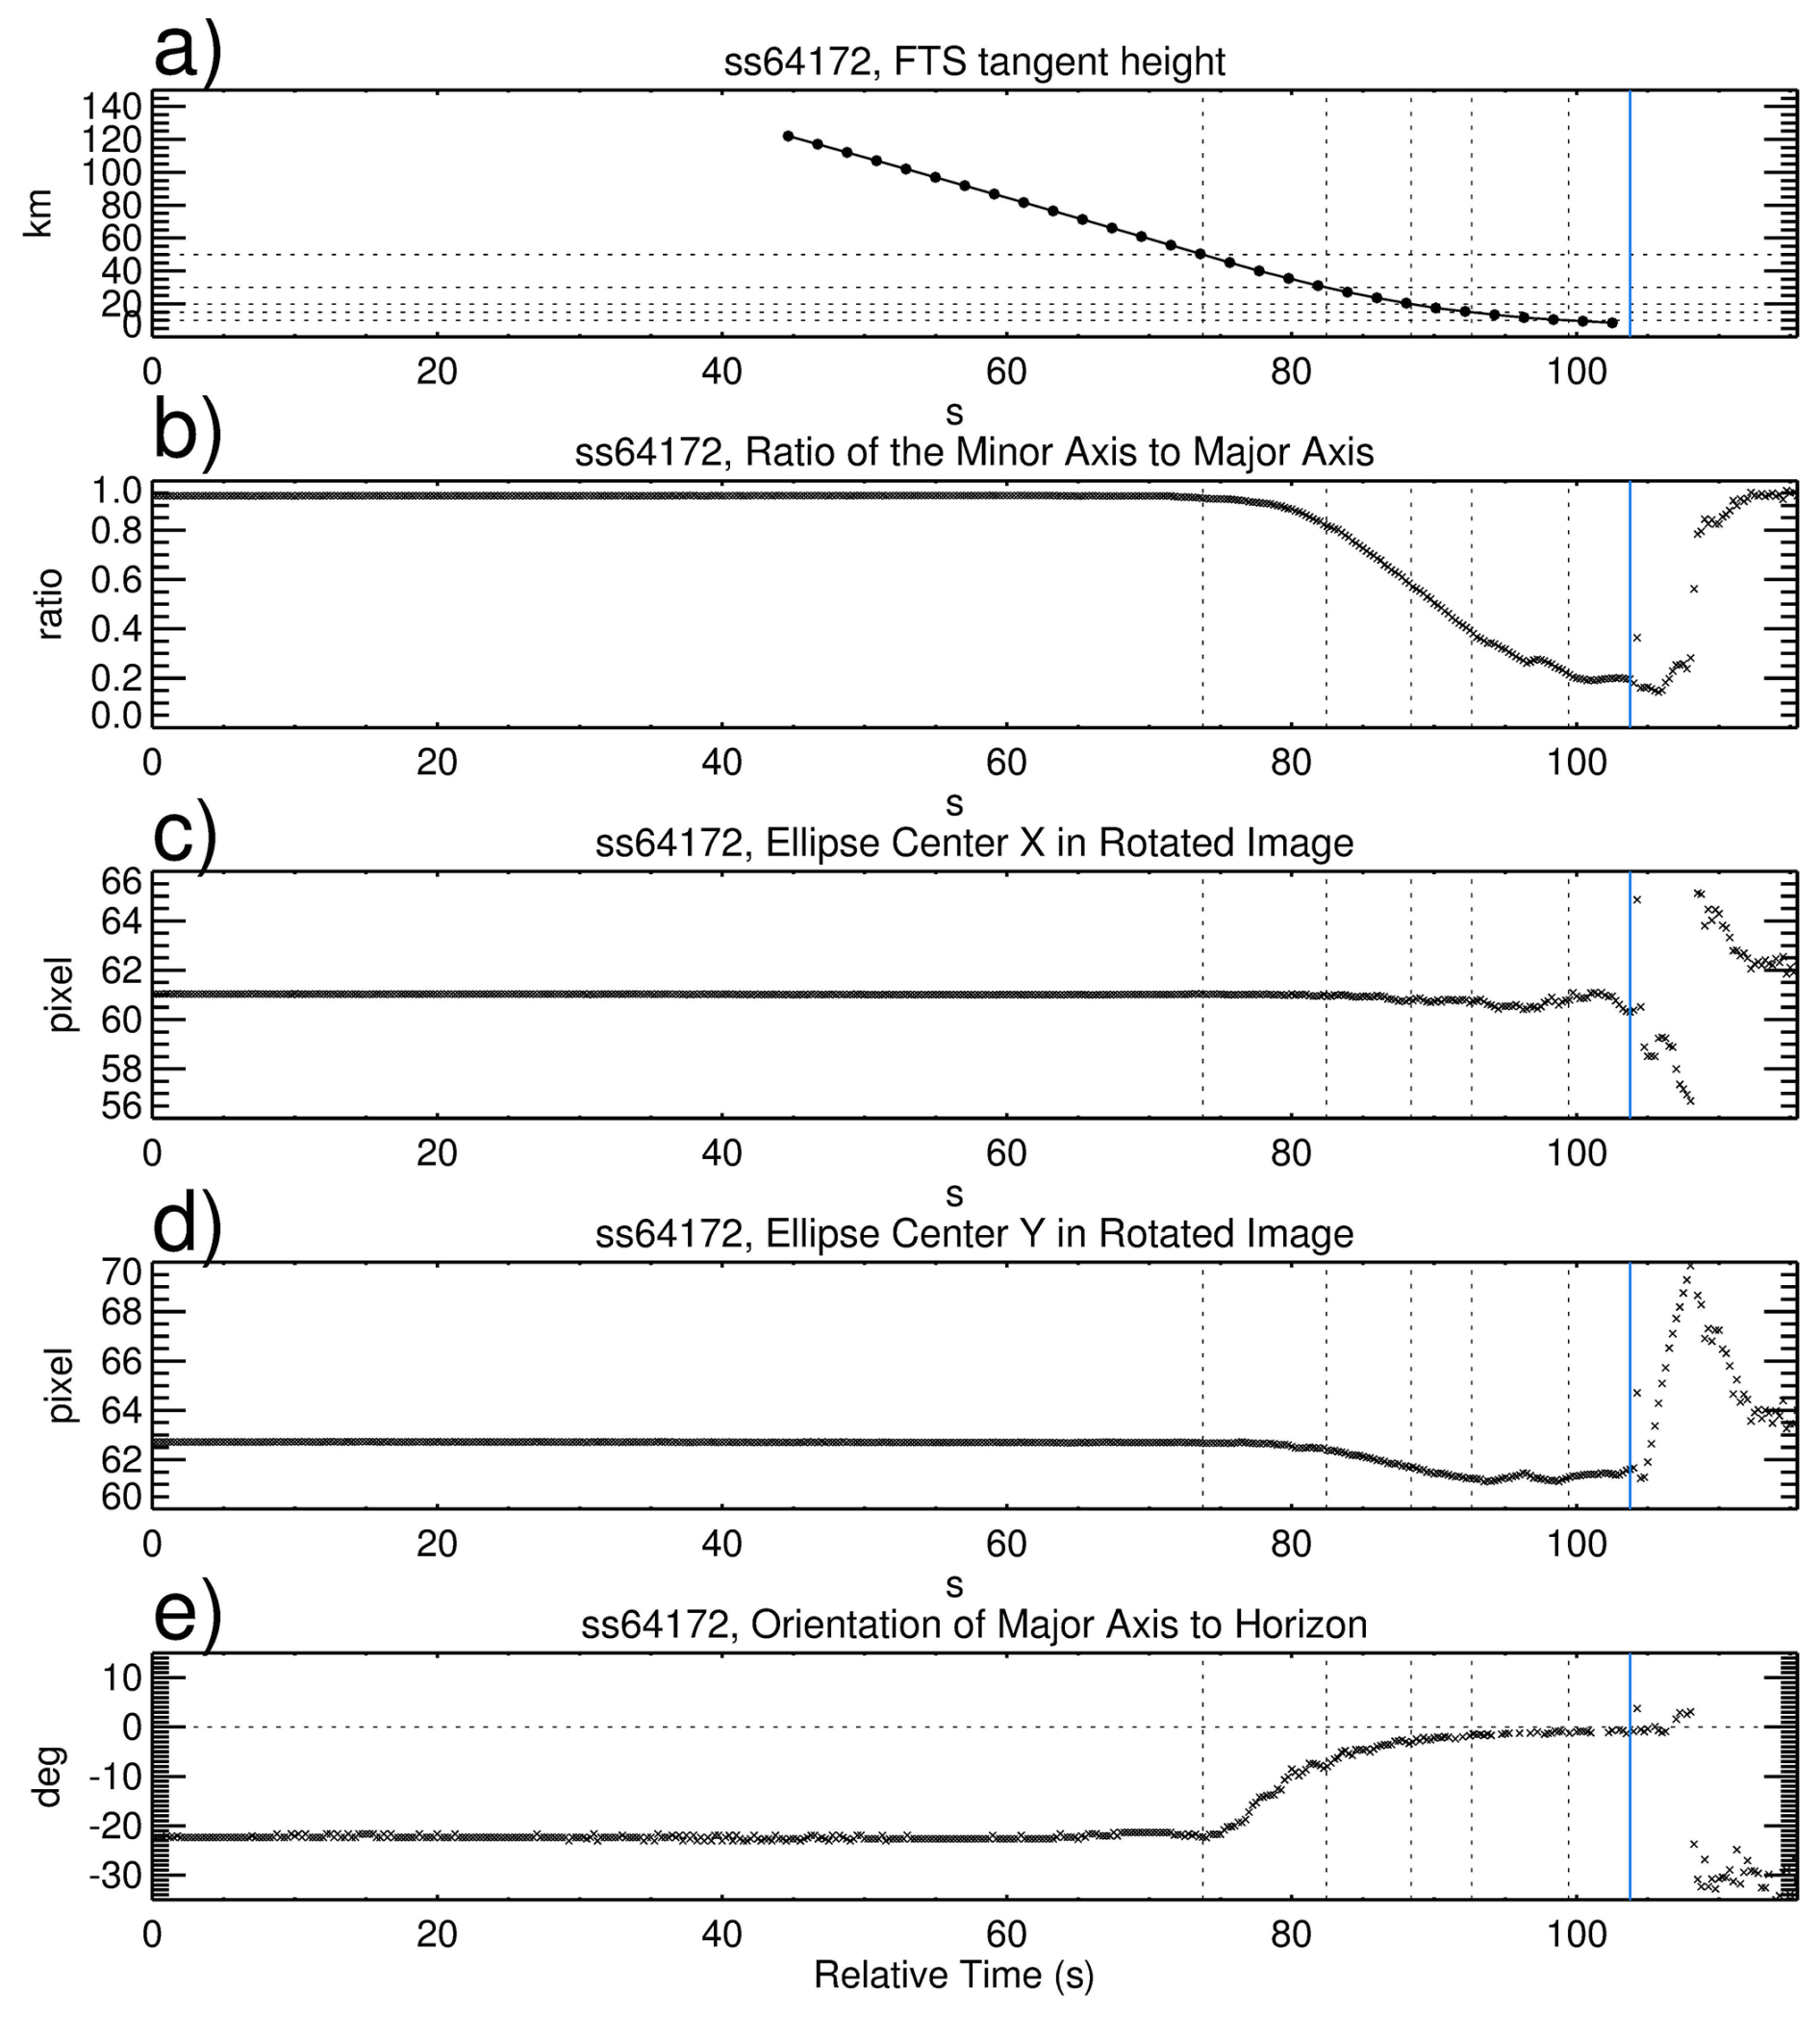
Figure 8The ACE-FTS tangent height vs. time curve for ss64172 (a). Time sequences of the ratio of the minor to major axes (b), the sun centre's X- and Y-coordinates in the images (c, d), and the orientation angle of the major axis to the horizontal axis (e). Vertical dotted lines indicate the time of the ACE-FTS measurement tangent heights at 50, 30, 20, 15, and 10 km. The vertical blue lines indicate the time at a low altitude when the sun tracker is no longer locked on the Sun.
In theory, for the Level 1 transmittance calculation, all measurements must originate from the same location on the Sun's disk. However, the MAESTRO slits do not precisely align with the tracker in elevation, and coupled with the flattening of the solar disk, a correction is required.
Following the procedure used in Sect. 3.2, a Sun boundary is established at 15 % of the peak intensity of the image contour, and an ellipse model is used to determine the Sun's centre. Figure 8 illustrates the analysis of these derived parameters for ss64172. Figure 8a shows the ACE-FTS tangent height versus time curve for this occultation, with measurement times at tangent heights of 50, 30, 20, 15, and 10 km indicated by the dotted vertical lines. After reaching the position denoted by the vertical blue line, which is determined from when the standard deviation of the Sun's vertical coordinates drastically increases, the sun tracker unlocks. Figure 8b shows the ratio of the minor to major axes for the derived ellipse. Outside the atmosphere, the ratio is ∼ 0.95, but within the atmosphere, the disk becomes distorted below ∼ 35 km and then progressively appears more “squashed” as the ratio decreases.
Figure 8c and d show the azimuth (X) and elevation (Y) midpoints of the sun's edges. The azimuth midpoint (Fig. 8c) is almost constant until the tracker loses lock. Below about 50 km, the elevation midpoint trends downward (Fig. 8d) as the sun tracker follows the radiometric centre of the radiance. This centre is a fixed location on the Imager, at the same location of the ACE-FTS FOV centre, but itself not necessarily at the midpoint of the ellipse contour. Figure 8e shows the orientation angle of the major axis with respect to the x-axis, reflecting the roll of the spacecraft. At high altitudes, the sun image is nearly a perfect circle, but the orientation angle is around −20° due to the imperfect imaging of the sun disk. Below 50 km and before the tracker loses lock, the non-circular image asymptotes to zero orientation angle.
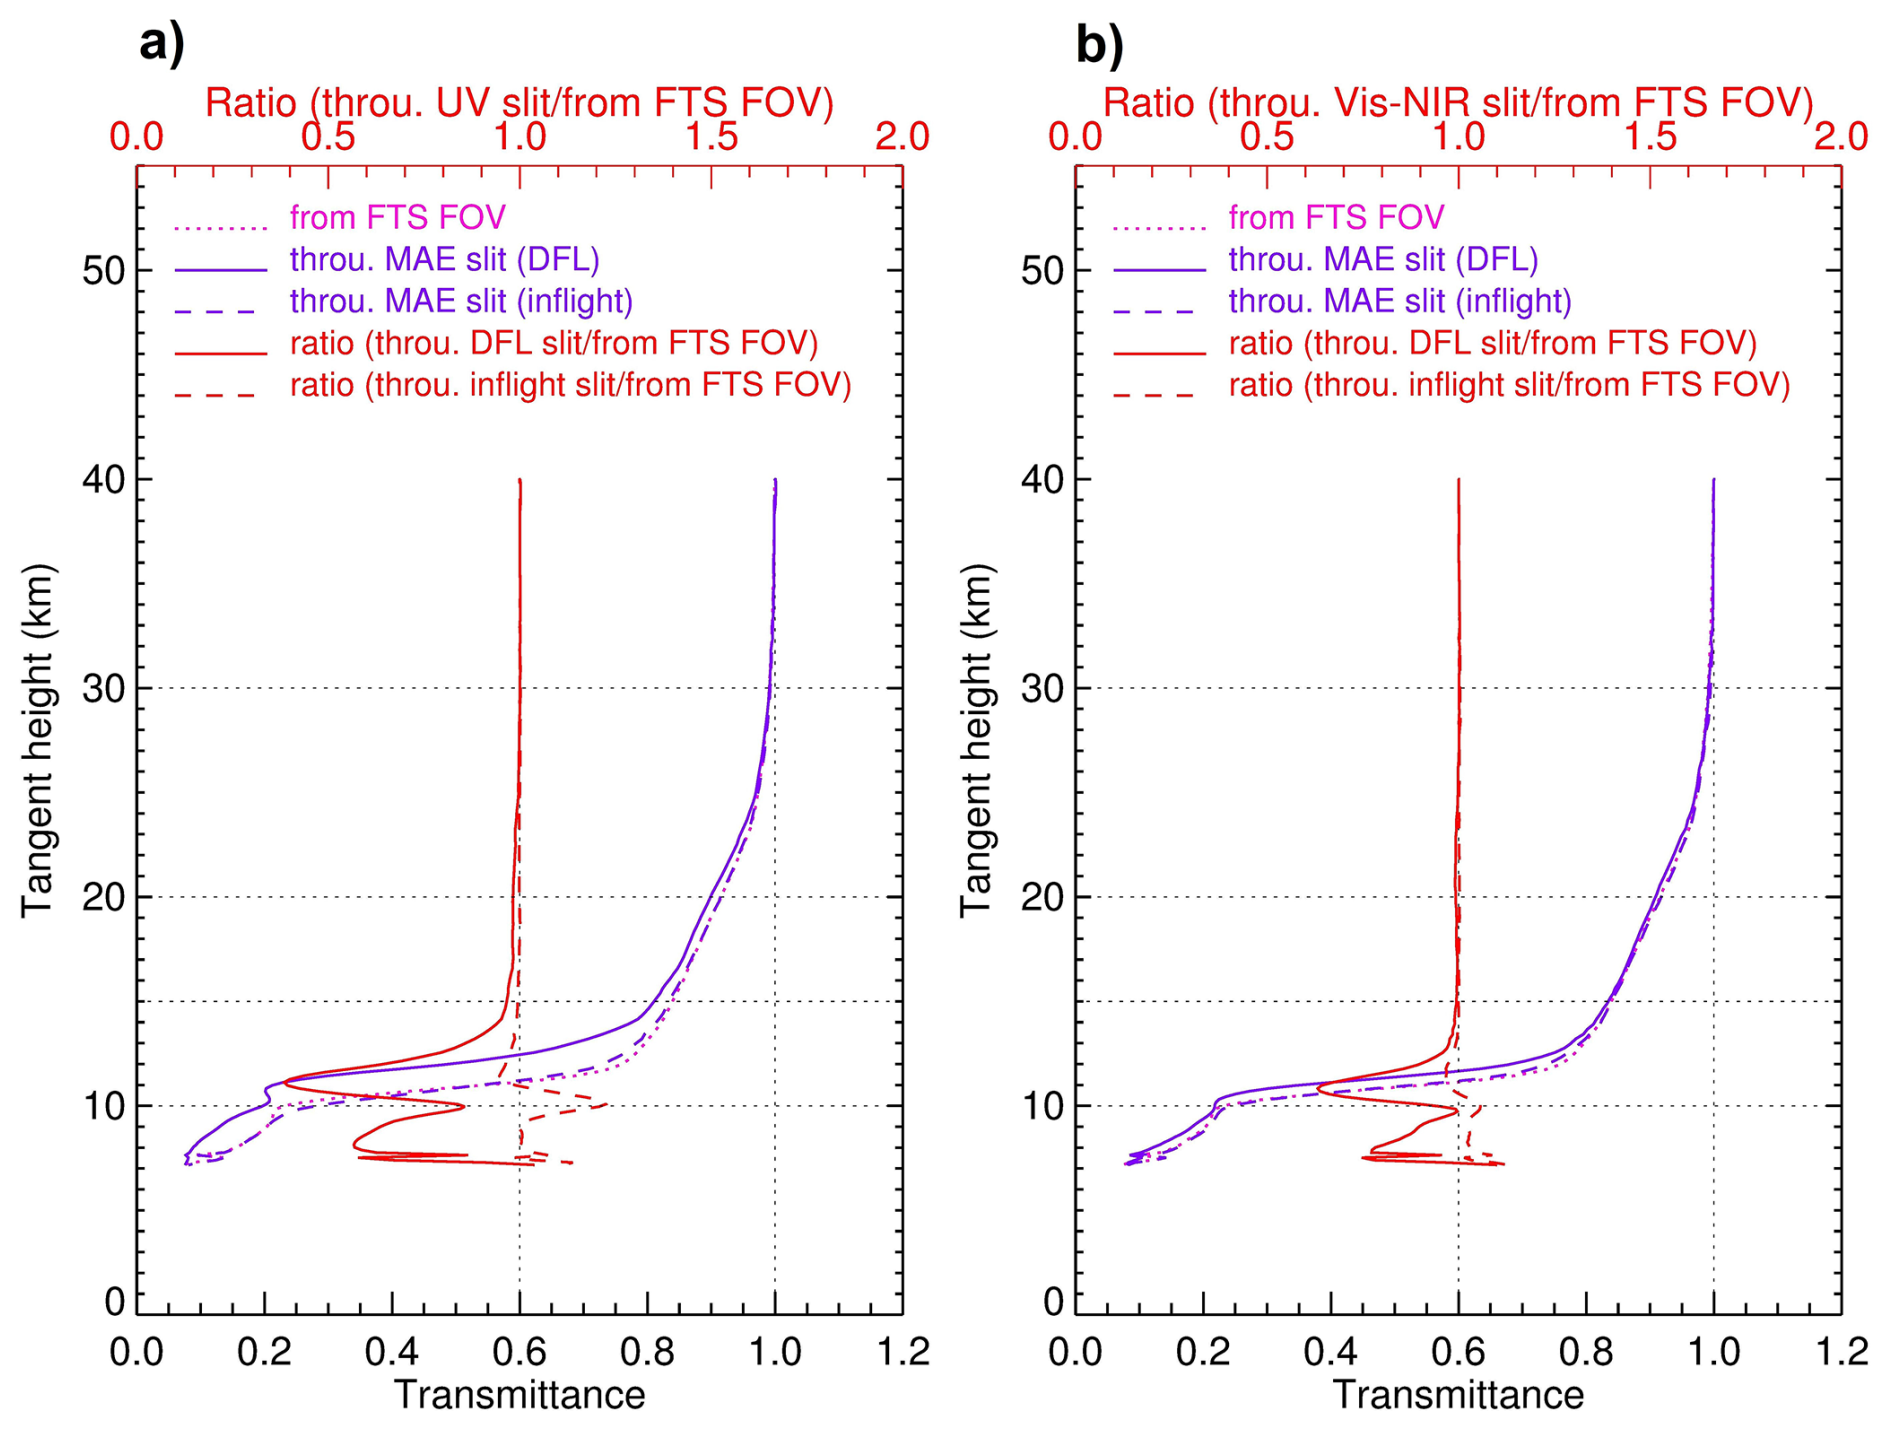
Figure 9The transmittance profiles below 40 km derived from the ACE NIR Imager integrated intensities alongside the MAESTRO UV (a) and Visible-NIR slits (b) estimated from the DFL test (solid blue) and from the in-flight sun-scan test (dashed blue), as well as the transmittance profile derived from the ACE NIR image intensities on the pixels where the ACE-FTS FOV is located (dotted pink). The two red curves are the ratios (top scales) of the DFL slit-position-derived transmittances (solid red) and the in-flight sun-scan test slit-position-derived transmittances (dashed red) to the ACE-FTS FOV-derived transmittances.
Figure 9a and b show the transmittance profiles estimated from the ACE NIR Imager intensities integrated along the MAESTRO UV and Visible-NIR slits derived from both the DFL test and the 8 December 2004 in-flight sun-scan test, respectively. The Imager transmittances calculated from the ACE-FTS FOV (see Sect. 3.2) are co-located and overplotted as the reference. The transmittance profiles through the slits, derived from the in-flight sun-scan test, closely match the reference profile. At altitudes below about 15 km, the DFL slit-position-derived transmittance is lower than that of the reference profile, with the ratios between the two transmittance profiles reaching about 50 % around 11 km. The MAESTRO Level 1 transmittance data is underestimated at low altitudes for all wavelengths when compared to other solar occultation instruments, e.g., SAGE III/ISS (not shown here). This is more consistent with the DFL ratio than the in-flight test results. Although only one wavelength is investigated here, this study provides a clue for understanding the possible underestimation of MAESTRO nominal transmittances. Further exploration of this topic is necessary but falls beyond the scope of this study.
3.4 Instrument temperature monitoring and anomaly assessment
Figure 10 shows a typical short-term (48 h) temperature plot for 3–4 March 2024 for the radiator (Fig. 10a), the diffraction grating of the Visible-NIR spectrometer (Fig. 10b), and the electronics board (Fig. 10c). The radiator is at the lowest temperature, about −9 °C, the spectrometer grating is about −6.5 °C, and the electronics board is at about 20 °C. The orbital timescale is the dominant pattern, with a cycle from sunset to sunrise at about 3 °C for the radiator, 0.5 °C for the grating, and 1.5 °C for the electronics. The electronics temperature (Fig. 10c) exhibits additional changes around sunset and sunrise due to occultation measurement activities.
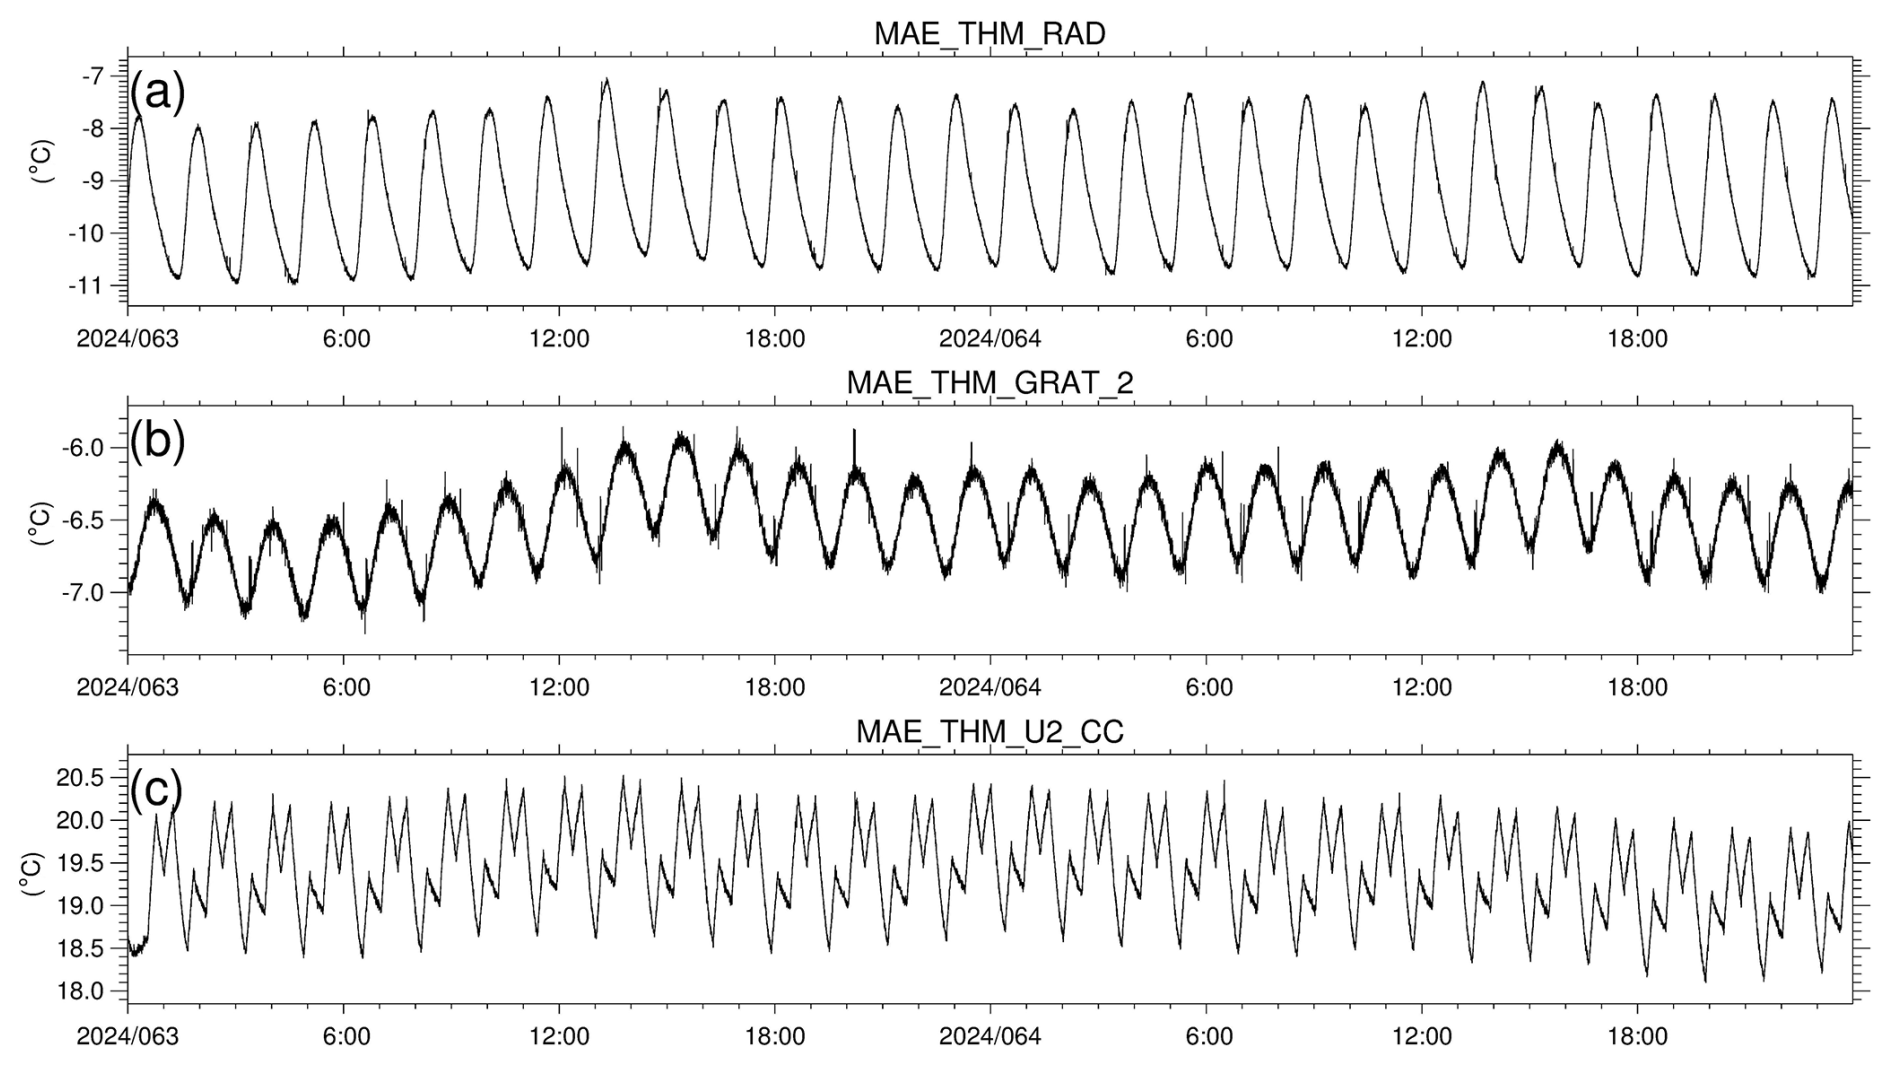
Figure 1048 h temperature (°C) for 3–4 March 2024 for the radiator (a), the grating for the Visible-NIR spectrometer (b), and the electronics board (c).
Figure 11 shows a longer-term (1 year) temperature plot for the Visible-NIR spectrometer grating only. Temperature variations are influenced by multiple factors, including month-to-month changes (about 2 °C) due to the approximately 4-month beta angle cycle and the annual cycle of the Earth-Sun distance. The features in June and December result when the satellite is exposed to prolonged sunlight for more than two weeks at high beta angles (> 60°) when no occultation measurements are possible. At this time, MAESTRO only provides high sun measurements. In early July, the temperature drops when the ACE-FTS undergoes decontamination for a few days; during this time, no measurements are taken. Other temperature telemetry records (not shown) display similar patterns but at different magnitudes. Periodic temperature variations occur throughout the mission.
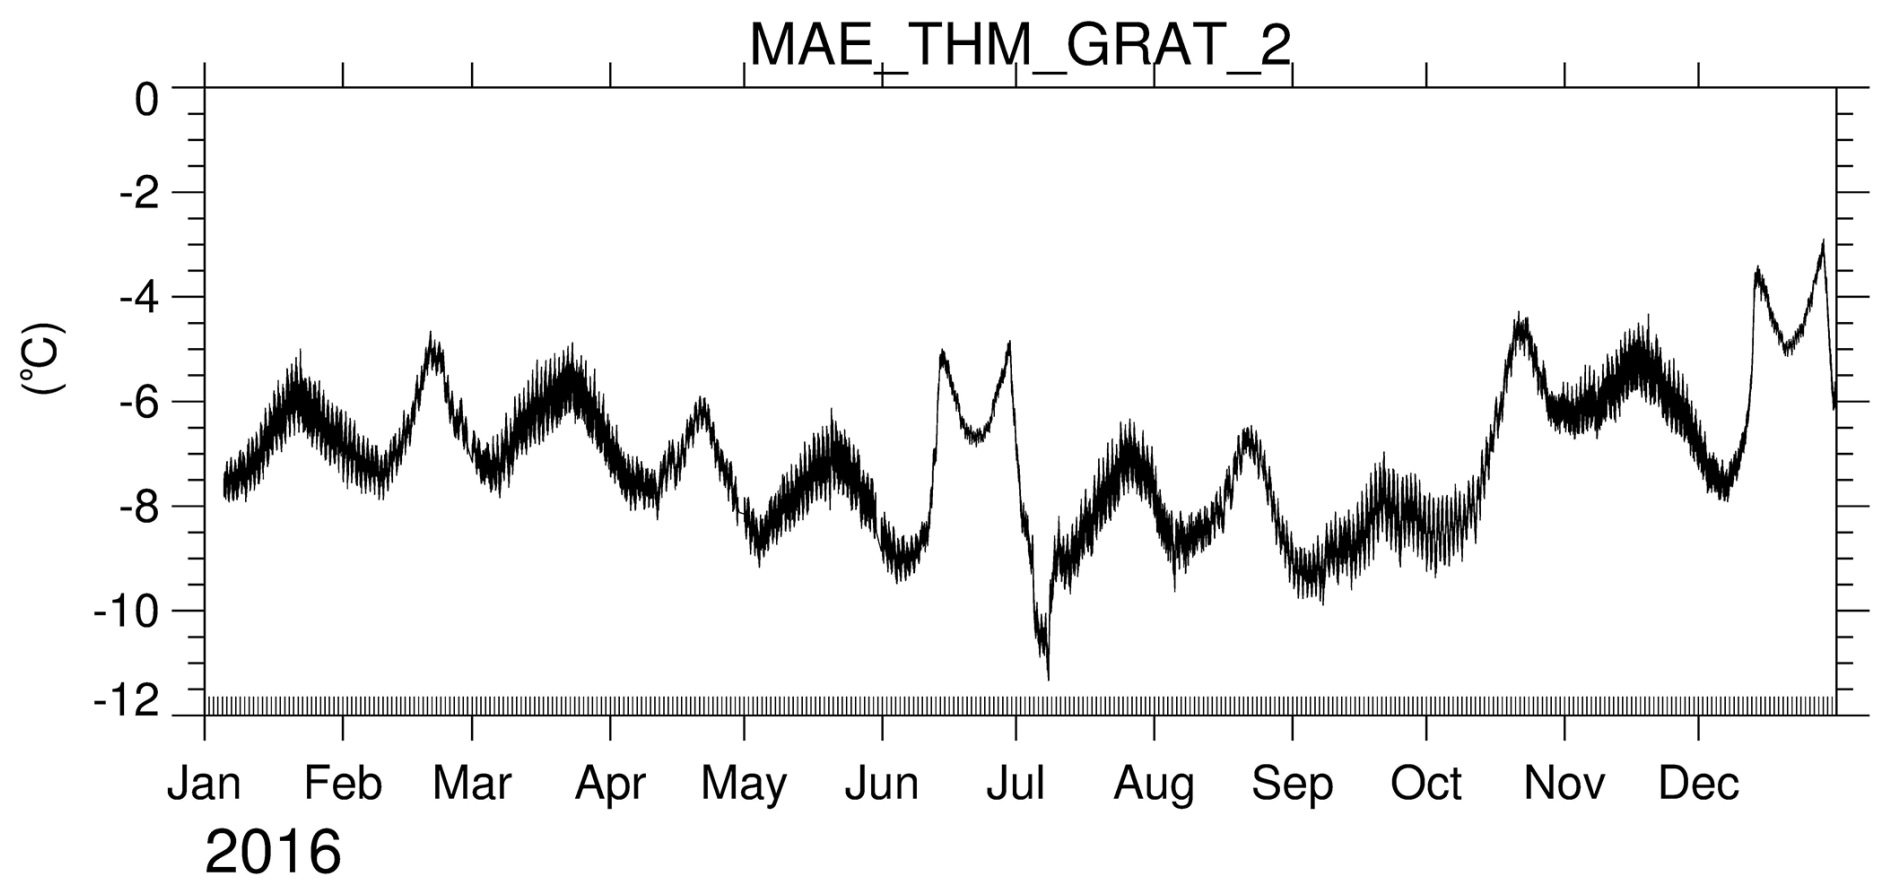
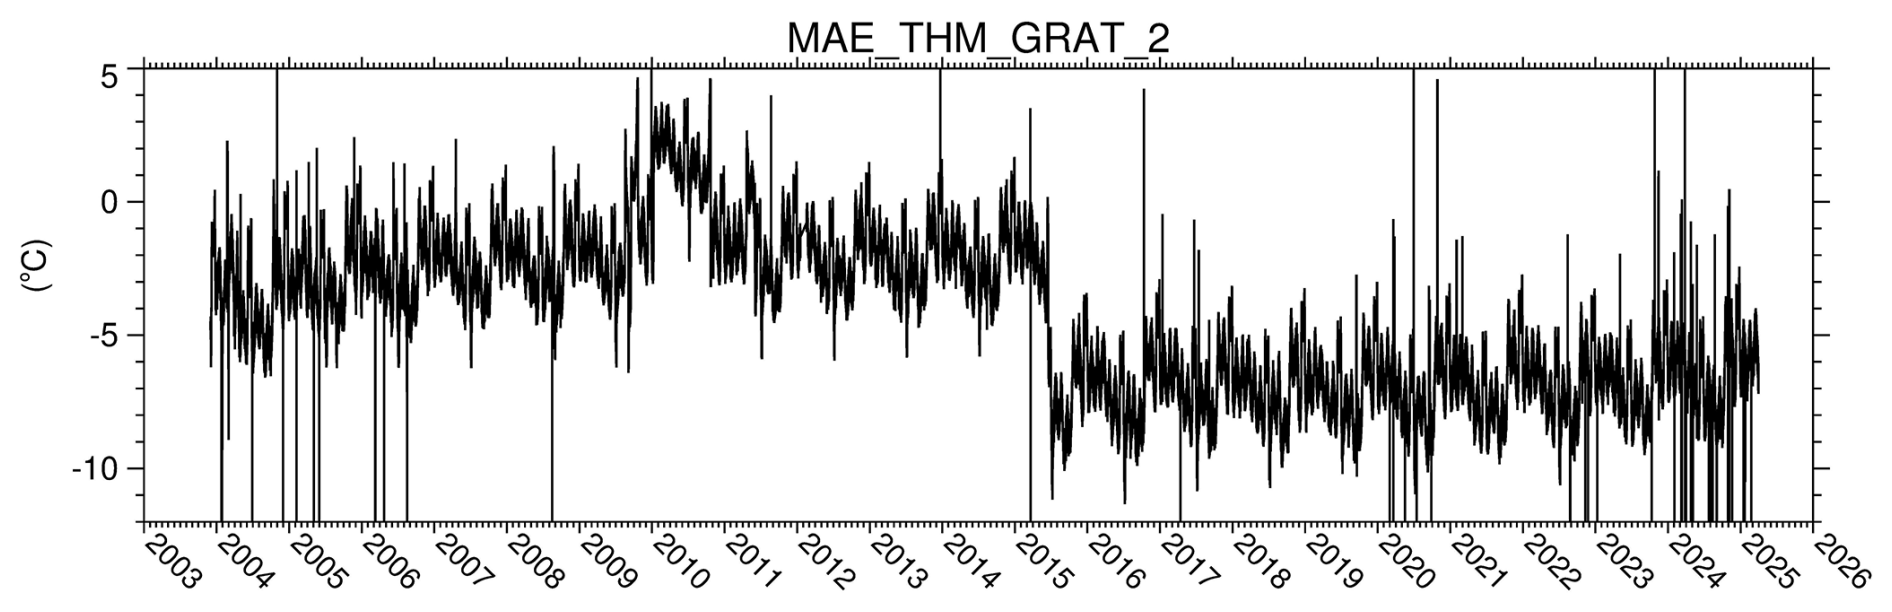
Figure 12 presents the 21-year temperature history for the Visible-NIR spectrometer grating. The faster cycles are superimposed on a generally stable long-term record. However, there are two notable exceptions: (1) the increase in temperature between January 2010 and September 2010, which has no apparent cause, and (2) the persistent decrease of about 5 °C starting 17 June 2015, when the star tracker failed, leading to reduced power consumption for the satellite. The temperature changes of the gratings affect the wavelength assignment for the detector pixels, which will be addressed in Sect. 3.5.2. This anomaly has allowed us to probe several issues, which are discussed in Sect. 3.5.
3.5 Impact of star tracker failure on the MAESTRO performance
3.5.1 Impact on the satellite orientation
The satellite's primary attitude control is via a 3-axis stabilization system that includes a momentum wheel, torque rods along three axes, one fine and six coarse sun sensors, and a magnetometer (Dahl et al., 1999). Pointing control provides ±1° precision in the pitch and yaw axes (3σ) and ±2° in the roll axis (3σ) (EO Portal, 2025). Secondary roll control was provided by a star tracker, which failed on 17 June 2015.
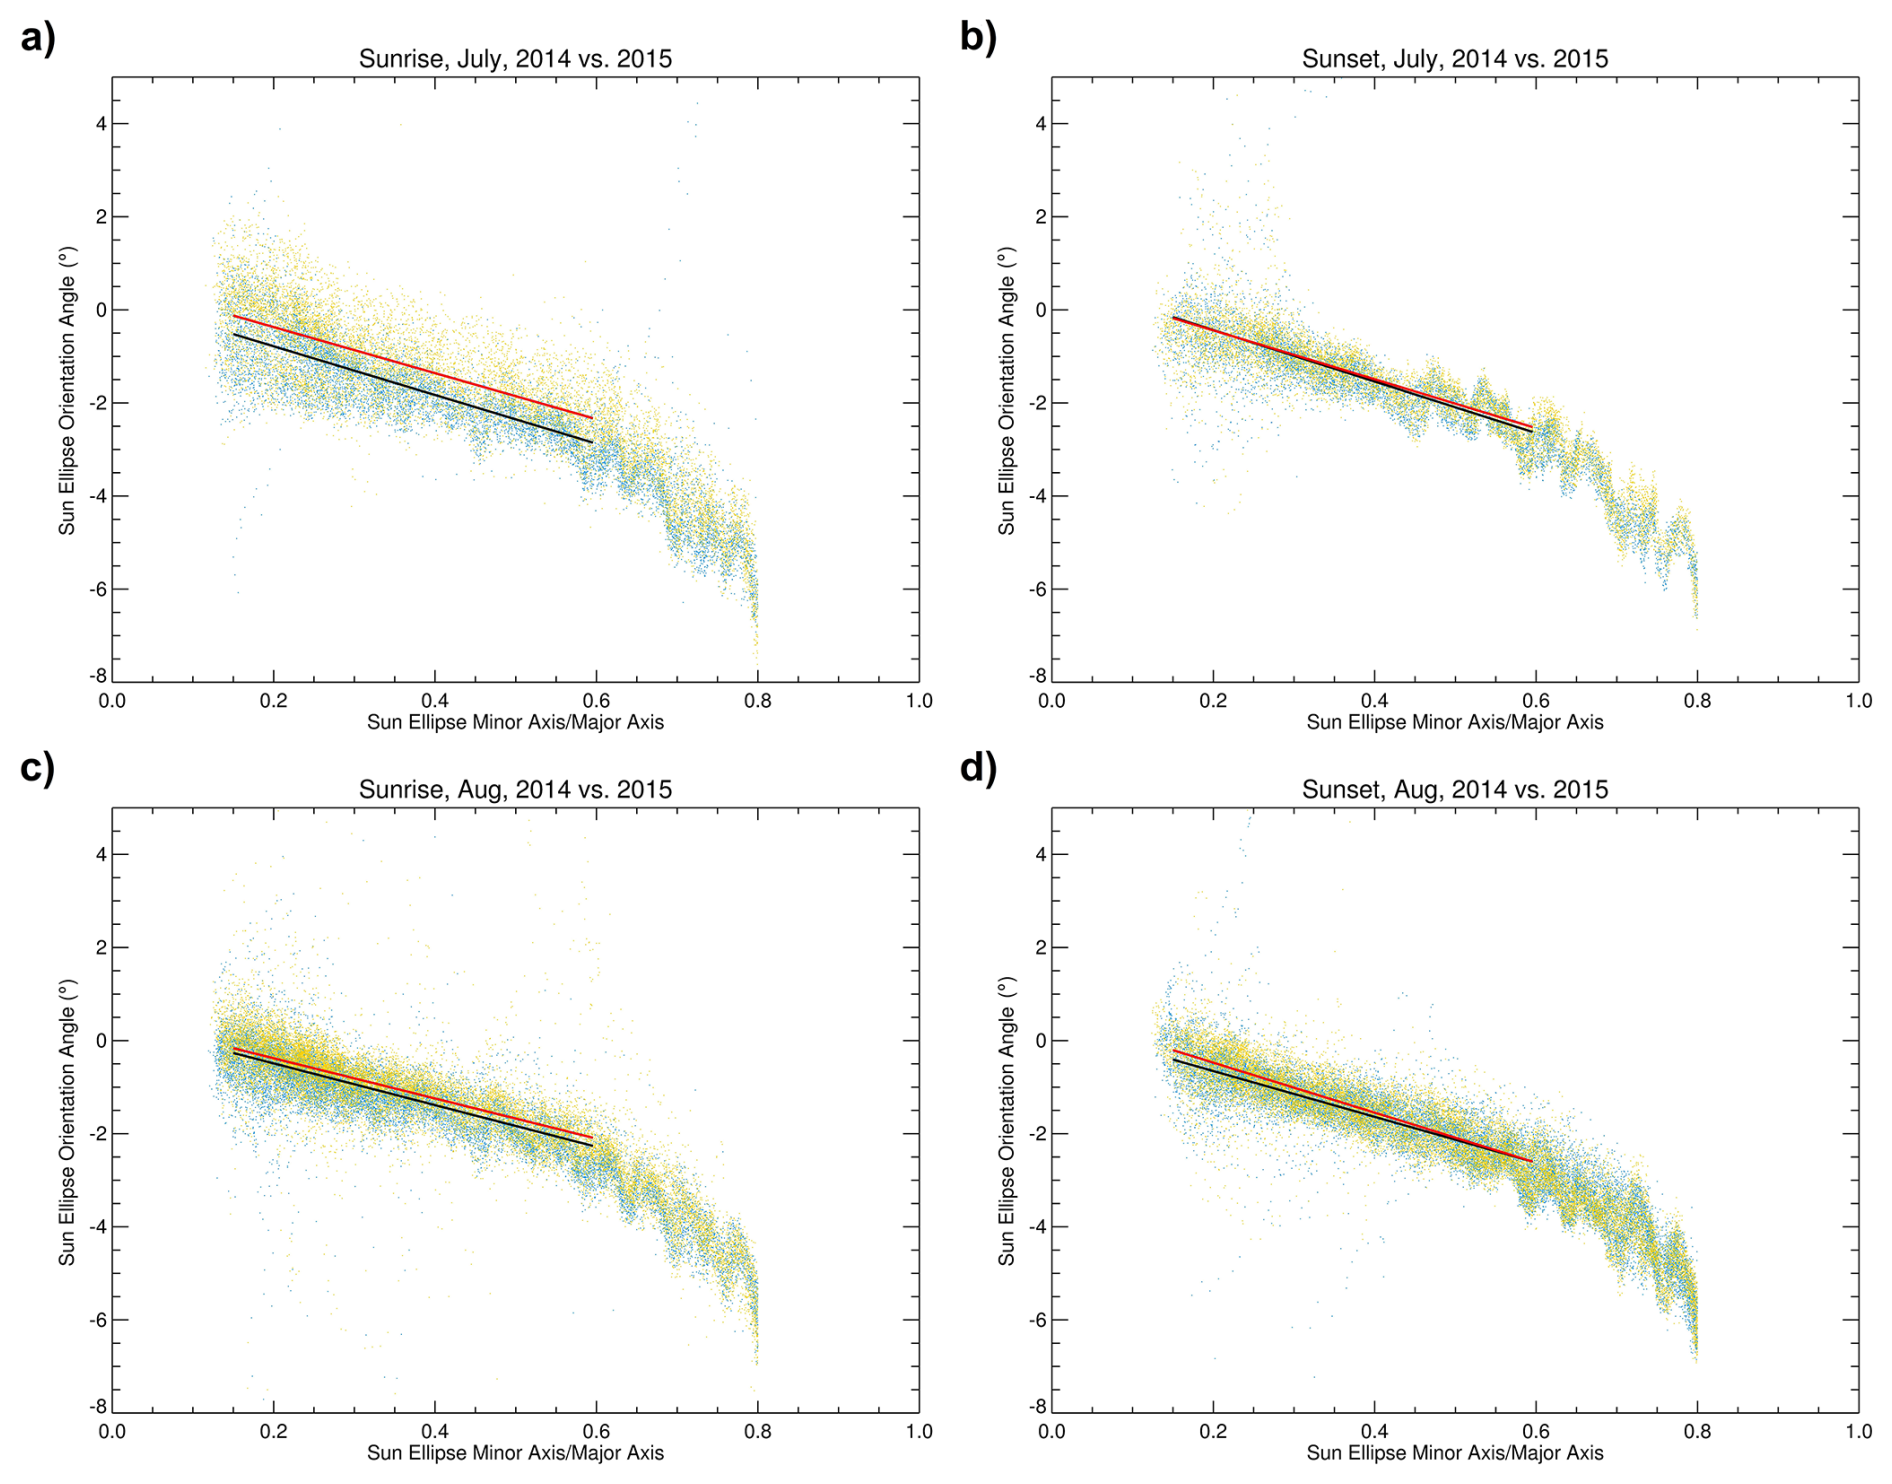
Figure 13Scatter plots showing the orientation angles of the major axis of the simulated sun and the ratios of the minor and major axes of the ellipse before the star tracker failure (2014, light blue dots) and after the failure (2015, orange dots) for July sunrise (a), July sunset (b), August sunrise (c) and August sunset (d) measurements. The black (2014) and red (2015) lines are the linear fits for the 2014 and 2015 data points within the 0.15–0.6 ratio range. The plots were cut off below 0.15 due to the sun tracker losing its lock on the Sun at low altitudes, and above 0.8, as the images are almost circular. ACE NIR Imager data from July have fewer data points than those from August, as the ACE-FTS detector decontamination is typically performed in early July, and thus, no occultation measurements are made. Sporadic outliers mainly originate from images taken at low altitudes when the sun tracker fails to lock onto the sun, resulting in indeterminate data.
The star tracker failure had the potential to modify the MAESTRO slits' location on the sun disk by causing variations in the satellite's roll. The sun images help identify potential changes around this failure. As discussed in Sect. 3.3, the sun image becomes distorted as the tangent altitude decreases; however, if the spacecraft's roll changes, the image's rotation will change. Figure 13 shows scatter plots of the orientation angle of the solar disk and the ratio between the minor and major axes of the ellipse fitted to sun images in July and August for both 2014 (before the failure) and 2015 (after the failure). The ratio reflects the satellite's tangent height; the smaller the ratio, the lower the height. Using the months of July and August, rather than immediately before and after the failure, provides a consistent environment for comparison. Spacecraft rotations would be visible if there were differences between the two years.
Given that the projection of the slits on the Sun, which has a diameter of 0.5° (40 pixels on the Imager), is nominally 0.022° (elevation) × 0.65° (azimuth) for the UV and 0.022° × 0.89° for the Visible-NIR channel (McElroy et al., 2007), a 1° rotation of the spacecraft implies that the slit is smeared in elevation by approximately 0.0087° or 0.49 km (1 pixel is approximately 0.7 km; Gilbert et al., 2007). Figure 13a–d highlight the differences between 2014 and 2015 by fitting lines within the 0.15–0.6 ratio range (corresponding to altitudes of 10–20 km) and comparing the resulting lines of best fit. July has fewer data points than August due to scheduling conflicts with the annual ACE-FTS detector decontamination. Apart from outliers, all the data within the 0.15–0.6 ratio range fall between +1 and −3°, indicating that the slit smearing from this issue is no more than 1.5 km.
Additionally, only negligible differences are found between the data obtained before and after the star tracker failure. The largest difference between the pre- and post-failure data occurs for the July sunrise observations, with a change that is still less than 0.5°. Therefore, the difference in rotation between the two periods is much less than other factors; instead, the primary feature is the drift with the altitude (e.g., from 30 to 10 km as shown in Fig. 13), and the effect of the failure on rotation is minimal. This apparent rotational drift in the satellite attitude may contribute to errors in the transmittance calculations, or it may instead be related to the known Imager artifact (Gilbert et al., 2007), which a future study will assess.
3.5.2 Impact on the wavelength assignment
There is a known temperature-dependent wavelength shift in the MAESTRO, which the data processor accounts for. This processor fits the high sun reference spectrum for an occultation to a smoothed high-resolution Fraunhofer solar spectrum (Chance and Kurucz, 2010), convolved with the MAESTRO instrument line shape using a high-order polynomial model. The polynomial fit is then used as a reference for wavelength assignment in each occultation spectral measurement with adjustments to shift, stretch and possibly higher-order terms. Typically, the effect of a temperature change within an occultation is small, and the effect of temperature variations between orbits is readily constructed.
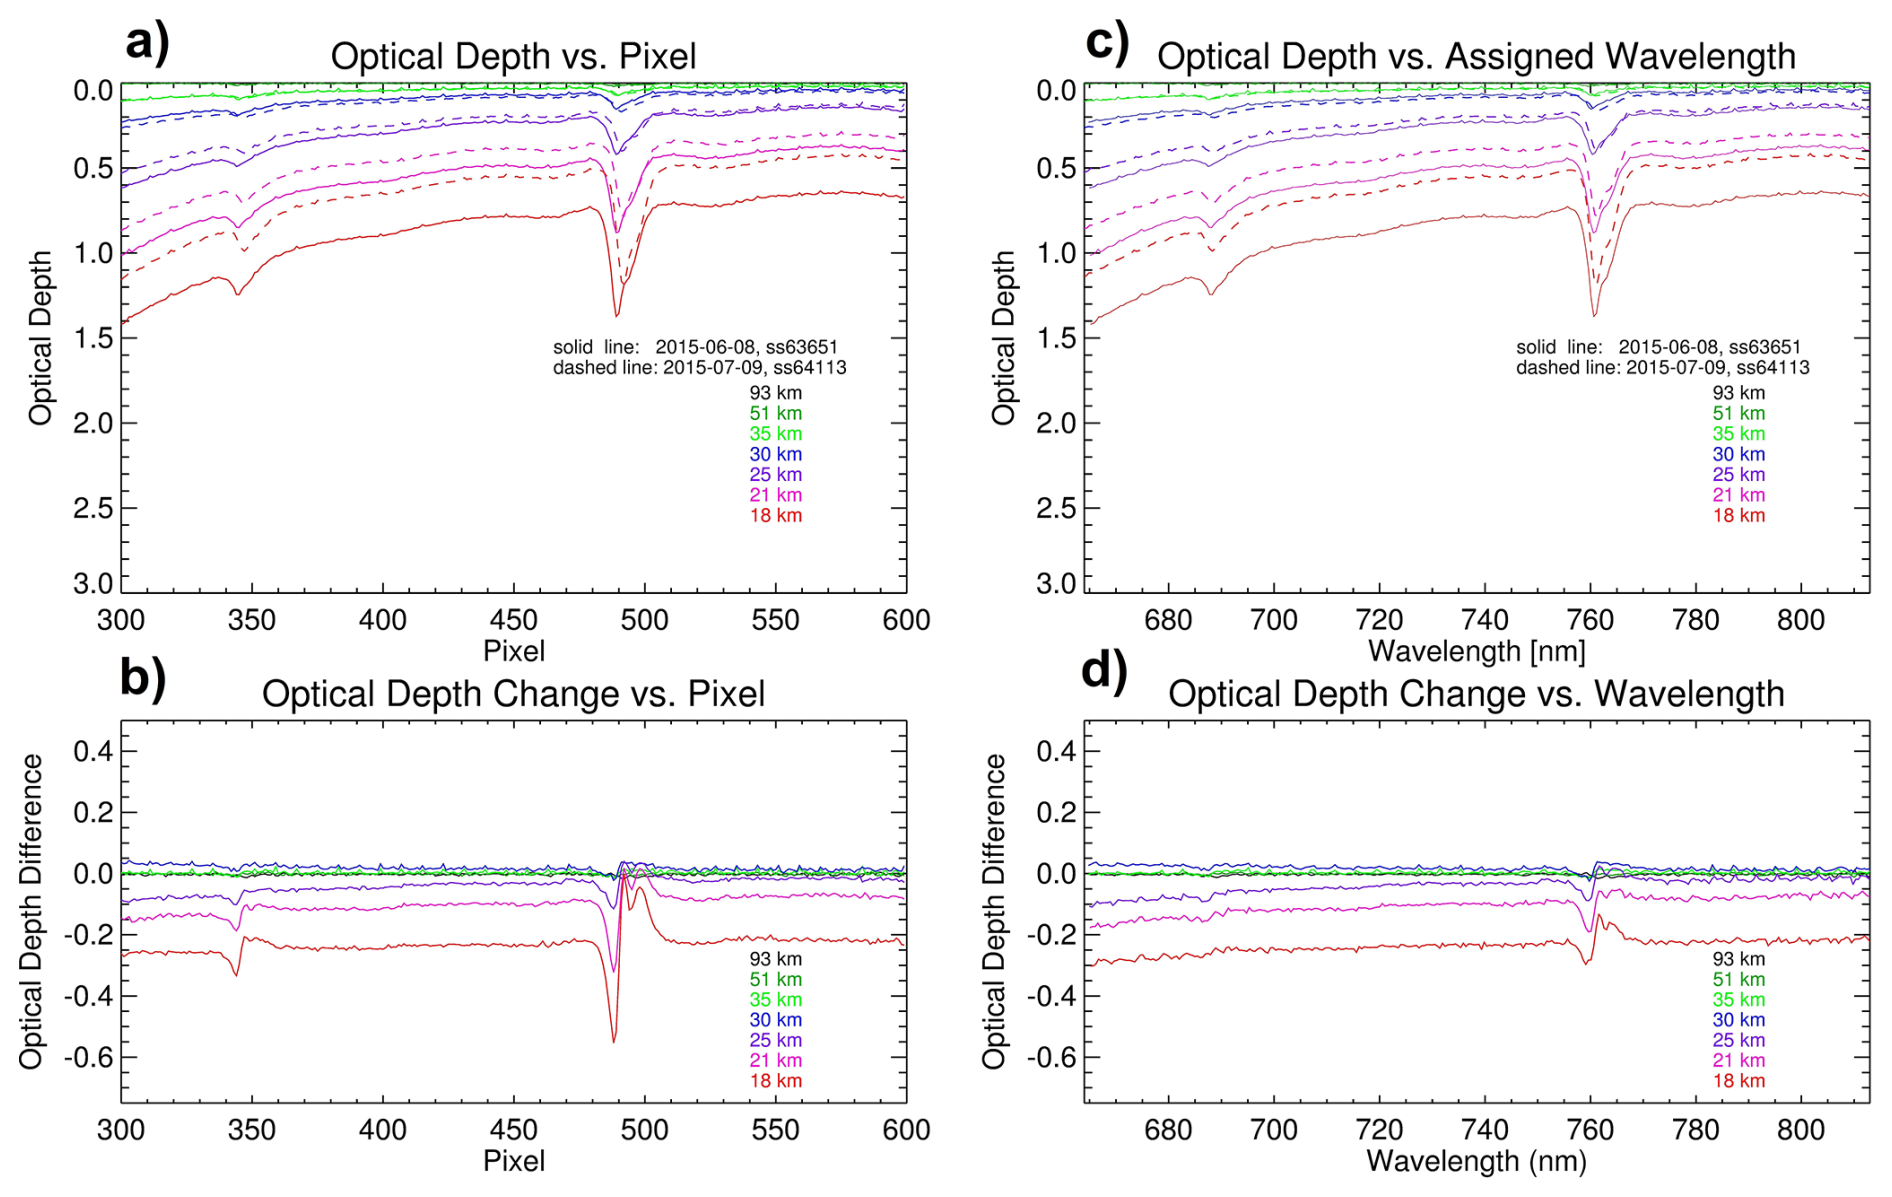
Figure 14The Visible-NIR optical depth spectra taken at several tangent heights (93, 51, 35, 30, 25, 21, and 18 km) during sunset occultation ss63651 on 8 June 2015 before the star tracker failure (solid) and during ss64113 on 9 July 2015 after the star tracker failure (dashed) as a function of pixel number (a) and their differences (b). The same spectra but with assigned wavelengths (c) and their differences (d).
The star tracker failure in 2015 affected the wavelength assignment due to the temperature change in the spectrometer grating (see Fig. 12). Figure 14a displays the raw optical depth spectra collected at various tangent heights (93, 51, 35, 30, 25, 21, and 18 km) for pixels 300 to 600 of the Visible-NIR spectrometer before (8 June 2015) and after (9 July 2015) the star tracker failure. Shifts in the spectrum are especially apparent between pixels 490–497, particularly at lower altitudes. Figure 14b illustrates the differences between the spectra before and after the star tracker failure, highlighting the wavelength shift. Figure 14c shows the same data as Fig. 14a, but with wavelengths assigned by the processor, and Fig. 14d shows the differences in wavelength assignment before and after the star tracker failure. These differences are significantly less than those in Fig. 14b, thereby demonstrating this approach's effectiveness even with a large temperature deviation. Thus, while not designed to handle the large temperature shift caused by the star tracker failure, this anomaly allows for an on-orbit confirmation of the data processing algorithm. Given the periodic temperature variations (see Sect. 3.4), the effect of wavelength shifts is accounted for.
3.6 Long-term trends in the UV and Visible-NIR high sun spectra
Figure 15a and b show the trends in the UV and Visible-NIR high sun spectra from 2004 to 2025, with one spectrum plotted per year. Part of the UV spectrum overlaps with the Visible-NIR, allowing for a direct comparison between the two spectrometers. MAESTRO trace gas retrievals use the 420–545 nm region for UV NO2 and O3, and the 530–755 nm region for Visible-NIR O3 with the temperature-dependent absorption cross-sections taken from the GOME flight model (Burrows et al., 1998, 1999). Figure 16a and b show the normalized time series of high sun spectral intensities at wavelengths 440, 490, 530 nm (arbitrarily chosen for UV) and 530, 603, 675, 779, 875, and 1012 nm (the same wavelengths used for retrieving the Visible-NIR aerosol data).
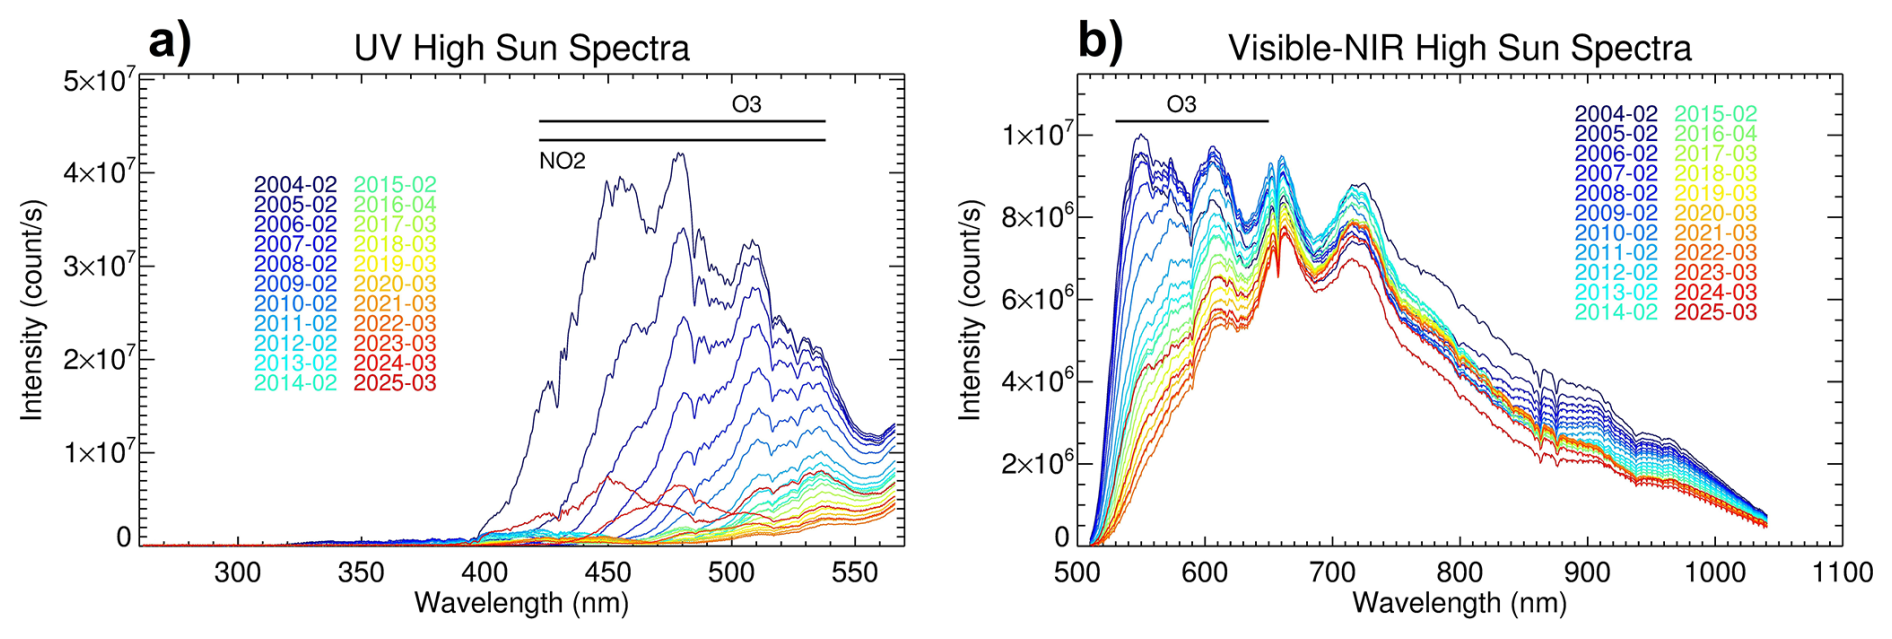
Figure 15A series of reference exo-atmospheric spectra obtained from the MAESTRO UV spectrometer (a) and the Visible-NIR spectrometer (b) covering 2004–2025, with one spectrum shown yearly. The relevant wavelength bands for the UV NO2, O3, and Visible-NIR O3 retrievals are indicated by horizontal lines near the top of the plots.
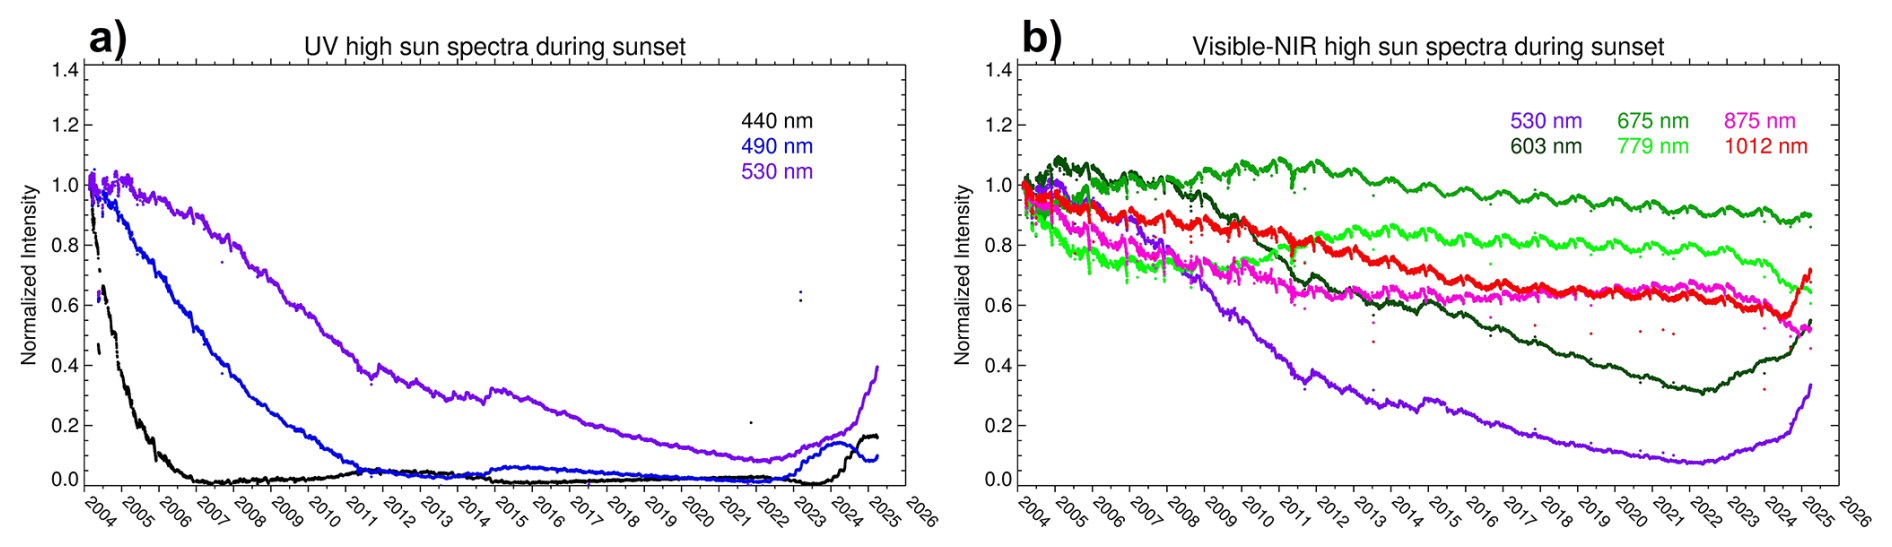
Figure 16Normalized time series of high sun spectral intensities between 2004–2025 from the UV spectrometer (a) and Visible-NIR spectrometer (b) at the wavelengths indicated by colour in the legends near the top of the plots.
The UV spectrometer at 440–490 nm shows a rapid decrease in intensity from launch values, reaching 90 % reduction by 2006 for 440 nm and 2010 for 480 nm. After 2022, the UV spectrometer signal shows a gradual recovery of about 10 %–40 % by 2025, with no definitive cause. However, this increased signal may allow for the retrieval of NO2 and O3 profiles in the future. The Visible-NIR spectrometer wavelengths exhibit different trends: longer wavelengths are more stable over time, while shorter wavelengths show trends similar to the UV spectrometer at the same wavelength. Since they are from separate spectrometers but share the common input optics, these decreasing trends are likely associated with the optics outside of the MAESTRO instrument.
Because solar occultation measurements are self-calibrating, the nearly simultaneous measurements of high sun and occultation spectra do not require the exact knowledge of the instrument's responsivity for transmittance calculation (McCormick et al., 1989; McElroy et al., 2007), allowing for the compensation of instrument changes. The Visible-NIR spectrometer continues to provide valid retrievals throughout the mission; however, due to UV spectrum degradation, the UV NO2 and O3 data are not valid after December 2009 (Jeffery et al., 2025). However, if the UV spectra continue to recover, retrievals from this channel will be resumed.
3.7 Determination of MAESTRO tangent heights
The initial plan for the MAESTRO retrievals was to utilize the time-tagged ACE-FTS pressure and temperature (p, T) profiles, along with the MAESTRO data. However, it was found early in the mission that the time from MAESTRO was inconsistent with that of ACE-FTS, likely due to variability in the satellite bus computer's interrupt latency (McElroy et al., 2007). Additionally, despite the on-orbit measurements discussed in Sect. 3.2, there is uncertainty between the MAESTRO and ACE-FTS FOVs and, thus, differences in the line-of-sight (LOS). Therefore, the retrieval algorithm must consider the time difference, UV LOS angle, and Visible-NIR LOS angle together.
In MAESTRO v1.2 data (Kar et al., 2007), these three parameters were set to constant values for all measurements, adjusting them until an ensemble of MAESTRO NO2 and O3 data agreed with those from ACE-FTS. At UTC (Coordinated Universal Time) times later than 20:00Z, MAESTRO profiles were found to often be larger than those from ACE-FTS by a factor of approximately 1.5–2. At all other times, MAESTRO agreed with ACE-FTS, suggesting that the time shift between the two depended on UTC.
Later retrieval versions calculated the time shift for each measurement. In v3 (and sub-versions thereof), the time shift for Visible-NIR measurements varied for each measurement, and the FOV angle was set to zero. The Visible-NIR A-band O2 slant column was fitted to the ACE-FTS air density by adjusting the time shift. In this process, a global scaling factor was introduced to link the two quantities, as it should be a constant. In practice, two scaling factors were required, one for sunset and the other for sunrise, which were empirically determined through ensemble comparisons of MAESTRO and ACE-FTS observations, typically of data from 2005–2006 when both action tables “A” and “B” are used. For the UV channel, the same time shift was used as the Visible-NIR, and the angle for the UV LOS relative to the Visible-NIR was determined from a test of occultation ss2873. In v3.13, this process was specified using four scaling factors for the corresponding scenarios (sunrise/sunset and the action tables “A”/“B”) which were applied only to the Visible-NIR O3 and aerosol data products. Unfortunately, none of the v3 retrieval algorithms produced satisfactory data products for all UV NO2, UV O3 and Visible-NIR O3 profiles simultaneously.
The current retrieval, version 4.5, assumes that the angle shift is, to the first order, equivalent to an additional time shift with opposite signs for sunset and sunrise, and reduces the number of parameters by fixing the angle shift to zero while using independent time shifts for the UV and Visible-NIR. The time shifts were determined by fitting the respective MAESTRO UV and Visible-NIR O3 columns to the ACE-FTS O3 columns.
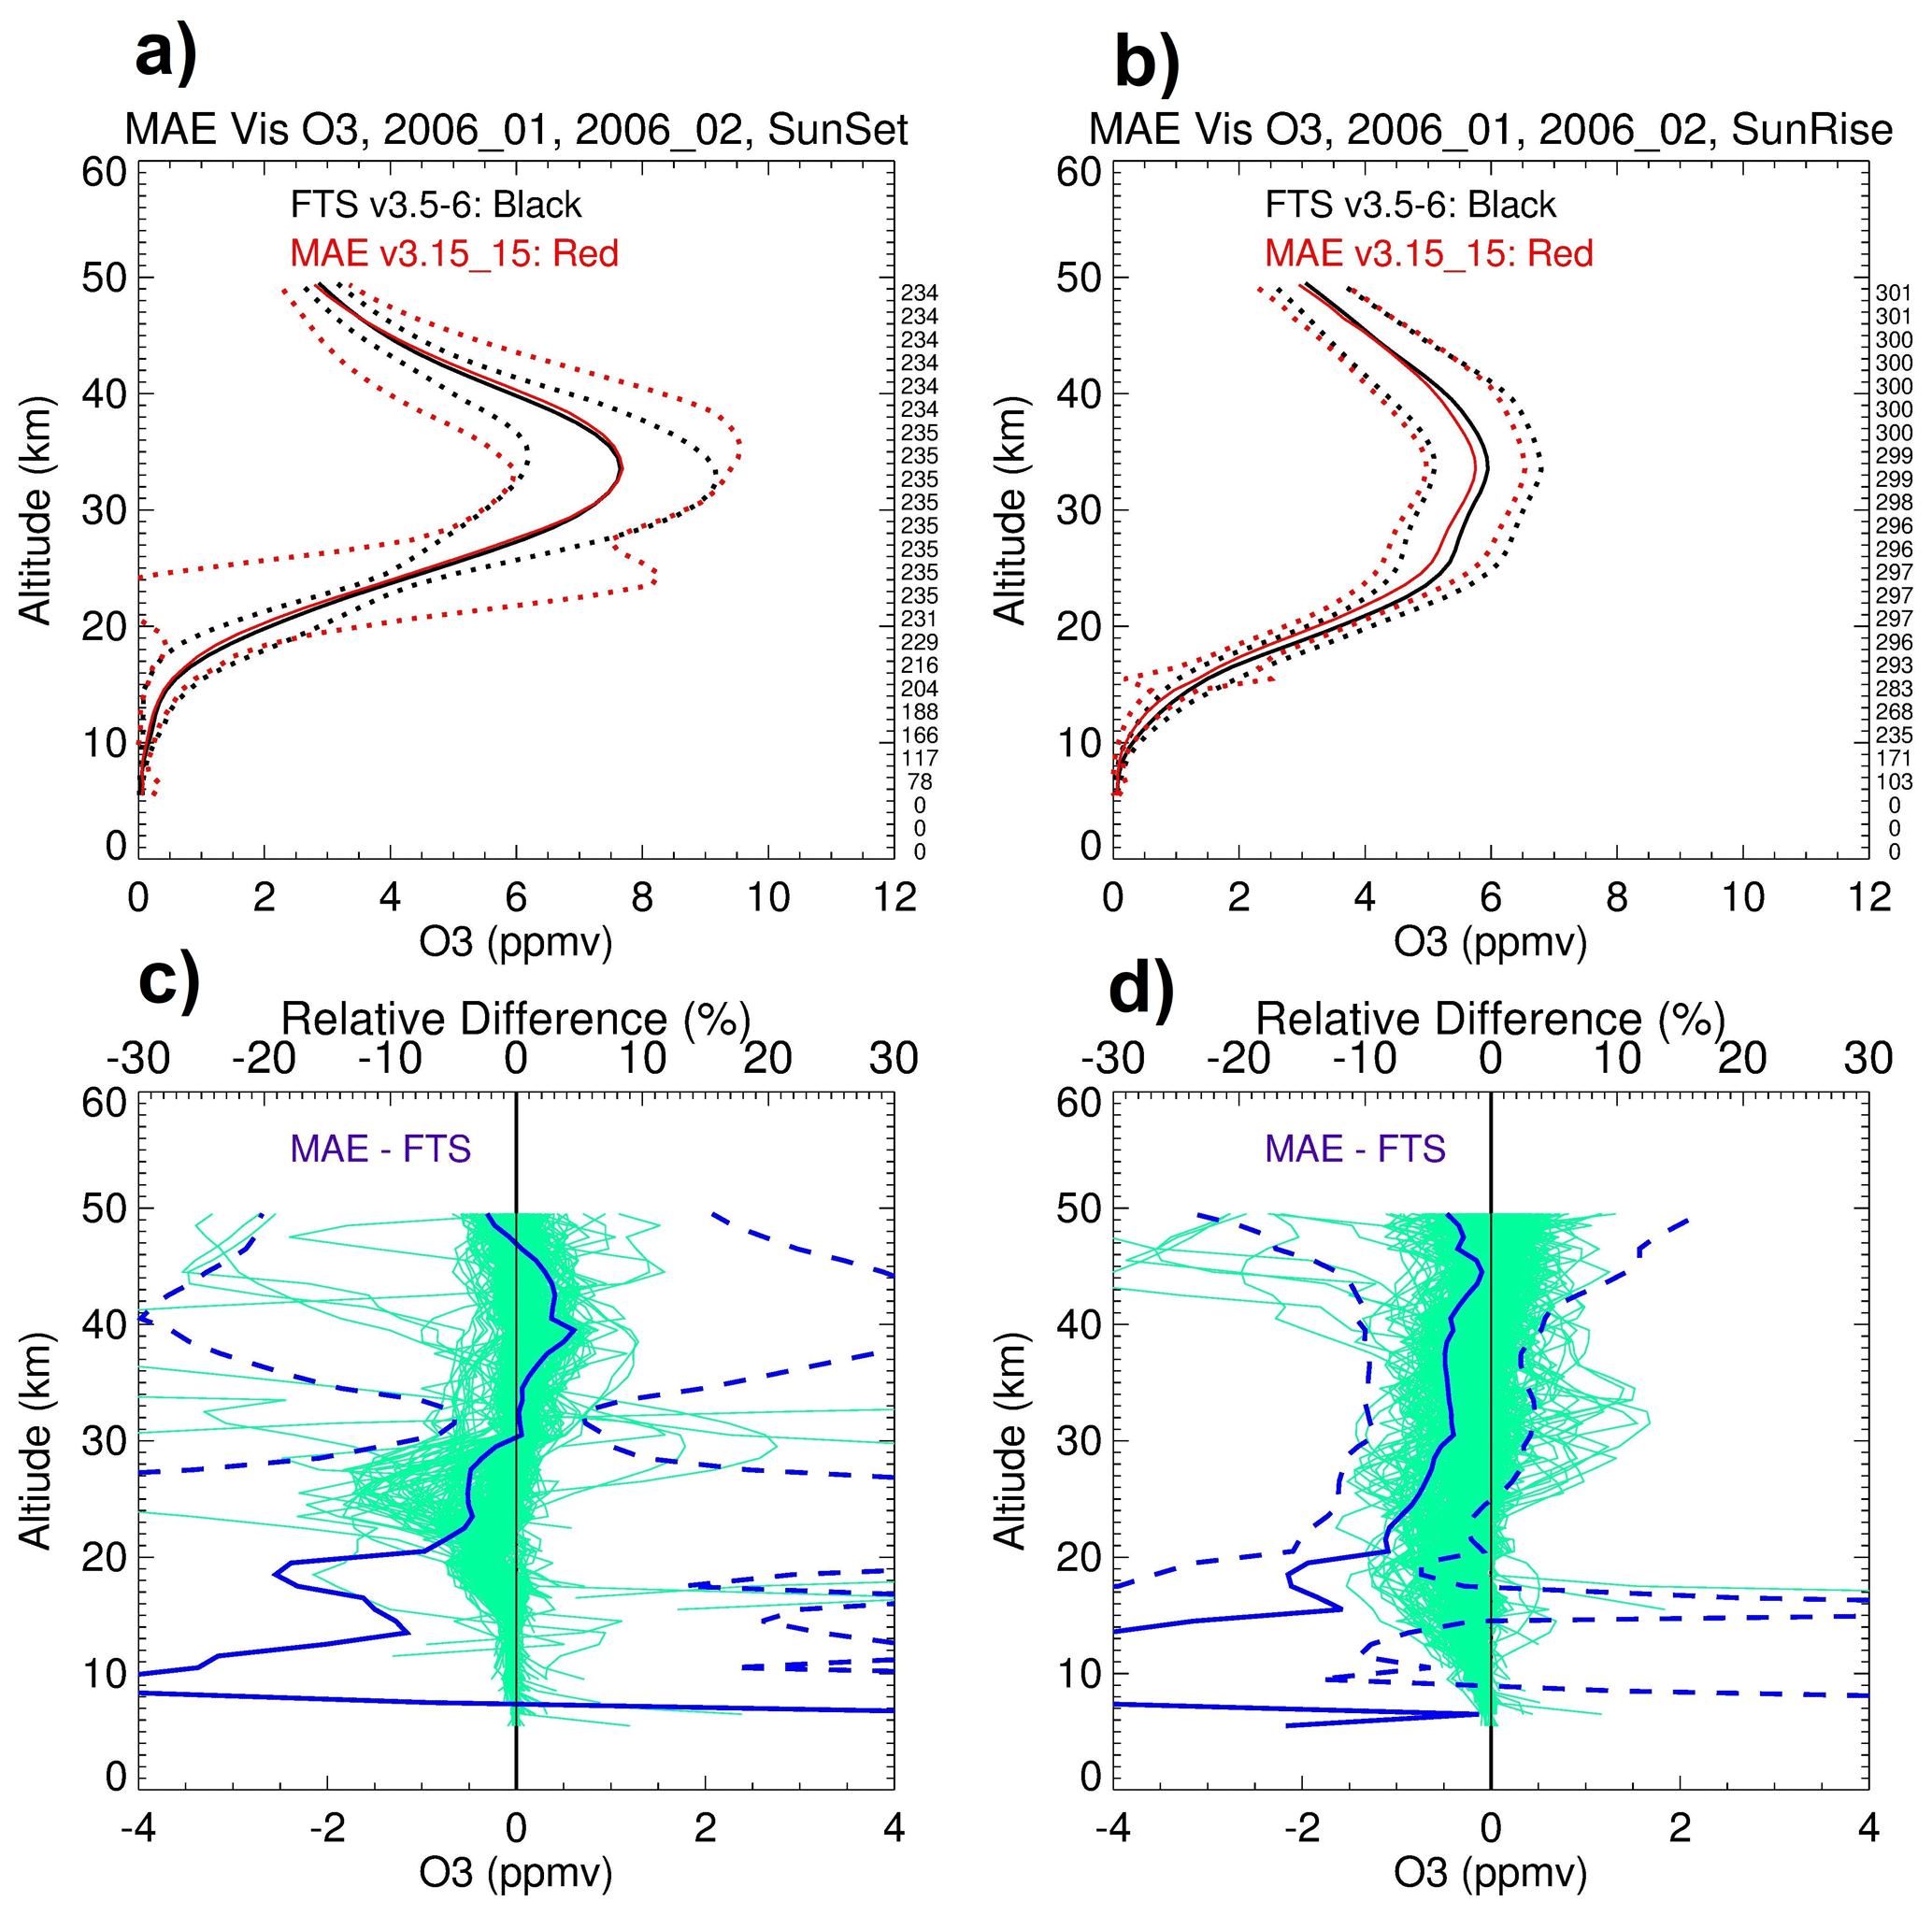
Figure 17The mean O3 profiles from MAESTRO (solid black) and ACE-FTS (solid red) averaged over January and February 2006, with a static time shift of −0.925 s, a fixed angle shift of −0.011° for both sunset (a) and sunrise (b) measurements along with their standard deviations (dotted black and dotted red lines). Absolute differences (MAESTRO – ACE-FTS, green lines; lower axes), the mean relative differences (solid blue; upper axes), and their standard deviations (dashed blue; upper axes) are shown for sunset (c) and for sunrise (d). The values along the right vertical axes in panels (a) and (b) show the number of data points compared at each altitude.
To illustrate this, a subset of data was processed using two approaches. First, the Visible-NIR data from January to February 2006 were processed with a fixed time shift of −0.925 s and an angle of −0.011° (close to 1 pixel on an image, Sect. 3.2) for both sunset and sunrise. Figure 17a (sunset) and b (sunrise) show the Visible-NIR O3 mean profiles and standard deviations alongside those from ACE-FTS. Figure 17c and d are the corresponding absolute and relative differences. There is good agreement between 22 and 50 km, with differences of < 5 % for both sunset and sunrise measurements.
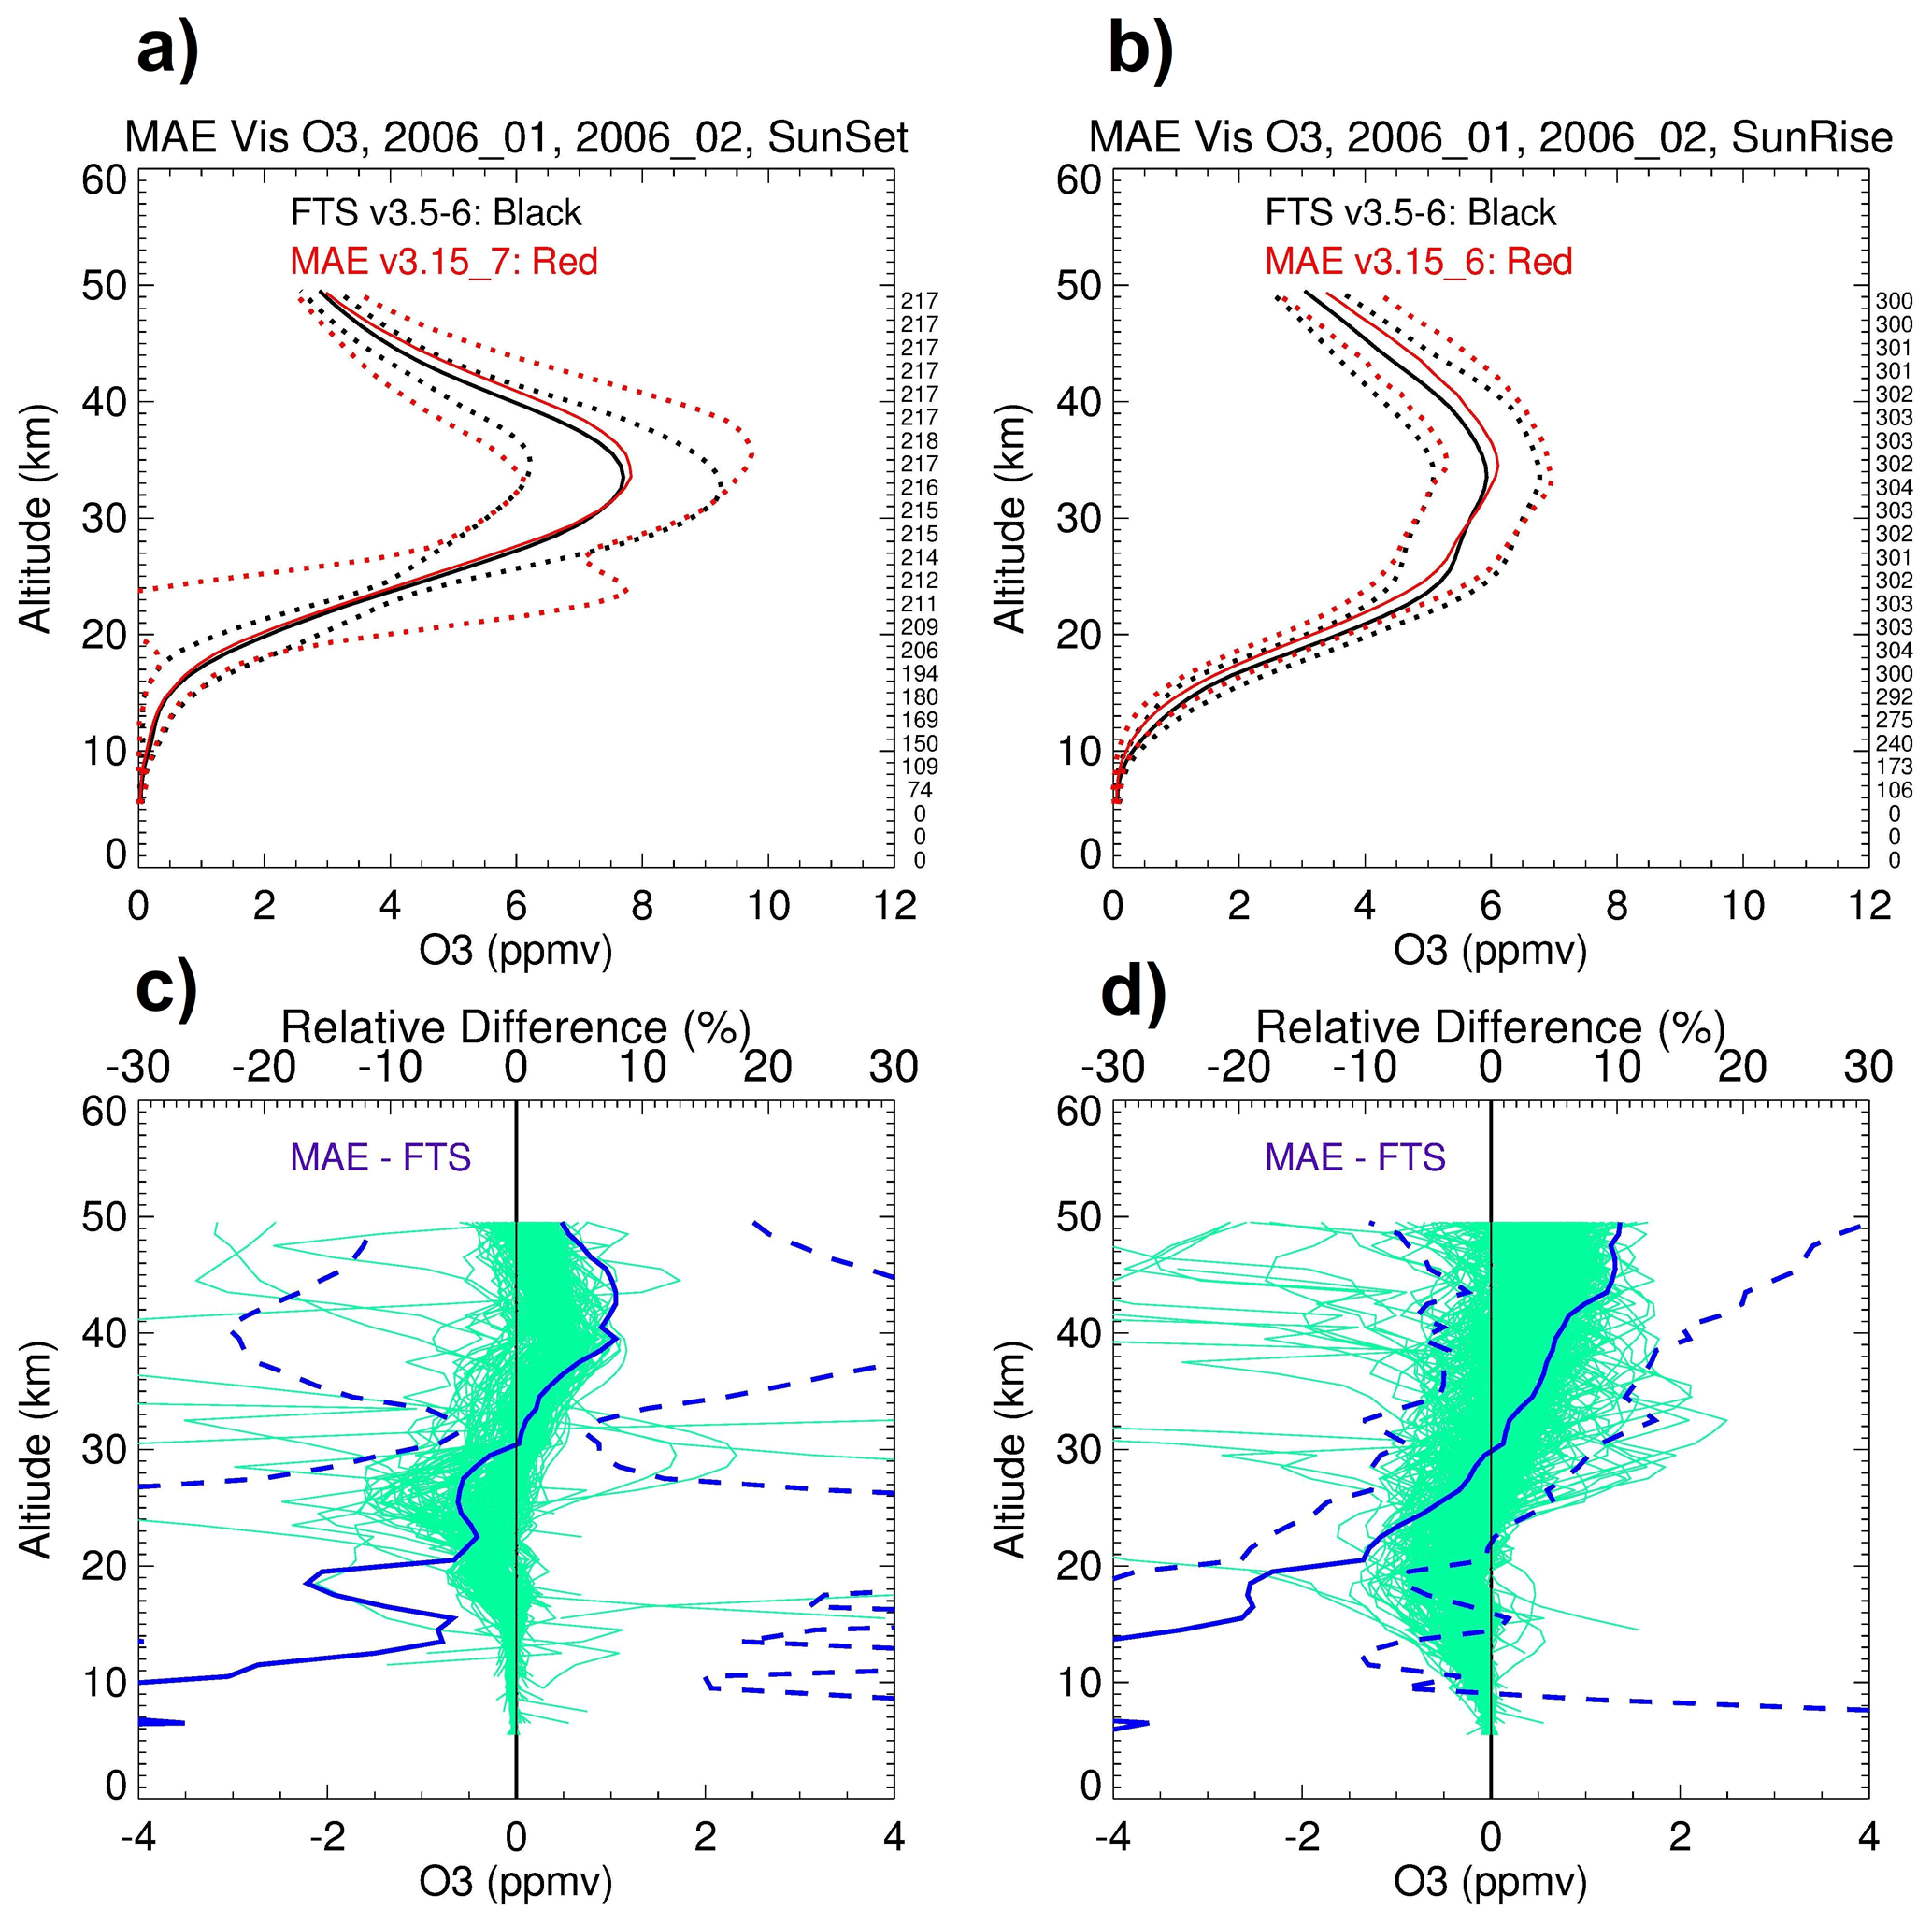
Figure 18Similar to Fig. 17, but with a static time shift of −1.325 s for sunset and −0.5 s for sunrise; the angle shifts are set to zero.
Then, the same subset of MAESTRO data was processed with a static time shift of −1.325 s for sunset and −0.5 s for sunrise and with all angle shifts set to zero. The results are shown in Fig. 18. For sunset, the difference profiles in Figs. 17c and 18c show similar structures, and for sunrise, Fig. 17d shows a variation of < 10 % and negative biases of between −8 % and −3 % between 20 and 50 km, while Fig. 18d shows variations of < 10 % and altitude-dependent biases from −10 % to 10 % between 20 and 50 km. Thus, simplification with a time shift of −0.913 − 0.412 s for sunset and −0.913 + 0.412 s for sunrise, with the angle shifted to zero gives results comparable to the more complex formulation. The tilt of profile differences (see Figs. 17c, d and 18c, d) may be attributed to the altitude-dependent underestimation of the MAESTRO transmittance and requires further investigations.
Retrievals for the UV spectrometer using v4.5 are similar, but independent from the Visible-NIR; fitting UV O3 to ACE-FTS O3 is used to derive the time shift for each occultation. Then the UV NO2 and O3 are retrieved simultaneously using that time shift.
The MAESTRO instrument aboard the Canadian SCISAT satellite has been operating for over 22 years. It has produced one of the longest satellite records of UV-Visible-NIR measurements, invaluable for understanding atmospheric constituents with high vertical resolution. This paper addresses some of the key challenges in MAESTRO's operation and provides insight into how these issues have been resolved, including:
-
The spectral intensities from the MAESTRO UV and Visible-NIR spectrometers have degraded over time. While intensity was degraded by 90 % at shorter wavelengths during the first two years of the mission, wavelengths longer than 600 nm remained above 50 % of their initial intensity. Therefore, O3 and aerosol measurements are available throughout the entire mission. Unexpectedly, a partial recovery of UV spectral signals began in 2022, with 10 %–40 % of the initial intensity recovered by 2025. Preliminary retrievals appear viable but require a comprehensive analysis before dissemination.
-
The current measurement scheme, set “B” of action tables, has not changed since August 2005 and effectively addresses the large dynamic range of incoming irradiances during an occultation.
-
An unexpectedly fortuitous event, the failure of the star tracker, has allowed us to verify that the changes of wavelength registration caused by temperature changes are correctly determined by using a spectral fitting to both the high sun and occultation spectra that employs Fraunhofer lines.
-
For MAESTRO retrievals to use the ACE-FTS pressure and temperature data, the variations between MAESTRO and ACE-FTS times, as well as an unknown set of angles between the MAESTRO and ACE-FTS LOSs, must be accounted for. This paper presents a solution that fits MAESTRO UV and Visible-NIR O3 profiles to ACE-FTS O3 profiles separately by adjusting two independent time shifts, one for each spectrometer, while setting the angle shifts to zero. The success of this approach is demonstrated here for low- and middle-stratosphere retrievals, as well as in Jeffery et al. (2025), who validated the MAESTRO v4.5 NO2 and O3 data.
-
An ongoing area of research is the MAESTRO retrieval at low altitudes, where refraction causes the Sun's image viewed by the ACE instruments to change shape, and consequently, the MAESTRO slits' position on the Sun to shift. We have utilized ACE Imager data, and the knowledge of the MAESTRO slit positions on the Imagers to demonstrate the issues. Further work on this will refine the retrievals for the lowest altitudes.
The MAESTRO instrument, together with the ACE-FTS, is expected to continue operations into the future.
The data used in this study include MAESTRO instrument telemetry data; Level 0 science data; Level 1 data (optical depth and spectra); earlier versions (e.g., v3.5/3.6) of ACE-FTS pressure and temperature data, as well as O3 and NO2 data; and ACE-Imager data acquired primarily during the sun-scan tests and for investigation of the star tracker failure. Most of these data are not publicly available but can be obtained from the authors upon request. The ACE-FTS v3.5/3.6 data are publicly available (https://doi.org/10.20383/102.0495, Bernath et al., 2021). The analysis codes are also available from the authors upon request.
JZ performed the analyses and wrote the manuscript. TM is the project Principal Investigator (PI) and helped edit the manuscript. JD oversees operations and data processing and helped edit and finalize the manuscript. KW managed the project and helped edit the manuscript. PJ helped edit the manuscript.
The contact author has declared that none of the authors has any competing interests.
Publisher's note: Copernicus Publications remains neutral with regard to jurisdictional claims made in the text, published maps, institutional affiliations, or any other geographical representation in this paper. The authors bear the ultimate responsibility for providing appropriate place names. Views expressed in the text are those of the authors and do not necessarily reflect the views of the publisher.
This study was funded by a contract from the Canadian Space Agency (CSA) as part of the Canadian-led Atmospheric Chemistry Experiment (ACE) mission supported by the CSA. The MAESTRO instrument operation has been supported by the CSA's Satellite Operations Centre and the ACE Science Operations Centre (SOC) at the University of Waterloo. The MAESTRO instrument was developed and built by Environment and Climate Change Canada (ECCC) and EMS Technologies.
We wish to acknowledge the significant contributions C. Thomas McElroy, who passed away on 27 February 2026 shortly before the publication of this work. He was the Principal Investigator of the MAESTRO instrument and the author of the major MAESTRO retrieval codes. His passing is a great loss, and he is deeply missed by colleagues and friends for his dedication and leadership of the MAESTRO project, as well as for his warm and humane personality.
This research has been supported by the Canadian Space Agency (contract no. 9F045-200582/001/SA).
This paper was edited by Zhao-Cheng Zeng and reviewed by Robert Damadeo and Emmanuel Dekemper.
Bernath, P., Boone, C., Steffen, J., and Crouse, J.: Atmospheric Chemistry Experiment SciSat Level 2 Processed Data, v3.5/v3.6, Federated Research Data Repository [data set], https://doi.org/10.20383/102.0495, 2021.
Bernath, P. F., McElroy, C. T., Abrams, M. C., Boone, C. D., Butler, M., Camy-Peyret, C., Carleer, M., Clerbaux, C., Coheur, P. F., Colin, R., DeCola, P., De Maziíere, M., Drummond, J. R., Dufour, D., Evans, W. F. J., Fast, H., Fussen, D., Gilbert, K., Jennings, D. E., Llewellyn, E. J., Lowe, R. P., Mahieu, E., McConnell, J. C., McHugh, M., McLeod, S. D., Michaud, R., Midwinter, C., Nassar, R., Nichitiu, F., Nowlan, C., Rinsland, C. P., Rochon, Y. J., Rowlands, N., Semeniuk, K., Simon, P., Skelton, R., Sloan, J. J., Soucy, M.-A., Strong, K., Tremblay, P., Turnbull, D., Walker, K. A., Walkty, I., Wardle, D. A., Wehrle, V., Zander, R., and Zou, J.: Atmospheric Chemistry Experiment (ACE): mission overview, Geophys. Res. Lett., 32, L15S01, https://doi.org/10.1029/2005GL022386, 2005.
Boone, C. D., Bernath, P. F., and Lecours, M.: Version 5 retrievals for ACE-FTS and ACE-imagers, J. Quant. Spectrosc. Radiat. Transfer, 310, 108749, https://doi.org/10.1016/j.jqsrt.2023.108749, 2023.
Burrows, J. P., Dehn, A., Deters, B., Himmelmann, S., Richter, A., Voigt, S., and Orphal, J.: Atmospheric remote-sensing reference data from GOME: Part 1. Temperature-dependent absorption cross-sections of NO2 in the 231–794 nm range, J. Quant. Spectrosc. Radiat. Transfer, 60, 1025–1031, https://doi.org/10.1016/S0022-4073(97)00197-0, 1998.
Burrows, J. P., Richter, A., Dehn, A., Deters, B., Himmelmann, S., Voigt, S., and Orphal, J.: Atmospheric remote-sensing reference data from GOME – 2. Temperature-dependent absorption cross sections of O3 in the 231–794 nm range, J. Quant. Spectrosc. Radiat. Transfer, 61, 509–517, https://doi.org/10.1016/S0022-4073(98)00037-5, 1999.
Chance, K. and Kurucz, R. L.: An improved high-resolution solar reference spectrum for Earth's atmosphere measurements in the ultraviolet, visible, and near infrared, J. Quant. Spectrosc. Radiat. Transfer, 111, 1289–1295, https://doi.org/10.1016/j.jqsrt.2010.01.036, 2010.
Dahl, H., Eliuk, W., Rumbold, G., and Shelly, R.: ACE – A Canadian Small Satellite Mission, Proceedings of the 13th AIAA/USU Conference on Small Satellites, 23–26 August 1999, Logan UT, SSC99-V-7, http://digitalcommons.usu.edu/cgi/viewcontent.cgi?article=2151&context=smallsat (last access: 9 March 2026), 1999.
Damadeo, R. P., Zawodny, J. M., Thomason, L. W., and Iyer, N.: SAGE version 7.0 algorithm: application to SAGE II, Atmos. Meas. Tech., 6, 3539–3561, https://doi.org/10.5194/amt-6-3539-2013, 2013.
EO Portal: SciSat-1/ACE (Science Satellite/Atmospheric Chemistry Experiment), https://www.eoportal.org/satellite-missions/scisat-1#spacecraft (last access: 6 July 2025), 2025.
Gilbert, K. L., Turnbull, D. N., Walker, K. A., Boone, C. D., McLeod, S. D., Butler, M., Skelton, R., Bernath, P. F., Chateauneuf, F., and Soucy, M.-A.: The onboard imagers for the Canadian ACE SCISAT-1 mission, J. Geophys. Res., 112, D12207, https://doi.org/10.1029/2006JD007714, 2007.
Jeffery, P. S., Drummond, J. R., McElroy, C. T., Walker, K. A., and Zou, J.: Validation of the version 4.5 MAESTRO ozone and NO2 measurements, Atmos. Meas. Tech., 18, 569–602, https://doi.org/10.5194/amt-18-569-2025, 2025.
Kar, J., McElroy, C. T., Drummond, J. R., Zou, J., Nichitiu, F., Walker, K. A., Randall, C. E., Nowlan, C. R., Dufour, D. G., Boone, C. D., Bernath, P. F., Trepte, C. R., Thomason, L. W., and McLinden, C.: Initial comparison of ozone and NO2 profiles from ACE-MAESTRO with balloon and satellite data, J. Geophys. Res., 112, D16301, https://doi.org/10.1029/2006JD008242, 2007.
Khanal, S., Toohey, M., Bourassa, A., McElroy, C. T., Sioris, C., and Walker, K. A.: Assessment of ACE-MAESTRO v3.13 multi-wavelength stratospheric aerosol extinction measurements, Atmos. Meas. Tech., 18, 6835–6852, https://doi.org/10.5194/amt-18-6835-2025, 2025.
McCormick, M. P., Zawodny, J. M., Veiga, R. E., Larsen, J. C., and Wang, P. H.: An overview of SAGE I and II ozone measurements, Planetary Space Sci., 37, 1567–1586, https://doi.org/10.1016/0032-0633(89)90146-3, 1989.
McCormick, M. P., Lei, L., Hill, M. T., Anderson, J., Querel, R., and Steinbrecht, W.: Early results and validation of SAGE III-ISS ozone profile measurements from onboard the International Space Station, Atmos. Meas. Tech., 13, 1287–1297, https://doi.org/10.5194/amt-13-1287-2020, 2020.
McElroy, C. T., Nowlan, C., Drummond, J. R., Bernath, P. F., Barton, D., Dufour, D., Midwinter, C., Hall, R., Ogyu, A., Ullberg, A., Wardle, D., Kar, J., Zou, J., Nichitiu, F., Boone, C., Walker, K., and Rowlands, N.: The ACE-MAESTRO instrument on SCISAT: description, performance, and preliminary results, Appl. Opt., 46, 4341–4356, https://doi.org/10.1364/AO.46.004341, 2007.
Nowlan, C. R., McElroy, C. T., and Drummond, J. R.: Measurements of the O2 A- and B-bands for determining temperature and pressure profiles from ACE–MAESTRO: Forward model and retrieval algorithm, J. Quant. Spectrosc. Radiat. Transfer, 108, 371–388, https://doi.org/10.1016/j.jqsrt.2007.06.006, 2007.
Robert, C. É., Bingen, C., Vanhellemont, F., Mateshvili, N., Dekemper, E., Tétard, C., Fussen, D., Bourassa, A., and Zehner, C.: AerGOM, an improved algorithm for stratospheric aerosol extinction retrieval from GOMOS observations – Part 2: Intercomparisons, Atmos. Meas. Tech., 9, 4701–4718, https://doi.org/10.5194/amt-9-4701-2016, 2016.
Sioris, C. E., Boone, C. D., Bernath, P. F., Zou, J., McElroy, C. T., and McLinden, C. A.: Atmospheric Chemistry Experiment (ACE) observations of aerosol in the upper troposphere and lower stratosphere from the Kasatochi volcanic eruption, J. Geophys. Res., 115, D00L14, https://doi.org/10.1029/2009JD013469, 2010a.
Sioris, C. E., Zou, J., McElroy, C. T., McLinden, C. A., and Vömel, H.: High vertical resolution water vapour profiles in the upper troposphere and lower stratosphere retrieved from MAESTRO solar occultation spectra, Adv. Space Res., 46, 642–650, https://doi.org/10.1016/j.asr.2010.04.040, 2010b.
Sioris, C. E., Zou, J., McElroy, C. T., Boone, C. D., Sheese, P. E., and Bernath, P. F.: Water vapour variability in the high-latitude upper troposphere – Part 2: Impact of volcanic eruptions, Atmos. Chem. Phys., 16, 2207–2219, https://doi.org/10.5194/acp-16-2207-2016, 2016.
Walker, K. A., Zou, J., Nichitiu, F., Gilbert, K. L., Turnbull, D., McElroy, C. T., Evans, W. F. J., Ferguson, C., Puckrin E., Boone, C., McLeod, S. D., Butler, M., Midwinter, C., Drummond, J. R., and Bernath, P. F.: Science Commissioning of the Atmospheric Chemistry Experiment (ACE), Earth Observing Systems IX, edited by: Barnes, W. L. and Butler, J. J., Proc. SPIE 5542, SPIE, Bellingham, WA, https://doi.org/10.1117/12.559941, 2004.
Wang, H.-J., Cunnold, D. M., Trepte, C., Thomason, L. W., and Zawodny, J. M.: SAGE III solar ozone measurements: Initial results, Geophys. Res. Lett., 33, L03805, https://doi.org/10.1029/2005GL025099, 2006.