the Creative Commons Attribution 4.0 License.
the Creative Commons Attribution 4.0 License.
 | 09 Apr 2026
First results of SO2 columns from FY-3F/OMS instrument observations
Huanhuan Yan
Andreas Richter
Xingying Zhang
Anja Schönhardt
Thomas Visarius
Qian Wang
Lu Zhang
Yichen Li
Weihe Wang
Atmospheric SO2 has a significant impact on the urban environment and on global climate. Remote sensing provides an unprecedented tool for the continuous and real-time monitoring of atmospheric SO2 from volcanic eruptions and anthropogenic emissions. The Ozone Monitoring Suite (OMS) onboard the Chinese FENGYUN-3F (FY-3F) satellite launched in August 2023 is a new hyperspectral UV-VIS instrument in the FY-3 family of satellites, aiming to obtain information about atmospheric trace gases. In this study, we use the OMS Nadir (OMS-N) top-of-atmosphere (TOA) measurements and Differential Optical Absorption Spectroscopy (DOAS) inversion to for the first time retrieve global SO2 columns from these measurements. Based on the characteristics of the OMS instrument and the performance of its L1 data, specific schemes including solar spectrum selection, spectral soft calibration, and background offset correction were developed to effectively reduce along-track stripes and across-track asymmetry found in the raw OMS SO2 retrievals. The accuracy of FY-3F/OMS SO2 retrievals was evaluated by comparing them with the DOAS and COvariance-Based Retrieval Algorithm (COBRA) SO2 products from the TROPOspheric Monitoring Instrument (TROPOMI) onboard Copernicus Sentinel-5 Precursor (Sentinel-5P) over three typical areas: clean oceanic regions, volcanic eruption regions, and anthropogenic emission regions. The results indicate that the OMS SO2 retrievals exhibit good stability over clean oceanic regions (with a precision of approximately 0.15 DU), successfully capture volcanic SO2 plumes, and effectively detect the elevated SO2 columns from anthropogenic emissions in regions such as the Middle East, Eastern India, and Northern Russia. Detector non-uniformity and Air mass factor (AMF) uncertainty remains the primary error source of this first version of OMS SO2 retrievals. This study is the first to present SO2 retrievals from FY-3F/OMS observations, which is crucial for a comprehensive understanding of OMS's capability in SO2 retrievals.
- Article
(14067 KB) - Full-text XML
- BibTeX
- EndNote


Sulfur dioxide (SO2) is a short-lived trace gas in the atmosphere that affects regional air quality and global climate change. SO2 is primarily released by anthropogenic activities (e.g., smelting of sulfur ore, combustion of coal, the oil and gas industry, emissions of motor vehicles) and natural phenomena (e.g., volcanic and biological processes) (Finlayson-Pitts and Pitts, 1999; Cullis and Hirschler, 1980; Seinfeld and Pandis, 2016). SO2 injection from a volcanic eruption can reach up to the upper troposphere/lower stratosphere, not only affecting global climate but also posing a threat to aviation, along with volcanic ash. Through reaction with hydroxyl radicals (OH) and water, atmospheric SO2 can be rapidly converted into sulfate aerosols. These aerosols both scatter and absorb solar and terrestrial radiation, affecting the radiation balance of the atmosphere (cooling or warming effect) (Twomey, 1977). Sulfate particles formed from anthropogenic SO2 emissions not only influence atmospheric visibility in the boundary layer but also contribute to acid rain which in turn damages ecosystems.
Low-Earth-orbit (LEO) satellite remote sensing offers the advantages of near global coverage, short-term periodic observation capabilities, and continuous spatial coverage. Due to the strong absorption characteristics of SO2 in the ultraviolet (UV) spectrum, especially in the 300–400 nm wavelength range, atmospheric SO2 information can be obtained from the reflected TOA radiance spectrum. Since the first UV-based satellite observation of large amounts of SO2 from the El Chichón volcanic eruption in 1982 by TOMS (Krueger, 1983), hyperspectral UV satellite instruments have been used to quantitatively monitor the spatial and temporal distribution of SO2 and its dispersion following volcanic eruptions. This compensates for the limitations of ground-based measurements, such as the high cost of dense in-situ observation networks and instrument maintenance (Krueger, 1983; Carn et al., 2005, 2007, 2009).
With the launch of a series of hyperspectral UV detection instruments, including the Global Ozone Monitoring Experiment (GOME) (Burrows et al., 1999; Khokhar et al., 2005; Eisinger and Burrows, 1998), the Scanning Imaging Absorption Spectrometer for Atmospheric Cartography (SCIAMACHY) (Gottwald and Bovensmann, 2010; Richter et al., 2006), the Ozone Monitoring Instrument (OMI) (Levelt et al., 2006), the Global Ozone Monitoring Experiment-2 (GOME-2) (Heue et al., 2010; Munro et al., 2006; Richter, 2009), the Ozone Mapping and Profiler Suite (OMPS) (Yang et al., 2013; Flynn et al., 2006), TROPOMI (Theys et al., 2019; Voors et al., 2017; Veefkind et al., 2012), and the Environmental Trace Gas Monitoring Instrument (EMI) (Chen et al., 2021; Zhao et al., 2020; Yan et al., 2021), satellite detection has been widely applied to monitor global SO2 variations and to support research on climate change, atmospheric chemistry, and the atmospheric environment.
FY-3F/OMS is a newly launched Chinese UV-VIS hyperspectral sensor that provides global observations with 7 km × 7 km spatial resolution at nadir and a morning overpass time. For a thorough understanding of the OMS SO2 product, this study presents OMS SO2 retrievals by using the OMS measurements and DOAS inversion, and compares them with TROPOMI DOAS and TROPOMI COBRA SO2 products over clean oceanic regions, volcanic eruption regions, and anthropogenic emission regions. This paper is organized as follows. Section 2 gives a brief introduction to the FY-3F/OMS instrument. Section 3 describes the detailed procedures used to retrieve the SO2 columns from FY-3F/OMS observations, including solar spectrum selection, spectral soft calibration, SO2 slant column density (SCD) retrieval, background offset correction, and the approach for AMF calculation used. Section 4 provides the OMS SO2 column results, followed by comparisons with the TROPOMI DOAS and TROPOMI COBRA SO2 products. Section 5 discusses error sources of OMS SO2 retrievals, including the instrument-related errors and DOAS SCD spectral fitting errors in OMS SO2 SCD retrievals, errors introduced by the AMF approach taken, and the residual errors after background offset correction. The last section summarizes the main results and offers conclusions, along with suggestions for future improvements.
The FY-3F satellite, the 21st in China's FengYun series, was successfully launched on 3 August 2023. It operates in a sun-synchronous orbit at an altitude of 836 km, with a descending node equatorial overpass time of 10:00 am LT. Equipped with 10 advanced atmospheric instruments, FY-3F is designed to provide high-quality data for weather forecasting, climate monitoring, and environmental research, contributing significantly to global meteorological and environmental observations.
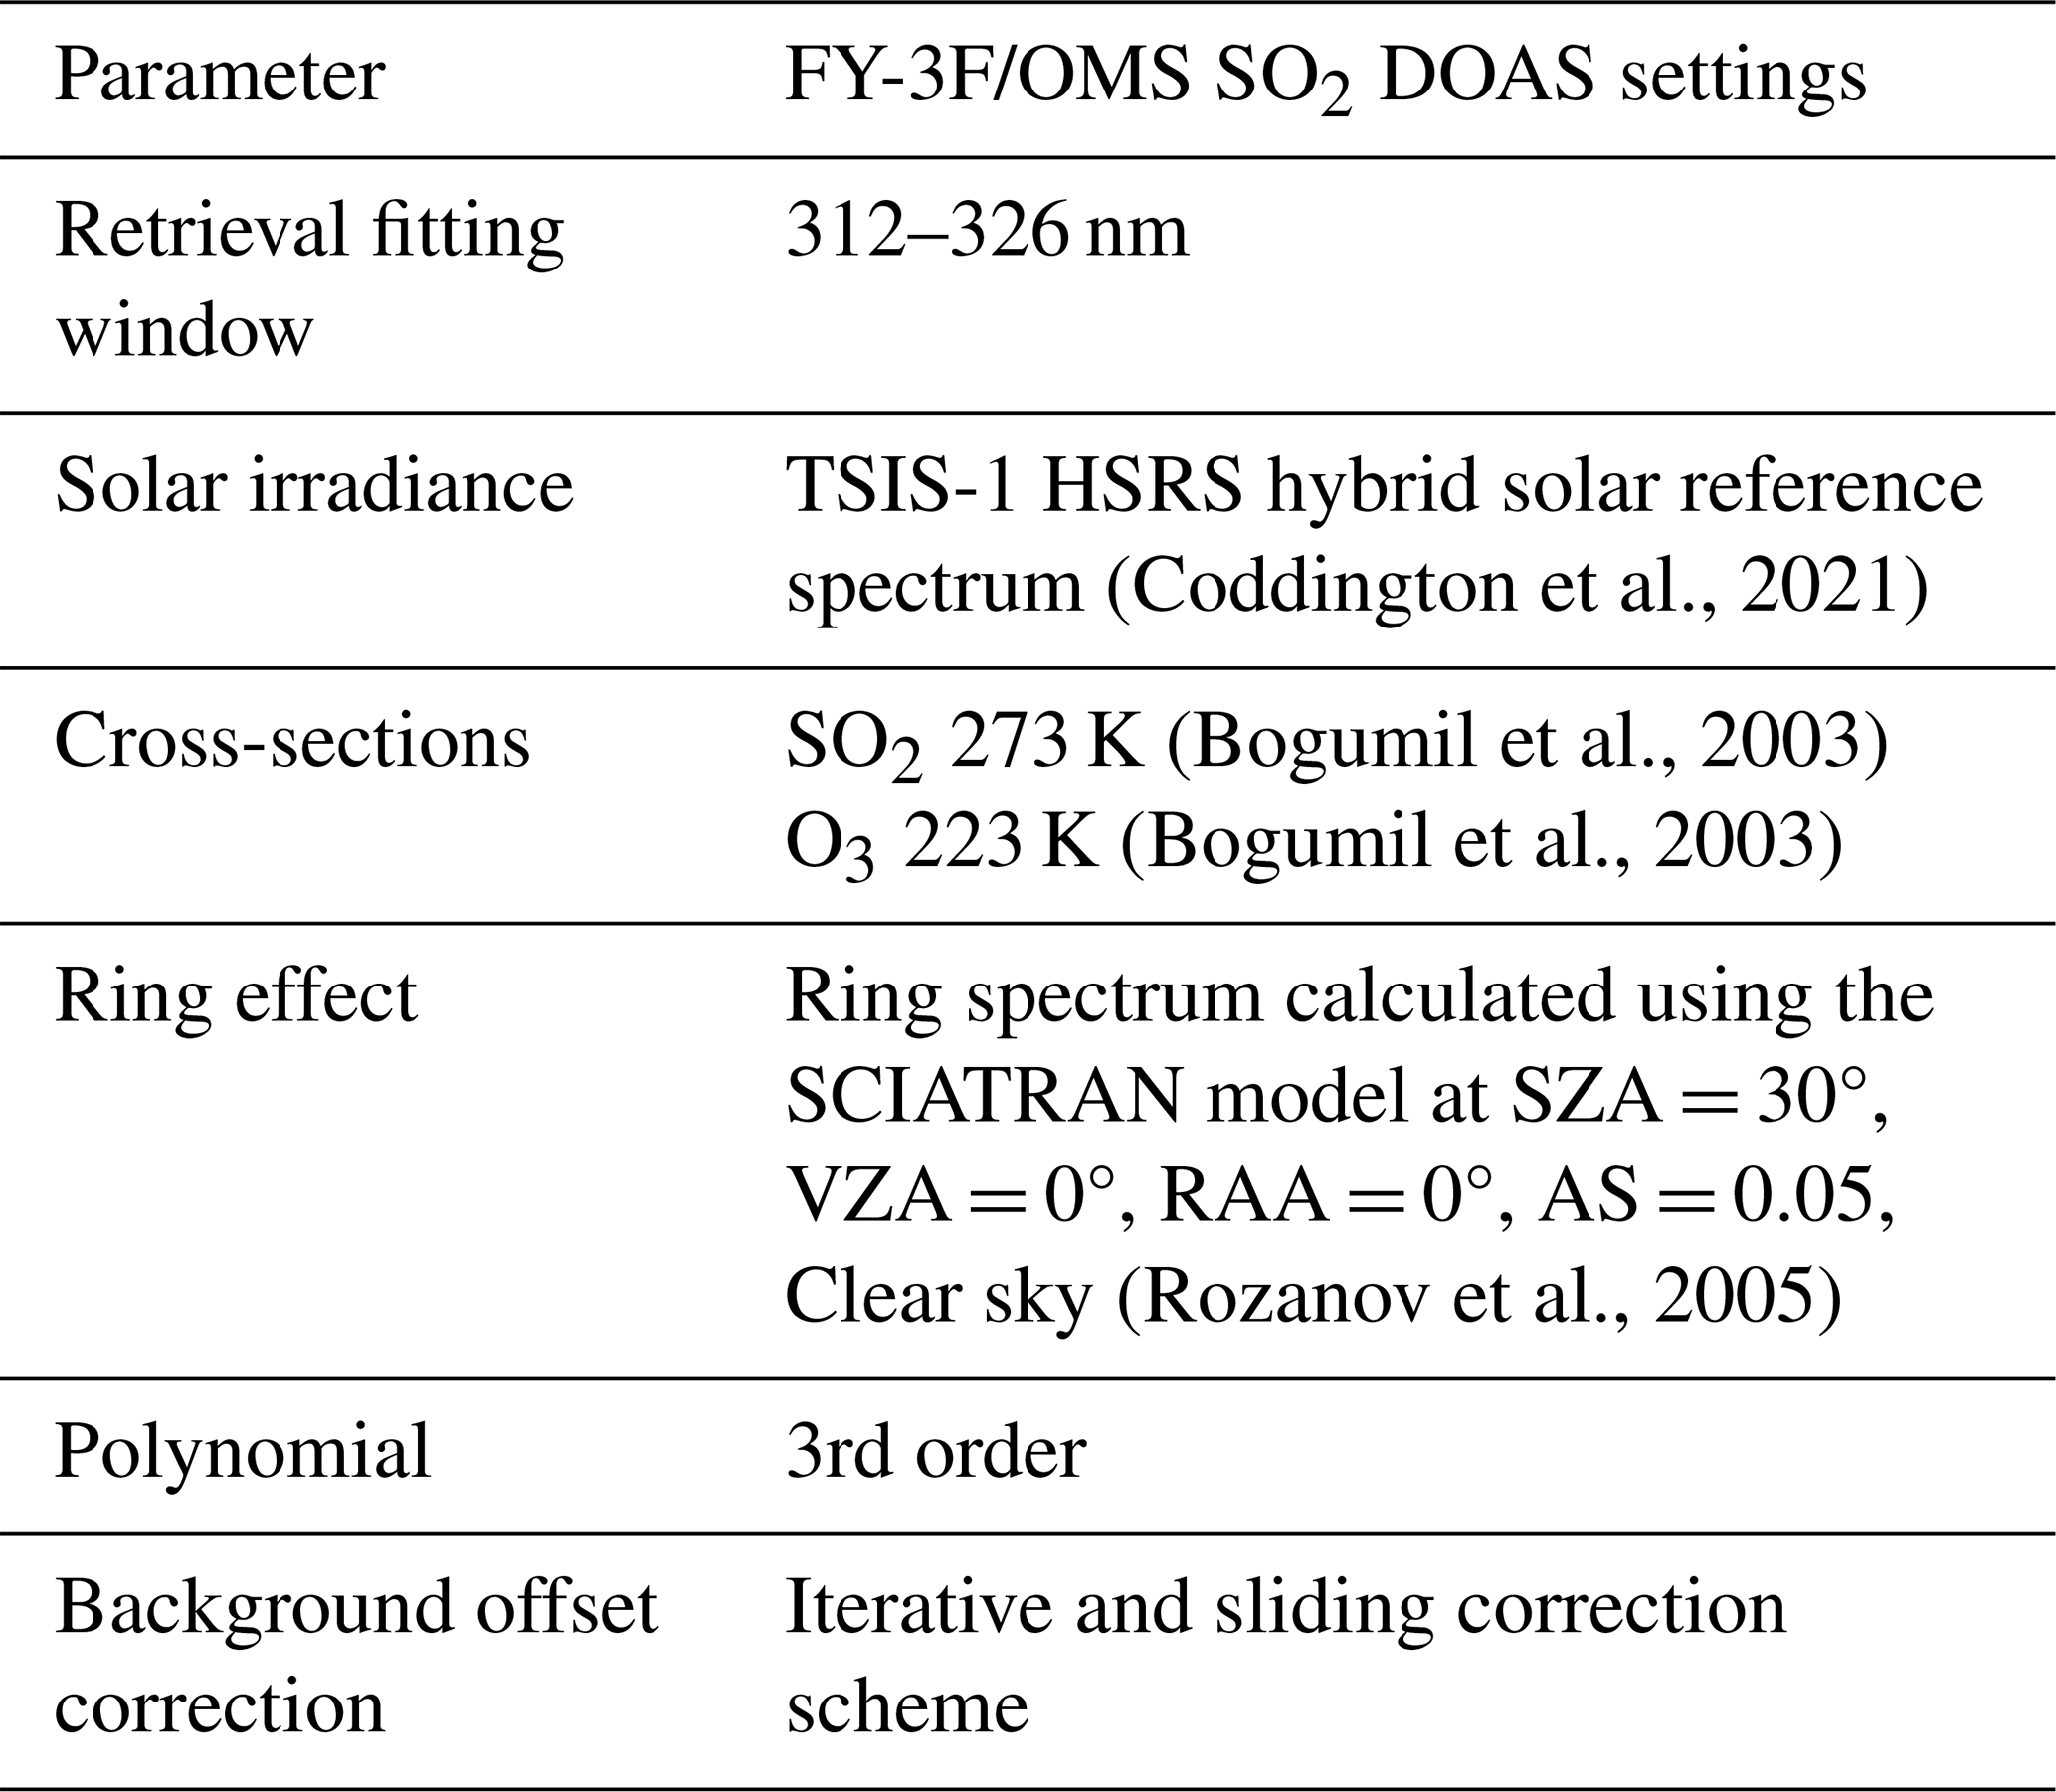
Table 1The main characteristics of the FY-3F/OMS-N instrument.
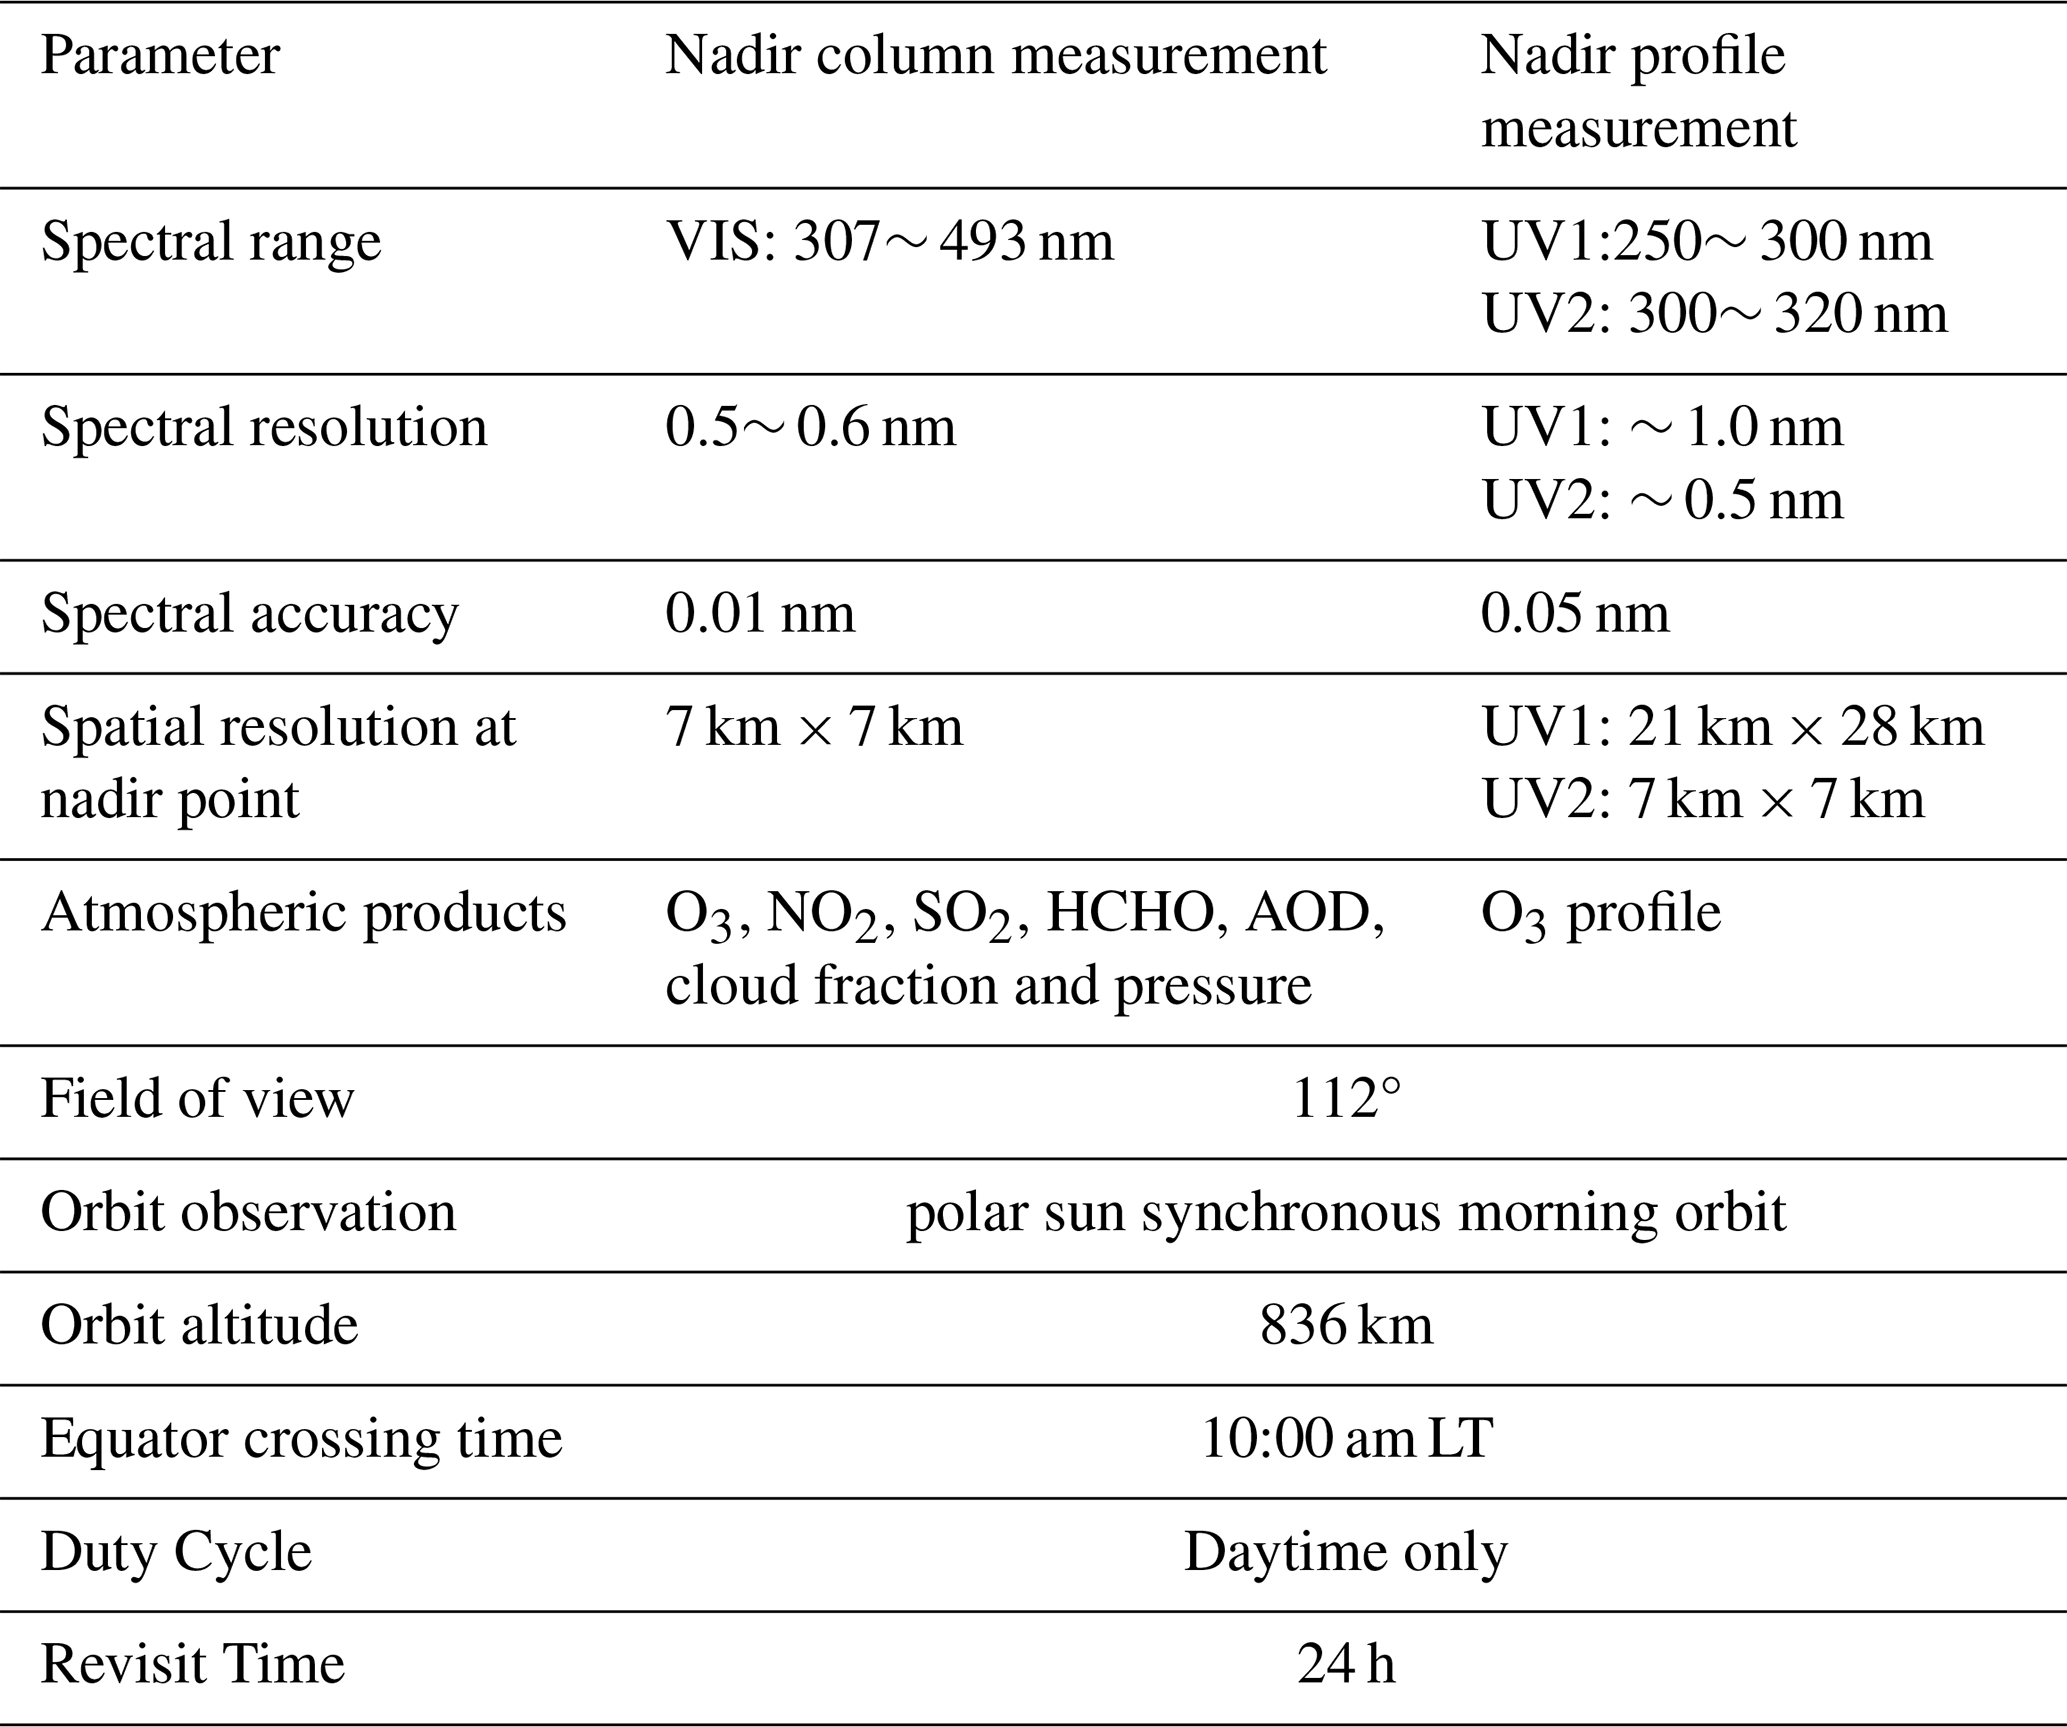
The Ozone Monitoring Suite (OMS) onboard FY-3F satellite is a new instrument in the FY-3 family of satellites. It has two observation modes: Nadir (OMS-N) and Limb (OMS-L) (Wang et al., 2024). While OMS-L provides information on the vertical distribution of O3, OMS-N is mainly used to obtain column information on trace gases such as O3, NO2, SO2, and HCHO, and aerosols, as well as vertical profiles of O3. OMS-N operates using a push-broom observation technique to obtain daily global measurements, with a wide Field of View (FOV) of 112°. It incorporates two imaging grating spectrometers covering the UV (250–320 nm) and VIS (307–493 nm) bands, where the UV measurements are divided into the UV1 (250–300 nm) and UV2 (300–320 nm) sub-bands. Each spectrometer uses a 1024 × 1024 pixel imaging array, with one dimension recording spatial information along the slit and the other recording spectral information. To enhance the signal-to-noise ratio (SNR) of the original detector rows, OMS L1 applied an onboard spatial binning strategy: sets of 16 pixels were averaged to yield 58 cross-track spatial rows in the UV1 band, and 4 pixels were averaged to produce 238 cross-track spatial rows in the UV2 and VIS bands, respectively (Wang et al., 2024). The remaining spatial rows were reserved for calibration purposes. The OMS-N VIS band (307–493 nm) was used for the retrieval of OMS SO2 columns in this study. It has a high spatial resolution of 7 km × 7 km at the nadir point, with a spectral resolution of 0.5–0.6 nm (Table 1). FY-3F/OMS data can be downloaded from the website http://data.nsmc.org.cn/DataPortal/en/home/index.html (last access: 10 March 2026).
The SO2 retrieval from FY-3F/OMS involves radiance normalization, spectral soft calibration, convolution of SO2 and O3 cross-sections and Ring spectrum with the OMS-N Instrument Spectral Response Function (ISRF), DOAS fitting to obtain SO2 SCD, AMF conversion to vertical column density (VCD), and background offset correction to reduce striping and across-track asymmetries. It should be noted that, due to the current unavailability of synchronized and reliable OMS cloud and aerosol products, the effects of clouds and aerosol on SO2 retrievals were not considered in this study. For the OMS SO2 product, it is recommended to use retrieval results with a solar zenith angle smaller than 70°, near-nadir and cloud-free pixels.
3.1 Solar irradiance
Using the satellite measured solar irradiance for the DOAS SO2 retrieval can effectively reduce instrument-related errors. However, due to the degradation and non-uniformity of the diffuser plate of OMS, the OMS L1 irradiance measurements experienced increasing errors after launch, especially in the shortwave UV region. For example, after one year on orbit, the intensity of OMS irradiance at the shorter wavelength of 317 nm has decreased by about 8.83 %, while at the longer wavelength of 331 nm, it has decreased by about 6.07 %. Therefore, in this study the Total and Spectral Solar Irradiance Sensor-1 (TSIS-1) Hybrid Solar Reference Spectrum (HSRS) hybrid solar reference spectrum (Coddington et al., 2021) was used for OMS SO2 retrievals instead of OMS daily measured solar irradiance. The TSIS-1 HSRS hybrid solar reference spectrum was developed by normalizing high spectral resolution solar datasets to the absolute irradiance scale of the TSIS-1 Spectral Irradiance Monitor (SIM) and the CubeSat Compact SIM (CSIM). The high spectral resolution solar data are sourced from the Air Force Geophysical Laboratory (AFGL) ultraviolet solar irradiance balloon observations, the ground-based Quality Assurance of Spectral Ultraviolet Measurements in Europe Fourier Transform Spectrometer (QASUMEFTS) solar irradiance observations, the Kitt Peak National Observatory (KPNO) solar transmittance atlas, and the semi-empirical Solar Pseudo Transmittance Spectrum (SPTS) atlas. The TSIS-1 HSRS spans 202–2730 nm at 0.01 to ∼ 0.001 nm spectral resolution with uncertainties of 0.3 % between 460 and 2365 nm and 1.3 % at wavelengths outside that range (Coddington et al., 2021). The TSIS-1 HSRS hybrid solar reference spectrum was convolved with the OMS-N ISRF to match the spectral characteristics of OMS radiance.
3.2 Spectral soft calibration
Before the DOAS fitting retrieval, spectral soft calibration was applied to the FY-3F/OMS radiance data. This procedure corrects wavelength shifts caused by instrument drift, temperature fluctuations, radiation effects, and nonlinearities by using known absorption features. It ensures the spectral accuracy and consistency of the OMS radiances, which is essential for accurate SO2 retrieval and for reducing the impact of calibration-related errors.
The spectral soft calibration is performed using the peaks and valleys of the TSIS-1 HSRS hybrid solar reference spectrum (van Geffen and van Oss, 2003; Coddington et al., 2021). The detailed process includes: (1) selecting the high-resolution hybrid solar reference spectrum (Coddington et al., 2021), and convolving the reference spectrum with the slit function of the FY-3F/OMS instrument; (2) fitting the ratio of the solar reference spectrum to the observed radiance spectrum with a low-order polynomial to enhance the observed radiance spectrum; (3) for each observed radiance spectrum in the SO2 fitting window, Gaussian peak-finding is performed to match the peak position of a set of Fraunhofer lines with their corresponding wavelengths. A least-squares method is used to fit the spectral line wavelengths and the peak position number data with a third-order polynomial, generating a spectral calibration equation for each observed pixel. Then the spectral soft calibration of the FY-3F/OMS radiance is realized by using the above spectral calibration equation.
3.3 DOAS SCD retrieval
3.3.1 SO2 fitting window
The selection of the retrieval fitting window is crucial for the accuracy of OMS SO2 retrievals, which significantly affect OMS capability in monitoring SO2 from volcanic and anthropogenic sources. A suitable fitting window helps to reduce the impact of interfering gases (O3), to enhance the SO2 information content in the satellite signal and to obtain reliable SO2 results. In this study, the 312–326 nm fitting window was selected for the OMS SO2 retrievals based on the following considerations.
-
Shorter wavelengths, despite stronger SO2 absorption (Fig. 1), suffer from lower SNR and TOA radiance saturation over volcanic plumes, while longer wavelengths introduce more noise due to weaker absorption and O3 interference, especially under low anthropogenic emissions.
-
The selected fitting window (312–326 nm) is consistent with the widely used TROPOMI SO2 product (Theys et al., 2017), facilitating intercomparison and validation of the OMS SO2 retrievals. For the first results of OMS SO2 results in this study, we did not adopt multiple fitting windows for different SO2 concentration conditions as implemented in the TROPOMI product.
-
Comparisons of SO2 retrievals from different fitting windows commonly used in published studies – 312–326 nm (Theys et al., 2017), 310.5–326 nm (Theys et al., 2021), 310.5–340 nm (Li et al., 2013), 308–333 nm (Yang et al., 2009, 2013), and 312–330 nm (Nowlan et al., 2011) – over the Sundhnúkur volcano and the surrounding clean region on 23 August 2024 (Fig. 2) show that the 312–326 nm window has higher SO2 values within the volcanic plume and lower standard deviations and mean values in the clean region (cross-track positions 1–150). These results demonstrate the suitability of the 312–326 nm fitting window for OMS SO2 retrievals. The discrete wavelengths (310.8, 311.9, 313.2, and 314.4 nm) used in the Band Residual Difference (BRD) algorithm (Krotkov et al., 2006) were not considered in this study because the OMS SO2 retrieval is based on DOAS algorithm that employs a hyperspectral UV fitting window. The 300–335 nm fitting window employed in the EISF algorithm (Yang et al., 2010) was also not considered in this study because the OMS VIS band starts at 307 nm, and the OMS UV2 spectral range (300–320 nm) requires further calibration.
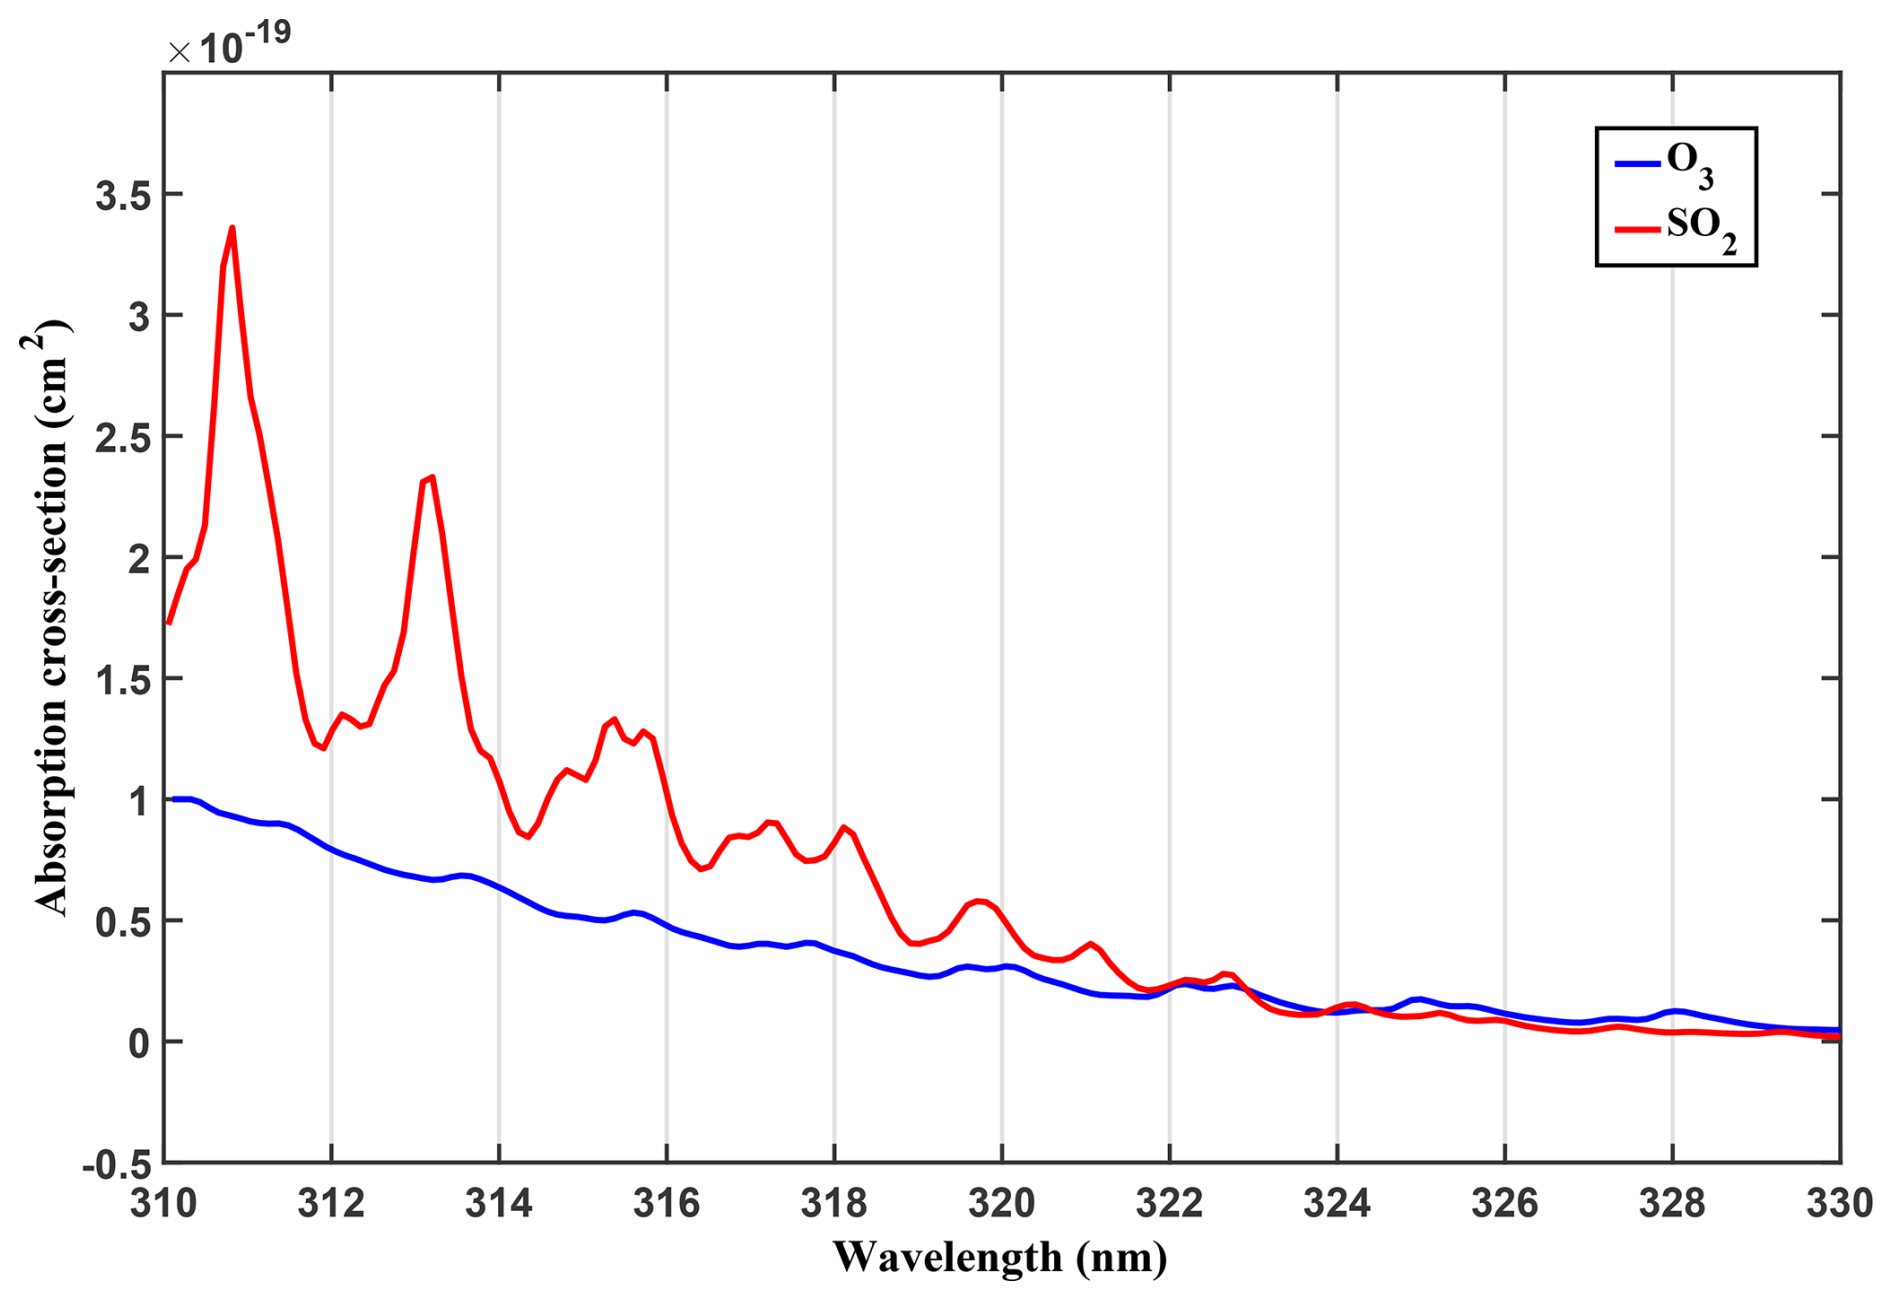
Figure 1Absorption cross sections of SO2 and O3 in the wavelength range 310–330 nm (Bogumil et al., 2003).
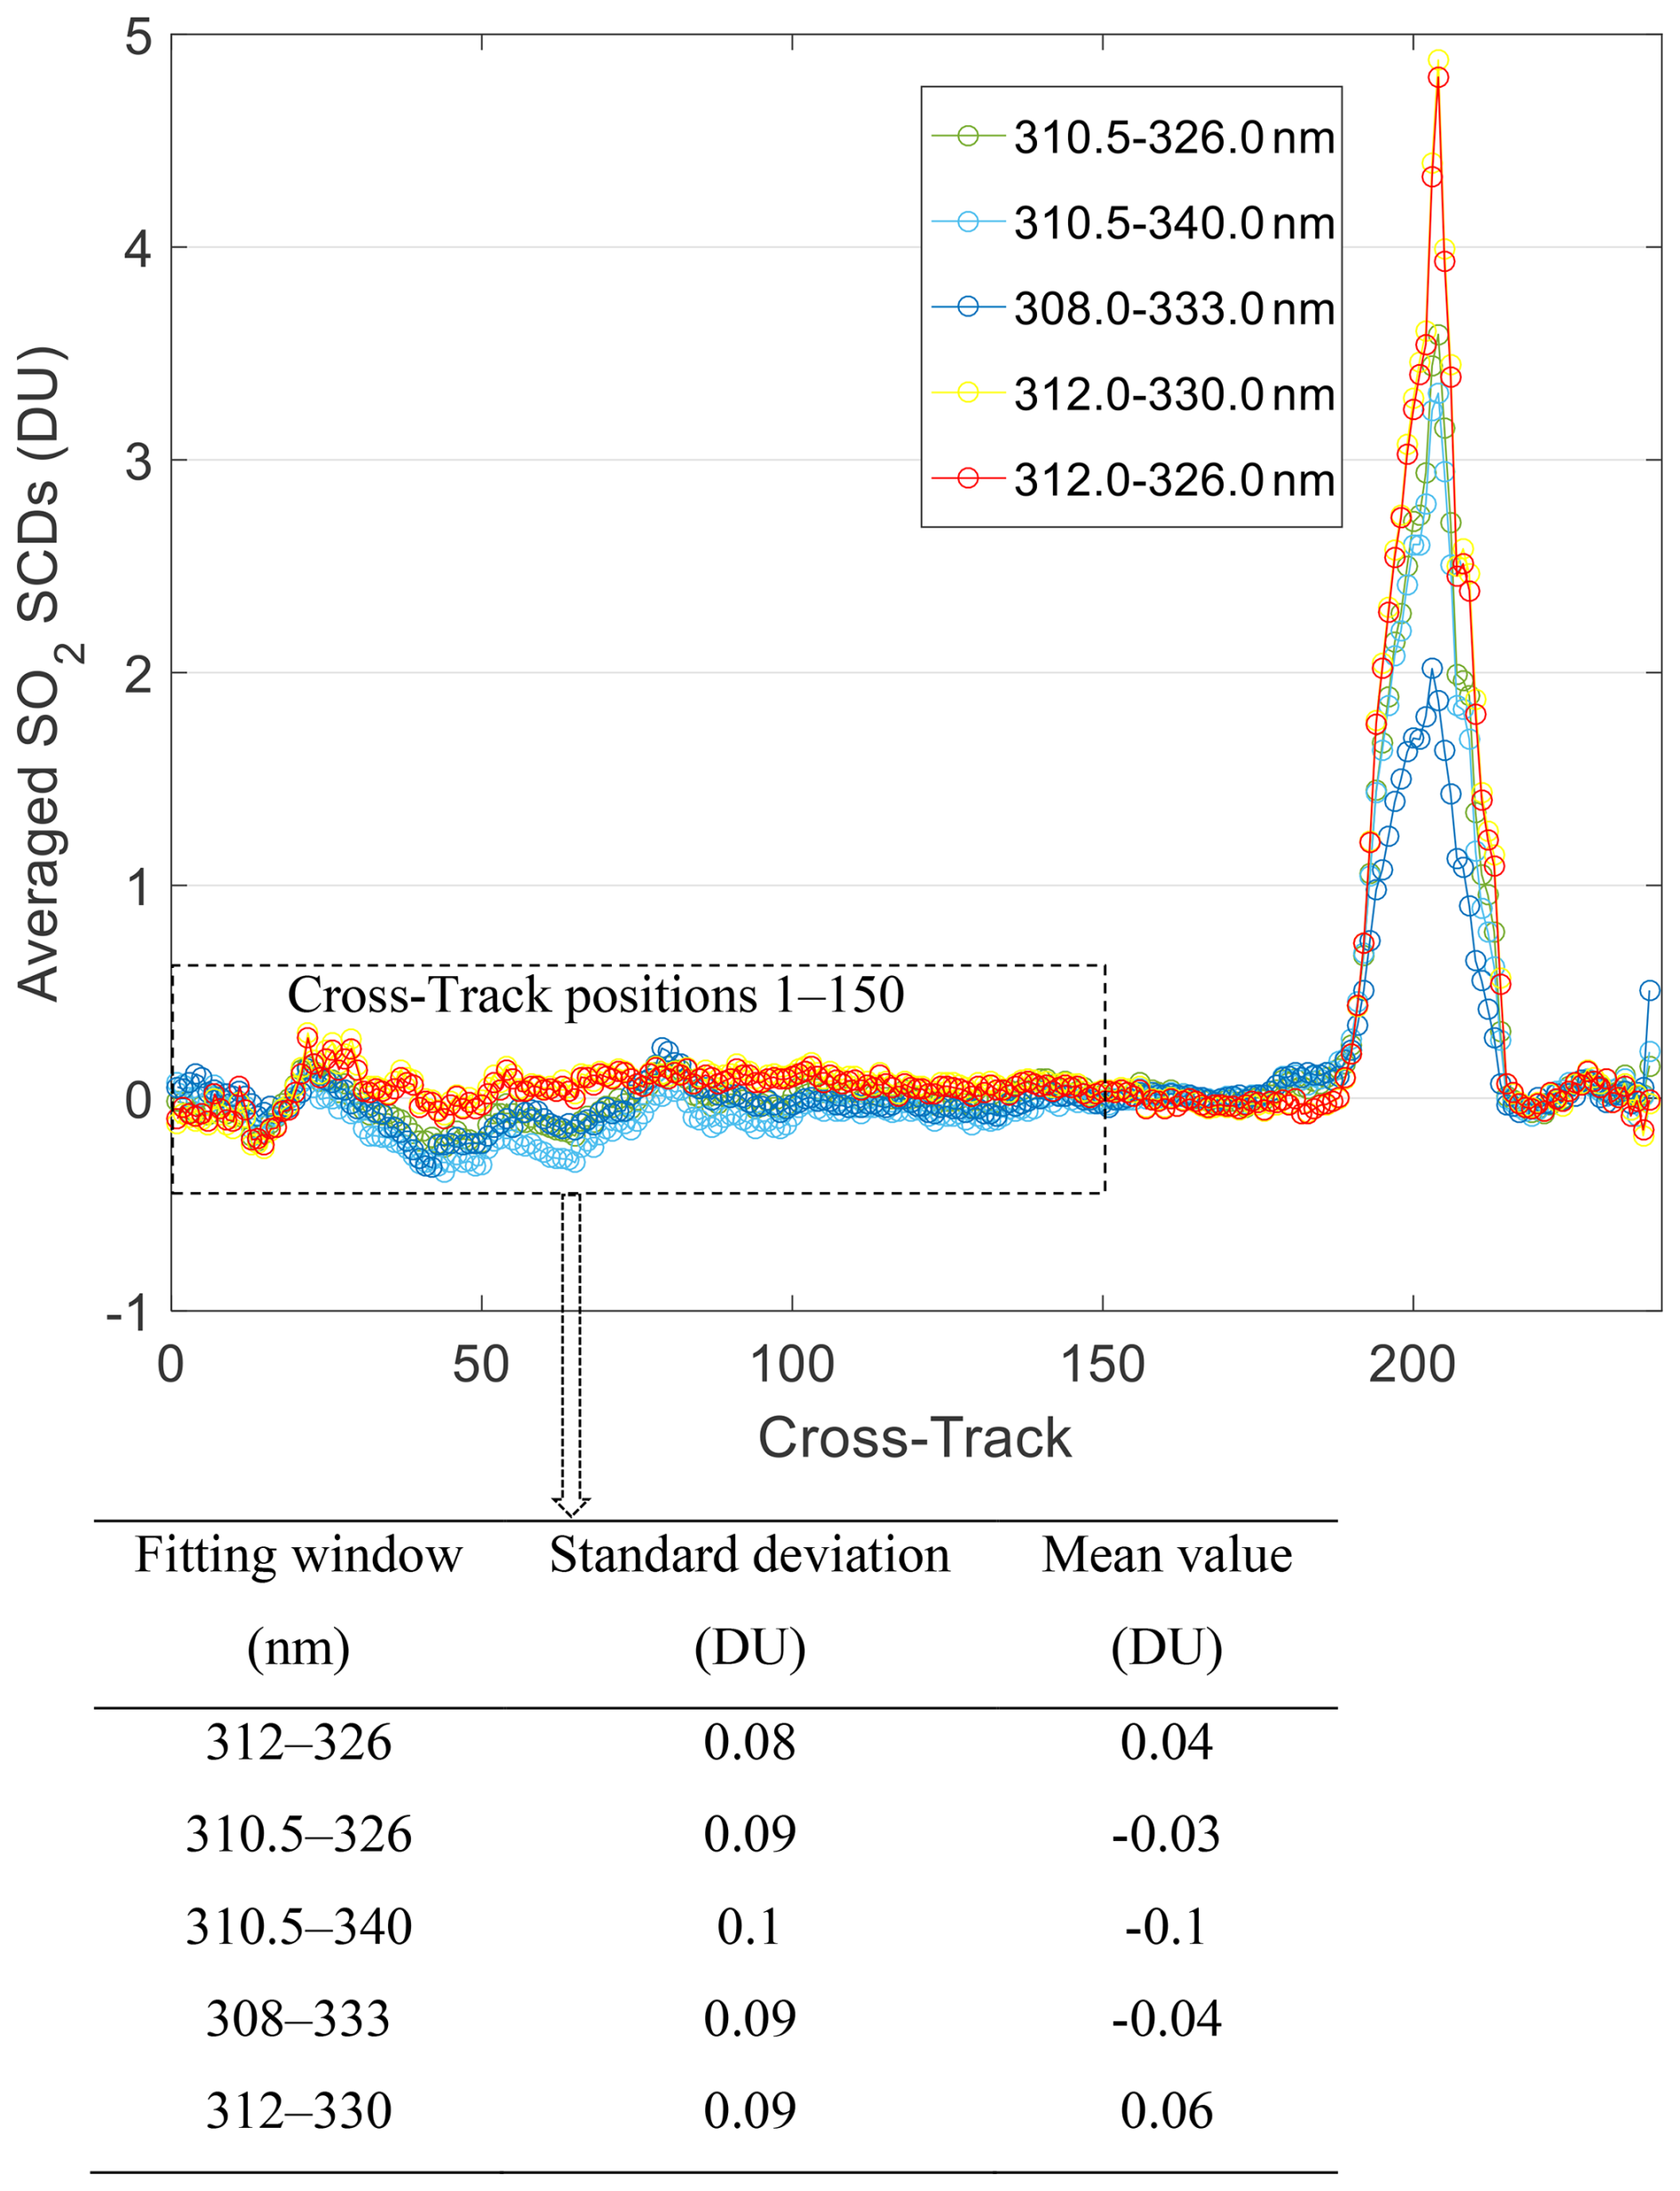
Figure 2Row-averaged SO2 retrievals from OMS rows 700 to 870 of orbit 20240823_1036 by using different spectral fitting windows.
3.3.2 Ring effect
The Ring effect is an important factor influencing the accuracy of SO2 retrieval results due to the pronounced filling-in features of the Ring spectrum in the UV region (Fig. 3). It redistributes photon energy and leads to the filling-in of Fraunhofer and atmospheric absorption lines (Sioris and Evans, 1999; Fish and Jones, 1995; Chance and Spurr, 1997; Vountas et al., 1998). For OMS SO2 column retrievals using the DOAS method, the Ring effect is considered as a pseudo-absorption effect, and the Ring spectrum calculated using the SCIATRAN radiative transfer model (Rozanov et al., 2005) is included as a pseudo-absorber in the spectral fitting process, as shown in Eq. (1).
Where I(λ) and F(λ) are the satellite-observed radiance and the solar reference spectrum convolved with the OMS ISRF, SZA is the Solar Zenith Angle, and are the absorption cross-section of SO2 and O3, and are the slant column density of SO2 and O3, σRing(λ) is the Ring spectrum calculated using the SCIATRAN model and convolved with the OMS ISRF, CRing is the Ring absorption coefficient determined by the fitting, P(λ) is a low-order polynomial, and E(λ) is the error term.
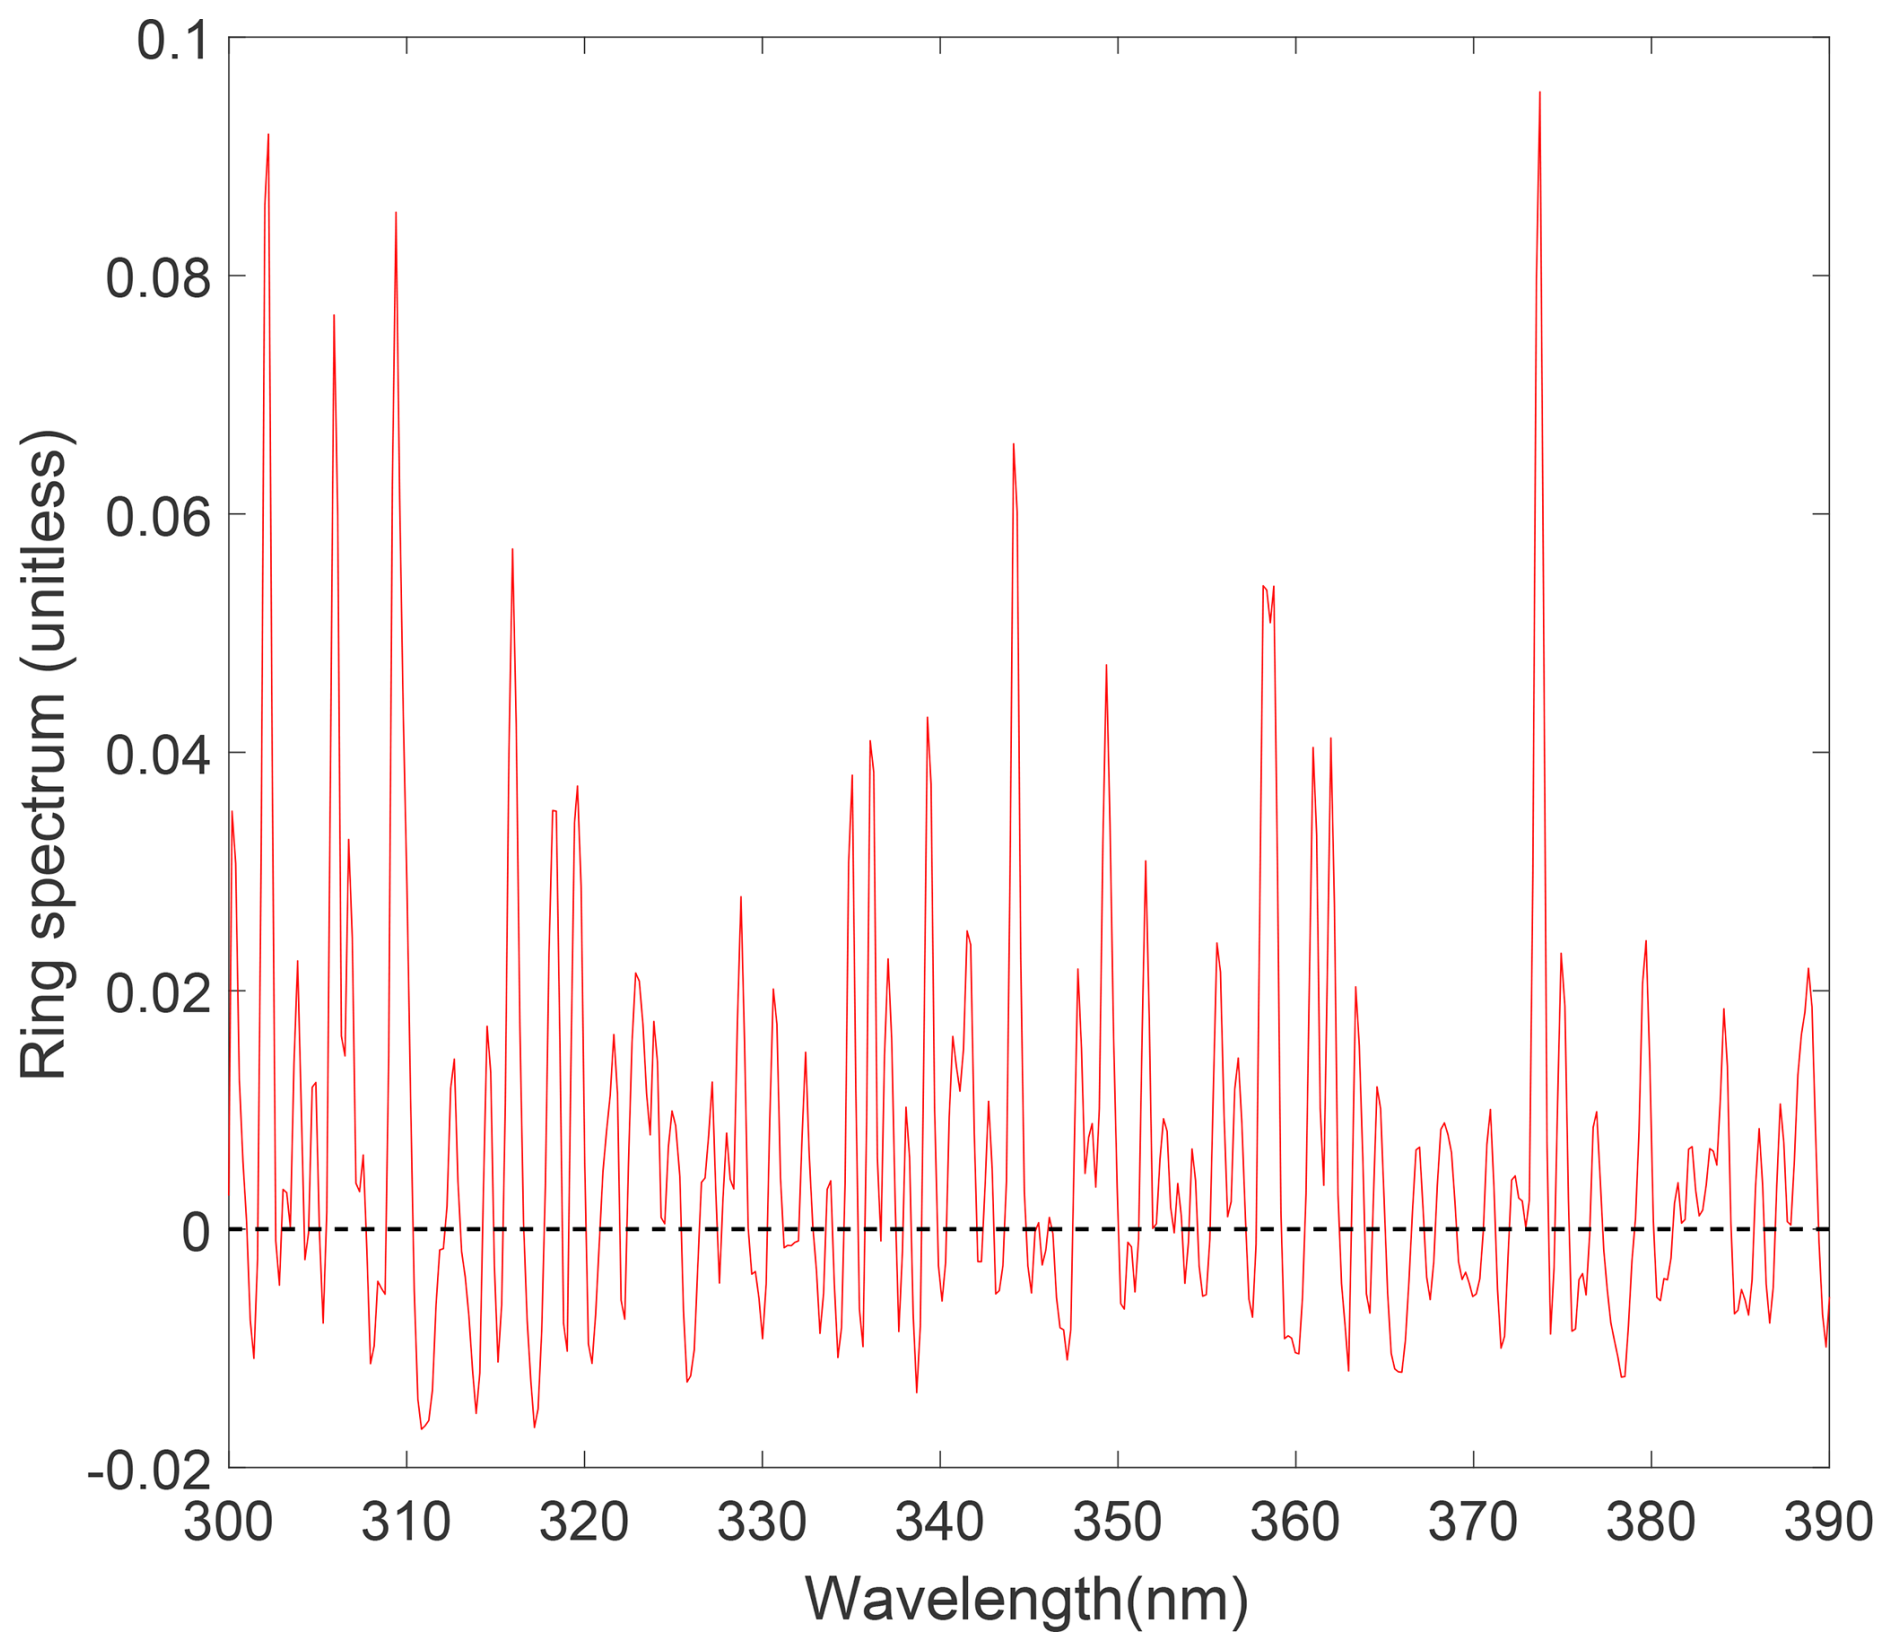
Figure 3Ring spectrum calculated with the SCIATRAN model, convolved with the OMS nadir ISRF. SCIATRAN forward settings are SZA = 30°, VZA = 0°, RAA = 0°, Surface albedo = 0.05, Ozone column = 275 DU, Clear sky.
Note that in this study a fixed Ring spectrum calculated using the SCIATRAN model under typical atmospheric and surface conditions and observational geometry (SZA = 30°, Viewing Zenith Angle (VZA) = 0°, Relative Azimuth Angle (RAA) = 0°, surface reflectance (AS) = 0.05, surface height above sea level (HS) (also referred to as terrain height) = 0 km, ozone column = 275 DU, clear sky) is used in the DOAS fitting for all OMS measurements. Variations of the Ring spectrum due to different atmospheric conditions and viewing geometries are not considered, since applying the Ring lookup table would be computationally costly and its impact on OMS SO2 SCD retrievals is limited. A detailed error analysis of this fixed Ring approach is discussed in Sect. 5.1.3.
3.3.3 Spectral fitting
The retrieval of the FY-3F/OMS SO2 SCD is primarily based on the classical DOAS theory (Platt and Stutz, 2008). It utilizes Beer-Lambert's law and the satellite hyperspectral radiance observations in the UV fitting window to derive the SO2 SCD along the entire photon path (Table 2). First, the absorption cross-section of SO2 and O3, measured under specific laboratory conditions with a higher spectral resolution and different sampling points than those of OMS observations, are convolved with the OMS ISRF to match the spectral resolution of the OMS instrument. Secondly, atmospheric extinction is divided into two components: a fast-varying part with wavelength, typically associated with narrow absorption features of SO2 and O3, and a slow-varying part with wavelength, related to broad spectral features of absorption and atmospheric scattering processes such as Rayleigh and Mie scattering. A low-order polynomial is used to remove the slow-varying components, while preserving the fast-varying part related to SO2 and O3 absorption. Finally, the slow-varying part of satellite-observed TOA reflectance (the ratio of L1 radiance to irradiance data) are removed by subtracting a low-order polynomial, and the atmospheric SO2 SCD is obtained through least-squares fitting.
Table 2Parameter settings for the retrieval of FY-3F/OMS SO2 SCD.
3.4 AMF
The reflected radiance detected by the satellite instrument contains information of trace gases integrated along the slant observation path. From the reflected radiance and above DOAS spectral fitting, the SO2 SCD can be derived; however, the SCD is not suitable for the application of satellite-derived SO2 in monitoring global climate change and air pollution, as it represents the SO2 column along the slant path, which is influenced by the observation geometry and atmospheric conditions. The SCD can be converted to VCD using AMF = SCD/VCD (Palmer et al., 2001), which represents the relative length of the mean slant path at a certain wavelength for photons interacting with a certain absorber in the atmosphere relative to the vertical path (Lorente et al., 2017).
The AMF can be expressed as a function of these parameters:
Where AS is the surface reflectance, HS is the terrain height, S(z) represents the SO2 vertical profile shape, O3 is total ozone column. In practice, the AMF is typically computed as the weighted average of altitude-dependent Box-AMFs (equivalent to scattering weights) across all layers, with the weights determined by the SO2 distribution in each layer (Eq. 3) (Chen et al., 2009; Wagner et al., 2007; Palmer et al., 2001; Boersma et al., 2004):
Where ci represents the SO2 number density in the ith layer, and Δhi denotes the thickness of that layer. Box-AMFs quantify the contribution of each atmospheric layer to the total AMF and allows for flexible updates of AMF with new SO2 profiles, eliminating the procedure of rebuilding the AMF lookup table (LUT).
In this study, OMS SO2 AMFs were calculated using Box-AMFs derived from SCIATRAN and SO2 vertical profiles from the Goddard Earth Observing System Composition Forecast (GEOS-CF) system (Fahrland et al., 2020) (Data source: https://portal.nccs.nasa.gov/datashare/gmao/geos-cf, last access: 10 March 2026). The GEOS-CF system combines the GEOS weather analysis and forecasting system with the GEOS-Chem chemistry module (Keller et al., 2021) to provide detailed chemical analyses of a wide range of air pollutants, including O3, NO2, SO2, and PM2.5. The GEOS-CF SO2 vertical profiles, with a horizontal resolution of 0.25° × 0.25°, a temporal resolution of 1 h, and 72 vertical model layers extending up to 0.01 hPa, were temporally matched to the OMS overpass time and spatially interpolated to the center of each OMS pixel. The profiles were normalized and used as weighting functions in the AMF calculation.
Table 3Values of the six variables used in the cloud-free Box-AMF LUT.
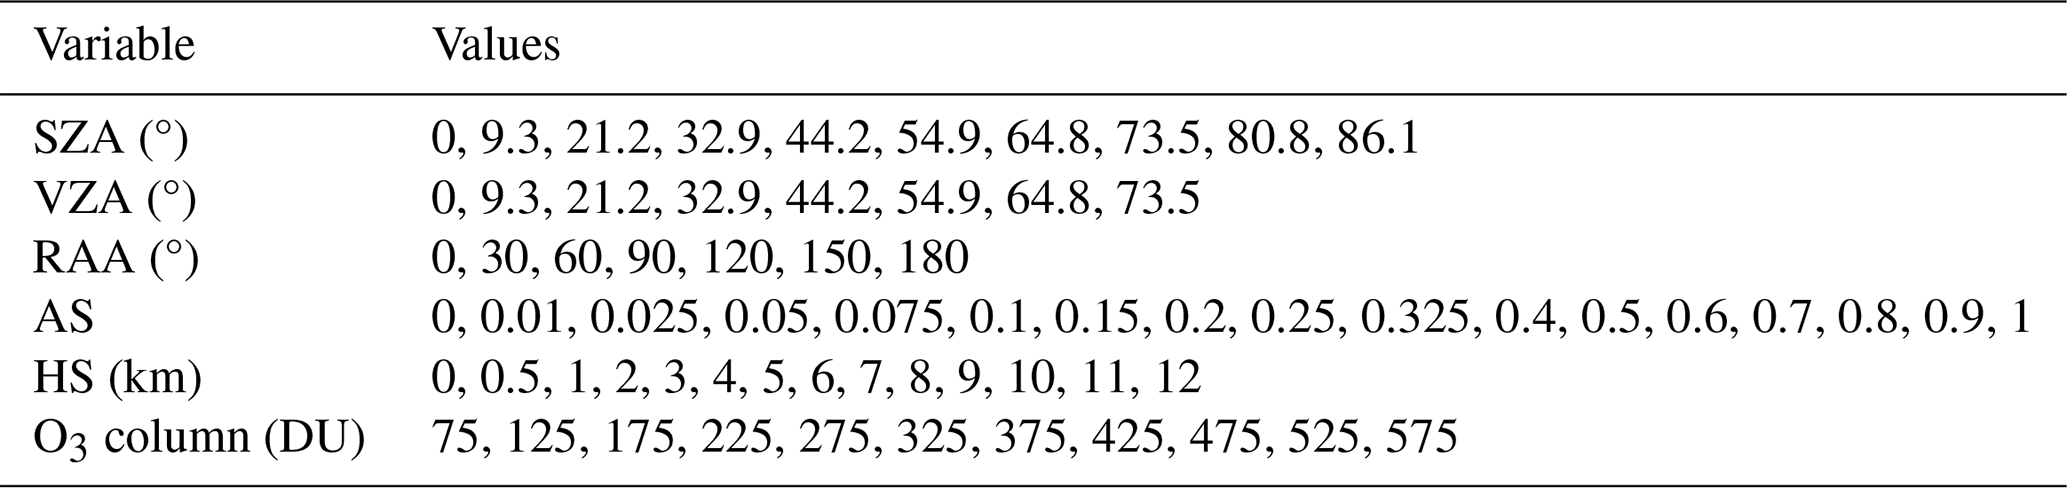
To improve computational efficiency, a cloud-free Box-AMF LUT was built using SCIATRAN, considering six variables: SZA, VZA, RAA, AS, HS, and O3 column. The detailed values for each variable are listed in Table 3. Although Box-AMFs are wavelength-dependent, the LUT in this study was calculated at 320 nm, approximately at the center of the OMS SO2 retrieval window (312–326 nm). For each OMS pixel, Box-AMF values were obtained by multi-dimensional interpolation within the LUT according to the corresponding observational geometry (SZA, VZA, and RAA) and atmospheric and surface conditions (AS, HS, and O3). The observational geometry parameters and surface height were directly obtained from the OMS L1 radiance product. The corresponding surface reflectance was interpolated from the OMI surface reflectance climatology (Kleipool et al., 2008). The total ozone column used for LUT interpolation was obtained from the corresponding OMS ozone product (Xu et al., 2025). Due to the current unavailability of synchronized and reliable OMS cloud and aerosol products, the effects of clouds and aerosol on SO2 retrievals were not considered in this study. Consequently, the AMFs for all OMS pixels were calculated using the cloud-free Box-AMF LUT. Section 5.2 of this study provides a detailed description of the AMF error analysis.
3.5 Background offset correction
The retrieval accuracy of SO2 columns from FY-3F/OMS is affected by spectral and radiometric calibration errors, which are difficult to remove from OMS L1 radiance data and result in systematic biases in the retrieval results, such as along-track stripes and cross-track asymmetries (Boersma et al., 2004). The TSIS-1 HSRS hybrid solar reference spectrum used in OMS SO2 retrievals does not contain instrument-related characteristics, meaning that certain calibration errors in the radiance data cannot be cancelled out during the DOAS fitting process. This may further contribute to systematic biases in the retrieved OMS SO2 columns. In addition, due to the low SNR of measurements in the fitting window, the weak SO2 absorption information included in the TOA reflected radiance, and the interference from strong O3 absorption in the fitting window, the OMS SO2 retrievals tend to be systematically overestimated or underestimated over the whole orbit. These systematic biases in the retrieval results of SO2 columns are mixed with the absorption information of SO2 and limit the applicability of the OMS SO2 product. Therefore, it is necessary to apply a background offset correction to reduce these systematic biases in the retrieved SO2 columns. The reference region method (Khokhar et al., 2005; Richter et al., 2006) was used to correct the background offsets, which are latitude-dependent and related to the cross-track position. This method selects retrieval values over a reference region (e.g., clean oceanic Pacific regions, assumed to be areas with no SO2) as the background area. The SO2 retrievals are then adjusted by subtracting the background offsets of the same latitude over the ocean. Yang proposed the sliding median correction method (Yang et al., 2007) and applied it to the OMI SO2 product. This method performs averaged sampling within a sliding window centered on the pixel (selecting pixels with values less than 2 DU) to get background offsets for each row of pixels. With the sliding window method, the cross-track and along-track biases varying with time and location can be effectively eliminated.
For OMS SO2 retrievals, based on the above background offset correction methods, we developed an improved iterative sliding correction scheme to avoid seam problems due to discontinuous integration times within the same orbit. The details of the background offset correction used for OMS SO2 retrievals are as follows.
-
Firstly, based on the integration time of FY-3F/OMS L1 data, the orbital data is divided into several data blocks corresponding to different integration times. For each data block, the mean vector (V0) at each cross-track position is estimated using all valid pixels within the block (i.e., pixels with normal L1 data, as indicated by the L1 QA quality flag). Each scan line within the data block is processed by subtracting V0 from the SO2 retrievals of each scan line to obtain the initially corrected SO2 columns.
-
Secondly, based on the initially corrected SO2 columns, the predefined SO2 threshold (2 DU), and the sliding window, the mean vector V1 for cross-track positions within each sliding window is estimated. The initially corrected SO2 columns are then processed by subtracting V1 to obtain the double-corrected SO2 columns. Note that the size of the sliding window varies with the satellite's spatial resolution. In this study, for the FY-3F/OMS with nadir resolution of 7 km × 7 km, the sliding window is set to 200 scan lines. It is worth noting that there is a trade-off between the size of the sliding window and the effectiveness of the offset correction: too big a window might result in poor offset correction, while too small a sliding window might lead to reduction of the SO2 information contained in the satellite measurements.
-
Finally, based on the double-corrected SO2 results, the predefined SO2 threshold, and the sliding window, an iterative procedure is performed until the relative deviation between the results of the two consecutive corrections is less than or equal to 5 %.
Based on the FY-3F/OMS L1 measurements and the retrieval scheme outlined in Sect. 3, global SO2 columns from FY-3F/OMS were retrieved and applied to monitor the SO2 emissions from volcanic and anthropogenic activities. Evaluating the accuracy of OMS SO2 retrievals is challenging, as it is difficult to obtain synchronous and high-quality ground-based or airborne measurements for the validation of OMS SO2 retrievals. Therefore, in this study, due to its high spatial and spectral resolution in the UV-VIS band and its common use in global SO2 monitoring, the TROPOMI SO2 total column product was selected as reference to evaluate the accuracy of OMS SO2 retrievals (Theys et al., 2019; Wang et al., 2022; Theys et al., 2017; Cofano et al., 2021; Corradino et al., 2024; Fioletov et al., 2020). It should be noted that, in the comparison between OMS and TROPOMI SO2 results, no filtering for cloud or large SZA was applied to the OMS SO2 data. Instead, all OMS SO2 retrievals greater than −10 DU were selected for the comparison, since negative values often appear in SO2 retrievals from most instruments (e.g., OMI, GOME-2, and TROPOMI), and small negative values can indicate low SO2 emissions in clean areas (Theys et al., 2013; Fioletov et al., 2020).
TROPOMI has a local overpass time of approximately 13:30, a spatial resolution of 5.5 km × 3.5 km for SO2 and provides daily global coverage with about 14 orbits per day. Two TROPOMI SO2 products derived from different retrieval algorithms are used for comparison in this study: one is the TROPOMI offline L2 orbital SO2 product from the DOAS algorithm (hereafter referred to as TROPOMI DOAS or TROPOMI-D) (Data source: https://browser.dataspace.copernicus.eu/, last access: 10 March 2026), and the other is the TROPOMI L3 grid Planetary Boundary Layer (PBL) and 7 km SO2 product from the COBRA algorithm (hereafter referred to as TROPOMI COBRA or TROPOMI-C) (Data source: https://data-portal.s5p-pal.com/products/so2cbr.html, last access: 1 January 2026). The TROPOMI DOAS SO2 retrieval uses multiple spectral windows, including 312–326, 325–335, and 360–390 nm (Theys et al., 2017), which helps mitigate saturation effects under volcanic eruptions, whereas the TROPOMI COBRA algorithm uses 310.5–326 nm as the retrieval window, where SO2 absorption is relatively strong. The TROPOMI COBRA SO2 product was developed by Royal Belgian Institute for Space Aeronomy (BIRA), and reduces significantly both the noise and biases present in the current TROPOMI operational DOAS SO2 retrievals (Theys et al., 2021). The TROPOMI COBRA L3 grid product (0.022° × 0.022° equal latitude-longitude grid) was generated using the HARP gridding tool from L2 data applying a Quality Assurance (QA) filter (QA > 0.5) to remove low quality data. This quality filtering may leads to some gaps in the COBRA data.
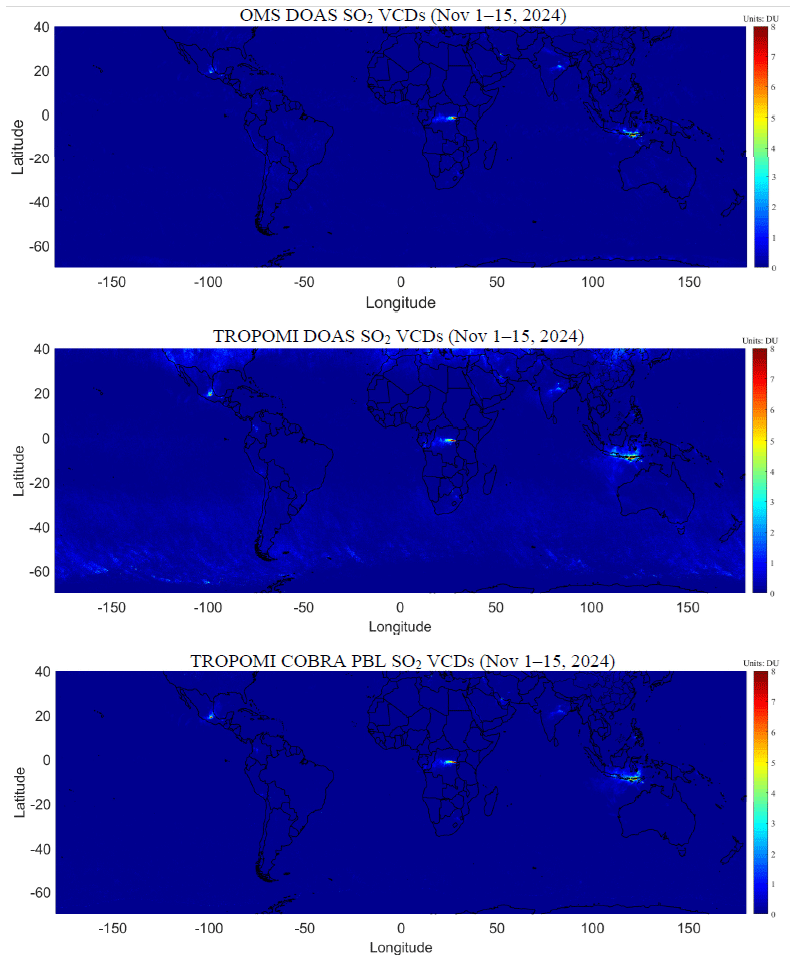
Figure 4Global maps of averaged SO2 VCDs from OMS, TROPOMI DOAS and TROPOMI COBRA for 1–15 November 2024, 0.2° × 0.2° equal latitude-longitude grid. Note that the TROPOMI DOAS SO2 VCDs are obtained from the product variable “sulfurdioxide_total_vertical_column”, and only pixels with QA > 0.5 are used.
Figure 4 shows the 15 d averaged global SO2 VCDs from OMS, TROPOMI DOAS and TROPOMI COBRA for 1–15 November 2024. OMS DOAS SO2 VCDs were averaged using pixels with SO2 column greater than −10 DU, while TROPOMI DOAS VCDs used pixels with QA > 0.5. Overall, the OMS, TROPOMI DOAS and TROPOMI COBRA datasets exhibit generally consistent spatial distributions, clearly identifying the major global SO2 emission hotspots. Minor differences between the datasets can be attributed to variations in observational geometry, overpass time, and algorithmic processing. Further comparisons based on individual orbits are presented in Sect. 4.1, 4.2, and 4.3. Based on these comparisons, the performance of OMS SO2 retrievals was evaluated over clean oceanic regions, volcanic eruption regions, and anthropogenic emission regions, as marked by the red boxes in the Fig. 5.
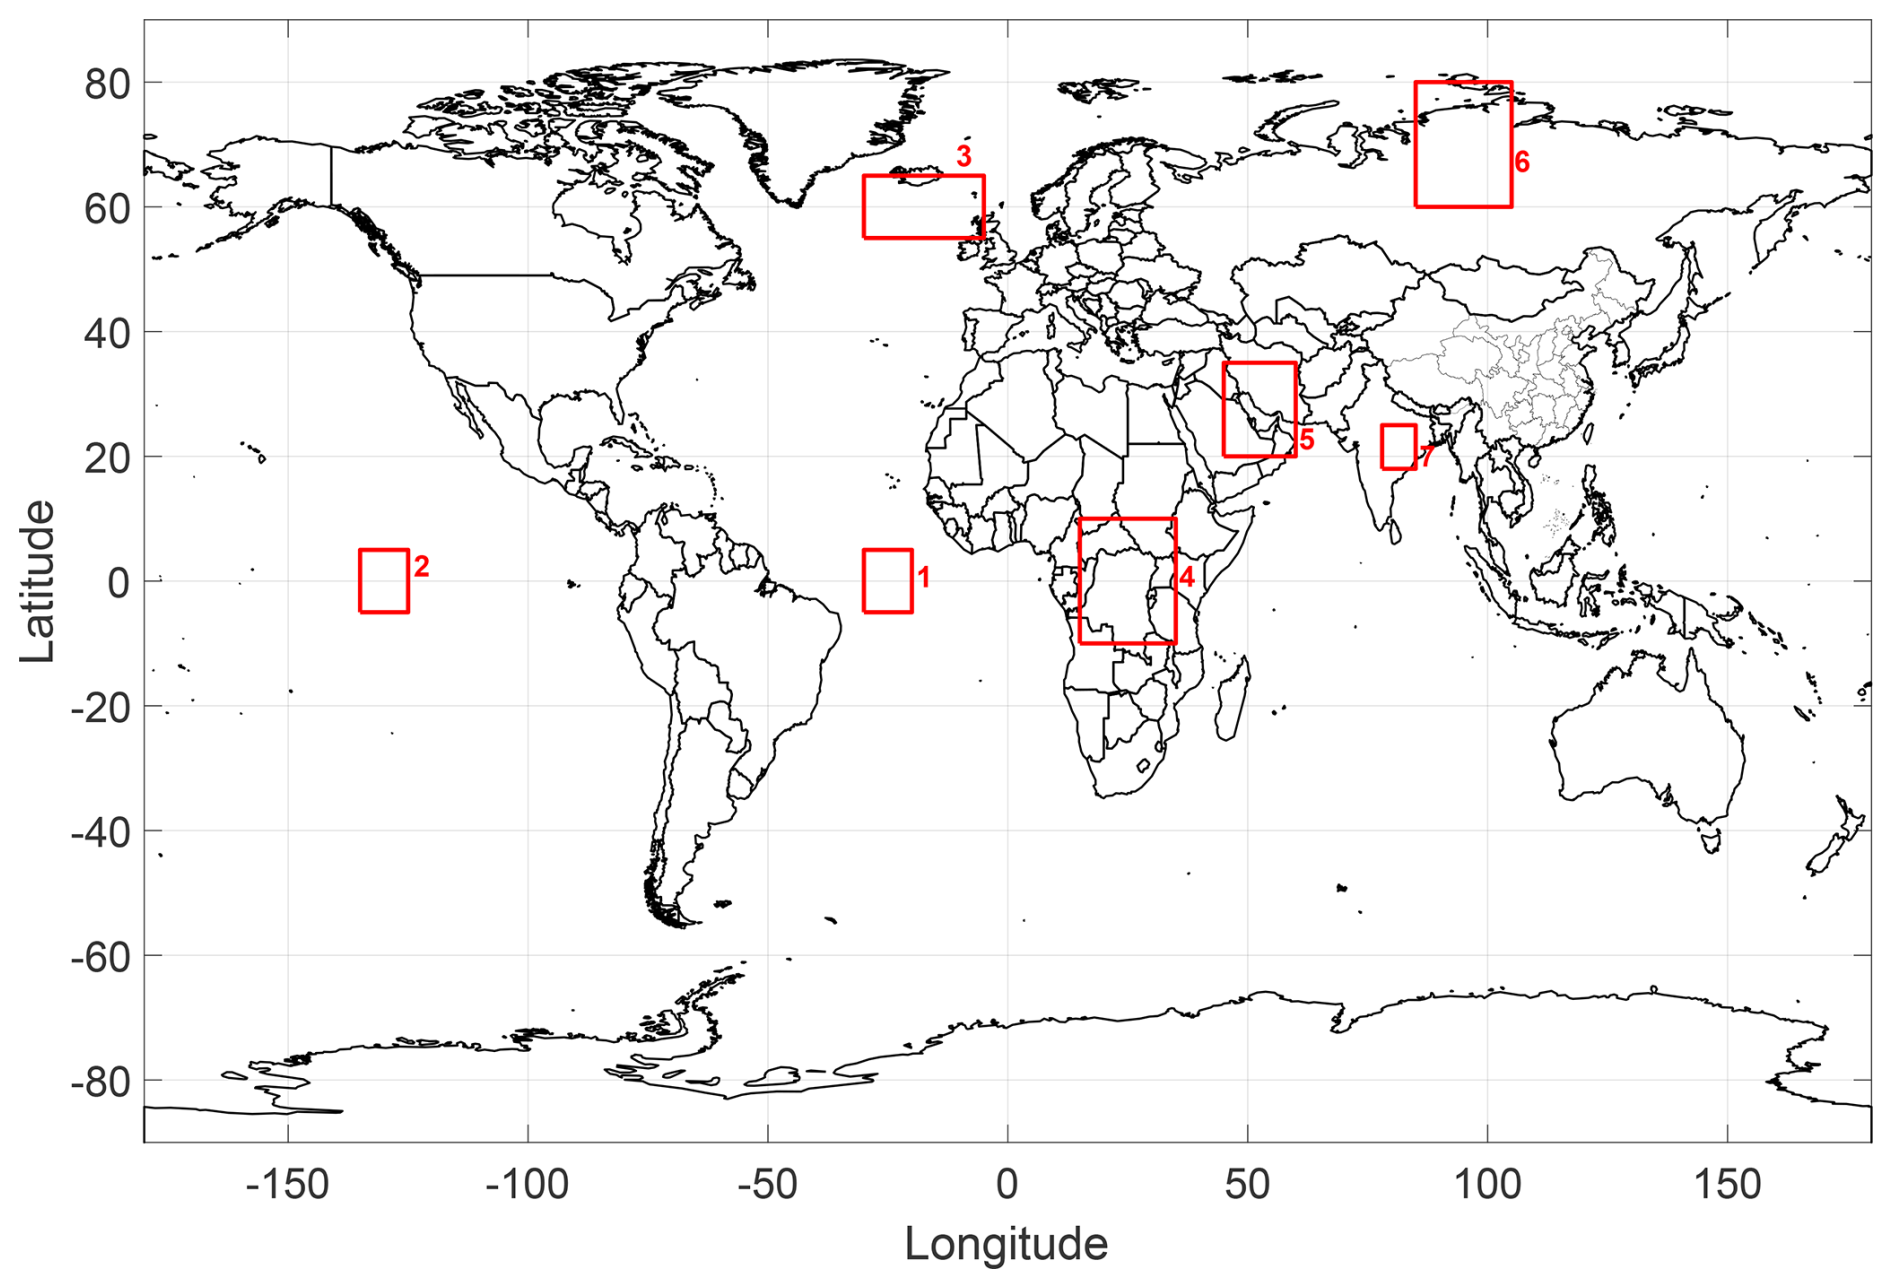
Figure 5Regions selected for the comparison of OMS and TROPOMI SO2 columns. Regions 1 and 2 represent clean oceanic areas, regions 3 and 4 correspond to volcanic eruption areas, and regions 5–7 represent anthropogenic emission areas.
4.1 Comparison over clean oceanic regions
Ideally, the retrieved SO2 values from satellite observations in clean regions should be close to zero. The scatter of SO2 columns in clean regions can reflect the reliability and stability of the satellite data and the retrieval algorithm (Krotkov et al., 2008). In this study, two clean oceanic regions, where SO2 emissions are extremely low and assumed to be zero, were selected as the case studies to compare and evaluate the precision of FY-3F/OMS SO2 retrievals. One is the area of latitude from 5° S to 5° N and longitude from 30 to 20° W (Region 1 in Fig. 5), and the other is the area of latitude from 5° S to 5° N and longitude from 135 to 125° W (Region 2 in Fig. 5). Due to the geolocation differences between OMS and TROPOMI orbits, the orbital pixels of OMS and TROPOMI DOAS and TROPOMI COBRA SO2 product over the two clean oceanic regions were resampled to 0.15° × 0.15° equal latitude-longitude grid for comparison. As suggested in the TROPOMI README file, only pixels with QA > 0.5 were used for the TROPOMI DOAS SO2 product in this section. For the cases of clean oceanic regions, TROPOMI COBRA L3 grid PBL SO2 products were used instead of the COBRA 7 km product.
As shown in Figs. 6, 7, 8, and 9, the SO2 columns retrieved from both OMS and TROPOMI over Region 1 and Region 2 are generally low and close to zero, and they approximately follow a normal distribution centered around 0, with most values concentrated between −2 and 2 DU. However, there are small differences between OMS and TROPOMI SO2 over clean oceanic regions, which become larger as the pixels approach the edge of the orbit, where retrieval uncertainties are larger. For Region 1, the standard deviations of OMS, TROPOMI DOAS and TROPOMI COBRA SO2 columns are 0.1537, 0.2493 and 0.1156 DU on 23 August 2024, and 0.1672, 0.3934 and 0.1865 DU on 15 November 2024, respectively. For Region 2, the corresponding standard deviations are 0.1539, 0.2636 and 0.1035 DU on 23 August 2024, and 0.1284, 0.3595 and 0.1615 DU on 15 November 2024, respectively. Compared with TROPOMI DOAS SO2 results, both TROPOMI COBRA and OMS DOAS SO2 results show lower standard deviations and are closer to zero over Regions 1 and 2. The differences between OMS and TROPOMI SO2 columns may be primarily related to differences in local overpass times, observation angles, L1 and L2 processing algorithms.
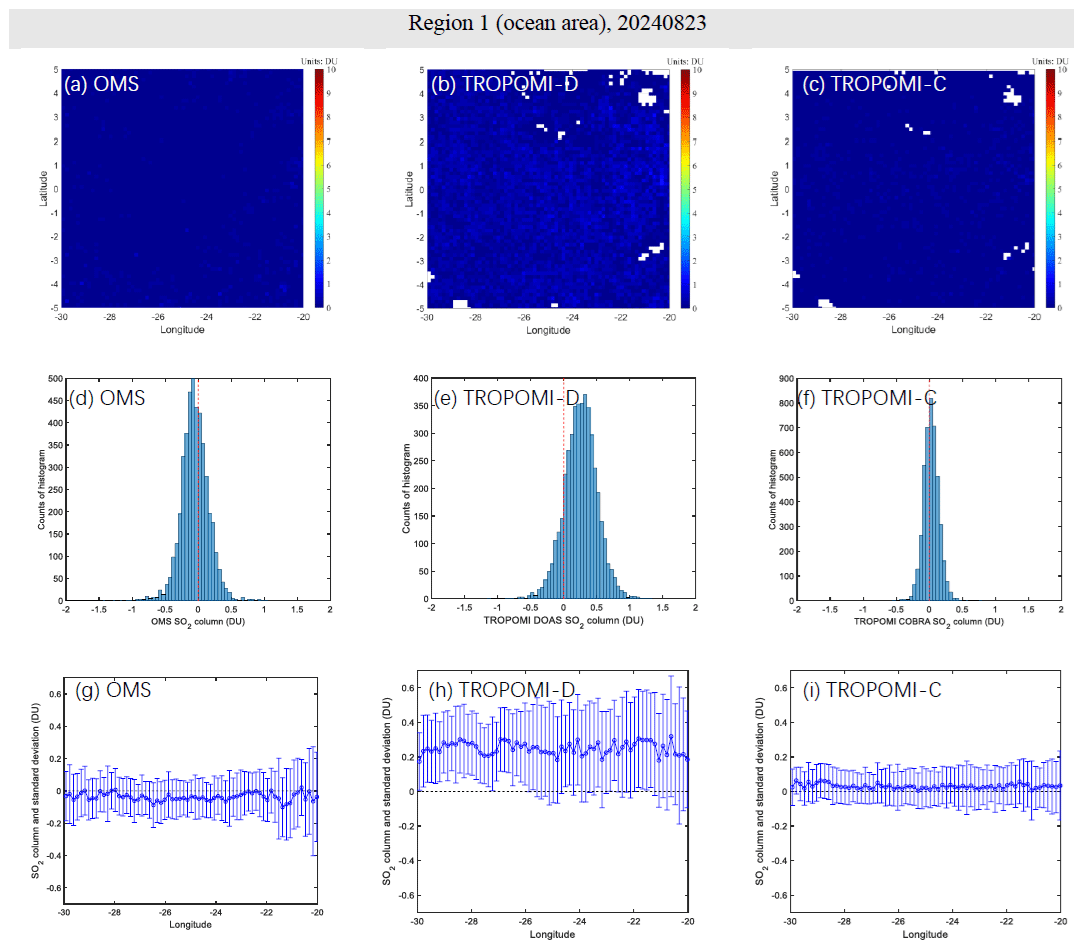
Figure 6SO2 retrievals over clean oceanic area (latitude from 5° S to 5° N and longitude from 30 to 20° W, Region 1) on 23 August 2024. (a–c) Spatial distribution of resampled FY-3F/OMS, TROPOMI DOAS (TROPOMI-D) and TROPOMI COBRA (TROPOMI-C) PBL SO2 columns over Region 1; (d–f) histogram of resampled OMS, TROPOMI DOAS and TROPOMI COBRA PBL SO2 columns over Region 1; (g–i) variation and standard deviations of the latitude-averaged SO2 columns over Region 1. Note that OMS pixels with SO2 column less than −10 DU and TROPOMI DOAS pixels with QA < 0.5 are assigned the value of −9999 and are not shown in the panels. The missing pixels in panels (b) and (c) are due to quality filtering applied to TROPOMI data.
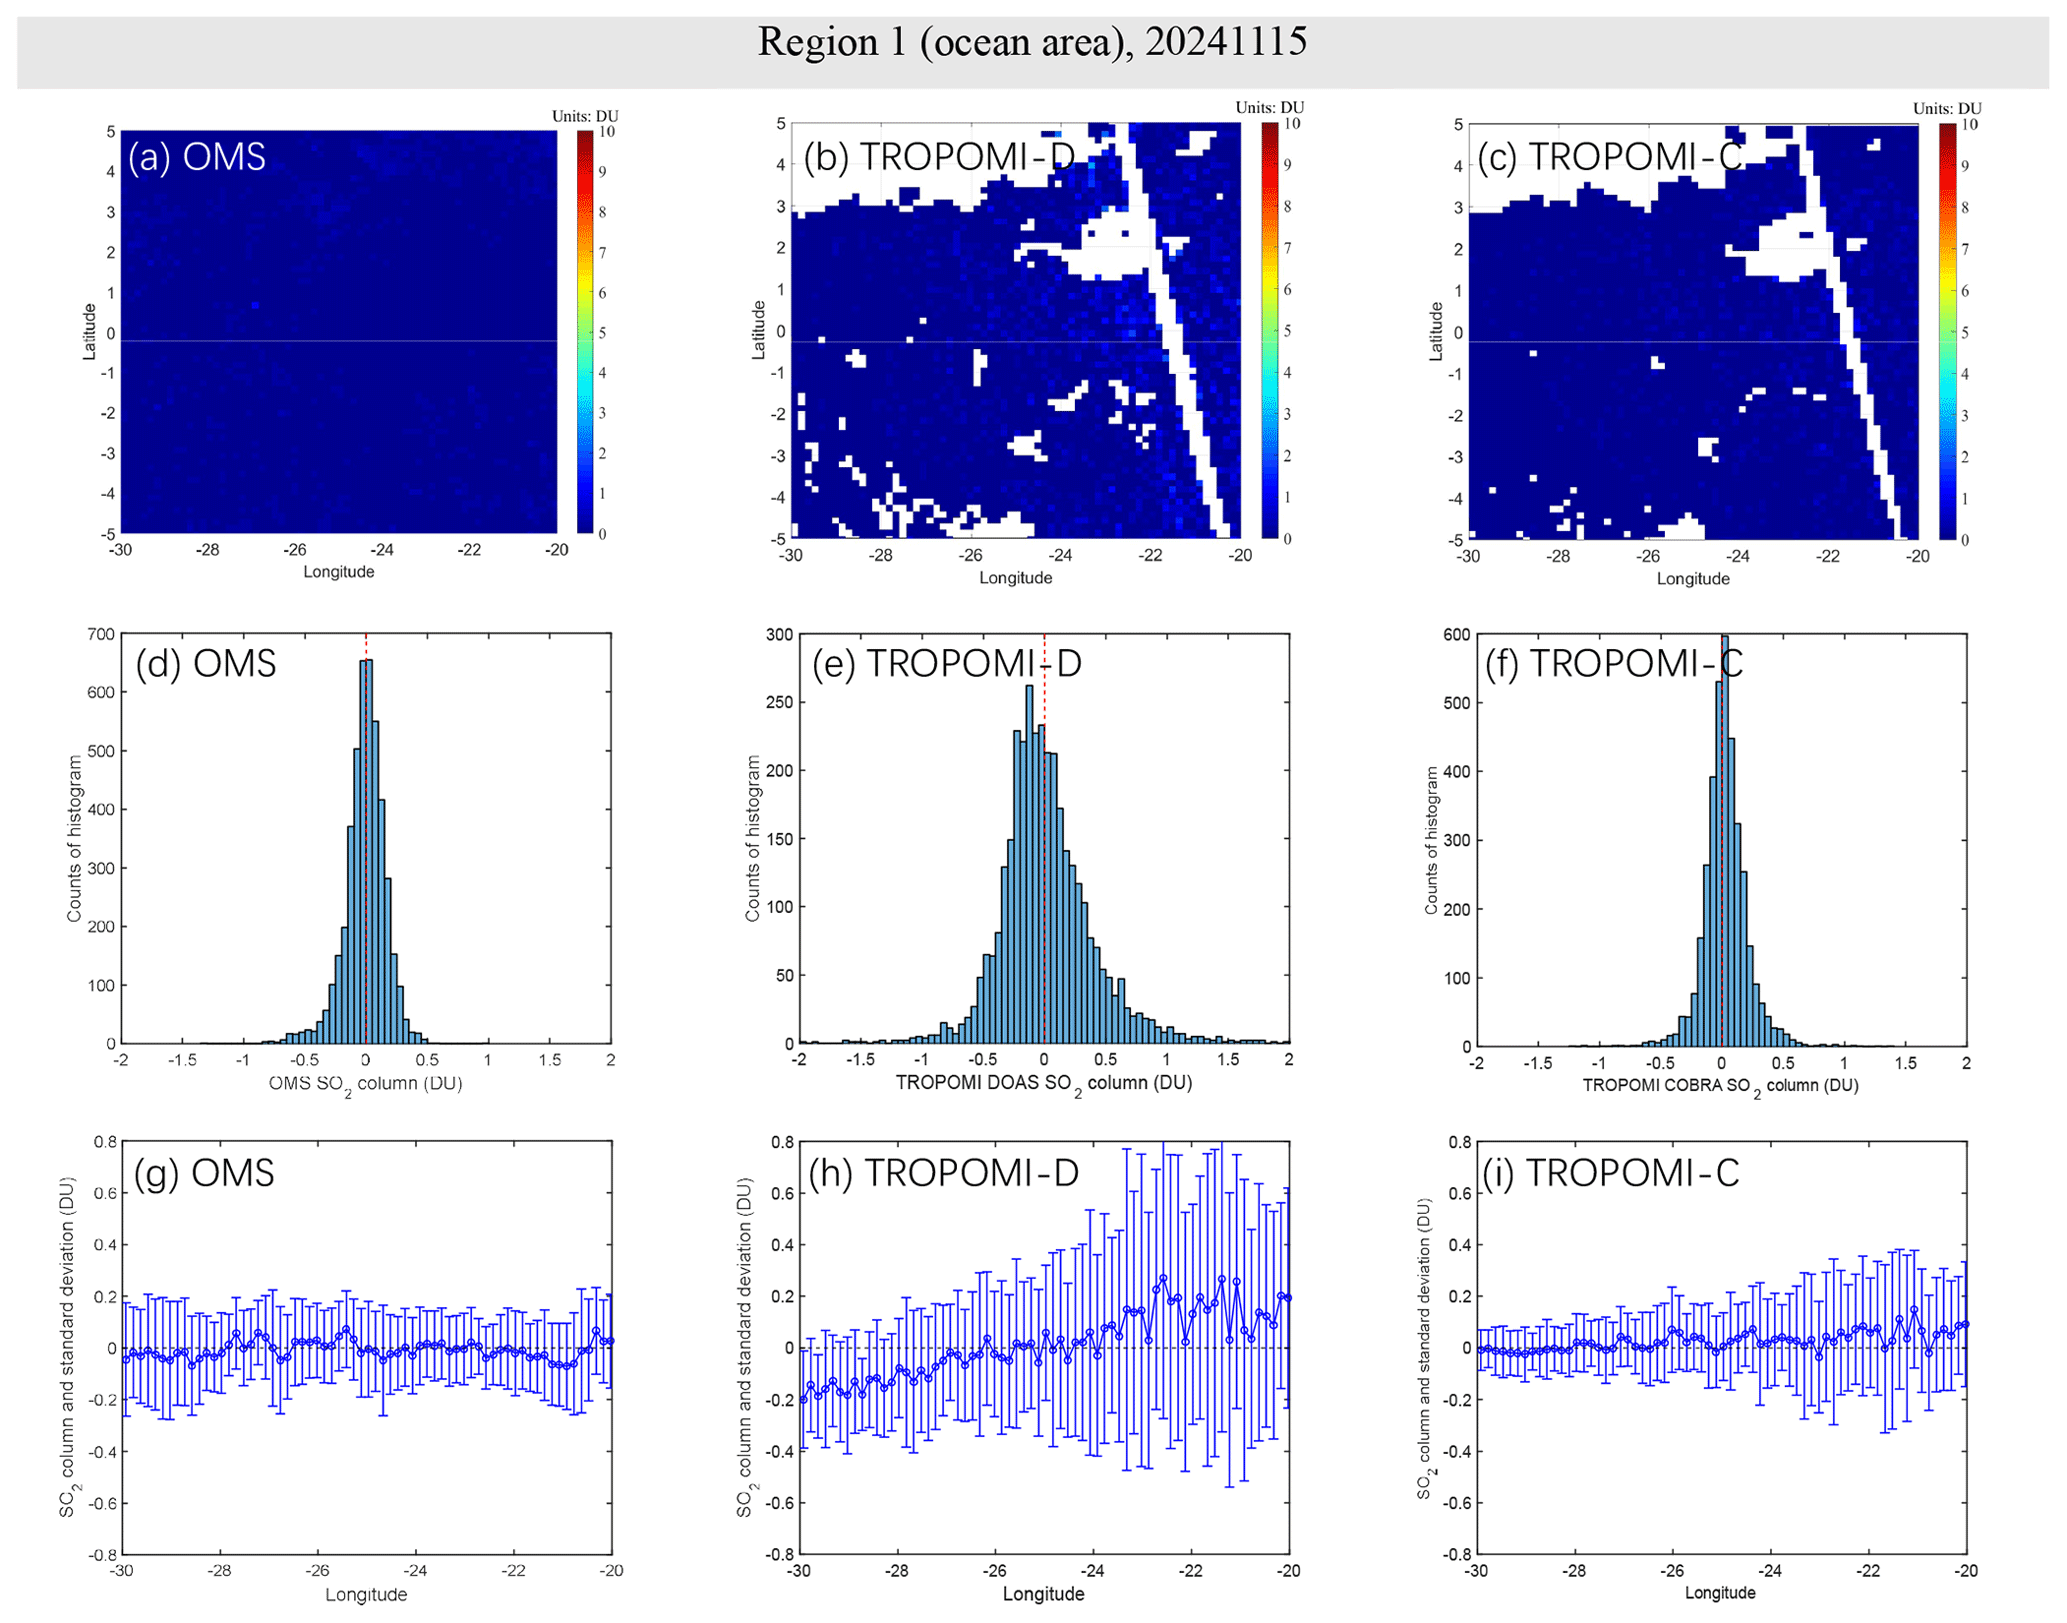
Figure 7As Fig. 6 but for 15 November 2024. The missing pixels in panels (b) and (c) are due to the gap between the two TROPOMI orbits, and quality filtering applied to TROPOMI data.
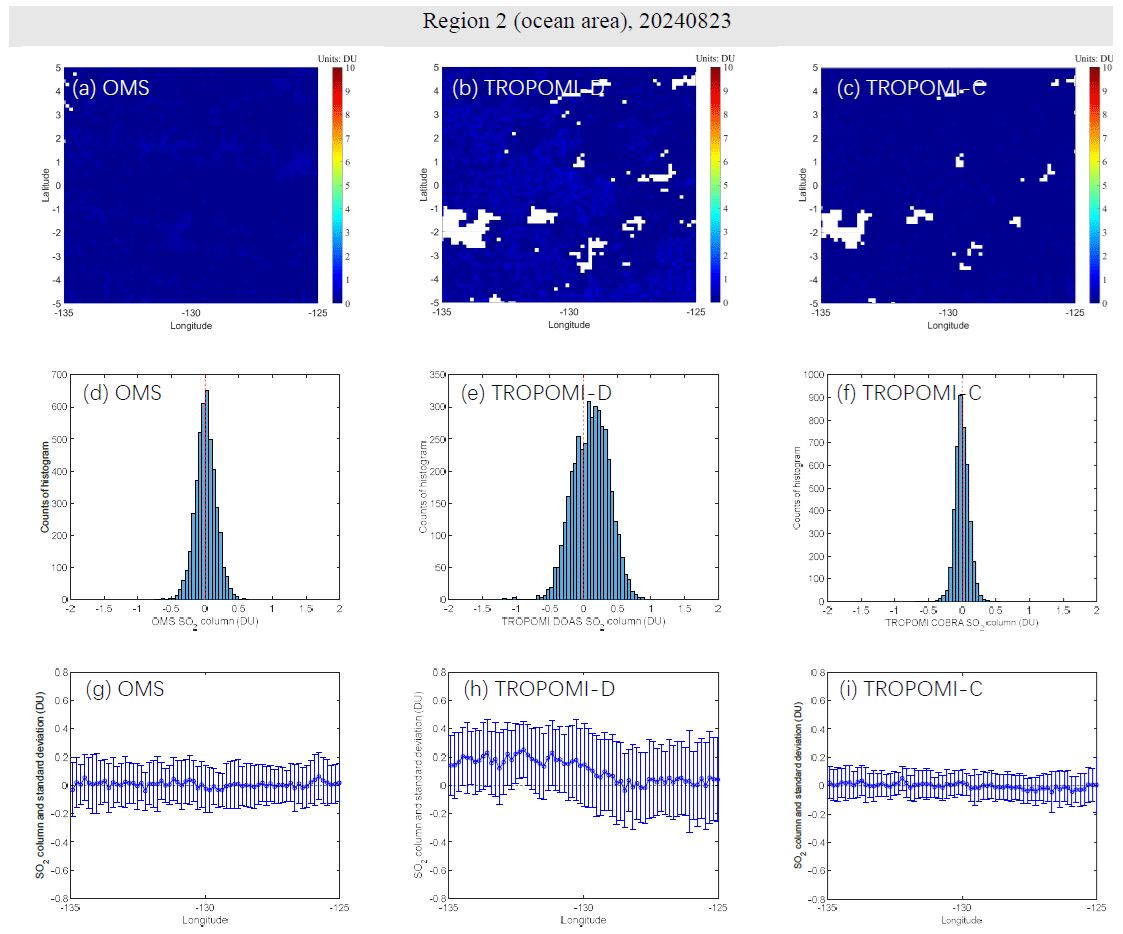
Figure 8As Fig. 6 but for Region 2 (latitude from 5° S to 5° N and longitude from 135 to 125° W). The missing pixels in panel (a) are caused by low spatial resolution at the edges of the orbits, and the missing pixels in panels (b) and (c) are caused by the quality filtering applied to TROPOMI data.
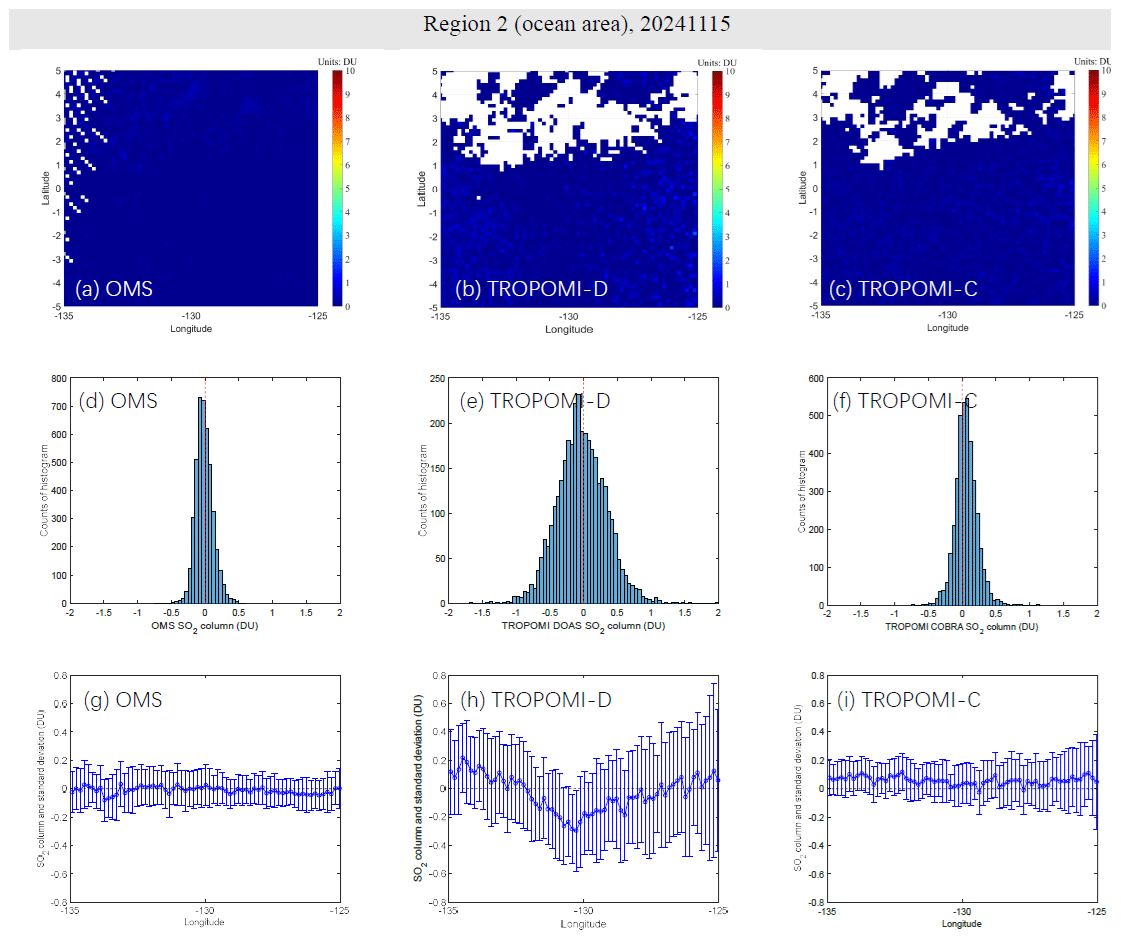
Figure 9As Fig. 8 but for 15 November 2024. The missing pixels in panel (a) are caused by low spatial resolution at the edges of the orbits, and the missing pixels in panels (b) and (c) are caused by the quality filtering applied to TROPOMI data.
Overall, comparisons from different dates and different clean oceanic regions indicate that FY-3F/OMS SO2 retrievals have a reliable precision of approximately 0.15 DU over low-emission regions, and the data quality is relatively stable over time. It is worth noting that the retrieval errors for both OMS and TROPOMI are relatively large at the edges of the orbit, which is likely due to fewer valid pixels in these regions, resulting in larger standard deviations; thus, these pixels should be used with caution.
4.2 Comparison over volcanic eruptions
The massive amounts of SO2 released over a short period during volcanic eruptions, as well as their long-distance transport and the subsequent formation of sulfate aerosols, not only influence the global radiative energy balance (Mccormick et al., 1995) but also pose risks to aviation in the tropopause or stratosphere (Miller and Casadevall, 2000). Through the comparison in volcanic regions, the capability of OMS SO2 retrievals at large columns can be evaluated. In this section, we took the eruptions of Sundhnúkur volcano (Region 3 in Fig. 5) and Nyamuragira volcano (Region 4 in Fig. 5) as case studies for comparing FY-3F/OMS SO2 with TROPOMI DOAS and TROPOMI COBRA 7 km SO2 results. To present the SO2 maps of OMS and TROPOMI DOAS more clearly, the resampling scheme in Sect. 4.1 was not used in Sect. 4.2. For TROPOMI DOAS, we used all pixels from the TROPOMI DOAS SO2 product instead of applying QA > 0.5 to filter the high-quality pixels when comparing with the OMS SO2 results. The reason is that after applying the QA > 0.5 filter, a lot of high SO2 pixels in TROPOMI DOAS over volcanic regions would be missing (not shown here), making it difficult to compare with OMS SO2 results. In this section, TROPOMI COBRA L3 grid 7 km SO2 products were used instead of PBL products.
The Sundhnúkur volcano (Region 3 in Fig. 5) is the first case study for comparing FY-3F/OMS SO2 with TROPOMI DOAS and TROPOMI COBRA 7 km SO2 results over a volcanic eruption. On 22 August 2024, Sundhnúkur volcano within the Reykjanes volcanic system began erupting and continued to emit SO2 for approximately 14 d (https://volcano.si.edu/, last access: 10 March 2026). The eruption created a fissure approximately 3.9 km long, with lava and smoke reaching a height of about 1 km. The region of latitude from 55 to 65° N and longitude from 30 to 5° W was selected as the study area for the Sundhnúkur volcano. There are two OMS orbits (20240823_1036 and 20240823_1217) (Format: YYYYMMDD_HHMM, UTC time of the first scan line) overpassing the Sundhnúkur volcano region on 23 August 2024. For the OMS orbit 20240823_1217, most of the pixels covering the volcanic region are near the edge of the orbit where the measurement noise tends to be higher. For TROPOMI DOAS, although two orbits (20240823T125304 and 20240823T111134) (Format: YYYYMMDDTHHMMSS, observation start UTC time) passed over the Sundhnúkur volcano area, only orbit 20240823T125304 is presented because most of its pixels over the Sundhnúkur volcano region were near the nadir of the orbit where the data quality is higher. Compared with OMS orbit 20240823_1036, OMS orbit 20240823_1217 has a local overpass time closer to that of TROPOMI orbit 20240823T125304 in the volcanic region, making the SO2 results of OMS orbit 20240823_1217 more consistent with those of TROPOMI orbit 20240823T125304.
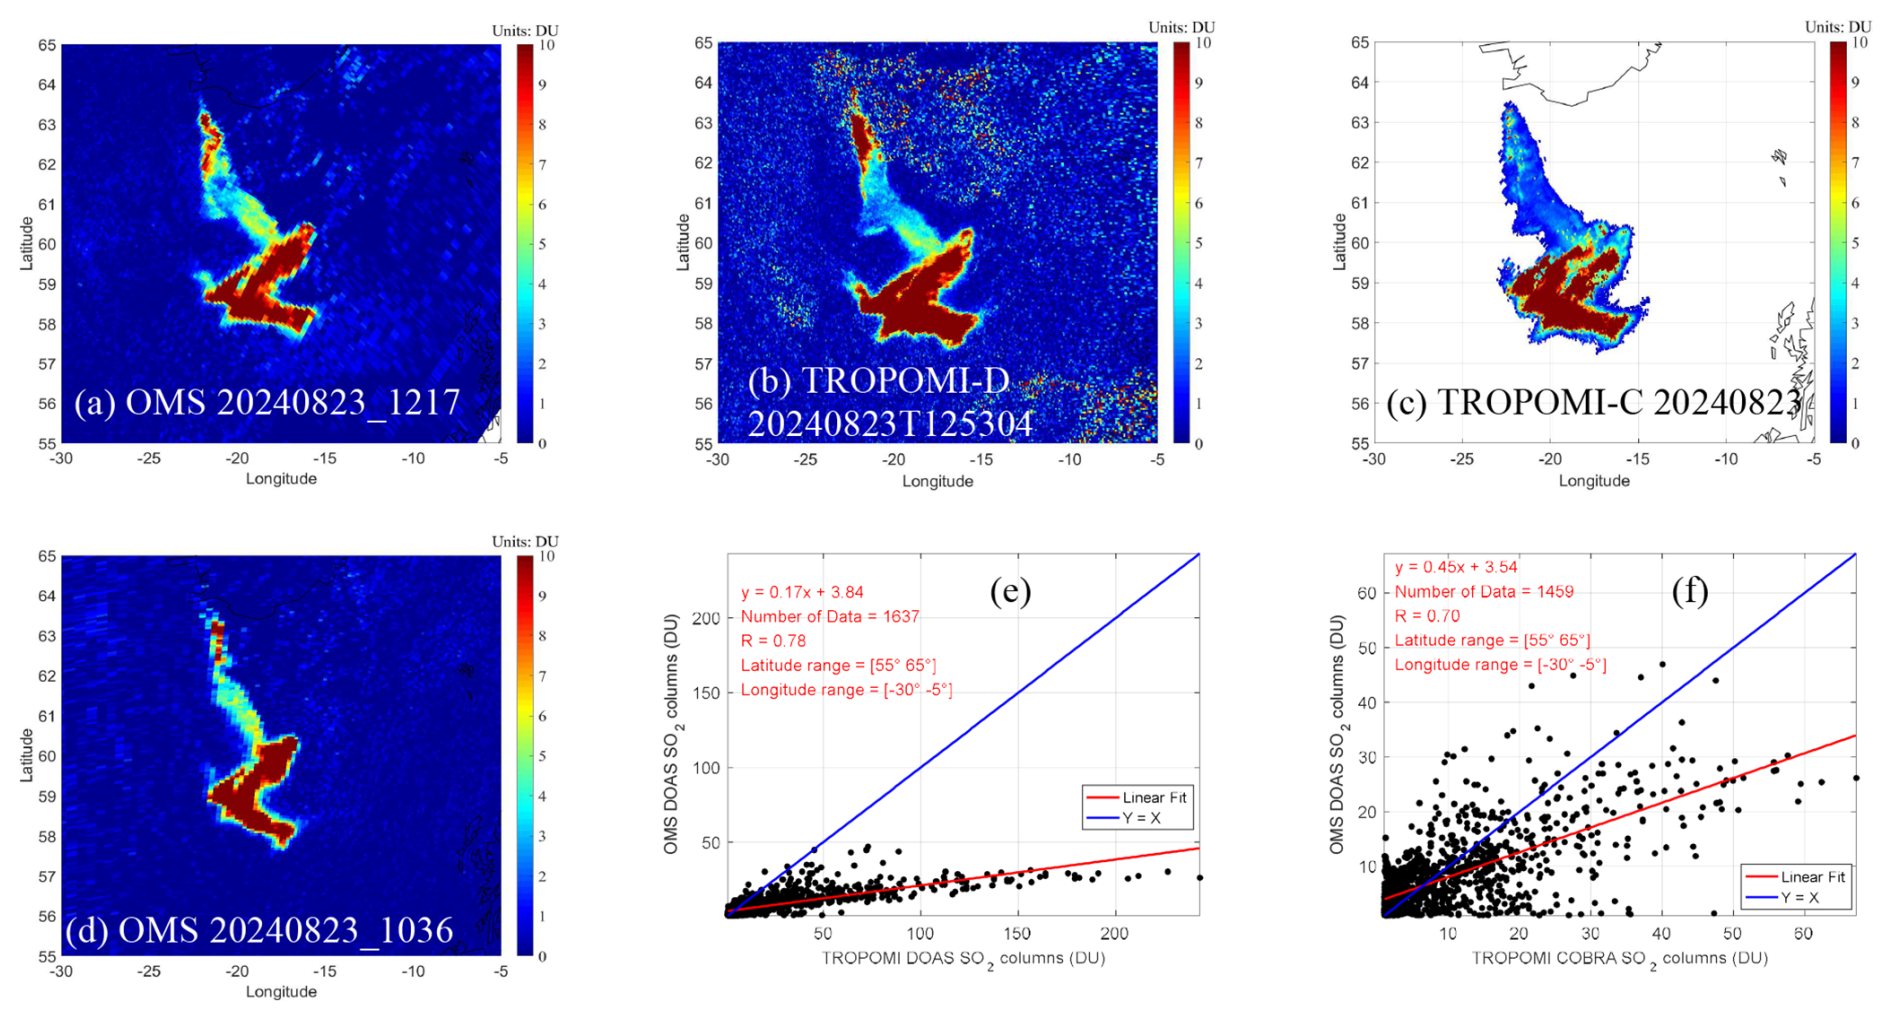
Figure 10SO2 retrievals over Sundhnúkur volcano on 23 August 2024. (a–d) Spatial distribution of FY-3F/OMS, TROPOMI DOAS and TROPOMI COBRA 7 km SO2 columns over Sundhnúkur volcano; (e, f) scatter plots of OMS 20240823_1217 and TROPOMI over Sundhnúkur volcano on 23 August 2024, where pixels with SO2 columns greater than 1 DU were selected and TROPOMI is resampled to the latitude-longitude grid of OMS. The missing pixels in panel (a) are the gap between the two OMS orbits, and the missing pixels in panel (c) are Nan values due to quality filtering applied to TROPOMI COBRA data.
As shown in Fig. 10, both OMS and TROPOMI successfully captured the high SO2 distribution around the Sundhnúkur volcano on 23 August 2024. The spatial distributions of OMS, TROPOMI DOAS and TROPOMI COBRA SO2 over Sundhnúkur volcano are similar, but differ at the edge of the SO2 plume. The correlation between OMS and TROPOMI DOAS reaches ∼ 0.78 over the Sundhnúkur volcano on 23 August 2024, while the correlation between OMS and TROPOMI COBRA reaches ∼ 0.70. However, when SO2 values exceed 50 DU, OMS SO2 retrievals are significantly lower than those of TROPOMI DOAS over the Sundhnúkur volcano region on 23 August 2024. Moreover, the relative biases between OMS and TROPOMI DOAS increase with increasing SO2 columns. This may be attributed to the reason that the OMS SO2 retrieval uses the 312–326 nm fitting window, where SO2 has strong absorption and is prone to saturation in the case of high SO2 concentrations, leading to an underestimation of SO2 columns. In order to mitigate the risk of saturation, TROPOMI DOAS uses two additional fitting windows (325–335 and 360–390 nm) (S5P-BIRA-L2-ATBD-400E) for volcanic eruption cases. In addition, the different overpass time of OMS and TROPOMI, along with varying volcanic eruption strength and meteorological conditions, may also be major contributors to the differences in SO2 columns of OMS and TROPOMI DOAS. The TROPOMI COBRA SO2 results retrieved from the 310.5–326 nm window are also lower than those from TROPOMI DOAS, but are more consistent with those from OMS.
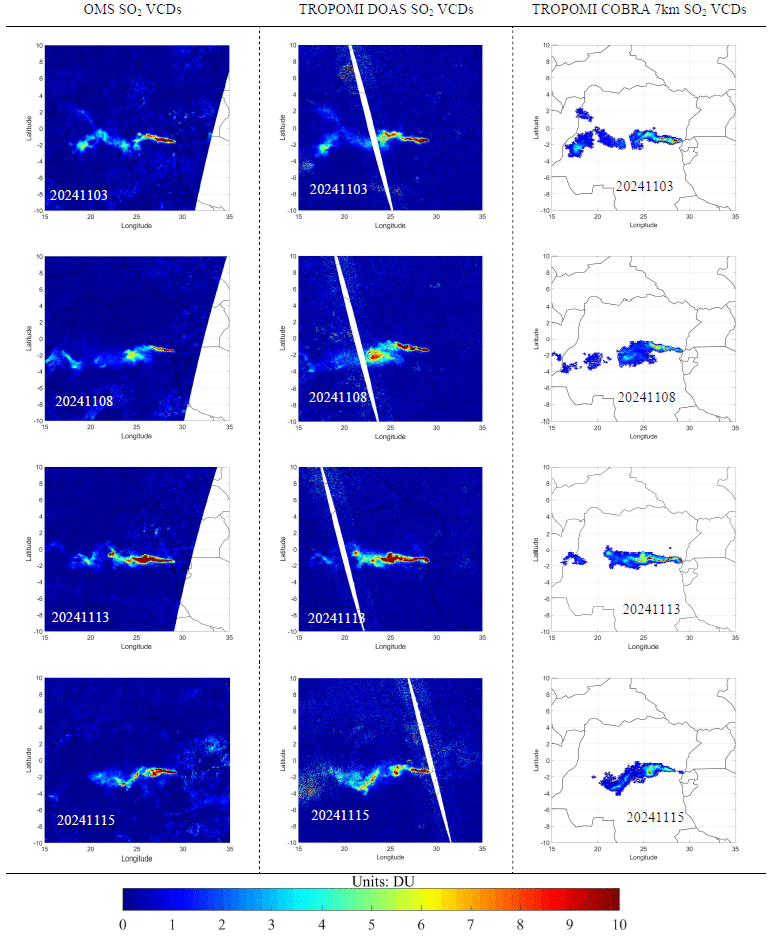
Figure 11SO2 retrievals of OMS and TROPOMI over the Nyamuragira volcano on 3, 8, 13, and 15 November 2024. From left to right, the panels show OMS SO2 VCDs, TROPOMI DOAS SO2 VCDs, and TROPOMI COBRA 7 km L3 SO2 VCDs. The missing pixels are the gap between the two orbits, or the Nan values due to quality filtering applied to TROPOMI COBRA data.
The Nyamuragira volcano (Region 4 in Fig. 5) is the second case study for comparing FY-3F/OMS SO2 with TROPOMI DOAS and TROPOMI COBRA 7 km SO2 results over a volcanic eruption. Nyamuragira is Africa's most active volcano and a high-potassium basaltic shield volcano located in the eastern part of the Democratic Republic of the Congo, approximately 25 km north of Lake Kivu and 13 km north-northwest of the Nyiragongo volcano (https://volcano.si.edu/; Global Volcanism Program, 2024b). Based on the Volcanic Explosivity Index (VEI) classification (Newhall and Self, 1982) and eruptive history reports of Nyamuragira from the Global Volcanism Program (GVP; Global Volcanism Program, 2024a), the magnitude of Nyamuragira's eruptions can generally be classified as small to moderate. According to the GVP weekly reports, Nyamuragira had continuing eruptive activities in November 2024. The spatial distribution maps (Fig. 11) show that OMS, TROPOMI DOAS, and TROPOMI COBRA results clearly detected the high-concentration SO2 plume from the Nyamuragira eruption, although the shape of the SO2 plume differs due to differences in overpass time, observation angles and retrieval strategies. Compared with OMS and TROPOMI DOAS, TROPOMI COBRA shows lower SO2 columns over the Nyamuragira volcano. Although OMS and TROPOMI DOAS exhibit more comparable SO2 levels, the quantitative agreement between them is weaker in scatter plot comparisons (not shown). This is primarily because Nyamuragira volcano is located near the equator, unlike the high-latitude Sundhnúkur volcano, making it difficult to identify OMS and TROPOMI orbits with closely matched observation times. Differences in overpass times lead to shifts in plume position, which hampers direct pixel-to-pixel quantitative comparisons over the Nyamuragira region.
Overall, from the above comparisons between FY-3F/OMS SO2 and TROPOMI DOAS and TROPOMI COBRA 7 km SO2 results, we can see that FY-3F/OMS has the capability to monitor volcanic activities, and with high spatial resolution of 7 km × 7 km and a local overpass time different from TROPOMI, FY-3F/OMS can contribute to a more effective satellite SO2 product for the continuous monitoring of global volcanic activity.
4.3 Comparison over anthropogenic emissions
Compared to the monitoring of high SO2 emissions from natural sources such as volcanoes, the monitoring of anthropogenic SO2 emissions from satellite observations is more challenging. The atmospheric SO2 from anthropogenic emissions is generally much lower compared to that of volcanic eruptions, and is primarily concentrated near the surface. The sensitivity of satellite measurements in the UV band near the surface is relatively low because solar UV radiation is partially absorbed and scattered by atmospheric components such as air, aerosols, and clouds during its transmission. As a result, the weakened UV radiation reaching the boundary layer reduces the sensitivity of satellite instruments to PBL SO2 and makes it harder to distinguish SO2 signals from background noise, especially at large solar zenith and satellite viewing angles.
Based on the SO2 emission sources observed by TROPOMI in 2018 (Fioletov et al., 2020), we selected three representative regions – the Persian Gulf (oil and gas exploration, Region 5 in Fig. 5), Norilsk (smelters, Region 6 in Fig. 5), and Eastern India (power plants, Region 7 in Fig. 5) – to compare three SO2 column products: OMS SO2, TROPOMI DOAS SO2, and TROPOMI COBRA PBL SO2. These comparisons aim at evaluating the capability of OMS in monitoring SO2 emissions from anthropogenic sources. Similar to the cases of volcanic eruptions, we used all pixels from the TROPOMI DOAS SO2 product instead of applying QA > 0.5 to filter the high-quality pixels because the QA > 0.5 filter would remove many high SO2 pixels over anthropogenic emission regions, especially over snow/ice surfaces such as Norilsk. Meanwhile, comparison results for the Persian Gulf and Eastern India regions during the study period show negligible differences whether the QA > 0.5 filter is applied or not (not shown here). In the case of anthropogenic emissions, TROPOMI COBRA L3 grid PBL SO2 products were used for comparison instead of the COBRA 7 km SO2 products.
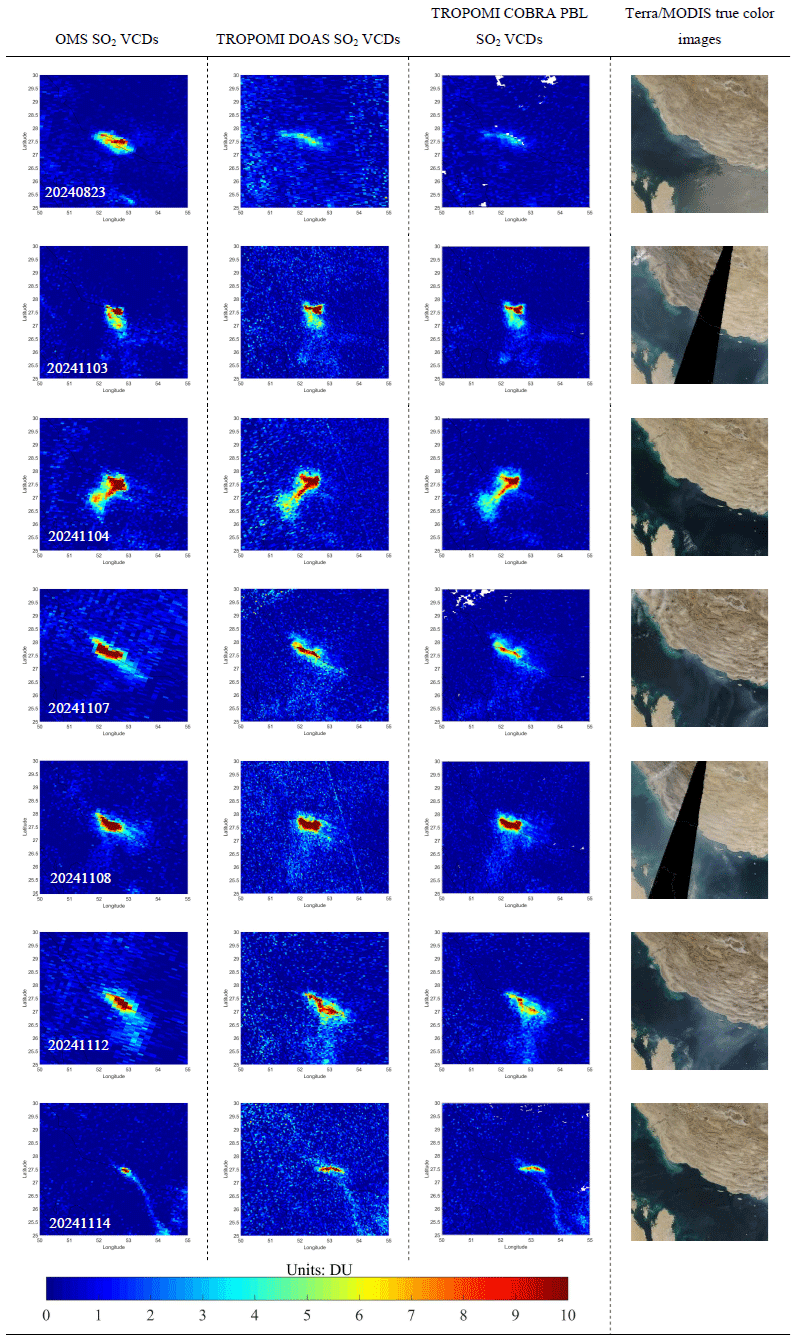
Figure 12SO2 retrievals of OMS and TROPOMI over the Persian Gulf on 23 August 2024, and 3, 4, 7, 8, 12, and 14 November 2024. From left to right, the panels show OMS SO2 VCDs, TROPOMI DOAS SO2, TROPOMI COBRA PBL L3 SO2, and Terra/MODIS true color images. Each row corresponds to the same observation date. The missing pixels are Nan values due to quality filtering applied to TROPOMI COBRA data.
The Persian Gulf was selected due to its high anthropogenic emissions, including SO2 and NO2, primarily from oil and gas extraction and refining industries (Mardani et al., 2025; Krotkov et al., 2016). This region has a higher probability of clear-sky days and is located in the low-latitude zone, which means relatively high SNR for satellite observations. As shown in Fig. 12, OMS effectively detects high SO2 values over the Persian Gulf while maintaining a lower background noise. The variability of enhanced SO2 columns from OMS are generally consistent with those from TROPOMI DOAS and TROPOMI COBRA. Differences are mainly manifested in magnitude and local-scale variability, which may be attributed to differences in satellite overpass time, retrieval algorithms, AMF, and spatial resolution. Based on the spatiotemporal distributions shown in Fig. 12, three representative days with relatively large and small differences (23 August and 4 and 8 November 2024) were selected for scatter plot comparisons among the three datasets (OMS SO2, TROPOMI DOAS SO2, and TROPOMI COBRA PBL SO2). Scatter plots (Fig. 13) comparing OMS SO2 with TROPOMI DOAS and TROPOMI COBRA SO2 over the Persian Gulf show that: (1) Both TROPOMI DOAS and TROPOMI COBRA SO2 products exhibit clear positive correlations with OMS, with correlation coefficients (R) ranging from ∼ 0.63 to 0.91. (2) The level of agreement among the three datasets varies with time. On 4 and 8 November, OMS shows good consistency with both TROPOMI products, with regression slopes close to unity (DOAS: slopes ≈ 1.00 and 0.98, R = 0.82 and 0.91; COBRA: slopes ≈ 0.93 and 0.96, R = 0.82 and 0.83), indicating good agreement under anthropogenic SO2 conditions. However, on 23 August OMS retrieves higher SO2 columns over the Persian Gulf emission hotspot region than both TROPOMI DOAS and COBRA, with regression slopes of ∼ 1.61 and 2.14, respectively. This discrepancy may be primarily attributed to the relatively low AMFs calculated using GEOS-CF profiles and OMI surface reflectance climatology over these high-SO2 regions. As shown in Fig. 14, although the corresponding OMS SCD results on 23 August is relatively low, the low AMFs over region with high SCDs lead to enhanced VCD (VCD = SCD/AMF), resulting in higher OMS SO2 VCDs over these high-SO2 regions on 23 August. (3) For pixels with low SO2 columns, the correlations among the three datasets are relatively weak, likely due to larger retrieval uncertainties associated with random noise and reduced sensitivity at low SO2 conditions. It should be noted that Fig. 13 does not present results for consecutive days. This is mainly due to the unavailability of GEOS-CF data for some days, the presence of a large number of pixels located near the satellite swath edges, and/or extensive cloud coverage indicated by the Terra/MODIS true color images, which limit the reliability of the comparison among the three SO2 datasets. Similar limitations also exist in the India case studies presented later.
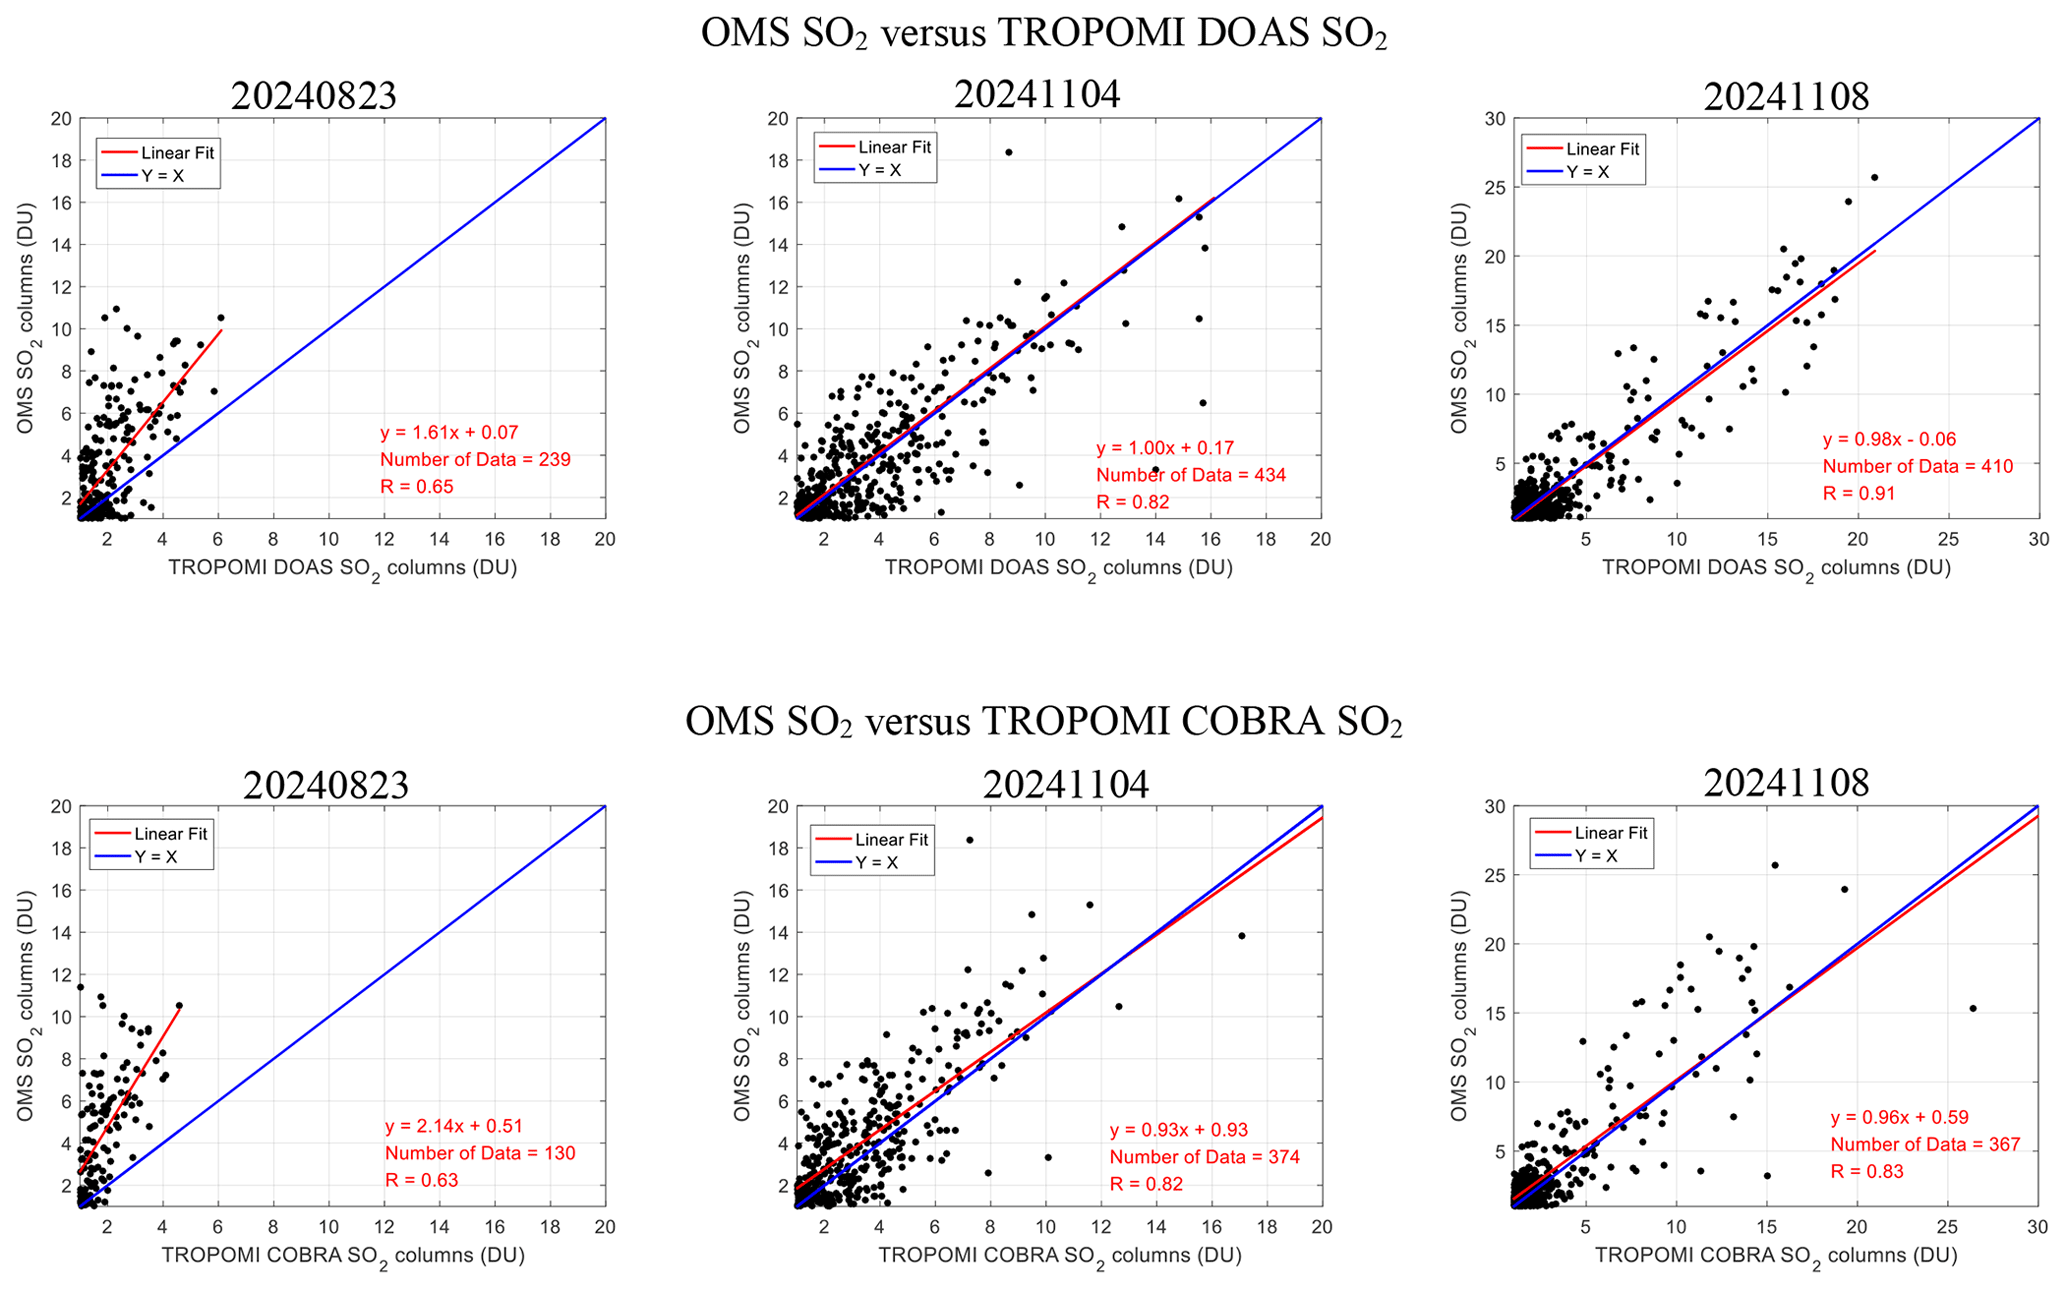
Figure 13Scatter plots of FY-3F/OMS, TROPOMI DOAS and TROPOMI COBRA PBL SO2 over the Persian Gulf on 23 August and 4 and 8 November 2024. Pixels with SO2 columns greater than 1 DU were selected, and TROPOMI data were resampled to the latitude-longitude grid of OMS. Data points in the scatter plots were selected from latitude 25–30° N and longitude 50–55° E.
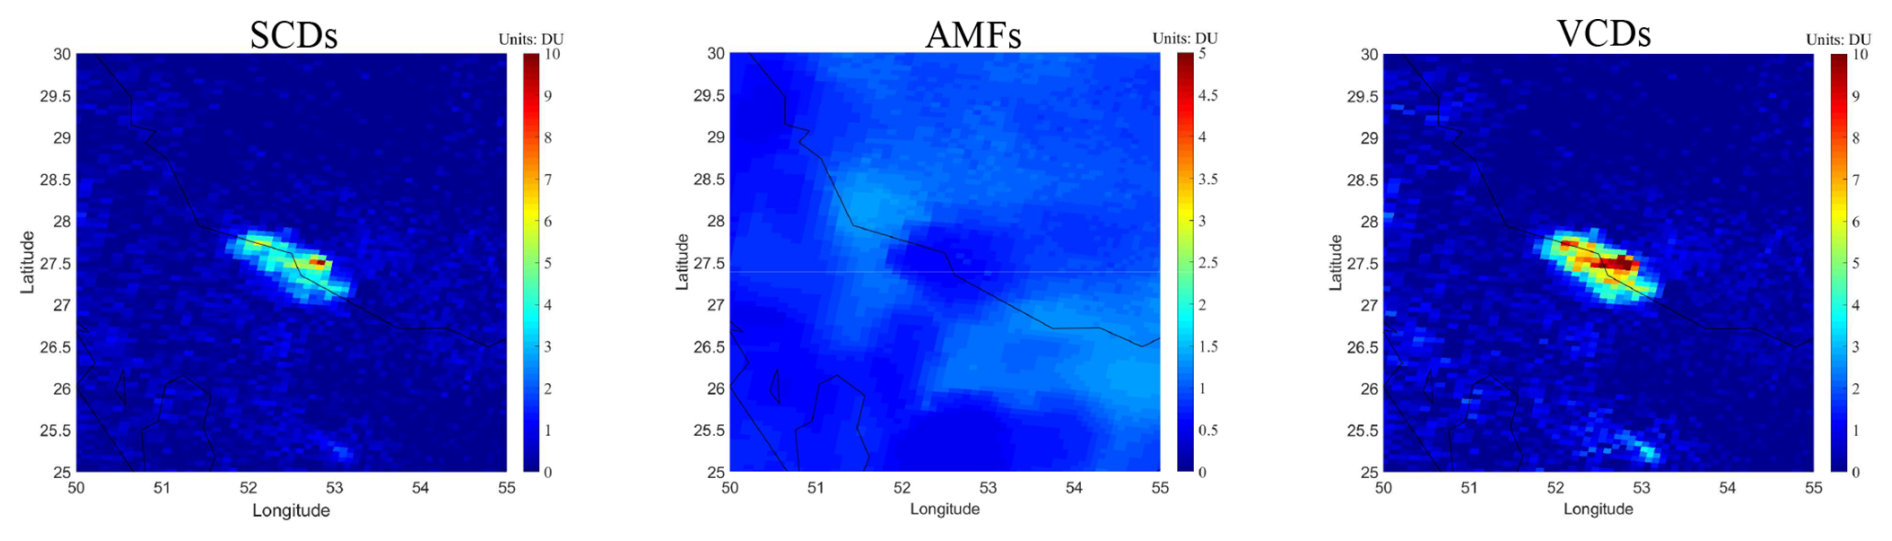
Figure 14Spatial distribution of FY-3F/OMS SO2 SCDs, AMFs, and VCDs over the Persian Gulf on 23 August 2024. VCDs = SCDs/AMFs.
Norilsk in northern Russia, located within the Arctic Circle, is one of the world's biggest sources of anthropogenic SO2 emissions due to its massive nickel and metal smelting industry (Bauduin et al., 2014). With winter lasting 6 to 9 months and snow covering the ground for most of the year, the region's low temperatures and atmospheric stability hinder pollutant dispersion, leading to persistently high SO2 concentrations over Norilsk. Large SO2 emissions cause severe air pollution and acid rain, which make Norilsk one of the most polluted cities in the world. On 16 May 2024, the orbits of OMS and TROPOMI with close local overpass times over Norilsk were selected to minimize the influence of emission variability and meteorological differences on the comparisons of SO2 columns. As shown in Fig. 15, both OMS and TROPOMI were able to detect the high SO2 plumes over the Norilsk region, with similar spatial patterns and transport features. The SO2 columns from OMS and TROPOMI DOAS show strong correlations, with correlation coefficients ranging from 0.80 to 0.85 over the Norilsk region. However, OMS SO2 VCD retrievals are lower than those from TROPOMI DOAS, with the average relative biases (|OMS − TROPOMI| TROPOMI) of the data from the Norilsk region in OMS orbit 20240516_0334 being approximately 38 % (excluding SO2 columns smaller than 1 DU), and for OMS orbit 20240516_0516 being approximately 33 % (applying the same filtering criteria). These differences may be related to differences in AMF strategy, retrieval algorithm, and spatial resolution. In contrast, the TROPOMI COBRA PBL L3 products exhibits large data gaps due to quality filtering over the Norilsk region, limiting its applicability over Norilsk for this case. In addition, the Terra/MODIS true color image from the same day shows the presence of snow cover over the Norilsk region, highlighting OMS's capability to capture anthropogenic SO2 emissions in high-latitude regions within the Arctic Circle.
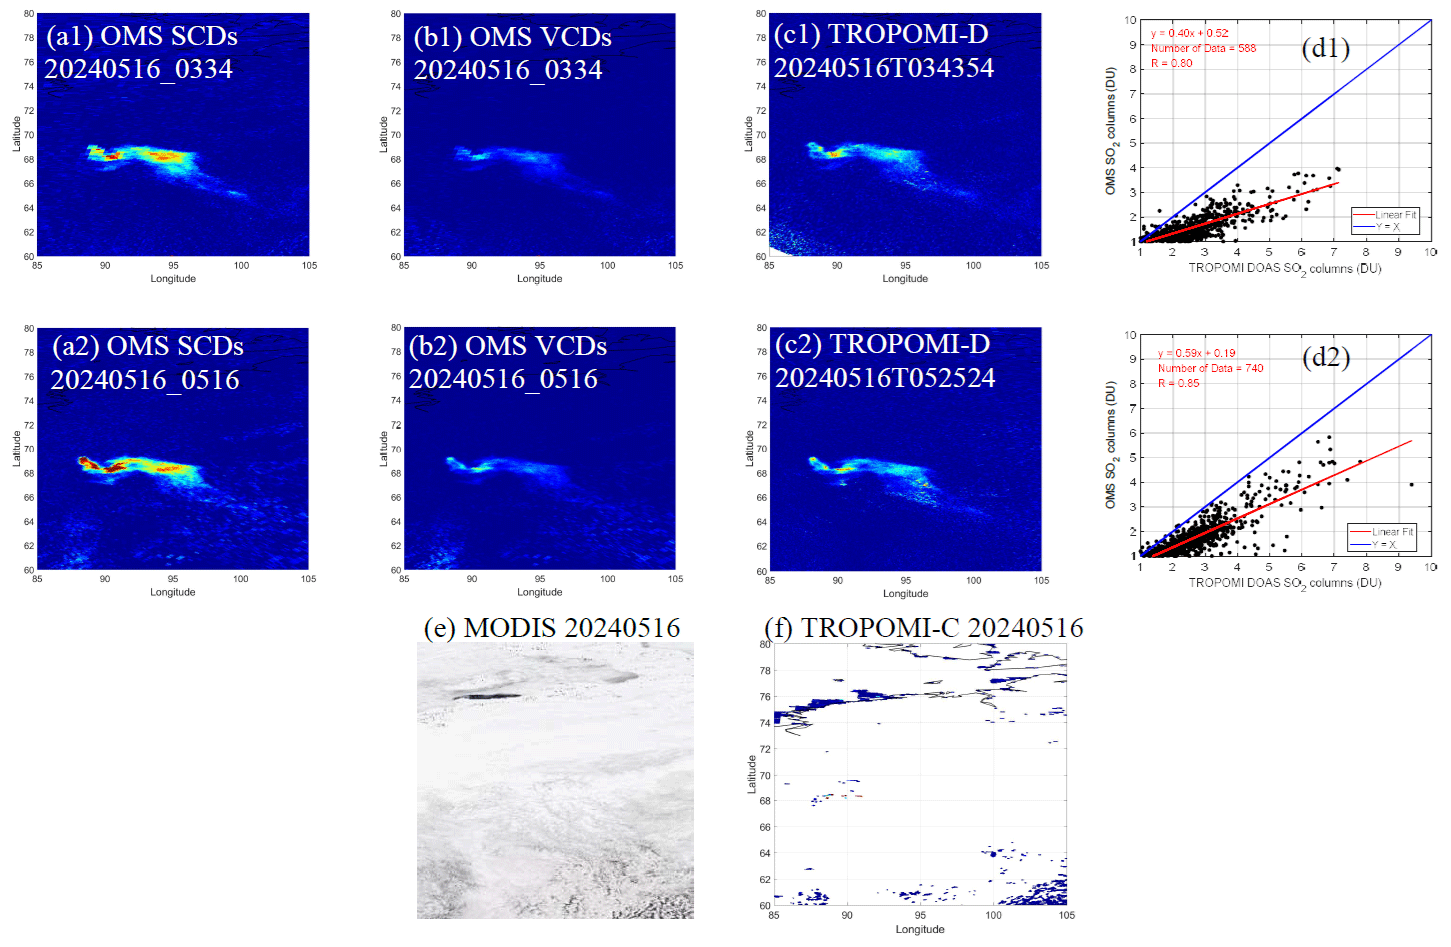
Figure 15SO2 retrievals over Norilsk on 16 May 2024. (a1–c2) Spatial distribution of FY-3F/OMS and TROPOMI DOAS SO2 columns over Norilsk; (d1–d2) scatter plots of OMS and TROPOMI DOAS SO2 columns over Norilsk on 16 May 2024, where pixels with SO2 columns greater than 1 DU were selected within 60–80° N and 85–105° E, and TROPOMI were resampled to the latitude-longitude grid of OMS; (e) true Color Image of Norilsk from Terra/MODIS on 16 May 2024; (f) SO2 columns from TROPOMI COBRA PBL over Norilsk on 16 May 2024. Note that the missing pixels in panel (f) are due to quality filtering applied to TROPOMI COBRA data.
India's SO2 emissions are mainly from coal fired power plants, transportation, and agricultural activities, which are growing rapidly, increasing by more than 100 % from 2005 to 2015 (Krotkov et al., 2016; Kuttippurath et al., 2022). Eastern India, in particular, is a major hotspot due to the dense distribution of coal-based power plants and industrial facilities. As shown in Fig. 16, OMS successfully captured strong SO2 plumes over Eastern India on 4, 5, 8, and 9 November 2024, with spatial patterns that are generally consistent with those retrieved by TROPOMI DOAS and TROPOMI COBRA. Figure 16 also includes Terra/MODIS true color images for the same days, which indicate relatively low cloud coverage over Eastern India, thereby minimizing the influence of clouds on the intercomparison of SO2 retrievals. Despite the overall consistency in spatial distribution, OMS SO2 retrievals over regions with strong SO2 emissions are higher than those from TROPOMI DOAS and TROPOMI COBRA on 5, 8, and 9 November 2024. This overestimation is likely related to uncertainties in AMF calculations associated with the use of GEOS-CF SO2 vertical profiles, OMI surface reflectance climatology, and aerosol loading over Eastern India. To further improve the accuracy of OMS SO2 retrievals over India, future work will focus on incorporating more representative local SO2 vertical profiles and more accurate surface reflectance databases.
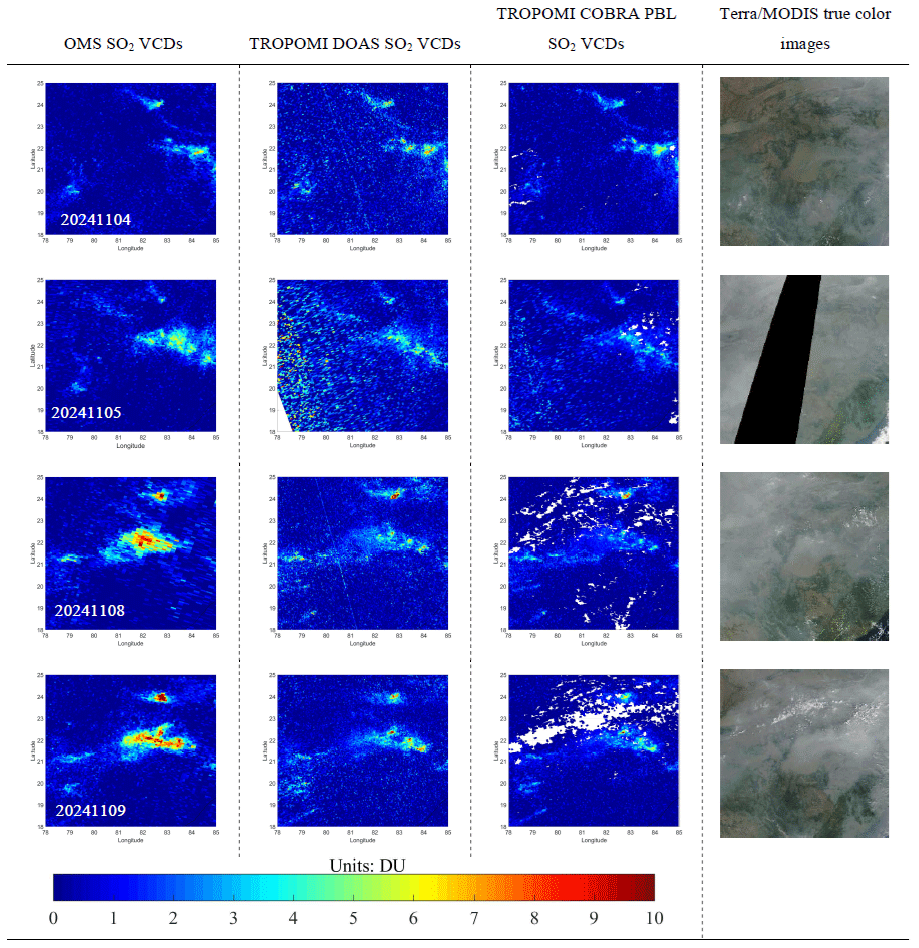
Figure 16SO2 retrievals of OMS and TROPOMI over Eastern India on 4, 5, 8, and 9 November 2024. From left to right, the panels show OMS SO2 VCDs, TROPOMI DOAS SO2, TROPOMI COBRA PBL L3 SO2, and Terra/MODIS true color images. Each row corresponds to the same observation date. The missing pixels are the gap between the two orbits, or the Nan values due to quality filtering applied to TROPOMI COBRA data.
Overall, the comparisons over the Persian Gulf, Norilsk, and Eastern India demonstrate that OMS SO2 retrievals show good spatial consistency and strong correlations with TROPOMI DOAS and TROPOMI COBRA SO2 products; OMS is capable of effectively distinguishing intense anthropogenic SO2 signals from background noises. Owing to differences in local overpass times, OMS can provide effective complementary data to fill the monitoring gaps in TROPOMI SO2 products.
The main error sources in the OMS DOAS SO2 retrieval include instrument-related errors, DOAS SCD spectral fitting errors, AMF uncertainties, and the residual error after background offset correction (see also, e.g., Lee et al., 2009; Theys et al., 2017). Instrument-related errors include spectral and radiometric calibration errors, degradation of the instrument, stray light contamination and non-uniformity of the diffuser plate, which introduce systematic biases in both radiance and irradiance measurements. DOAS SCD spectral fitting errors include uncertainties in the absorption cross-sections of SO2 and O3, interference from strong O3 absorption, the Ring effect caused by inelastic scattering, and the selection of the polynomial order in spectral fitting. The AMF, which is crucial for the accuracy of OMS SO2 retrieval, is mainly affected by the uncertainties in surface reflectance, SO2 vertical profile shape, wavelength dependence, and terrain height. Moreover, the background offset correction may introduce additional uncertainties, especially in high SO2 areas.
This section is organized as follows. First, the major error sources affecting the SCD retrieval are listed, and the quantitative uncertainty of the OMS SO2 SCD retrieval is provided. Second, the main error sources influencing the AMF are analysed, and the AMF uncertainty associated with each error component is quantitatively estimated. Third, the residual errors after background offset correction are evaluated. Finally, based on the above results, overall quantitative estimates of the uncertainty of OMS SO2 retrieval are presented.
5.1 Errors in SCD
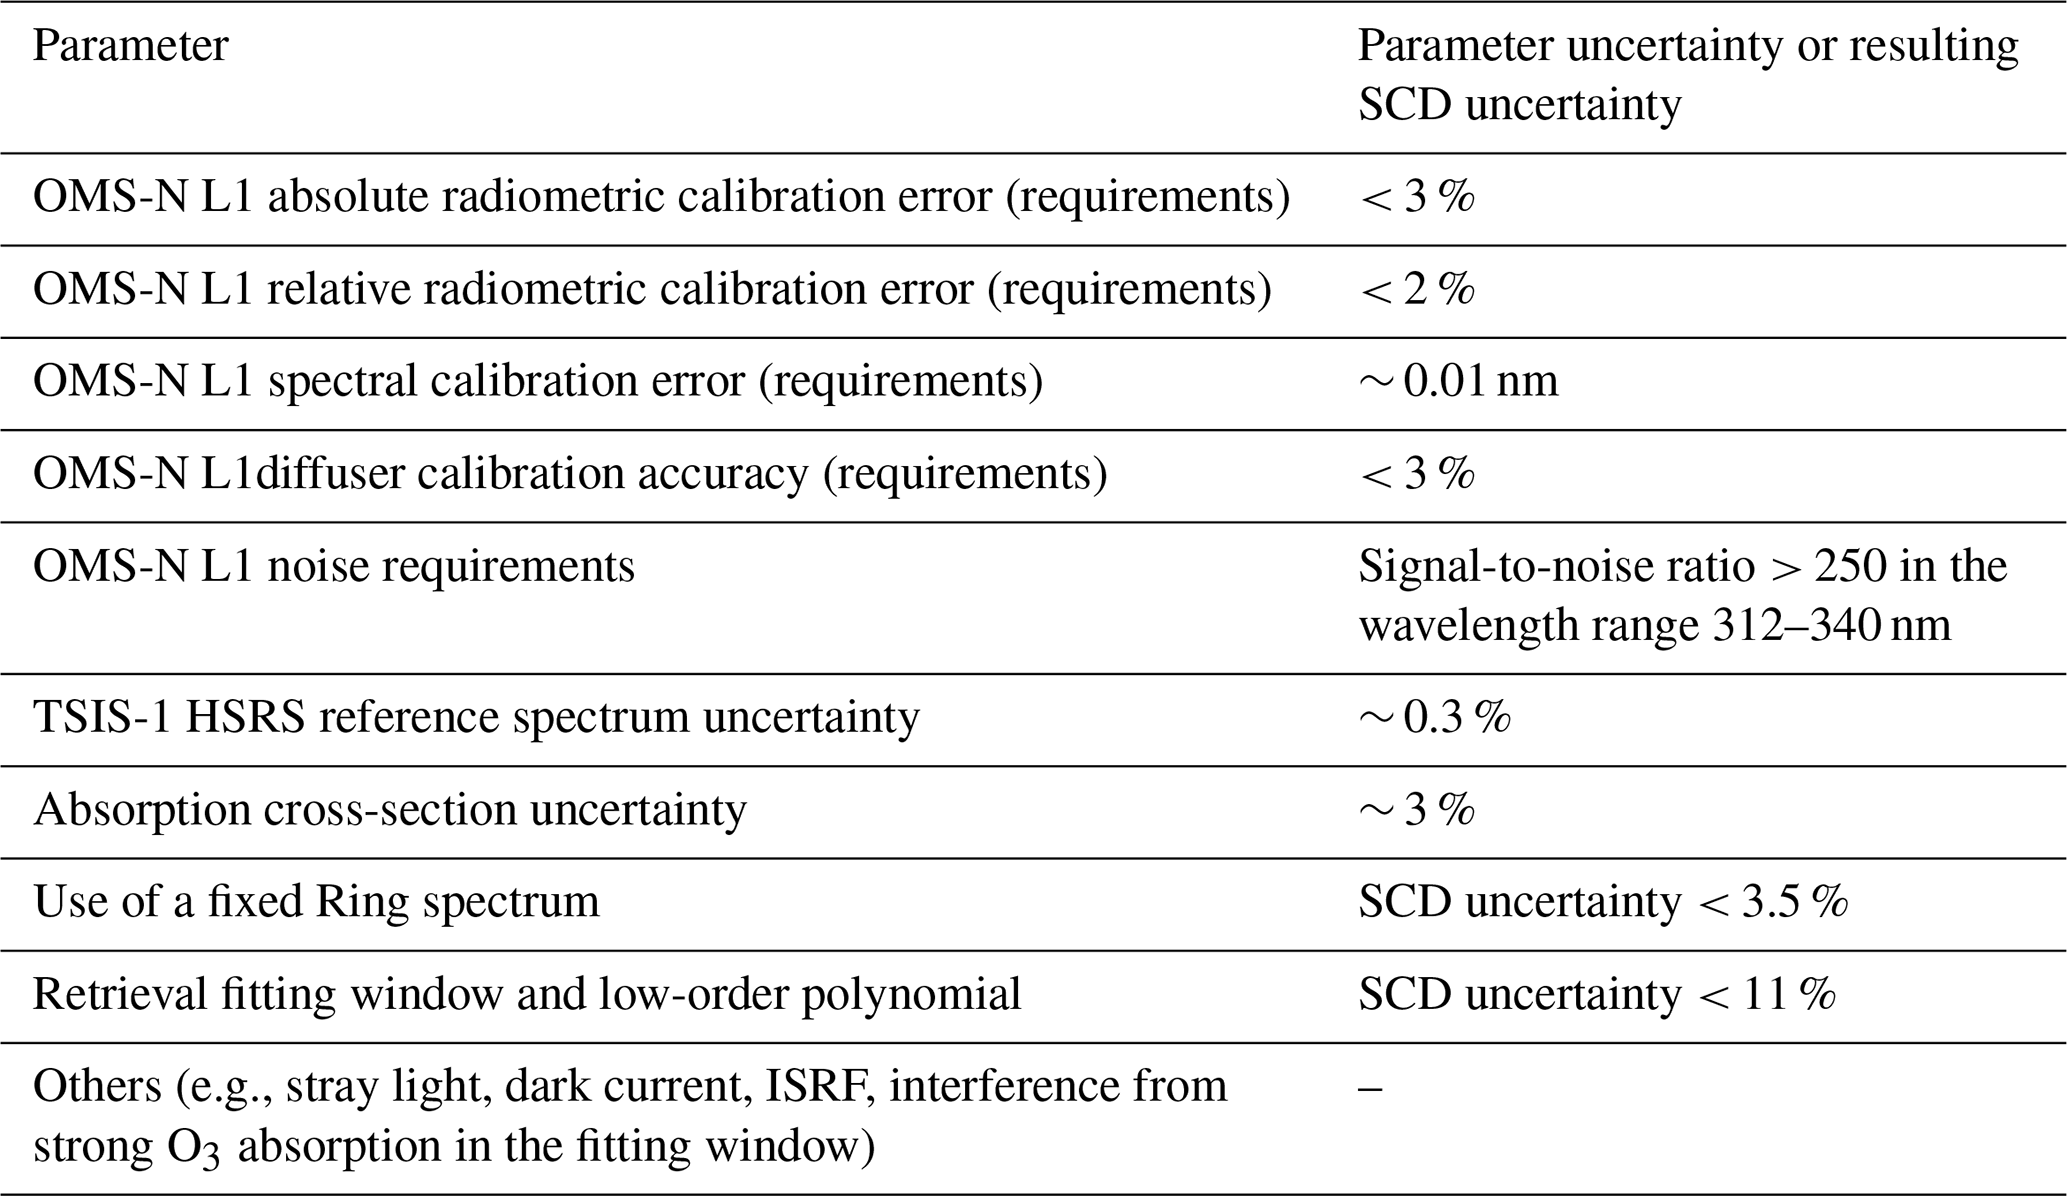
The main error sources affecting OMS SO2 SCD primarily include instrument-related noise and algorithm settings in spectral fitting (Table 4). These error sources are difficult to separate, making it challenging to quantitatively estimate how each individual error source contributes to the SCD retrieval uncertainty. Although OMS L1 provides specified performance requirements before launch, on-orbit measurements indicate that the OMS L1 errors deviate from the planned specifications for certain parameters. At the time of writing, the updated OMS L1 errors have not yet been obtained. Therefore, in this study, we do not report the contribution of each individual error source to the final SCD uncertainty. Instead, we use the DOAS Spectral Fitting Error (SFE) to derive the overall SCD uncertainty under the current OMS L1 instrument status and DOAS settings.
Table 4Main error sources affecting the OMS SO2 SCD retrieval.
5.1.1 Error source: instrument-related errors
The errors in irradiance and radiance measurements are the main instrument-related error sources affecting OMS SO2 SCD retrievals, leading to systematic biases such as along-track stripes at specific viewing angles and cross-track asymmetry in SO2 SCD retrievals (Boersma et al., 2004). To reduce errors related to irradiance non-uniformity, the TSIS-1 HSRS hybrid solar reference spectrum was used instead of the OMS irradiance measurements to mitigate the effects of viewing angle dependence and instrument degradation on OMS SO2 retrieval. Radiance measurement errors mainly depend on viewing angle, wavelength, and optical degradation. The viewing angle dependence, primarily caused by calibration inaccuracies, results in unequal responses across different cross-track positions. These biases can be partially corrected using background offset correction but cannot be fully eliminated. With increasing optical degradation over the OMS on-orbit lifetime, additional errors may be introduced into the OMS radiance spectra, thereby leading to larger uncertainties of OMS SO2 SCD retrievals.
5.1.2 Error source: absorption cross-sections
The temperature dependence and uncertainties of absorption cross-section spectra is one of the error sources which affect the accuracy of OMS SCD retrieval. The OMS SO2 SCD retrieval utilizes the Bogumil SO2 and O3 absorption cross-section spectra at constant 273 and 223 K (Bogumil et al., 2003), which is in general not representative of the effective temperature corresponding to the SO2 vertical profile. The differences in SCD retrievals caused by temperature-dependent absorption cross-sections increase with increasing SO2 columns (Yan et al., 2014). For example, compared to SCD retrievals using the 203 K absorption cross-sections, the differences in SO2 SCDs can reach a maximum of ∼ 25 DU (with SCDs around 60 DU). In addition to the temperature dependence, the uncertainties of the 273 K SO2 and 223 K O3 absorption cross-sections from Bogumil et al. (2003) are approximately 3.0 %, which may result in ∼ 6 % systematic errors in the retrieved SO2 SCD within the 312–326 nm fitting window (Vandaele et al., 2009). Future work will incorporate accurate temperature correction in OMS SO2 retrievals.
5.1.3 Error source: Ring effect
In the UV wavelength band, the Ring effect is a non-negligible part of the DOAS SCD fitting process. Taking the OMS 20240823_1036 orbit as an example, after including the Ring spectrum into the DOAS retrieval, the spectral fitting RMSE decreases by approximately 0.004 to 0.01. As shown in Fig. 17, the Ring spectrum varies with SZA, VZA, O3 column and AS within the 310–330 nm wavelength range. The variation of the Ring spectrum with RAA is negligible and is therefore not presented. The mean percentage change in the Ring spectrum is approximately 27.67 % (absolute deviation: 0.0025) as the O3 column varies from 175 to 575 DU, 47.34 % (absolute deviation: 0.0048) as the AS varies from 0 to 1, 24.18 % (absolute deviation: 0.0021) as the VZA varies from 0 to 75°, and 45.29 % (absolute deviation: 0.0047) as the SZA varies from 0 to 80°.
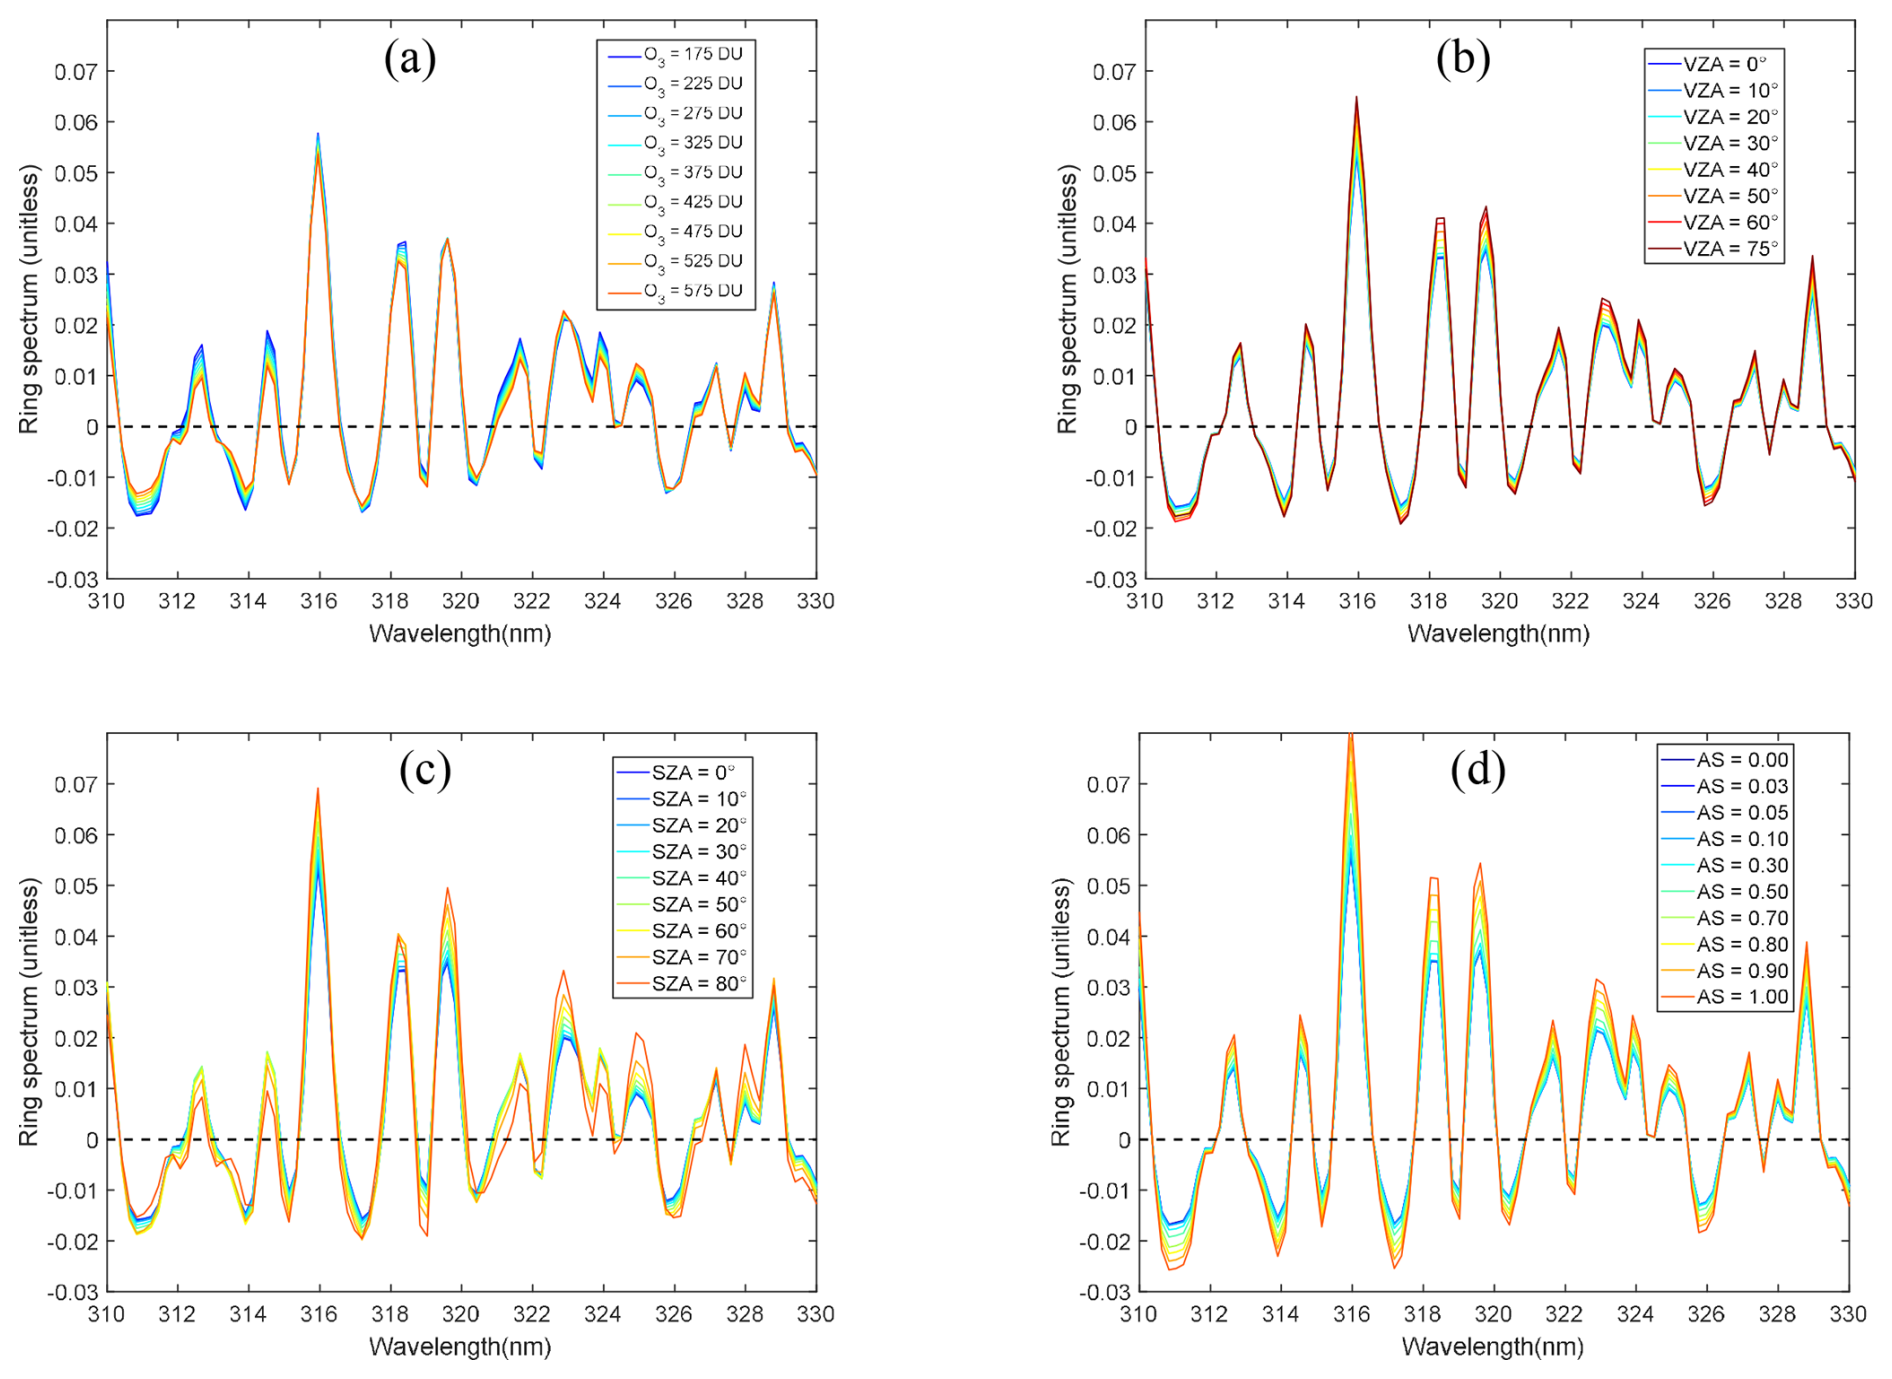
Figure 17Variation of Ring spectrum with O3, VZA, SZA and surface reflectivity (AS). Ring spectrum was calculated using the SCIATRAN model, convolved with the OMS ISRF. The default SCIATRAN settings for the Ring spectrum are as follows: wavelength step = 0.2 nm, clear sky, HS = 0 km, O3 = 275 DU, AS = 0.05, SZA = 30°, VZA = 0°, RAA = 0°.
However, in this study, a fixed Ring spectrum calculated from SCIATRAN was used to retrieve SO2 for all OMS pixels. The reason is that although the Ring spectrum varies significantly with SZA, VZA, O3 column, and AS within the 310–330 nm wavelength range, the impact of Ring spectrum variability on SO2 retrievals is relatively small (< 3 % or less) due to the weak correlation between the Ring spectrum and the satellite TOA reflectance, especially in the case of volcanic eruptions with high SO2 concentrations. Moreover, using Ring spectra that vary with SZA, VZA, O3 column, and AS within the 310–330 nm wavelength range require constructing a large lookup table, which would significantly increase computational cost for OMS SO2 column retrievals.
5.1.4 Error source: others
The OMS SO2 SCD retrieval is also influenced by the following factors: (1) Interference from strong O3 absorption in the retrieval fitting window. Due to the overlap of O3 and SO2 absorption in the UV wavelength, the strong O3 absorption signal may overshadow the SO2 absorption information, leading to errors in SO2 SCD retrievals. (2) Selection of fitting window. Different retrieval fitting windows have varying SO2 absorption features, O3 absorption interference, and SNR. The scheme using a single retrieval fitting window of 312–326 nm for OMS SO2 SCD retrieval may lead to the underestimation of SO2 columns in the cases of volcanic eruptions. (3) Low-order polynomial. In DOAS retrievals, low-order polynomials are used to remove slow-varying components, such as aerosol scattering and broad spectral features of absorption. In this study, a third-order polynomial was used for SCD spectral fitting. The errors introduced by this polynomial will need to be quantified.
5.1.5 Total SCD uncertainties
Taking a volcanic eruption orbit as an example (wide range of measured SCDs; orbit OMS 20240823_1036), two plots of the SCD fitting RMSE and SFE are presented. As shown in Fig. 18, both RMSE and SCD uncertainty are relatively large and exhibit pronounced striping patterns. At the right edge of the swath, the SCD uncertainty exceeds 8 DU, while at the left edge it is approximately 5–6 DU. In the middle of the swath, the SCD uncertainty is about 3–5 DU. These large SCD uncertainties are mainly associated with instrument radiometric and spectral calibration errors. Although background offset corrections can substantially reduce striping patterns in the SO2 columns, separating the contributions of instrument-related noise and spectral fitting errors to the overall SCD uncertainty remains challenging. Ongoing improvements to the OMS L1 data are expected to reduce striping and calibration asymmetries, thereby improving the accuracy of SO2 SCD retrievals.
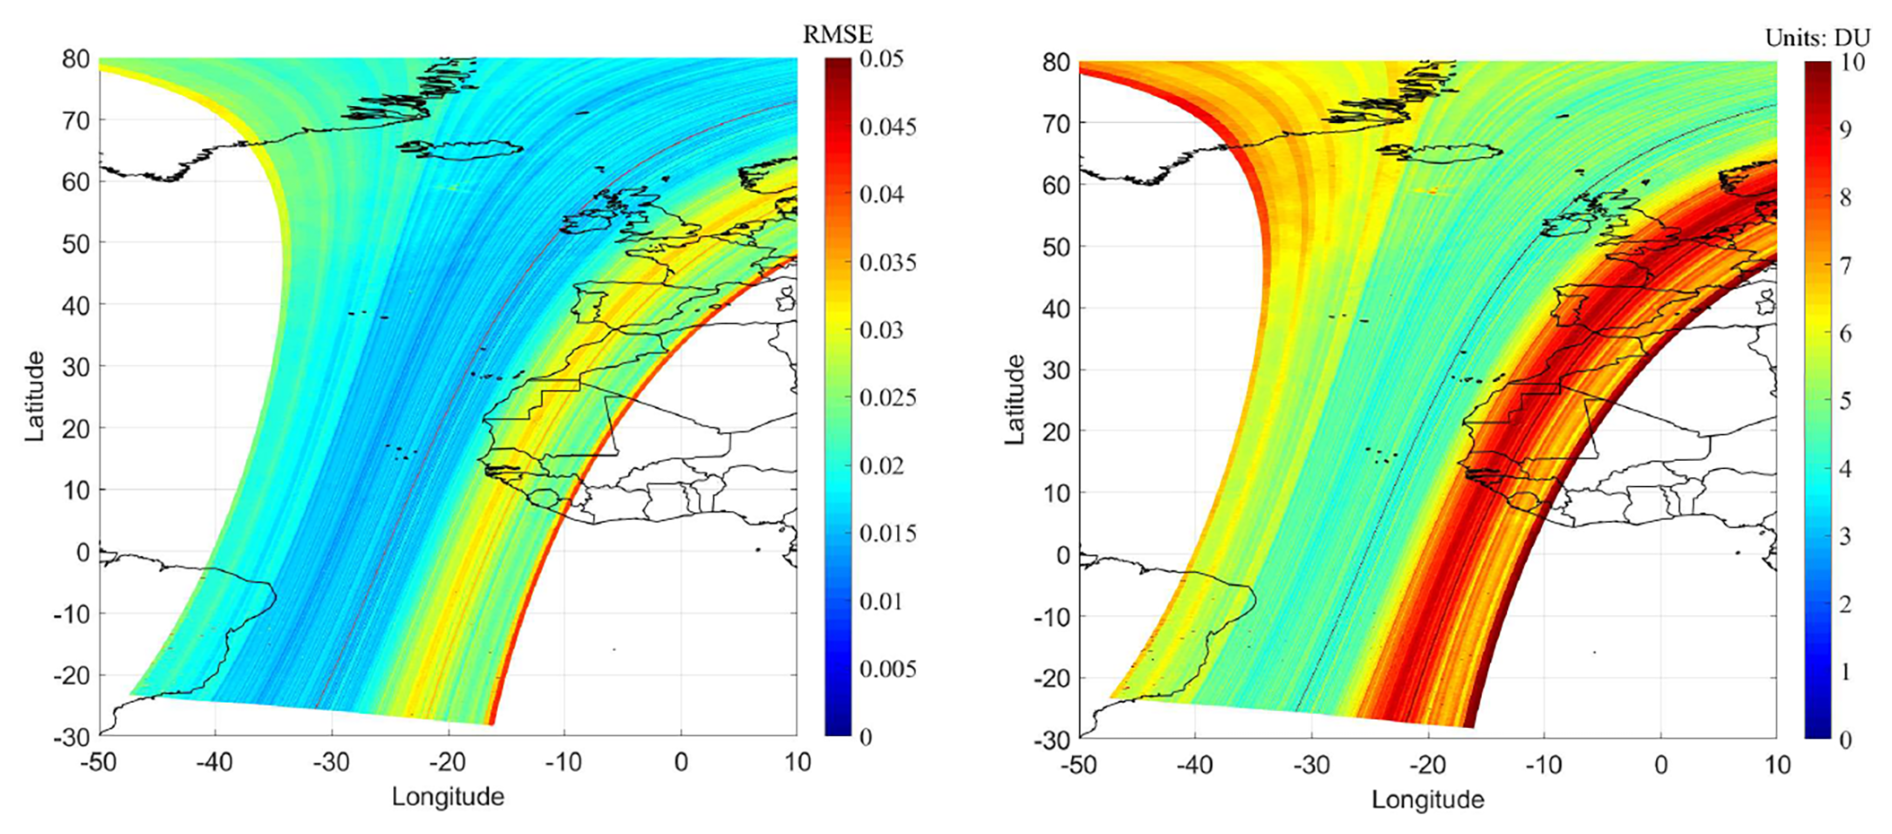
Figure 18RMSE and SFE of OMS SO2 SCDs for OMS orbit 20240823_1036.
5.2 Errors in AMF
AMF uncertainty is a primary source of the uncertainty of OMS SO2 VCD retrieval. In this study, OMS SO2 AMFs were calculated using SO2 vertical profiles from GEOS-CF (Keller et al., 2021) and Box-AMFs derived from the SCIATRAN model (Chen et al., 2009; Wagner et al., 2007; Palmer et al., 2001; Boersma et al., 2004; see Sect. 3.4 for more information). The uncertainty in OMS SO2 AMF is mainly associated with SZA, VZA, RAA, AS, HS, O3 column, the shape of SO2 vertical profile (S(z)), and wavelength (λ) dependence (Lee et al., 2009). It should be noted that the clouds and aerosols were not considered in the OMS SO2 AMF calculation. Therefore, AMF uncertainties associated with clouds and aerosols were not included in the present AMF error analysis.
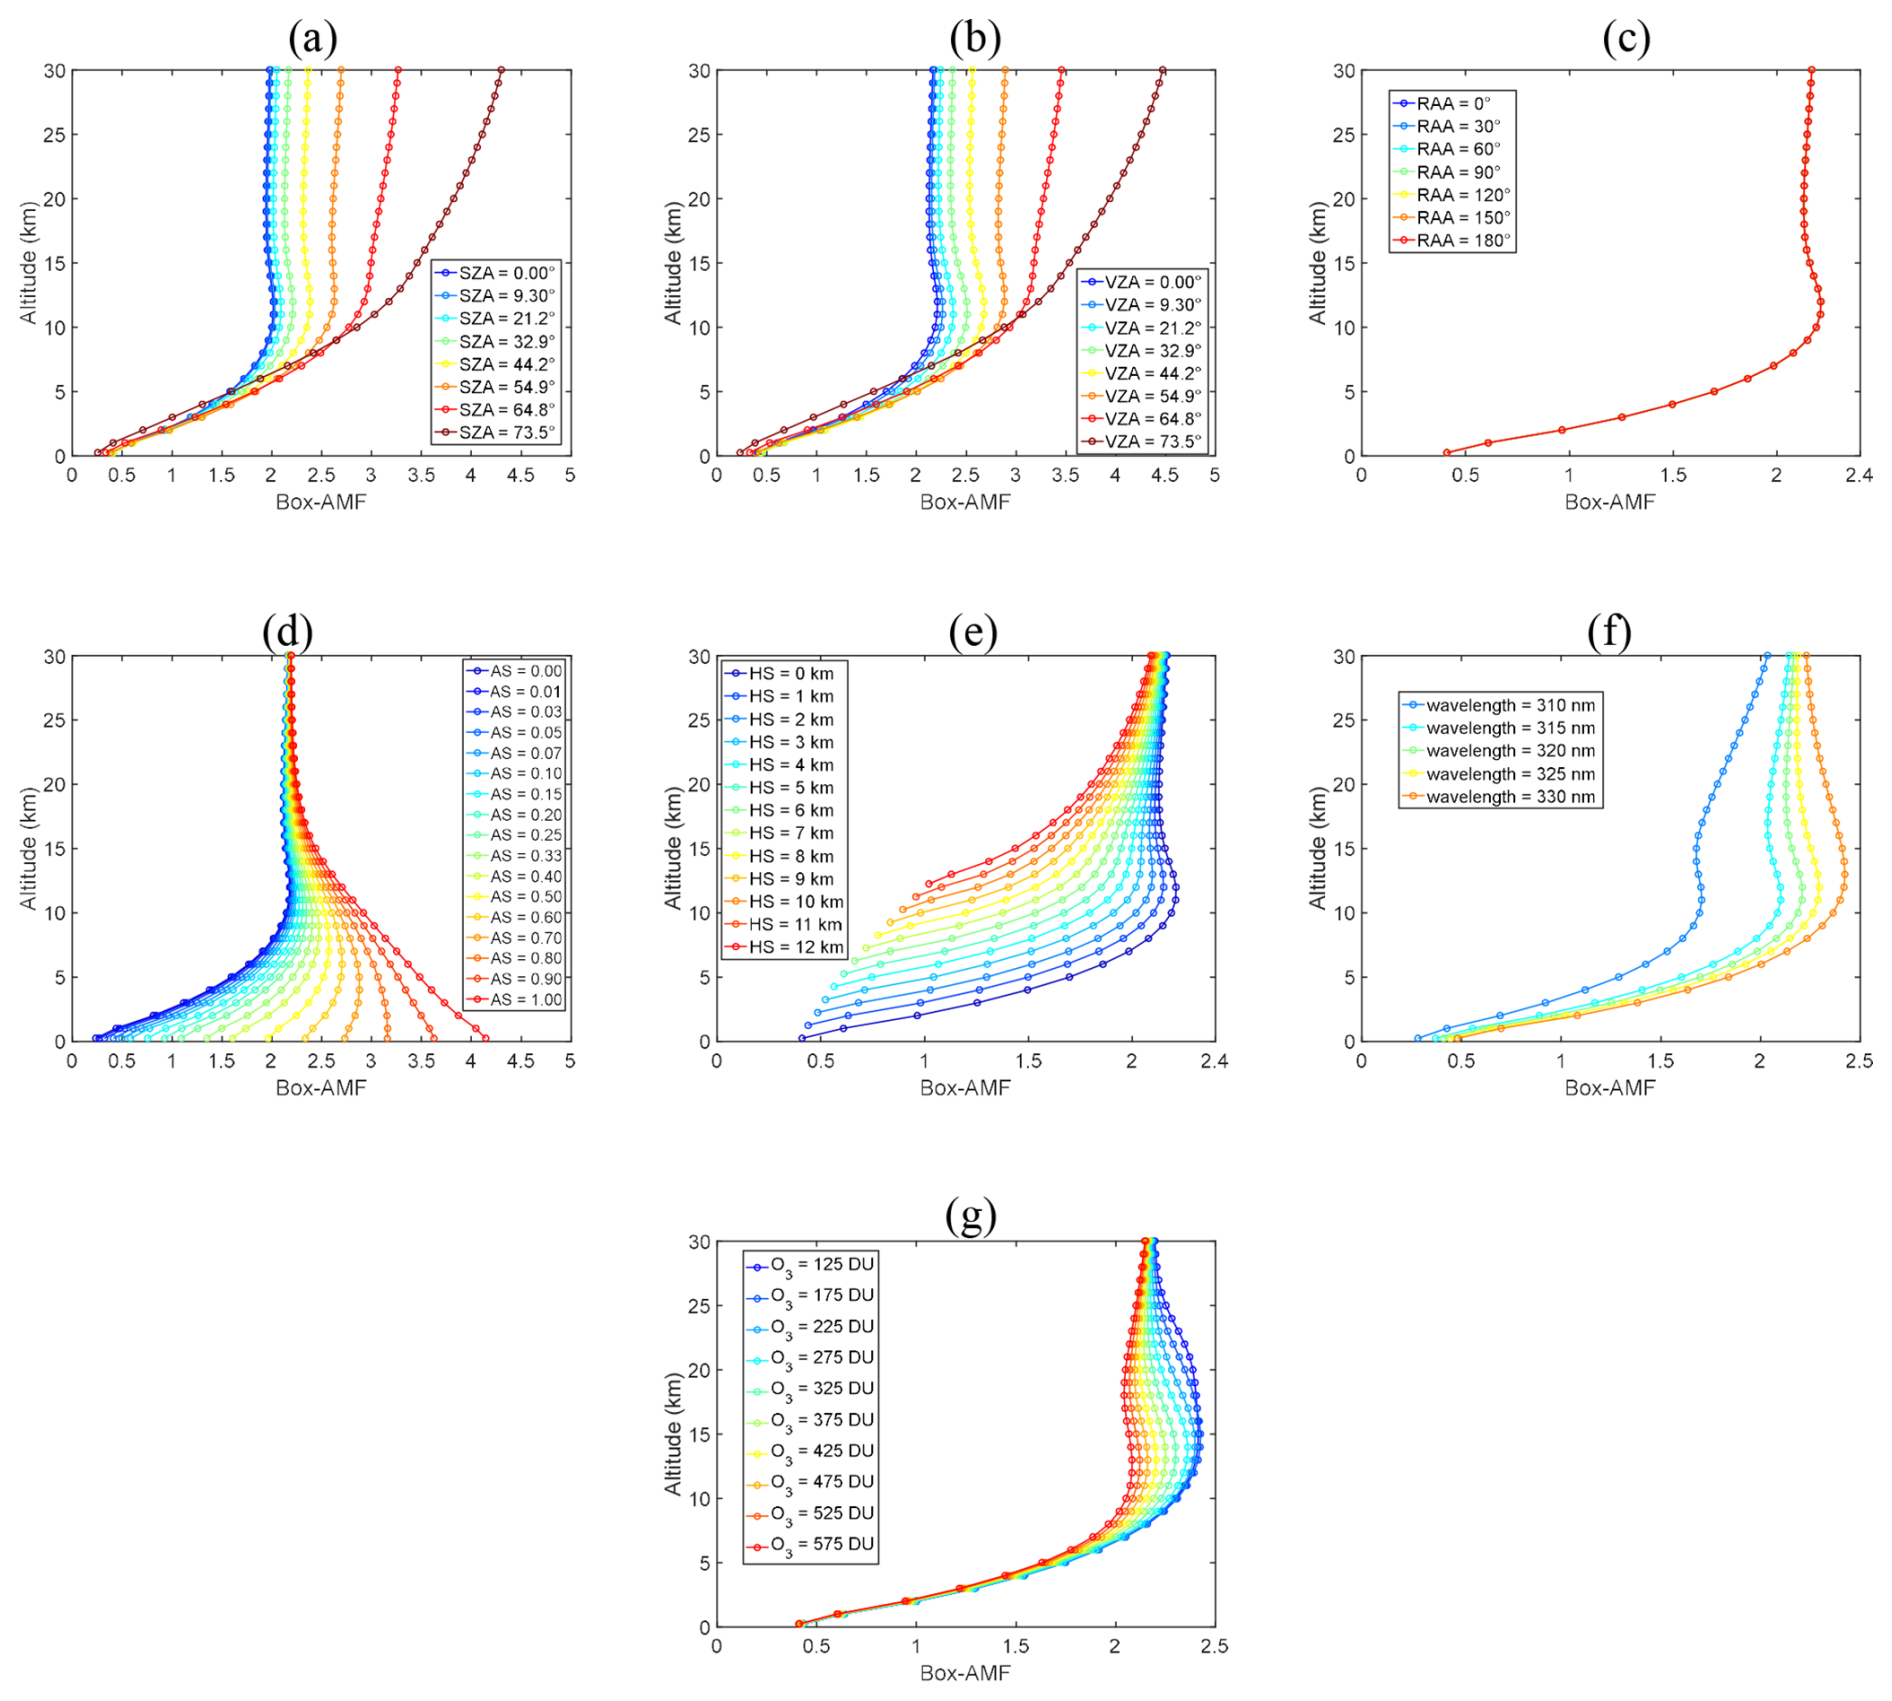
Figure 19Variation of Box-AMF with SZA, VZA, RAA, AS, HS, wavelength, and O3 column. The default SCIATRAN settings for Box-AMF calculation are as follows: wavelength = 320 nm, clear sky, HS = 0 km, O3 = 275 DU, AS = 0.05, SZA = 32.9°, VZA = 0°, RAA = 0°.
In this section, sensitivity tests of OMS SO2 AMF were conducted using the SCIATRAN model by computing Box-AMFs under different forward-model configurations (Fig. 19). And then the contribution of each input parameter to the AMF uncertainty was quantified by perturbing it according to its estimated uncertainty while keeping other parameters fixed. Finally, an overall estimate of uncertainty in OMS SO2 AMF was derived. For the perturbation analysis, a set of typical atmospheric and surface conditions was adopted as the default configuration, with SZA = 32.9°, VZA = 0°, RAA = 0°, AS = 0.05, HS = 0 km, wavelength = 320 nm, O3 column = 275 DU, clear-sky conditions, and with the assumption of surface reflectance as isotropic Lambertian equivalent reflector (LER).
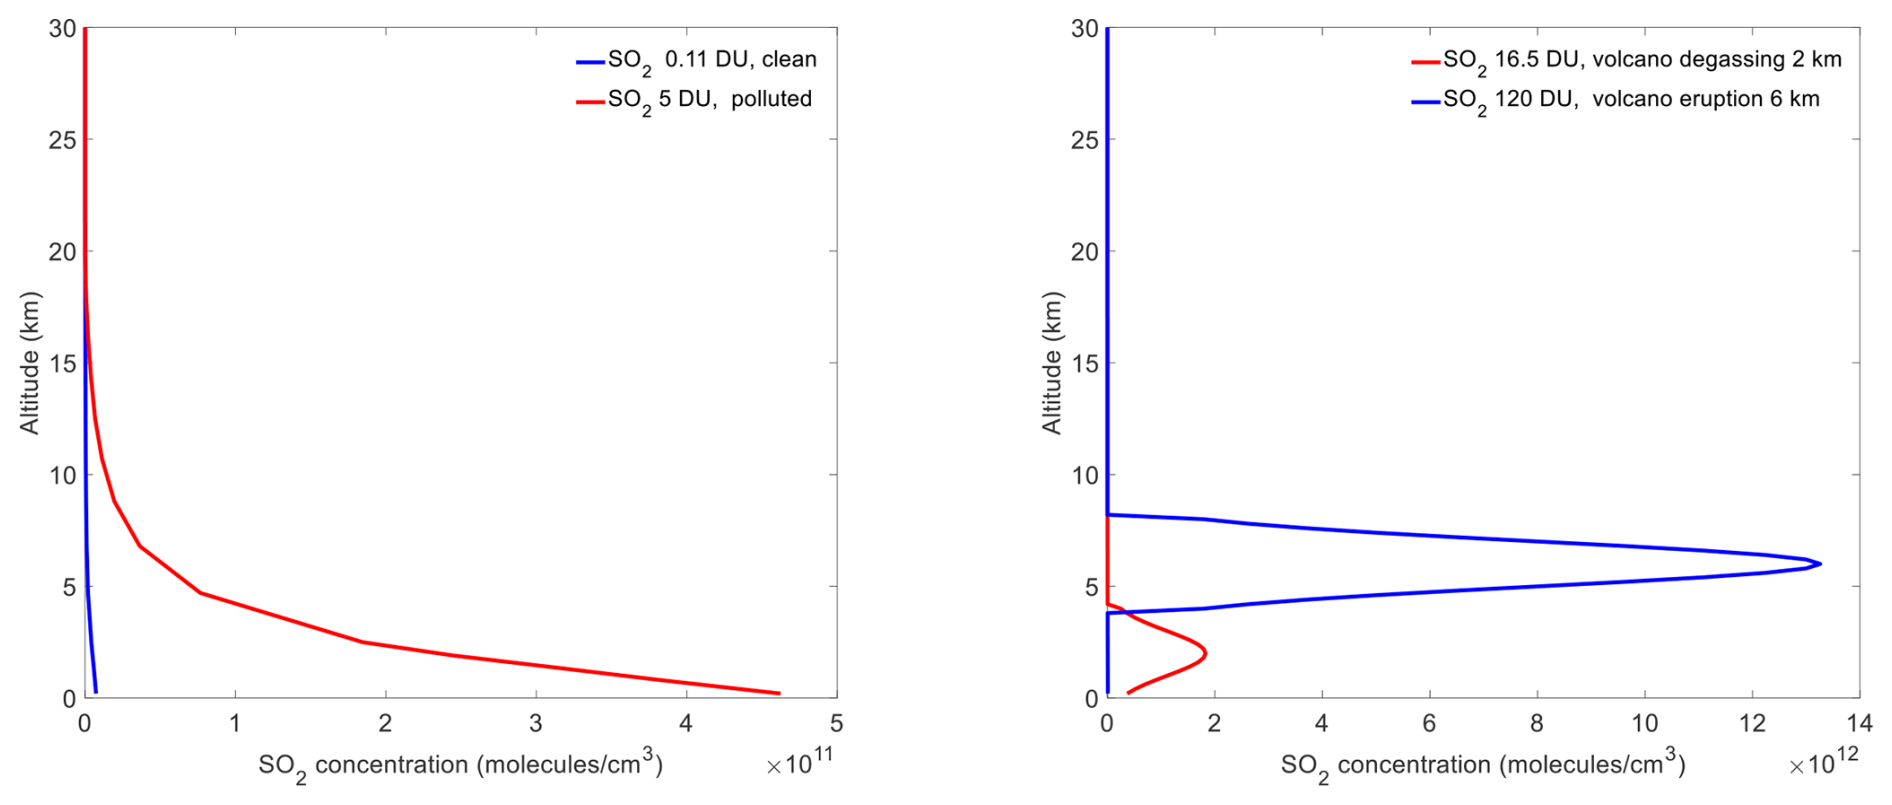
Figure 20Assumed SO2 profiles corresponding to clean conditions, and anthropogenic SO2 emissions (left); assumed SO2 profiles corresponding to volcanic degassing with plume heights around 2 km, and volcanic eruption with plume heights around 6 km (right).
The contributions of different parameters to the AMF uncertainty were evaluated across five scenarios: clean, boundary-layer pollution, boundary-layer pollution over snow and ice, volcanic degassing, and volcanic eruption. To represent these scenarios, four assumed SO2 vertical profiles were constructed (Fig. 20), corresponding to clean conditions (SO2 column = 0.11 DU), anthropogenic SO2 emissions (SO2 column = 5 DU), volcanic degassing with plume heights around 2 km (SO2 column = 16.5 DU), and volcanic eruptions with plume heights around 6 km (SO2 column = 120 DU).
5.2.1 Error source: observation angles (SZA, VZA, RAA)
As shown in Fig. 19a–b, at lower altitudes, Box-AMF is relatively insensitive to changes in SZA and VZA within the range of 0–50°. However, at higher altitudes (e.g., above 5 km), the Box-AMF generally increases with increasing SZA and VZA due to the longer atmospheric path length at larger angles, which enhances the contribution of each atmospheric layer to the total AMF. When SZA or VZA exceeds 73.5°, Box-AMFs decrease significantly below altitude 10 km, and larger angles are excluded. As shown in Fig. 19c, the variation of Box-AMF with RAA is negligible. At the time of writing, the measurement errors of OMS SZA and VZA are unavailable, and the proportion of uncertainty propagated to the AMF remains to be determined. In general, satellite measurements of SZA and VZA are considered highly accurate, and their contribution to the overall uncertainty is expected to be negligible.
5.2.2 Error source: surface reflectance (AS)
The surface reflectance has a relatively strong impact on the OMS SO2 AMF values, especially in anthropogenic emission regions where SO2 is concentrated near the surface. As shown in Fig. 19d, Box-AMF increases with increasing surface reflectance due to enhanced atmospheric multiple scattering. The difference in surface Box-AMF can reach approximately 1700 %.
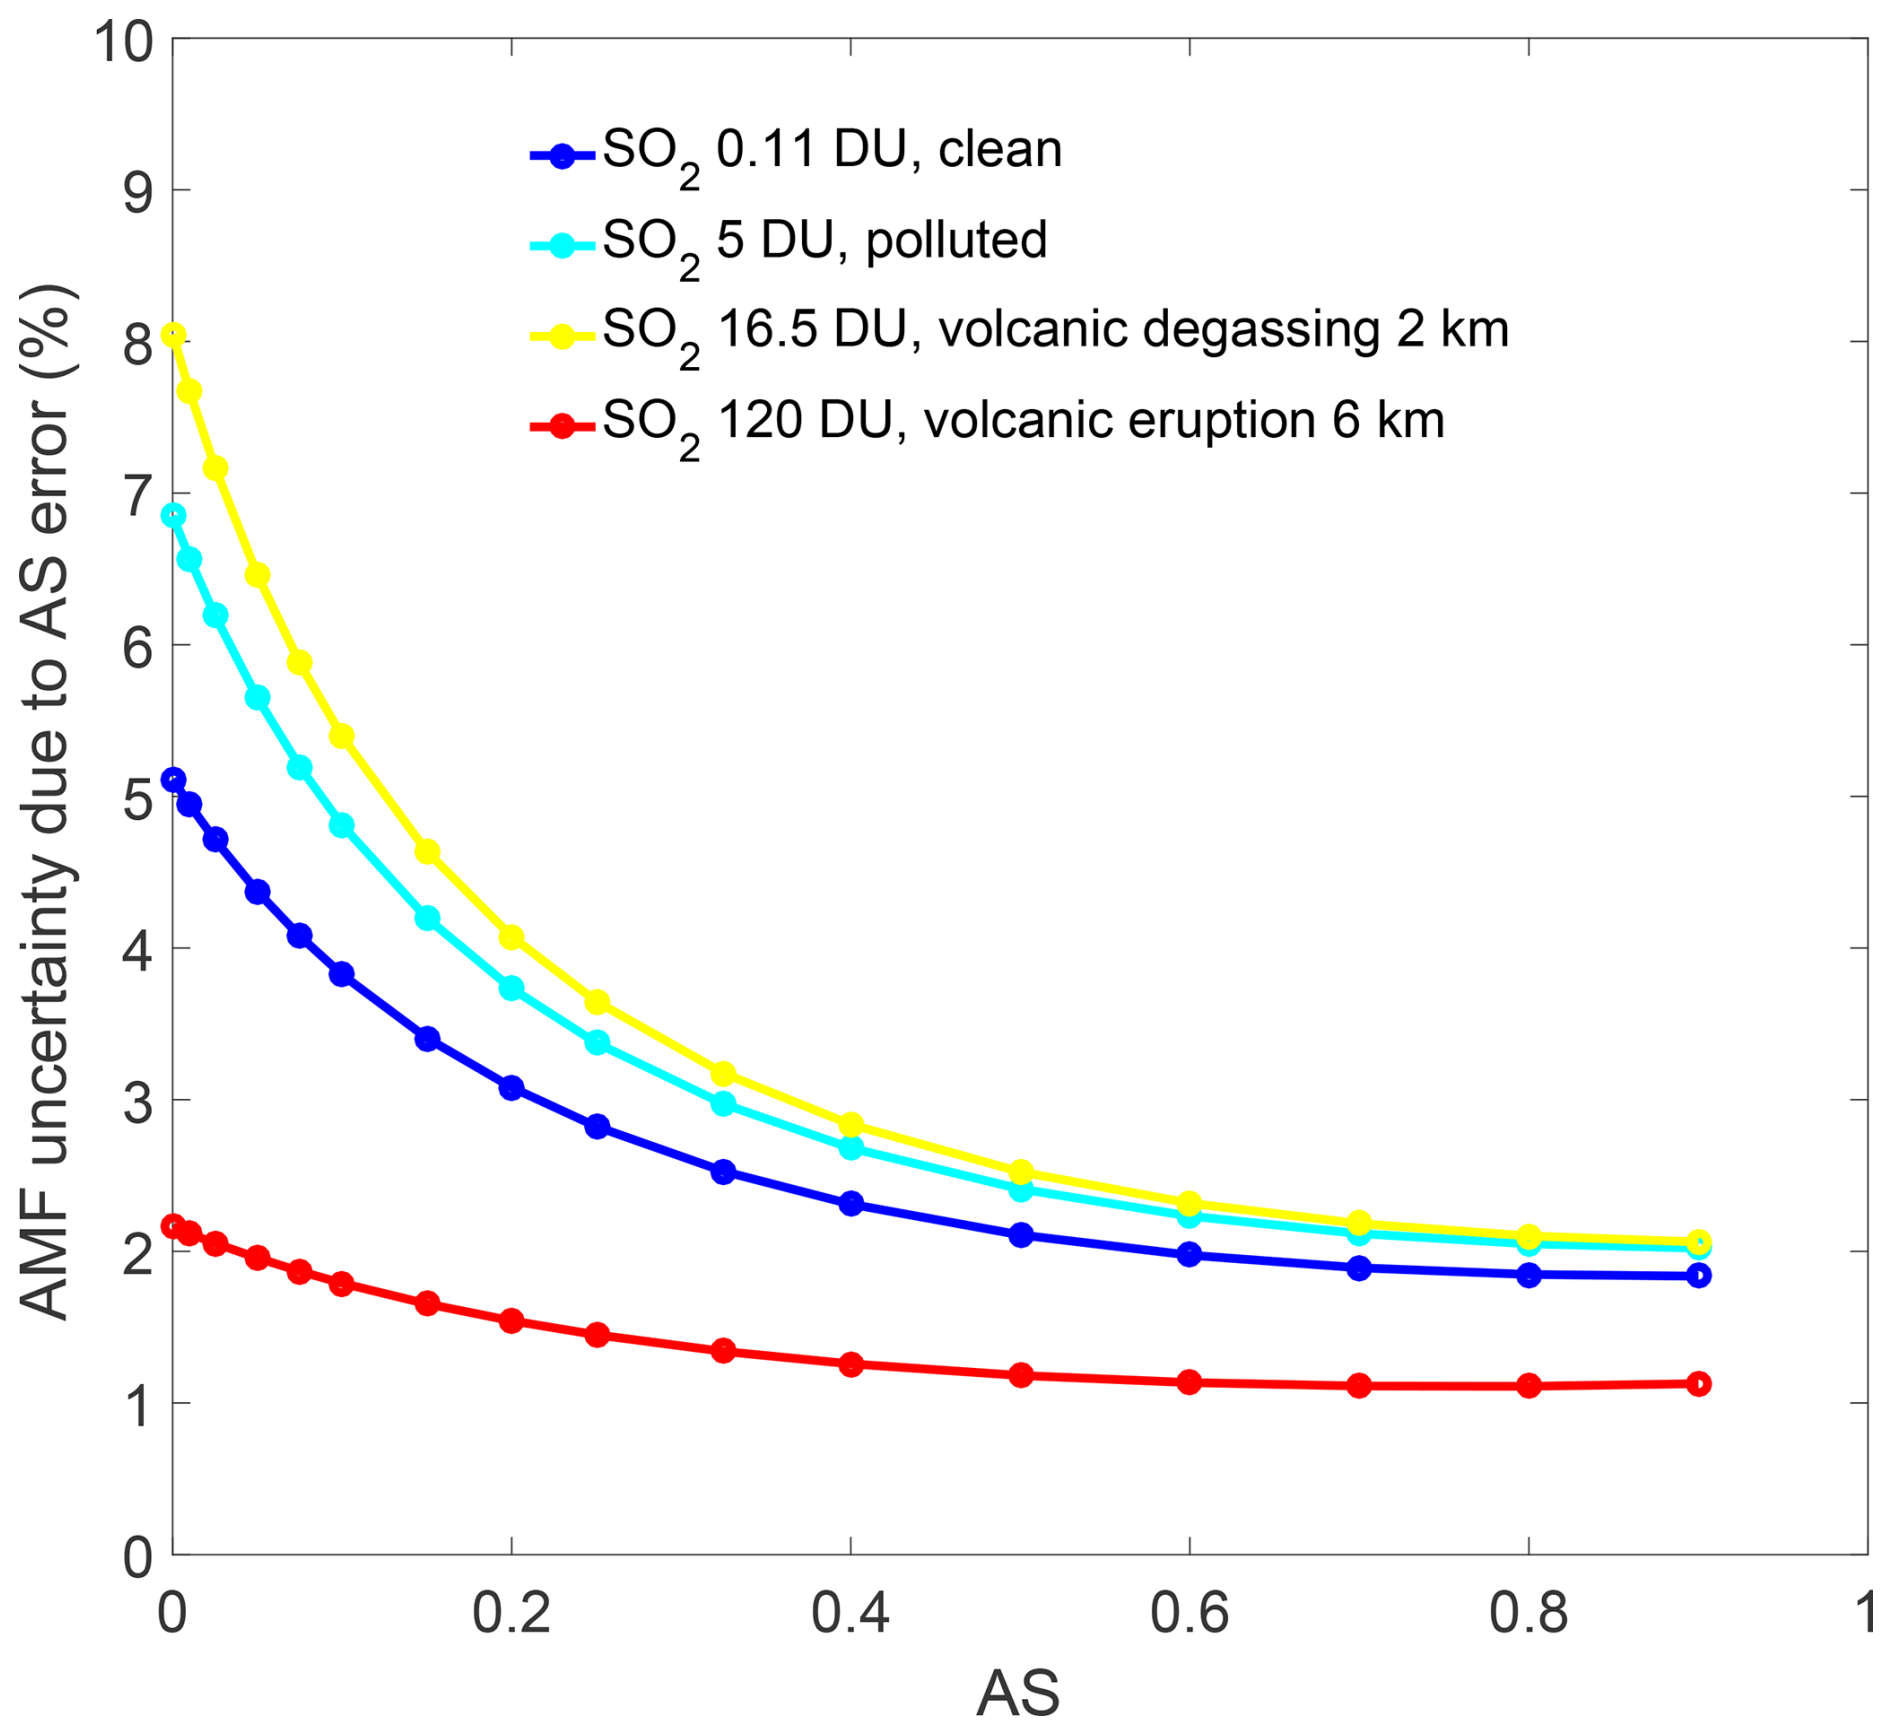
The OMI surface LER database used for OMS SO2 AMF calculation has overall uncertainties in the LER of 0.01–0.02, with slightly increasing values at shorter wavelengths (Kleipool et al., 2008). Here, we assume an LER uncertainty of 0.02 and use the SO2 vertical profiles shown in Fig. 20 to calculate the AMF uncertainty due to AS errors for five scenarios. The results are as follows (Fig. 21): (1) AMF uncertainty decreases with increasing AS, indicating that bright surfaces reduce the effect of AS perturbations on AMF. (2) Volcanic degassing and polluted conditions are particularly sensitive to AS: at AS = 0.05, uncertainties are ∼ 6.5 % and ∼ 5.6 %, respectively, while at AS = 0.8, they decrease to ∼ 2.1 % and ∼ 2.0 %, indicating that AS strongly influences AMF in cases with moderate SO2 concentrations. (3) High-concentration SO2 is less sensitive to AS: for volcanic eruption scenarios, AMF uncertainty varies slightly with AS, ranging from 1.1 % to 2.1 %. These results indicate that accurate AS input is crucial for reliable AMF calculations. In the future, higher spatial resolution surface reflectance products that account for directional effects, such as the TROPOMI DLER model (Tilstra et al., 2024), will be considered for OMS SO2 AMF calculations.
5.2.3 Error source: terrain height (HS)
The terrain heights used in OMS SO2 AMF calculations were obtained from the OMS L1 dataset, which derived terrain information from the Copernicus Digital Elevation Model (COP-DEM) with a spatial resolution of 30 m. According to the Copernicus DEM Product Handbook, the product exhibits an absolute vertical accuracy better than 4 m and a horizontal accuracy better than 6 m under standard conditions (Fahrland et al., 2020). Therefore, a terrain height uncertainty of 4 m is assumed to quantify the AMF uncertainty induced by HS errors.
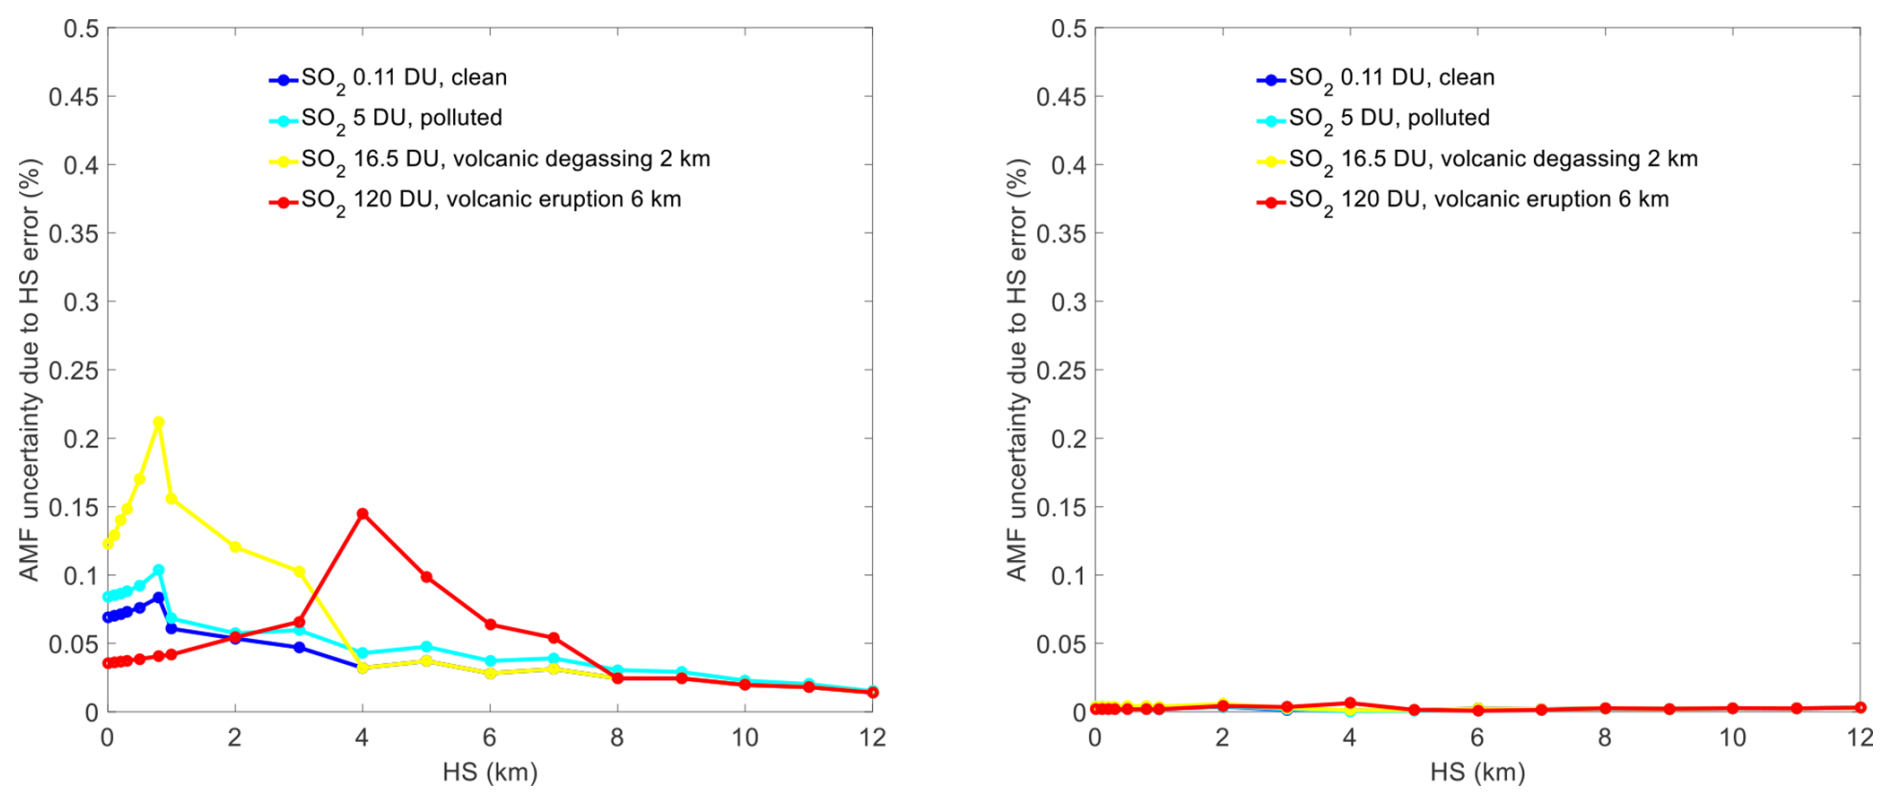
Figure 22AMF uncertainty due to HS errors for different scenarios. AS = 0.05 (left); AS = 0.8 (right).
The results (Fig. 22) show that: (1) For AS = 0.05, the AMF uncertainty due to HS errors is relatively small, generally below 0.2 %, while for AS = 0.8 it is further reduced to mostly below 0.01 %. (2) The AMF uncertainty decreases with increasing surface elevation: low-elevation surfaces (0–1 km) exhibit higher sensitivity, particularly under polluted and volcanic degassing scenarios, whereas at high elevations (> 5 km) the uncertainty becomes negligible (< 0.02 %). (3) The sensitivity to HS varies among different scenarios, which can be attributed to differences in the altitude of SO2 concentration peaks in each profile.
5.2.4 Error source: SO2 profile shape
Since the actual vertical distribution of atmospheric SO2 is often difficult to obtain, a priori profiles from chemical transport models are commonly used in AMF calculations. For regions dominated by anthropogenic emissions, models such as GEOS-Chem and TM5 are widely applied to provide global SO2 vertical profiles for AMF estimation, and uncertainties in these profiles can propagate into the total AMF.
In this study, SO2 vertical profiles from GEOS-CF were used for AMF calculations. Keller et al. (2021) reported that GEOS-CF v1.0 systematically overestimates SO2 concentrations owing to outdated emission inventories, with model biases reaching up to a factor of four. However, at the time of writing, detailed information on the layer-resolved uncertainties and temporal biases of GEOS-CF SO2 vertical profiles is not available. Considering that the GEOS-CF results originate from the GEOS-Chem chemistry module, the uncertainty estimates reported in Lee et al. (2009) were adopted, where the AMF uncertainty due to GEOS-Chem SO2 profile errors was generally in the range of 10 %–22 % under clear-sky conditions.
5.2.5 Error source: O3
The variation of Box-AMF with the O3 column (Fig. 19g) shows that, O3 column has a relatively weak impact on Box-AMF, especially for altitudes below 5 km. The Box-AMF gradually decreases as the O3 column increases. The differences in Box-AMF under different O3 column conditions are more noticeable between altitudes of 5 and 25 km. In this study, the total O3 column from OMS was used in the OMS SO2 AMF calculation, with an estimated uncertainty of less than 5 %. Assuming O3 error of 5 %, the estimate of AMF uncertainty due to O3 errors is generally small (Fig. 23), with values below 0.7 % for dark surfaces (AS = 0.05) and below 0.4 % for bright surfaces (AS = 0.8). AMF uncertainty increases slightly with increasing O3 total column, especially for dark surfaces.
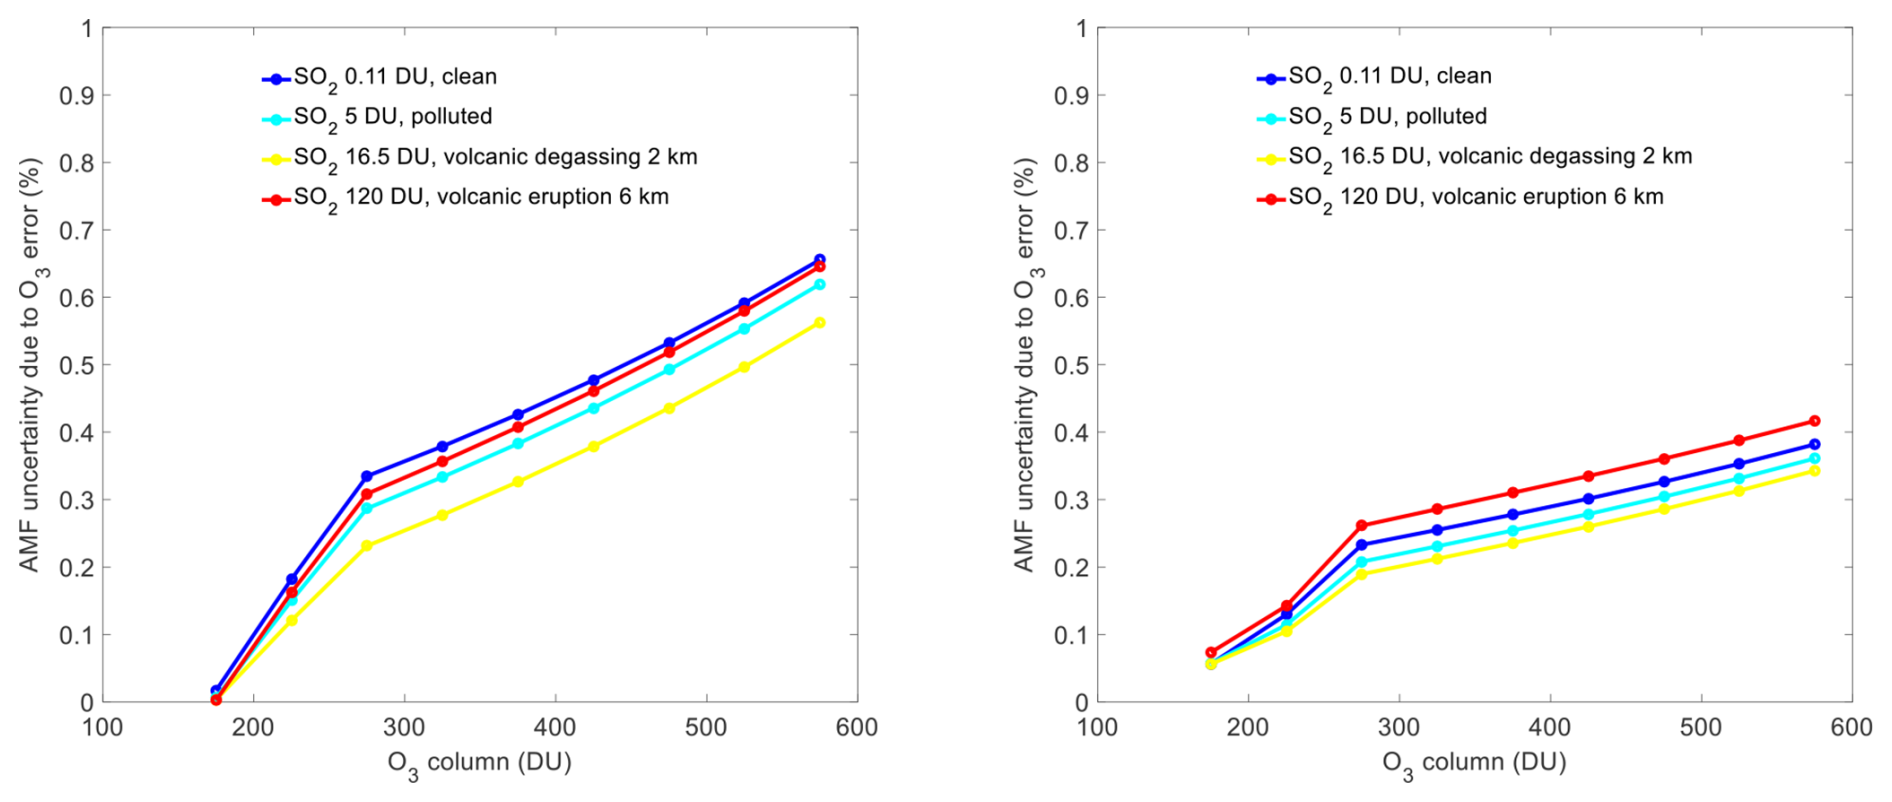
Figure 23AMF uncertainty due to O3 errors for different scenarios. AS = 0.05 (left); AS = 0.8 (right).
5.2.6 Error source: wavelength dependence
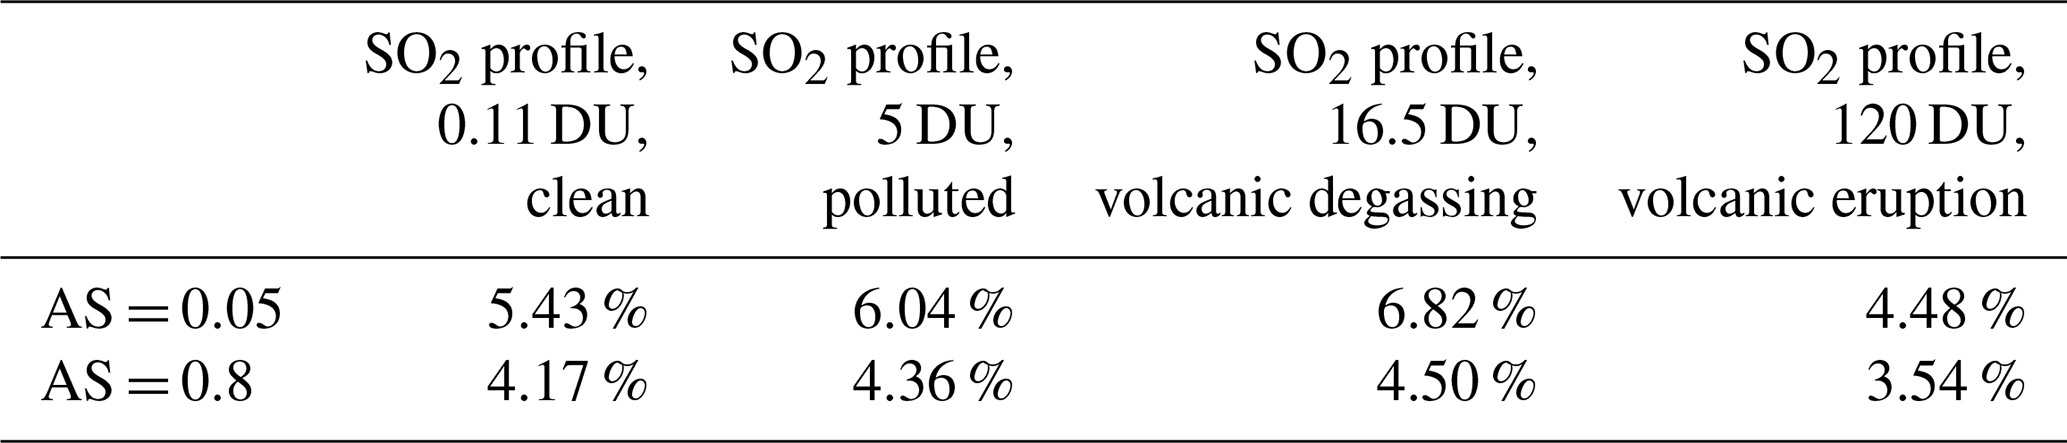
The wavelength dependence of AMF is a non-negligible error source of AMF uncertainty. The variation of Box-AMF with wavelength ranging from 310 to 330 nm (Fig. 19f) shows that Box-AMF increases with increasing wavelength. In this study, the wavelength 320 nm, which is approximately at the center of the SO2 retrieval window (312–326 nm), was selected for the AMF calculation. To evaluate the AMF uncertainty due to wavelength dependence, three representative wavelengths within the retrieval window (313, 320, and 325 nm) were selected to quantify the impact of wavelength dependence. As shown in Table 5, the AMF uncertainty due to wavelength dependence ranges from approximately 5.4 % to 6.8 % for dark surfaces (AS = 0.05) and decreases to about 3.5 %–4.5 % for bright surfaces (AS = 0.8). This indicates that AMF is more sensitive to wavelength variations under dark surface conditions, whereas enhanced multiple scattering over bright surfaces reduces the impact of wavelength dependence. Among the four scenarios, polluted conditions and volcanic degassing exhibit larger wavelength-related uncertainties, while clean and volcanic eruption cases show relatively lower sensitivity.
5.2.7 Error source: others
In addition to the error sources discussed above, other factors may also contribute to AMF uncertainty. However, their impacts on AMF have not yet been quantitatively assessed in this study. These factors include (1) uncertainties in the radiative transfer model, which are generally considered to be small; (2) interpolation errors. For SO2 retrievals from high spatial resolution satellite observations, it is often necessary to construct a LUT using a radiative transfer model to improve retrieval efficiency. However, the LUT approach, which requires an interpolation process, may introduce additional uncertainties into the Box-AMF results.
5.2.8 Total AMF uncertainty
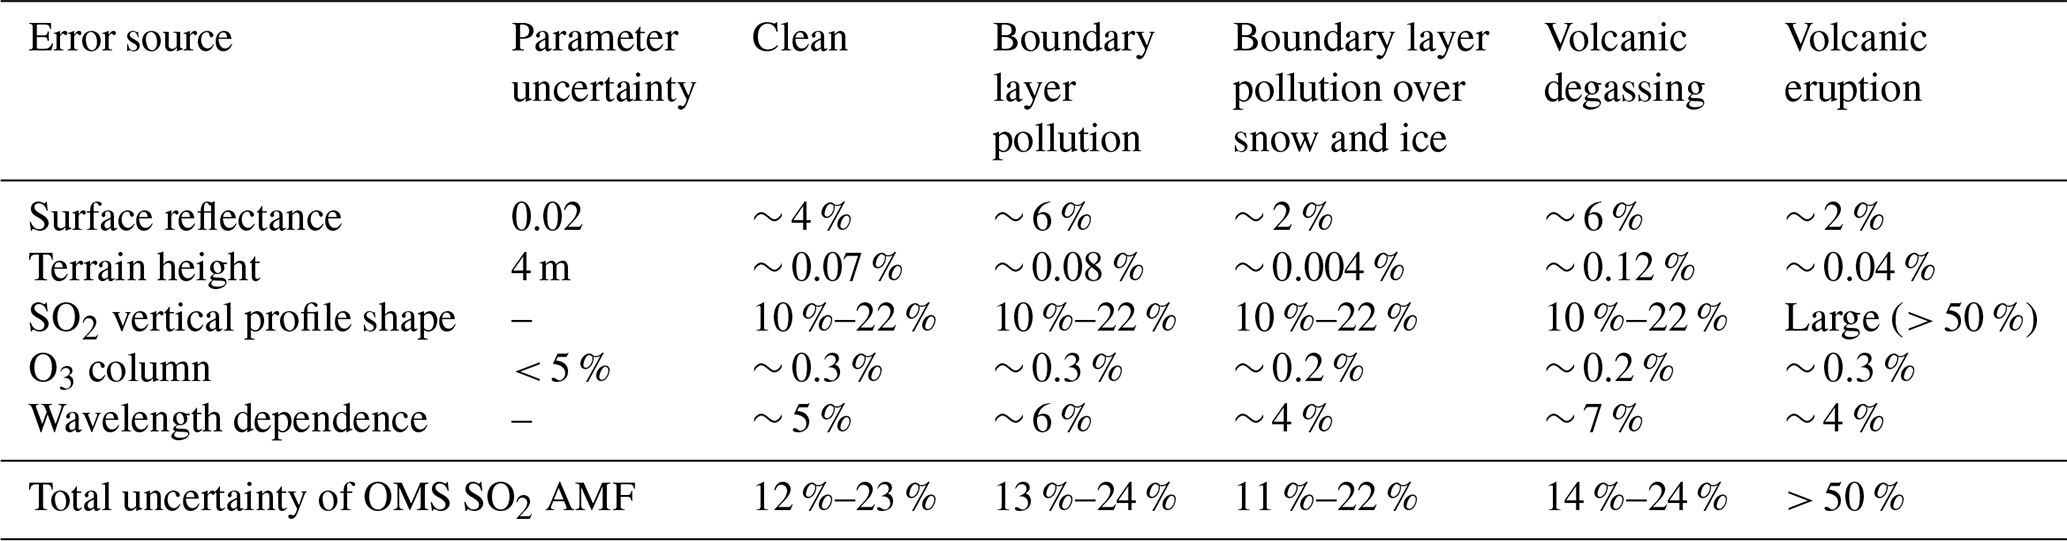
Overall, the AMF uncertainty is primarily dominated by uncertainties in surface reflectance, the SO2 vertical profile shape, and wavelength dependence, while the contributions from ozone and terrain height are relatively small. Assuming that these error sources are independent, the total AMF uncertainty can be expressed as the quadrature sum of the AMF uncertainties due to surface reflectance (AS), terrain height (HS), SO2 vertical profile shape S(z), O3 column, and wavelength dependence, as follows:
As shown in Table 6, the total AMF uncertainties under five scenarios – clean, boundary layer pollution, boundary layer pollution over snow and ice, volcanic degassing, and volcanic eruption – are estimated to be 12 %–23 %, 13 %–24 %, 11 %–22 %, 14 %–24 %, and > 50 %, respectively. It should be noted that these values were calculated under clear-sky conditions, without considering the effects of clouds or aerosols.
Table 6OMS SO2 AMF uncertainty due to individual error components under different clear-sky scenarios.
5.3 Errors from background offset correction
Background offset correction is essential for the OMS SO2 column retrievals which have obvious along-track stripes and cross-track asymmetries problems. However, it is hard to get the accurate background offset for SO2 retrieval of each pixel. In this study, an iterative sliding correction scheme for background offset correction was applied to OMS SO2 retrievals, with the purpose of forcing SO2 values over clean or low SO2 emission regions to zero. This approach helps addressing problems such as along-track stripes and cross-track asymmetry. However, the sliding window strategy assumes that pixels with values smaller than the threshold (2 DU) within the sliding window represent zero SO2 emissions, which may lead to a loss of SO2 information contained in the low-emission regions. This not only could limit the applicability of the OMS SO2 product for monitoring anthropogenic emission sources, but also may lead to many negative retrievals of SO2 column in clean regions. Furthermore, SO2 retrievals at certain cross-track positions (assumed to be clean near-zero) may exceed the 2 DU threshold, requiring the threshold to be adjusted upwards to achieve a better effect after background offset correction. Therefore, although the current background offset correction strategy helps mitigate stripes, residual systematic errors may still remain after the correction, which could affect the accuracy of the OMS SO2 column retrievals.
The quantification of the residual systematic errors is challenging, as it is difficult to fully separate random fitting errors from residual systematic components. Therefore, in this study, the residual systematic errors after the background offset correction were combined with the random fitting errors and treated as an effective SCD uncertainty, which was subsequently used in the total uncertainty estimation of the OMS SO2 VCD.
5.4 Total uncertainty of OMS SO2 VCD
In general, assuming that the error sources are independent of each other, the uncertainty of satellite-retrieved SO2 VCD can be estimated using the following standard error propagation approach (Lee et al., 2009; Theys et al., 2017):
where σSCD is the random error from DOAS SO2 SCD spectral fitting including instrument-related noise, is the residual systematic error after background offset correction, and σAMF is the AMF uncertainty which includes two components: one is related to the atmospheric scattering weight and the other one is associated with the SO2 profile shape.
In the standard error propagation method, σSCD is commonly approximated by the SFE. However, for the OMS SO2 retrieval, the SFE is strongly affected by instrument-related systematic errors, as shown in Fig. 18. As a result, the SFE includes not only random fitting errors but also systematic components, and thus does not represent the random SCD uncertainty. If directly used as σSCD in the error propagation, it would lead to an overestimation of the total uncertainty of the OMS SO2 VCD.
Therefore, the SFE was not adopted as σSCD in this study. Instead, the standard deviation of the corrected SCD over clean oceanic regions, approximately 0.2 DU in equatorial regions and about 0.4 DU at high latitudes, was used as an effective SCD uncertainty. This value reflects the combined effect of random fitting error and residual systematic errors after background offset correction and was propagated into the total uncertainty estimation. Accordingly, the total uncertainty of the OMS SO2 VCD can be expressed as:
where σSCD, res is the effective SCD uncertainty, and SCDcorr is the background-corrected SO2 SCD.
Table 7Total uncertainty of OMS SO2 VCDs under different clear-sky scenarios.
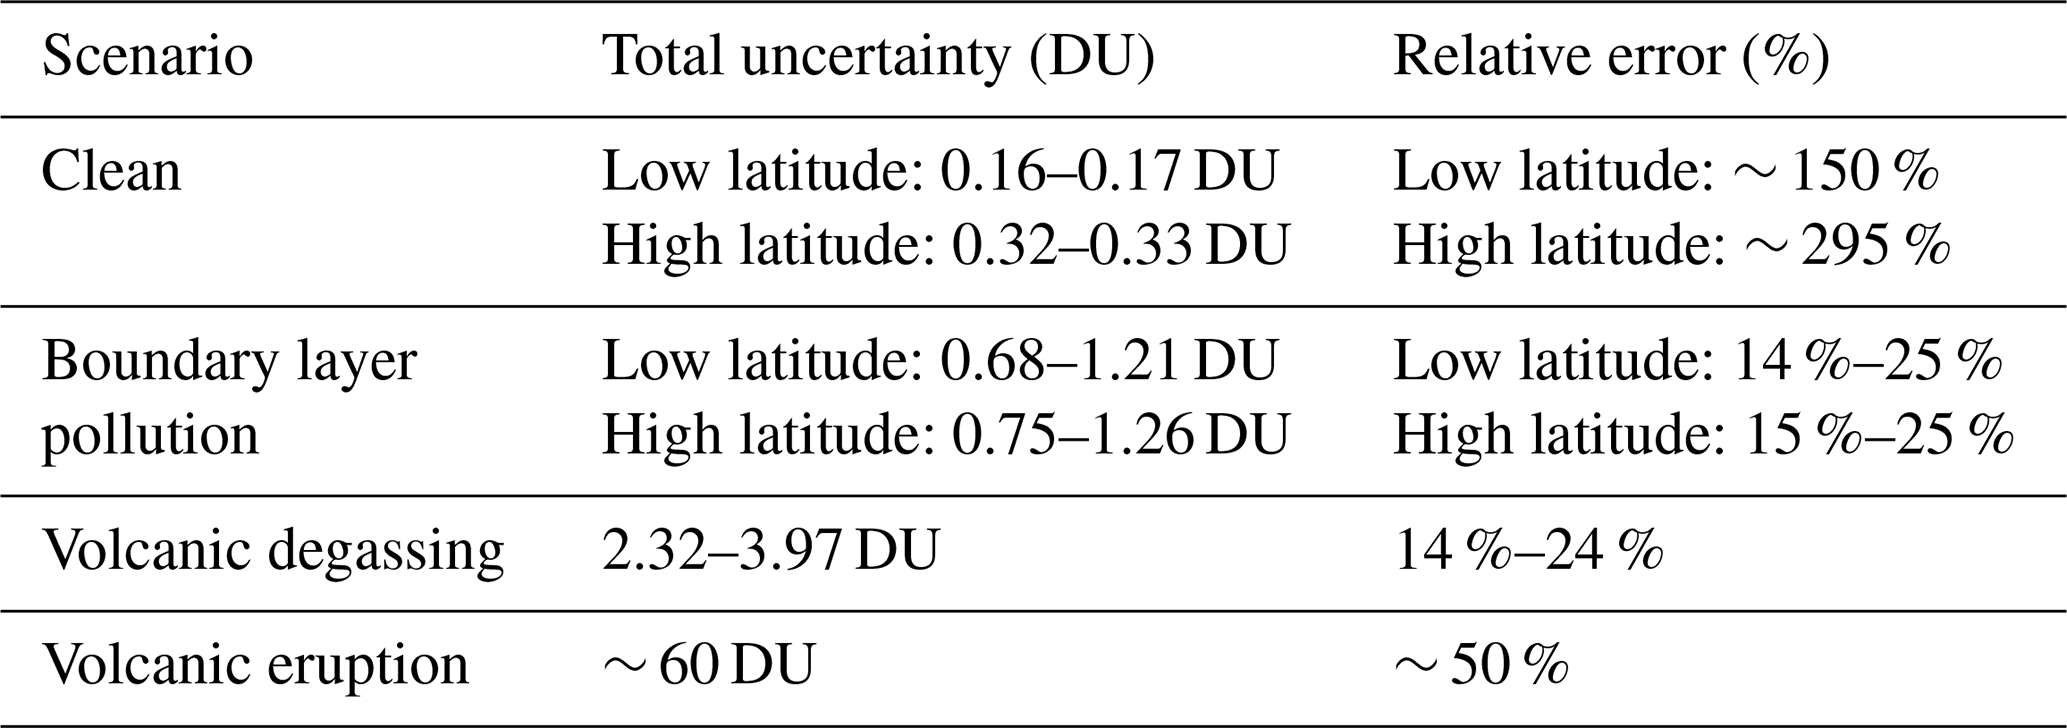
The estimated total uncertainties of OMS SO2 VCDs under four scenarios – clean, boundary layer pollution, volcanic degassing, and volcanic eruption – are summarized in Table 7. The results show that under clean conditions, the total uncertainty is dominated by measurement noise and fitting errors, ranging from 0.16–0.17 DU at low latitudes and 0.32–0.33 DU at high latitudes. The corresponding relative errors are ∼ 150 % at low latitudes and ∼ 295 % at high latitudes, reflecting the challenge of retrieving low SO2 column. For boundary layer pollution scenarios, the enhanced SO2 signal reduces the relative errors to 14 %–25 %, while the total uncertainty increases to 0.68–1.21 DU at low latitudes and 0.75–1.26 DU at high latitudes. For volcanic degassing, the relative errors range from 14 %–24 %, with total uncertainties ranging from 2.32 to 3.97 DU. Under the volcanic eruption scenario, the total uncertainty and relative error are approximately 60 DU and 50 %, respectively. It should be noted that these estimates still involve large uncertainties due to the large errors in radiance measurement and SO2 vertical profile provided by GEOS-CF, particularly under volcanic eruption conditions. In addition, the uncertainties associated with clouds and aerosols were not included in the present error analysis, suggesting that the estimated uncertainties may be conservative.
This study presents the first SO2 retrieval results from the Chinese FY-3F/OMS instrument, which was launched in August 2023. The results were derived using TOA reflected radiance data from FY-3F/OMS with a DOAS approach. To improve the retrieval accuracy, specific processing schemes were developed based on the characteristics of the OMS instrument and the performance of its L1 data. These schemes, including solar spectrum selection, spectral soft calibration, and background offset correction, effectively reduce along-track stripes and across-track asymmetry in the OMS SO2 retrievals.
To evaluate the accuracy of OMS SO2 retrievals, comparisons with TROPOMI DOAS and TROPOMI COBRA SO2 products were conducted over clean oceanic regions, volcanic eruptions, and anthropogenic emission regions. The comparison results indicate that OMS retrievals show reasonable agreement with TROPOMI products, have good stability in clean oceanic regions and can be used to monitor SO2 emissions from volcanic eruptions and anthropogenic sources. In selected clean oceanic regions, the SO2 values of both OMS and TROPOMI follow approximately a normal distribution centered around 0, with most values concentrated between −2 and 2 DU. For the Sundhnúkur and Nyamuragira volcanic eruptions, FY-3F/OMS SO2 retrievals successfully capture the spatial distribution and high-concentration plumes of volcanic SO2, similar to the TROPOMI DOAS and TROPOMI COBRA 7 km SO2 results. However, OMS tends to underestimate SO2 at high columns (> 50 DU) due to saturation in the 312–326 nm fitting window. In anthropogenic emission regions, OMS and TROPOMI SO2 products show generally good consistency in detecting anthropogenic SO2 emissions, with correlation coefficients ranging from about 0.6–0.9 over the Persian Gulf and 0.80–0.85 over Norilsk. The differences between OMS and TROPOMI SO2 results may be related to differences in local overpass times, spatial resolution, observation angles, and the L1 and L2 processing algorithms (e.g., differences in L1 radiometric and spectral calibration methods, SO2 retrieval fitting windows, AMF strategies).
In summary, the agreement between the OMS and TROPOMI measurements is within expectations, taking into account the differences in satellite overpass times and the uncertainties associated with AMF. With its high spectral and spatial resolution, morning overpass time, daily global coverage, and reliable SO2 retrieval results, OMS will provide effective data support for monitoring the continuous SO2 changes from global volcanic eruptions and anthropogenic activities, helping to fill the spatial and temporal gaps in the existing global satellite network.
The current OMS SO2 retrievals still have several shortcomings that need to be addressed in the future. More work will be needed to incorporate accurate and satellite-synchronized SO2 vertical profiles to improve the accuracy of AMF. In addition, higher spatial resolution surface reflectance products that account for directional effects, as well as the impacts of clouds and aerosols on the AMF, should be considered in the OMS SO2 AMF calculation. Another issue that needs to be addressed in the future is the simultaneous retrieval of volcanic eruption heights, which would help improve the accuracy of SO2 retrievals in volcanic regions. Moreover, the 312–326 nm retrieval fitting window used in the OMS SO2 product exhibits nonlinear variation in the case of very large SO2 concentrations, leading to an underestimation of SO2 columns. In the future, SO2 retrievals from longer UV wavelength fitting windows varying with SO2 columns will be incorporated into the OMS SO2 retrieval to mitigate the saturation issue in the case of large volcanic eruptions. Our preliminary strategy for such retrievals is as follows. First, a global SO2 column retrieval is performed using the 312–326 nm window. Pixels exceeding a threshold (e.g., > 50 DU) are flagged as potentially saturated. For these flagged pixels, additional retrievals are conducted using the 325–335 and 360–390 nm windows. If the new retrievals are within a reasonable range and exceed the 312–326 nm results, the maximum value from the 325–335 or 360–390 nm windows replaces the original retrieval; otherwise, the 312–326 nm retrieval is retained.
Furthermore, although in this study the comparison between OMS SO2 retrievals and TROPOMI SO2 products was conducted to demonstrate the capability of OMS SO2 retrievals, synchronous and high-quality ground-based or airborne measurements remain crucial for validating the accuracy of OMS SO2 retrievals. In the future, ground-based and airborne experiments need to be conducted to provide accurate ground-based or airborne data for the validation of OMS SO2 retrievals.
The SO2 data produced in this study is available from the authors on request. FY-3F/OMS-N L1 data can be downloaded from the website http://data.nsmc.org.cn/DataPortal/en/home/index.html. TROPOMI DOAS SO2 data is available via the Copernicus Data Space Ecosystem (https://browser.dataspace.copernicus.eu/). TROPOMI COBRA SO2 data is available via the PAL system (https://data-portal.s5p-pal.com/products/so2cbr.html).
HY: Drafting, data processing, and plotting; AR: Revision, research methodology and content suggestions, and English polishing; XZ: Suggestions on revision and research direction; AS: Discussion and suggestions on the Ring effect; TV & YL & CY: Discussion and suggestions on AMF calculation; QW: Discussion on the data quality of OMS L1 data; LZ & WW: Discussion and suggestions on the revision of the Error analysis section.
At least one of the (co-)authors is a member of the editorial board of Atmospheric Measurement Techniques. The peer-review process was guided by an independent editor, and the authors also have no other competing interests to declare.
Publisher's note: Copernicus Publications remains neutral with regard to jurisdictional claims made in the text, published maps, institutional affiliations, or any other geographical representation in this paper. The authors bear the ultimate responsibility for providing appropriate place names. Views expressed in the text are those of the authors and do not necessarily reflect the views of the publisher.
The authors wish to thank the many scientists and engineers from FY-3F/OMS L1 team, TROPOMI team, and the Institute of Environmental Physics at the University of Bremen. The authors also acknowledge the use of ChatGPT for improving the English of the manuscript.
This research has been supported by the National Key Research and Development Program of China (grant no. 2022YFB3904801)
This paper was edited by Meng Gao and reviewed by three anonymous referees.
Bauduin, S., Clarisse, L., Clerbaux, C., Hurtmans, D., and Coheur, P. F.: IASI observations of sulfur dioxide (SO2) in the boundary layer of Norilsk, J. Geophys. Res.-Atmos., 119, 4253–4263, 2014.
Boersma, K., Eskes, H., and Brinksma, E.: Error analysis for tropospheric NO2 retrieval from space, J. Geophys. Res.-Atmos., 109, https://doi.org/10.1029/2003JD003962, 2004.
Bogumil, K., Orphal, J., Homann, T., Voigt, S., Spietz, P., Fleischmann, O. C., Vogel, A., Hartmann, M., Kromminga, H., Bovensmann, H., Frerick, J., and Burrows, J. P.: Measurements of molecular absorption spectra with the SCIAMACHY pre-flight model: instrument characterization and reference data for atmospheric remote-sensing in the 230–2380 nm region, J. Photoch. Photobiol. A, 157, 167–184, 2003.
Burrows, J. P., Weber, M., Buchwitz, M., Rozanov, V., Ladstätter-Weißenmayer, A., Richter, A., DeBeek, R., Hoogen, R., Bramstedt, K., and Eichmann, K.-U.: The global ozone monitoring experiment (GOME): Mission concept and first scientific results, J. Atmos. Sci., 56, 151–175, 1999.
Carn, S., Strow, L. D., de Souza-Machado, S., Edmonds, Y., and Hannon, S.: Quantifying tropospheric volcanic emissions with AIRS: The 2002 eruption of Mt. Etna (Italy), Geophys. Res. Lett., 32, https://doi.org/10.1029/2004GL021034, 2005.
Carn, S. A., Krueger, A. J., Krotkov, N. A., Yang, K., and Levelt, P. F.: Sulfur dioxide emissions from Peruvian copper smelters detected by the Ozone Monitoring Instrument, Geophys. Res. Lett., 34, 1093–1101, https://doi.org/10.1029/2006gl029020, 2007.
Carn, S. A., Krueger, A. J., Krotkov, N. A., Yang, K., and Evans, K.: Tracking volcanic sulfur dioxide clouds for aviation hazard mitigation, Nat. Hazards, 51, 325–343, https://doi.org/10.1007/s11069-008-9228-4, 2009.
Chance, K. V. and Spurr, R. J.: Ring effect studies: Rayleigh scattering, including molecular parameters for rotational Raman scattering, and the Fraunhofer spectrum, Appl. Optics, 36, 5224–5230, 1997.
Chen, L., Han, D., Tao, J., and Su, L.: Overview of tropospheric NO2 vertical column density retrieval from space measurement, J. Remote Sens., 13, 343–360, 2009.
Chen, L., Shang, H., Fan, M., Tao, J., Husi, L., Zhang, Y., Wang, H., Cheng, L., Zhang, X., and Wei, L.: Mission overview of the GF-5 satellite for atmospheric parameter monitoring, National Remote Sensing Bulletin, 25, 1917–1931, 2021.
Coddington, O. M., Richard, E. C., Harber, D., Pilewskie, P., Woods, T. N., Chance, K., Liu, X., and Sun, K.: The TSIS-1 hybrid solar reference spectrum, Geophys. Res. Lett., 48, e2020GL091709, https://doi.org/10.1029/2020GL091709, 2021.
Cofano, A., Cigna, F., Santamaria Amato, L., Siciliani de Cumis, M., and Tapete, D.: Exploiting Sentinel-5P TROPOMI and ground sensor data for the detection of volcanic SO2 plumes and activity in 2018–2021 at Stromboli, Italy, Sensors-Basel, 21, 6991, https://doi.org/10.3390/s21216991, 2021.
Corradino, C., Jouve, P., La Spina, A., and Del Negro, C.: Monitoring Earth's atmosphere with Sentinel-5 TROPOMI and Artificial Intelligence: Quantifying volcanic SO2 emissions, Remote Sens. Environ., 315, 114463, https://doi.org/10.1016/j.rse.2024.114463, 2024.
Cullis, C. F. and Hirschler, M. M.: Atmospheric Sulfur – Natural and Man-Made Sources, Atmos. Environ., 14, 1263–1278, https://doi.org/10.1016/0004-6981(80)90228-0, 1980.
Eisinger, M. and Burrows, J. P.: Tropospheric sulfur dioxide observed by the ERS-2 GOME instrument, Geophys. Res. Lett., 25, 4177–4180, https://doi.org/10.1029/1998gl900128, 1998.
Fahrland, E., Jacob, P., Schrader, H., and Kahabka, H.: Copernicus digital elevation model product handbook, Airbus Defence and Space – Intelligence, Potsdam, Germany, 2024–2006, https://dataspace.copernicus.eu/sites/default/files/media/files/2024-06/geo1988-copernicusdem-spe-002_producthandbook_i5.0.pdf (last access: 10 March 2026), 2020.
Finlayson-Pitts, B. J. and Pitts Jr., J. N.: Chemistry of the upper and lower atmosphere: theory, experiments, and applications, Elsevier, ISBN 978-0122570605, 1999.
Fioletov, V., McLinden, C. A., Griffin, D., Theys, N., Loyola, D. G., Hedelt, P., Krotkov, N. A., and Li, C.: Anthropogenic and volcanic point source SO2 emissions derived from TROPOMI on board Sentinel-5 Precursor: first results, Atmos. Chem. Phys., 20, 5591–5607, https://doi.org/10.5194/acp-20-5591-2020, 2020.
Fish, D. and Jones, R.: Rotational Raman scattering and the ring effect in zenith-sky spectra, Geophys. Res. Lett., 22, 811–814, 1995.
Flynn, L. E., Seftor, C. J., Larsen, J. C., and Xu, P.: The Ozone Mapping and Profiler Suite, in: Earth Science Satellite Remote Sensing, edited by: Qu, J. J., Gao, W., Kafatos, M., Murphy, R. E., and Salomonson, V. V., Springer, Berlin, Heidelberg, https://doi.org/10.1007/978-3-540-37293-6_15, 2006.
Global Volcanism Program: Report on Nyamuragira (DR Congo), edited by: Sennert, S., Weekly Volcanic Activity Report, 6–12 November 2024, Smithsonian Institution and US Geological Survey, 2024a.
Global Volcanism Program: Report on Reykjanes (Iceland), edited by: Sennert, S., Weekly Volcanic Activity Report, 21–27 August 2024, Smithsonian Institution and US Geological Survey, 2024b.
Gottwald, M. and Bovensmann, H.: SCIAMACHY-Exploring the changing Earth's Atmosphere, Springer Science & Business Media, https://doi.org/10.1007/978-90-481-9896-2, 2010.
Heue, K.-P., Brenninkmeijer, C. A. M., Wagner, T., Mies, K., Dix, B., Frieß, U., Martinsson, B. G., Slemr, F., and van Velthoven, P. F. J.: Observations of the 2008 Kasatochi volcanic SO2 plume by CARIBIC aircraft DOAS and the GOME-2 satellite, Atmos. Chem. Phys., 10, 4699–4713, https://doi.org/10.5194/acp-10-4699-2010, 2010.
Keller, C. A., Knowland, K. E., Duncan, B. N., Liu, J., Anderson, D. C., Das, S., Lucchesi, R. A., Lundgren, E. W., Nicely, J. M., and Nielsen, E.: Description of the NASA GEOS composition forecast modeling system GEOS-CF v1.0, J. Adv. Model. Earth Sy., 13, e2020MS002413, https://doi.org/10.1029/2020MS002413, 2021.
Khokhar, M. F., Frankenberg, C., Van Roozendael, M., Beirle, S., Kühl, S., Richter, A., Platt, U., and Wagner, T.: Satellite observations of atmospheric SO2 from volcanic eruptions during the time-period of 1996–2002, Adv. Space Res., 36, 879–887, https://doi.org/10.1016/j.asr.2005.04.114, 2005.
Kleipool, Q., Dobber, M., de Haan, J., and Levelt, P.: Earth surface reflectance climatology from 3 years of OMI data, J. Geophys. Res.-Atmos., 113, https://doi.org/10.1029/2008JD010290, 2008.
Krotkov, N. A., Carn, S. A., Krueger, A. J., Bhartia, P. K., and Yang, K.: Band residual difference algorithm for retrieval of SO2 from the aura Ozone Monitoring Instrument (OMI), IEEE Trans. Geosci. Remote Sens., 44, 1259–1266, https://doi.org/10.1109/Tgrs.2005.861932, 2006.
Krotkov, N. A., McClure, B., Dickerson, R. R., Carn, S. A., Li, C., Bhartia, P. K., Yang, K., Krueger, A. J., Li, Z. Q., Levelt, P. F., Chen, H. B., Wang, P. C., and Lu, D. R.: Validation of SO2 retrievals from the Ozone Monitoring Instrument over NE China, J. Geophys. Res.-Atmos., 113, 259–269, 2008.
Krotkov, N. A., McLinden, C. A., Li, C., Lamsal, L. N., Celarier, E. A., Marchenko, S. V., Swartz, W. H., Bucsela, E. J., Joiner, J., Duncan, B. N., Boersma, K. F., Veefkind, J. P., Levelt, P. F., Fioletov, V. E., Dickerson, R. R., He, H., Lu, Z., and Streets, D. G.: Aura OMI observations of regional SO2 and NO2 pollution changes from 2005 to 2015, Atmos. Chem. Phys., 16, 4605–4629, https://doi.org/10.5194/acp-16-4605-2016, 2016.
Krueger, A. J.: Sighting of El Chichón Sulfur Dioxide Clouds with the Nimbus 7 Total Ozone Mapping Spectrometer, Science, 220, 1377–1379, https://doi.org/10.1126/science.220.4604.1377, 1983.
Kuttippurath, J., Patel, V. K., Pathak, M., and Singh, A.: Improvements in SO2 pollution in India: role of technology and environmental regulations, Environ. Sci. Pollut. R., 29, 78637–78649, 2022.
Lee, C., Martin, R. V., van Donkelaar, A., O'Byrne, G., Krotkov, N., Richter, A., Huey, L. G., and Holloway, J. S.: Retrieval of vertical columns of sulfur dioxide from SCIAMACHY and OMI: Air mass factor algorithm development, validation, and error analysis, J. Geophys. Res., 114, https://doi.org/10.1029/2009jd012123, 2009.
Levelt, P. F., Van den Oord, G. H. J., Dobber, M. R., Malkki, A., Visser, H., de Vries, J., Stammes, P., Lundell, J. O. V., and Saari, H.: The Ozone Monitoring Instrument, IEEE Trans. Geosci. Remote Sens., 44, 1093–1101, https://doi.org/10.1109/Tgrs.2006.872333, 2006.
Li, C., Joiner, J., Krotkov, N. A., and Bhartia, P. K.: A fast and sensitive new satellite SO2 retrieval algorithm based on principal component analysis: Application to the ozone monitoring instrument, Geophys. Res. Lett., 40, 6314–6318, 2013.
Lorente, A., Folkert Boersma, K., Yu, H., Dörner, S., Hilboll, A., Richter, A., Liu, M., Lamsal, L. N., Barkley, M., De Smedt, I., Van Roozendael, M., Wang, Y., Wagner, T., Beirle, S., Lin, J.-T., Krotkov, N., Stammes, P., Wang, P., Eskes, H. J., and Krol, M.: Structural uncertainty in air mass factor calculation for NO2 and HCHO satellite retrievals, Atmos. Meas. Tech., 10, 759–782, https://doi.org/10.5194/amt-10-759-2017, 2017.
Mardani, M., Nowrouzi, M., and Abyar, H.: Assessing the environmental impact of offshore flares in the Persian Gulf: A comprehensive analysis of SO2 emissions, Advances in Environmental Technology, 11, 63–74, 2025.
Mccormick, M. P., Thomason, L. W., and Trepte, C. R.: Atmospheric effects of the Mt. Pinatubo eruption, Nature, 373, 399–404, https://doi.org/10.1038/373399a0, 1995.
Miller, T. P. and Casadevall, T., J.: Volcanic ash hazards to aviation, in: Encyclopedia of Volcanoes, edited by: Sigurdsson, H., Academic Press, San Diego, 915–930, ISBN 978-0126431407, 2000.
Munro, R., Eisinger, M., Anderson, C., Callies, J., Corpaccioli, E., Lang, R., Lefebvre, A., Livschitz, Y., and Albiñana, A. P.: GOME-2 on MetOp, Proc. of The 2006 EUMETSAT Meteorological Satellite Conference, Helsinki, Finland, 12–16 June 2006, https://www-cdn.eumetsat.int/files/2020-04/pdf_conf_p48_s4_01_munro_v.pdf (last access: 10 March 2026), 2006.
Newhall, C. G. and Self, S.: The volcanic explosivity index (VEI) an estimate of explosive magnitude for historical volcanism, J. Geophys. Res.-Oceans, 87, 1231–1238, 1982.
Nowlan, C., Liu, X., Chance, K., Cai, Z., Kurosu, T., Lee, C., and Martin, R.: Retrievals of sulfur dioxide from the Global Ozone Monitoring Experiment 2 (GOME-2) using an optimal estimation approach: Algorithm and initial validation, J. Geophys. Res.-Atmos., 116, https://doi.org/10.1029/2011JD015808, 2011.
Palmer, P. I., Jacob, D. J., Chance, K., Martin, R. V., Spurr, R. J., Kurosu, T. P., Bey, I., Yantosca, R., Fiore, A., and Li, Q.: Air mass factor formulation for spectroscopic measurements from satellites: Application to formaldehyde retrievals from the Global Ozone Monitoring Experiment, J. Geophys. Res.-Atmos., 106, 14539–14550, 2001.
Platt, U. and Stutz, J.: Differential Optical Absorption Spectroscopy: Principles and Applications, Physics of Earth and Space Environments, Springer, Verlag Berlin Heidelberg, 593 pp., https://doi.org/10.1007/978-3-540-75776-4, 2008.
Richter, A.: Algorithm Theoretical Basis Document for the GOME-2 Rapid Volcanic SO2 product, SAVAA project, https://www.iup.uni-bremen.de/doas/so2_alerts/gome2_so2_atbd_091005.pdf (last access: 10 March 2026), 2009.
Richter, A., Wittrock, F., and Burrows, J. P.: SO2 measurements with SCIAMACHY, Proc. Atmospheric Science Conference, Frascati, Italy, 8–12 May 2006, 2006.
Rozanov, A., Rozanov, V., Buchwitz, M., Kokhanovsky, A., and Burrows, J.: SCIATRAN 2.0 – A new radiative transfer model for geophysical applications in the 175–2400 nm spectral region, Adv. Space Res., 36, 1015–1019, 2005.
Seinfeld, J. H. and Pandis, S. N.: Atmospheric chemistry and physics: from air pollution to climate change, John Wiley & Sons, ISBN 978-1118947401, 2016.
Sioris, C. E. and Evans, W. F.: Filling in of Fraunhofer and gas-absorption lines in sky spectra as caused by rotational Raman scattering, Appl. Optics, 38, 2706–2713, 1999.
Theys, N., Campion, R., Clarisse, L., Brenot, H., van Gent, J., Dils, B., Corradini, S., Merucci, L., Coheur, P.-F., Van Roozendael, M., Hurtmans, D., Clerbaux, C., Tait, S., and Ferrucci, F.: Volcanic SO2 fluxes derived from satellite data: a survey using OMI, GOME-2, IASI and MODIS, Atmos. Chem. Phys., 13, 5945–5968, https://doi.org/10.5194/acp-13-5945-2013, 2013.
Theys, N., De Smedt, I., Yu, H., Danckaert, T., van Gent, J., Hörmann, C., Wagner, T., Hedelt, P., Bauer, H., Romahn, F., Pedergnana, M., Loyola, D., and Van Roozendael, M.: Sulfur dioxide retrievals from TROPOMI onboard Sentinel-5 Precursor: algorithm theoretical basis, Atmos. Meas. Tech., 10, 119–153, https://doi.org/10.5194/amt-10-119-2017, 2017.
Theys, N., Hedelt, P., De Smedt, I., Lerot, C., Yu, H., Vlietinck, J., Pedergnana, M., Arellano, S., Galle, B., and Fernandez, D.: Global monitoring of volcanic SO2 degassing with unprecedented resolution from TROPOMI onboard Sentinel-5 Precursor, Sci. Rep., 9, 2643, https://doi.org/10.1038/s41598-019-39279-y, 2019.
Theys, N., Fioletov, V., Li, C., De Smedt, I., Lerot, C., McLinden, C., Krotkov, N., Griffin, D., Clarisse, L., Hedelt, P., Loyola, D., Wagner, T., Kumar, V., Innes, A., Ribas, R., Hendrick, F., Vlietinck, J., Brenot, H., and Van Roozendael, M.: A sulfur dioxide Covariance-Based Retrieval Algorithm (COBRA): application to TROPOMI reveals new emission sources, Atmos. Chem. Phys., 21, 16727–16744, https://doi.org/10.5194/acp-21-16727-2021, 2021.
Tilstra, L. G., de Graaf, M., Trees, V. J. H., Litvinov, P., Dubovik, O., and Stammes, P.: A directional surface reflectance climatology determined from TROPOMI observations, Atmos. Meas. Tech., 17, 2235–2256, https://doi.org/10.5194/amt-17-2235-2024, 2024.
Twomey, S.: The influence of pollution on the shortwave albedo of clouds, J. Atmos. Sci., 34, 1149–1152, 1977.
Vandaele, A. C., Hermans, C., and Fally, S.: Fourier transform measurements of SO2 absorption cross sections: II. Temperature dependence in the 29 000–44 000 cm(-1) (227–345 nm) region, J. Quant. Spectrosc. Ra., 110, 2115–2126, https://doi.org/10.1016/j.jqsrt.2009.05.006, 2009.
van Geffen, J. H. and van Oss, R. F.: Wavelength calibration of spectra measured by the Global Ozone Monitoring Experiment by use of a high-resolution reference spectrum, Appl. Optics, 42, 2739–2753, 2003.
Veefkind, J., Aben, I., McMullan, K., Förster, H., De Vries, J., Otter, G., Claas, J., Eskes, H., De Haan, J., and Kleipool, Q.: TROPOMI on the ESA Sentinel-5 Precursor: A GMES mission for global observations of the atmospheric composition for climate, air quality and ozone layer applications, Remote Sens. Environ., 120, 70–83, 2012.
Voors, R., De Vries, J., Bhatti, I. S., Lobb, D., Wood, T., Nick, V. D. V., Aben, I., and Veefkind, P.: TROPOMI, the Sentinel 5 precursor instrument for air quality and climate observations: status of the current design, Society of Photo-optical Instrumentation Engineers, https://doi.org/10.1117/12.2309017, 2017.
Vountas, M., Rozanov, V., and Burrows, J.: Ring effect: Impact of rotational Raman scattering on radiative transfer in Earth's atmosphere, J. Quant. Spectrosc. Ra., 60, 943–961, 1998.
Wagner, T., Burrows, J. P., Deutschmann, T., Dix, B., von Friedeburg, C., Frieß, U., Hendrick, F., Heue, K.-P., Irie, H., Iwabuchi, H., Kanaya, Y., Keller, J., McLinden, C. A., Oetjen, H., Palazzi, E., Petritoli, A., Platt, U., Postylyakov, O., Pukite, J., Richter, A., van Roozendael, M., Rozanov, A., Rozanov, V., Sinreich, R., Sanghavi, S., and Wittrock, F.: Comparison of box-air-mass-factors and radiances for Multiple-Axis Differential Optical Absorption Spectroscopy (MAX-DOAS) geometries calculated from different UV/visible radiative transfer models, Atmos. Chem. Phys., 7, 1809–1833, https://doi.org/10.5194/acp-7-1809-2007, 2007.
Wang, C., Wang, T., Wang, P., and Wang, W.: Assessment of the performance of TROPOMI NO2 and SO2 data products in the North China Plain: comparison, correction and application, Remote Sens.-Basel, 14, 214, https://doi.org/10.3390/rs14010214, 2022.
Wang, Q., Wang, Y., Xu, N., Mao, J., Sun, L., Shi, E., Hu, X., Chen, L., Yang, Z., and Si, F.: Preflight Spectral Calibration of the Ozone Monitoring Suite-Nadir on FengYun 3F Satellite, Remote Sens.-Basel, 16, 1538, https://doi.org/10.3390/rs16091538, 2024.
Xu, J., Wang, Y., Chen, L., Efremenko, D., Rao, L., Tana, G., Liu, S., Wang, Q., Mao, J., and Wang, Y.: First total ozone column observations from the Ozone Monitoring Suite-Nadir (OMS-N) onboard China's FengYun-3F satellite, Sci. China Earth Sci., 68, 3665–3683, 2025.
Yan, H., Wang, W., and Chen, L.: Temperature effects on the retrieval of SO2 from ultraviolet satellite observations, Proc. SPIE, 379–386, 2014.
Yan, H., Wang, H., Wang, W., and Zhang, X.: Volcanic SO2 retrieved from GF-5 Environmental trace gas Monitoring Instrument, National Remote Sensing Bulletin, 25, 2326–2338, https://doi.org/10.11834/jrs.20210303, 2021.
Yang, K., Krotkov, N. A., Krueger, A. J., Carn, S. A., Bhartia, P. K., and Levelt, P. F.: Retrieval of large volcanic SO2 columns from the Aura Ozone Monitoring Instrument: Comparison and limitations, J. Geophys. Res., 112, D24S43, https://doi.org/10.1029/2007JD008825, 2007.
Yang, K., Krotkov, N. A., Krueger, A. J., Carn, S. A., Bhartia, P. K., and Levelt, P. F.: Improving retrieval of volcanic sulfur dioxide from backscattered UV satellite observations, Geophys. Res. Lett., 36, https://doi.org/10.1029/2008GL036036, 2009.
Yang, K., Liu, X., Bhartia, P. K., Krotkov, N. A., Carn, S. A., Hughes, E. J., Krueger, A. J., Spurr, R. J., and Trahan, S. G.: Direct retrieval of sulfur dioxide amount and altitude from spaceborne hyperspectral UV measurements: Theory and application, J. Geophys. Res.-Atmos., 115, https://doi.org/10.1029/2010JD013982, 2010.
Yang, K., Dickerson, R. R., Carn, S. A., Ge, C., and Wang, J.: First observations of SO2 from the satellite Suomi NPP OMPS: Widespread air pollution events over China, Geophys. Res. Lett., 40, 4957–4962, 2013.
Zhao, M., Si, F., Wang, Y., Zhou, H., Wang, S., Jiang, Y., and Liu, W.: First Year On-Orbit Calibration of the Chinese Environmental Trace Gas Monitoring Instrument Onboard GaoFen-5, IEEE Trans. Geosci. Remote Sens., 58, 8531–8540, 2020.
- Abstract
- Introduction
- The FY-3F/OMS Instrument
- SO2 column retrievals from FY-3F/OMS
- Comparison of OMS SO2 columns with TROPOMI observations
- Error analysis
- Conclusions and future work
- Data availability
- Author contributions
- Competing interests
- Disclaimer
- Acknowledgements
- Financial support
- Review statement
- References