the Creative Commons Attribution 4.0 License.
the Creative Commons Attribution 4.0 License.
 | 28 Jan 2026
Quality aspects of Fengyun3 D∕E radio occultation bending angle products
Ying Li
Yan Liu
Wenwu Ding
Mi Liao
Xingliang Huo
Jinying Ye
This study systematically evaluated the quality of ionosphere-corrected bending angles from Fengyun3 (FY3) satellites (equipped with GPS and BDS receivers) using ERA5 data as references and MetOp products as comparisons. The quality of subsequent retrieved optimized bending angles, refractivity, and temperature were also analysed. Ionosphere-corrected bending angle were assessed via two approaches: outlier detection across 10–80 km and quantification. Overall quality evaluation showed that FY3 ionosphere-corrected bending angles were consistent with MetOp below 40 km. Above 40 km, FY3 bending angles exhibited larger errors than MetOp. In outlier detection, MetOp had less than 5 % bad profiles, followed by FY3D (<10 %), while FY3E (GPS/BDS) had about 20 % bad profiles. FY3E-GPS bending angles are prone to have large outliers in the height range of 35–50 km. For bias and noise quantification, the daily mean biases and noise levels of FY3 satellites were higher than those of MetOp. Specifically, FY3E-GPS showed notable large daily mean biases of about −0.4 µrad and most of these biases are in setting RO events. FY3D and FY3E-BDS ranked second, with biases of approximately −0.1 µrad. MetOp had the smallest biases, at around −0.05 µrad. Regarding noises, FY3D, FY3E-GPS exhibited comparable noise levels, at roughly 2.5 µrad; FY3E-BDS had lower noises of 1.5 µrad. MetOp noises are smallest at about 1.0 µrad. Due to the larger biases and noises at high altitudes, FY3's optimized bending angles were strongly corrected by background bending angles. Refractivity and temperature were also influenced by the strong correction of optimized bending angle. In summary, FY3 ionosphere-bending angles show high quality below 40 km. However, at high altitudes, further efforts are required for improving FY3 data's utility in numerical weather prediction and climate studies, especially for stratospheric applications.
- Article
(12081 KB) - Full-text XML
- BibTeX
- EndNote


Global Navigation Satellite System (GNSS) radio occultation is a robust atmospheric remote sensing technique for sensing the Earth's atmosphere (Kursinski et al., 1997; Hajj et al., 2002). It provides vertical profiles, such as temperature, pressure, density and water vapour of the Earth's atmosphere. The basic theory of GNSS RO is to put RO receivers on the Low Earth Orbit (LEO) satellite to receive GNSS signals. While propagating through the atmosphere, GNSS signals will be bent due to refractive gradient. Given the orbits of GNSS and LEO satellites, the accumulated bending angle can be retrieved using geometric optic method (Melbourne et al., 1994). Since refractivity is related to bending angle, it can be calculated through the Abel transform. In dry air condition, where the existence of water vapour can be neglected (Foelsche et al., 2008), temperature, density and pressure can be resolved using existing atmospheric relation equations in terms of the Smith–Weintraub equation, the ideal-gas law and the hydrostatic equation (Kursinski et al., 1997; Hajj et al., 2002). In moist air condition, additional background temperature/humidity profiles are required for calculating atmospheric profiles (e.g., Healy and Eyre, 2000; Syndergaard et al., 2018; Li et al., 2019).
RO data has several distinctive advantages, such as high vertical resolution, high accuracy (in the upper troposphere and lower stratosphere), self-calibration, all-weather condition and long-term consistency (Kirchengast, 2004; Steiner et al., 2011). Therefore, RO data has been widely used in numerical weather prediction, climate monitoring and space weather researches (Anthes, 2011). Positive impacts were received from these applications. For example, assimilation of RO data has significantly improved the performance of numerical weather prediction systems (e.g., Cucurull and Derber, 2008; Healy and Eyre, 2000; Huang et al., 2010; Singh et al., 2021). With 11 000 RO profiles being assimilated, RO is approaching being the most impactful dataset (Cardinali and Healy, 2014; Eyre et al., 2022). Meanwhile, RO data have been proved to be useful in temperature trends detection (e.g., Steiner et al., 2011, 2020), atmospheric boundary detection (e.g., Ao et al., 2012; Guo et al., 2011; Sokolovskiy et al., 2006), tropopause identification (e.g., Rieckh et al., 2014; Schmidt et al., 2010), sudden stratospheric warming events diagnostics (e.g., Li et al., 2021, 2023) and also tropical cyclones detection (e.g., Teng et al., 2023; Yang et al., 2023).
The first Low Earth Orbit (LEO) mission to employ the Radio Occultation (RO) technique was GPS/MET, launched in 1995 (Hocke, 1997; Ware et al., 1996). This mission successfully observed and retrieved highly accurate atmospheric profiles in the upper troposphere and lower stratosphere (Rocken et al., 1997; Steiner et al., 1999), thereby validating the concept of the GNSS RO technique for Earth's atmospheric sensing. Since 2000, a series of continuous RO missions have been launched, starting with the Challenging Mini-Satellite Payload (CHAMP) mission (Wickert et al., 2001), followed by the Gravity Recovery and Climate Experiment (GRACE) mission (Wickert et al., 2005). In 2006, the Constellation Observing System for Meteorology, Ionosphere, and Climate (COSMIC) mission – composed of six satellites – greatly advanced RO observations (Schreiner et al., 2007). Beginning in 2008, the European Meteorological Operational (MetOp) satellite program launched MetOp-A (Luntama et al., 2008), followed by MetOp-B in 2012 and MetOp-C in 2018. In 2013, China launched its first RO satellite: the Fengyun (FY) 3C (Liao et al., 2015, 2016a, 2016b; Sun et al., 2018). This satellite carried China's first domestically designed GNSS Occultation Sounder (GNOS) receiver. After FY3C, subsequent satellites in the FY3 series – FY3D through FY3G – have been gradually launched in recent years (Sun et al., 2023; Liu et al., 2023; He et al., 2023; Mo et al., 2024). Among these series of satellites, the FY3C and FY3D carried the first version of GNOS receiver (GNOS-I) and FY3E to FY3G carried the second version of GNOS RO receiver (GNOS-II).
In addition to these satellites (Bai et al., 2014) launched by institutional entities, a large number of commercial satellites have also been deployed. One of the earliest commercial RO satellites was launched by Spire in 2017. To date, Spire has launched approximately 60 RO satellites and now provides around 20 000 high-quality atmospheric profiles per day (Bowler, 2020; Nguyen et al., 2022). PlanetiQ has launched five RO-related satellites and delivers over 6600 high-quality neutral atmospheric profiles daily (Kursinski et al., 2024). In China, both the Tianmu and Yunyao satellite constellations have been put into operation: the companies behind these constellations have launched dozens of RO satellites, with more planned for future deployment (Xu et al., 2025). Collectively, these institutional and commercial satellites have created unique opportunities for weather and climate research.
In recent years, the Radio Occultation modelling experiment (ROMEX) has been endorsed by the international radio occultation working group (Anthes et al., 2024). This experiment collects up to 35 000 RO profiles per day over a three months' period and tests the impacts of these data on numerical weather prediction system. The data are available to all users for testing in global and regional models, and they are also available for other scientific studies in weather and climate. Initial results found good impacts on Numerical Weather Prediction (NWP) system (e.g., Anlauf, 2024; Li et al., 2024; Lonitz, 2024) and on forecasts of Atlantic hurricanes (Miller et al., 2024).
The purpose of our work is to further evaluate and improve data quality of Fengyun series RO satellites in the stratospheric region. As a first step, this study works on analysing the quality aspects of Fengyun RO ionosphere-corrected bending angles in terms of data quality as well as biases and noises. Several works have analysed the quality of Fengyun series RO satellites. Liao et al. (2016b) has validated RO refractivity of FY3C satellite. Results showed that its refractivity quality were similar to COSMIC and MetOp in the height range of 0–30 km. In addition, it also points out that FY3C products needed further improvement above 30 km. Sun et al. (2018) reviewed the FY3C GNOS instrument, RO data processing, and data quality evaluation. Their results further demonstrated that FY3C can provide accurate atmospheric profiles below 30 km and reliable ionospheric products. Bai et al. (2018) discussed the differences between the single-difference and zero-difference clock corrections applied to RO observations and found negligible discrepancies between the two methods. With the launch of the FY3E satellite, which is equipped with the GNOS-II receiver, several studies have further evaluated the quality of GNOS-II RO observations (Liu et al., 2023; He et al., 2023; Liang et al., 2024; Mo et al., 2024). These studies have further confirmed the high quality of GNOS-II RO profiles in the upper troposphere and lower stratosphere. Beyond these published papers, ROMSAF has also released two reports that analyse the data quality of FY3C and FY3E (Bowler et al., 2019; Lewis et al., 2025).
Although, there are already many existing evaluation works, many key aspects have never been discussed yet, e.g., bending angle quality. Unlike the case of statistical optimization and 1dVAR (e.g., Li et al., 2013, 2019), the retrieval of bending angle is not influenced by background models. Understanding the quality of ionosphere-corrected bending angle is useful for assessing the quality of subsequently retrieved RO products. However, the quality of bending angle has rarely been discussed before, especially above the middle stratospheric layers (>30 km). In order to further improve Fengyun data quality and get ready for more widely numerical weather prediction applications, it is important to improve Fengyun atmospheric profiles above middle stratospheric layers. Therefore, this research works on examing the quality of Fengyun ionosphere-corrected bending angle and their influences on subsequently retrieved RO profiles in terms of optimized bending angle, refractivity and temperature. This study is a joint work between Innovation Academy for Precision Measurement Science and Technology Chinese Academy of Sciences (CAS) and China Meteorology Administration Earth System Modeling and Prediction Centre Chinese Meteorology Administration (CMA) aiming at improving the performance of Fengyun data in its NWP system. It is expected that the outcome of this study and also our subsequent research are useful for further enhancing NWP system of CMA and for improving the application of Fengyun data in stratospheric climate applications.
2.1 Data
In this study, we used Fengyun-3D (FY3D), Fengyun-3E GPS (FY3E-GPS), Fengyun-3E BDS (FY3E-BDS) and MetOp (METC) RO ionosphere-corrected bending angle observations, optimized bending angle, refractivity and dry temperature profiles. The data period is August 2023. Fengyun data can be downloaded from Fengyun satellite data service provided by the National Satellite Meteorological Center (NSMC) CMA. It is also known that the Fengyun data has been updated since 2025 to improve its data quality below 30 km. However, this does not affect our results in this study since we focus on bending angle quality above 30 km. The MetOp data we used are the Interim Climate Data Records (ICDRs). Such data can be downloaded from the official website of ROMSAF. It provides reprocessed bending angle, refractivity, dry temperature, 1dVar products. There products have a high degree of internal consistency, which is important for climate monitoring.
Figure 1 shows the number of observations of all four types of observations in August. It can be seen that Fengyun observations are generally of similar numbers to MetOp with observed profiles vary from 500 to 600 per day. However, from 18 to 24 August, the numbers FY3D and FY3E-GPS decrease with values are about 400–500. Panel (b) shows the latitudinal distributions of these four types of RO observations during three days of 14–16 August 2023. RO observations are found to be largest in two middle latitudes of both two hemispheres, i.e., 20–60° S and 20–60° N. In the two polar regions, observations are smallest with numbers are about 200 for the three days. Panel (c) shows numbers of setting observations and rising observations. The differences between rising and setting events for all four types of observations are generally within 20 %. FY3D, FY3E-GPS and METC have more setting events than rising events. However, FY3E-BDS records more rising events, and the reason for this remains unknown, which requires further investigation in the future. Overall, the number of RO observations, and also latitudinal distributions or the types of RO events between Fengyun and MetOp satellites are of similar characteristics.
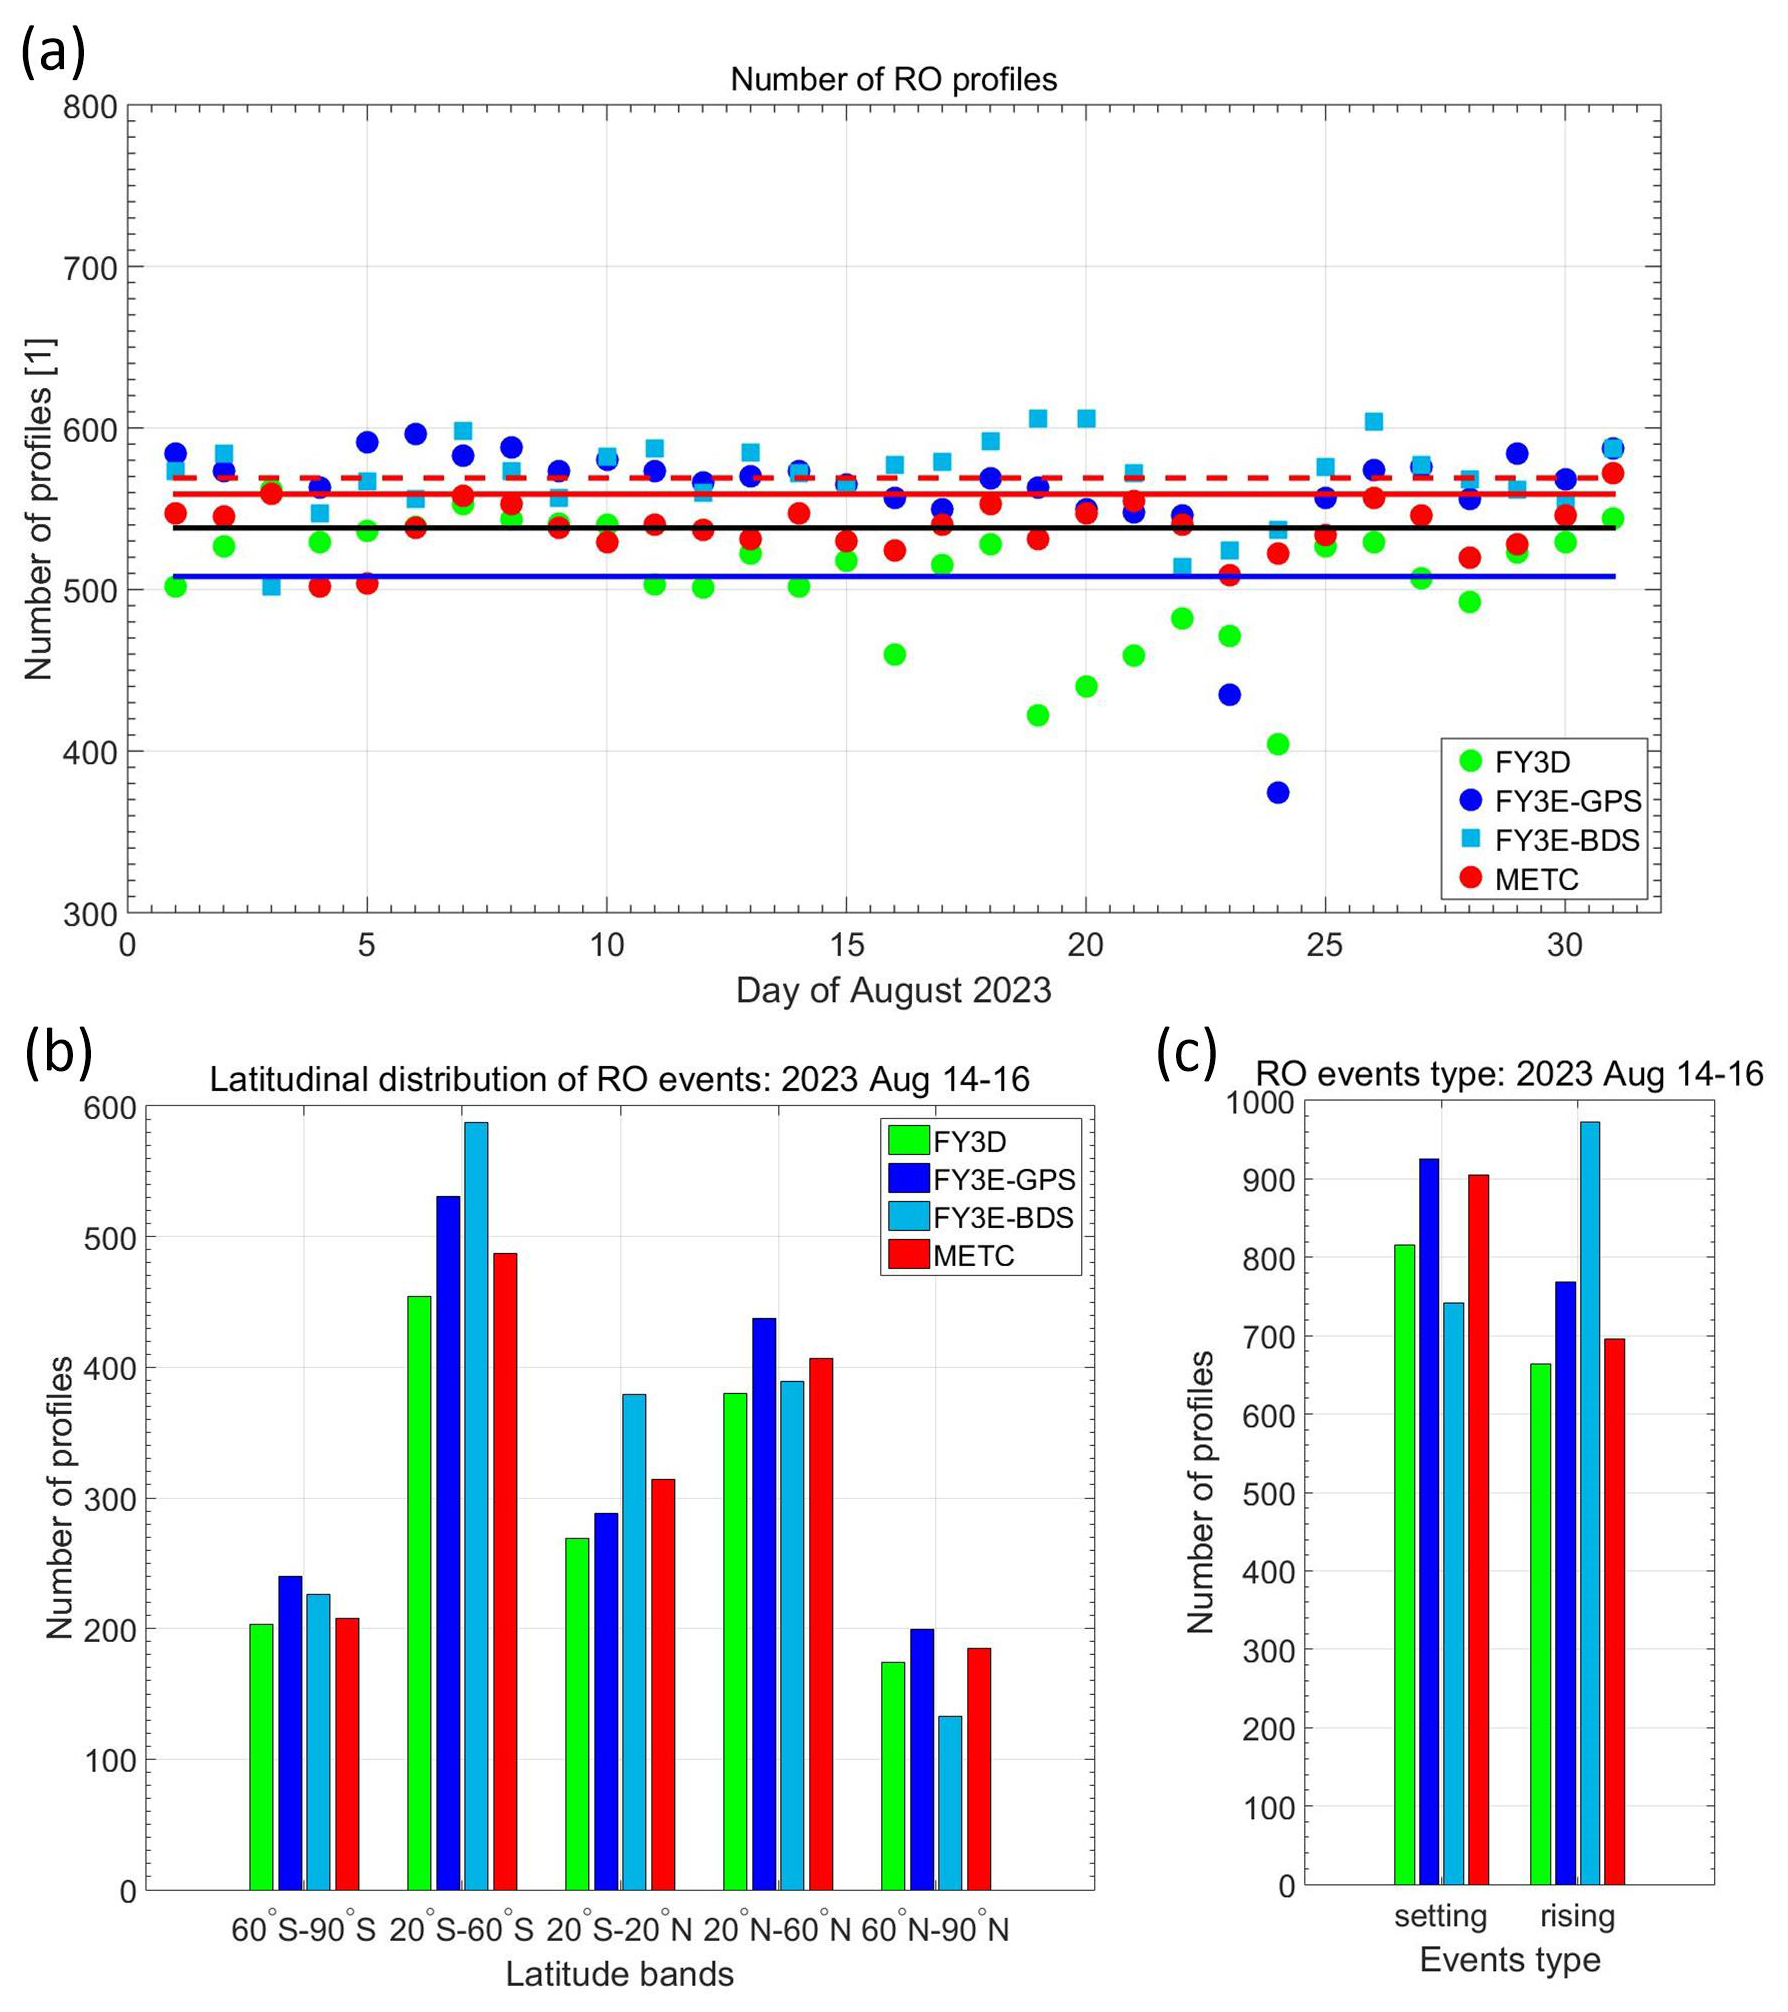
Figure 1Panel (a): daily number of FY3D, FY3E-GPS, FY3E-BDS events in August 2023; Panel (b): number of RO events during the three days of 14–16 August 2023 in five latitude bands of SHP (60–90° S), SHSM (20–60° S), TRO (20° S–20° N), NHSM (20–60° N) and NHP (60–90° N); Panel (c): number of setting and rising events of the four types of RO observations during 14–16 August 2023.
In order to calculate RO biases and observations, we also used European Centre for Medium-Range Weather Forecasts (ECMWF) reanalysis version 5 (ERA5) data in this study as a comparison to calculate these uncertainties. ERA5 is the fifth-generation ECMWF atmospheric reanalysis of the global weather and climate (Hersbach et al., 2019, 2020; Simmons et al., 2020). It was produced for the European Copernicus Climate Change (C3S) by ECMWF and replaces the ERA-Interim reanalysis (Dee et al., 2011), which stopped being produced by August 2019. Such reanalysis data combines model data with observations from across the world into a globally complete and consistent dataset using the laws of physics. It provides atmospheric profiles on regular spatial grids and temporal layers. Most of the current researches used ERA5 data on 37 vertical levels. However this type of data is only up to about 40 km. In order to compare data from middle stratospheric above, this research used 137 vertical levels' data from the surface up to an altitude of about 80 km. Four time layers, in terms of 00:00, 06:00, 12:00 and 18:00 UTC are used. In order to match with the horizontal resolution of RO data, we used the 2.5° lat×2.5° lon resolution ERA5 data.
It should be noted that both MetOp data and FY3 data have been assimilated into ERA5. However, the impacts on our results can be minor for two reasons. First, assimilation of RO data are mostly below the middle stratosphere. However, this study mainly focus on the quality of bending angle above the middle stratosphere. Secondly, due to relatively smaller number of MetOp and FY3 RO observations, their influences on the calculated ERA5 data can be neglected.
2.2 Methodology
In designing a quality control scheme for RO bending angles, we reviewed several published quality control schemes. For instance, Scherllin-Pirscher et al. (2015) developed a series of quality control schemes for constructing BAROCLIM bending angle model. Angerer et al. (2017) proposed a new set of quality control schemes for RO bending angles. Additionally, ROMSAF has developed a series of quality control systems for its reprocessing system (Syndergaard et al., 2018). The quality control schemes of our study are empirically based. First of all, we used the quality control of above mentioned studies as basis and then apply them to Fengyun and MetOp data. After that we compare the calculated statistical errors with results in previous literatures and then adjusting corresponding schemes. For example, current schemes lack quality control in the height range of 35–50 km. However, we found that quality control in this height range is necessary since some Fengyun data may have outliers. Moreover, some previous schemes employ a minimum bending angle quality control method. However, it is also not suitable for MetOp data since MetOp exhibits lower noise level in its RO bending angles (Angerer et al., 2017). By several iterative process, we finally obtained the quality control scheme in this study as shown in Table 1.
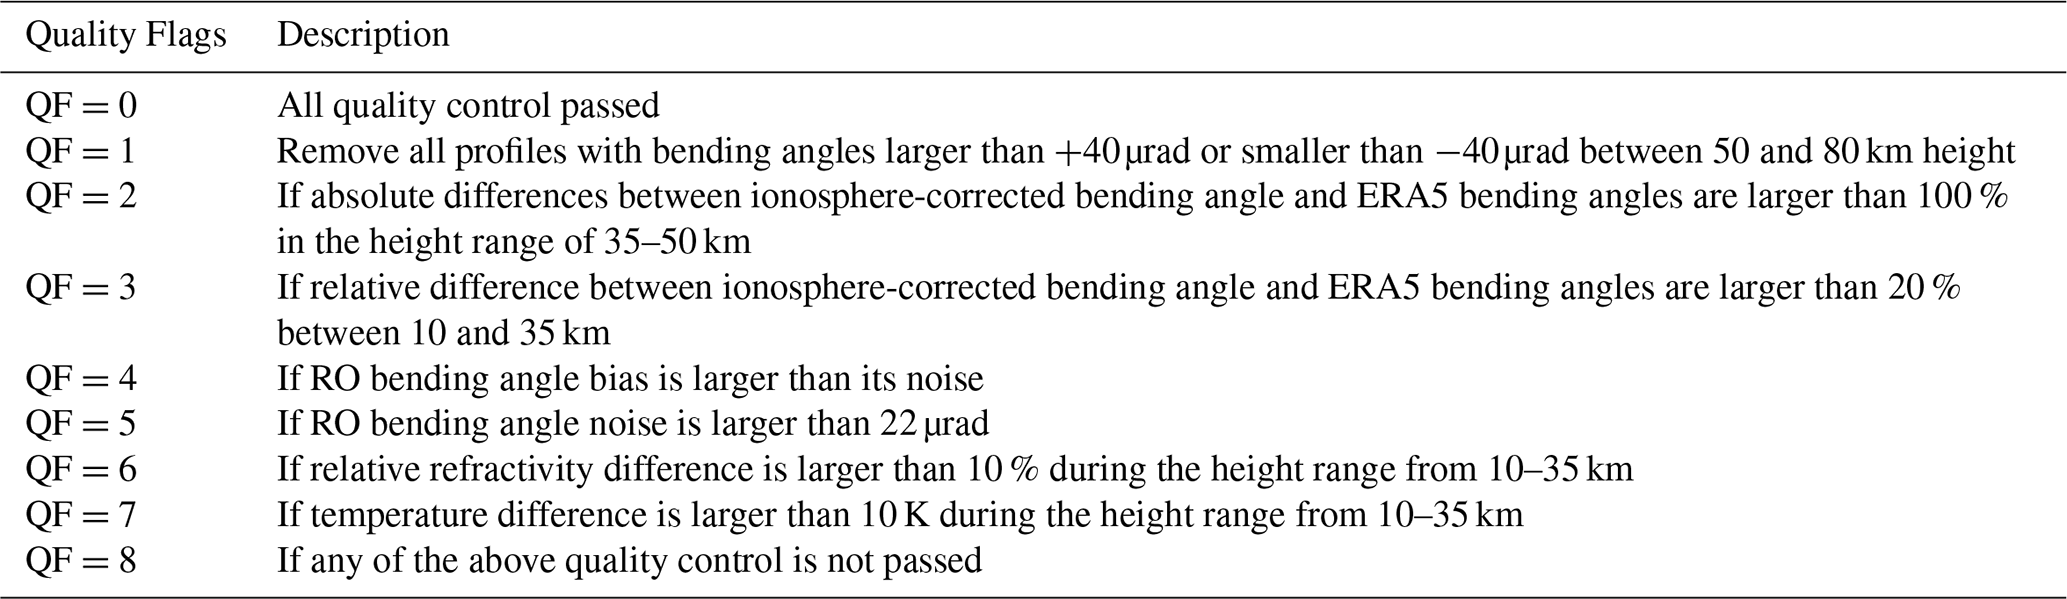
Based on the above empirical quality control schemes and our own analysis on Fengyun data in this study, we designed an empirically derived bending angle quality control scheme (as shown in Table 1) for Fengyun and MetOp products. This scheme includes seven quality flags. Quality flags 1 to 3 (QF1 to QF3) are used to detect and reject outliers in bending angles in the height range of 50–80, 35–50, and 10–35 km height ranges, respectively. The thresholds are empirically obtained based on the experience of existing publications as discussed above and also our internal tests. QF4 and QF5 are used to reject RO profiles with excessive bending angle noise at high-altitude regions. Bending angle biases and noises are calculated as the mean systematic differences and standard deviations of ionosphere-corrected bending angle against ERA5 bending angle from the height range of 50 km to 80 km (or to the top of a profile). The specifically equations can be seen from Pirscher (2010).
Bending angle biases and noises are calculated as the mean systematic differences and standard deviations of ionosphere-corrected bending angle αRO against ERA5 bending angle αERA5 from the height range of 50 to 80 km (or to the top of a profile). The specifically equations are taken from Pirscher (2010):
and the equation of bending angle noise is:
It should be noted that compared to Pirscher (2010), we use bending angles down to 50 km due to relatively larger noises of Fengyun data. QF4 is used to reject profiles where the bending angle bias exceeds the noise level – indicating that bias-inducing error sources are so significant that they outweigh the noise, making such bending angles unreliable. Furthermore, QF5 is used to reject profiles where bending angle noise exceeds 22 µrad. We assume that if one of the bending angle quality flags is not equal to zero (good quality), this profile is not reliable and should be rejected.
In addition to bending angle quality, we also check quality of refractivity and temperature profiles in the height range of 10–35 km height range. This is used to further reject RO events that may suffer from large errors. Both refractivity and temperature profiles are checked in the height range of 10–35 km. If refractivity difference profile exceed the threshold of 10 % (QF6) or if a temperature profile exceed threshold of 10 K (QF7), then this profile is discarded. QF0 indicates a profile of good quality, i.e., where no quality issues have been detected. QF8 indicates that at least one of the seven quality flags has a non-zero value.
Based on the above methodology, this section presents the Fengyun bending angle quality evaluation results. Section 3.1 presents bending angle statistical errors as an overall view for understanding Fengyun bending angle quality. Section 3.2 introduces bending angle outlier rejection results and the characteristics of these quality flags are also analysed. Section 3.3 then introduces the quality issues related to biases and noises and their characteristics.
3.1 Bending angle statistical errors
Figure 2 presents systematic differences and standard deviations between ionosphere-corrected bending angles and ERA5 bending angles across six latitudinal bands globally: the entire globe (90° S to 90° N, Global), low latitudes (20° S to 20° N, Tropics = TRO), mid-latitudes (20° S/N to 60° S/N, with SHSM/NHSM referring to the southern/northern hemisphere subtropics and mid-latitudes), and high latitudes (60° S/N to 90° S/N, SHP/NHP = southern/northern hemisphere high latitudes). These profiles are derived from QF=0 data to avoid the influences of large biases and noises. The systematic differences of all four observations among the six latitudinal bands below 40 km are small and comparable. However, discrepancies become apparent above 40 km. The Fengyun series exhibit larger biases, while MetOp has the smallest biases. In terms of bending angle noise, FY3E-GPS and FY3D have the highest levels of bending angle noise – approximately 1 % to 3 % larger than those of MetOp. Bending angle noises of FY3E-BDS falls in the middle, being roughly 0.5 % to 2 % higher than that of MetOp. This suggests that the GNOS BDS observations have smaller noises than the GNOS GPS observations. This can be attributed to two reasons. First, the constellation geometry of BDS, which includes GEO and IGSO satellites with much slower relative motion with respect to LEO platform. This leads to relatively smaller Doppler rate and more stable carrier-phase tracking for BDS occultation. Second, GPS satellites P2 signal operates in a code-free tracking model, which consequently results in a slightly inferior tracking performance.
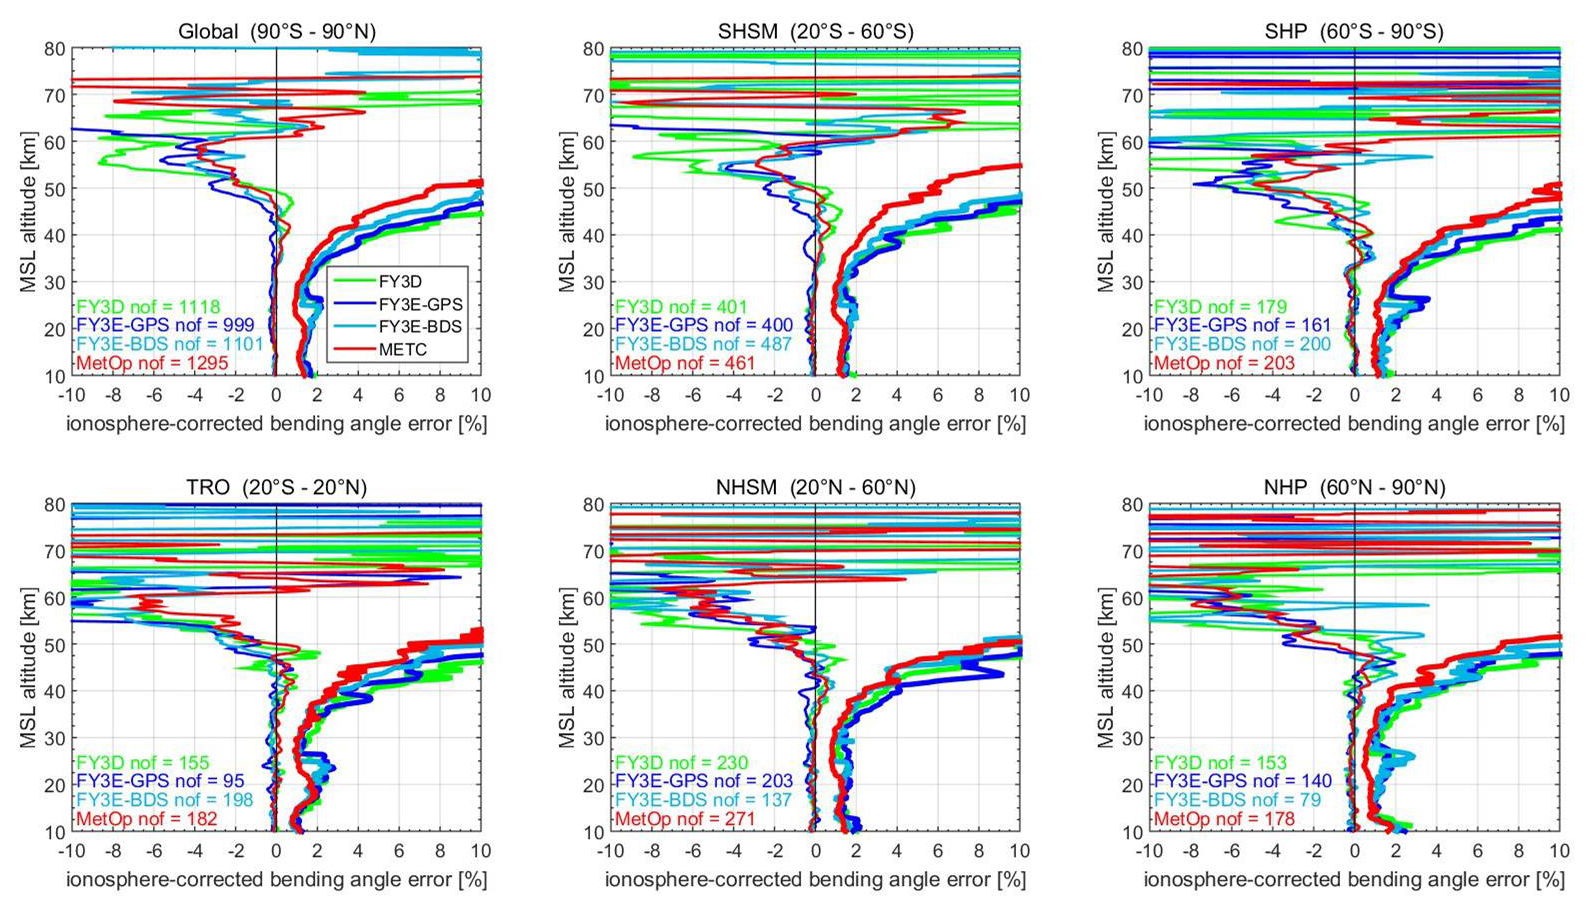
Figure 2Upper two rows: systematic differences (thin lines) and standard deviations (thick lines) of ionosphere-corrected bending angle against ERA5 data during 14–16 August 2023 time period in six latitudinal bands of Global (90° S–90° N), SHP (60–90° S), SHSM (20–60° S), TRO (20° S–20° N), NHSM (20–60° N) and NHP (60–90° N), results of FY3D, FY3E-GPS, FY3E-BDS and MetOp are shown. Numbers of profiles in each region (e.g., FY3D-nof) are indicated in each panel.
When comparing statistical errors across different latitudinal bands, the largest errors are found in the SHP (Southern Hemisphere Polar) region. This can be attributed to the high uncertainty of ECMWF data in polar regions (Li et al., 2013, 2015). A spike transition at about 25 km is observable in the error profiles of Fengyun satellites. This is primarily due to two reasons: (1) extrapolation of L2 signal at fixed 25 km; (2) fixed transition height at 25 km). Since 2025, the RO retrieval algorithm has been revised at CMA. First, the extrapolation height of L2 will be determined by the quality of L2 signal. Second, the fixed transition height was changed from 25 to 15 km. By this revision, the standard deviations of refractivity has been reduced by about 0.5 % in this height range. In the calculation of statistical errors, we found that enhancing quality control in the middle and upper stratosphere helps to further filter out outliers of Fengyun satellites – particularly for FY3E-GPS. This is the reason we introduced QF=3: specifically, if the absolute difference between values at 35 and 50 km exceeds 100 %, the profile is discarded (see Sect. 2). This criterion removes approximately 2 % of additional Fengyun profiles but is highly effective in eliminating outliers in the middle and upper stratosphere.
Figure 3 presents the exemplary correlation functions and correlation coefficient contours of ionosphere-corrected bending angles. The top two rows display correlation functions at exemplary heights of 20, 40, and 60 km, covering the same six latitudinal bands as shown in Fig. 2. The third row shows the correlation coefficient contours for FY3D, FY3E-GPS, and MetOp. Since the correlation coefficients of FY3E-BDS are similar to FY3E-GPS, the contours for FY3E-BDS are not included here. Examining the first two rows, the ionosphere-corrected bending angle correlation coefficients of all three satellites are generally comparable at the main peak, with shapes resembling an exponential function and correlation lengths of approximately 1 km. The correlation functions exhibit greater noise in the TRO (Tropical) and NHP (Northern Hemisphere Polar) regions, which is attributed to the smaller number of atmospheric profiles available in these areas. All Fengyun bending angles show anomalous curves below 26 km; this phenomenon is also associated with the transition from the Geometric Optics (GO) method to the Wave Optics (WO) method. This finding is also consistent with Lewis et al. (2025). The third row presents the correlation coefficients of all three sets of observations. Overall, the correlations are weak and comparable across the three observations. Similarly, the correlation coefficients of Fengyun bending angles exhibit abnormal biases of 0.2–0.4 from 26 km downward.
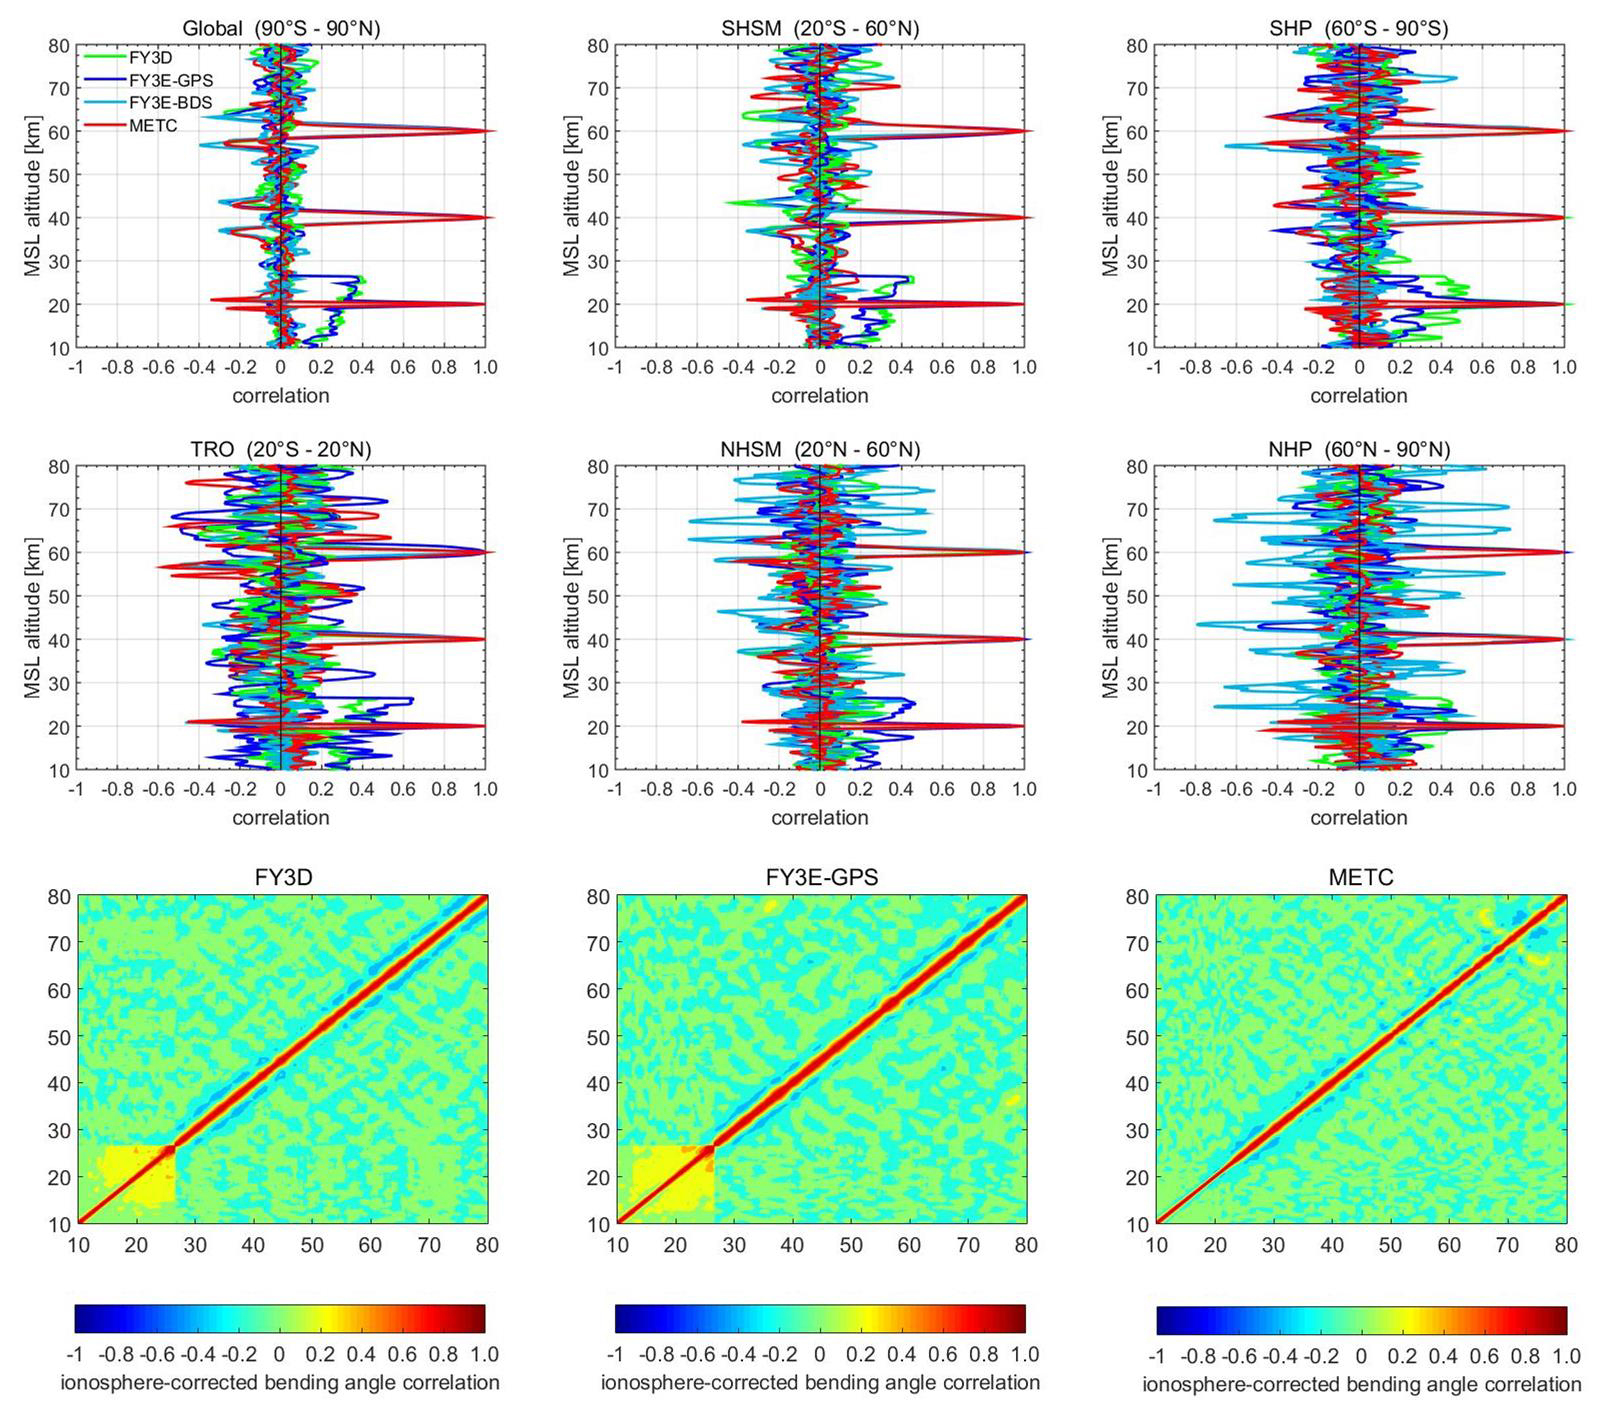
Figure 3Upper two rows: correlation functions of ionosphere-corrected bending angle at three exemplary heights of 20, 40, and 60 km across the same six latitudinal bands as Fig. 2, and results of all four types of observations are shown. Third row: correlation coefficients of ionosphere-corrected bending angle of FY3D, FY3E-GPS and METC observations.
3.2 Bending angle quality evaluation
Figure 4 presents the daily time series of the percentage of poor-quality flags for RO bending angles across all four observational datasets. To quantify the characteristics of each quality flag, individual profiles were inspected for all flag categories; consequently, a single profile may be assigned multiple quality flags. Focusing on QF8 (denoted by red dots), which indicates overall poor-quality profiles, FY3E-GPS profiles exhibit the highest percentage of poor-quality profiles among all datasets, ranging from 35 % to 45 %. FY3E-BDS bending angles rank second, with their proportion of poor-quality profiles also spanning 30 % to 40 %. The quality of FY3D observations is superior to that of FY3E: the percentage of poor-quality profiles for FY3D mostly varies between 20 % and 30 %. In contrast, MetOp data demonstrate the best quality, with the percentage of poor-quality profiles typically around 20 %. Since the overall quality also includes quality control on refractivity, which we set as a strict criteria, the bad quality percentage are higher than that solely use bending angle.
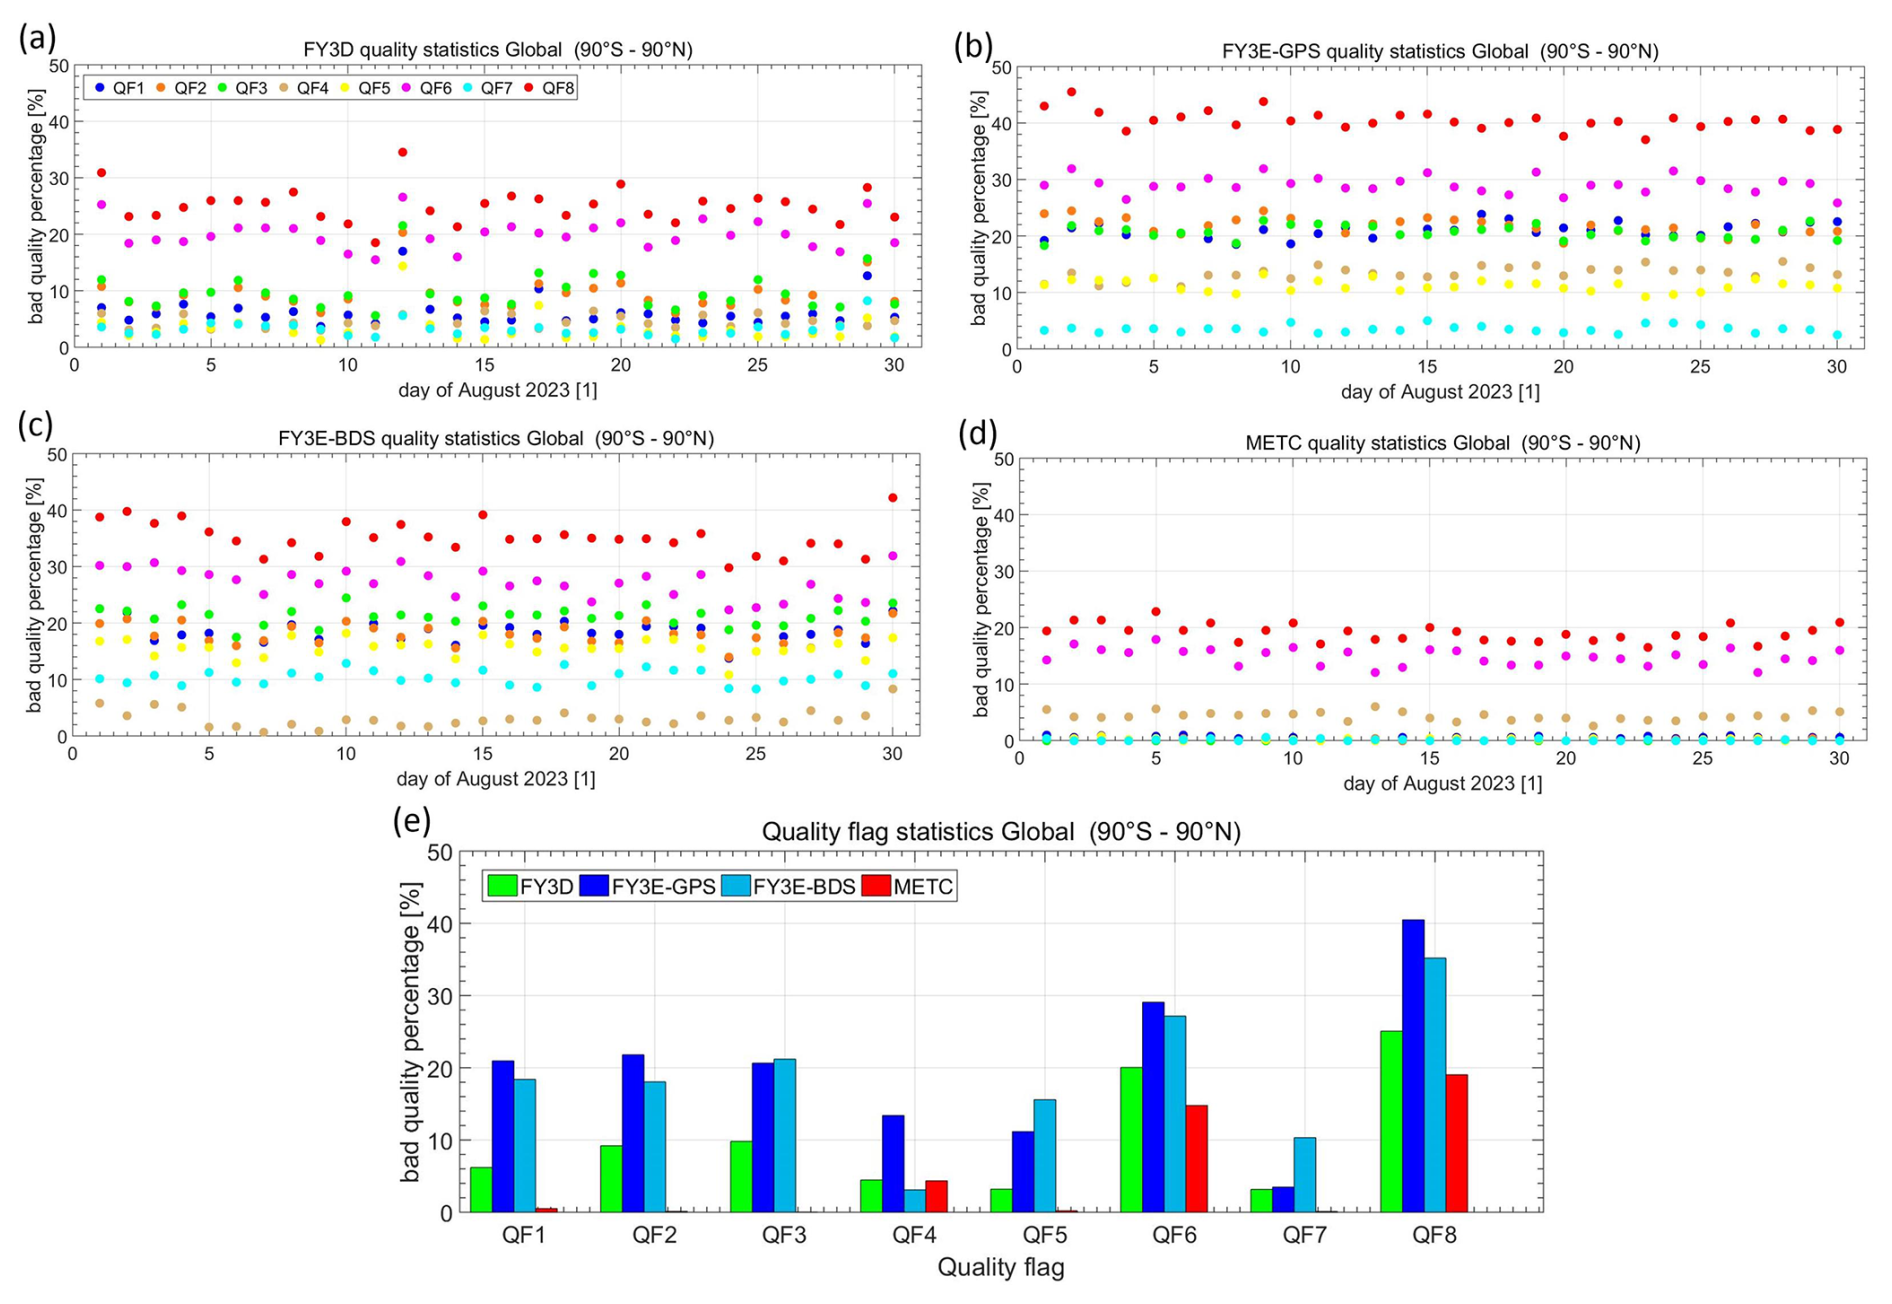
Figure 4Panels (a–d): time series of daily mean percentage of bad quality flags (QF1–QF8 see Table 1) for FY3D, FY3E-GPS, FY3E-BDS and METC observations, respectively. Panel (e): proportion comparison of the eight bad quality flags for each type of RO observations of August 2023.
An analysis of bending angle quality (QF1–QF5) reveals that MetOp bending angles have minimal quality issues. This can be attributed to the high-quality GRAS radio occultation (RO) receiver. Only a small fraction (less than 5 %) of MetOp profiles are flagged with QF4, which indicates quality problems where bending angle biases are larger than noises. This low QF4 percentage is primarily due to the very high signal-to-noise ratio (SNR) of the MetOp RO receiver (Angerer et al., 2017). Therefore, QF4 might not be truly useful for MetOp observations. In contrast, Fengyun datasets – particularly FY3E – exhibit much more bending angle quality control issues at high altitudes. When comparing QF1 to QF3 (which assess bending angle outliers across three distinct height ranges), the percentages of these flags are generally comparable. This suggests that if a profile exceeds the threshold in one height range, it is highly likely to exceed thresholds in other height ranges. However, the percentages of these QFs do not fully overlap, which emphasizes the necessity of evaluating bending angle quality across multiple height ranges. For FY3D and FY3E-BDS, QF3 (which targets the 10–35 km height range) has the highest percentage. For FY3E-GPS, QF2 (focusing on the 35–50 km range) is more prominent, indicating a greater possibility for outliers in the middle and upper stratosphere. As noted in the analysis of bending angle statistical errors (Sect. 3.1), removing this outlier effect in the 35–50 km range would result in larger biases for FY3E-GPS – a phenomenon not obvious in the other three datasets.
Quality flags 4 and 5 (QF4 and QF5) are associated with bending angle biases and noises. For Fengyun bending angles, FY3D demonstrates overall smaller bending angle biases and noise quality problems compared to the two FY3E bending angles. Their percentage of QF4 vary around 10 %, while the percentage of QF5 is consistently less than 5 %. For FY3E-BDS, QF4 percentages are generally small (less than 5 %), whereas QF5 (large bending angle noises) percentages range from 15 % to 20 %. This indicates that FY3E-BDS bending angles are prone to significant noise-related quality issues. For FY3E-GPS bending angles, both QF4 and QF5 percentages range from 10 % to 15 %, suggesting that this dataset is affected by both large biases and noise-related quality problems. As discussed earlier, only less than 5 % METC bending angle profiles exhibit biases larger than noise (QF4).
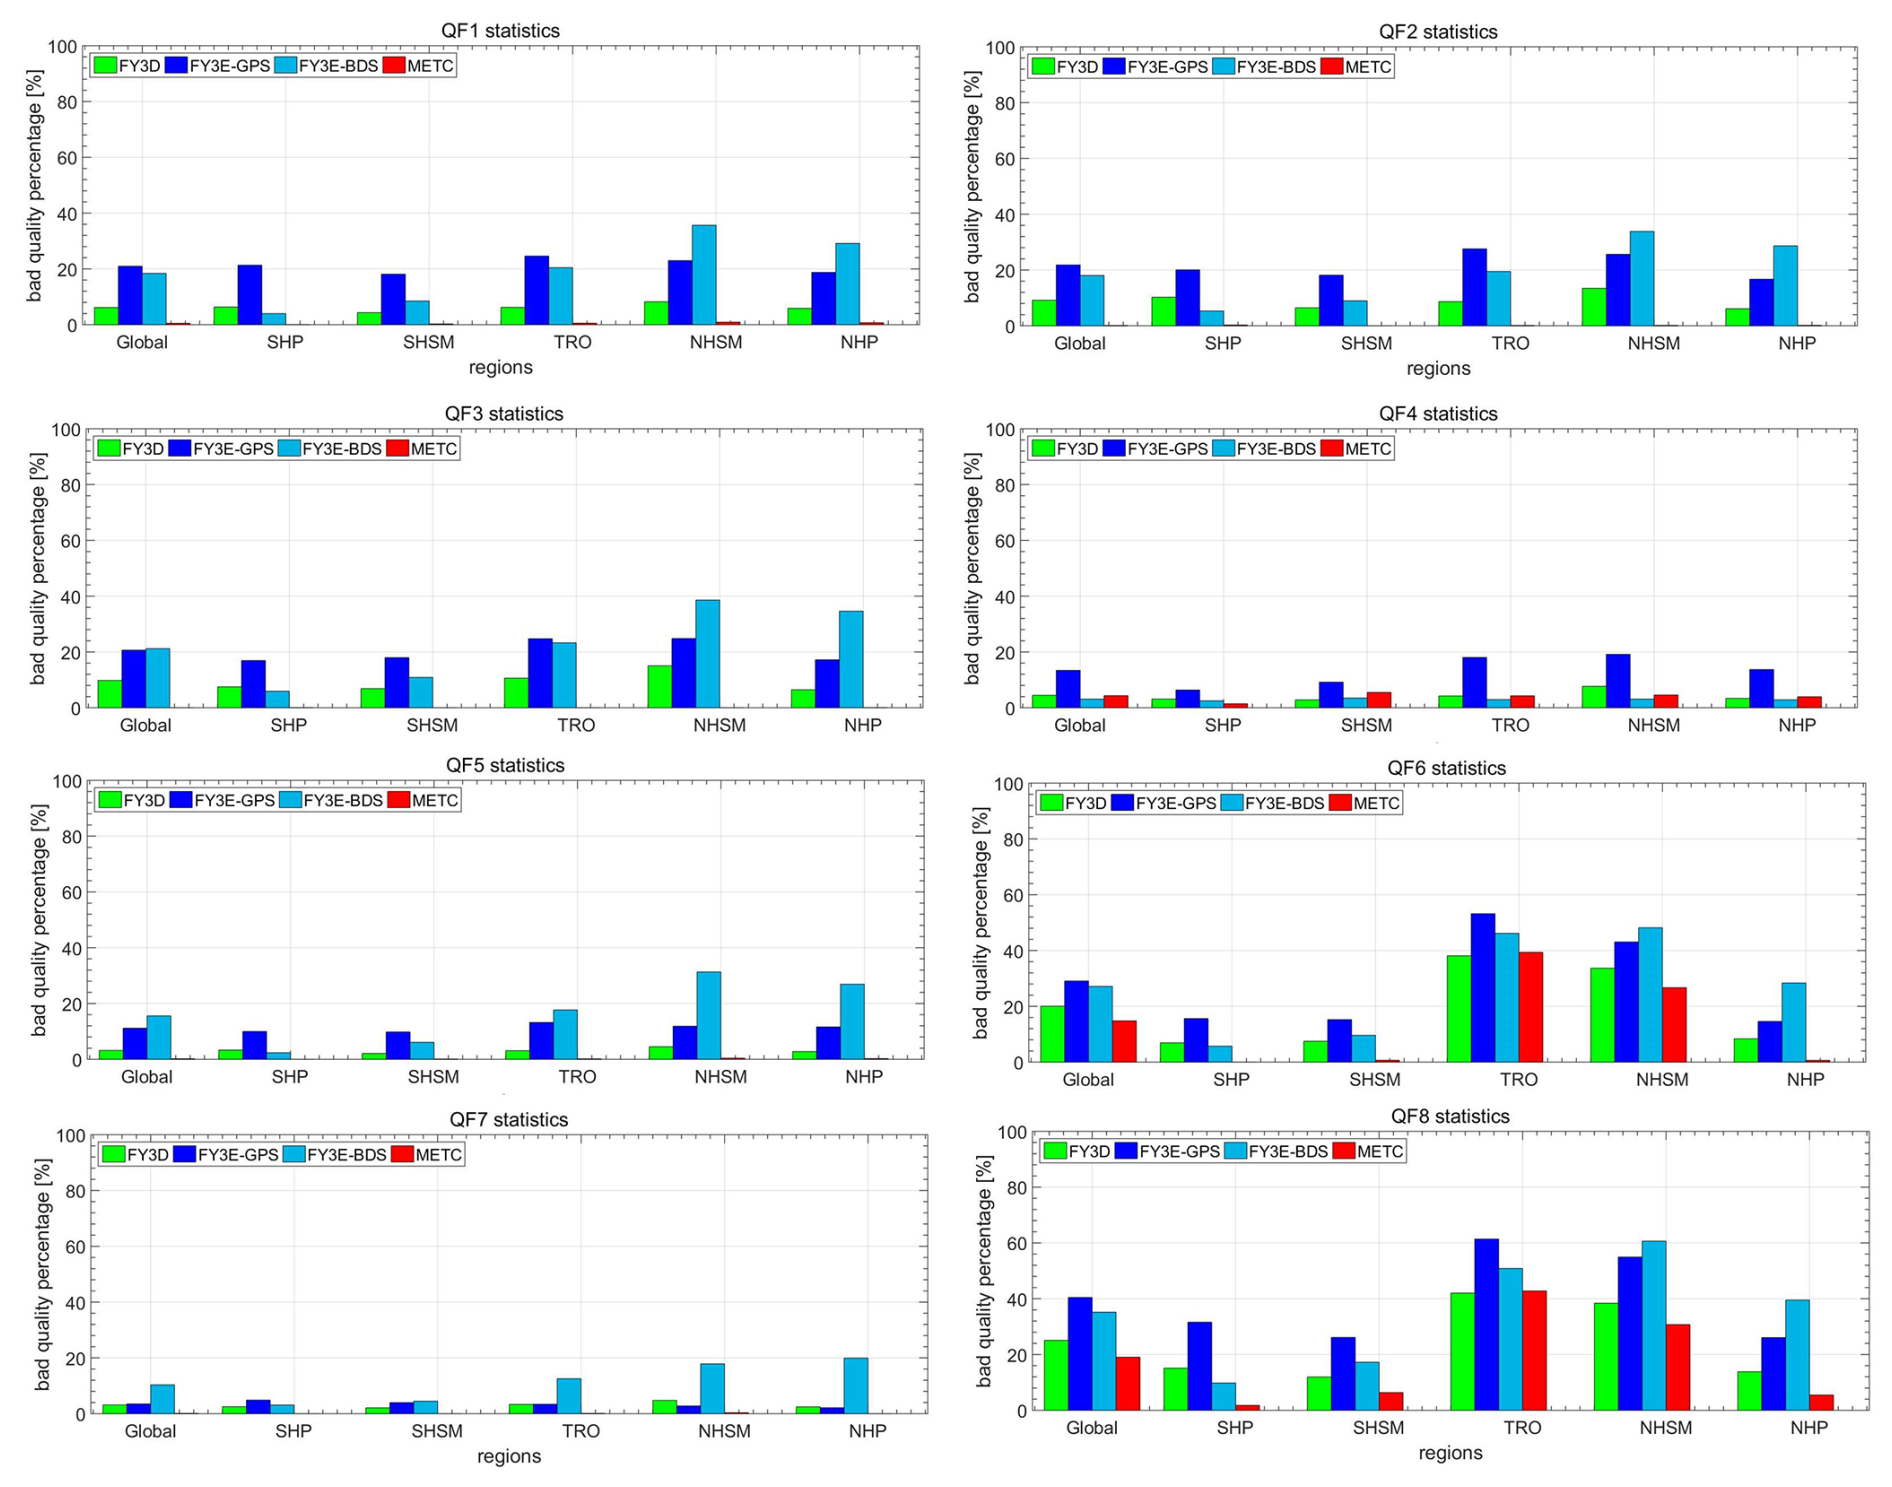
Figure 5Percentage of bad quality flags in the same six latitude bands as Fig. 2. Results are obtained using data from August 2023.
Quality flags 6 and 7 represent the quality of refractivity and temperature, respectively. Since our quality control for refractivity is relatively strict, QF6 has the highest percentage among all quality flags. Again, MetOp refractivity has the smallest percentage, at around 15 %, followed by FY3D refractivity, which is approximately 20 %. The two FY3E datasets have the highest percentages, at around 30 %. For QF7, which represents temperature quality, the percentage for MetOp is nearly zero. The percentages for FY3D and FY3E-GPS are also small, at less than 5 %. However, FY3E-BDS shows approximately 10 % of temperature data with poor quality.
The bottom panel of Fig. 4 shows the monthly mean percentage of each quality flag. Focusing on the overall quality of bending angle profiles (QF1–QF3), MetOp observations exhibit almost no quality issues. The proportion of quality problems for FY3D is consistently below 10 %, which is significantly lower than the approximately 20 % observed for both FY3E-GPS and FY3E-BDS. Regarding QF4, FY3E-GPS has notably higher percentages (exceeding 10 %) compared to the other three datasets, whose QF4 percentages all remain below 5 %. Such biases of FY3E-GPS bending angles will be further illustrated in Sect. 3.3. For QF5, FY3E-BDS has the highest percentage (around 15 %), followed by FY3E-GPS and then FY3D; MetOp data show almost no QF5-related quality issues. For QF6, both FY3E datasets (FY3E-GPS and FY3E-BDS) have large percentages (close to 30 %), followed by FY3D (approximately 20 %) and MetOp (around 15 %). For QF7, FY3E-BDS has the highest percentage (about 10 %), while FY3D and FY3E-GPS have QF7 percentages of less than 5 %; MetOp data show no temperature-related quality issues. For QF8 (which represents overall profile quality), approximately 40 % of FY3E-GPS observations are classified as poor quality, followed by FY3E-BDS (35 %), FY3D (25 %), and MetOp (less than 20 %).
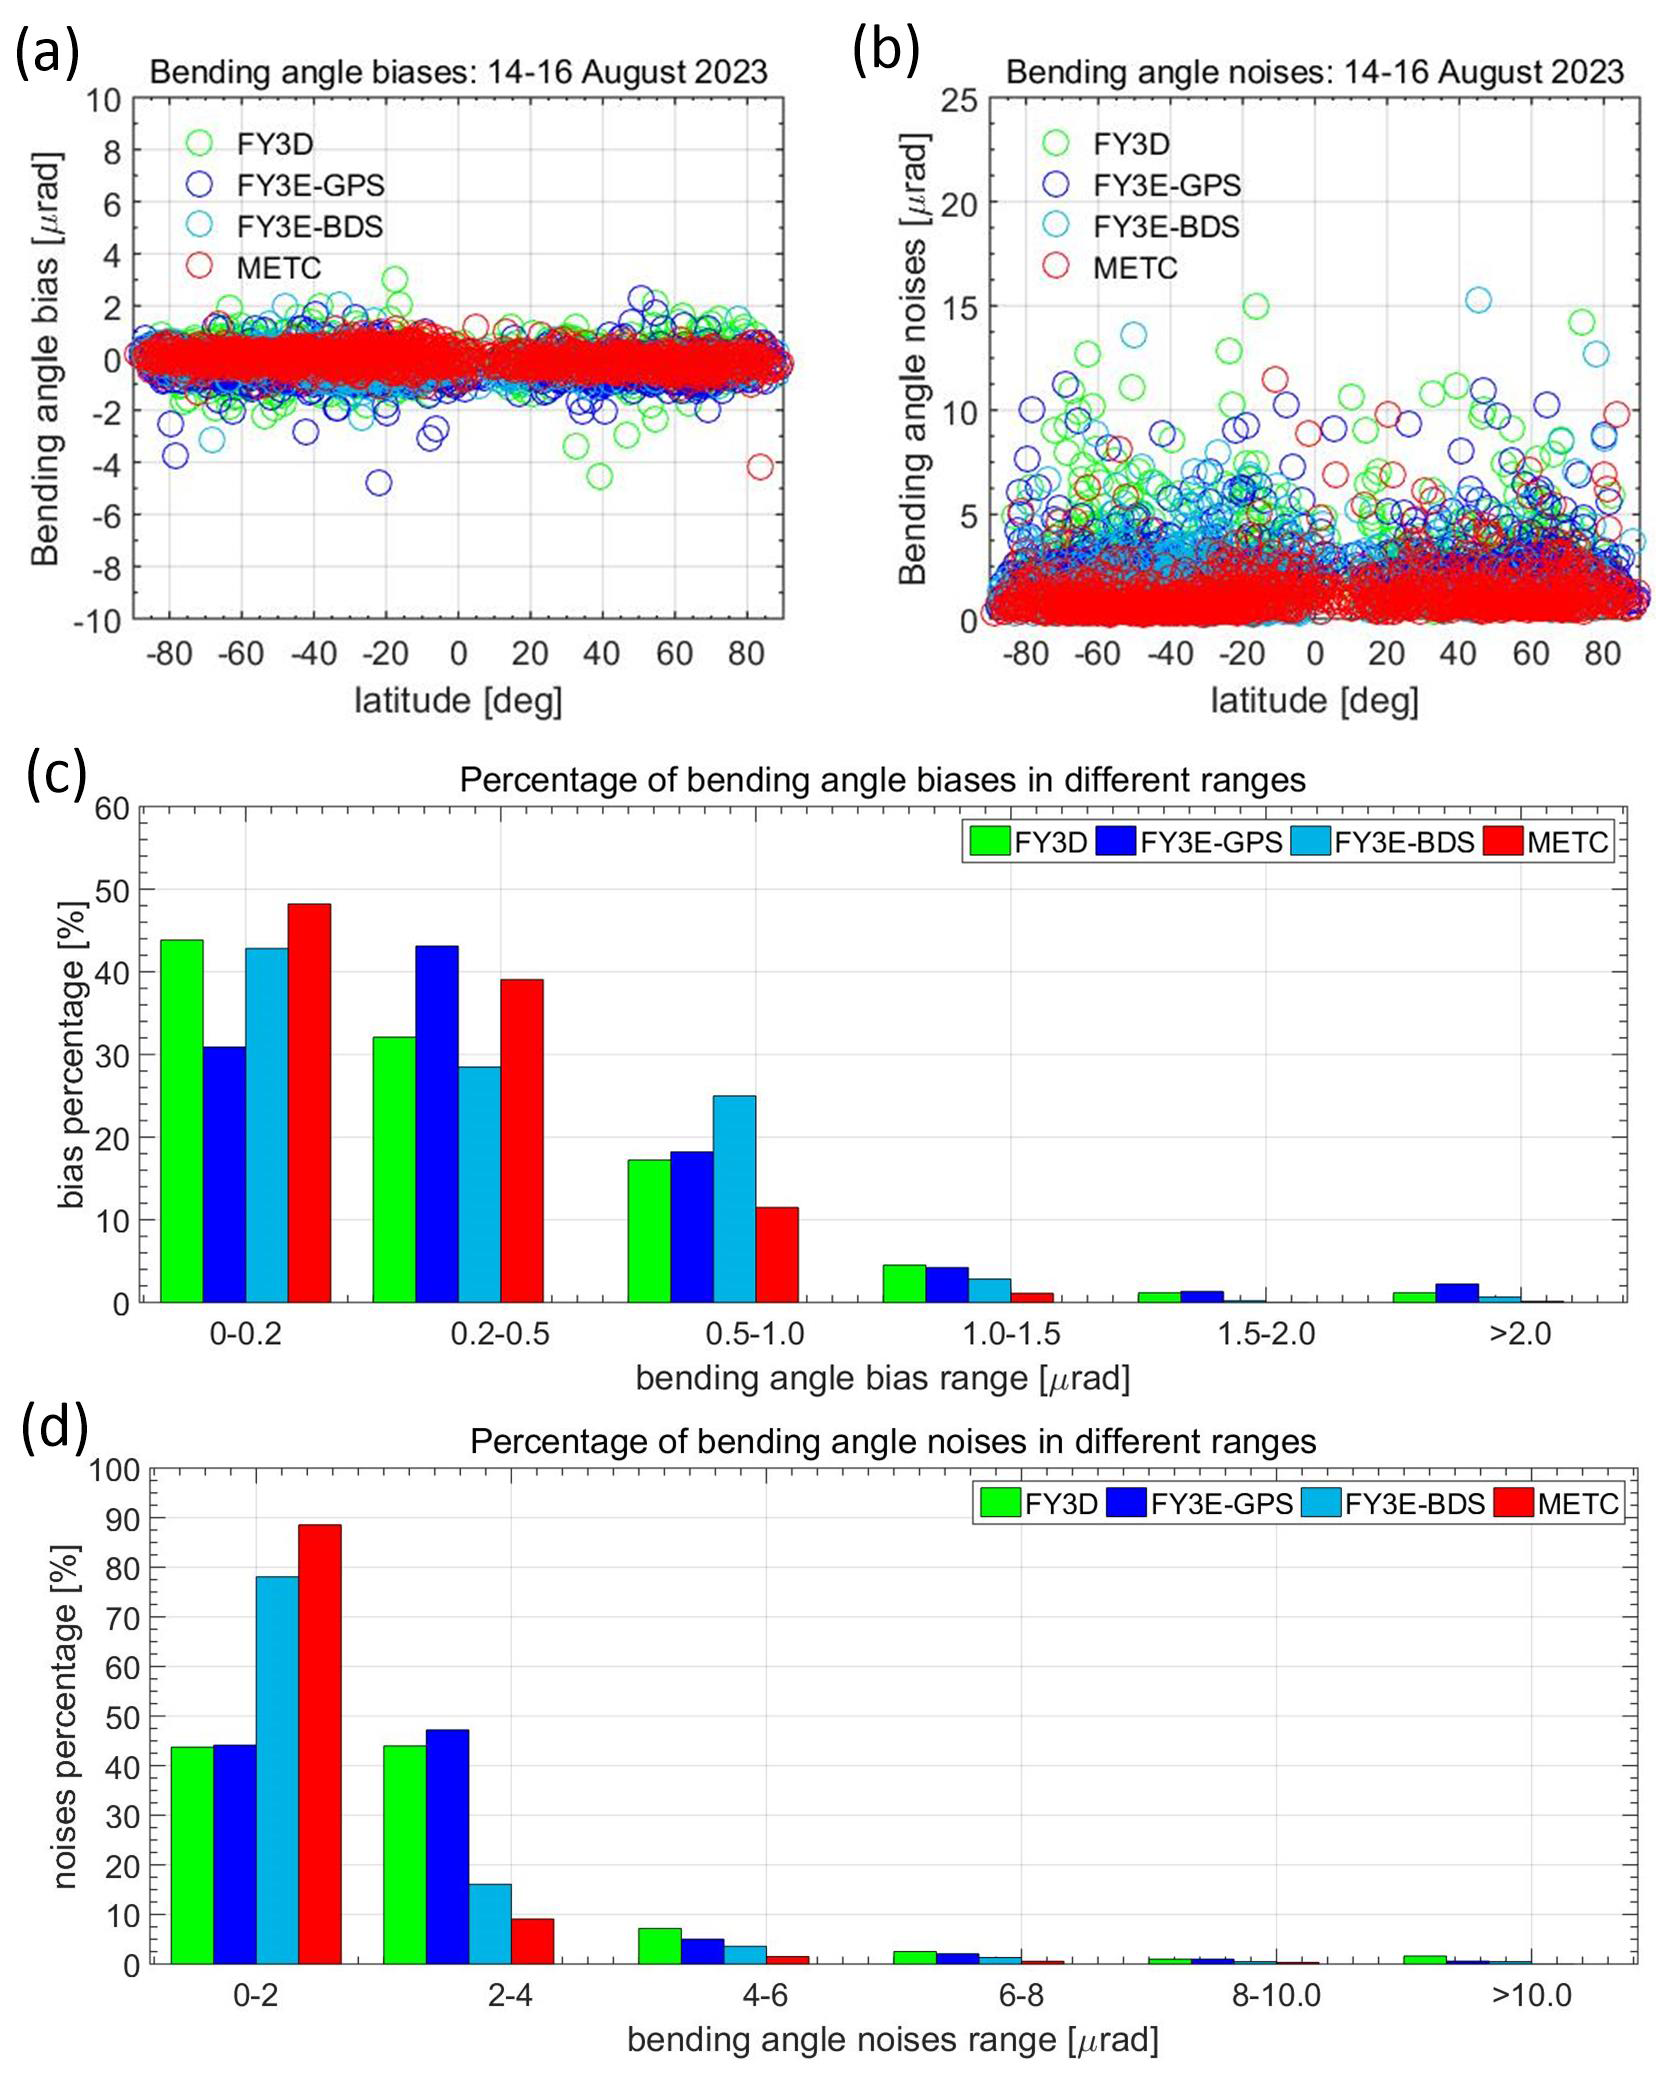
Figure 6Panels (a) and (b): latitudinal variations in RO bending angle biases and noises for three exemplary days (14–16 August); Panel (c): percentages of biases falling within different value ranges (biases are in absolute terms); Panel (d): percentages of RO bending angle noises falling within different value ranges.
Figure 5 shows monthly mean percentage of each quality flags in the same six latitude bands as Fig. 2. It can be seen that for almost all quality flags, the percentage of bad quality flags are most distinctive in TRO (20° S–20° N) and NHSM (20–60° N) regions. This can be attributed to that these two regions suffer more from the disturbance of ionospheric residual errors and also the influences of water vapour. Percentage of bad quality flags ranks the second in NHP region (northern hemisphere polar), especially for FY3E-BDS observations. The reason of this needs further investigations.
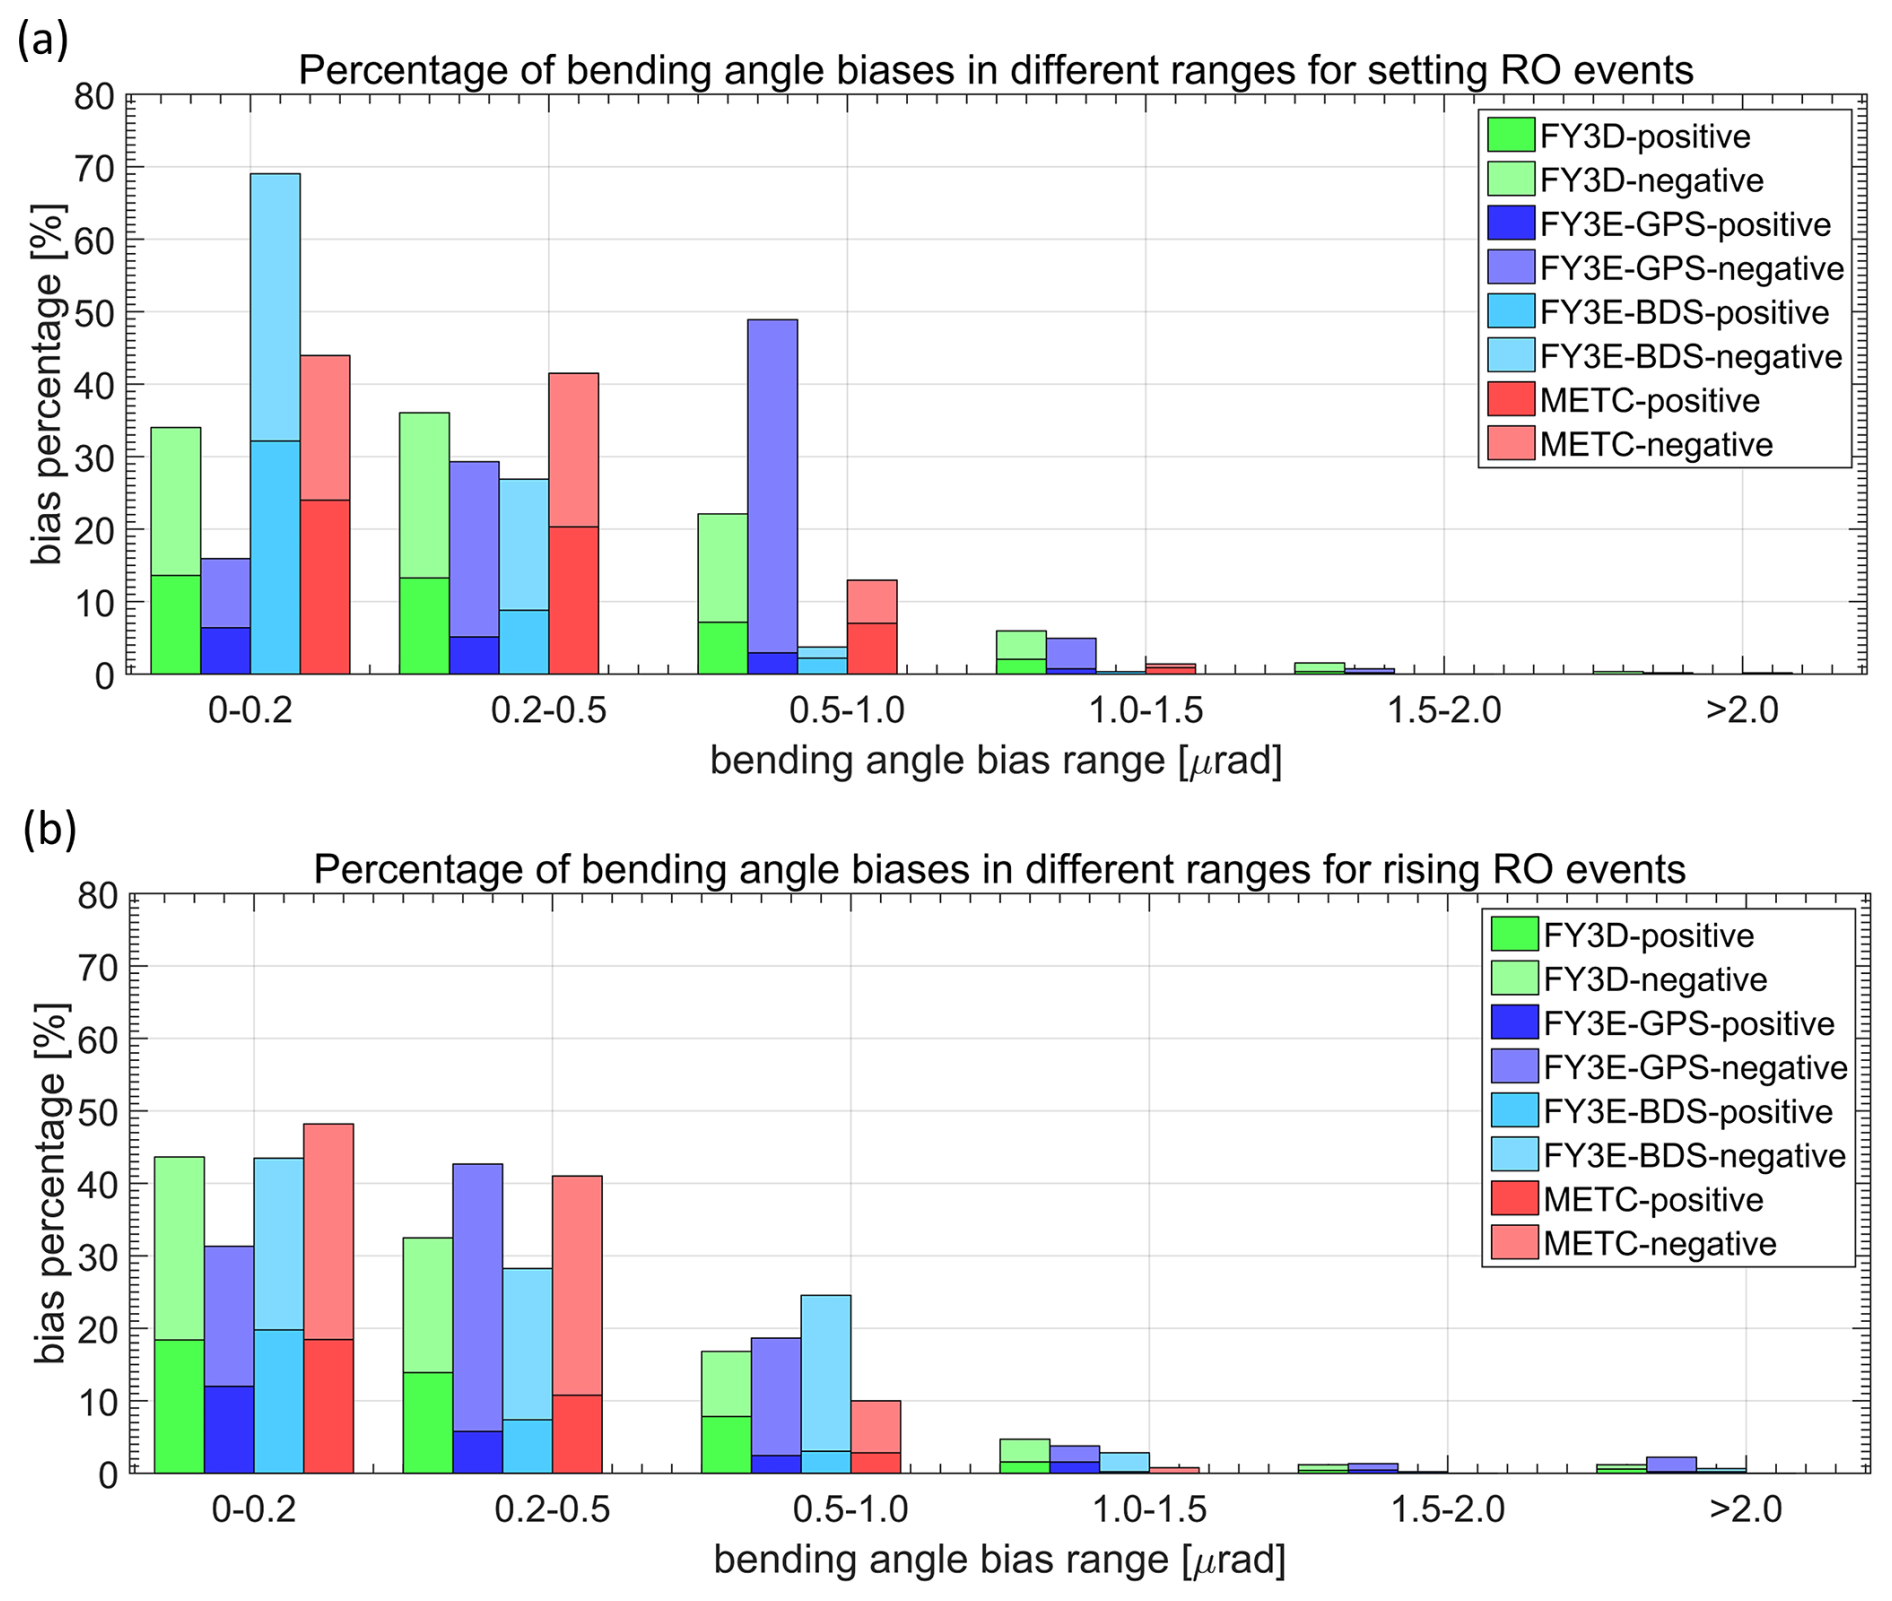
Figure 7Percentage of bending angle biases across six error ranges for rising (upper) and setting (bottom) events, and percentages values are obtained using data from 14–16 August 2023, the absolute values of biases and corresponding ranges are used.
3.3 Bending angle biases and noises
Figures 6–8 show the characteristics of bending angle biases and noises for the four types of RO bending angles. These results are obtained using all QF=0 RO profiles. Figure 6 presents the individual RO bending angle biases (panel (a)) and noises (panel (b)) over three exemplary days: 14–16 August 2023. The individual bending angle biases of MetOp are overall small, with values varying within ±1 µrad. In contrast, the biases of Fengyun are larger than those of MetOp data with values mostly vary within ±2 µrad. The noises of MetOp are mostly within 2 µrad, while bending angle noises of Fengyun are significantly larger – many of these noises range in magnitude from 5 to 15 µrad. Panels (c) and (d) show the percentages of bending angle biases (in absolute terms) and noises that fall into each error range, respectively. MetOp data exhibit the smallest bending angle biases and noises, while Fengyun observations show generally larger biases and noises. Among the Fengyun series, FY3D-BDS exhibits smaller bending angle noises than the other two Fengyun observations. A more comprehensive overview of the monthly results is presented in Fig. 8.
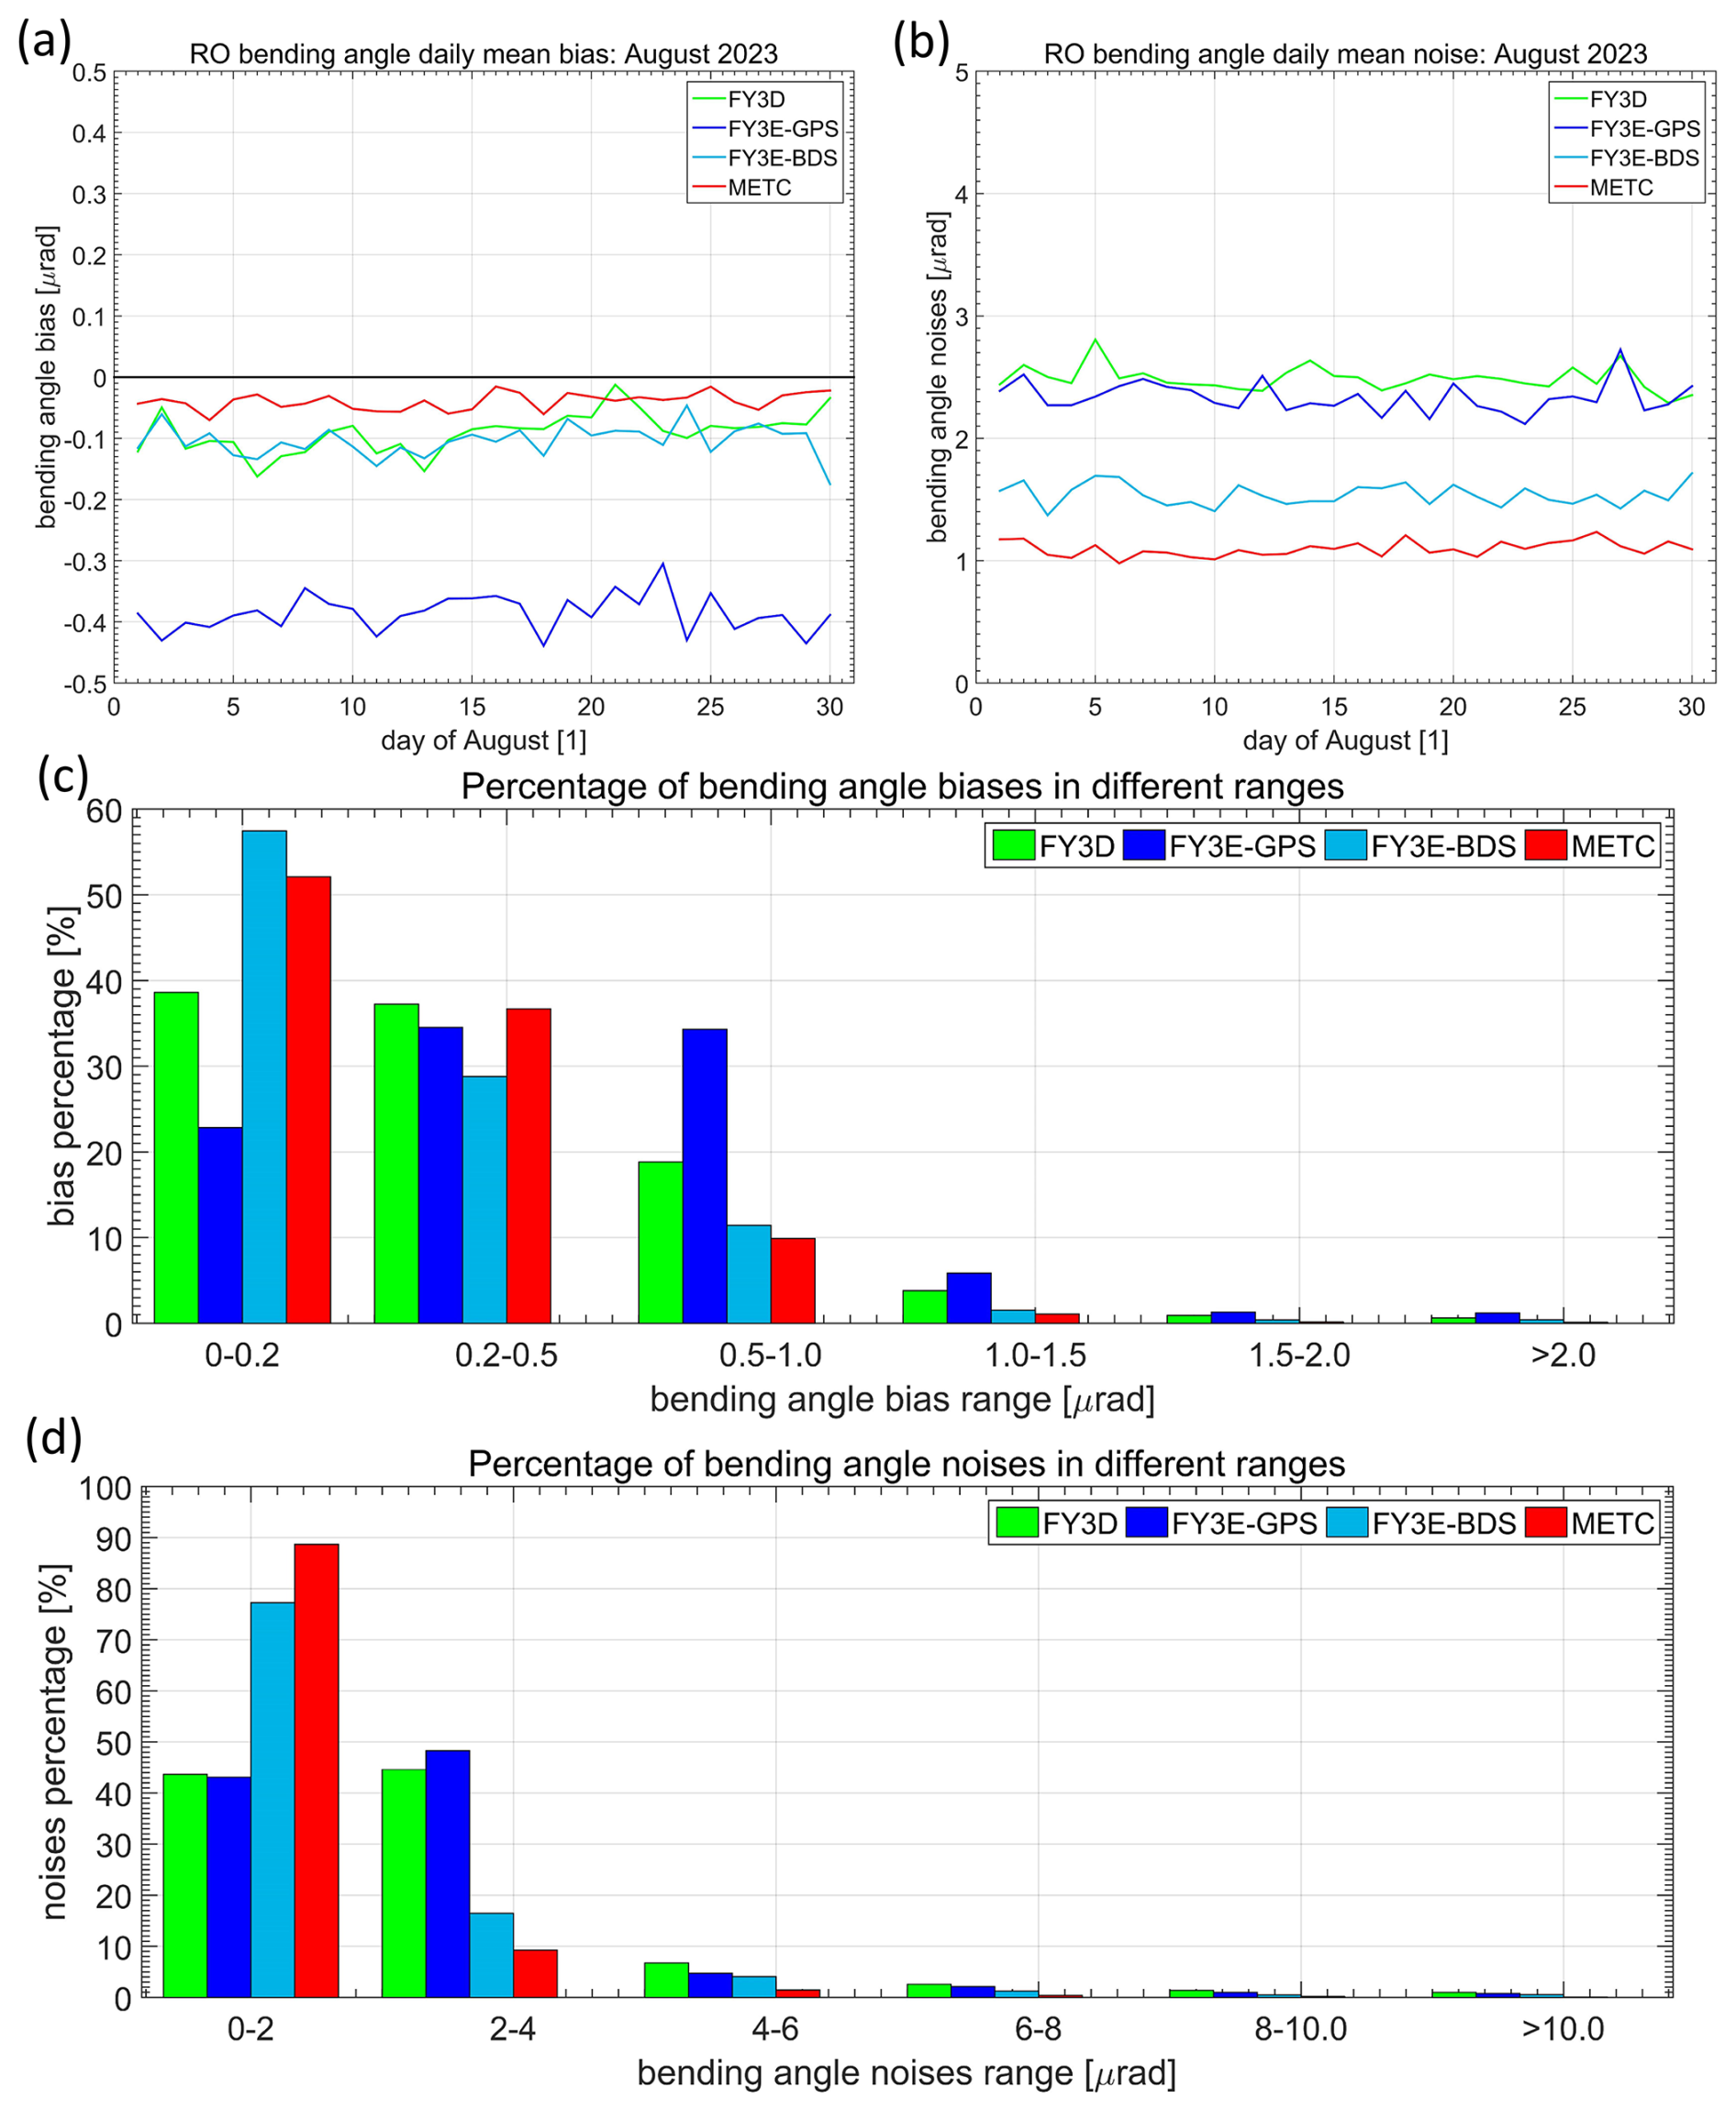
Figure 8Panels (a) and (b): time series of daily mean bending angle biases (a) and noises (b) for August 2023; Panels (c) and (d): percentage of bending angle biases (c) and noises (d) across six error ranges.
Figure 7 illustrates the percentages of bending angle biases and noises within the same ranges as Fig. 6, but separated by rising and setting events. Darker colours represent positive biases, while lighter colours represent negative biases. For setting events, the positive and negative biases of MetOp are of similar magnitudes overall. More than 85 % of MetOp biases are less than 0.5 µrad. For the Fengyun satellite series, however, negative errors outnumber positive errors, and this trend is even more pronounced for FY3E-GPS bending angles. For example, within the bias range of 0.5–1.0 µrad, approximately 45 % of the biases are negative, while only 5 % are positive. When comparing the bias magnitudes across Fengyun satellites, FY3E-GPS bending angles show the largest biases, with about 50 % of FY3E-GPS observations falling within the 0.5–1.0 µrad error range. Among all Fengyun satellites, FY3E-BDS has the smallest biases, as over 95 % of its biases are less than 0.5 µrad. FY3D biases fall in between, with roughly 70 % of its biases below 0.5 µrad. For rising events (panel (b)), all four RO bending angles exhibit more negative biases than positive ones, and this characteristic is also more prominent for FY3E-GPS observations. When comparing setting and rising events, the proportion of large bending angle biases (greater than 0.5 µrad) in FY3E-GPS observations is less than 20 %.
Figure 8 presents the temporal series of daily mean biases and noises (upper panel) and the percentages of biases and noises falling within specific error ranges (bottom two panels). Focusing on the upper panel, both the RO bending angle biases and noises exhibit no significant temporal variations. MetOp shows the smallest bending angle biases, with values around −0.5 µrad. FY3D and FY3E-BDS rank the second, with values around −0.1 µrad. In contrast, FY3E-GPS exhibits significantly larger bending angle biases than the other three datasets, with values varying around −0.4 µrad. This result is consistent with the findings of the ROMSAF report (Lewis, et al., 2025). Both our results and the ROMSAF report found large bending angle biases in FY3E observations. We further found that such large biases mainly come from the FY3E-GPS observations rather than FY3E-BDS observations. In addition, the ROMSAF report suggest positive biases while we found negative biases. This may due to different background data used for the calculation of biases and noises at high altitudes. Turning to bending angle noises, MetOp again has the smallest values, which vary around 1 µrad. FY3E-BDS ranks second, with values varying around 1.5 µrad. FY3D and FY3E-GPS – both equipped with GNOS-GPS receivers – exhibit similar noise values, approximately 2.5 µrad.
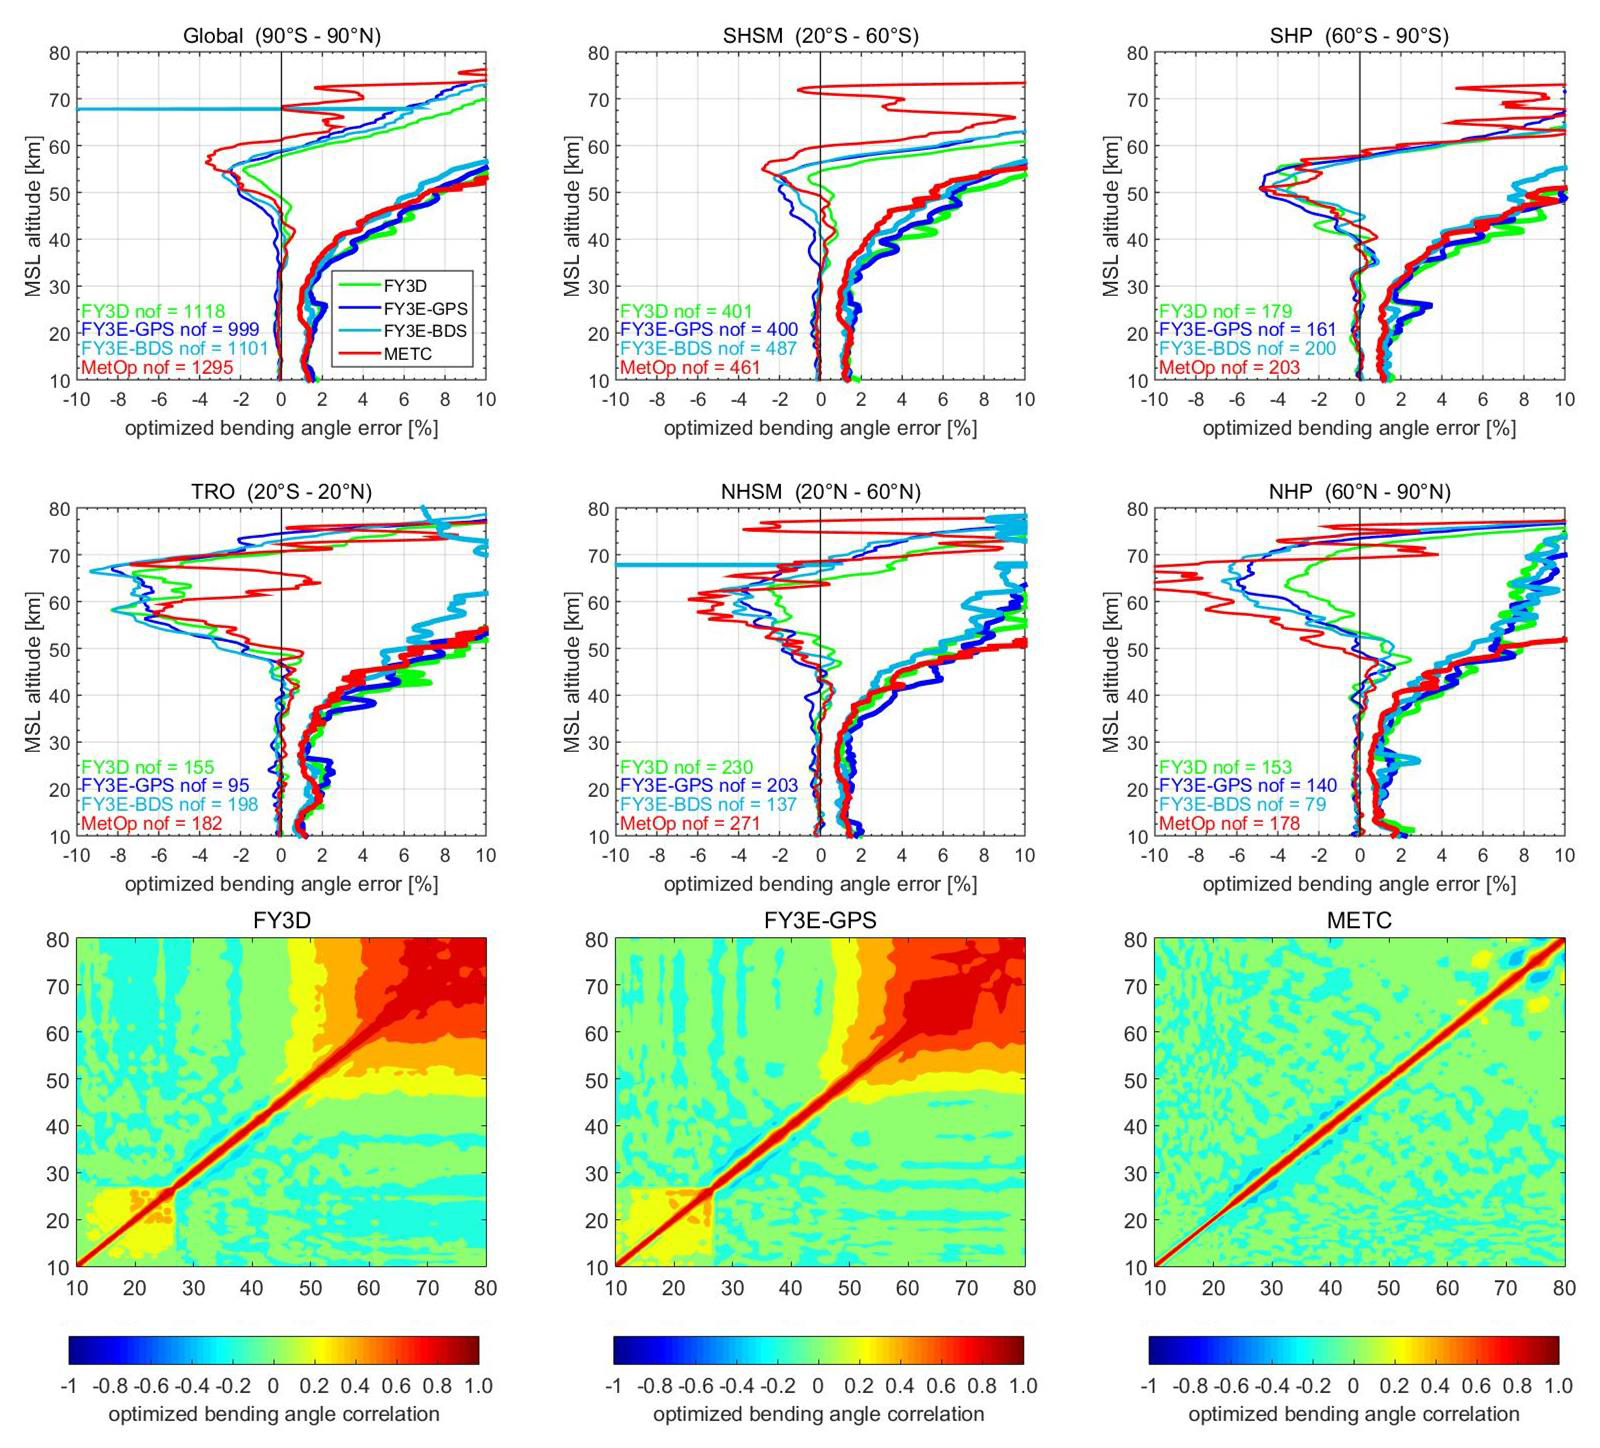
Figure 9Upper two rows: systematic differences (thin lines) and standard deviations (thick lines) of optimized bending angle against ERA5 data during 14–16 August 2023 time period in the same six latitudinal bands as Fig. 2. Bottom row: correlation coefficients of optimized bending angle of FY3D, FY3E-GPS and METC observations.
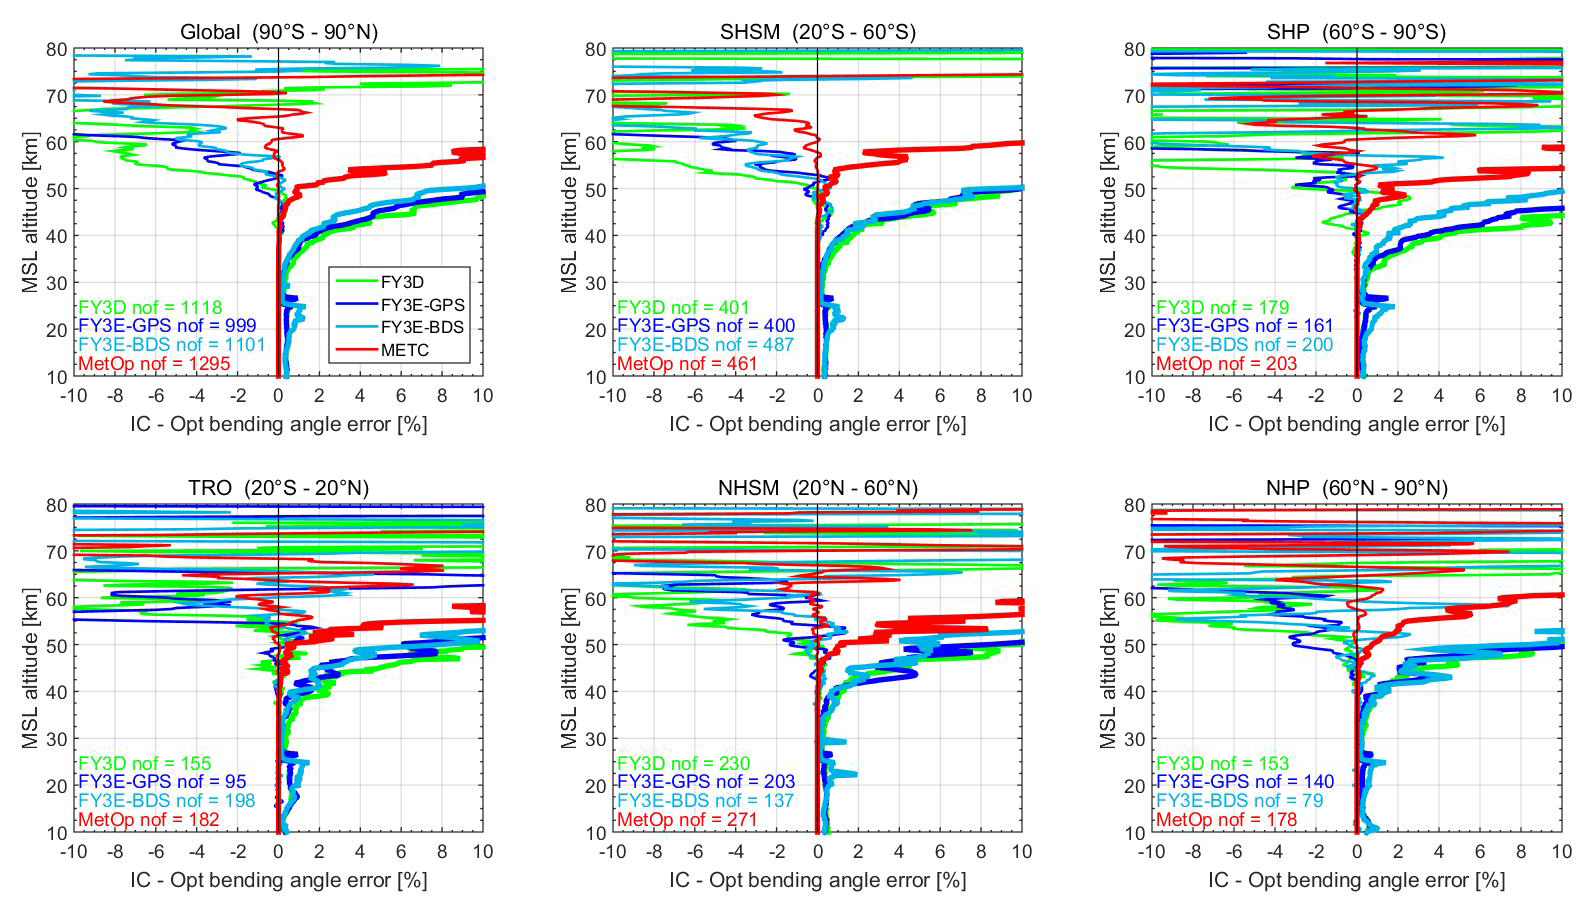
Figure 10Systematic differences (thin lines) and standard deviations (thick lines) of ionosphere-corrected bending angle against optimized bending angle during 14–16 August 2023 time period in the same six latitudinal bands as Fig. 2.
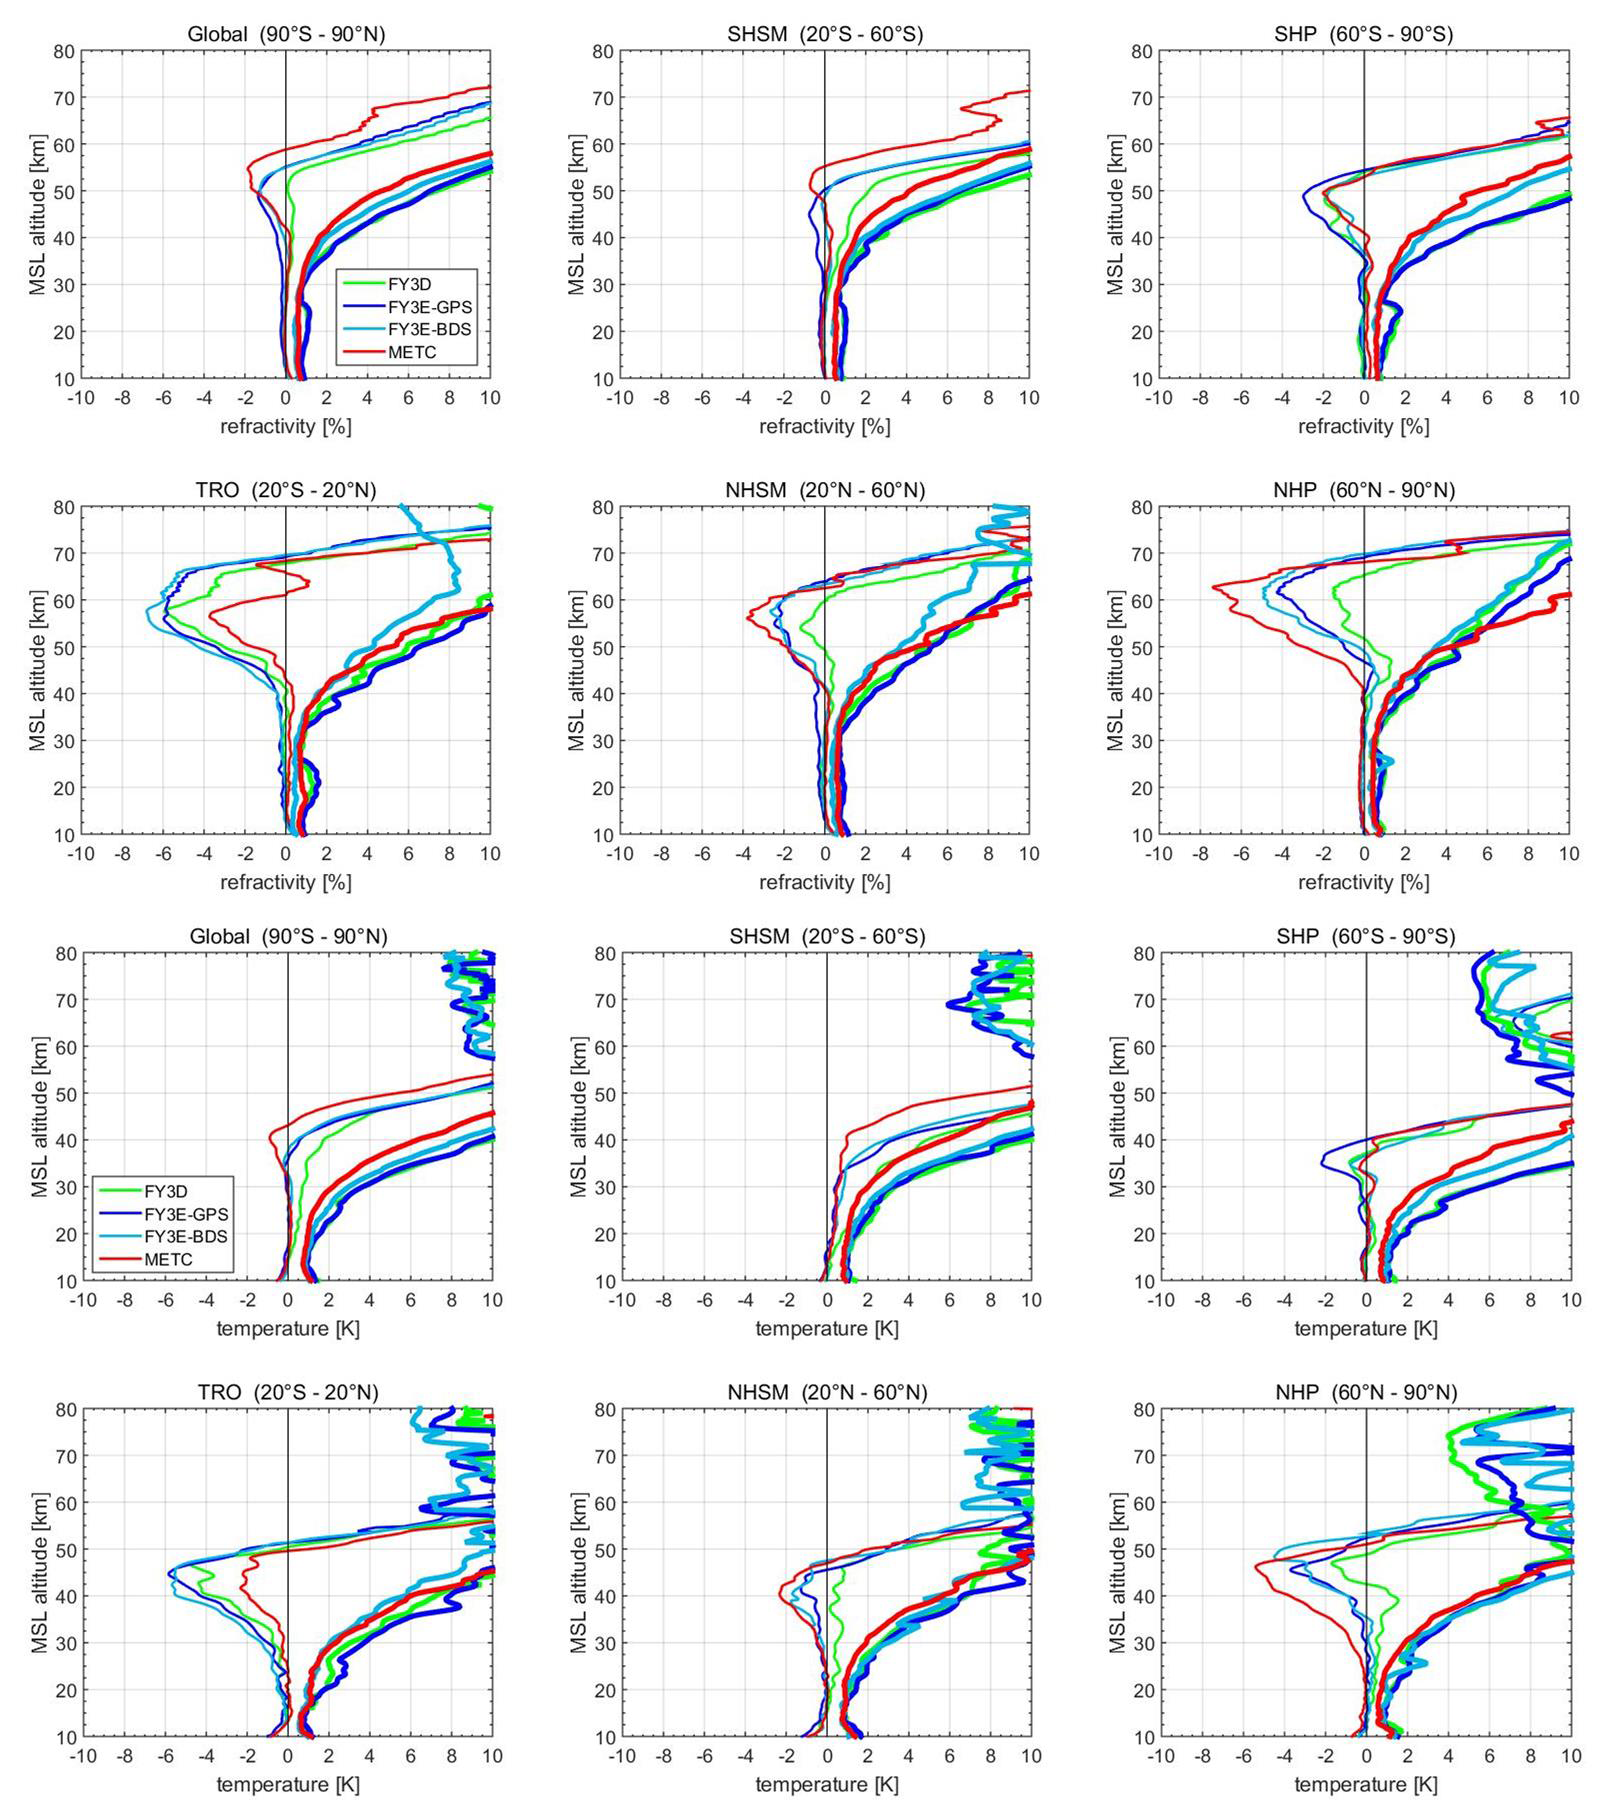
Figure 11Systematic differences (thin lines) and standard deviations (thick lines) of refractivity (upper two rows) and temperature (bottom two row) against ERA5 data during 14–16 August 2023 time period in the same six latitudinal bands as Fig. 2.
A further examination of the bias (in absolute terms) and noise ranges (bottom two panels of Fig. 8) shows that more than 90 % of MetOp bending angle biases fall within the 0.5 µrad range, with more than 50 % within the 0.2 µrad range. More than 80 % of the bending angle biases for FY3E-BDS and FY3D also fall within ranges smaller than 0.5 µrad. For FY3E-GPS biases, however, only approximately 60 % fall within ranges less than 0.5 µrad, while the remaining values fall within ranges larger than 0.5 µrad. This further explains why the daily mean bending angle biases of FY3E-GPS are much larger than those of the other three datasets (Panel (a)). Turning to RO bending angle noises, approximately 90 % of MetOp noises fall within the 0–2 µrad range, followed by FY3E-BDS, for which about 80 % of the noises fall within this range. For FY3D and FY3E-GPS, only about 40 % of the noises fall within this range. More than 40 % of the bending angle noises for FY3D and FY3E-GPS fall within the 2–4 µrad range, and the remaining 20 % fall within ranges larger than 4 µrad. This further explains why the observations from FY3D and FY3E-GPS exhibit larger noises than those from the other two datasets.
This section presents the statistical errors of optimized bending angle, refractivity and temperature. These profiles are directly obtained from CMA and ROMSAF (c.f., Sect. 2.2). Both data centers use the ROPP software to process their RO retrievals. Figure 9 presents the systematic differences and standard deviations of statistically optimized bending angles across six latitude bands (upper two panels) and their correlation coefficients (third panel). When examining the systematic differences overall, the Fengyun optimized bending angles exhibit error magnitudes similar to those of MetOp at high altitudes (above 50 km). This contrasts with the error characteristics of ionosphere-corrected bending angles. While the standard deviations of Fengyun's optimized bending angles below 50 km remain larger than those of MetOp data, the discrepancies are smaller than those of ionosphere-corrected bending angles. Above 50 km, however, the standard deviations of MetOp data are larger than those of Fengyun data – this also contrasts with the case of ionosphere-corrected bending angles. These results suggest that the optimized bending angles from Fengyun satellites are more strongly corrected by background data. This conclusion is further supported by the bottom panel, which shows the correlation coefficients. Focusing on the correlation coefficients of Fengyun's statistically optimized bending angles, strong correlations are observed at high altitudes. If strong correlations are detected, it indicates that bending angles are strongly influenced by one data source. This further confirms that Fengyun's statistically optimized bending angles are influenced by background bending angles at high altitudes. In contrast, the correlation coefficients of MetOp optimized bending angle do not exhibit such strong correlations at high altitudes; their values are similar to those of ionosphere-corrected bending angles (see Fig. 3).
To further understand the relationship between ionosphere-corrected bending angles and statistically optimized bending angles, Fig. 10 presents the systematic differences and standard deviations of ionosphere-corrected bending angles relative to optimized bending angles. On a global scale, MetOp's ionosphere-corrected bending angles exhibit overall small differences (less than 0.5 %) compared to its optimized bending angles up to an altitude of 60 km. In contrast, for Fengyun data, such small differences – with magnitudes similar to those of MetOp – are only observed below 50 km, an altitude 10 km lower than that of MetOp. Above 60 km, the differences in MetOp data gradually increase. However, below 70 km, these values remain mostly within ±2 %. This indicates that MetOp's ionosphere-corrected bending angles remain close to their optimized counterparts even up to 70 km. For Fengyun data, by comparison, the differences rise significantly above 50 km. This suggests that Fengyun's optimized bending angles are more strongly influenced by background bending angles at altitudes above 50 km. Turning to standard deviations: those of MetOp are less than 0.5 % below 50 km. In contrast, the standard deviations of Fengyun data increase sharply from 30 km upward. This further confirms that Fengyun's optimized bending angles are heavily affected by background data at altitudes above 50 km.
Figure 11 presents the systematic differences in refractivity and temperature across the same six altitude bands as Fig. 6. It can be observed that MetOp exhibits the smallest refractivity errors in the SHSM, SHP, and TRO regions. In the NHSM and NHP regions, MetOp data are consistent with Fengyun observations below 40 km. Above 40 km, however, Fengyun shows smaller refractivity errors. This is mainly because the differences in the optimized bending angles of Fengyun data are smaller than those of MetOp data above 50 km in these two regions. Consequently, refractivity, which is retrieved from optimized bending angle, show similar characteristics. A similar situation is found for temperature. Below 30 km, the systematic differences in temperature among all four RO observations are generally similar. Above 30 km, MetOp exhibits the smallest temperature systematic differences in the SHSM, SHP, and TRO regions. In the NHSM and NHP regions, by contrast, Fengyun observations show smaller differences. These results are consistent with those of the optimized bending angles and refractivity. This is also attributed to the uncertainty propagation of the optimized bending angles (Li et al., 2019).
This study systematically assesses the quality of ionosphere-corrected bending angles of Fengyun D and E (both GPS and BDS) satellites using ERA5 data as references, and with MetOp data as comparisons. An empirical quality control scheme is developed in this study. The ionosphere-corrected bending angles are evaluated in a twofold way. First, they are checked from three height rages covering from 10 to 80 km. If bending angles exceed empirically determined thresholds, the profile will be rejected and corresponding quality flags will be assigned. Secondly, the biases and noises of ionosphere-corrected bending angles are calculated and if they did not pass our quality control, the profile is also rejected and quality flags will be assigned. The quality control scheme and thresholds are determined based on experiences of existing studies and our empirical analysis of Fengyun and MetOp bending angles.
A comparison of RO ionosphere-corrected bending angles with ERA5 bending angles shows that Fengyun's ionosphere-corrected bending angles are generally consistent with MetOp's bending angles below 40 km. Above 40 km, the statistical errors of Fengyun's bending angles are consistently larger than that of MetOp's bending angle. FY3E-GPS and FY3D exhibit the largest bending angle noises, which are approximately 1 %–3 % greater than those of MetOp. FY3E-BDS's bending angle noises fall in between, being roughly 0.5 %–2 % greater than MetOp's – this suggests that GNOS BDS RO observations have smaller noises than GNOS GPS RO observations. The bending angle correlations of all three Fengyun observations are generally consistent with MetOp observations above 30 km.
Focusing on the first set of quality flags (QF1–QF3) – which are used to identify outliers in bending angle profiles – we note that the percentage of poor-quality profiles for MetOp is nearly zero. This is attributed to its high-performance receiver of MetOp satellite. FY3D ranks second, with fewer than 10 % of its profiles containing outliers. The two bending angle datasets from FY3E (from GPS and BDS receivers) have the highest percentages of poor bending angle quality profiles, with values around 20 %. Turning to quality issues related to bending angle biases and noises, we also note that MetOp and FY3D have few such issues (less than 5 %). However, the percentage of large biases of FY3E-GPS are approximately to 15 % and the percentage of large noises of FY3E-BDs are also approximately 15 %.
Further check the magnitudes of bending angle biases and noises (data with no quality issues) show that MetOp bending angle biases are smallest with biases are around −0.5 µrad. FY3D and FY3E-BDS bending angle biases rank the second with biases around −0.1 µrad. FY3E-GPS bending angles show distinctive much larger biases than the other three observations with values varying around −0.4 µrad, and most of these large biases are detected in rising events. Focusing on bending angle noises, MetOp bending angle biases again are smallest with values varying around 1 µrad. FY3E-BDS bending angles rank the second, with values varying around 1.5 µrad. FY3D and FY3E-GPS, which are all GNOS-GPS receivers, show similar noises values which are about 2.5 µrad.
The statistical errors of optimized bending angles are also calculated. Both systematic differences and standard deviations of Fengyun bending angles at high altitudes are significantly reduced compared to the ionosphere-corrected bending angle. Furthermore, Fengyun optimized bending angle reveal larger correlations above 50 km. This all suggest that the optimized bending angle are strongly affected by the background bending angle at high altitudes. Statistical errors of refractivity and temperature are also calculated. Below 40 km, refractivity errors of all four observations are overall consistent. However, above 40 km, MetOp refractivity still outperforms in SHSM, SHP, TRO regions. In the NHSM and NHP regions, Fengyun refractivity outperforms. This may be caused by the strong weighting given to the optimized bending angle in these two regions. Similar situation were found in temperature statistical errors.
In conclusion, the ionosphere-corrected bending angles from Fengyun RO satellites exhibit promising quality below 40 km. Above 40 km, however, both the biases and noises of Fengyun's bending angles are larger than those of MetOp data. Notably, FY3E-GPS bending angles exhibit distinct negative biases. The sources of these biases and noises may include three factors: orbit determination errors, clock errors, or receiver noises/biases. Our future work plan includes further investigating and quantifying the main causes of the large bending angle errors in Fengyun data at high altitudes. We also aim to develop an empirical observation error model for the statistical optimization of Fengyun's ionosphere-corrected bending angles. It is expected that this work will further enhance the performance of Fengyun data in numerical weather prediction and climate studies, particularly for stratospheric applications.
The code used to produce the results of this study is available from the corresponding author upon qualified request.
These data can be downloaded from Fengyun satellite data service of CMA, and the link is below: https://data.nsmc.org.cn/DataPortal/cn/home/index.html (last access: 31 August 2025). The ICDRs data are available at the website of the official ROMSAF website, and the link is as below: https://rom-saf.eumetsat.int/product_archive.php (last access: 31 August 2025). The (numeric) data underlying the results of this study are available from the corresponding author upon qualified request.
Ying Li implemented the new method, performed the analysis, produced most of the figures, and wrote the initial draft of the manuscript. Yan Liu served as primary co-author, providing advice and guidance on algorithm design, analysis, and figure production, and contributed to the writing of the manuscript. Wenwu Ding supported on the algorithm design and test, data analysis and revision of the paper manuscript. Mi Liao works on the algorithm design, data collection and analysis. Xingliang Huo contributed on the data analysis, validation and revision of the text of the paper. Jinying Ye works on the data collection, validation and also part of the wring of the paper.
The contact author has declared that none of the authors has any competing interests.
Publisher's note: Copernicus Publications remains neutral with regard to jurisdictional claims made in the text, published maps, institutional affiliations, or any other geographical representation in this paper. The authors bear the ultimate responsibility for providing appropriate place names. Views expressed in the text are those of the authors and do not necessarily reflect the views of the publisher.
We acknowledge ECMWF (Reading, UK) for providing access to their analysis and forecast data. We also acknowledge ROMSAF for providing access to their MetOp data.
The research at APM (Wuhan, China) was supported by the National Key Research and Development Program (no. 2023YFA1009100) and National Natural Science Foundation of China (Grant no. 42474063). At CMA, this work was supported by the “Fengyun-3 03 batch satellite project” numerical forecast assimilation application of fengyun-3 03 batch ground application system (No.FY-3(03)-AS-8).
This paper was edited by Peter Alexander and reviewed by two anonymous referees.
Angerer, B., Ladstädter, F., Scherllin-Pirscher, B., Schwärz, M., Steiner, A. K., Foelsche, U., and Kirchengast, G.: Quality aspects of the Wegener Center multi-satellite GPS radio occultation record OPSv5.6, Atmos. Meas. Tech., 10, 4845–4863, https://doi.org/10.5194/amt-10-4845-2017, 2017.
Anlauf, H.: Results from data assimilation experiments with ROMEX data at DWD, IROWG-10 (10th International Radio Occultation Working Group), Boulder, CO, USA, https://www.cosmic.ucar.edu/events/cosmic-jcsda-workshop-irowg-10/agenda (last access: 23 January 2026), 2024.
Anthes, R. A.: Exploring Earth's atmosphere with radio occultation: contributions to weather, climate and space weather, Atmos. Meas. Tech., 4, 1077–1103, https://doi.org/10.5194/amt-4-1077-2011, 2011.
Anthes, R. A., Marquardt, C., Ruston, B., and Shao, H.: Radio Occultation Modeling Experiment (ROMEX): Determining the impact of radio occultation observations on numerical weather prediction, Bull. Amer. Meteor. Soc., 105, 1552–1568, https://doi.org/10.1175/BAMS-D-23-0326.1, 2024.
Ao, C. O., Waliser, D. E., Chan, S. K., Li, J.-L., Tian, B., Xie, F., and Mannucci, A. J.: Planetary boundary layer heights from GPS radio occultation refractivity and humidity profiles, J. Geophys. Res., 117, https://doi.org/10.1029/2012JD017598, 2012.
Bai, W., Liu, C., Meng, X., Sun, Y., Kirchengast, G., Du, Q., Wang, X., Yang, G., Liao, M., Yang, Z., Zhao, D., Xia, J., Cai, Y., Liu, L., and Wang, D.: Evaluation of atmospheric profiles derived from single- and zero-difference excess phase processing of BeiDou radio occultation data from the FY-3C GNOS mission, Atmos. Meas. Tech., 11, 819–833, https://doi.org/10.5194/amt-11-819-2018, 2018.
Bai, W. H., Sun, Y. Q., Du, Q. F., Yang, G. L., Yang, Z. D., Zhang, P., Bi, Y. M., Wang, X. Y., Cheng, C., and Han, Y.: An introduction to the FY3 GNOS instrument and mountain-top tests, Atmos. Meas. Tech., 7, 1817–1823, https://doi.org/10.5194/amt-7-1817-2014, 2014.
Bowler, N. E.: An assessment of GNSS radio occultation data produced by Spire, Q. J. R. Meteorol. Soc., 146, 3772–3788, https://doi.org/10.1002/qj.3872, 2020.
Bowler, N. E., Forsythe, M., Eyre, J., Healy, S., and Lauritsen, K. B.: An initial assessment of the quality of RO data from FY-3D, Met Office, Exeter, UKSAF/ROM/METO/REP/RSR/035, 1–19, https://rom-saf.eumetsat.int/general-documents/rsr/rsr_35.pdf (last access: 23 January 2026), 2019.
Cardinali, C. and Healy, S.: Impact of GPS radio occultation measurements in the ECMWF system using adjoint-based diagnostics, Q. J. R. Meteorol. Soc., 140, 2315–2320, https://doi.org/10.1002/qj.2300, 2014.
Cucurull, L. and Derber, J. C.: Operational Implementation of COSMIC Observations into NCEP's Global Data Assimilation System, Wea. Forecasting, 23, 702–711, https://doi.org/10.1175/2008WAF2007070.1, 2008.
Dee, D. P., Uppala, S., Simmons, A. J., Berrisford, P., Poli, P., Kobayashi, S., Andrae, U., Balmaseda, M., Balsamo, G., and Bauer, d. P.: The ERA-Interim reanalysis: Configuration and performance of the data assimilation system, Q. J. R. Meteorol. Soc., 137, 553–597, https://doi.org/10.1002/qj.828, 2011.
Eyre, J., Bell, W., Cotton, J., English, S., Forsythe, M., Healy, S., and Pavelin, E.: Assimilation of satellite data in numerical weather prediction. Part II: Recent years, Q. J. R. Meteorol. Soc., 148, 521–556, https://doi.org/10.1002/qj.4228, 2022.
Foelsche, U., Borsche, M., Steiner, A. K., Gobiet, A., Pirscher, B., Kirchengast, G., Wickert, J., and Schmidt, T.: Observing upper troposphere-lower stratosphere climate with radio occultation data from the CHAMP satellite, Clim. Dyn., 31, 49–65, https://doi.org/10.1007/s00382-007-0337-7, 2008.
Guo, P., Kuo, Y. H., Sokolovskiy, S. V., and Lenschow, D. H.: Estimating Atmospheric Boundary Layer Depth Using COSMIC Radio Occultation Data, J. Atmos. Sci., 68, 1703–1713, https://doi.org/10.1175/2011JAS3612.1, 2011.
Hajj, G. A., Kursinski, E. R., Romans, L. J., Bertiger, W. I., and Leroy, S. S.: A technical description of atmospheric sounding by GPS occultation, J. Atmos. Sol.-Terr. Phys., 64, 451–469, https://doi.org/10.1016/S1364-6826(01)00114-6, 2002.
He, Y., Zhang, S., Guo, S., and Wu, Y.: Quality Assessment of the Atmospheric Radio Occultation Profiles from FY-3E/GNOS-II BDS and GPS Measurements, Remote Sens., 15, https://doi.org/10.3390/rs15225313, 2023.
Healy, S. and Eyre, J.: Retrieving temperature, water vapour and surface pressure information from refractiveindex profiles derived by radio occultation: A simulation study, Q. J. R. Meteorol. Soc., 126, 1661–1683, https://doi.org/10.1002/qj.49712656606, 2000.
Hersbach, H., Bell, B., Berrisford, P., Horányi, A., Muñoz Sabater, J., Nicolas, J., Radu, R., Schepers, D., Simmons, A., Soci, C., and Dee, D.: Global reanalysis: goodbye ERA-Interim, hello ERA5, ECMWF newsletter, 159, 17–24, https://doi.org/10.21957/vf291hehd7, 2019.
Hersbach, H., Bell, B., Berrisford, P., Hirahara, S., Horányi, A., Muñoz-Sabater, J., Nicolas, J., Peubey, C., Radu, R., Schepers, D., Simmons, A., Soci, C., Abdalla, S., Abellan, X., Balsamo, G., Bechtold, P., Biavati, G., Bidlot, J., Bonavita, M., De Chiara, G., Dahlgren, P., Dee, D., Diamantakis, M., Dragani, R., Flemming, J., Forbes, R., Fuentes, M., Geer, A., Haimberger, L., Healy, S., Hogan, R. J., Hólm, E., Janisková, M., Keeley, S., Laloyaux, P., Lopez, P., Lupu, C., Radnoti, G., de Rosnay, P., Rozum, I., Vamborg, F., Villaume, S., and Thépaut, J.-N.: The ERA5 global reanalysis, Q. J. R. Meteorol. Soc., 146, 1999–2049, https://doi.org/10.1002/qj.3803, 2020.
Hocke, K.: Inversion of GPS meteorology data, Ann. Geophys., 15, 443–450, https://doi.org/10.1007/s00585-997-0443-1, 1997.
Huang, C.-Y., Kuo, Y.-H., Chen, S.-Y., Terng, C.-T., Chien, F.-C., Lin, P.-L., Kueh, M.-T., Chen, S.-H., Yang, M.-J., Wang, C.-J., and Prasad Rao, A. S. K. A. V.: Impact of GPS radio occultation data assimilation on regional weather predictions, GPS Solut., 14, 35–49, https://doi.org/10.1007/s10291-009-0144-1, 2010.
Kirchengast, G.: Occultations for probing atmosphere and climate: Setting the scene, in: Occultations for Probing Atmosphere and Climate, edited by: Kirchengast, G., Foelsche, U., and Steiner, A. K., Springer-Verlag, Berlin-Heidelberg, 1–8, https://doi.org/10.1007/978-3-662-09041-1, 2004.
Kursinski, E. R., Hajj, G. A., Schofield, J. T., Linfield, R. P., and Hardy, K. R.: Observing Earth's atmosphere with radio occultation measurements using the Global Positioning System, J. Geophys. Res., 102, 23429–23465, https://doi.org/10.1029/97JD01569, 1997.
Kursinski, E. R., Brandmeyer, J., Scharf, I., McCormick, C., Botnick, A., Houle, B., Triolo, T., Dotts, C., Feng, X., Giesinger, B., McGaugh, P., Palowski, C., and Schira, C.: PlanetiQ status report, IROWG-10 (10th International Radio Occultation Working Group), Boulder, CO, USA, 2024.
Lewis, O., Bowler, N., Healy, S., and Lauritsen, K. B.: An initial assessment of the quality of RO data from FY-3E, Met Office, Exeter, UKSAF/ROM/METO/REP/RSR/047, 2025.
Li, X., Thomas, C., Jin, .X, Liu, H. X., Kleist, D., Cucurull, L., Riedel, C., and Collard, A.: Impact of ROMEX Data on NCEP GFS Forecast, IROWG-10 (10th International Radio Occultation Working Group), Boulder, CO, USA, https://www.cosmic.ucar.edu/events/cosmic-jcsda-workshop-irowg-10/agenda (last access: 23 January 2026), 2024.
Li, Y., Kirchengast, G., Scherllin-Pirscher, B., Wu, S., Schwaerz, M., Fritzer, J., Zhang, S., Carter, B. A., and Zhang, K.: A new dynamic approach for statistical optimization of GNSS radio occultation bending angles for optimal climate monitoring utility, J. Geophys. Res., 118, 13022–13040, https://doi.org/10.1002/2013JD020763, 2013.
Li, Y., Kirchengast, G., Scherllin-Pirscher, B., Norman, R., Yuan, Y. B., Fritzer, J., Schwaerz, M., and Zhang, K.: Dynamic statistical optimization of GNSS radio occultation bending angles: advanced algorithm and performance analysis, Atmos. Meas. Tech., 8, 3447–3465, https://doi.org/10.5194/amt-8-3447-2015, 2015.
Li, Y., Kirchengast, G., Scherllin-Pirscher, B., Schwaerz, M., Nielsen, J. K., Ho, S.-p., and Yuan, Y.-b.: A New Algorithm for the Retrieval of Atmospheric Profiles from GNSS Radio Occultation Data in Moist Air and Comparison to 1DVar Retrievals, Remote Sens., 11, https://doi.org/10.3390/rs11232729, 2019.
Li, Y., Kirchengast, G., Schwärz, M., Ladstädter, F., and Yuan, Y.: Monitoring sudden stratospheric warmings using radio occultation: a new approach demonstrated based on the 2009 event, Atmos. Meas. Tech., 14, 2327–2343, https://doi.org/10.5194/amt-14-2327-2021, 2021.
Li, Y., Kirchengast, G., Schwaerz, M., and Yuan, Y.: Monitoring sudden stratospheric warmings under climate change since 1980 based on reanalysis data verified by radio occultation, Atmos. Chem. Phys., 23, 1259–1284, https://doi.org/10.5194/acp-23-1259-2023, 2023.
Liang, J., Liu, C., Wang, X., Meng, X., Sun, Y., Liao, M., Hu, X., Lu, W., Wang, J., Zhang, P., Yang, G., Xu, N., Bai, W., Du, Q., Hu, P., Tan, G., Wang, X., Xia, J., Huang, F., Yin, C., Cai, Y., and Li, P.: Assessment of FY-3E GNOS II Radio Occultation Data Using an Improved Three-Cornered Hat Method, Remote Sens., 16, 3808, https://doi.org/10.3390/rs16203808, 2024.
Liao, M., Zhang, P., Bi, Y., and Yang, G.: A preliminary estimation of the radio occultation products accuracy from the Fengyun-3C meteorological satellite, Acta Meteorol. Sin., 73, 1131–1140, https://doi.org/10.11676/qxxb2015.072, 2015.
Liao, M., Zhang, P., Yang, G., Bai, W., Meng, X., Du, Q., and Sun, Y.: Status of radio occultation sounding technology of FY-3C GNOS, Adv. Meteor. Sci. Technol., 6, 83–87, 2016a.
Liao, M., Zhang, P., Yang, G.-L., Bi, Y.-M., Liu, Y., Bai, W.-H., Meng, X.-G., Du, Q.-F., and Sun, Y.-Q.: Preliminary validation of the refractivity from the new radio occultation sounder GNOS/FY-3C, Atmos. Meas. Tech., 9, 781–792, https://doi.org/10.5194/amt-9-781-2016, 2016b.
Liu, C., Liao, M., Sun, Y., Wang, X., Liang, J., Hu, X., Zhang, P., Yang, G., Liu, Y., Wang, J., Bai, W., Du, Q., Meng, X., Hu, P., Tan, G., Wang, X., Xia, J., Huang, F., Yin, C., Cai, Y., Li, W., Li, P., and Kirchengast, G.: Preliminary Assessment of BDS Radio Occultation Retrieval Quality and Coverage Using FY-3E GNOS II Measurements, Remote Sens., 15, https://doi.org/10.3390/rs15205011, 2023.
Lonitz, K.: Sensitivity to the RO observation operator when assimilating 35,000 radio occultations per day during ROMEX IROWG-10 (10th International Radio Occultation Working Group), Boulder, CO, USA, 2024.
Luntama, J.-P., Kirchengast, G., Borsche, M., Foelsche, U., Steiner, A., Healy, S., von Engeln, A., O'Clerigh, E., and Marquardt, C.: Prospects of the EPS GRAS Mission For Operational Atmospheric Applications, Bull. Amer. Meteor. Soc., 89, 1863–1876, https://doi.org/10.1175/2008BAMS2399.1, 2008.
Melbourne, W., Davis, E., Duncan, C., Hajj, G., Hardy, K., Kursinski, E., Meehan, T., Young, L., and Yunck, T.: The application of spaceborne GPS to atmospheric limb sounding and global change monitoring, Jet Propulsion Laboratory, California Institute of Technology, Pasadena, CAJPL Publication 94-18, 1–26, https://ntrs.nasa.gov/api/citations/19960008694/downloads/19960008694.pdf (last access: 23 January 2026), 1994.
Miller, W. J. S., Chen, Y., Ho, S.-P., and Shao, X.: Does Assimilating PlanetIQ and Spire GNSS RO Bending Angles Improve HAFS Forecasts of Four 2022 Atlantic Hurricanes? An Evaluation in Support of the ROMEX Experiment IROWG-10 (10th International Radio Occultation Working Group), Boulder, CO, USA, https://www.cosmic.ucar.edu/events/cosmic-jcsda-workshop-irowg-10/agenda (last access: 23 January 2026), 2024.
Mo, Z., Lou, Y., Zhang, W., Zhou, Y., Wu, P., and Zhang, Z.: Performance assessment of multi-source GNSS radio occultation from COSMIC-2, MetOp-B/C, FY-3D/E, Spire and PlanetiQ over China, Atmos. Res., 311, 107704, https://doi.org/10.1016/j.atmosres.2024.107704, 2024.
Nguyen, V., Jales, P., Talpe, M., Cartwright, J., Savastano, G., Vetra-carvalho, S., Navacchi, C., Sikarin, R., Ashour, M., Franci, A., and Yeoh, B.: Status and Future Plans of Spire's GNSS Radio Occultation and Reflectometry Constellation,IROWG-10 (10th International Radio Occultation Working Group), Boulder, CO, USA, https://www.cosmic.ucar.edu/events/cosmic-jcsda-workshop-irowg-10/agenda (last access: 23 January 2026) 2022.
Pirscher, B.: Multi-satellite climatologies of fundamental atmospheric variables from Radio Occulation and their validation, PhD, Wegener Center Verlag Graz, Graz, Austria, 218 pp., https://wegcwww.uni-graz.at/publ/wegcreports/2010/WCV-SciRep-No33-BPirscher-Mai2010.pdf (last access: 23 January 2026), 2010.
Rieckh, T., Scherllin-Pirscher, B., Ladstädter, F., and Foelsche, U.: Characteristics of tropopause parameters as observed with GPS radio occultation, Atmos. Meas. Tech., 7, 3947–3958, https://doi.org/10.5194/amt-7-3947-2014, 2014.
Rocken, C., Anthes, R., Exner, M., Hunt, D., Sokolovskiy, S., Ware, R., Gorbunov, M., Schreiner, W., Feng, D., Herman, B., Kuo, Y. H., and Zou, X.: Analysis and validation of GPS/MET data in the neutral atmosphere, J. Geophys. Res., 102, 29849–29866, https://doi.org/10.1029/97JD02400, 1997.
Scherllin-Pirscher, B., Syndergaard, S., Foelsche, U., and Lauritsen, K. B.: Generation of a bending angle radio occultation climatology (BAROCLIM) and its use in radio occultation retrievals, Atmos. Meas. Tech., 8, 109–124, https://doi.org/10.5194/amt-8-109-2015, 2015.
Schmidt, T., Wickert, J., and Haser, A.: Variability of the upper troposphere and lower stratosphere observed with GPS radio occultation bending angles and temperatures, Adv. Space Res., 46, 150–161, https://doi.org/10.1016/j.asr.2010.01.021, 2010.
Schreiner, W., Rocken, C., Sokolovskiy, S., Syndergaard, S., and Hunt, D.: Estimates of the precision of GPS radio occultations from the COSMIC/FORMOSAT-3 mission, Geophys. Res. Lett., 34, https://doi.org/10.1029/2006GL027557, 2007.
Simmons, A., Soci, C., Nicolas, J., Bell, B., Berrisford, P., Dragani, R., Flemming, J., Haimberger, L., Healy, S., Hersbach, H., Horanyi, A., Inness, A., Munoz-Sabater, J., Radu, R., and Schepers, D.: Global stratospheric temperature bias and other stratospheric aspects of ERA5 and ERA5.1, Technical Memo 859, https://doi.org/10.21957/rcxqfmg0, 2020.
Singh, R., Ojha, S. P., Anthes, R., and Hunt, D.: Evaluation and Assimilation of the COSMIC-2 Radio Occultation Constellation Observed Atmospheric Refractivity in the WRF Data Assimilation System, Journal of Geophysical Research: Atmospheres, 126, e2021JD034935, https://doi.org/10.1029/2021JD034935, 2021.
Sokolovskiy, S., Kuo, Y. H., Rocken, C., Schreiner, W. S., Hunt, D., and Anthes, R. A.: Monitoring the atmospheric boundary layer by GPS radio occultation signals recorded in the open-loop mode, Geophys. Res. Lett., 33, https://doi.org/10.1029/2006GL025955, 2006.
Steiner, A. K., Kirchengast, G., and Ladreiter, H. P.: Inversion, error analysis, and validation of GPS/MET occultation data, Ann. Geophys., 17, 122–138, https://doi.org/10.1007/s00585-999-0122-5, 1999.
Steiner, A. K., Lackner, B. C., Ladstädter, F., Scherllin-Pirscher, B., Foelsche, U., and Kirchengast, G.: GPS radio occultation for climate monitoring and change detection, Radio Sci., 46, 1–17, https://doi.org/10.1029/2010RS004614, 2011.
Steiner, A. K., Ladstädter, F., Randel, W. J., Maycock, A. C., Fu, Q., Claud, C., Gleisner, H., Haimberger, L., Ho, S. P., Keckhut, P., Leblanc, T., Mears, C., Polvani, L. M., Santer, B. D., Schmidt, T., Sofieva, V., Wing, R., and Zou, C. Z.: Observed Temperature Changes in the Troposphere and Stratosphere from 1979 to 2018, J. Climate, 33, 8165–8194, https://doi.org/10.1175/JCLI-D-19-0998.1, 2020.
Sun, Y., Bai, W., Liu, C., Liu, Y., Du, Q., Wang, X., Yang, G., Liao, M., Yang, Z., Zhang, X., Meng, X., Zhao, D., Xia, J., Cai, Y., and Kirchengast, G.: The FengYun-3C radio occultation sounder GNOS: a review of the mission and its early results and science applications, Atmos. Meas. Tech., 11, 5797–5811, https://doi.org/10.5194/amt-11-5797-2018, 2018.
Sun, Y., Huang, F., Xia, J., Yin, C., Bai, W., Du, Q., Wang, X., Cai, Y., Li, W., Yang, G., Zhai, X., Xu, N., Hu, X., Liu, Y., Liu, C., Wang, D., Qiu, T., Tian, Y., Duan, L., Li, F., Meng, X., Liu, C., Tan, G., Hu, P., Wu, R., and Song, D.: GNOS-II on Fengyun-3 Satellite Series: Exploration of Multi-GNSS Reflection Signals for Operational Applications, Remote Sens., 15, https://doi.org/10.3390/rs15245756, 2023.
Syndergaard, S., Healy, S., and Lauritsen, K. B.: Validation Report: Reprocessed Level1B bending angle, Level2A refractivity, Level2A dry temperature CDR v1.0 products (Version 1.2), ROM SAF Consortium (DMI, ECMWF, IEEC, UKMO), SAF/ROM/DMI/REP/1DVAR/001, 1–157, https://rom-saf.eumetsat.int/product_documents/romsaf_vr_atm_rep.pdf (last access: 23 January 2026), 2018.
Teng, H.-F., Kuo, Y.-H., and Done, J. M.: Potential Impacts of Radio Occultation Data Assimilation on Forecast Skill of Tropical Cyclone Formation in the Western North Pacific, Geophys. Res. Lett., 50, e2021GL096750, https://doi.org/10.1029/2021GL096750, 2023.
Ware, R., Exner, M., Feng, D., Gorbunov, M., Hardy, K., Herman, B., Kuo, Y., Meehan, T., Melbourne, W., Rocken, C., Schreiner, W., Sokolovskiy, S., Solheim, F., Zou, X., Anthes, R., Businger, S., and Trenberth, K.: GPS Sounding of the Atmosphere from Low Earth Orbit: Preliminary Results, Bull. Amer. Meteor. Soc., 77, 19–40, https://doi.org/10.1175/1520-0477(1996)077<0019:GSOTAF>2.0.CO;2, 1996.
Wickert, J., Reigber, C., Beyerle, G., König, R., Marquardt, C., Schmidt, T., Grunwaldt, L., Galas, R., Meehan, T. K., Melbourne, W. G., and Hocke, K.: Atmosphere sounding by GPS radio occultation: First results from CHAMP, Geophys. Res. Lett., 28, 3263–3266, https://doi.org/10.1029/2001GL013117, 2001.
Wickert, J., Beyerle, G., König, R., Heise, S., Grunwaldt, L., Michalak, G., Reigber, Ch., and Schmidt, T.: GPS radio occultation with CHAMP and GRACE: A first look at a new and promising satellite configuration for global atmospheric sounding, Ann. Geophys., 23, 653–658, https://doi.org/10.5194/angeo-23-653-2005, 2005.
Xu, X., Han, W., Wang, J., Gao, Z., Li, F., Cheng, Y., and Fu, N.: Quality assessment of YUNYAO radio occultation data in the neutral atmosphere, Atmos. Meas. Tech., 18, 1339–1353, https://doi.org/10.5194/amt-18-1339-2025, 2025.
Yang, S.-C., Chen, S.-H., and Chang, C.-C.: Understanding the impact of assimilating FORMOSAT-7/COSMIC-2 radio occultation refractivity on tropical cyclone genesis: Observing system simulation experiments using Hurricane Gordon (2006) as a case study, Q. J. R. Meteorol. Soc., 149, 1293–1318, https://doi.org/10.1002/qj.4455, 2023.
- Abstract
- Background
- Data and methodology
- Ionosphere-corrected bending angle quality
- Optimized bending angle, refractivity and temperature
- Conclusions
- Code availability
- Data availability
- Author contributions
- Competing interests
- Disclaimer
- Acknowledgements
- Financial support
- Review statement
- References