the Creative Commons Attribution 4.0 License.
the Creative Commons Attribution 4.0 License.
 | 02 Mar 2018
Comparisons of the tropospheric specific humidity from GPS radio occultations with ERA-Interim, NASA MERRA, and AIRS data
Panagiotis Vergados
Anthony J. Mannucci
Chi O. Ao
Olga Verkhoglyadova
Byron Iijima
We construct a 9-year data record (2007–2015) of the tropospheric specific humidity using Global Positioning System radio occultation (GPS RO) observations from the Constellation Observing System for Meteorology, Ionosphere, and Climate (COSMIC) mission. This record covers the ±40∘ latitude belt and includes estimates of the zonally averaged monthly mean specific humidity from 700 up to 400 hPa. It includes three major climate zones: (a) the deep tropics (±15∘), (b) the trade winds belts (±15–30∘), and (c) the subtropics (±30–40∘). We find that the RO observations agree very well with the European Centre for Medium-Range Weather Forecasts Re-Analysis Interim (ERA-Interim), the Modern-Era Retrospective Analysis for Research and Applications (MERRA), and the Atmospheric Infrared Sounder (AIRS) by capturing similar magnitudes and patterns of variability in the monthly zonal mean specific humidity and interannual anomaly over annual and interannual timescales. The JPL and UCAR specific humidity climatologies differ by less than 15 % (depending on location and pressure level), primarily due to differences in the retrieved refractivity. In the middle-to-upper troposphere, in all climate zones, JPL is the wettest of all data sets, AIRS is the driest of all data sets, and UCAR, ERA-Interim, and MERRA are in very good agreement, lying between the JPL and AIRS climatologies. In the lower-to-middle troposphere, we present a complex behavior of discrepancies, and we speculate that this might be due to convection and entrainment. Conclusively, the RO observations could potentially be used as a climate variable, but more thorough analysis is required to assess the structural uncertainty between centers and its origin.
- Article
(3945 KB) - Full-text XML
-
Supplement
(11556 KB) - BibTeX
- EndNote


The Intergovernmental Panel on Climate Change (IPCC) Fifth Assessment Report (AR5) (Flato et al., 2013) reported that identifying the vertical structure of humidity is subject to great uncertainty, because dynamical processes that cannot be captured by one sensor alone drive water vapor. Hence, we ought to quantify and understand the degree of agreement of the water vapor concentration in the troposphere among different sensors in order to improve the representation of the Earth's atmospheric humidity content that is key to predicting future climate (Hegerl et al., 2015).
To date, ground- and space-based platforms, reanalyses, and model simulations do not provide precise knowledge of the water vapor's concentration, or its trends over time, in multiple regions of the Earth's atmosphere (Sherwood et al., 2010). This is because of a combination of different reasons that include (a) sampling bias due to cloudiness, deep convection, or surface emissivity variations; (b) biases due to limited local time coverage, or random observations versus volume-filling scans; (c) coarse spatial resolution, and (d) misrepresentation of the planetary boundary layer's moisture content (Hannay et al., 2009) that induces errors in the lower-to-middle troposphere moist convection.
In particular, infrared (IR) space-based platforms have a relatively coarse vertical resolution (e.g., 2.0–3.0 km), are prone to cloud contamination (Fetzer et al., 2006), and tend to be biased low over wet and dry humidity extremes (Fetzer et al., 2008; Chou et al., 2009). The use of IR observations in the lower troposphere still remains a challenge due to the decreasing information content and the difficulty of detecting low-cloud contamination (Schreier et al., 2014). Space-based microwave (MW) limb sounders, despite having low sensitivity to precipitation and clouds, have a coarse vertical resolution (e.g., 3.0 km in case of the Microwave Limb Sounder, MLS; Waters et al., 2006) and are sensitive to the a priori solution that could cause unsuccessful limb-viewing radiance retrievals (e.g., of up to 30 % in the case of MLS; Read et al., 2007) under clear sky but moist conditions. Heavy cloudiness, especially in the middle-to-upper troposphere can also introduce biases in the upwelling MW radiation from water vapor due to the presence of ice particles that can contaminate the MW retrievals (Fetzer et al., 2008). Global circulation models do not properly represent the middle troposphere moist convection (Sherwood et al., 2010; Holloway and Neelin, 2009; Frenkel et al., 2012), and large discrepancies in the tropospheric humidity among different reanalyses (Chen et al., 2008) and among reanalyses, models, and satellite observations (Chuang et al., 2010; Jiang et al., 2012; Tian et al., 2013; Wang and Su, 2013) still persist.
The path towards constraining the models, reanalyses, and satellite water vapor observational uncertainties is to compare them against data sets that are as independent from their a priori information as possible. Here, we use the multiyear observational record from Global Positioning System radio occultation (GPS RO) observations as such a data set, offering all-weather sensing, high vertical resolution (100–200 m; Kursinski et al., 2000; Schmidt et al., 2005), high specific humidity (SH) accuracy (< 1.0 g kg−1), and full diurnal cycle sampling (depending on the orbit and number of the RO spacecrafts).
Our primary objective is to create a short-term SH data record (9 years) based on RO observations and compare it against NASA's Modern-Era Retrospective Analysis for Research and Applications (MERRA), the European Centre for Medium-Range Weather Forecasts (ECMWF) Re-Analysis Interim (ERA-Interim), and Atmospheric Infrared Sounder (AIRS) data sets. Our goal is to evaluate the consistency of the RO SH retrievals with respect to state-of-the-art reanalyses and satellite observations by quantifying the RO differences with the rest of the data sets over the tropics and subtropics. We anticipate gaining new insights about the SH distribution over different convective regions, which could provide guidelines for future model improvements. The uniqueness of this investigation is that this is the first study to compare nearly a decade long data record of RO SH information and their interannual variability against MERRA, ERA-Interim, and AIRS. The description of the humidity retrieval process from RO observations is discussed in detail in Kursinski et al. (1997), Kursinski and Hajj (2001), and Collard and Healey (2003). Of importance is the fact that we use MERRA, instead of MERRA-2, because MERRA does not assimilate ROs (unlike ERA-Interim), providing an independent data set when comparing the RO SH observations.
Section 2 presents the data sets we use in this analysis together with their retrieval characteristics. In Sect. 3, we present and discuss the RO SH climatologies with respect to the rest of the data sets and Sect. 4 summarizes our current research.
We create time series of tropospheric SH climatologies using Constellation Observing System for Meteorology, Ionosphere, and Climate (COSMIC) observations (both the UCAR and the JPL retrievals), the MERRA and ERA-Interim data sets, and the Atmospheric Infrared Sounder (AIRS) observations. These climatologies contain a 9-year measurement record from January 2007 until December 2015 and represent monthly zonal mean averages. We study the geographic region between ±40∘ latitude, which we divide into three distinct dynamical regions: (a) the deep tropics (±15∘), (b) the middle tropics (±15–30∘), and (c) the subtropics (±30–40∘). In each region, we study the annual and interannual variability and trend of the SH from all data sets, and then we quantify the mean differences and standard deviations of all climatologies with respect to the JPL climatology (that we use as a reference). The time series represent monthly zonal averages of the SH at individual pressure levels from the lower to the middle troposphere: 700, 600, 500, and 400 hPa.
We are particularly interested in investigating the performance of the RO SH climatologies with respect to other databases within ±40∘ latitude, as it is a key region for climate research, and because models and observations exhibit large differences in the middle and upper troposphere in this band (e.g., Jiang et al., 2012; Tian et al., 2013; Wang and Su, 2013). We focus between 700 and 400 hPa because, although tracking of the GPS signals in the lower troposphere (e.g., below 700 hPa) has been greatly improved with the use of open loop tracking techniques (Sokolovskiy et al., 2006), the presence of the water vapor and small signal-to-noise ratio could still cause loss of lock for lower altitudes. Additionally, atmospheric ducting at and below the planetary boundary layer could also lead to negative refractivity biases (Ao et al., 2003; Xie et al., 2010). Above 400 hPa, the signature of water vapor on the atmospheric refractivity is small, leading to larger retrieval errors.
2.1 Constellation Observing System for Meteorology, Ionosphere, and Climate
The COSMIC constellation of six microsatellites were launched in April 2006 orbiting the Earth at an altitude of ∼ 800 km in near-circular low Earth orbit (Anthes et al., 2008). They measure the phase and amplitude of the transmitted dual frequency L-band GPS signals (f1 = 1.57542 GHz; f2 = 1.22760 GHz) as a function of time. The relative motion of the COSMIC satellites with respect to the GPS satellites and the presence of the atmosphere cause a Doppler frequency shift on the transmitted GPS signals received by the COSMIC satellites. The magnitude of the Doppler frequency shift is estimated as the time derivative of the recorded GPS signal phases, which together with precise knowledge of the position and velocity information of both the COSMIC and the GPS satellites allows for estimation of the amount of bending of the transmitted GPS signals due to the presence of the atmosphere, from which one can infer the air refractive index (Kursinski et al., 1997). In the lower troposphere, the bending angle is retrieved using radioholographic methods (such as canonical transform or full spectrum inversion) that eliminate errors due to atmospheric multipath (e.g., Ao et al., 2003). The relative motion of the COSMIC and GPS satellite pair allows for the vertical scanning of the atmosphere providing vertical profiles of atmospheric refractivity, which contain temperature and humidity information.
We use RO-derived SH products from both the UCAR and the JPL processing centers, which follow different processing techniques. Although this study does not focus on these differences, we note that UCAR adopts a variational assimilation method, which requires a priori estimates of the atmospheric water vapor content (provided by ERA-Interim), implying that the derived SH products may be subject to the error characteristics of the humidity initialization. In contrast, JPL uses the refractivity equation (along with the hydrostatic equation and equation of state) to estimate the water vapor pressure given a priori knowledge of air temperature (Hajj et al., 2002):
where N (unitless) is the refractivity, P (mbar) is the pressure, T (K) is the temperature, and e (mbar) is the RO-derived water vapor pressure. The equation we use to convert the water vapor pressure into specific humidity is given by
where q (g kg−1) is the specific humidity, P (mbar) is the pressure, and e (mbar) is the RO-derived water vapor pressure. The retrieval errors of the JPL SH products do not contain a priori humidity information, but they are subject to errors in the a priori temperature information, which is provided by the ECMWF Tropical Ocean and Global Atmosphere (TOGA) database. Because Eq. (1) requires that both the RO and the ECMWF TOGA data sets be reported at the same pressure levels, we interpolate the temperature profiles into the vertical grid of the RO profiles using linear interpolation in the log pressure domain. Currently, the JPL-retrieved COSMIC refractivity profiles are provided at 200 m vertical resolution in the lower to middle troposphere.
2.2 Modern-Era Retrospective Analysis for Research and Application
We use the MERRA (v5.2.0) analysis that employs a 3-D variational assimilation technique based on the Gridpoint Statistical Interpolation (GIS) scheme with a 6 h update cycle (e.g., Wu et al., 2002). It did not yet assimilate RO observations and, therefore, it is an independent data set from COSMIC. Besides MERRA-2 assimilating GPS RO bending angle observations, it also includes significant changes with respect to MERRA in regards to moisture analysis that have a direct affect on the water cycle (Gelaro et al., 2017; Takacs et al., 2016; Bosilovich et al., 2017). Although GPS RO comparisons with MERRA-2 could provide valuable statistics, they would not represent a clear picture of the effect of assimilating GPS RO observations unless the impact of all other improvements on the humidity climatology is first determined. We analyze the monthly gridded SH products given in a 1/2∘ × 2/3∘ latitude–longitude grid and 42 vertical pressure levels. In the troposphere, the vertical pressure resolution from the surface up to 700 hPa is 25 hPa, whereas from 700 until 300 hPa the vertical resolution is 50 hPa. MERRA is a NASA analysis that assimilates satellite observations using Goddard's Earth Observing System (GOES) version 5.2.0 Data Assimilation System (DAS) (Rienecker et al., 2008). Primarily, it assimilates radiances from AIRS, the Advanced Television and Infrared Observatory Spacecraft Operational Vertical Sounder (ATOVS), and the Special Sensor Microwave Imager (SSM/I), and Fig. 4 in Rienecker et al. (2011) provides a detailed list of the rest of the data sets that are assimilated.
2.3 European Center for Medium-Range Weather Forecasts Re-Analysis Interim
We use the ERA-Interim (Dee et al., 2011), which uses a 4-D variational assimilation technique (Simmons et al., 2005) to analyze a variety of observational data sets to predict the state of the atmosphere with accuracy similar to what is theoretically possible based on the error characteristics of the assimilated data (Simmons and Hollingsworth, 2002). We analyze the monthly gridded SH products given in a 0.75∘ × 0.75∘ latitude–longitude grid and 20 pressure levels from 1000 up to 300 hPa. The vertical resolution from the surface up to 750 hPa is 25 hPa, but the vertical resolution decreases to 50 hPa between 750 and 300 hPa. The primary data sets assimilated in ERA-Interim are radiosonde humidity observations, AIRS and microwave radiances and, as of November 2006, the GPS RO bending angle profiles.
2.4 Atmospheric Infrared Sounder
We use the AIRS/AMSU v6 Level 3 data (Tian et al., 2013) and analyze the monthly gridded SH product given in a 1∘ × 1∘ latitude–longitude grid, which extends from the surface up to 100 hPa in 12 vertical pressure levels (∼ 2.0 km vertical resolution). The latest AIRS v6 SH products are now available at standard pressure levels. The vertical resolution between the surface up to 850 hPa is 75 hPa; between 700 and 300 hPa the vertical resolution decreases to 100 hPa, and above the 300 hPa pressure level up to 100 hPa the vertical resolution is 50 hPa. The AIRS physical retrievals use an IR–MW neural net solution (Blackwell et al., 2008) as the first guess for temperature and water vapor profiles based on MIT's stochastic cloud-clearing and neural network solution described in Khan et al. (2014).
2.5 Establishing data set accuracy
Kursinski et al. (1995) estimated that occultation water vapor pressure profiles at the tropics have a precision between 10 and 20 % below 7.0 km altitude assuming temperature errors of 1.5 K, surface pressure errors of 3 mbar, and refractivity errors of < 0.2 %, which translate to a SH precision of < 0.25 g kg−1 at 700 hPa and < 0.03 g kg−1 at 400 hPa, given a mean SH of 4.0 g kg−1 at 700 hPa and 1.0 g kg−1 at 400 hPa between January 2007 and December 2015. Kursinski and Hajj (2001) determined that the precision of individual occultation SH profiles is ∼ 0.20–0.50 g kg−1 in the middle-to-lower troposphere. Ho et al. (2007) combined AIRS and RO data retrieving SH profiles in the lower troposphere with root-mean-square error (RMSE) between 0.40 g kg−1 (at 700 hPa) and 0.05 g kg−1 (at 400 hPa). Ho et al. (2010) collocated RO and ECMWF profiles near radiosonde locations and estimated that the standard deviation of the differences between the two data sets is < 0.50 g kg−1 above 3.0 km altitude. Kishore et al. (2011) estimated that the differences between the ERA-Interim and COSMIC are −0.15±0.22 g kg−1 at 3.0 km and −0.07±0.06 g kg−1 at 7.0 km in the deep tropics (±20∘). They also estimated that the differences between the Japanese 25-year Reanalysis (JRA-25) and COSMIC are about -0.10±0.23 g kg−1 at 3.0 km and -0.20±0.06 g kg−1 at 7.0 km. Ao et al. (2012) estimated that the SH precision is ∼ 0.15 g kg−1 per degree K error in temperature. Vergados et al. (2014) reported that RO SH is retrieved within ∼ 0.20–0.40 g kg−1 accuracy at the tropics, provided the RO refractivity accuracy is ∼ 1.0 % at an altitude of 2.0 km, decreasing to ∼ 0.2 % at an altitude of 8.0 km (Kuo et al., 2005) and a temperature error of ±1.0 K. Recently, Kursinski and Gebhardt (2014) proposed a novel approach to further improve the retrieved humidity accuracy and precision from RO observations in the middle troposphere.
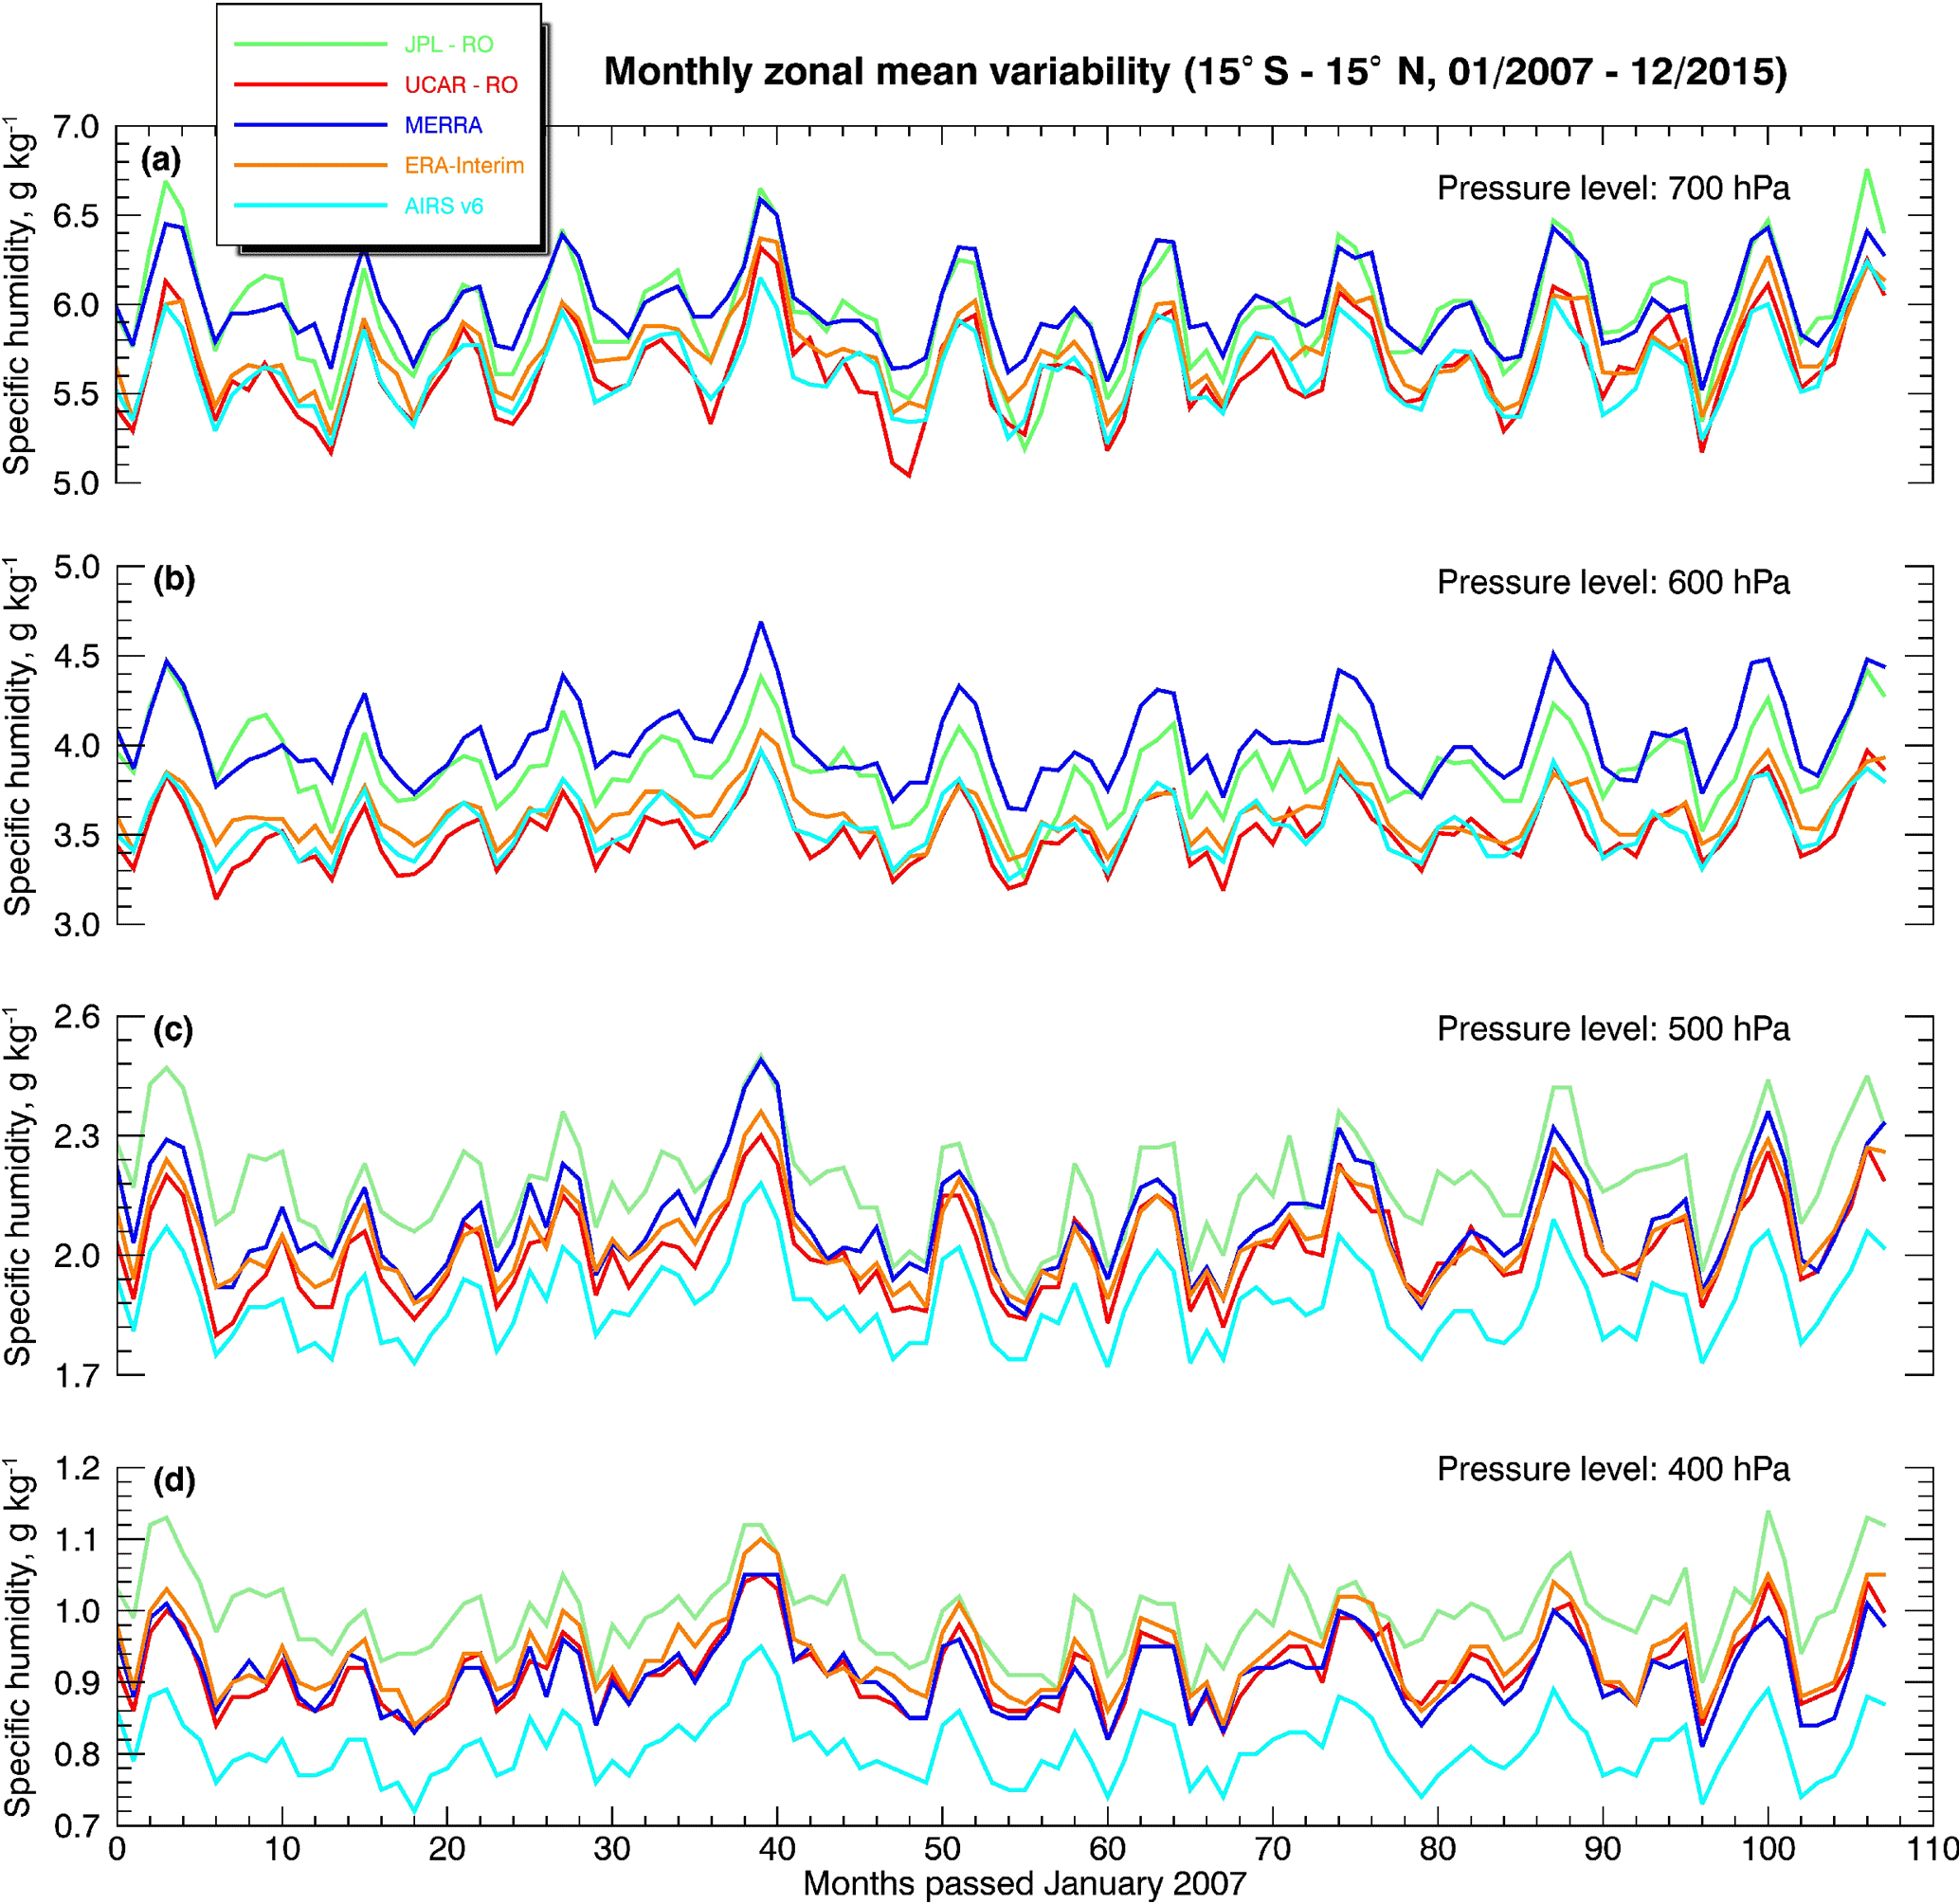
Figure 1Times series of the monthly zonal averages of the specific humidity from 1 January 2007 until 31 December 2015 from JPL (green), UCAR (red), ERA-Interim (orange), MERRA (blue), and AIRS (cyan) at (a) 500 hPa, (b) 400 hPa, (c) 700 hPa, and (d) 600 hPa pressure levels.
Conclusively, the SH accuracy and precision from RO observations depends on altitude and we determine it to be ∼ 10–20 %. MERRA assimilates various observational data sets and the SH accuracy is a function of the accuracy of the assimilated products. In general, the MERRA SH retrievals are accurate to ∼ 20 % (Rienecker et al., 2011). AIRS estimated SH product accuracies are typically ∼ 25 % at p > 200 hPa (Fetzer et al., 2008), and ERA-Interim SH products have an estimated accuracy of ∼ 7–20 % in the tropical lower-to-middle troposphere (Dee et al., 2011). The RO retrievals seem to have better accuracy than the AIRS retrievals, which could be attributed to the fact that the RO observations are based on precise time measurements and have very low sensitivity to clouds (unlike the IR observations). In general, the RO observations seem to have similar accuracy and precision with both the MERRA and ERA-Interim reanalyses.
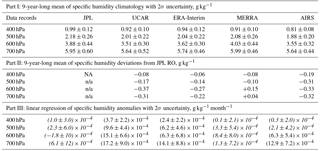
Table 1Mean climatology, deviation of the mean climatology from JPL, and linear regression fits of the specific humidity time series from JPL, UCAR, ERA-Interim, MERRA, and AIRS over the ±15∘ climate region. The 2σ uncertainties are estimated for each statistical metric, and their statistical significance is evaluated at p < 0.05 confidence level. Values in italic font are statistically insignificant.
3.1 Analysis of the specific humidity in the deep tropics
The latitude belt within ±15∘ encompasses the ascending branch of the Hadley cell circulation. Near to the surface, moist air masses from both hemispheres converge within this narrow equatorial region, collide, and lead to heavy precipitation. The amount of the latent heat released during rainfall warms the air driving strong rising motions, deep convection, and high cloud formation.
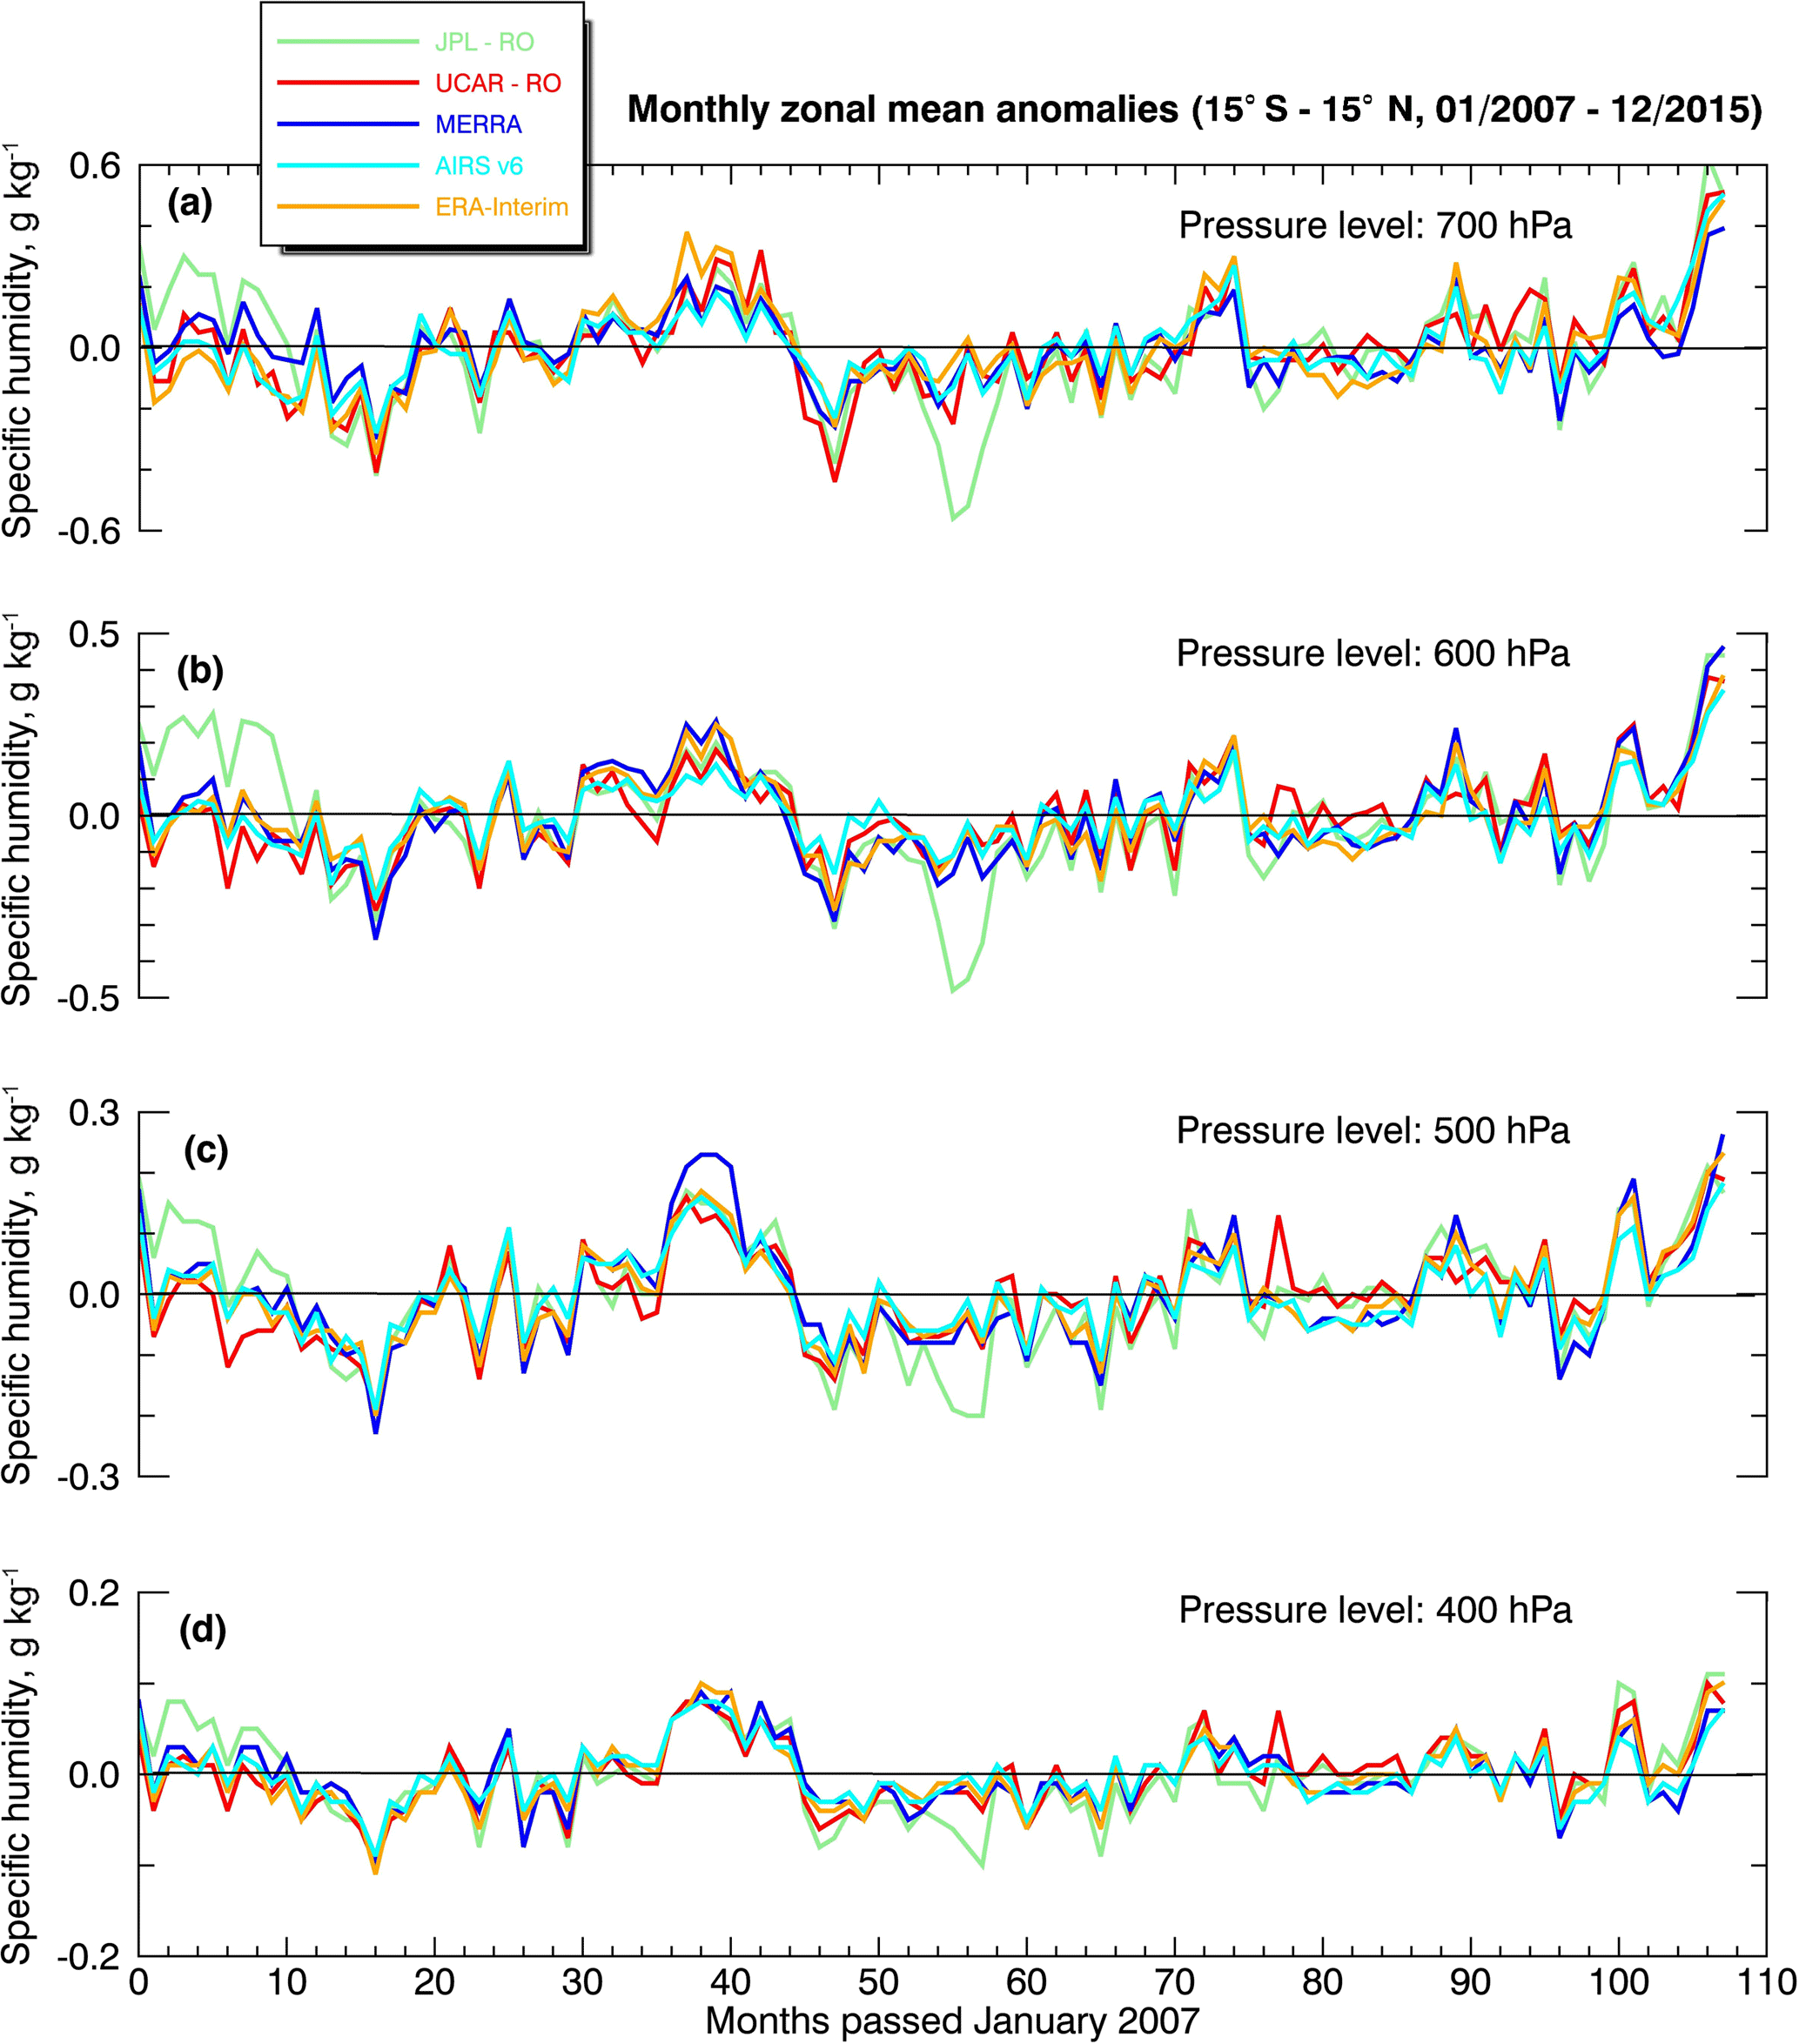
Figure 1 shows the monthly zonal mean SH as a function of time from January 2007 until December 2015 from 700 up to 400 hPa. Qualitatively, all data sets capture the same variability pattern, exhibiting clear signatures of an annual and interannual cycle at all pressure levels. Quantitatively, the magnitude of the SH varies among data sets with a minimum value of 5.0 g kg−1 (summer and winter) and a maximum value of 6.5 g kg−1 (spring and autumn) at 700 hPa. Its value decreases with altitude and at 400 hPa fluctuates between 0.7 g kg−1 (during summer and winter) and 1.0 g kg−1 (during spring and autumn). Table 1 shows that the 9-year mean differences among all climatologies are < 20 %, falling within the level of retrieval uncertainty of individual RO SH profiles.
Due to averaging over 9 years, random and systematic errors in the time series are significantly reduced, representing the degree of disagreement among climatologies. Despite these differences, Fig. 2 shows that all interannual anomaly climatologies not only capture the same variability patterns but they also have almost similar magnitudes. Their amplitude fluctuates around ±0.4 g kg−1 at 700 hPa and decreases with altitude to ±0.1 g kg−1 at 400 hPa. During the strong La Niña event in 2010–2011 all interannual anomaly climatologies captured an enhancement in SH with respect to the background, which is more pronounced at 500 and 400 hPa marking the highest values in the time series. An even stronger El Niño event occurred in 2015–2016 and the interannual anomalies in all climatologies also started showing a pronounced increase in SH. Interestingly, during the strong La Niña event in 2007–2008, only the JPL climatology displayed increased SH values compared to the rest of the rest climatologies. The interannual anomaly variations for all data sets in the middle troposphere correlate strongly (> 0.8) with those in the lower troposphere but have smaller amplitude.
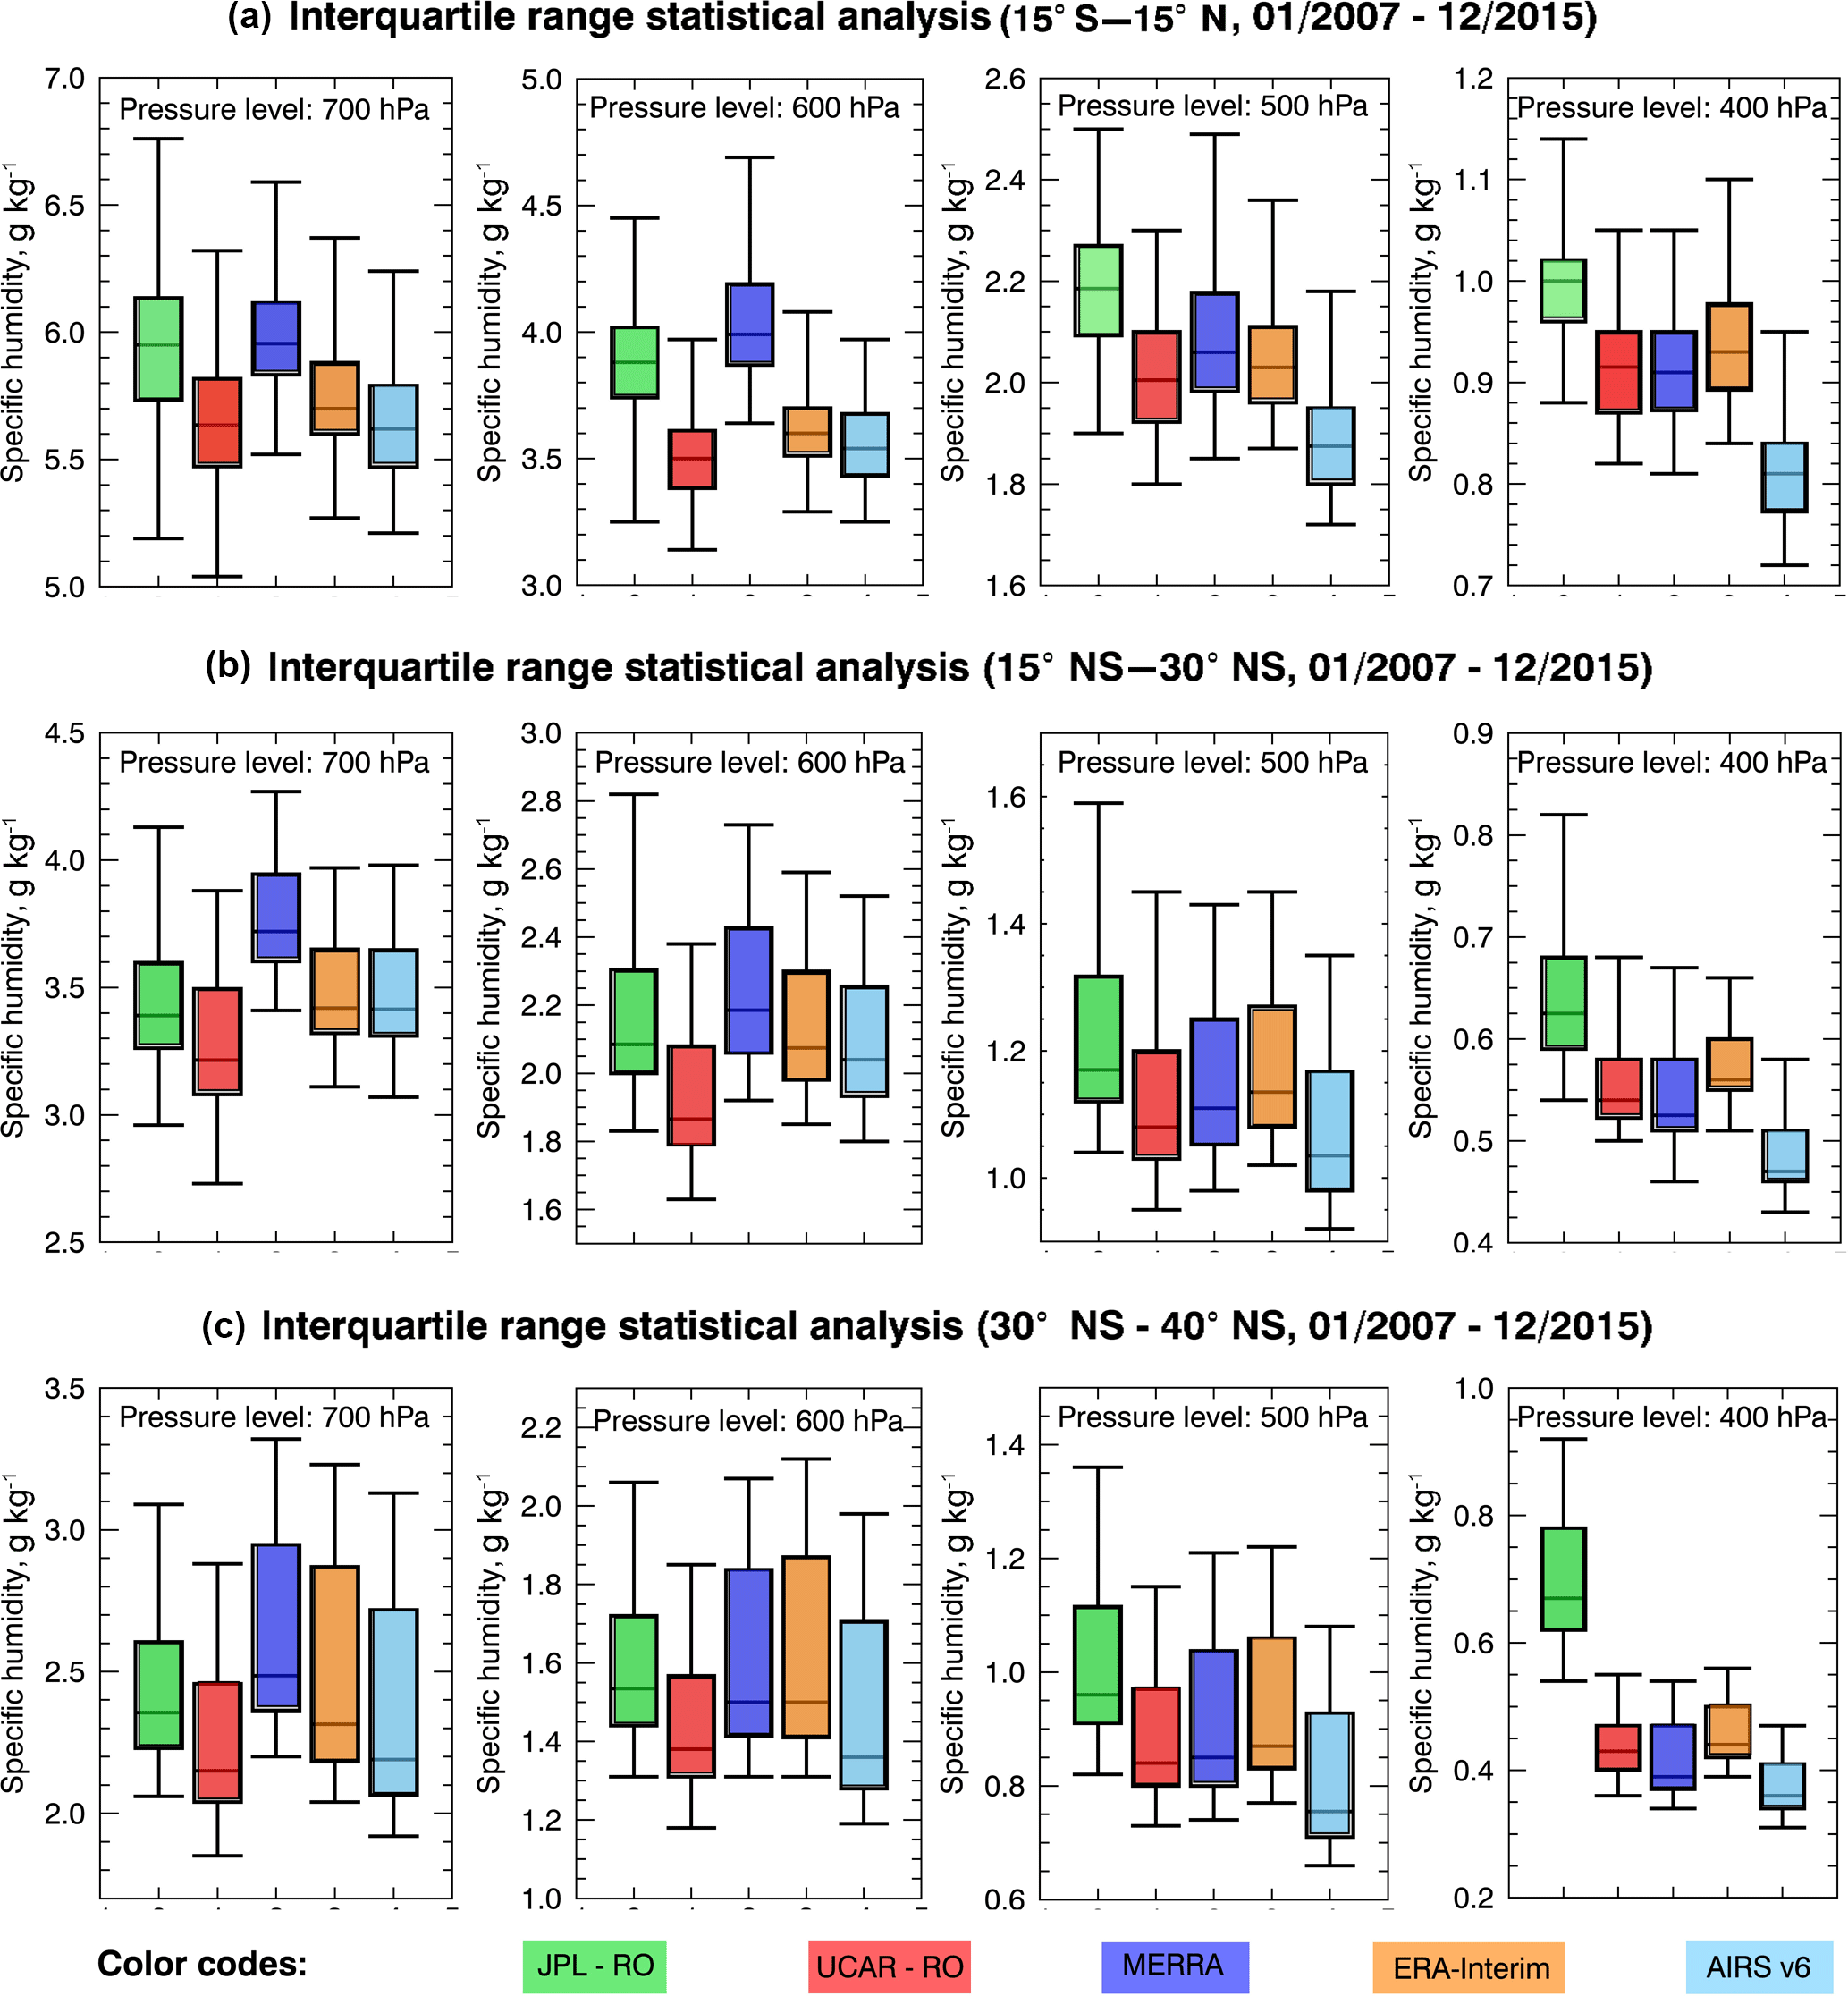
Figure 3Box plots of the monthly zonal mean specific humidity throughout the 2007–2015 time period for the 700, 600, 500, and 400 hPa over the ascending branch of Hadley cell (±15∘) (a), the trade winds belt (±15–30∘ NS) (b), and the descending branch of Hadley cell at the subtropics (±30–40∘) from JPL (green), UCAR (red), MERRA (blue), ERA-Interim (orange), and AIRS (cyan).
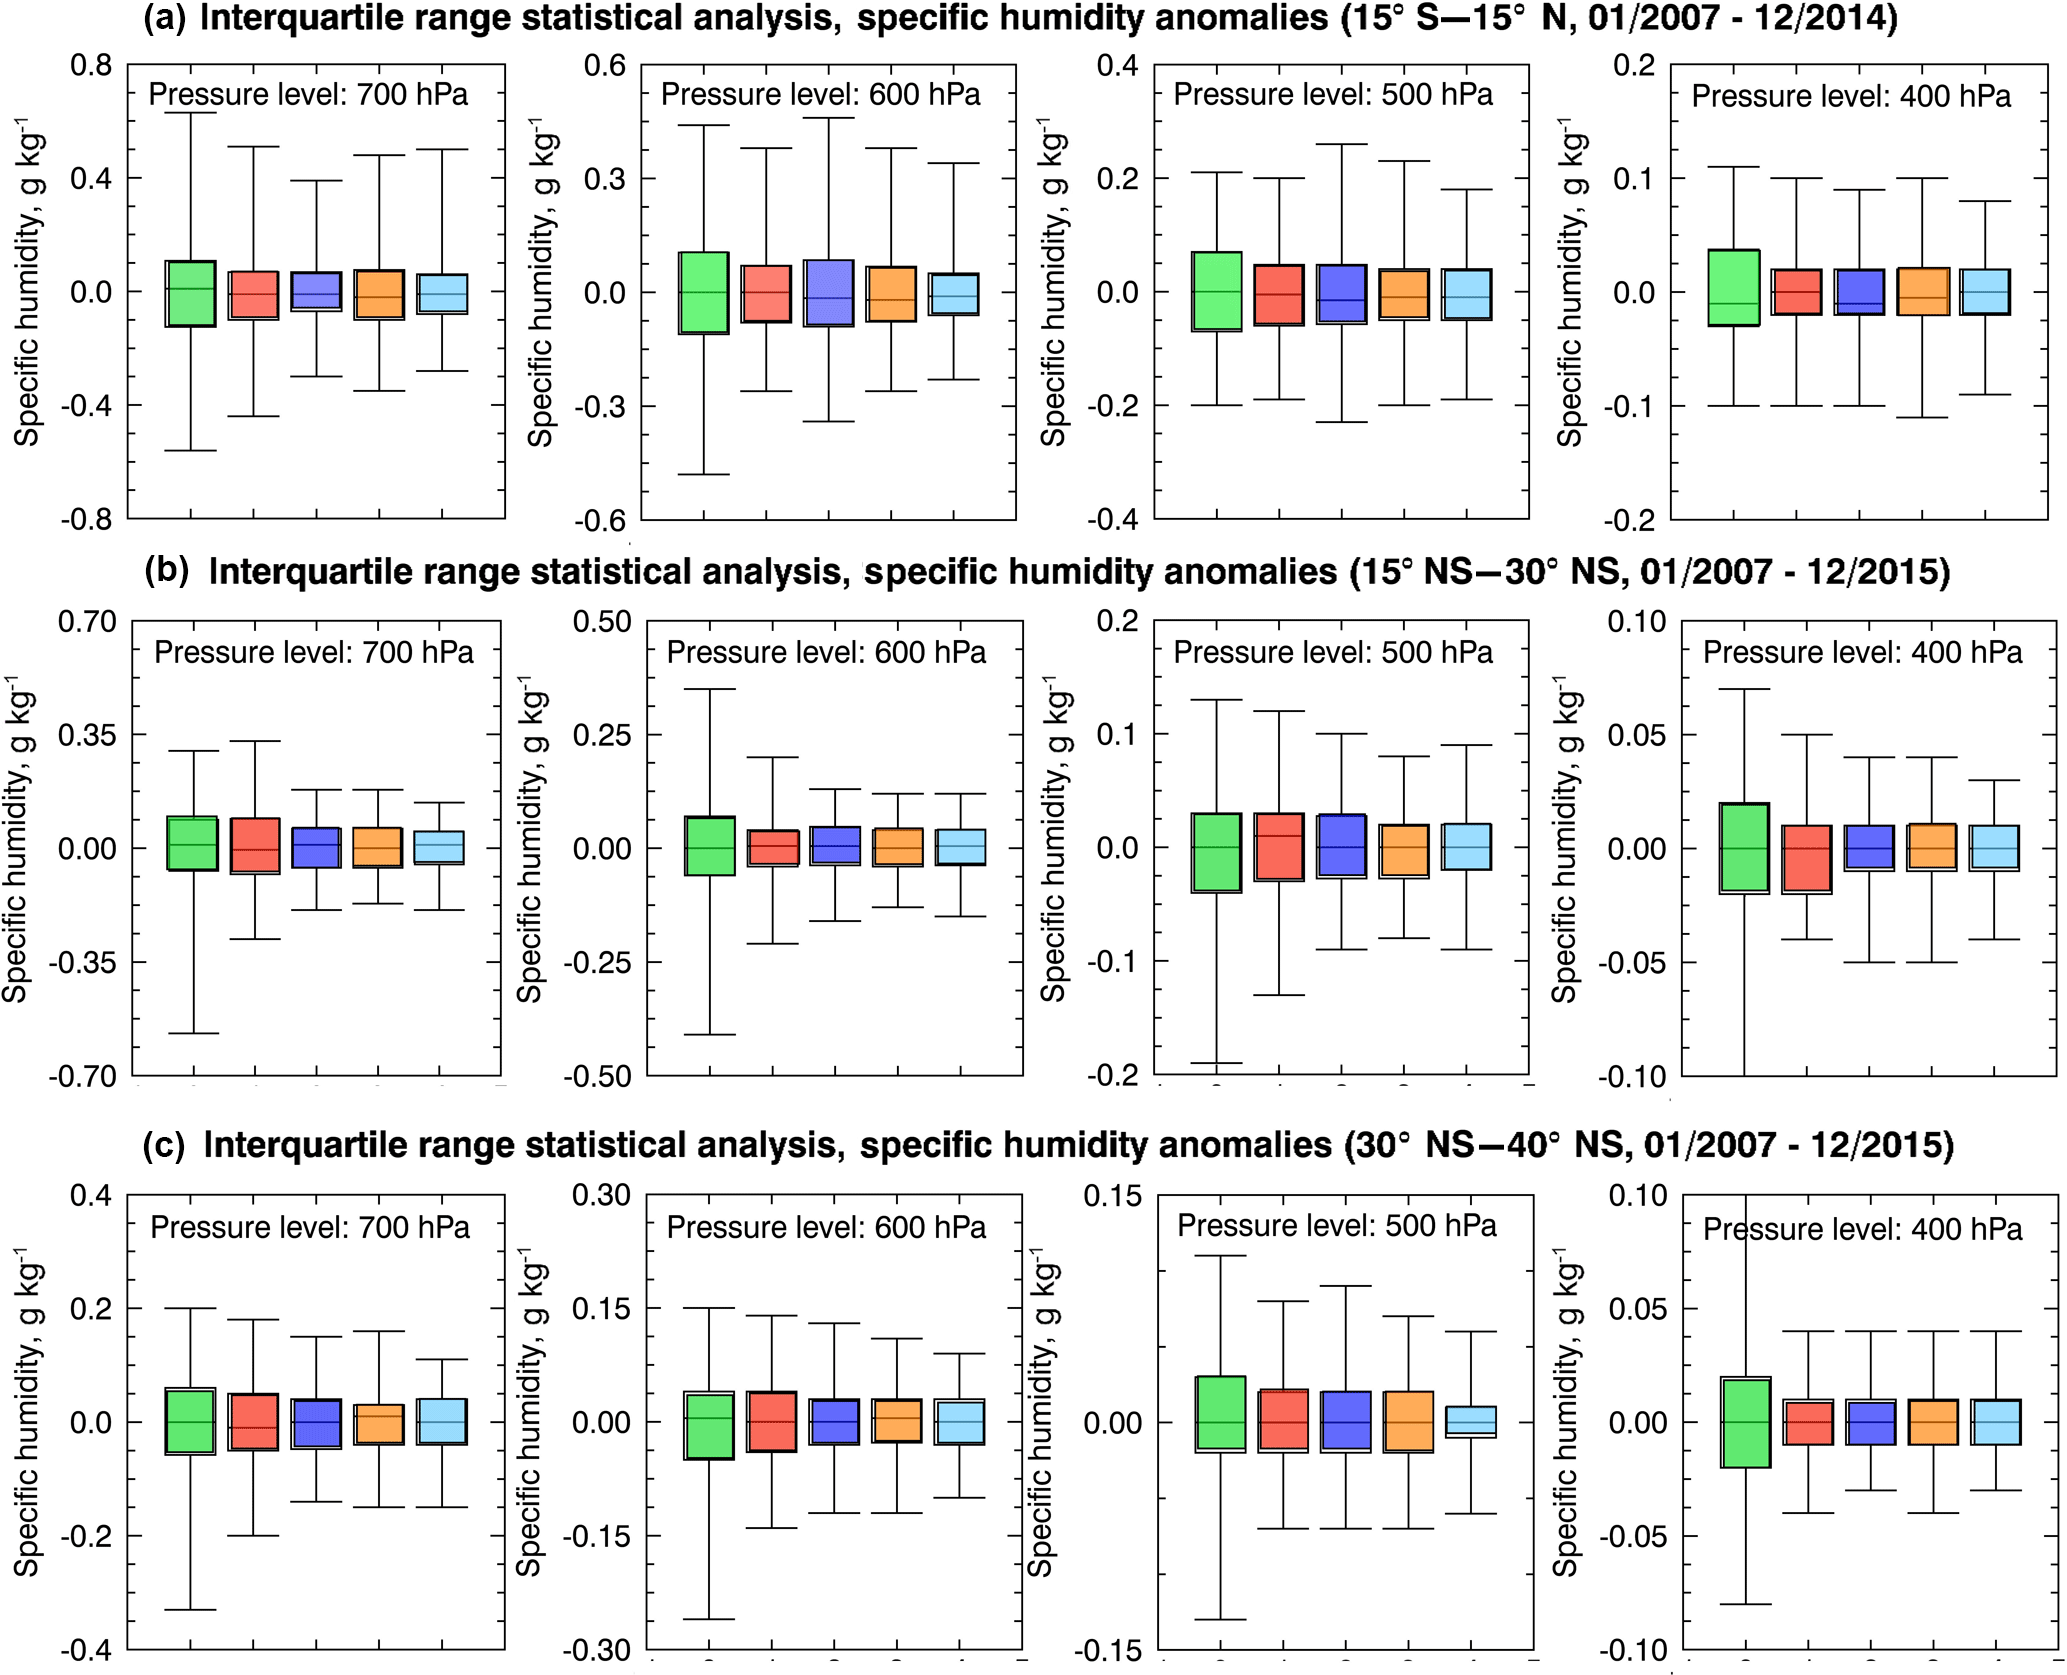
A linear regression fit and a Student t test on the SH interannual anomalies show that the JPL and MERRA series do not suggest an increase in SH with time between 700 and 400 hPa (see Table 1). However, the UCAR and ERA-Interim data sets show an increase of the tropospheric SH, with slower increase rate with increasing altitude. The difference between the two data sets is that UCAR RO suggests faster moistening of the troposphere than ERA-Interim. The AIRS data sets also show an increase of the SH at 700 and 600 hPa at a rate similar to that of ERA-Interim, but no SH increase at 500 hPa and above. We statistically analyze the 9-year time series of the absolute SH (see Fig. 1) and interannual anomaly climatologies (see Fig. 2) by estimating their respective interquartile ranges (IQRs) as shown in Figs. 3 and 4. In these box plots, the solid black line inside the boxes represents the median value of the 9-year climatologies. The length of the box represents the value range within which we find 50 % of the values around the median. The top and bottom whiskers define the largest and the lowest monthly zonal mean values of the time series.
Figure 3 shows that in the lower troposphere, above the planetary boundary layer, the JPL and MERRA products show almost the same median value of ∼ 6.0 g kg−1 (at 700 hPa) and ∼ 4.0 g kg−1 (at 600 hPa). Their difference is < 1.0 and < 4.0 % at 700 and 600 hPa, respectively (see Table 1), marking their excellent agreement. The UCAR, AIRS, and ERA-Interim data sets are in a very good agreement with one another differing by < 3.0 %, and they are drier than the JPL and MERRA products by ∼ 7.0–10 %. This dryness is more pronounced at 600 hPa. In the middle troposphere, at 500 and 400 hPa, the MERRA, ERA-Interim, and UCAR climatologies start agreeing very well with each other, capturing 2.0 g kg−1 at 500 hPa and 0.9 g kg−1 at 400 hPa. JPL appears to be the moistest of all data sets by < 10 %, whereas AIRS is the driest of all data sets by ∼ 15–25 % and its dryness is more apparent at 400 hPa.
Figure 4 summarizes the statistics of all SH interannual anomaly climatologies. Despite the differences in the absolute values, the interannual anomalies (a) have almost the same median value, (b) have similar IQRs, and (c) exhibit similar scattering around the median with almost the same maximum and minimum values. This behavior is seen at 700 up to 400 hPa, with the scattering around the median to be more consistent among the climatologies at higher altitudes. We should point out that the pronounced AIRS dry bias over the deep tropics Intertropical Convergence Zone (Hearty et al. 2014), due to sampling limitations over cloud-covered regions, can explain the observed systematic lower SH values with respect to all data sets from 700 up to 400 hPa. This suggests that IR observations over deep convective environments do not properly capture the amount of water vapor in the atmosphere.
3.2 Analysis of the specific humidity at the trade winds zones
The ±15–30∘ latitudinal belt, in both hemispheres, defines the trade winds zones, where dry air masses descending from the Hadley cell at the subtropics travel towards the Equator. These regions exhibit shallower convection compared to the deep tropics, as clouds forming in these regions are typically cumulus and do not extend above 4.0 km.
Figures S1 and S2 (see Supplement) show that the SH climatology and the respective interannual anomaly for all data sets capture distinct annual and interannual variability patterns at all pressure levels. The SH is lower in the trade winds zone than in the deep tropics ranging from 2.5–4.5 g kg−1 at 700 hPa to 0.45–0.75 g kg−1 at 400 hPa and the amplitude of the interannual anomalies is ∼ 50 % smaller in the 700–400 hPa pressure range. The interannual anomalies are also correlated between 700 and 400 hPa (> 0.6), but their degree of correlation is weaker than that over the deep tropics, and we do not observe enhanced values during the strong La Niña and El Niño events as we observe over the deep tropics. We suggest that this may be due to weaker convection over the trade winds zone compared to the deep tropics; thus, establishing a weaker vertical connection. In the trade winds zone, all data sets do not suggest a statistically significant increase in SH (see Table S1), but we ought to point out that the linear regression fit slopes are negative.
Table S1 shows that the mean differences of the SH over the 9-year period, between JPL and the rest of the data sets, is smaller at 700, 600, and 500 hPa than the differences in the deep tropics, except at 400 hPa, where it remains almost the same. These differences are smaller than 20 % and fall within the retrieval uncertainty of the data sets. It appears that over less convective regions the climatologies agree better with one another, suggesting that convection could may be a limiting factor in properly sensing the amount of water vapor in the atmosphere.
Figures 3b and S1 show that the SH climatologies in the trade winds zone have similar characteristics with the deep tropics at 500 and 400 hPa. The JPL data set appears to be again the wettest and the AIRS the driest compared to all climatologies, whereas UCAR, ERA-Interim, and MERRA show a very good agreement in between. The reason JPL appears to be the wettest at 500 hPa is because the summer season in all years is wetter by ∼ 4.0 % than the rest of the data sets, but this difference is within the systematic uncertainty of the retrievals. However, at 700 and 600 hPa, we notice a different behavior in terms of the data sets' agreement compared to our analysis in the deep tropics. Specifically, the JPL, ERA-Interim, and AIRS data sets agree very well with one another, with differences of ∼ 1.0 % (at 700 hPa) and ∼ 2.0–3.0 % (at 600 hPa); however, these differences are statistically insignificant. UCAR is the driest of all data sets by ∼ 15 % (with respect to MERRA) and ∼ 5.0–10 % (with respect to JPL), and MERRA seems to overestimate the SH particularly at 700 hPa.
Figures 4b and S2 show that the SH interannual anomalies are in excellent agreement with one another, with almost the same median value, similar IQR, and exhibit similar scattering around the median. The exception is the JPL climatology, which shows larger scattering towards negative anomaly values. This could be due to outliers in the data, which push down the lowest negative value. This behavior is seen at 700 up to 400 hPa and, unlike the deep tropics, we do not observe enhanced SH anomaly values in the climatologies during the strong La Niña and El Niño events (Fig. S2).
3.3 Analysis of the specific humidity at the subtropics
The ±30–40∘ latitude belt, in both hemispheres, defines the subtropics where dry air descends from the Hadley cell. These moderate-to-strong subsidence regions exhibit low-cloud formation (especially during the summer months), while favoring formation of low-altitude marine boundary layer clouds.
Figures S3 and S4 (see Supplement) show that the SH climatology shows a distinct annual cycle signature at all pressure levels, with lower values ∼ 2.0–3.5 g kg−1 at 700 hPa to 0.3–0.6 g kg−1 at 400 hPa (except for the JPL climatology that appears wet biased) than the trade winds zones and the deep tropics. The amplitudes of the SH interannual anomalies are also smaller by ∼ 50 % (see Fig. S8) than those estimated over the trade winds zone and the deep tropics. The SH interannual anomalies show the same degree of correlation (∼ 0.65) with altitude as the one estimated in the trade winds zones, suggesting again that the strength of the convection defines the correlation strength of the SH anomalies throughout the vertical extent of the troposphere. Table S2 shows that ERA-Interim and UCAR (at all pressure levels) as well as AIRS (at 500 and 400 hPa) capture a moistening of the subtropics, except the AIRS at 700 and 600 hPa pressure levels, where the data set indicates a decrease in the SH over time. JPL does not show a decrease or increase of SH with time, and MERRA shows moistening of the middle troposphere. Compared to the deep tropics and the trade winds zones, Table S2 shows that the mean differences of the SH values between JPL and the rest of the data sets are smaller than in the deep tropics and similar to the trade winds zone, except at 400 hPa, where it remains almost the same. Again, this hints at the notion that different data sets agree better with one another over regions characterized by less convection.
Figures 3c and S3 show that the SH climatologies in the subtropics in the middle troposphere show the exact same behavior as in the deep tropics and the trade winds zone at all pressure levels. Specifically, JPL captures moister air than all other data sets and this wetness is more pronounced at 400 hPa. The AIRS is systematically the driest among all climatologies, and MERRA, ERA-Interim, and UCAR show an excellent agreement, being in between the JPL and the AIRS data sets. At 700 hPa, MERRA and UCAR are the wettest and driest climatologies, respectively, with JPL, ERA-Interim, and AIRS having a very good agreement lying in between. At 600 hPa, JPL agrees very well with both reanalyses, differing by < 2.0 %, and UCAR agrees very well with AIRS, being drier than by ∼ 7.0 %. All these differences are smaller than each data set's retrieval uncertainty except that of JPL at 400 hPa, which is > 30 %. Similar to the deep tropics and the trade winds zone, the SH interannual anomalies in the subtropics exhibit the same behaviors being in excellent agreement with one another, having almost the same median value, similar IQR, and similar scattering around the median (see Figs. 4c and S8).
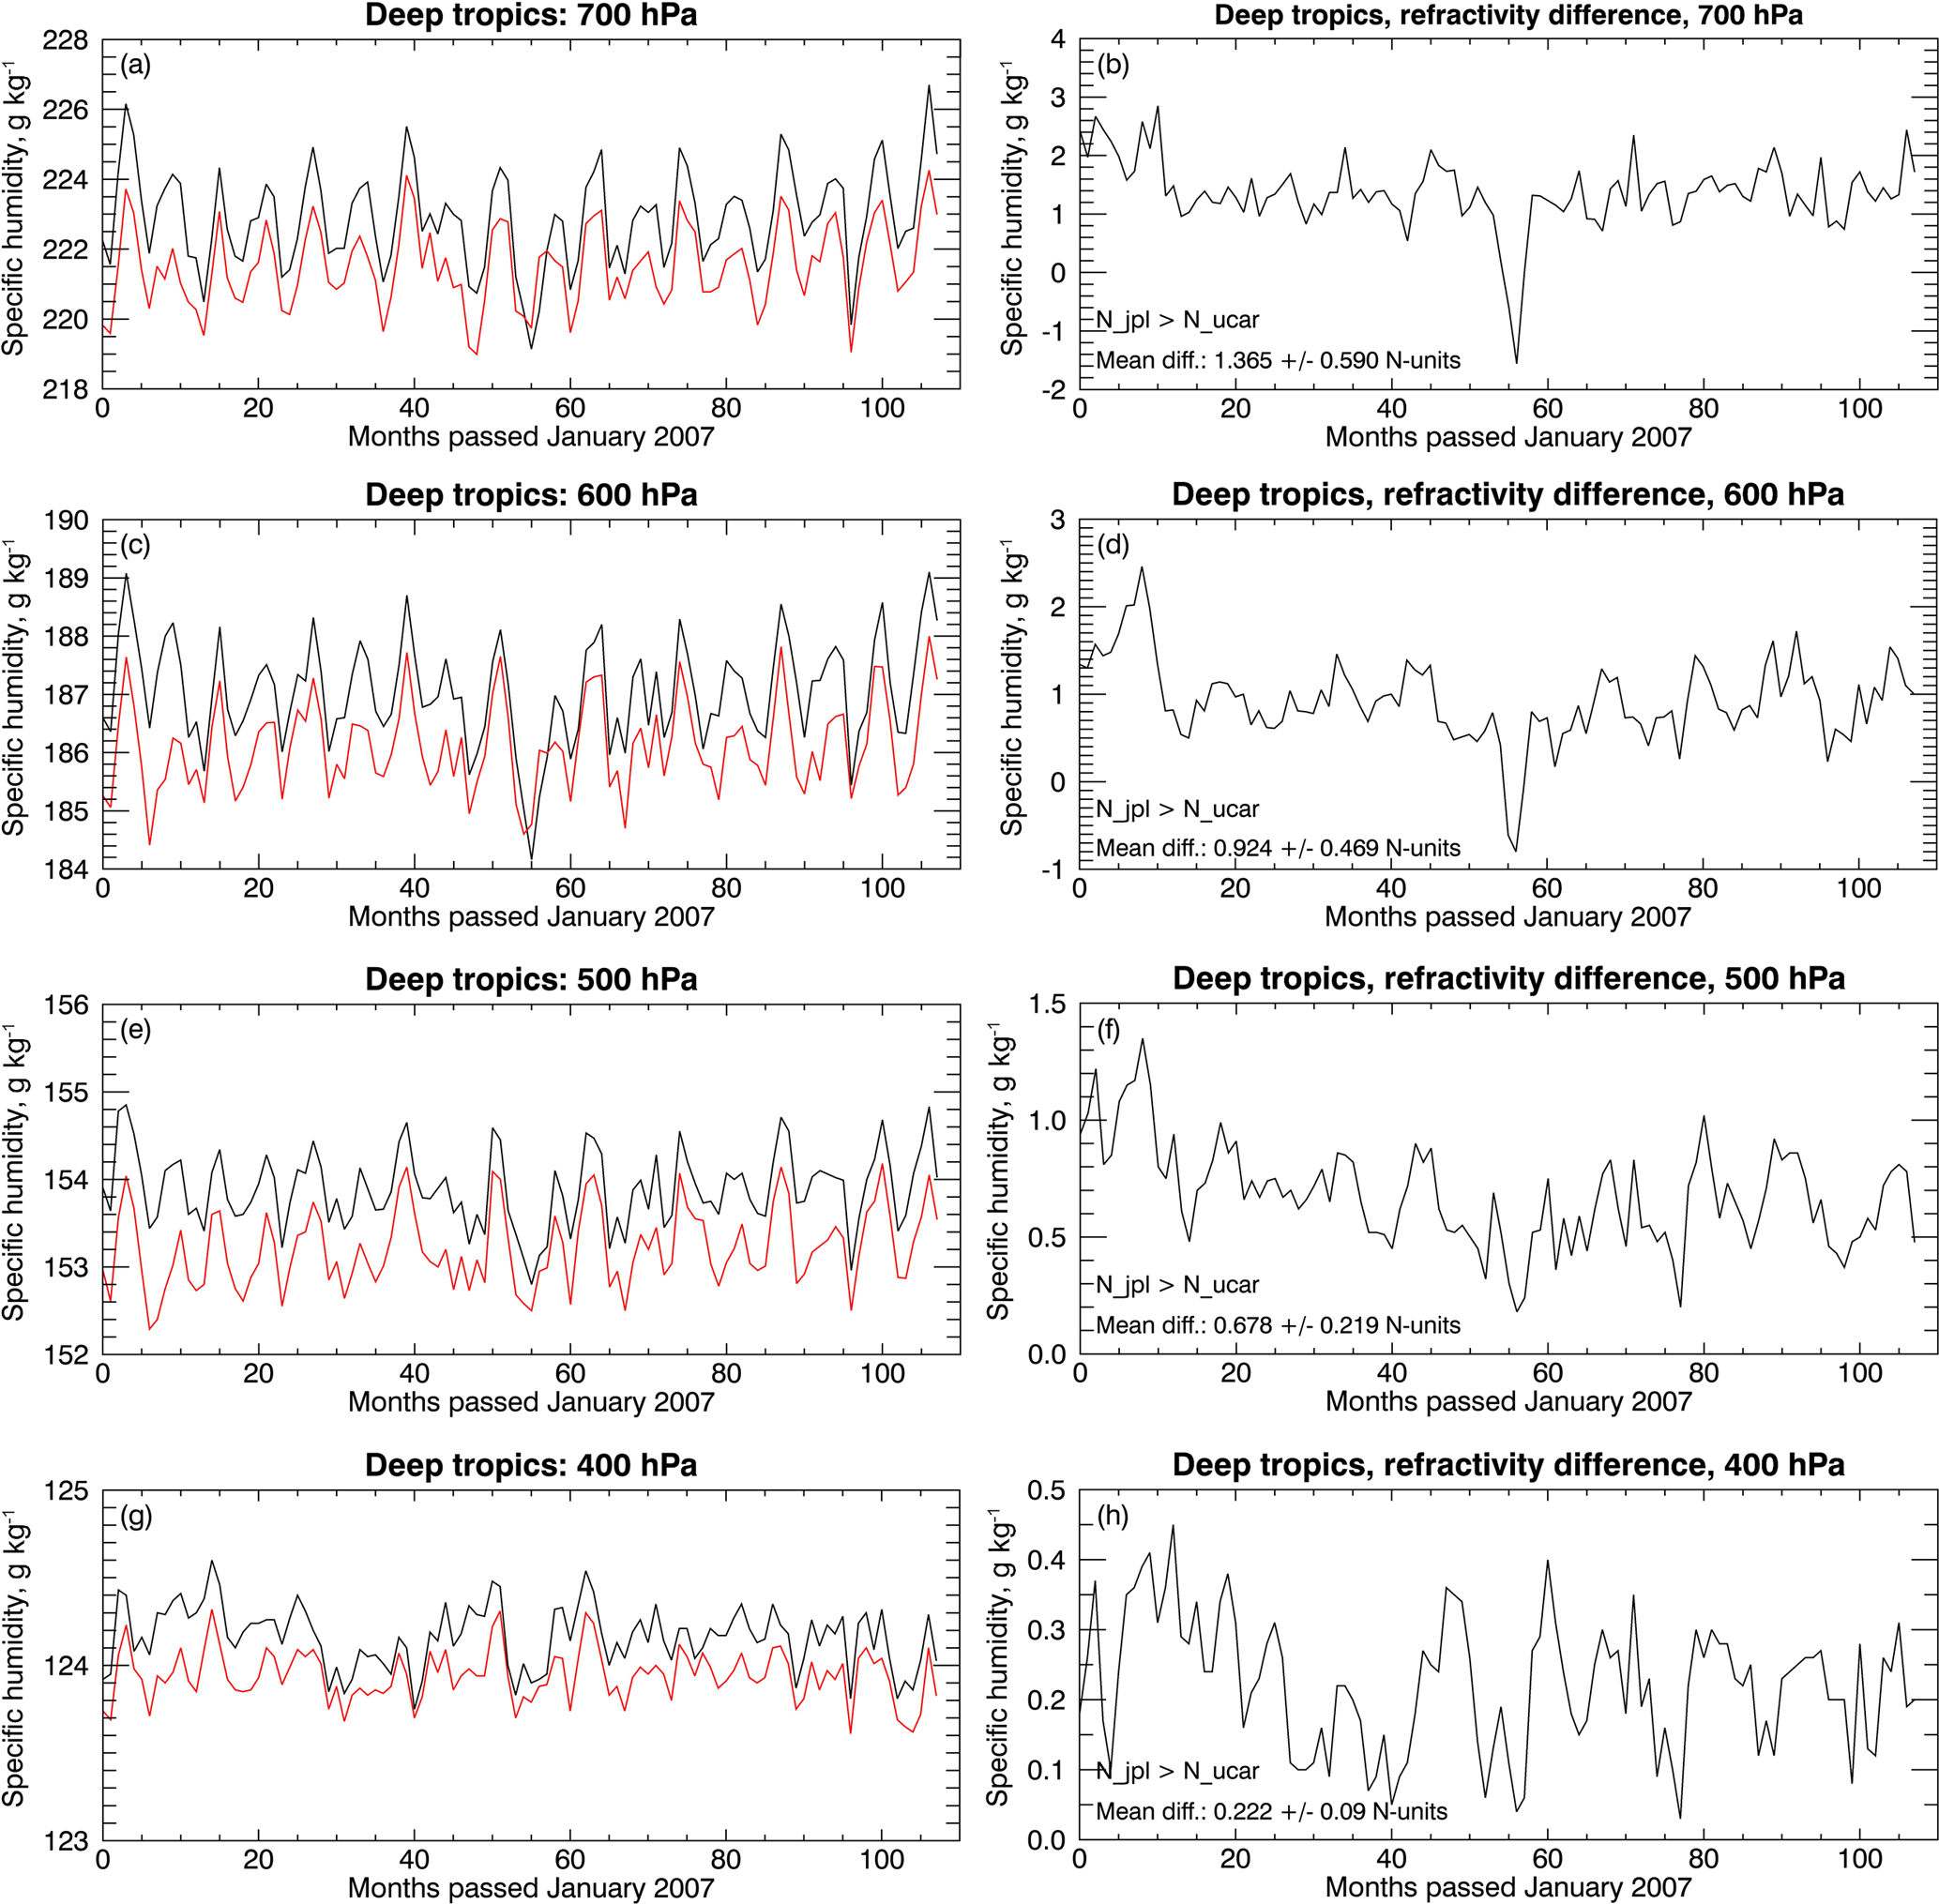
Figure 5Times series of the monthly zonal averages of the refractivity from 1 January 2007 until 31 December 2015 in the deep tropics (±15∘) from JPL (black) and UCAR (red) at (a) 700 hPa, (b) 600 hPa, (c) 500 hPa, and (d) 400 hPa pressure levels. The time series of the refractivity differences between JPL minus UCAR are shown at (e) 700 hPa, (f) 600 hPa, (g) 500 hPa, and (h) 400 hPa.
3.4 Differences between JPL and UCAR specific humidity retrievals
To begin establishing the RO-derived SH as a climate product, we must investigate the origin of the observed differences between the JPL and UCAR SH statistics. One of the possible reasons for the observed discrepancies in Fig. 1 could be the difference in the refractivity products generated by each center. Here, we investigate this possibility by analyzing the JPL and UCAR refractivity climatologies in the deep tropics.
Figure 5 shows that the monthly zonal averages of the JPL-derived refractivity are systematically larger than those estimated by UCAR and this is noticeable at all pressure levels. The JPL and UCAR climatologies are in excellent agreement, which becomes better with increasing altitude. Interestingly, we notice a sharp dip in the JPL refractivity in Fig. 5 during the summer of 2011 at 700 and 600 hPa, which explains the JPL SH interannual anomaly dip during the same period at 700 and 600 hPa in Fig. 2. Quantitatively, the 9-year mean differences are 1.365 ± 0.590 N units (or 0.6 % with respect to UCAR) at 700 hPa, 0.924 ± 0.469 N units (or 0.5 % with respect to UCAR) at 600 hPa, 0.678 ± 0.217 N units (or 0.4 % with respect to UCAR) at 500 hPa, and 0.222 ± 0.09 N units (or 0.2 % with respect to UCAR) at 400 hPa. From Eq. (1), we can derive an expression that relates refractivity changes into water vapor pressure changes, assuming a constant temperature:
where δN and δe represent the refractivity and water vapor pressure changes. We convert these water vapor changes into SH changes using Eq. (2). The mean refractivity differences from Fig. 5 correspond to SH differences of the order of (a) 0.26 ± 0.11 g kg−1 at 700 hPa, (b) 0.19 ± 0.10 g kg−1 at 600 hPa, (c) 0.16 ± 0.05 g kg−1 at 500 hPa, and (d) 0.06 ± 0.02 g kg−1 at 400 hPa. Comparing these values with the mean differences in Table 1, we argue that the majority of the SH differences between JPL and UCAR at all pressure levels results from the refractivity differences between the two centers.
Another factor that could cause the JPL and UCAR SH climatologies to deviate is the different retrieval approaches adopted by JPL and UCAR. JPL uses Eq. (1) to solve for the water vapor pressure by assuming a background temperature from the ECMWF TOGA operational analysis. Comparisons of ECMWF operational products with rawindsondes over the Pacific and Indian oceans reveal a systematic warm bias in the operational analysis of the order of 0.5 K with an RMSE of 1.0 K (Nuret and Chong, 1996; Nagarajan and Aiyyer, 2004). This bias leaks through the JPL retrievals, causing JPL to overestimate the SH (e.g., by ∼ 0.10 g kg−1 at 500 and 400 hPa). UCAR uses a variational assimilation approach that takes ERA-Interim temperature and humidity information as a priori. This could explain why UCAR climatologies appear to be consistent with ERA-Interim at all altitudes in the deep tropics and in the middle troposphere at the trade winds zone and the subtropics. Additionally, the different quality control used by the two centers leads to a different number of available occultations, which could also introduce a small bias in the SH comparisons. However, this effect would be small as we analyze monthly zonal averages.
Based on statistical tests using a 2σ uncertainty and 95 % confidence level criteria the RO observations agree very well with the MERRA, ERA-Interim, and AIRS climatologies by capturing similar magnitudes and patterns of variability in the monthly zonal mean specific humidity and interannual anomaly over annual and interannual timescales. The specific humidity differences between RO and all other climatologies fall within the expected specific humidity retrieval uncertainty. The JPL and UCAR specific humidity climatologies differ by less than 15 % in the median (depending on location and pressure level) and these differences are primarily due to the differences in the retrieved refractivity. Although we could explain these differences, we cannot speculate which center is closer to the truth; we demonstrate that both JPL and UCAR essentially provide similar specific humidity climatologies within the retrieval uncertainty. At 500 and 400 hPa, in all climate zones, JPL appears to be the wettest of all data sets; AIRS is the driest of all data sets, and UCAR, ERA-Interim, and MERRA are in very good agreement lying in between the JPL and AIRS climatologies. In the lower-to-middle troposphere, we present a complex behavior of discrepancies, as we speculate that this might be because the 700 and 600 hPa pressure levels are closest to the planetary boundary layer that interfaces with the free troposphere via convection and entrainment. This implies that the specific humidity measured by each data set could be susceptible to the degree to which each data set represents this vertical coupling. Weather models are known to be less accurate over convective regions, and recent studies indicate that RO observations could be positively biased by only 2 % over cloudy regions (Yang and Zou, 2017).
Given the above, the RO observations could augment the reanalyses and satellite observations by providing an additional complementary data set to study short-term SH variations, which are critical to the study of water vapor trends, and climate sensitivity, variability, and change. More detailed statistical analysis is required between the SH products between different RO processing centers to define its structural uncertainty. The reduced daily sampling of the COSMIC mission may be also a limiting factor in properly establishing differences between the RO and other platforms. We expect that the increased sampling rate of the COSMIC-2 follow-on mission will provide a much better picture of the tropical and subtropical climatology, which will help us extend the current short-term RO record.
The RO SH products are publicly available through JPL Global Environmental & Earth Science Information System (GENESIS) portal at https://genesis.jpl.nasa.gov/genesis/ and are accessible via the publicly available Atmospheric Grid Analysis and Extraction Profile (AGAPE) web interface at https://genesis.jpl.nasa.gov/agape/. The AIRS/AMSU v6 Level 3 SH products are described in detail in Tian et al. (2013), and for our analysis we use the AIRX3STM v006 data downloadable from multiple different online tools, including the Simple Subset Wizard (SSW) at https://disc.gsfc.nasa.gov/SSW/ and the Mirador search base at https://mirador.gsfc.nasa.gov. From the MERRA SH products we use are the MAIMNPANA v5.2.0 files, which we downloaded from the SSW. The ERA-Interim SH products are publicly available at http://apps.ecmwf.int/datasets/data/interim-full-moda/levtype=sfc/.
The supplement related to this article is available online at: https://doi.org/10.5194/amt-11-1193-2018-supplement.
The authors declare that they have no conflict of interest.
This article is part of the special issue “Observing Atmosphere and Climate with Occultation Techniques – Results from the OPAC-IROWG 2016 Workshop”. It is a result of the International Workshop on Occultations for Probing Atmosphere and Climate, Leibnitz, Austria, 8–14 September 2016.
This research was carried out at the Jet Propulsion Laboratory, California
Institute of Technology, under a contract with the National Aeronautics and
Space Administration Earth Science Mission Directorate (SMD). We thank
Robert Khachikyan for making publicly available the JPL RO retrievals through
the AGAPE interactive search tool. We would like to acknowledge the
University Corporation for Atmospheric Research (UCAR) COSMIC Data Analysis
and Archive Center (CDAAC) for making publicly available the COSMIC data
sets. We would like to thank NASA Earth Observing System Data and Information
System (EOSDIS) for making publicly available the MERRA and AIRS data sets.
Edited by: Jens Wickert
Reviewed by: Richard Anthes and one anonymous referee
Anthes, R. A., Bernhardt, P. A., Chen, Y., Cucurull, L., Dymond, K. F., Ector, D., Healy, S. B., Ho, S.-P., Hunt, D. C., Kuo, Y.-H., Liu, H., Manning, K., McCormick, C., Meehan, T. K., Randel, W. J., Rocken, C., Schreiner, W. S., Sokolovskiy, S. V., Syndergaard, S., Thompson, D. C., Trenberth, K. E., Wee, T.-K., Yen, N. L., and Zeng, Z.: The COSMIC/FORMOSAT-3 mission: Early results, B. Am. Meteorol. Soc., 89, 313–333, https://doi.org/10.1175/BAMS-89-3-313, 2008.
Ao, C. O., Meehan, T. K., Hajj, G. A., Mannucci, A. J., and Beyerle, G.: Lower troposphere refractivity bias in GPS occultation retrievals, J. Geophys. Res., 108, 4577, https://doi.org/10.1029/2002JD003216, 2003.
Ao, C. O., Waliser, D. E., Chan, S. K., Li, J.-L., Tian, B., Xie, F., and Mannucci, A. J.: Planetary boundary layer heights from GPS radio occultation refractivity and humidity profiles, J. Geophys. Res., 117, D16117, https://doi.org/10.1029/2012JD017598, 2012.
Blackwell, W. J., Pieper, M., and Jairam, L. G.: Neural network estimation of atmospheric profiles using AIRS/IASI/AMSU data in the presence of clouds, Proc. SPIE, 7149, 714905, https://doi.org/10.1117/12.804841, 2008.
Bosilovich, M. G., Robertson, F. R., Takacs, L., Molod, A., and Mocko, D.: Atmospheric Water Balance and Variability in the MERRA-2 Reanalysis, J. Climate, 30, 1177–1196, https://doi.org/10.1175/JCLI-D-16-0338.1, 2017.
Chen, J., Del Genio, A. D., Carlson, B. E., and Bosilovich, M. G.: The spatiotemporal structure of twentieth-century climate variations in observations and reanalyses. Part I: Long-term trend, J. Climate, 21, 2611-2633, https://doi.org/10.1175/2007JCLI2011.1, 2008.
Chou, M.-D., Weng, C.-H., and Lin, P.-H.: Analyses of FORMOSAT-3/COSMIC humidity retrievals and comparisons with AIRS retrievals and NCEP/NCAR reanalyses, J. Geophys. Res., 114, D00G03, https://doi.org/10.1029/2008JD010227, 2009.
Chuang, H., Huang, X., and Minschwaner, K.: Interannual variations of tropical upper tropospheric humidity and tropical rainy-region SST: Comparisons between models, reanalyses, and observations, J. Geophys. Res., 115, D21125, https://doi.org/10.1029/2010JD014205, 2010.
Collard, A. D. and Healy, S. B.: The combined impact of future space-based atmospheric sounding instruments on numerical weather prediction analysis fields: A simulation study, Q. J. Roy. Meteor. Soc., 129, 2741–2760, 2003.
Dee, D. P., Uppala, S. M., Simmons, A. J., Berrisford, P., Poli, P., Kobayashi, S., Andrae, U., Balmaseda, M. A., Balsamo, G., Bauer, P., Bechtold, P., Beljaars, A. C. M., van de Berg, L., Bidlot, J., Bormann, N., Delsol, C., Dragani, R., Fuentes, M., Geer, A. J., Haimberger, L., Healy, S. B., Hersbach, H., Hólm, E. V., Isaksen, L., Kållberg, P., Köhler, M., Matricardi, M., McNally, A. P., Monge-Sanz, B. M., Morcrette, J.-J., Park, B.-K., Peubey, C., de Rosnay, P., Tavolato, C., Thépaut, J.-N., and Vitart, F.: The ERA Interim reanalysis: configuration and performance of the data assimilation system, Q. J. Roy. Meteor. Soc., 137, 553–597, https://doi.org/10.1002/qj.828, 2011.
Fetzer, E. J., Lambrigtsen, B. H., Eldering, A., Aumann, H. H., and Chahine, M. T.: Biases in total precipitable water vapor climatologies from Atmospheric Infrared Sounder and Advanced Microwave Scanning Radiometer, J. Geophys. Res., 111, D09S16, https://doi.org/10.1029/2005JD006598, 2006.
Fetzer, E. J., Read, W. G., Waliser, D., Kahn, B. H., Tian, B., Vömel, H., Irion, F. W., Su, H., Eldering, A., de la Torre Juarez, M., Jiang, J., and Dang, V.: Comparison of upper tropospheric water vapor observations from the Microwave Limb Sounder and Atmospheric Infrared Sounder, J. Geophys. Res., 113, D22110, https://doi.org/10.1029/2008JD010000, 2008.
Flato, G., Marotzke, J., Abiodun, B., Braconnot, P., Chou, S. C., Collins, W., Cox, P., Driouech, F., Emori, S., Eyring, V., Forest, C., Gleckler, P., Guilyardi, E., Jakob, C., Kattsov, V., Reason, C., and Rummukainen, M.: Evaluation of Climate Models, in: Climate Change 2013: The Physical Science Basis. Contribution of Working Group I to the Fifth Assessment Report of the Intergovernmental Panel on Climate Change, edited by: Stocker, T. F., Qin, D., Plattner, G.-K., Tignor, M., Allen, S. K., Boschung, J., Nauels, A., Xia, Y., Bex, V., and Midgley, P. M., Cambridge University Press, Cambridge, UK and New York, NY, USA, 2013.
Frenkel, Y., Majda, A. J., and Khouider, B.: Using the Stochastic Multicloud Model to Improve Tropical Convective Parameterization: A Paradigm Example, J. Atmos. Sci., 69, 1080–1105, 2012.
Gelaro, R., McCarty, W., Suarez, M. J., Todling, R., Molod, A., Takacs, L., Randles, C. A., Darmenov, A., Bosilovich, M. G., Reichle, R., Wargan, K., Coy, L., Cullather, R., Draper, C.,. Akella, S, Buchard, V., Conaty, A., da Silva, A. M., Gu, W., Kim, G.-K., Koster, R., Lucchesi, R., Merkova, D., Nielsen, J. E., Partyka, G., Pawson, S., Putman, W., Rienecker, M., Schubert, S. D., Sienkiewicz, M., and Zhao, B.: The Modern-Era Retrospective Analysis for Research and Applications, version 2 (MERRA-2), J. Climate, 30, 5419–5454, https://doi.org/10.1175/JCLI-D-16-0758.1, 2017.
Hajj, G. A., Kursinski, E. R., Romans, L. J., Bertiger, W. I., and Leroy, S. S.: A technical description of atmospheric sounding by GPS occultation, J. Atmos. Sol.-Terr. Phy., 64, 451–469, https://doi.org/10.1016/S1364-6826(01)00114-6, 2002.
Hannay, C., Williamson, D. L., Hack, J. J., Kiehl, J. T., Olson, J. G., Klein, S. A., Bretherton, C. S., and Köhler, M.: Evaluation of forecasted southeast Pacific stratocumulus in the NCAR, GFDL, and ECMWF models, J. Climate, 22, 2871–2889, https://doi.org/10.1175/2008JCLI2479.1, 2009.
Hearty, T. J., Savtchenko, A., Tian, B., Fetzer, E., Yung, Y. L., Theobald, M., Vollmer, B., Fishbein, E., and Won, Y.-I.: Estimating sampling biases and measurement uncertainties of AIRS/AMSU-A temperature and water vapor observations using MERRA reanalysis, J. Geophys. Res.-Atmos., 119, 2725–2741, https://doi.org/10.1002/2013JD021205, 2014.
Hegerl, G. C., Black, E., Allan, R. P., Ingram, W. J., Polson, D., Trenberth, K. E., Chadwick, R. S., Arkin, P. A., Sarojini, B. B., Becker, A., Dai, A., Durack, P. J., Easterling, D., Fowler, H. J., Kendon, E. J., Huffman, G. J., Liu, C., Marsh, R., New, M., Osborn, T. J., Skliris, N., Stott, P. A., Vidale, P.-L., Wijffels, S. E., Wilcox, L. J., Willett, K. M., and Zhang, X.: Challenges in quantifying changes in the global water cycle, B. Am. Meteorol. Soc., 96, 1097–1115, 2015.
Ho, S.-P., Kuo, Y.-H., and Sokolovskiy, S.: Improvement of the temperature and moisture retrievals in the lower troposphere using AIRS and GPS radio occultation measurements, J. Atmos. Ocean. Tech., 24, 1726–1737, https://doi.org/10.1175/JTECH2071.1, 2007.
Ho, S.-P., Zhou, X., Kuo, Y.-H., Hunt, D., and Wang, J.-H.: Global Evaluation of Radiosonde Water Vapor Systematic Biases using GPS Radio Occultation from COSMIC and ECMWF Analysis, Remote Sens., 2, 1320-1330, https://doi.org/10.3390/rs2051320, 2010.
Holloway, C. E. and Neelin, J. D.: Moisture vertical structure, column water vapor, and tropical deep convection, J. Atmos. Sci., 66, 1665–1683, doi10.1175/2008JAS2806.1, 2009.
Jiang, J. H., Su, H., Zhai, C., Perun, V. S., Del Genio, A., Nazarenko, L. S., Donner, L. J., Horowitz, L., Seman, C., Cole, J., Gettelman, A., Ringer, M. A., Rotstayn, L., Jeffrey, S., Wu, T., Brient, F., Dufresne, J.-L., Kawai, H., Koshiro, T., Watanabe, M., L'Écuyer, T. S., Volodin, E. M., Iversen, T., Drange, H., Mesquita, M. D. S., Read, W. G., Waters, J. W., Tian, B., Teixeira, J., and Stephens, G. L.: Evaluation of Cloud and Water Vapor Simulations in IPCC AR5 Climate Models Using NASA “A-Train” Satellite Observations, J. Geophys. Res., 117, D14105, https://doi.org/10.1029/2011JD017237, 2012.
Kahn, B. H., Irion, F. W., Dang, V. T., Manning, E. M., Nasiri, S. L., Naud, C. M., Blaisdell, J. M., Schreier, M. M., Yue, Q., Bowman, K. W., Fetzer, E. J., Hulley, G. C., Liou, K. N., Lubin, D., Ou, S. C., Susskind, J., Takano, Y., Tian, B., and Worden, J. R.: The Atmospheric Infrared Sounder version 6 cloud products, Atmos. Chem. Phys., 14, 399–426, https://doi.org/10.5194/acp-14-399-2014, 2014.
Kishore, P., Venkat Ratnam, M., Namboothiri, S. P., Velicogna, I., Basha, G., Jiang, J. H., Igarashi, K., Rao, S. V. B., and Sivakumar, V.: Global (50S–50N) distribution of water vapor observed by COSMIC GPS RO: Comparison with GPS radiosonde, NCEP, ERA Interim, and JRA-25 reanalysis datasets, J. Atmos. Sol.-Terr. Phy., 73, 1849–1860, 2011.
Kuo, Y.-H., Schreiner, W. S., Wang, J., Rossiter, D. L., and Zhang, Y.: Comparison of GPS radio occultation soundings with radiosondes, Geophys. Res. Lett., 32, L05817, https://doi.org/10.1029/2004GL021443, 2005.
Kursinski, E. R. and Gebhardt, T.: A Method to Deconvolve Errors in GPS RO-Derived Water Vapor Histograms, J. Atmos. Ocean. Tech., 31, 2606–2628, https://doi.org/10.1175/JTECH-D-13-00233.1, 2014.
Kursinski, E. R. and Hajj, G. A.: A comparison of water vapor derived from GPS occultations and global weather analyses, J. Geophys. Res., 106, 1113–1138, https://doi.org/10.1029/2000JD900421, 2001.
Kursinski, E. R., Hajj, G. A., Hardy, K. R., Romans, L. J., and Schofield, J. T.: Observing tropospheric water vapor by radio occultation using the global positioning system, Geophys. Res. Lett., 22, 2365–2368, https://doi.org/10.1029/95GL02127, 1995.
Kursinski, E. R., Hajj, G. A., Schofield, J. T., Linfield, R. P., and Hardy, K. R.: Observing Earth's atmosphere with radio occultation measurements using the Global Positioning System, J. Geophys. Res., 102, 23429–23465, https://doi.org/10.1029/97JD01569, 1997.
Kursinski, E. R., Healy, S. B., and Romans, L. J.: Initial results of combining GPS occultations with ECMWF global analyses within a 1DVar framework, Earth Planets Space, 52, 885–892, 2000.
Nagarajan, B. and Aiyyer, A. R.: Performance of the ECMWF Operational Analyses over the Tropical Indian Ocean, Mon. Weather Rev., 132, 2275–2282, https://doi.org/10.1175/1520-0493(2004)132<2275:POTEOA>2.0.CO;2, 2004.
Nuret, M. and Chong, M.: Monitoring the performance of the ECMWF operational analysis using the enhanced TOGA COARE observational network, Weather Forecast., 11, 53–65, https://doi.org/10.1175/1520-0434(1996)011<0053:MTPOTE>2.0.CO;2, 1996.
Read, W. G., Lambert, A., Bacmeister, J., Cofield, R. E., Christensen, L. E., Cuddy, D. T., Daffer, W. H., Drouin, B. J., Fetzer, E., Froidevaux, L., Fuller, R., Herman, R., Jarnot, R. F., Jiang, J. H., Jiang, Y. B., Kelly, K., Knosp, B. W., Kovalenko, L. J., Livesey, N. J., Liu, H.-C., Manney, G. L., Pickett, H. M., Pumphrey, H. C., Rosenlof, K. H., Sabounchi, X., Santee, M. L., Schwartz, M. J., Snyder, W. V., Stek, P. C., Su, H., Takacs, L. L., Thurstans, R. P., Vomel, H., Wagner, P. A., Waters, J. W., Webster, C. R., Weinstock, E. M., and Wu, D. L.: Aura Microwave Limb Sounder upper tropospheric and lower stratospheric H2O and relative humidity with respect to ice validation, J. Geophys. Res., 112, D24S35, https://doi.org/10.1029/2007JD008752, 2007.
Rienecker, M. M., Suarez, M. J., Todling, R., Bacmeister, J., Takacs, L., Liu, H.-C., Gu, W., Sienkiewicz, M., Koster, R. D., Gelaro, R., Stajner, I., and Nielsen, J. E.: The GOES-5 Data Assimilation System – Documentation of versions 5.0.1, 5.1.0, and 5.2.0, NASA Tech. Rep., Series on Global Modeling and Data Assimilation, NASA/TM-2008-104606, National Aeronautics and Space Administration Goddard Space Flight Center Greenbelt, Maryland 20771, USA, 27, 92 pp., 2008.
Rienecker, M. M., Suarez, M. J., Gelaro, R., Todling, R., Bacmeister, J., Liu, E., Bosilovich, M. G., Schubert, S. D., Takacs, L., Kim, G.-K., Bloom, S., Chen, J., Collins, D., Conaty, A., da Silva, A., Gu, W., Joiner, J., Koster, R. D., Lucchesi, R., Molod, A., Owens, T., Pawson, S., Pegion, P., Redder, C. R., Reichle, R., Robertson, F. R., Ruddick, A. G., Sienkiewicz, M., and Woollen, J.: MERRA: NASA's Modern-Era Retrospective Analysis for Research and Applications, J. Climate, 24, 3624–3648, https://doi.org/10.1175/JCLI-D-11-00015.1, 2011.
Schmidt, T., Heise, S., Wickert, J., Beyerle, G., and Reigber, C.: GPS radio occultation with CHAMP and SAC-C: global monitoring of thermal tropopause parameters, Atmos. Chem. Phys., 5, 1473–1488, https://doi.org/10.5194/acp-5-1473-2005, 2005.
Schreier, M. M., Kahn, B. H., Sušelj, K., Karlsson, J., Ou, S. C., Yue, Q., and Nasiri, S. L.: Atmospheric parameters in a subtropical cloud regime transition derived by AIRS and MODIS: observed statistical variability compared to ERA-Interim, Atmos. Chem. Phys., 14, 3573–3587, https://doi.org/10.5194/acp-14-3573-2014, 2014.
Sherwood, S. C., Roca, R., Weckwerth, T. M., and Andronova, N. G.: Tropospheric water vapor, convection, and climate, Rev. Geophys., 48, RG2001, https://doi.org/10.1029/2009RG000301, 2010.
Simmons, A. J. and Hollingsworth, A.: Some aspects of the improvement in skill of numerical prediction, Q. J. Roy. Meteor. Soc., 128, 647–677, 2002.
Simmons, A. J., Hortal, M., Kelly, G., McNally, A., Untach, A., and Uppala, S.: ECMWF analyses and forecasts of stratospheric winter polar vortex breakup: September 2002 in the southern hemisphere and related events, J. Atmos. Sci., 62, 668–689, 2005.
Sokolovskiy, S., Rocken, C., Hunt, D., Schreiner, W., Johnson, J., Masters, D., and Esterhuizen, S.: GPS profiling of the lower troposphere from space: Inversion and demodulation of the open-loop radio occultation signals, Geophys. Res. Lett., 33, L14816, https://doi.org/10.1029/2006GL026112, 2006.
Takacs, L. L., Suarez, M., and Todling, R.: Maintaining atmospheric mass and water balance in reanalyses, Q. J. Roy. Meteor. Soc., 142, 1565–1573, https://doi.org/10.1002/qj.2763, 2016.
Tian, B., Fetzer, E. J., Kahn, B. H., Teixeira, J., Manning, E., and Hearty, T.: Evaluating CMIP5 Models using AIRS Tropospheric Air Temperature and Specific Humidity Climatology, J. Geophys. Res.-Atmos., 118, 114–134, https://doi.org/10.1029/2012JD018607, 2013.
Vergados, P., Mannucci, A. J., and Ao, C. O.: Assessing the performance of GPS radio occultation measurements in retrieving tropospheric humidity in cloudiness: A comparison study with radiosondes, ERA-Interim, and AIRS data sets, J. Geophys. Res.-Atmos., 119, 7718–7731, https://doi.org/10.1002/2013JD021398, 2014.
Wang, H. and Su, W.: Evaluating and understanding top of the atmosphere cloud radiative effects in Intergovernmental Panel on Climate Change (IPCC) Fifth Assessment Report (AR5) Coupled Model Intercomparison Project Phase 5 (CMIP5) models using satellite observations, J. Geophys. Res.-Atmos., 118, 683–699, https://doi.org/10.1029/2012JD018619, 2013.
Waters, J. W., Froidevaux, L., Harwood, R. S., et al.: The Earth Observing System Microwave Limb Sounder (EOS MLS) on the Aura Satellite, IEEE T. Geosci. Remote, 44, 1075–1092, 2006.
Wu, W.-S., Purser, R. J., and Parrish, D. F.: Three-dimensional variational analysis with spatially inhomogeneous covariances, Mon. Weather Rev., 130, 2905–2916, 2002.
Xie, F., Wu, D. L., Ao, C. O., Kursinski, E. R., Mannucci, A. J., and Syndergaard, S.: Super refraction effects on GPS radio occultation refractivity in marine boundary layers, Geophys. Res. Lett., 37, L11805, https://doi.org/10.1029/2010GL043299, 2010.
Yang, S. and Zou, X.: Dependence of positive refractivity bias of GPS RO cloudy profiles on cloud fraction along GPS RO limb tracks, GPS Solut., 21, 499–509, https://doi.org/10.1007/s10291-016-0541-1, 2017.