the Creative Commons Attribution 4.0 License.
the Creative Commons Attribution 4.0 License.
Laser pulse bidirectional reflectance from CALIPSO mission
Xiaomei Lu
Yuekui Yang
Mark Vaughan
Zhaoyan Liu
Sharon Rodier
William Hunt
Kathy Powell
Patricia Lucker
Charles Trepte
This paper presents an innovative retrieval method that translates the CALIOP land surface laser pulse returns into the surface bidirectional reflectance. To better analyze the surface returns, the CALIOP receiver impulse response and the downlinked samples' distribution at 30 m vertical resolution are discussed. The saturated laser pulse magnitudes from snow and ice surfaces are recovered based on information extracted from the tail end of the surface signal. The retrieved snow surface bidirectional reflectance is compared with reflectance from both CALIOP cloud-covered regions and MODIS BRDF–albedo model parameters. In addition to the surface bidirectional reflectance, the column top-of-atmosphere bidirectional reflectances are calculated from the CALIOP lidar background data and compared with the bidirectional reflectances derived from WFC radiance measurements. The retrieved CALIOP surface bidirectional reflectance and column top-of-atmosphere bidirectional reflectance results provide unique information to complement existing MODIS standard data products and are expected to have valuable applications for modelers.
- Article
(4101 KB) - Full-text XML
- BibTeX
- EndNote
The surface reflectivity over the snow- and ice-covered polar regions is a crucial factor in the Earth's radiation budget (Wiscombe and Warren, 1980). Although passive sensors such as the Moderate Resolution Imaging Spectroradiometer (MODIS) instruments, which are operating on both Terra and Aqua spacecraft (Savtchenko et al., 2003), are being used by scientists from a variety of disciplines, including oceanography (McClain, 2009; NASA Goddard Space Flight Center, 2014a, b), biology (NASA Goddard Space Flight Center, 2014c), and atmospheric science (Platnick et al., 2015), their reflectance observations are limited to daylight segments of each orbit and have large uncertainties due to the low solar angles in the polar regions (Behrenfeld et al., 2013; Lu et al., 2017). In this regard, active sensors can complement passive sensors and provide new measurement opportunities and insights (Yang et al., 2013).
The Cloud-Aerosol Lidar and Infrared Pathfinder Satellite Observations (CALIPSO) mission builds on the experience of the Lidar In-space Technology Experiment (LITE), which flew a three-wavelength lidar on the space shuttle in 1994 (Hunt et al., 2009; Winker et al., 1996). The CALIPSO instrument suite consists of the Cloud-Aerosol Lidar with Orthogonal Polarization (CALIOP), a two-wavelength (1064, 532 nm) polarization sensitive (532 nm only) elastic backscatter lidar, the Imaging Infrared Radiometer (IIR) with three channels in the thermal infrared, and the Wide Field-of-View Camera (WFC), with a single channel centered at 650 nm. Additional details can be found in the CALIPSO algorithm theoretical basis documents (ATBDs), which are available online at (https://www-calipso.larc.nasa.gov/resources/project_documentation.php). Since routine science operations began on 13 June 2006, data have been collected almost continuously. The CALIOP lidar provides vertical profiles of elastic backscattering from a near-nadir viewing angle during both day and night between 82∘ N and 82∘ S (Hunt et al., 2009; Winker et al., 2009). Though largely ignored prior to launch, the signals from CALIOP surface returns have since been mined for a wealth of unanticipated new discoveries (Behrenfeld et al., 2017; He et al., 2016; Lu et al., 2016; Venkata and Reagan, 2016). These valuable signals provide unique information to complement existing A-train Terra and Aqua MODIS passive remote sensing data products, including nighttime measurements, measurements underneath aerosols and non-opaque clouds, measurements in polar regions during all seasons and over sea ice, and direct measurements of depolarization ratio at 532 nm.
In this study, we focus on the retrieval of surface laser pulse bidirectional reflectance using the CALIOP 532 nm polarization channels and provide an initial assessment of the algorithm's performance. To better analyze the surface returns, the CALIOP receiver impulse response and the downlinked attenuated backscatter signal at 30 m vertical resolution are discussed in detail. The paper is organized as follows. The CALIPSO, MODIS, and Ice, Cloud and land Elevation Satellite (ICESat) data used in this study are briefly introduced in Sect. 2. In Sect. 3, the CALIOP surface bidirectional reflectance retrieval technique is described and its performance is evaluated relative to other satellite-derived data products. Section 4 presents the column bidirectional reflectance retrieval and highlights some initial results. Finally, the conclusions drawn from our analyses are given in Sect. 5.
In this section, we describe the data products that are used in this paper. These include the CALIOP version 4 data, CALIPSO WFC data, MODIS bidirectional reflectance distribution function (BRDF) and albedo products, and ICESat Geoscience Laser Altimetry System (GLAS) surface elevation data.
2.1 CALIPSO data
The CALIOP version 4.1 (V4.1) level 1 (L1) data product is used here to derive the surface integrated attenuated backscatter (IAB) from 30 m above to 300 m below the surface, which is a critically important parameter used in the surface bidirectional reflectance retrieval described in Section 3. Compared with version 3 (V3) data, the CALIOP V4.1 data product substantially improves both the 532 and 1064 nm calibration accuracies (Getzewich et al., 2018; Kar et al., 2018; Vaughan et al., 2018). Changes to the calibration techniques are firmly rooted in a thoroughly documented and peer-reviewed approach (Getzewich et al., 2016, 2018; Kar et al., 2018; Vaughan et al., 2018). More information about the data products, including data availability, user documentation, quality statements, sample read software, and tools for working with the data, etc. can be found at the Atmospheric Science Data Center (ASDC) web site (https://eosweb.larc.nasa.gov/project/calipso/calipso_table, last access: 1 June 2018).
To obtain the surface laser pulse reflectance under cloudless skies, the IAB above the surface is used to filter out signals with any significant atmospheric attenuation. The typical clear atmosphere is considered to be the case with IAB less than 0.0125 sr−1 (Venkata and Reagan, 2016). The CALIOP level 2 (L2) data products (Vaughan et al., 2017) provide estimates of cloud–aerosol optical properties, such as layer optical depths, layer base and top altitudes, and particulate backscatter and extinction profiles.
The WFC is a commercial off-the-shelf instrument based on the Ball Aerospace & Technologies Corporation CT-633 star tracker design. The IFOV of each pixel in the camera is approximately 125 m by 125 m when projected onto the Earth's surface from a nominal 705 km orbit. The image plane is oriented such that the active row of pixels is aligned in the cross-track direction providing a full swath FOV of approximately 61 km in the cross-track direction centered on the lidar boresight. The WFC is designed to have a large dynamic range that will allow it to observe bright clouds without saturation and still be able to detect small variations in surface albedo (Pitts et al., 2005). The bidirectional reflectance from CALIPSO WFC radiance measurements is archived in WFC L1 data. The CALIOP L1, L2 and WFC L1 data products can be freely downloaded through the ASDC at NASA Langley Research Center (https://eosweb.larc.nasa.gov/HORDERBIN/HTML_Start.cgi, last access: 1 June 2018). All CALIPSO data products are available beginning with data from 13 June 2006.
2.2 MODIS BRDF–albedo parameters
MODIS is an optical scanner that measures Earth radiance in 36 bands, ranging from 0.4 to 14 µm. The MODIS land surface reflectance is a seven-band product computed from the MODIS Level 1B land bands 1 (620–670 nm), 2 (841–876 nm), 3 (459–479 nm), 4 (545–565 nm), 5 (1230–1250 nm), 6 (1628–1652 nm), and 7 (2105–2155 nm). The product provides an estimate of the surface spectral reflectance for each band as it would have been measured at ground level if there were no atmospheric scattering or absorption. Corrections are applied to compensate for the effects of the atmospheric gases and aerosols (Vermote, 2015a, b). In order to resolve surface reflectance with near-nadir illumination and nadir-viewing angles, the MODIS MCD43C1 version 6 BRDF and albedo parameters are used. The BRDF describes how the reflectance depends on view and solar angles. Specification of the BRDF provides land surface reflectance explicitly in terms of its spectral, directional, spatial, and temporal characteristics (Lucht et al., 2000). The operational MODIS BRDF–albedo algorithm makes use of a kernel-driven, linear BRDF model, which relies on the weighted sum of an isotropic parameter and two functions (or kernels) of viewing and illumination geometry to determine reflectance as (Schaaf et al., 2002)
where θ, υ, φ, and λ are the solar zenith, view zenith, relative azimuth angles, and wavelength, respectively. are the model kernels and fk(λ) are the spectrally dependent BRDF kernel parameters.
The MODIS surface reflectance used in Section 3 is calculated by Eq. (1) with fk(λ) from MODIS MCD43C1 provided BRDF–albedo parameters at band 4, and the model kernels by Eqs. (38) and (39) of Lucht et al. (2000) with 3∘ solar zenith and view zenith angle and 0∘ relative azimuth angle. The MODIS MCD43C1 products are publicly available and can be downloaded from NASA's Land Processes Distributed Active Archive Center (LP DAAC).
2.3 ICESat/GLAS surface elevation
NASA's ICESat, which operated between 2003 and 2009, made the first satellite-based global nadir lidar measurements, highlighted by observations of Earth's ice sheet elevations, sea ice thickness, and vegetation canopy structure. The primary instrument on ICESat was the GLAS, which utilized 1064 nm laser pulses for measuring the heights of the surface and sampled the Earth's surface from an orbit of about 600 km with laser footprints of about 65 m in diameter spaced at 172 m along track. The primary objective of the GLAS laser altimeter was to measure elevation profiles of the Greenland and Antarctic ice sheet surfaces (Zwally et al., 2002). The GLAS/ICESat 500 m laser altimetry digital elevation model (DEM) product of Antarctica (DiMarzio, 2007) is used in this paper. This DEM is generated from the first seven operational periods (from February 2003 through June 2005) of the GLAS instrument. It is provided on polar stereographic grids at 500 m grid spacing. The grid covers all of Antarctica north of 86∘ S.
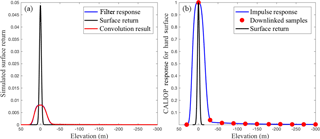
Figure 1(a) Simulated low-pass filter response (blue), surface return (black), and the convolution result of the surface return and low-pass filter (red); note that the blue curve is completely overwritten by the red curve. (b) CALIOP impulse response function for hard surface (blue), the downlinked 30 m vertical resolution samples (red circles) and the simulated peak-normalized surface return (black). Note that the downlinked samples in this example have no time delay, and the surface elevation is assumed to be at 0 m. The elevations below the surface are set to negative numbers.
In this section, we introduce the surface laser pulse bidirectional reflectance retrieval method. First, we introduce the CALIOP receiver impulse response, which is critically important for analyzing the surface signals. Then we describe our technique for recovering the saturated signal from snow and ice surfaces based on information gleaned from the subsurface “tail”. The accuracy of the CALIOP surface laser pulse bidirectional reflectance results are evaluated using internal consistency checks and comparisons to MODIS.
3.1 Method
The detectors for the respective linearly orthogonal polarized channels of the CALIOP 532 nm receiver are photomultiplier tubes (PMTs) that are coupled to third-order low-pass Bessel filters with a bandwidth ∼ 2.44 MHz (Venkata and Reagan, 2016). The outputs of the low-pass filters are sampled by 10 MHz analog-to-digital converters (ADCs), which yield an equivalent 15 m vertical resolution. To conserve downlink bandwidth, the data acquired between 0.5 km below and 8.2 km above mean sea level are subsequently averaged on board the satellite to 30 m vertical resolution. A feature of the low-pass Bessel filter is that for a short pulse return (as occurs from a hard-target reflection) the area under the pulse is preserved. Figure 1a illustrates a simulated example where the black curve is the hard surface return, the blue curve is the impulse response of the low-pass filter and the red curve is the convolution results between the black and blue curves. The surface elevation is assumed to be at 0 m.
It can be seen from Fig. 1a that if a narrow pulse (black) enters the low-pass filter, its peak amplitude is reduced but the pulse is stretched in time (or range r = ct∕2, where c is the light speed and t is the traveling time) so as to preserve the area under the original narrow pulse. The shape of the post-filter response is the CALIOP impulse response function, which is the convolution of the original narrow pulse and the impulse response of the low-pass filter. Because the width of the filter impulse response is much larger than the surface pulse, the shape of CALIOP impulse response function is dominated by the filter impulse response and is relatively less sensitive to the pulse width of the transmitted laser pulse (20 ns width). Note that the red curve of Fig. 1a completely overlaps (and thus totally obscures) the blue curve.
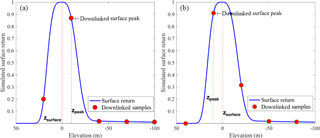
Figure 2The simulated surface return pulse after low-pass filter (blue curve) and CALIOP downlinked 30 m resolution samples (red circles). The surface elevation (zsurface) is assumed to be 0 m (red dashed line). The elevation below the surface is set to negative value. The black and green dash lines are altitudes where the downlinked surface sample reaches its peak value (zpeak).
Figure 1b shows the CALIOP impulse response model for the hard surface (blue curve, Hu et al., 2007) and simulated peak-normalized surface pulse (black). Since the original narrow surface pulse of Fig. 1a is stretched to the red line, the low-pass filter can distribute a narrow surface return (black line of Fig. 1b) to a sequence of downlinked 30 m resolution samples (red circles of Fig. 1b) over several adjacent range bins starting from the bin that contains the surface echo. Note that the downlinked samples in Fig. 1b have no time delay (Venkata and Reagan, 2016); that is, the samples digitized by the ADC are exactly coincident with the surface return pulse. However on board CALIOP, the start of the ADC sampling time varies, and thus no single sample is guaranteed to be exactly coincident with the Earth's surface, and the location of the measured peak signal may be offset from the true surface altitude by several meters.
Figure 2 shows examples of the downlinked samples measured at different ADC start times. The true surface altitude (zsurface) is assumed to be at 0 m (red dashed line). The black (Fig. 2a) and green (Fig. 2b) dashed lines show the elevations of the maximum value of the downlinked surface samples (zpeak). The elevation of downlinked surface peak of Fig. 2a is lower than the true surface elevation and simultaneously the magnitude of samples immediately before the peak is increased and the magnitude of samples immediately after the peak is reduced. When the elevation of downlinked surface peak is higher than the surface elevation, the corresponding changes for the downlinked samples immediately before and after the peak are reversed (Fig. 2b). Figure 2 indicates that the shape of the downlinked samples' distribution is determined by the distance between true surface elevation and the elevation of downlinked surface peak (zsurface–zpeak) (Lu et al., 2014).
The observations show that the CALIOP impulse response exhibits a non-ideal recovery of the lidar signal after a strong backscattering target. Examples of strong targets are dense liquid water clouds and surface returns (Hu et al., 2007; Lu et al., 2014). As a result, the surface total IAB (unit: sr−1) is calculated as integrating between 30 m above and 300 m below the surface peak; i.e.,
with the surface attenuated backscatter coefficients, β′(z), obtained directly from CALIOP V4 L1 data product. The surface peak is determined to be the maximum attenuated backscatter located within ±150 m of the surface DEM given by the “Surface_Elevation” parameter recorded in the CALIOP L1 data.
Because of the non-ideal recovery of transient impulse response, the downlinked samples of Fig. 1b wrongly appear as if the laser pulse is penetrating the surface to a depth of several hundreds of meters. Comprehensive analyses by the CALIPSO team have determined that more than 90 % of the surface return energy is contained in the first three downlinked samples, corresponding to the peak sample as well as one before and one after the peak sample as shown in Figs. 1b and 2. The remaining surface return energy is distributed into the signal “tail” that lies below the three peak samples (Hu et al., 2007). The tail signal is assumed to be extinguished at a distance of 300 m below the peak, so that the IAB (unit: sr−1) of the surface tail is calculated as
The observed CALIOP surface total integrated attenuated backscatter is the product of the actual surface bidirectional reflectance and atmospheric effective transmission (Josset et al., 2010): . The land surface bidirectional reflectance (ρ) can be obtained directly from the surface total integrated attenuated backscatter as
Here, T2 is the two-way atmospheric transmittance, which can be estimated from the CALIOP data (Hu et al., 2008; Young and Vaughan, 2009). For example, for the clear sky, the molecular Rayleigh two-way atmospheric transmittance can be estimated directly from the Rayleigh extinction cross section and molecular number density and the ozone absorption cross section and ozone number density. The number density profiles are obtained from the ancillary meteorological data provided by the NASA Global Modeling and Assimilation Office (GMAO) (https://gmao.gsfc.nasa.gov/operations/, last access: 1 June 2018) and reported for each lidar profile. For cloudy (or aerosol-laden) skies, the total column optical depth used to estimate the two-way atmospheric transmittance can be found from CALIOP L2 layer or profile products. The ocean surface reflectance from CALIOP lidar measurements can be found in detail from references (e.g., Venkata and Reagan, 2016). However, the signals from snow and ice surfaces under clear skies are so strong that they usually saturate the digitizers. For the saturated signal, we should recover the saturated signal first before calculating the surface bidirectional reflectance from Eq. (4).
3.2 Recovery of CALIOP saturated signal
Two 14-bit ADCs with different gains are used in each 532 nm channel to provide a 22-bit effective dynamic range (Hunt et al., 2009). On each channel, the high-gain ADC measures weak signals and the low-gain ADC acquires signals that saturate the high-gain digitizer. The profile samples are taken from the high-gain ADC if they are on scale. If a sample is saturated on the high-gain ADC, the corresponding sample from the low-gain ADC, rescaled by the gain ratio between the high-gain channel and the low-gain channel (high–low gain ratio), is used. The output of each pair of digitizers is re-scaled and merged into a single profile before being downlinked. The downlinked signal is saturated when the low-gain channel signal is saturated. The value that gets rescaled is the backscatter signal from the low-gain channel, which is the total signal minus a digitizer offset applied to eliminate underflows from negative noise excursions.
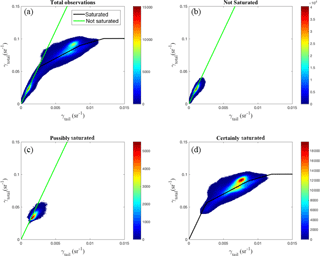
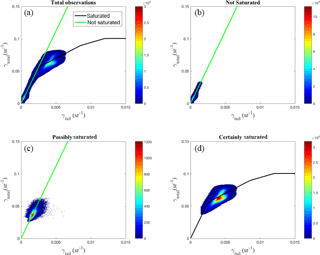
Figure 3Relation between total and tail integrated attenuated backscatter at CALIOP 532 nm parallel channel. (a) Total observations; (b) unsaturated observations; (c) possibly saturated observations; (d) certainly saturated observations. The color bar is the number of observations. The green and black lines are the simulated total-to-tail signal ratios for unsaturated and saturated surface returns from the CALIOP impulse response function shown in Fig. 1b.
The maximum digitizer reading is 16 383 (14 bits). Thus, the maximum backscatter value when the low-gain channel reaches saturation is 16 383 − offset. The corresponding saturation value is the maximum low-gain channel backscatter (16 383 − offset) multiplied by the high–low gain ratio. Moreover, because multiple samples are averaged before downlinking, it is possible that a downlinked sample value might be less than the saturation value, although one of the samples that went into the average was saturated. Note that the saturation threshold described here cannot be applied directly to the attenuated backscatter coefficients reported in the CALIOP L1 data product. To apply the saturation calculation to L1 data, some additional conversions (e.g., range scaling, energy normalization, calibration and amplifier gain normalization) are required.
For user convenience, a surface saturation flag used to indicate the likelihood that the surface backscatter signal is saturated has been added to the CALIOP V4.1 L1 data product. Surface saturation flag values of 0, 1, and 2 mean the surface backscatter signal is not saturated, possibly saturated, and certainly saturated, respectively. In order to see the saturated and unsaturated surface backscatter signal, Figs. 3 and 4 show the relation between total and tail surface IAB in the CALIOP 532 nm parallel and perpendicular channels, respectively. The colors represent the number of CALIOP lidar observations. Figure 3a shows all surface observations for the 532 nm parallel channel in 2009. Similarly, Fig. 3b shows only those surface observations that are not saturated, Fig. 3c shows the observations that are possibly saturated, and Fig. 3d shows only those parallel channel surface observations that are identified as “certainly saturated”.
The green and black lines are the simulated total-to-tail signal ratios for unsaturated and saturated surface backscatter signals from the CALIOP impulse response model shown in Fig. 1b, where the saturation value is set to be 1.4 km−1 sr−1 and the simulated downlinked samples have no time delay. The green and black lines overlap when the surface returns are small and not saturated. However, the black line departs significantly from the green line when the surface returns are saturated. Figure 4 is the same as Fig. 3 but for the CALIOP 532 nm perpendicular channel. Figures 3 and 4 show that there is a linear relation between total and tail surface IAB (green line) for unsaturated surface backscatter signals.
For the saturated signals, the total integrated attenuated backscatter ( can be estimated from the surface tail as
The value of c is the total-to-tail signal ratio, which can be empirically estimated from fitting the total and tail signals of unsaturated CALIOP observations shown in Figs. 3b and 4b and/or theoretically obtained from the CALIOP impulse response model shown in Fig. 1b. The value of c is about 19.6 ± 3.5 from fitting the unsaturated signals. Since the shape of the downlinked sample distribution is determined by the distance between true surface elevation and the elevation of downlinked surface peak (zsurface–zpeak), the value of total-to-tail signal ratio is also a function of the distance zsurface–zpeak as shown in Fig. 5, which is estimated from the impulse response model of Fig. 1b by setting different ADC sampling times corresponding to the distance zsurface–zpeak from about −15 to 15 m. The advantage of using the surface tail to estimate the total IAB (Eq. 5) is that it will not be subject to saturation.
3.3 Performance assessment
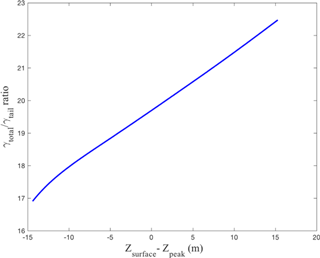
Figure 5The total-to-tail signal ratio as a function of the elevation difference between the true surface and the downlinked surface sample peak zsurface–zpeak.
The surface returns from snow and ice saturate the detectors under clear sky or optically thin cloud situations. Figure 6 shows the CALIOP data image of 532 nm total attenuated backscatter (km−1 sr−1) on 10 October 2009 over Antarctic snow surface. The color bar on the right indicates the magnitude of the total attenuated backscatter (km−1 sr−1) at 532 nm. The surface returns under clear sky within the red dashed lines are certainly saturated, while the surface return signals between the green dashed lines under transparent cloud are not. The surface signals lying underneath the transparent cloud layer between the rightmost red line and the leftmost green line are possibly saturated. The 532 nm non-ideal transient recovery is seen in Fig. 6 as a gradual transition of colors from high attenuated backscatter values (white) to lower ones for the snow surface under clear sky (between the red dashed lines). Figure 7 shows the CALIOP ground-track orbit as an intermittent black line, the interspersed with green line segments corresponding to the unsaturated region in Fig. 6, and red line segments corresponding to the saturated region. The background color is the surface elevation (units of meters) from GLAS/ICESat 500 m laser altimetry DEM product of Antarctica (DiMarzio, 2007).
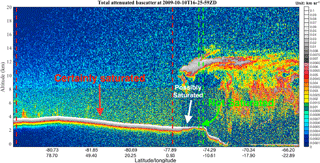
Figure 6Total attenuated backscatter at 532 nm (km−1 sr−1) on 10 October 2009; the surface return signals between the red dashed lines under clear sky are certainly saturated, while the signals between the green dashed lines under transparent cloud are not saturated. The surface signals between the red and green dashed lines under transparent cloud are possibly saturated. The color bar on the right indicates the value of total attenuated backscatter.
For the saturated region of Fig. 6, the total IAB () of the snow surface is calculated from the surface tail by Eq. (5), with the total-to-tail signal ratio obtained from the relationship plotted in Fig. 5. The required elevation difference (zsurface–zpeak) is found between the GLAS/ICESat Antarctica DEM and CALIOP downlinked surface peak. Note that both the GLAS/ICESat Antarctica DEM and CALIOP elevation refer to the EGM96 Geoid datum. Here the GLAS/ICESat Antarctica DEM is assumed to be the true surface elevation. The surface bidirectional reflectance (ρ) is then obtained from Eq. (4) with the clear sky two-way atmospheric transmittance derived from meteorological data reported in the CALIOP L1 data.
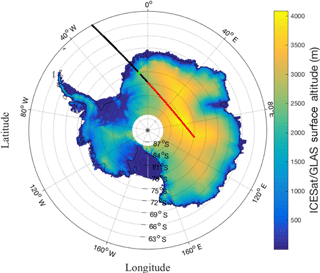
Figure 7CALIOP ground-track over Antarctic (black line). Intermittent green lines show the unsaturated region and red lines show the saturated region of Fig. 6; the background color is the snow surface elevation (units of meters) from GLAS/ICESat Antarctic 500 m DEM product.
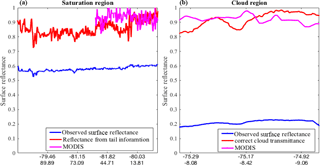
Figure 8(a) CALIOP observed surface bidirectional reflectance (blue) and corrected surface bidirectional reflectance (red) corresponding to the saturated region of Fig. 6. (b) CALIOP observed surface bidirectional reflectance under transparent cloud before (blue) and after (red) correcting for the two-way transmittance of overlying clouds, corresponding to the unsaturated region of Fig. 6. The magenta lines show MODIS surface reflectance at 555 nm.
The surface bidirectional reflectance estimated from the surface tail is shown by the red line in Fig. 8a. For comparison, the CALIOP observed surface bidirectional reflectance, with the total IAB ( calculated by Eq. (2) directly from saturated surface return, is shown in blue. For the unsaturated region of Fig. 6, the cloud optical depth (τc) and effective two-way transmittance (T2) come from the corresponding CALIOP L2 cloud layer data products. However, when the cloud effective two-way transmittance is not available from L2 data, it is estimated as (Yang et al., 2013). The mean relative difference of effective two-way transmittances between first and second scattering orders is less than 10 % when cloud optical depth is less than 1 (Yang et al., 2013).
The CALIOP observed surface reflectances before and after correcting for the cloud transmittance are shown in blue and red in Fig. 8b, respectively. The magenta lines in Fig. 8 show the corresponding MODIS surface reflectances at 555 nm on 10 October 2009. There are no MODIS results over the left part of Fig. 8a. Figure 8 indicates that the surface reflectances calculated directly from the saturated signals (blue in Fig. 8a) will be, as expected, lower than the true values. Moreover, when clouds are present, the surface reflectances calculated before correcting for the cloud two-way transmittance (0.18 ± 0.04) are much smaller than the reflectances calculated from the saturated signal under clear sky conditions (0.58 ± 0.02). The mean surface reflectance estimated from the surface tail over the saturated region is about 0.86 ± 0.06, while the mean surface reflectance by correcting the cloud transmittance from unsaturated region is about 0.89 ± 0.07. The MODIS surface reflectances are about 0.93 ± 0.04 and 0.92 ± 0.04 for the saturation and cloud regions, respectively. Note that almost all of the MODIS BRDF quality flags in Fig. 8 are larger than 0, where 0 means the best quality of the MODIS data. The mean surface reflectance estimated from the surface tail (red line of Fig. 8a) is consistent with the reflectance after correcting the cloud transmittance (red line of Fig. 8b) and MODIS reflectance (magenta lines in Fig. 8).
Figure 9 presents CALIOP surface reflectance comparisons over Antarctica for clear sky (solid curves) and cloudy sky (dashed curves) conditions for all of 2009. The solid black line shows the reflectance distribution estimated from the surface tail with the constant total-to-tail signal ratio of 19.6 used in Eq. (5), while the solid red line shows the reflectance directly obtained from the saturated signals by Eqs. (2) and (4). The dashed red and black are surface reflectances before and after correcting for the two-way transmittances of overlying clouds. The cloudy cases are chosen with an optical depth of about 1 to make sure that the surface return under the cloud is not saturated and still exhibits a reasonably robust signal-to-noise ratio. When clouds are present, the apparent mean surface reflectance before correcting for the cloud transmittance (red dashed curve) is about 0.26 ± 0.05. The apparent mean surface reflectance from saturated signals (solid red) is about 0.58 ± 0.05. The red dashed distribution is totally separated from the solid red distribution, which indicates that the apparent surface reflectance at 532 nm over polar snow/ice sheet regions could be used for cloud screening when cloud optical depth is greater than 1. The mean surface reflectance estimated from the surface tail (solid black) is about 0.90 ± 0.10, while the mean surface reflectance estimated by correcting for the cloud transmittance (dashed black) from the cloudy region is about 0.84 ± 0.13. The surface reflectance under cloudy conditions will be more accurate if the cloud effective two-way transmittance can be obtained more accurately. The magenta line in Fig. 9 shows the MODIS reflectance distribution at 555 nm with the mean of about 0.96 ± 0.04 over Antarctica in 2009.
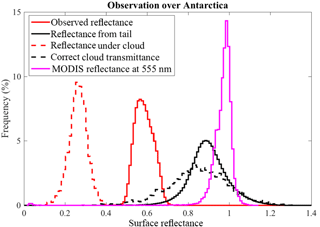
Figure 9The CALIOP surface bidirectional reflectance distribution at 532 nm over Antarctica for clear sky (solid curves) and cloudy sky conditions (dashed curves). The solid red is reflectance computed directly from the saturated signals. The solid black is reflectance estimated from surface tail with the constant total-to-tail signal ratio of 19.6. The dashed red and black lines are surface reflectances before and after correcting for cloud two-way transmittance. The magenta line shows the MODIS reflectance distribution at 555 nm.
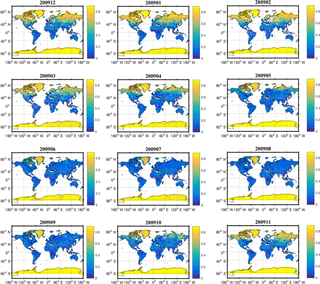
Figure 10The monthly CALIOP surface reflectance at 532 nm for clear sky conditions in 2009. The colors represent the value of surface reflectance.
The surface bidirectional reflectance results shown in Fig. 9 are from 1-year observations over Antarctica. Therefore, the surface reflectance might be variable due to snow aging, dust or soot content, melting and surface roughness, etc. As a consequence, the standard deviation of the surface reflectance reported here is larger than the simulated one of about 0.004 (Yang et al., 2013). For example, we assume here a 5 % uncertainty in and the two-way atmospheric transmittance, T2, and 10 % uncertainty in the total-to-tail signal ratio c. From Eqs. (5) and (4), the uncertainty of surface bidirectional reflectance can be estimated as . Summing up all the uncertainties yields the value of as 0.02, resulting in an uncertainty in surface bidirectional reflectance () of about 14 %. The standard deviation will be about 0.13, with the mean value of surface bidirectional reflectance of about 0.9. The retrieved CALIOP surface bidirectional reflectance from surface tail is consistent with reflectance for snow samples with melting and refreezing cycle (Wiscombe and Warren, 1980) and agrees with reflectance for snow samples in presence of volcanic sand and soot (Peltoniemi et al., 2015).
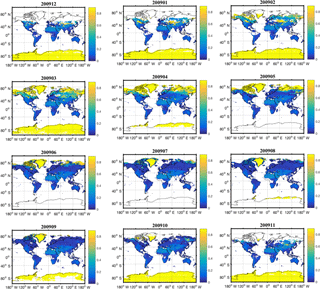
Figure 11The monthly MODIS surface reflectance at 555 nm in 2009. The colors represent the value of surface reflectance. There are no MODIS observations during polar night at high latitudes.
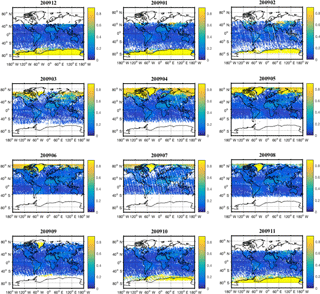
Figure 10 shows the monthly CALIOP surface reflectance at 532 nm for clear sky conditions in 2009, color-coded according to the retrieved surface reflectance. The surface reflectances for the saturated observations are obtained from the surface tails, with a constant total-to-tail signal ratio of 19.6, while the surface reflectance for unsaturated observations are estimated directly from Eqs. (2) and (4). The monthly surface reflectance shows that the reflectance values over permanent snow and ice surfaces (Greenland and Antarctica) are high during the whole year, and the reflectance results over snow-covered land surface in wintertime are higher than those in summertime when the snow is completely melted. There is significant seasonal reflectance transition from winter (December, January, and February), to spring (March, April, and May), to summer (June, July, and August), and then to fall (September, October, and November). The pattern of CALIOP surface reflectance at 532 nm is similar to that of MODIS surface reflectance at 555 nm, presented in Fig. 11, which is calculated from MODIS provided BRDF–albedo parameters with 3∘ off-nadir illumination angles. We note that there are no MODIS results at high latitude during polar night. This new surface reflectance data set from CALIOP, which makes reliable measurements both day and night and has an ability to characterize the surface even when obscured by transparent cloud and/or aerosol, complements existing MODIS passive remote sensing capabilities.
In addition to the surface bidirectional reflectance work, a further effort is underway to improve the accuracy of the column top-of-atmosphere bidirectional reflectances currently calculated using the CALIOP lidar background data, according to the equation
where μ0 is cosine of the solar zenith angle, and I is the upwelling radiance derived from the lidar background signals. The upwelling radiance is proportional to the lidar background, which is proportional to the square of the root mean square (RMS) noise. S0 is the extraterrestrial solar irradiance over the lidar bandpass. D is an adjustment for the correct Earth–Sun distance (Spencer, 1971). The upwelling background radiance, I, can be derived from either the background monitor anode current readings or the RMS baseline noise. The background monitor readings may be subject to uncertainty in offsets and also the possibility of saturation over bright targets. The square of the RMS baseline noise is highly correlated with the background monitor readings, but will not be subject to offset uncertainty. The RMS background noise is one of the downlinked status parameters and does not have to be computed from science data.
In terms of the RMS background noise, the parallel and perpendicular components of the upwelling background radiance can be expressed as , and , where RMS∥ and RMS⊥ are the parallel and perpendicular components of the baseline noise and C∥ and C⊥ are the parallel and perpendicular calibration coefficients that relate the RMS noise values to radiance units. In addition, the calibration coefficients are related through the lidar polarization gain ratio (PGR) as . The parallel and perpendicular components of the column reflectance can be expressed as
The total column reflectance is then the sum of parallel and perpendicular components.
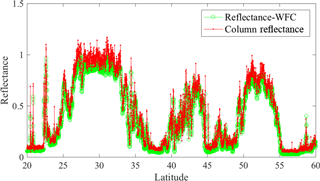
The CALIOP L1 data product provides the values of parallel and perpendicular column reflectance at single laser shot resolution. Figures 12, 13, and 14 show examples of column reflectance from L1 data on 4 September 2006. The blue line in Fig. 12 shows the CALIOP ground track and the red line shows the region from which the results shown in Figs. 13 and 14 are obtained. CALIOP 532 nm total attenuated backscatter (km−1 sr−1) is given in Fig. 13, which shows extensive, often opaque cloud layers and intermittent ocean surfaces. In Fig. 14 we show the column reflectances from both the CALIOP lidar (red) and the WFC (green) for the orbit segment shown by the red line of Fig. 12. The column reflectances computed from the lidar data are highly consistent with the values from the camera with correlation coefficient of about 0.98. The relative differences are within 20 %. The reasons for any discrepancies could come from calibration biases, surface FOV differences, and detector spectral response function differences. A global map of CALIOP column reflectance under clear sky conditions for each month in 2009 is shown in Fig. 15. The column reflectances are taken directly from CALIOP level 1 data and averaged over 1∘ by 2∘ latitude and longitude grid boxes. The column reflectances for Greenland and Antarctica are seen to be fairly consistent values in the range from 0.8 to about 1.1 with a mean value of 0.94 ± 0.10. The column reflectance over ocean surface varies between near 0 and about 0.2. For the land surfaces, the column reflectance can be from 0.05 to about 0.4, with somewhat higher values in desert regions. Note that the column reflectance is available only for CALIOP daytime measurements since it is retrieved from the solar background signals. The CALIOP column bidirectional reflectance records can be used to model the solar background radiance in the lidar simulator tool (Powell et al., 2017).
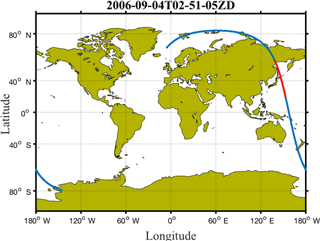
Figure 12CALIOP ground orbit track. The blue line is the orbit track of one granule around 02:51 on 4 September 2006. The red line is the study region shown in Figs. 13 and 14.
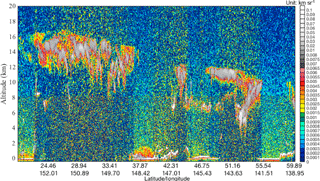
Figure 13Total attenuated backscatter (km−1 sr−1) along the red line orbit shown in Fig. 11. The color bar on the right indicates the value of total attenuated backscatter.
In this paper, we developed an innovative retrieval method that translates the CALIOP land surface laser pulse returns into surface bidirectional reflectances. The method takes advantage of the CALIOP impulse response, which distributes a narrow surface return into a sequence of downlinked 30 m resolution samples over several adjacent range bins. The CALIPSO team have determined that more than 90 % of the surface return energy is contained in the first three 30 m vertical range bins, starting from the bin that contains the surface echo, and the remaining surface return energy is distributed into the surface “tail” that lies below the first three range bins. This new method takes advantage of surface tail to recover the saturated pulse return from snow and ice surfaces. In the CALIOP V4.1 L1 data product, surface saturation flag values of 0, 1, and 2 mean the surface backscatter signal is not saturated, possibly saturated, and certainly saturated, respectively. For unsaturated surface backscatter signals, the total attenuated backscatter () was calculated by integrating the surface attenuated backscatter coefficients between 30 m above and 300 m below the surface. For the possibly and certainly saturated signals, the total attenuated backscatter () can be estimated from the surface tail with an empirically estimated total-to-tail signal ratio. The land surface bidirectional reflectance (ρ) can be obtained from the total attenuated backscatter () with the effective two-way atmospheric transmittance estimated from CALIOP data.
To validate the new method, the snow surface bidirectional reflectances obtained from the tail of the surface signals were compared with MODIS surface reflectances and surface reflectances calculated from CALIOP “unsaturated” surface returns when cloud is present. The comparisons show that the snow surface bidirectional reflectances over Antarctica for saturated signal regions are generally reliable, with a mean value of 0.90 ± 0.10, while the mean surface reflectance from cloud-covered regions is about 0.84 ± 0.13. The calculated MODIS reflectance at 555 nm from BRDF–albedo model with near-nadir illumination and viewing angles is about 0.96 ± 0.04. The comparisons here demonstrate that the apparent reflectance of snow surfaces beneath clouds with cloud optical depths of about 1 is significantly lower than that for clear sky conditions, thus supporting the use of apparent surface reflectance in cloud detection/screening in satellite data analysis.
The column top-of-atmosphere bidirectional reflectance from CALIOP V4.1 L1 data products is calculated from the square of the RMS baseline noise. The RMS baseline noise is highly correlated with the CALIOP background monitor readings and is not subject to offset uncertainty or saturation. The comparison analysis shows that the column reflectance values computed from the lidar data are consistent with the values from the CALIPSO wide field-of-view camera. For clear skies, the column bidirectional reflectance over Greenland and Antarctica is in the range from 0.8 to about 1.1, with a mean value of 0.94 ± 0.10. The column reflectance over ocean surfaces varies between near 0 and about 0.2 and the column reflectance over land can be from 0.05 to about 0.4 with somewhat higher values in desert regions. These CALIOP column bidirectional reflectance records can be used to suggest the values of the solar background radiance required in the lidar simulator tools.
The CALIOP makes reliable and independent measurements both day and night and at low solar angles through considerable aerosol loads and transparent clouds. The surface bidirectional reflectances retrieved from CALIOP measurements contribute complementary data for existing MODIS standard data products and could be used to detect and monitor seasonal surface reflectance changes in high-latitude regions where passive MODIS measurements are limited. The more than 10 years of CALIOP continuous observations of snow surface bidirectional reflectance and column top-of-atmosphere bidirectional reflectance in polar region will benefit the communities modeling snow melting and climate change. There is an ongoing study which uses the snow surface bidirectional reflectances at 532 and 1064 nm and depolarization ratio at 532 nm for snow grain size and snow depth studies.
CALIOP level 1 and level 2 data sets can be freely downloaded through the ASDC HTML order tool (https://eosweb.larc.nasa.gov/HORDERBIN/HTML_Start.cgi, last access: 1 June 2018) at NASA Langley Research Center. MODIS MCD43C1 products are publicly available and can be downloaded from NASA's LP DAAC (Schaaf and Wang, 2015). GLAS/ICESat 500 m laser altimetry DEM product of Antarctica version 1 is provided by the National Snow and Ice Data Center (NSIDC; DiMarzio, 2007).
Author Charles R. Trepte is a co-guest editor for the “CALIPSO version 4 algorithms and data products” special issue in Atmospheric Measurement Techniques but did not participate in any aspects of the editorial review of this paper. All other authors declare that they have no conflicts of interest.
This article is part of the special issue “CALIPSO version 4 algorithms and data products”. It is not associated with a conference.
We would like to thank two anonymous reviewers and editor for their substantial
comments and suggestions that led to the improvement of this paper.
Edited by: James Campbell
Reviewed by: two anonymous referees
Behrenfeld, M. J., Hu, Y., Hostetler, C. A., Dall'Olmo, G., Rodier, S. D., Hair, J. W., and Trepte, C. R.: Space-based lidar measurements of global ocean carbon stocks, Geophys. Res. Lett., 40, 4355–4360, https://doi.org/10.1002/grl.50816, 2013.
Behrenfeld, M. J., Hu, Y., O'Malley, R. T., Boss, E. S., Hostetler, C. A., Siegel, D. A., Sarmiento, J. L., Schulien, J., Hair, J. W., Lu, X., Rodier, S., and Scarino, A. J.: Annual boom-bust cycles of polar phytoplankton biomass revealed by space-based lidar, Nat. Geosci., 10, 118–122, https://doi.org/10.1038/ngeo2861, 2017.
DiMarzio, J. P.: GLAS/ICESat 500 m Laser Altimetry Digital Elevation Model of Antarctica, Version 1, Boulder, Colorado USA. NSIDC: National Snow and Ice Data Center, https://doi.org/10.5067/K2IMI0L24BRJ (last access: 24 October 2017), 2007.
Getzewich, B. J., Tackett, J. L., Kar, J., Garnier, A., Vaughan, M. A., and Hunt, B.: CALIOP Calibration: Version 4.0 Algorithm Updates, EPJ Web Conf., 119, 04013, https://doi.org/10.1051/epjconf/201611904013, 2016.
Getzewich, B. J., Vaughan, M. A., Hunt, W. H., Powell, K. A., Avery, M. A., Tackett, J. L., Kar, J., Lee, K.-P., and Toth, T.: CALIPSO Lidar Calibration at 532 nm: Version 4 Daytime Algorithm, in preparation, 2018.
He, M., Hu, Y., Huang, J. P., and Stamnes, K.: Aerosol optical depth under “clear” sky conditions derived from sea surface reflection of lidar signals, Opt. Express, 24, A1618–A1634, https://doi.org/10.1364/OE.24.0A1618, 2016.
Hu, Y., Powell, K., Vaughan, M., Tepte, C., Weimer, C., Beherenfeld, M., Young, S., Winker, D., Hostetler, C., Hunt, W., Kuehn, R., Flittner, d., Cisewski, M., Gibson, G., Lin, B., and MacDonnell, D.: Elevation information in tail (EIT) technique for lidar altimetry, Opt. Express, 15, 14504–14515, https://doi.org/10.1364/OE.15.014504, 2007.
Hu, Y., Stamnes, K., Vaughan, M., Pelon, J., Weimer, C., Wu, D., Cisewski, M., Sun, W., Yang, P., Lin, B., Omar, A., Flittner, D., Hostetler, C., Trepte, C., Winker, D., Gibson, G., and Santa-Maria, M.: Sea surface wind speed estimation from space-based lidar measurements, Atmos. Chem. Phys., 8, 3593–3601, https://doi.org/10.5194/acp-8-3593-2008, 2008.
Hunt, W. H., Winker, D. M., Vaughan, M. A., Powell, K. A., Lucker, P. L., and Weimer, C.: CALIPSO Lidar Description and Performance Assessment, J. Atmos. Ocean. Tech., 26, 1214–1228, https://doi.org/10.1175/2009JTECHA1223.1, 2009.
Josset, D., Pelon, J., Hu, Y., Zhai, P., Powell, K., Rodier, S., and Trepte, C.: CALIPSO Land Surface Mapping Principle and First Results, 25th International Laser Radar Conference (ILRC), 5–9 July 2010, St. Petersburg, Russia, Curran Associates, Inc., 1316–1319, 2010.
Kar, J., Vaughan, M. A., Lee, K.-P., Tackett, J. L., Avery, M. A., Garnier, A., Getzewich, B. J., Hunt, W. H., Josset, D., Liu, Z., Lucker, P. L., Magill, B., Omar, A. H., Pelon, J., Rogers, R. R., Toth, T. D., Trepte, C. R., Vernier, J.-P., Winker, D. M., and Young, S. A.: CALIPSO lidar calibration at 532 nm: version 4 nighttime algorithm, Atmos. Meas. Tech., 11, 1459–1479, https://doi.org/10.5194/amt-11-1459-2018, 2018.
Lu, X., Hu, Y., C., T., and Liu, Z.: A Super-Resolution Laser Altimetry Concept, IEEE Geosci. Remote, 11, 298–302, https://doi.org/10.1109/lgrs.2013.2256876, 2014.
Lu, X., Hu, Y., Pelon, J., Trepte, C., Liu, K., Rodier, S., Zeng, S., Lucker, P., Verhappen, R., Wilson, J., Audouy, C., Ferrier, C., Haouchine, S., Hunt, B., and Getzewich, B.: Retrieval of ocean subsurface particulate backscattering coefficient from space-borne CALIOP lidar measurements, Opt. Express, 24, 29001–29008, https://doi.org/10.1364/OE.24.029001, 2016.
Lu, X., Hu, Y., Liu, Z., Rodier, S., Vaughan, M., Lucker, P., Trepte, C., and Pelon, J.: Observations of Arctic snow and sea ice cover from CALIOP lidar measurements, Remote Sens. Environ., 194, 248–263, https://doi.org/10.1016/j.rse.2017.03.046, 2017.
Lucht, W., Schaaf, C. B., and Strahler, A. H.: An algorithm for the retrieval of albedo from space using semiempirical BRDF models, IEEE Trans. Geosci. Remote, 38, 977–998, https://doi.org/10.1109/36.841980, 2000.
McClain, C. R.: A Decade of Satellite Ocean Color Observations, Annu. Rev. Mar. Sci., 1, 19–42, https://doi.org/10.1146/annurev.marine.010908.163650, 2009.
NASA Goddard Space Flight Center: Moderate-resolution Imaging Spectroradiometer (MODIS) Aqua Downwelling Diffuse Attenuation Coefficient Data, 2014 Reprocessing, O. E. L., Ocean Biology Processing Group, NASA OB.DAAC, Greenbelt, MD, USA, https://doi.org/10.5067/AQUA/MODIS/L3B/KD/2014, 2014a.
NASA Goddard Space Flight Center: Moderate-resolution Imaging Spectroradiometer (MODIS) Aqua Remote-Sensing Reflectance Data, 2014 Reprocessing, O. E. L., Ocean Biology Processing Group, NASA OB.DAAC, Greenbelt, MD, USA, https://doi.org/10.5067/AQUA/MODIS/L3M/RRS/2014, 2014b.
NASA Goddard Space Flight Center: Moderate-resolution Imaging Spectroradiometer (MODIS) Aqua Particulate Organic Carbon Data, 2014 Reprocessing, O. E. L., Ocean Biology Processing Group, NASA OB.DAAC, Greenbelt, MD, USA, https://doi.org/10.5067/AQUA/MODIS/L3B/POC/2014, 2014c.
Peltoniemi, J. I., Gritsevich, M., Hakala, T., Dagsson-Waldhauserová, P., Arnalds, Ó., Anttila, K., Hannula, H.-R., Kivekäs, N., Lihavainen, H., Meinander, O., Svensson, J., Virkkula, A., and de Leeuw, G.: Soot on Snow experiment: bidirectional reflectance factor measurements of contaminated snow, The Cryosphere, 9, 2323–2337, https://doi.org/10.5194/tc-9-2323-2015, 2015.
Pitts, M. C., Hu, Y., Currey, J. C., Winker, D., and Lambeth, J. D.: CALIPSO Algorithm Theoretical basis Document: Wide Field Camera (WFC) Level 1 Algorithms PC-SCI-205, available at: https://www-calipso.larc.nasa.gov/resources/project_documentation.php (last access: 1 June 2018), 2005.
Platnick, S., Ackerman, S. A., King, M. D., Meyer, K., Menzel, W. P., Holz, R. E., Baum, B. A., and Yang, P.: MODIS atmosphere L2 cloud product (06_L2), NASA MODIS Adaptive Processing System, Goddard Space Flight Center, USA, https://doi.org/10.5067/MODIS/MOD06_L2.006, 2015.
Powell, K. A., Hunt, W., Vaughan, M. A., Hair, J. W., and Hostetler, C. A.: Modeling Lidar Solar Background Measurements, The 97th AMS annual meeting: Session 4 The CALIPSO Mission: Space-based Atmospheric Studies – Part II, 22–26 January 2017, Seattle, WA, USA, 2017.
Savtchenko, A., Ouzounov, D., Gopalan, A., Yuan, D., Nickless, D., and Ostrenga, D.: MODIS data from Terra and Aqua satellites, Geoscience and Remote Sensing Symposium, 2003. IGARSS '03. Proceedings. 2003 IEEE International, 21–25 July 2003, Toulouse, France, 5, 3028–3030, https://doi.org/10.1109/IGARSS.2003.1294670, 2003.
Schaaf, C. and Wang, Z.: MCD43C1 MODIS/Terra+Aqua BRDF/AlbedoModel Parameters Daily L3 Global 0.05Deg CMG V006, NASA EOSDIS Land Processes DAAC, https://doi.org/10.5067/MODIS/MCD43C1.006, 2015.
Schaaf, C. B., Gao, F., Strahler, A. H., Lucht, W., Li, X., Tsang, T., Strugnell, N. C., Zhang, X., Jin, Y., Muller, J.-P., Lewis, P., Barnsley, M., Hobson, P., Disney, M., Roberts, G., Dunderdale, M., Doll, C., d'Entremont, R. P., Hu, B., Liang, S., Privette, J. L., and Roy, D.: First operational BRDF, albedo nadir reflectance products from MODIS, Remote Sens. Environ., 83, 135–148, https://doi.org/10.1016/S0034-4257(02)00091-3, 2002.
Spencer, J. W.: Fourier Series Representation of the Position of the Sun, Search, 2, p. 172, 1971.
Vaughan, M., Pitts, M., Trepte, C., Winker, D., Detweiler, P., Garnier, A., Getzewich, B., Hunt, W., Lambeth, J., Lee, K.-P., Lucker, P., Murray, T., Rodier, S., Tremas, T., Bazureau, A., and Pelon, J.: CALIPSO Data Products Catalog, Release 4.20, Document No: PC-SCI-503, available at: https://www-calipso.larc.nasa.gov/products/CALIPSO_DPC_Rev4x20.pdf (last access: 1 June 2018), 2017.
Vaughan, M., Garnier, A., Josset, D., Avery, M., Lee, K.-P., Liu, Z., Hunt, W., Pelon, J., Tackett, J., Getzewich, B., Kar, J., and Burton, S.: CALIPSO Lidar Calibration at 1064 nm: Version 4 Algorithm, in preparation, 2018.
Venkata, S. and Reagan, J.: Aerosol Retrievals from CALIPSO Lidar Ocean Surface Returns, Remote Sens., 8, 1006, https://doi.org/10.3390/rs8121006, 2016.
Vermote, E.: MOD09A1 MODIS Surface Reflectance 8-Day L3 Global 500 m SIN Grid V006, NASA EOSDIS Land Processes DAAC, https://doi.org/10.5067/MODIS/MYD09A1.006, 2015a.
Vermote, E. F.: MODIS Surface Reflectance User's Guide, collection 6, Version 1.4, available at: https://lpdaac.usgs.gov/sites/default/files/public/product_documentation/mod09_user_guide_v1.4.pdf (last access: 1 June 2018), 2015b.
Winker, D. M., Couch, R. H., and McCormick, M. P.: An overview of LITE: NASA's Lidar In-space Technology Experiment, P. IEEE, 84, 164–180, 1996.
Winker, D. M., Vaughan, M. A., Omar, A., Hu, Y., Powell, K. A., Liu, Z., Hunt, W. H., and Young, S. A.: Overview of the CALIPSO Mission and CALIOP Data Processing Algorithms, J. Atmos. Ocean. Tech., 26, 2310–2323, https://doi.org/10.1175/2009jtecha1281.1, 2009.
Wiscombe, W. J. and Warren, S. G.: A Model for the Spectral Albedo of Snow. I: Pure Snow, J. Atmos, Sci., 37, 2712–2733, https://doi.org/10.1175/1520-0469(1980)037<2712:amftsa>2.0.co;2, 1980.
Yang, Y., Marshak, A., Palm, S. P., Wang, Z., and Schaaf, C.: Assessment of Cloud Screening With Apparent Surface Reflectance in Support of the ICESat-2 Mission, IEEE Trans. Geosci. Remote, 51, 1037–1045, https://doi.org/10.1109/TGRS.2012.2204066, 2013.
Young, S. A. and Vaughan, M. A.: The Retrieval of Profiles of Particulate Extinction from Cloud-Aerosol Lidar Infrared Pathfinder Satellite Observations (CALIPSO) Data: Algorithm Description, J. Atmos. Ocean. Tech., 26, 1105–1119, https://doi.org/10.1175/2008JTECHA1221.1, 2009.
Zwally, H. J., Schutz, B., Abdalati, W., Abshire, J., Bentley, C., Brenner, A., Bufton, J., Dezio, J., Hancock, D., Harding, D., Herring, T., Minster, B., Quinn, K., Palm, S., Spinhirne, J., and Thomas, R.: ICESat's laser measurements of polar ice, atmosphere, ocean, and land, J. Geodyn., 34, 405–445, 2002.


