the Creative Commons Attribution 4.0 License.
the Creative Commons Attribution 4.0 License.
 | 29 Jun 2018
Characteristics of vertical velocities estimated from drop size and fall velocity spectra of a Parsivel disdrometer
Dong-Kyun Kim
Chang-Keun Song
Vertical air velocities were estimated from drop size and fall velocity spectra observed by Parsivel disdrometers during intensive field observations from 13 June to 3 August 2016 around Mt. Jiri (1915 m a.s.l.) in the southern Korean Peninsula. Rainfall and wind velocity data measured by Parsivel disdrometers and ultrasonic anemometers, respectively, were analyzed for an orographic rainfall event associated with a stationary front over Mt. Jiri on 1 July 2016. In this study, a new technique was developed to estimate vertical air velocities from drop size and fall velocity spectra measured by the Parsivel disdrometers and investigate characteristics of up-/downdrafts and related microphysics on the windward and leeward sides of the mountain.
To validate results from this technique, vertical air velocities between the Parsivel disdrometers and anemometers were compared at different locations and were shown in quite good agreement with each other. It was shown that upward motion was relatively more dominant on the windward side and even during periods of heavy rainfall. In contrast, downward motion was more dominant on the leeward side during nearly the same periods of heavy rainfall. Occurrences of upward and downward motion were digitized as percentage values as they are divided by a total count of occurrences during the entire period. On the windward (leeward) side, the percentages of upward (downward) motion were much larger than those of downward (upward) motion. The mean rainfall intensity on the leeward side was stronger than on the windward side, suggesting that most of the rainfall on the leeward side was relatively more affected by the downward motion. With the estimated vertical air velocities, histogram characteristics of rainfall parameters were also examined between the windward and leeward sides.
- Article
(3494 KB) - Full-text XML
- BibTeX
- EndNote


Drop size distribution (DSD) and related rain parameters from surface disdrometer measurements or indirectly retrieved from remote sensing measurements such as radars, wind profilers, or satellites provide key information for a better understanding of rain microphysics that accounts for drop growth and precipitation processes. Nevertheless, DSD uncertainties always exist as its retrieval is vulnerable to various factors such as measurement errors, sampling difference in volume and height, strong winds, up-/downdrafts, turbulence, and so on as has been reported in many previous studies (Jameson and Kostinski, 1998; Cao et al., 2008; Tokay et al., 2009; Thurai et al., 2012). Thus, a validation of such retrieved DSDs by comparing with those from surface disdrometers is not straightforward (Williams et al., 2000) due to their different environment, although minimizing a sampling difference as much as possible is needed. Even if DSDs are accurately obtained, their characteristics, particularly between convective and stratiform rain, can vary largely from small areas on a short-time scale to climatic regimes in the long term.
Ground-based classifications of convective, mixed, or stratiform rain types have been performed in various ways such as characteristics in integral DSD parameters (i.e., rain rate, mean drop diameter, etc.), bright band signature, vertical gradients in Doppler velocity and reflectivity, vertical draft magnitude, and so on (Atlas et al., 2000; Cifelli et al., 2000; Thompson et al., 2015; Tokay and Short, 1996; Tokay et al., 1999; Thurai et al., 2016; Williams et al., 1995). Tokay et al. (1999) classified rainfall types from collocated disdrometer and 915 MHz profiler observations in tropical rain events and indicated that compared to profiler classifications that utilize vertical gradients in Doppler velocity, a disdrometer is relatively more feasible to misclassify stratiform rain as convective, or vice versa, due to time–height ambiguity mostly associated with advection of drops while falling to the ground.
In measuring and validating surface DSDs, there is no such handy, transportable, and low-cost instrument like a disdrometer that has long been used as a ground truth, although it has inherent problems mentioned above as exposed to different environments. The Parsivel disdrometer (hereafter Parsivel) is one of disdrometers widely used for DSD studies all over the world. As deduced from its name, par-si-vel (particle size and velocity), this disdrometer measures sizes, fall velocities, and number counts of liquid and ice particles falling into 32 (size) × 32 (fall velocity) bins. Parsivel has been used at observatories or in numerous field experiments to examine and validate microphysical properties by comparing DSDs and integral DSD parameters with those from other types of disdrometers, the two-dimensional video disdrometer (2-DVD), wind profiler, and radar observations for various events of precipitation (Jaffrain and Berne, 2011; Kim et al., 2016; Thurai et al., 2011, 2016; Tokay et al., 2013).
A Parsivel-measured fall velocity of a raindrop is the sum of a raindrop terminal fall speed (in stagnant air) and vertical air motion. Thus, when there are updrafts or downdrafts, the Parsivel-measured fall velocity deviates from the terminal fall speed even if drop sizes are identical. On top of this, strong horizontal winds, vertical shear, or turbulence can disperse the distribution of drop size and fall velocity, leading to a change (or bias) in the Parsivel-measured fall velocity averaged over the distribution. Consequently, all these factors would affect DSD integral parameters such as rain rate, although the effects of the factors on DSD are complicated and hardly discriminated (Niu et al., 2010). Ulbrich (1992) examined errors in rain rate that result from inaccuracies in fall speeds of raindrops (i.e., inaccurate estimation of vertical air motion) and indicated that updraft will result in larger rain rate at a given reflectivity than when there are no vertical winds. Niu et al. (2010) investigated differences in distributions of drop sizes and fall velocities between convective and stratiform rain and ascribed different deviations in Parsivel-measured fall velocities between small and large drops to vertical air motion and turbulence. Parsivel is prone to measurement errors particularly when there are strong winds and turbulence, leading to discrepancies in comparison with other measurements in the same locations. Friedrich et al. (2013) investigated the influence of strong winds on particle size distributions measured by Parsivel disdrometers deployed in Hurricane Ike in 2008 and convective storms, and noted that misclassification can occur by particles not falling perpendicular to the sampling area at high wind speed and/or heavy rainfall. Tokay et al. (2009, 2014) indicated that the old version of Parsivel tends to underestimate the number of small drops and overestimate drop size larger than 2.0 mm in heavy rain as well as in windy conditions. When they compared each old and new version of Parsivel with Joss–Waldvogel disdrometer and rain gauge measurements, the new version of Parsivel (referred to as Parsivel2 in their paper) appeared to have a noticeable improvement over the old one for measuring drop size and rainfall rate.

Figure 1Picture of a Parsivel disdrometer and an ultrasonic anemometer that were installed at an observation site around Mt. Jiri during the intensive observation period.
To our knowledge, no studies of vertical air velocities retrieved from Parsivel-measured drop size – fall velocity spectra have been documented or reported yet. In this study we utilize Parsivel and anemometer data collected during intensive field observations that targeted investigating orographic rainfall mechanisms around mountain areas in the southern region of South Korea. A simple technique to retrieve vertical air velocities from Parsivel measurements is developed and first applied to an orographic heavy rain event. This paper is organized as follows. In Sect. 2, the retrieval technique and instruments used in this study are introduced. A case description about the rain event is followed in Sect. 3. Results about characteristics of up-/downward motion and related microphysics on the windward and leeward sides are presented in Sect. 4. A summary and conclusions follow in Sect. 5.
Two main instruments used in this study are the Parsivel disdrometer and ultrasonic anemometer collocated at three different sites around Mt. Jiri (see Fig. 1). Their data were collected during the intensive observation period from 13 June to 3 August 2016 to cover a summer rainy season which is called “Changma” in South Korea. The Parsivel disdrometer (Parsivel), manufactured by OTT (Germany), uses laser-optical properties to measure both sizes and fall velocities of precipitation particles and derives quantities of radar reflectivity, precipitation intensity, etc. from measured drop size spectra. Time resolution is 1 min. For more details about Parsivel, please see Löffler-Mang and Joss (2000). The ultrasonic anemometer (the Young Model 81000, hereafter UVW) measures east–west (u), north–south (v), and vertical (w) components of winds by using the speed of sound moving along winds between the three non-orthogonal sonic axes and generates wind speed and direction at a 1 min interval. The accuracies are ±0.05 m s−1 for wind speed (0 to 30 m s−1) and ±2∘ for wind direction (0 to 30 m s−1), respectively. The w component observed by UVW is referred to as wUVW.
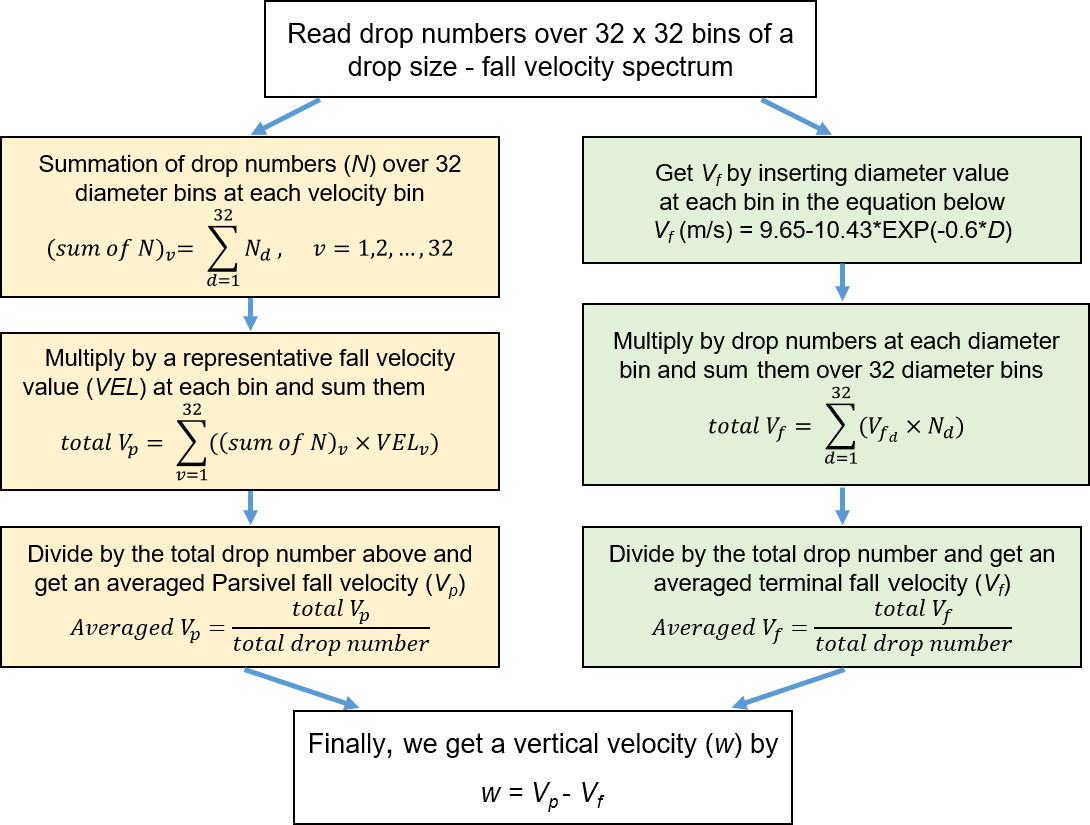
Figure 2Flowchart for estimating w from a diameter – fall velocity spectrum of Parsivel (1 min interval). See text for more details.
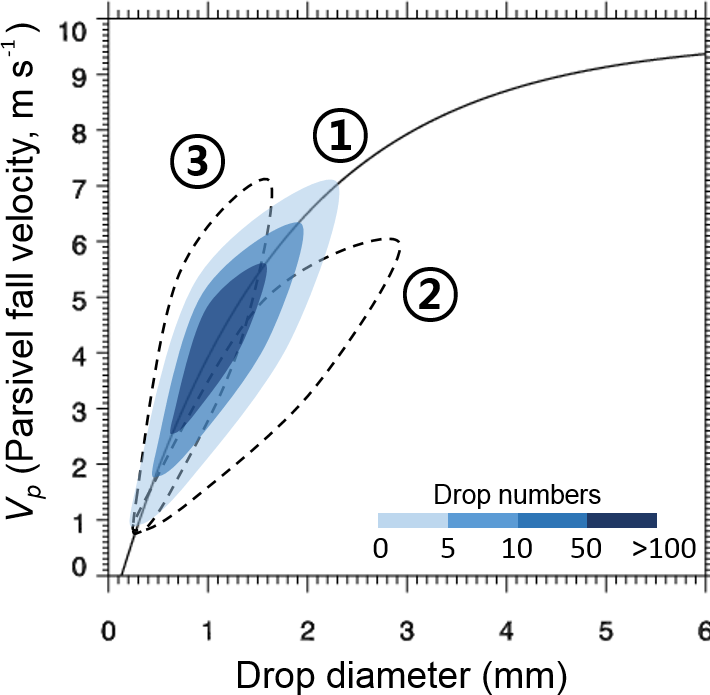
Figure 3Schematic of Parsivel-measured diameter and fall velocity distributions for the three cases of determining zero w, upward w, and downward w. Solid line curve indicates terminal fall velocities (Vf) computed from Eq. (1). Contours show drop number concentrations. See text for more information.
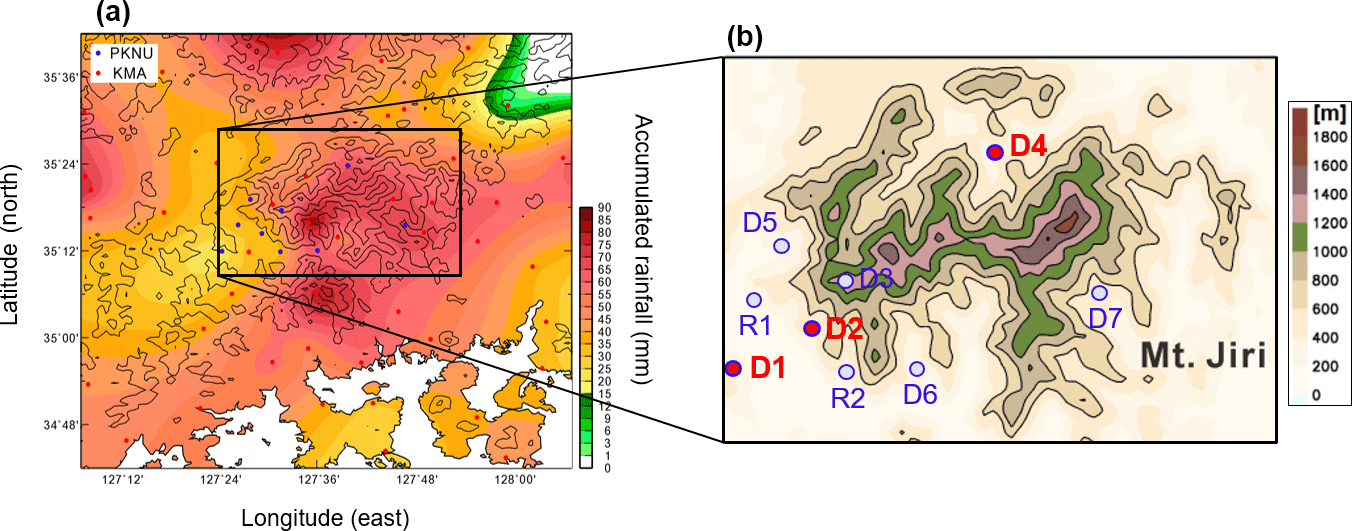
Figure 4(a) Distribution of an accumulated rainfall (mm) on 1 July over contours of altitude at 300 m interval and (b) the enlarged topography of Mt. Jiri with contours of altitude at 200 m interval, showing nine observation sites. Three sites in red are where the Parsivel and UVW measurements were analyzed in this study. R1 and R2 show sites with a rain gauge only.
In this study, a simple, new scheme to derive vertical velocity (w) from Parsivel measurements is developed by using a relationship of Atlas et al. (1973) between terminal fall velocities and drop diameters in still air as shown by
where D is drop diameter (mm) and Vf is terminal fall velocity (m s−1), and the vertical relation of air as shown below
where Vp is Parsivel-measured fall velocity (m s−1) averaged over 32 diameter × 32 velocity classes in a size and velocity spectrum. Altitudes of D1, D2, and D4 are 105, 280, and 313 m a.s.l., respectively. Due to the very low altitudes of these observation sites, change in atmospheric density with height is negligible, and thus the atmospheric density correction (Beard, 1985) on Vf is ignored. In all the terms, negative means downward. A mean w value at 1 min interval is finally estimated by subtracting Vp from Vf, also averaged following the flowchart in Fig. 2. The final w estimate is hereafter called wpar. For more details, please see the flowchart that shows how w is estimated from a 1 min drop size (D) and fall velocity (Vp) spectrum of Parsivel. Figure 3 illustrates three conditions of determining zero w, upward w, or downward w value for a given D vs. Vp spectrum. For case 1, w would be zero since the D-Vp distribution closely follows the Vf line. Upward w value is determined for case 2 such that Vp is smaller than Vf (i.e., the distribution is towards below the Vf line). For case 3, downward w value is determined since Vp is larger than Vf. For wpar validation, wpar is compared with wUVW and its result is described in Sect. 4.
During a summer rainy season usually from late June to mid-July in South Korea, severe weather phenomena accompanied by heavy rainfall often occur in the southern region of the Korean Peninsula mostly covered by complex high mountains. In association with terrain-induced up-/downdrafts, mountainous areas can play an important role in controlling formation, amount, and distribution of rainfall. As precipitation systems move over these areas, they tend to develop rapidly and produce localized heavy rainfall. Observational analysis from radar and surface measurements in these areas is necessary to understand terrain effects on rainfall development and microphysics. Thus, we performed intensive field observations around Mt. Jiri (1915 m a.s.l.) in the southern Korean Peninsula during the summertime in 2016.
During the observation period of 13 June–3 August 2016, several rain events were observed. On 1 July 2016, a rainfall system associated with a Changma front developed over the Yellow Sea and moved towards Mt. Jiri. As it passed over the mountain from the east, heavy rainfall was produced and observed by Parsivel disdrometers and UVWs from 12:00 to 22:00 LST. Figure 4 shows a distribution of accumulated rainfall on 1 July and the enlarged topography of Mt. Jiri with locations of observations. Large rainfall up to 90 mm was seen around the top and south of Mt. Jiri in relation to moist upwind flows on the windward side close to the ocean.
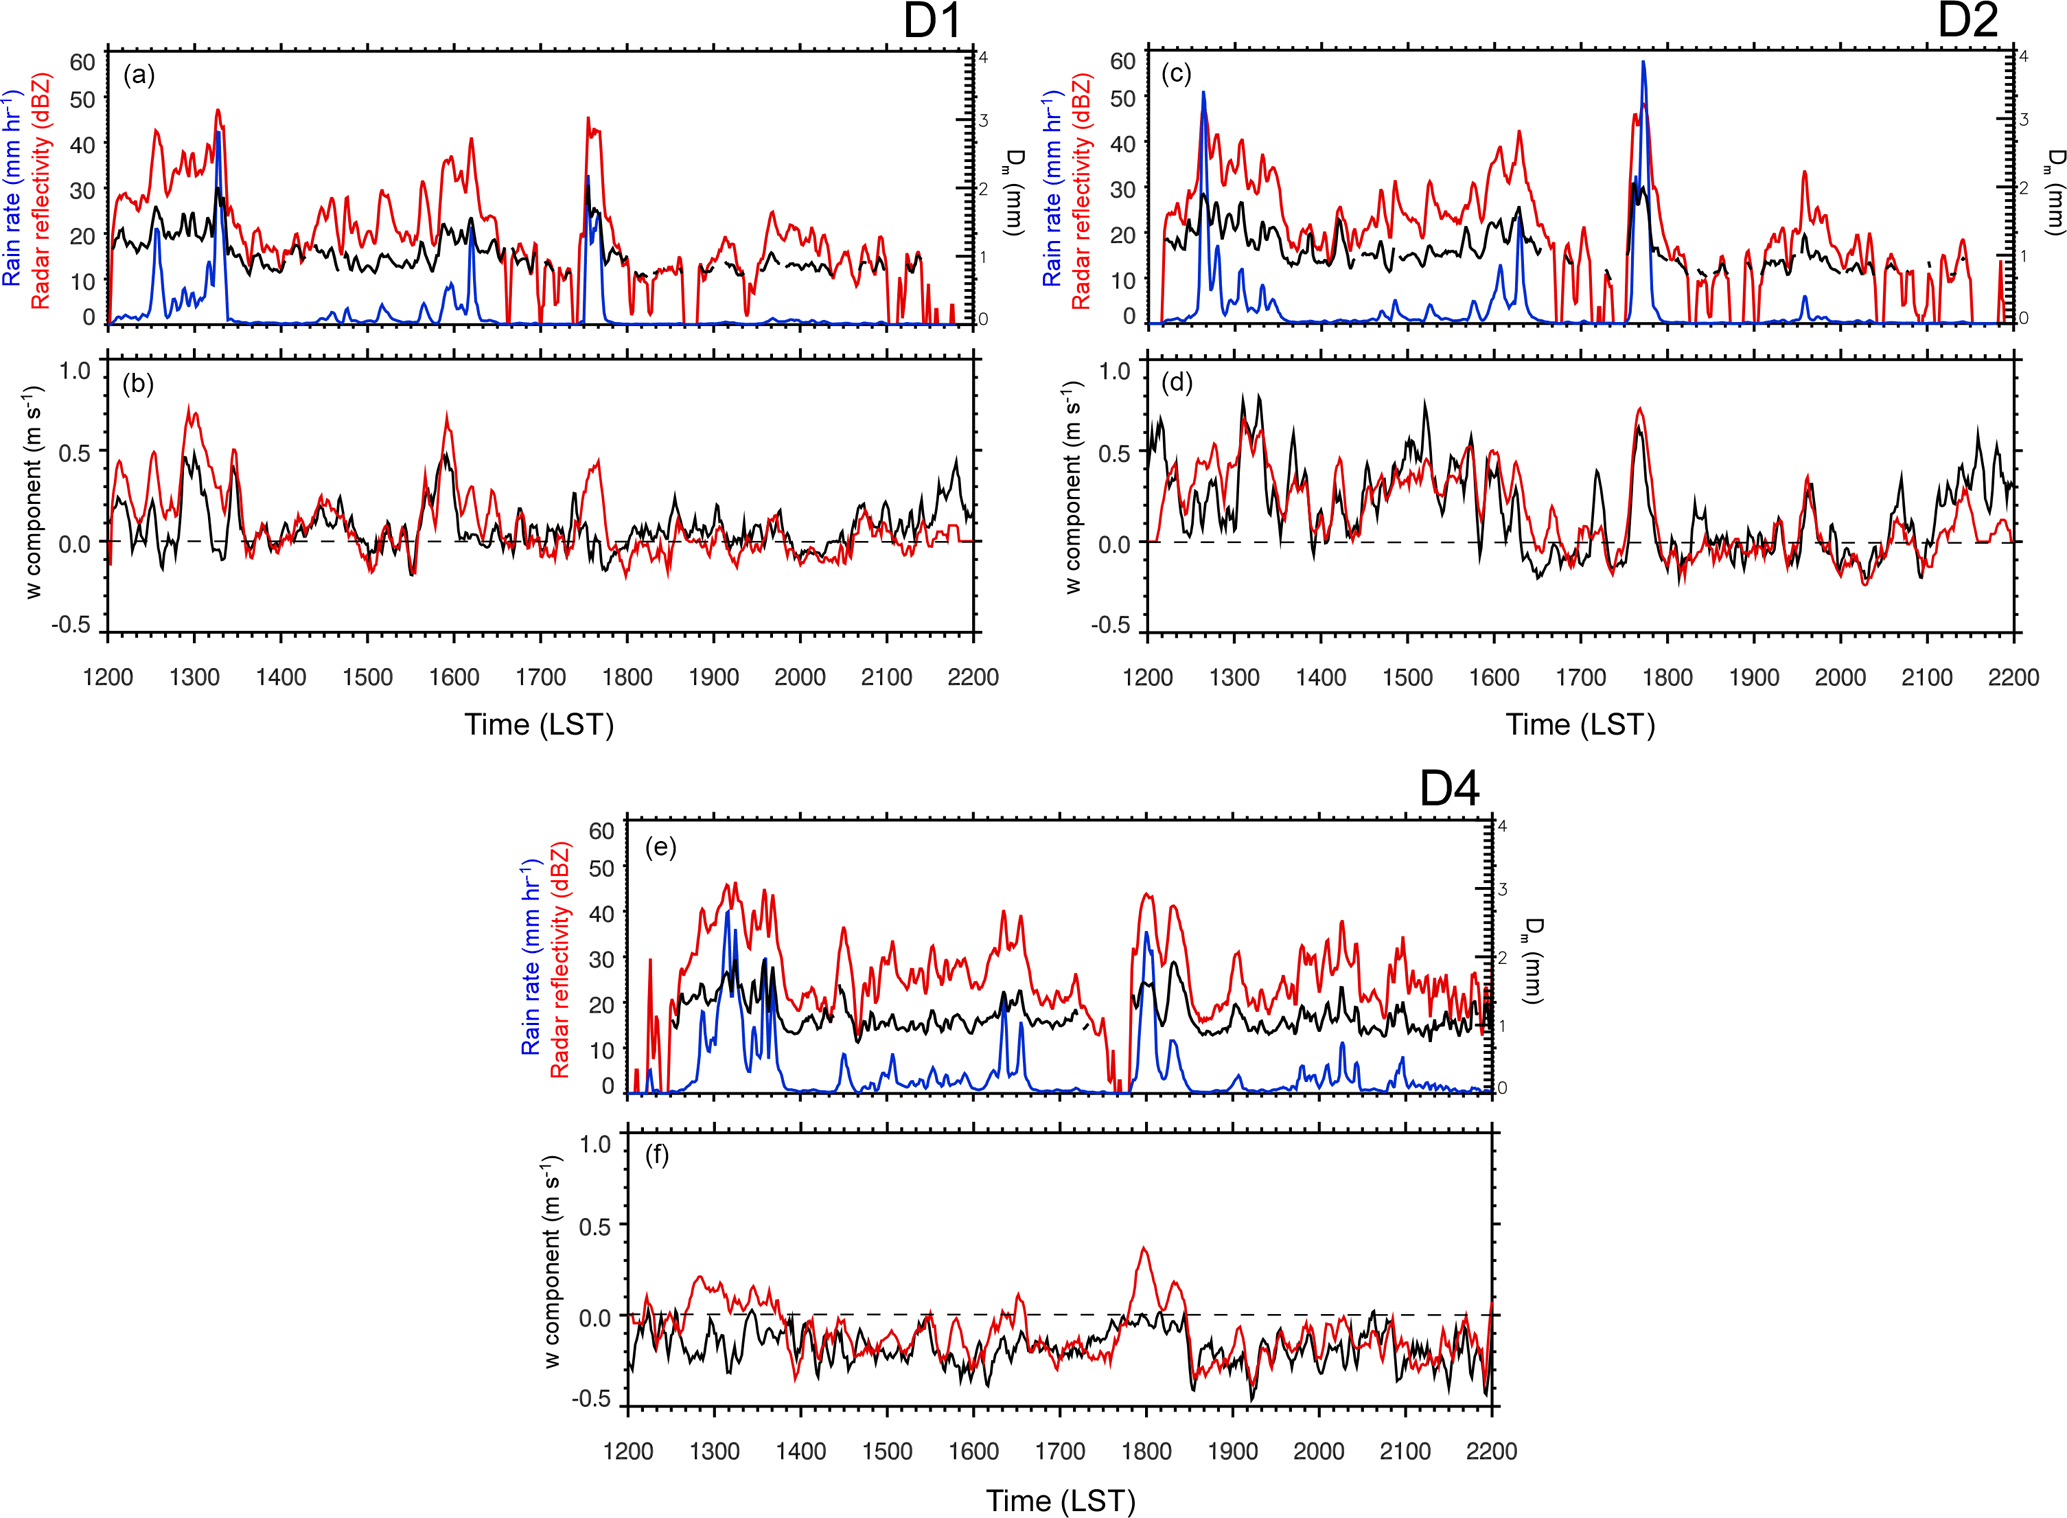
Figure 5Time series of radar reflectivity (dBZ) in red line, rain rate (mm h−1) in blue, and mass-weighted mean diameter (Dm, mm) in black at D1, D2, and D4 (a, c, e), and the time series of wpar (m s−1) in red and wUVW (m s−1) in black at the same sites (b, d, f). LST stands for local standard time. A five-point running mean was applied.
4.1 w comparison in time series
For the wpar validation, the observed wUVW is compared in a time series. Time series of radar reflectivity (Z), rain rate (R), mass-weighted mean diameter (Dm) measured from Parsivel are also examined together. Three observation sites of D1, D2, and D4 where both the Parsivel and UVW data are available were selected out of nine sites (Fig. 4b). D1 and D2 are windward and D4 is leeward of Mt. Jiri. Figure 5 shows the time series of Z, R, and Dm (top), and w (bottom) between the Parsivel and UVW observed at D1, D2, and D4. At D1 and D2, high Z > 40 dBZ and R > 20 mm h−1 are observed during the 12:30–13:30 LST period and at around 17:30 LST in Fig. 5a and c. Correspondingly, large Dm values reaching 2 mm were analyzed in these periods. In Fig. 5e, high Z and R were also observed on the leeward side but showed a little time lag compared to those in Fig. 5a and c.
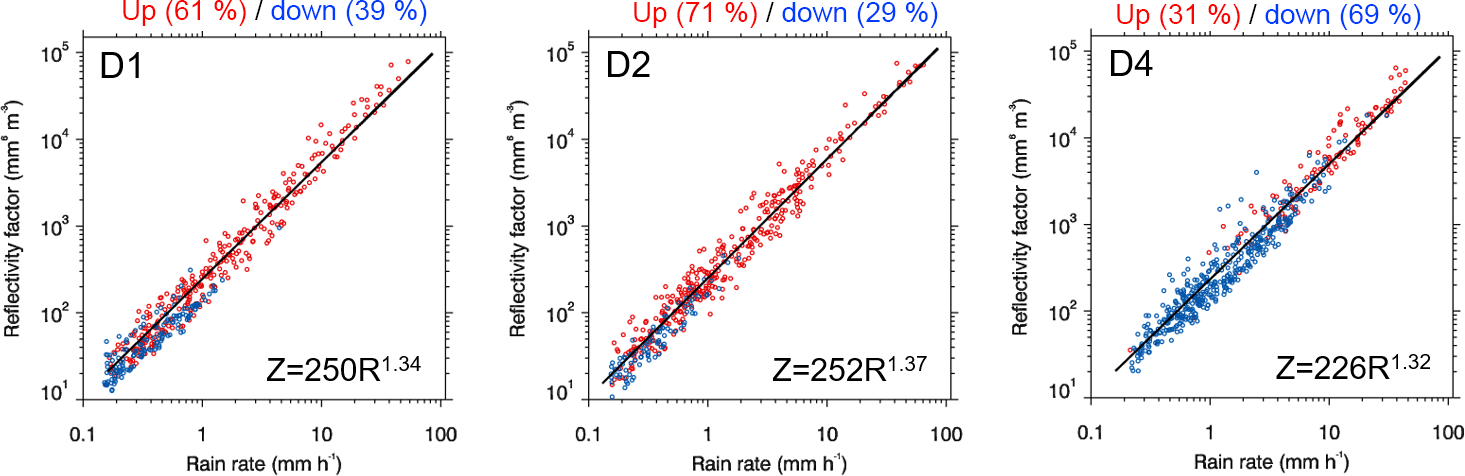
Figure 6Z–R scatterplots at the three sites. Red dots indicate upward w and blue indicate downward w. Numbers on the top show percentages of frequency of occurrence in each w category.
It is shown in Fig. 5b, d, and f that wpar matches quite well with wUVW. On the windward side (D1, D2), they both show mostly upward motion and, importantly, larger upward motion during periods of heavy rainfall (i.e., 12:30–13:30 LST and around 17:30 LST). In contrast, downward motion is mostly observed on the leeward side (D4). It is noted in Fig. 5f that there existed a relatively large difference between wpar and wUVW during these high R periods. We found that the difference is related to a decrease of Vp in these periods. For a given Vf, a mean Vp became smaller in Eq. (2) due to an increase of the number of small drops at a range of 1–2 mm or a spread of small drops below the Vf line in the D-Vp distribution (more like case 2 illustrated in Fig. 3). A physical reason for this is not clear yet, but it probably resulted from strong winds and turbulence during this high R period. In other periods, they showed quite good agreement. Also, the maximum and minimum values of wpar and wUVW hardly exceed ±0.5 m−1, almost one-fifth of horizontal wind magnitudes (not shown), suggesting that winds are almost horizontal during the whole period and they point upward or downward slightly with the w signs. At D1 and D2, the relatively large wpar and wUVW were found during heavy rain with R > 20 mm h−1 around 13:00 and 17:40 LST (Fig. 5b and d), indicating that updrafts contributed more to the substantial R increase on the windward side. In Fig. 5f, negative wUVW values were found on the leeward side most of the time including during the heavy rain period (R > 20 mm h−1), suggesting that most of the rainfall on the leeward side occurred in more association with downward w motion.
Figure 6 shows characteristics of Z–R relations at D1, D2, and D4. Upward wpar values are colored in red and downward wpar in blue. They were changed to percentages by dividing by the total of counts in each class with R > 0.5 mm h−1. At D1 and D2, the percentages for the upward wpar class are 61 and 71 %, much larger than 39 and 29 % for the downward wpar class, respectively. In contrast, the upward wpar percentage at D4 is 31 %, about a half of or less than those at D1 and D2 as found in Fig. 5, and the downward wpar percentage is 69 %. Power–law Z–R relations in a form of Z=αRβ are compared between the observation sites in Fig. 6. There was a decrease in the coefficient α from D1 and D2 (250, 252) on the windward side to D4 (226) on the leeward side. The exponent β did not show notable change between the sides. The noticeable decrease in α suggests that for a given Z, R is larger at D4 than D1 and D2. This is consistent with histograms of DSD parameters in the later section showing the larger mean R and Dm at D4.
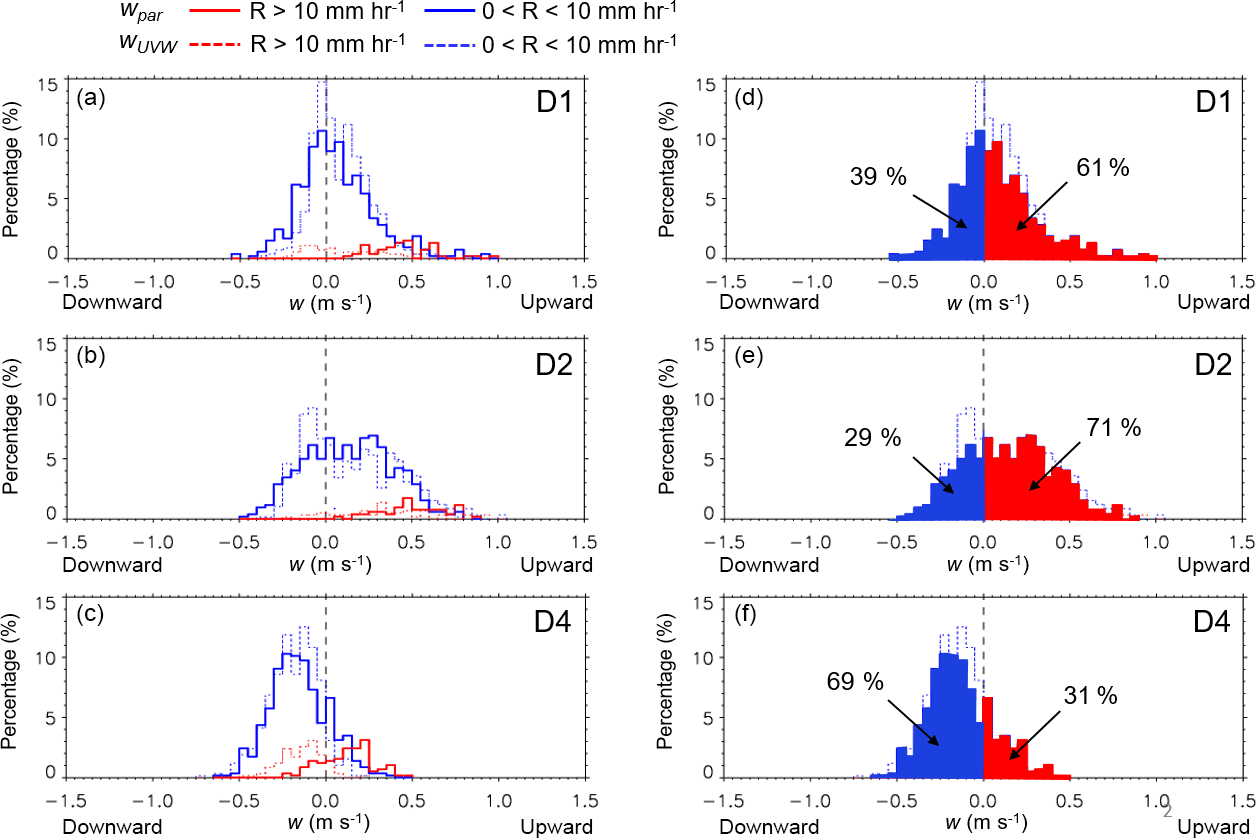
Figure 7Frequency histograms of w (m s−1) with regard to the two R groups (a, b, c) and those with percentages in the upward and downward w groups at the three sites (d, e, f).
4.2 Histogram analyses
4.2.1 Characteristics of w histograms with regard to R
The wpar and wUVW time series discussed in Sect. 4.1 are examined in their histograms of frequency with regard to R. In this study, a simple R threshold, R < 10 mm h−1 and R > 10 mm h−1 (Leary and Houze, 1979; Testud et al., 2001), to discriminate stratiform and convective rain was used, although there have been plenty of other methods based on DSDs and vertical profiles to discriminate stratiform and convective rain (Bringi et al., 2003; Caracciolo et al., 2006; Thompson et al., 2015; Thurai et al., 2016; Tokay and Short, 1996; Tokay et al., 1999; Ulbrich and Atlas, 2002; Williams et al., 1995). Occurrences of upward and downward motion were changed to percentage values as they are divided by a total count of upward and downward w during the entire period. A bin size for these histograms is 0.05 m s−1.
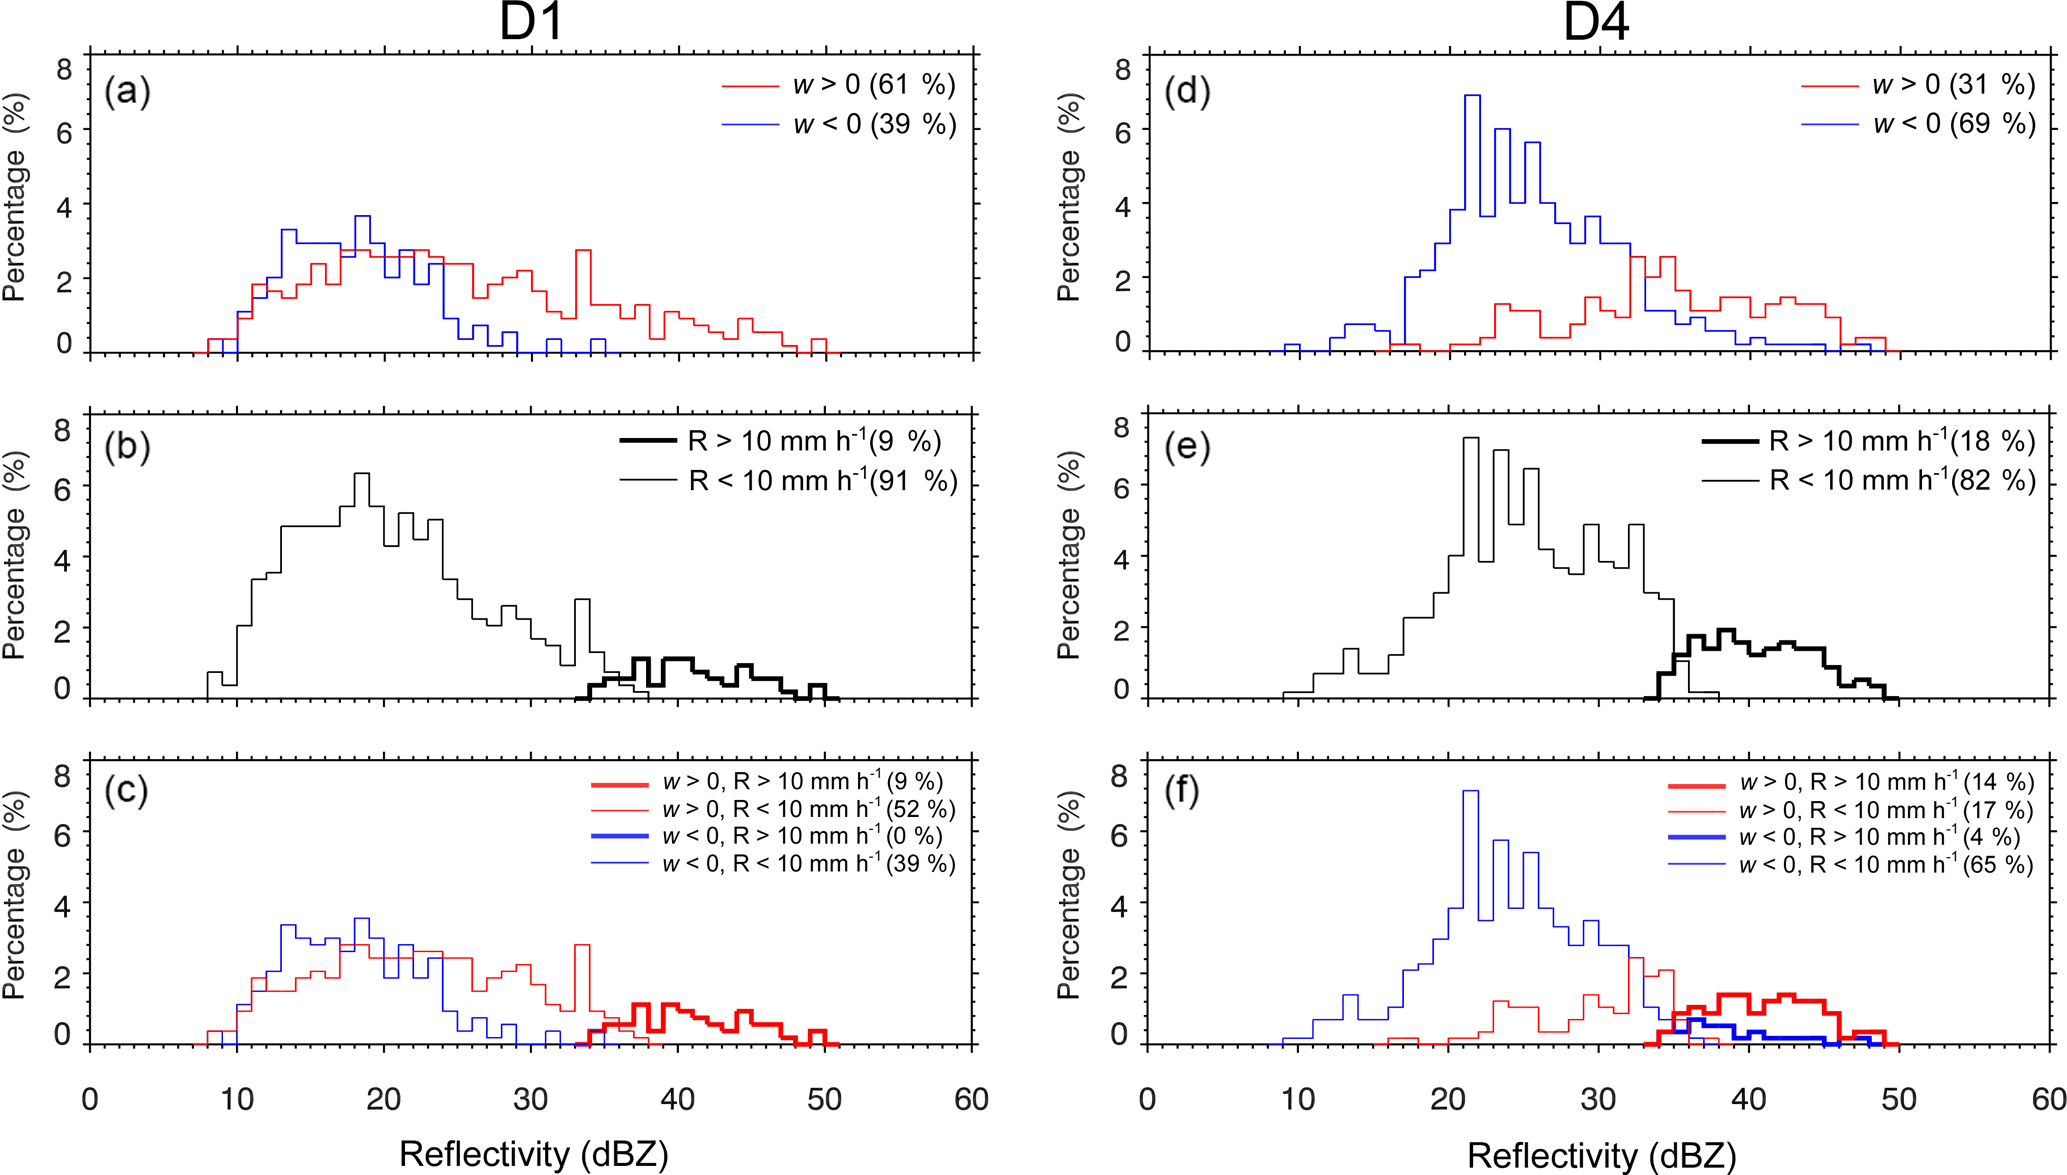
Figure 8Frequency histograms of Z with regard to w, R, and these in the four groups with percentages at D1 and D4.
In Fig. 7a, b, c, on the whole, the wpar histograms are in good agreement with the wUVW at all three sites, showing the much better agreement in the stratiform class (R < 10 mm h−1) than the convective class. The relatively larger difference between the wpar and wUVW histograms is found in the convective class of D1 and this is likely due to strong wind speeds that tend to make a downward spread in measured D vs. Vp spectra of Parsivel. Mathematically, this downward spread decreases Parsivel-measured drop fall velocities (i.e., decrease in Vp in Eq. 2), and thus wpar becomes more positive, making a larger difference with wUVW. Compared to D4, the similar histograms of wpar are shown between D1 and D2. That is, convective rain has occurred almost in association with upward motion, while for stratiform rain, it occurred with both upward and downward motion (Fig. 7a and b). At D4, in contrast, most of stratiform rain was associated with downward motion and convective rain was associated with both upward and downward motion (Fig. 7c). Therefore, both convective and stratiform rain were relatively more associated with downward motion on the leeward side than on the windward side. Figure 7d, e, f show the areas occupied by the upward and downward w motion in percentage at each site, same as those in the Z–R scatterplots shown in Fig. 6. The colored areas with the percentages show readily which w group is far more dominant. As noted, upward motion was dominant at D1 and D2, while downward motion was dominant at D4. However, they did not show large percentage differences at all the sites, suggesting that either upward or downward motion has not happened overwhelmingly on each side in this event.
4.2.2 Characteristics of Z histograms with regard to w and R
The wpar properties discussed in Sect. 4.1 are examined by frequency histograms of Z with regard to w and R. In Fig. 8a, a much larger percentage (61 %) in the upward w group is found at D1 showing a relatively wider Z distribution compared to that at D4 in Fig. 8d. In Fig. 8b, the R percentage classified as convective was 9 %, much smaller than 61 % in the upward w group in Fig. 8a, suggesting that 52 % of the upward w group was associated with stratiform rain. In order to study such relationships between w and R, histograms were split by four conditions in the upper-right corner shown in Fig. 8c and f. That is, each group of R > 10 mm h−1 and R < 10 mm h−1, which is regarded as convective and stratiform rain, respectively, is separated by upward and downward w. Therefore, for instance, 91 % of the group R > 10 mm h−1 in Fig. 8c is equal to the sum of 52 % of the upward w and 39 % of the downward w group. Likewise, the upward and downward w groups are also split by the two R conditions. Unlike D4 in Fig. 8f, there was no thick blue line at D1 in Fig. 8c because there were no data that fell into the category of the downward w and R > 10 mm h−1 as shown in Fig. 7a.
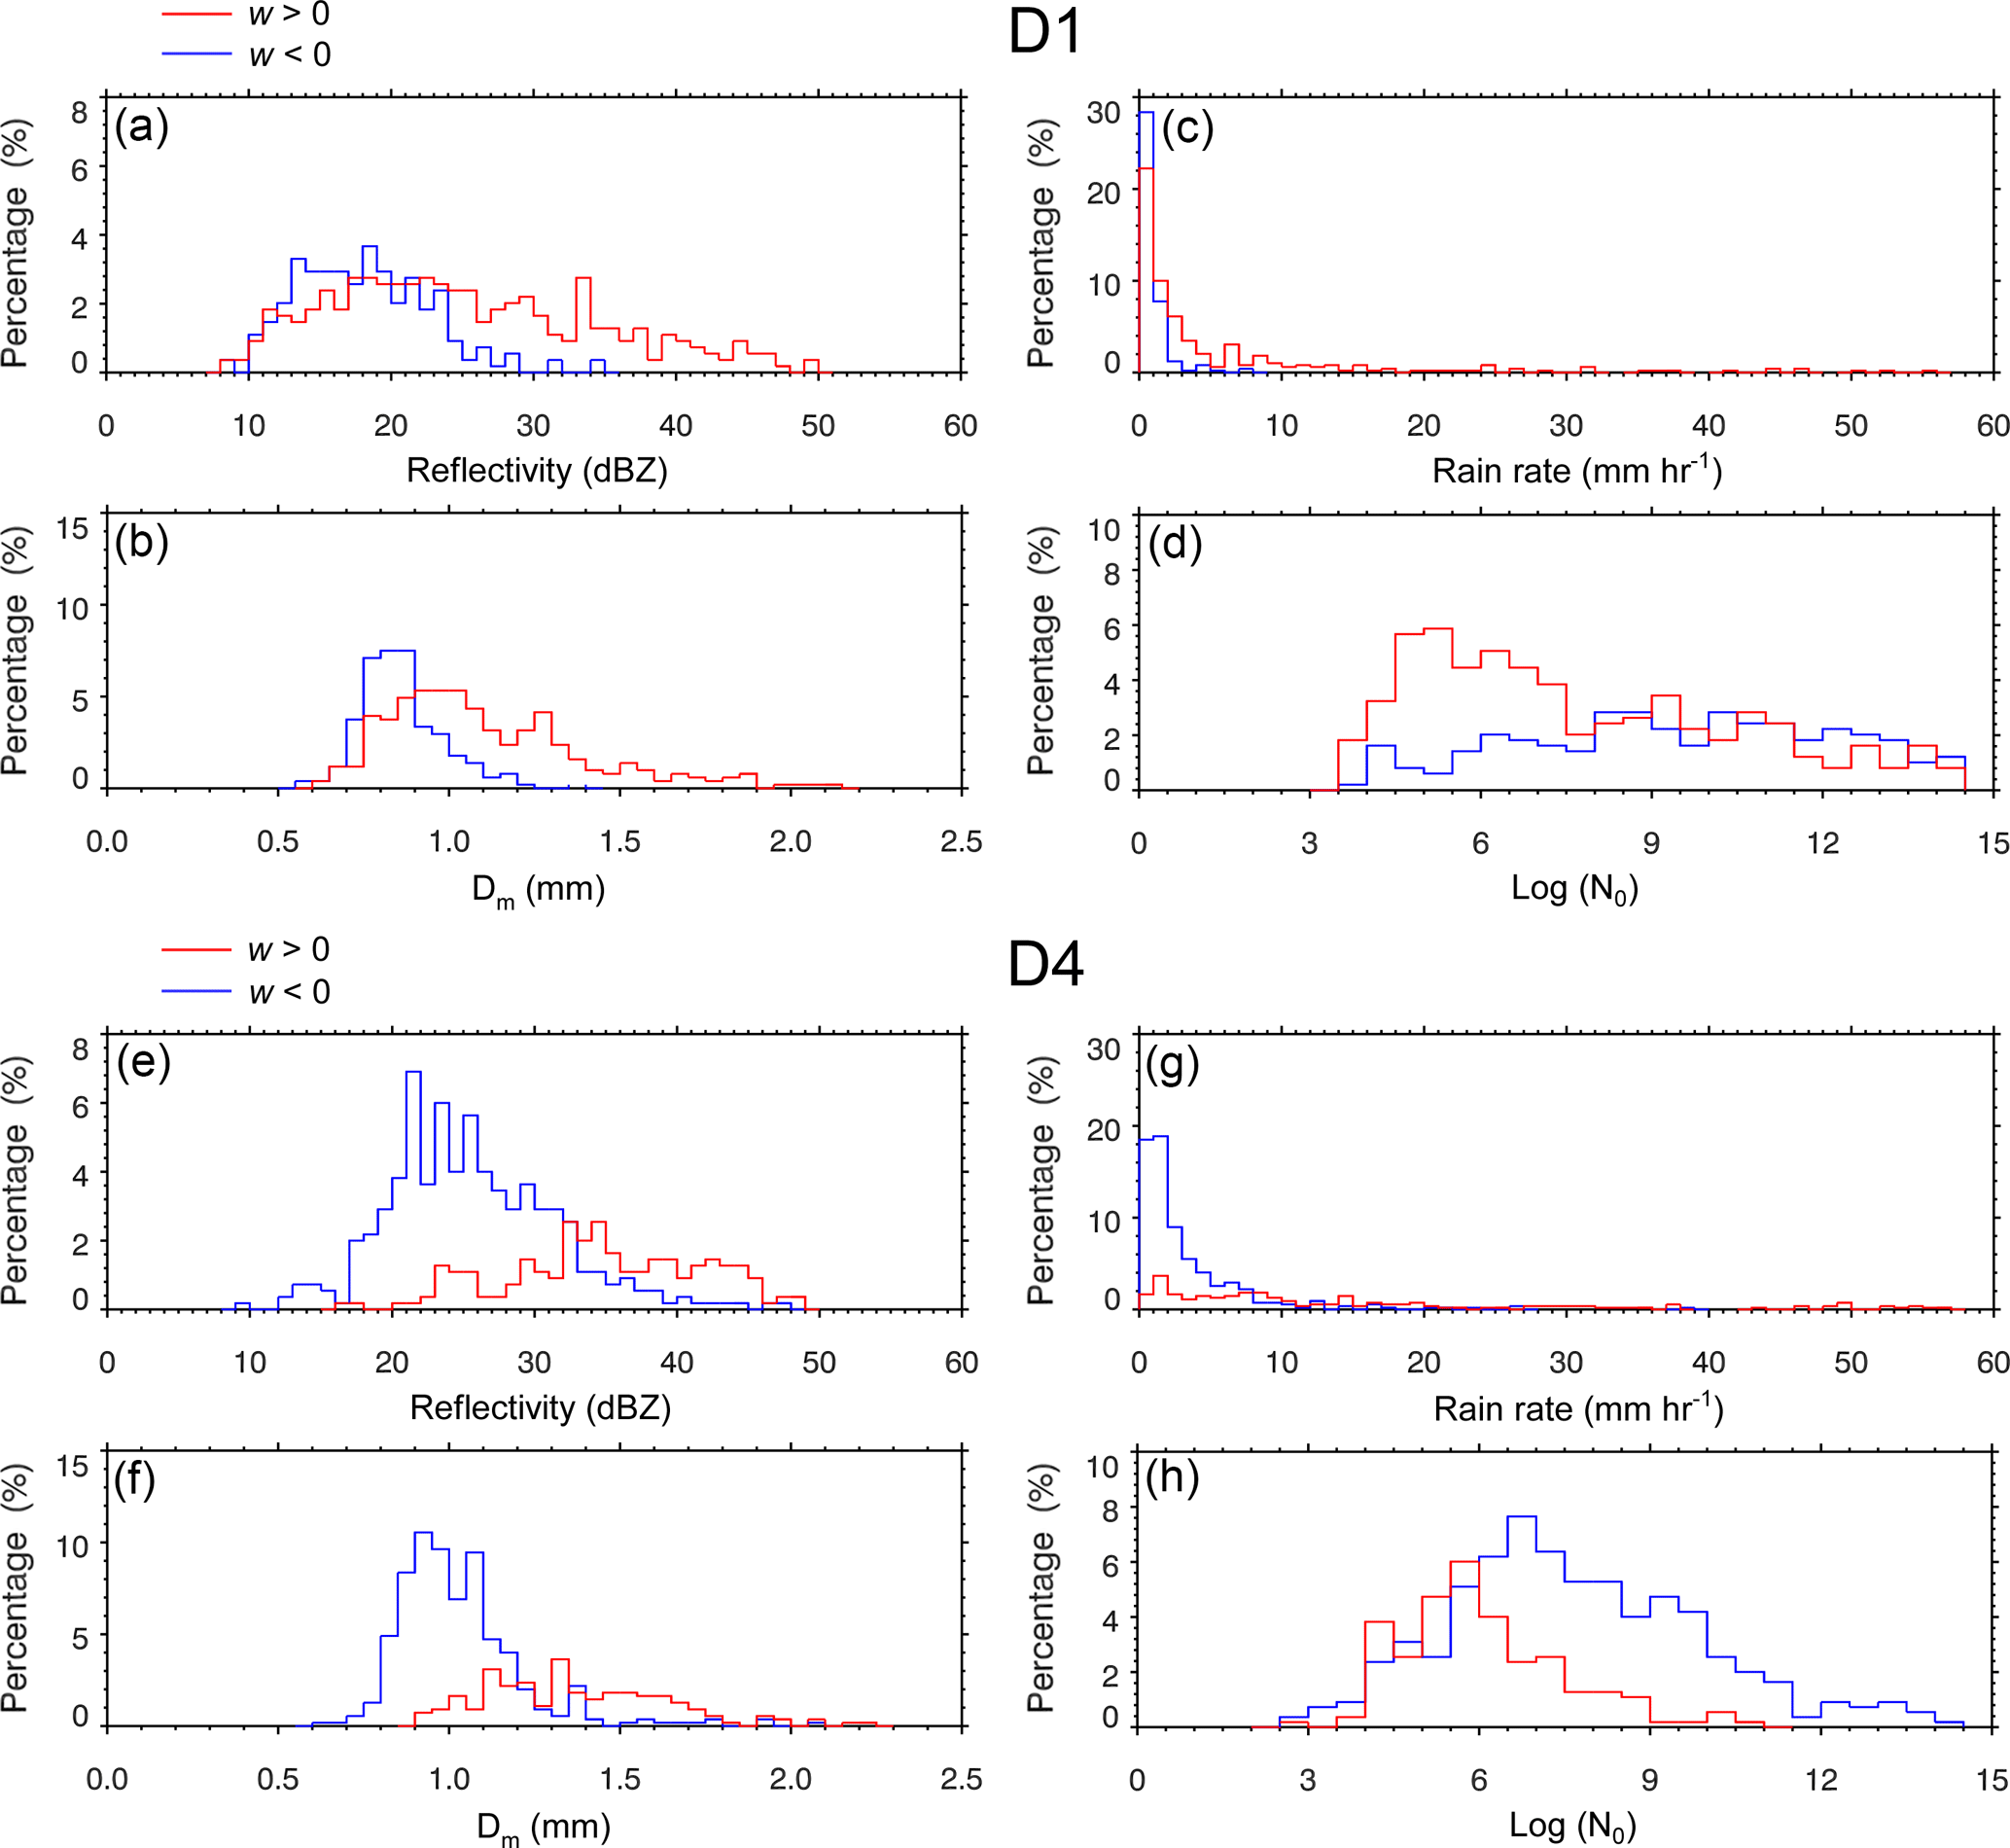
Figure 9Frequency histograms of retrieved DSD parameters with regard to the upward (red line) and downward w (blue): (a) radar reflectivity (dBZ), (b) Dm (mm), (c) rain rate (mm h−1), and (d) N0 (m−3 mm) in log scale at D1 (top four panels) and same as these but for D4 (bottom four panels).
In Fig. 8c, convective rain (R >10 mm h−1) with the largest mean Z occurred solely in association with upward w motion (thick red line). Among the four categories, the majority percentage of 52 % was found in the category of the upward w and R < 10 mm h−1 at D1 but 65 % was found in the category of the downward w and R < 10 mm h−1 at D4. The widest Z distributions were shown in these categories. In Fig. 8d, a much larger percentage is found in the downward w group as noted previously. In Fig. 8e, a larger percentage of 18 % is found in the group R > 10 mm h−1, compared to the counterpart (9 %) at D1, indicating that, on average, rain intensity was stronger at D4 (leeward). It is noted that at D4, convective rain occurred in association with both upward (14 %) and downward motion (4 %) although the latter showed a bit smaller Z values than those in the upward w and convective rain category (thick red line). It is thus suggested that downward w motion can play a significant role in increasing R, even larger than 10 mm h−1, although the strongest R was related to upward motion rather than downward. Most of stratiform rain (< 10 mm h−1) was associated with downward motion (65 %).
4.2.3 Histogram characteristics of DSD parameters with regard to wpar
In Fig. 9, we analyze histograms of DSD parameters that are obtained with additional w information from Parsivel, which is the first time ever, compared to conventional DSD studies. In this study, two histograms separated by the upward and downward w were obtained per each parameter. In Fig. 9e, the Z histograms at D4 show higher Z distributions with mean values of 34.8 and 25.6 dBZ in the upward and downward w categories, respectively, are shown, compared to those (25.2 and 18.2 dBZ) at D1 in Fig. 9a. At both D1 and D4, the mean Z, R, and Dm values in the upward w category were higher than those in the downward w category. Between D1 and D4, the mean Z, R, and Dm over the entire data set were higher at D4, indicating that rainfall intensity was somewhat stronger than D1, although the maximum Z (∼ 50 dBZ) and R (near 60 mm h−1) were quite similar to each other (see the time series of Z and R in Fig. 5). The mean R of 15.1 mm h−1 was higher in the upward w category of D4 than 6.22 mm h−1 in that of D1 (Fig. 9c and g). The total mean R was 7.2 mm h−1 at D4, also larger than 4.3 mm h−1 at D1. The mean Dm was largest at 1.37 mm in the upward w category of D4 in Fig. 9f and smallest at 0.86 mm in the downward w category of D1 in Fig. 9b. Thus, the mean Dm (1.03 mm) in the downward w category of D4 was greater than the one (0.86 mm) in that of D1. This indicates that there was a comparatively larger number of large drops at D4 in association with downward motion which was dominant during the entire period. Thus, it is stressed that, relative to the windward side, downward motion has more influenced the growth in drop size and increase in R intensity on the leeward side.
Intensive field observations for orographic rainfall around Mt. Jiri in the southern regions of South Korea were conducted during summertime in 2016. In order to examine up-/downward w properties on the windward and leeward sides of the mountain, a simple technique was newly developed to retrieve vertical velocities (w) from drop size and fall velocity spectra of Parsivel. Their comparison with the w components observed by UVW showed quite good agreement with each other, producing the similar w histograms between the two instruments. On the windward side (D1 and D2), upward motion was more frequently observed, and particularly larger upward motion was found during convective rain. For the leeward side (D4), downward motion was more dominant even during the large R periods (> 10 mm h−1) as on the windward side, and most of stratiform rain was associated with downward motion. Thus, it is speculated that downward motion has contributed more to drop growth and R increase on the leeward side. It is important to note that as the rain system moves over the mountain, upward and downward motion have occurred on both sides of the mountain, although there existed the difference in their frequencies of occurrence.
Eventually, the newly developed technique that estimates w values from Parsivel drop size and fall velocity spectra is found physically meaningful and promising, although it needs to be further tested in other places and events. It would be applicable to w retrieval and comparison studies near the surface to investigate rain microphysics associated with up-/downward motion. The different properties of up-/downward motion in different locations stress their dependence on observed D-Vp distributions which vary largely as a result of complex factors such as rainfall intensity, up-/downdrafts, wind speed, turbulence, and so on.
In this study, both the observed and estimated w values were very small in magnitude mostly between −0.5 and +0.5 m s−1, about one-fifth of the measured horizontal wind speeds. As known, the w values are just a vertical component of winds. Thus, the low w values indicate that winds blow almost horizontally and point up-/downward slightly with the w signs. During the high R periods, the estimated w values were larger in a positive sign (windward side), suggesting that there were more upward-pointing flows around the mountain. Probably this produces a large-scale environment of converging-upward air and helps to intensify the orographic rain system, increasing Z and R.
The relatively large difference between wpar and wUVW was found on the leeward side during the high R periods (Fig. 5f). This is probably associated with strong winds and turbulence that can spread the D-Vp distribution of drops down below the Vf line (particularly small drops) and further bias w magnitudes. Hence, w retrievals using the disdrometer-based technique are also not free from environmental conditions. Since the effects of winds and turbulence were not analyzed in this study, we will soon investigate their effects on D-Vp distributions and resultant w biases in a quantitative way as a subsequent work.
The Parsivel and anemometer data collected during the intense observation campaign from 13 June to 3 August 2016 were provided by GEAR in the Environmental Atmospheric Department of Pukyong National University, Busan, South Korea. The data set is not publicly accessible and only available upon request and further information is found at http://gear.pknu.ac.kr (GEAR, 2017).
D-KK designed the new method and carried out the analysis with the measurements in this study, and C-KS contributed to describing the results through discussion.
The authors declare that they have no conflict of interest.
This research was supported by the National Strategic Project-Fine Particle
of the National Research Foundation of Korea (NRF), funded by the Ministry of
Science and ICT (MSIT), the Ministry of Environment (ME), and the Ministry of
Health and Welfare (MOHW) (NRF-2017M3D8A1092021), and also supported by the New
Faculty Start-Up Program funded by UNIST (grant no. 1.160110.01).
Edited by: Gianfranco Vulpiani
Reviewed by: three anonymous referees
Atlas, D., Srivastava, R. C., and Sekhon, R. S.: Doppler radar characteristics of precipitation at vertical incidence, Rev. Geophys. Space Phys., 11, 1–35, 1973.
Atlas, D., Ulbrich, C. W., Marks, F. D., Black, R. A., Amitai, E., Willis, P. T., and Samsury, C. E.: Partitioning tropical oceanic convective and stratiform rains by draft strength, J. Geophys. Res., 105, 2259–2267, 2000.
Beard, K. V.: Simple altitude adjustments to raindrop velocities for Doppler radar analysis, J. Atmos. Ocean. Tech., 2, 468–471, 1985.
Bringi, V. N., Chandrasekar, V., Hubbert, J., Gorgucci, E., Randeu, W. L., and Schoenhuber, M.: Raindrop size distribution in different climatic regimes from disdrometer and dual-polarized radar analysis, J. Atmos. Sci., 60, 354–365, 2003.
Cao, Q., Zhang, G., Brandes, E., Schuur, T., Ryzhkov, A., and Ikeda, K.: Analysis of Video Disdrometer and Polarimetric Radar Data to Characterize Rain Microphysics in Oklahoma, J. Appl. Meteor. Climatol., 47, 2238–2255, 2008.
Caracciolo, C., Prodi, F., Battaglia, A., and Porcu, F.: Analysis of the moments and parameters of a gamma DSD to infer precipitation properties: a convective stratiform discrimination algorithm, Atmos. Res., 80, 165–186, 2006.
Cifelli, R., Williams, C. R., Rajopadhyaya, D. K., Avery, S. K., Gage, K. S., and May, P. T.: Drop-size distribution characteristics in tropical mesoscale convective systems, J. Appl. Meteor., 39, 760–777, 2000.
Friedrich, K., Higgins, S., Masters, F. J., and Lopez, C. R.: Articulating and stationary Parsivel disdrometer measurements in conditions with strong winds and heavy rainfall, J. Atmos. Ocean. Tech., 30, 2063–2080, 2013.
GEAR: http://gear.pknu.ac.kr/, last access: 1 August 2017.
Jaffrain, J. and Berne, A.: Experimental quantification of the sampling uncertainty associated with measurements from PARSIVEL disdrometers, J. Hydrometeor., 12, 352–370, 2011.
Jameson, A. R. and Kostinski, A. B.: Fluctuation properties of precipitation. Part II: reconsideration of the meaning and measurement of raindrop size distributions, J. Atmos. Sci., 55, 283–294 1998.
Kim, D.-K. and Lee, D.-I.: Raindrop size distribution properties associated with vertical air motion in the stratiform region of a springtime rain event from 1290 MHz wind profiler, micro rain radar, and Parsivel disdrometer measurements, Meteorol. Appl., 23, 40–49, 2016.
Leary, C. A. and Houze Jr., R. A.: Melting and evaporation of hydrometeors in precipitation from the anvil clouds of deep tropical convection, J. Atmos. Sci., 36, 669–679, 1979.
Löffler-Mang, M. and Joss, J.: An optical disdrometer for measuring size and velocity of hydrometeors, J. Atmos. Ocean. Tech., 17, 130–139, 2000.
Niu, S., Jia, X., Sang, J., Liu, X., Lu, C., and Liu, Y.: Distributions of raindrop sizes and fall velocities in a semiarid plateau climate: Convective versus stratiform rains, J. Appl. Meteor. Climatol., 49, 632–645, 2010.
Testud, J., Oury, S., Amayenc, P., and Black, R. A.: The concept of “normalized” distributions to describe raindrop spectra: A tool for cloud physics and cloud remote sensing, J. Appl. Meteor., 40, 1118–1140, 2001.
Thompson, E. J., Rutledge, S. A., Dolan, B., and Thurai, M.: Drop size distributions and radar observations of convective and stratiform rain over the equatorial Indian and west Pacific Oceans, J. Atmos. Sci., 72, 4091–4125, 2015.
Thurai, M., Petersen, W. A., Tokay, A., Schultz, C., and Gatlin, P.: Drop size distribution comparisons between Parsivel and 2-D video disdrometers, Adv. Geosci., 30, 3–9, https://doi.org/10.5194/adgeo-30-3-2011, 2011.
Thurai, M., Bringi, V. N., Carey, L. D., Gatlin, P., Schultz, E., and Petersen, W. A.: Estimating the accuracy of polarimetric radar–based retrievals of drop-size distribution parameters and rain rate: an application of error variance separation using radar-derived spatial correlations, J. Hydrometeor., 13, 1066–1079, 2012.
Thurai, M., Gatlin, P. N., and Bringi, V. N.: Separating stratiform and convective rain types based on the drop size distribution characteristics using 2D video disdrometer data, Atmos. Res., 169, 416–423, 2016.
Tokay, A. and Short, D. A.: Evidence from Tropical raindrop spectra of the origin of rain from stratiform versus convective clouds, J. Appl. Meteor., 35, 355–371, 1996.
Tokay, A., Short, D. A., Williams, C. R., Ecklund, W. L., and Gage, K. S.: Tropical rainfall associated with convective and stratiform clouds: Intercomparison of disdrometer and profiler measurements, J. Appl. Meteor., 38, 302–320, 1999.
Tokay, A., Hartmann, P., Battaglia, A., Gage, K. S., Clark, W. L., and Williams, C. R.: A field study of reflectivity and Z–R relations using vertically pointing radars and disdrometers, J. Atmos. Ocean. Tech., 26, 1120–1134, 2009.
Tokay, A., Petersen, W. A., Gatlin, P., and Wingo, M.: Comparison of raindrop size distribution measurements by collocated disdrometers, J. Atmos. Ocean. Tech., 30, 1672–1690, 2013.
Tokay, A., Wolff, D. B., and Petersen, W. A.: Evaluation of the new version of the laser-optical disdrometer, OTT Parsivel2, J. Atmos. Ocean. Tech., 31, 1276–1288, 2014.
Ulbrich, C. W.: Algorithms for determination of rainfall integral parameters using reflectivity factor and mean doppler fall speed at vertical incidence, J. Atmos. Ocean. Tech., 9, 120–128, 1992.
Ulbrich, C. W. and Atlas, D.: On the separation of tropical convective and stratiform rains, J. Appl. Meteor. Climatol., 41, 188–195, 2002.
Williams, C. R., Ecklund, W. L., and Gage, K. S.: Classification of precipitating clouds in the tropics using 915-MHz wind profilers, J. Atmos. Ocean. Tech., 12, 996–1012, 1995.
Williams, C. R., Kruger, A., Gage, K. S., Tokay, A., Cifelli, R. C., Krajewski, W. F., and Kummerow, C.: Comparison of simultaneous rain drop size distributions estimated from two surface disdrometers and a UHF profiler, Geophys. Res. Lett., 27, 1763–1766, 2000.