the Creative Commons Attribution 4.0 License.
the Creative Commons Attribution 4.0 License.
 | 11 Jul 2018
Inter-channel uniformity of a microwave sounder in space
Martin Burgdorf
Imke Hans
Marc Prange
Theresa Lang
Stefan A. Buehler
We analyzed intrusions of the Moon in the deep space view of the Advanced Microwave Sounding Unit-B on the NOAA-16 satellite and found no significant discrepancies in the signals from the different sounding channels between 2001 and 2008. However, earlier investigations had detected biases of up to 10 K, by using simultaneous nadir overpasses of NOAA-16 with other satellites. These discrepancies in the observations of Earth scenes cannot be due to non-linearity of the receiver or contamination of the deep space view without affecting the signal from the Moon as well. As neither major anomalies of the on-board calibration target nor the local oscillator were present, we consider radio frequency interference in combination with a strongly decreasing gain the most obvious reason for the degrading photometric stability. By means of the chosen example we demonstrate the usefulness of the Moon for investigations of the performance of microwave sounders in flight.
- Article
(2406 KB) - Full-text XML
- BibTeX
- EndNote


Photometric stability of the measurement devices is an indispensable prerequisite for a reliable characterization of global change in atmospheric properties. This basic rule is particularly valid for space-based instruments, because they cannot be checked in the laboratory again once the operational phase has begun. Microwave sounders thus take advantage of an on-board calibration target (OBCT) for updating the flux calibration in intervals of a few seconds. Nevertheless, systematic errors can creep in from slowly changing instrumental properties that cannot be detected with the generally employed two-point calibration, for example non-linearity. In order to first characterize and then reduce these errors in the case of AMSU-A (Advanced Microwave Sounding Unit-A), Zou and Wang (2011) determined time-dependent calibration offsets and nonlinear coefficients from simultaneous nadir overpass (SNO) regressions, which resulted in more consistent multi-satellite radiance observations for all respective channels. However, SNOs and other inter-calibration methods that rely exclusively on the comparison of two space instruments without a third source of information about the Earth scenes, can, as a matter of principle, never remove all spurious trends in the data, because they cannot identify the relative contributions of either instrument to offsets and drifts.
At first glance it seems impossible to transfer the method developed by Zou and Wang (2011) to the sounding channels of AMSU-B (channels 18–20), because their departure from linearity was proven to be smaller than 0.1 K and basically independent of instrument temperature in ground tests (Saunders et al., 1995b). As a consequence the nonlinear coefficient for the sounding channels was supposed to be insignificant and set to zero in the calibration files used by AAPP (ATOVS, Advanced TIROS-N, Television and InfraRed Observation Satellite, Operational Vertical Sounder, and AVHRR, Advanced Very High Resolution Radiometer, Pre-processing Package) for AMSU-B on all platforms. Nevertheless, there were considerable biases between the sounding channels of AMSU-B on NOAA-16 and those on other satellites, especially towards the end of its lifetime (Hanlon and Ingram, 2015; John et al., 2012) and particularly pronounced with channel 20. In this work we investigate why the flux calibration of the different channels seemed to diverge with time by using the radiation from the Moon when entering the deep space view (DSV) as a third reference flux, in addition to the cosmic microwave background (CMB) and the OBCT. We concentrate on the three sounding channels, because they are the scientifically most important ones, characterizing the 183.3 GHz line of water vapour, and at the same time apparently the worst in respect to stability.
As the Moon fills only a fraction of the beam, it is particularly well suited to detect effects, the impact of which grows with decreasing scene flux. On top of that its microwave spectrum differs considerably from Earth's, for it is featureless and varies little with wavelength (Mangum, 1993). This means that all channels with the same central frequency, i.e. the three sounding channels, must produce the same brightness temperature when observing the Moon (apart from a very small band correction). With this approach, it seemed feasible to throw additional light on the origin of the biases of AMSU-B on NOAA-16, which have defied explanation until now.
2.1 Selection of Moon intrusions
As the different sounding channels of AMSU-B observe at the same time with the same centre frequency and in the same direction, there is no need to know the brightness temperature of the Moon for studies of the inter-channel uniformity, for every channel gets the same flux. However, it is advantageous to select those intrusions where the Moon comes closest to the centre of the beam. This is not only because one gets the strongest signal with this alignment, but also because the “light curve”, i.e. the measured brightness temperature as a function of time, resembles most closely a Gaussian in this case, making it easy to determine its maximum value without introducing systematic errors from the fit. The minimum distance between the pointing direction of each DSV and the Moon can be calculated for each orbit with AAPP, providing the information needed to identify candidates for further investigation. We concentrated our search on the years 2001, 2004, 2006, and 2007, thus increasing the density of observations at the start of the mission and the period of the emerging bias pattern. Beginning with the year 2007, the decreasing signal-to-noise ratio started to affect the accuracy of the photometric measurements (Hans et al., 2017).

Figure 1(a) Light curves of the Moon obtained from the four AMSU-B deep space views (pixels) on 2 November 2006. (b) Observing geometry projected to the sky: the axis of the orbit of the satellite is marked with a plus sign. is its angular distance from DSV 4, shown as a filled, green circle. The pointing direction of the instrument describes a great circle in the sky during one scan, which covers all four deep space views and then continues along the large, red arrow. From one scan to the next, all DSVs move by a small amount along the large circles in the orientation of the small red arrow. The yellow arrow gives an example of the trajectory of the Moon. DSV 2 came closest and thus gave the highest signal in its light curve. DSV 4 was too far away from the Moon to be affected by its presence. From the ratio of the maximum signals in DSV 1 and DSV 3 one can calculate how far the Moon is away from DSV 2. This distance is zero if and only if the counts from DSV 1 and DSV 3 are the same. The completion of the circles that each DSV describes in the sky takes 100 min, the duration of the orbit of the satellite. This is fast compared to the movement of the Moon (synodic month 29.5 days) and the movement of the orbital axis of the satellite with a period of one year (blue arrow).
2.2 Analysis
We fit the light curves of the Moon, which are sampled once per scan, with a Gaussian. The fit is achieved by optimizing three parameters: the maximum number of counts a, the centroid (location) μ, and the peak width σ. Each of these parameters provides information about a different property of the instrument: gain, pointing direction in the along-track direction, and beam size in the along-track direction. If the Moon appears in three DSVs at the same time, it is possible to fit a Gaussian through the maximum signal of each of them and thus to obtain information about the beam pattern in the across-track direction as well, see Fig. 1. Obviously the Moon produces a signal in all frequency channels, but the signal-to-noise ratio varies considerably among the different channels.
For an investigation of photometric stability and uniformity the value of a and the minimum distance of the Moon to the pointing direction of the DSVs need to be known. This is because a is a function of this distance and the beam pattern.
2.2.1 Position of the beam
AAPP calculates the lunar angles for each scan and all four DSVs and writes part of this information in the level 1b file. Therefore, it is possible to identify the smallest lunar angle for each DSV. Unfortunately the calculation with AAPP is subject of several uncertainties.
-
The error in the moon calculation is at worst 0.3∘ (MHS L1 PGS, 2013). This value has been confirmed by the analysis of Moon intrusions in Burgdorf et al. (2016). It is caused by incomplete knowledge of the alignment of the satellite; the position of the Moon is known with very high accuracy.
-
Misalignment of the quasi-optics or feedhorns would be likely to produce effects on Channels 18, 19, and 20 which share the same path to the receiver (McLellan, 1998). Such a misalignment could have been caused by vibrations during launch and is difficult to detect during flight, as ground control points cannot be used with the sounding channels. So for the utilization period of AMSU-B on NOAA-16, no geolocation correction is performed on data from MW instruments aboard the NOAA satellites (Moradi et al., 2011).
-
The position of the warmest spot on the lunar surface varies with phase and is in general not in the centre. Given the fact that the Moon can only appear with phases ±75∘ around full Moon in the DSV (Burgdorf et al., 2016), its temperature maximum cannot be off centre by more than half of the Moon's apparent radius, i.e. ≈ 0.1∘ (Coates, 1961).
For these reasons one cannot rely on the calculation with AAPP to determine the lunar angles of the different Moon intrusions. Instead the point of maximum signal was first identified in the along-track direction from the light curve in each DSV (Fig. 1). Then we determined the point of maximum signal in the across-track direction, i.e. in the scan plane, by fitting a Gaussian to the maximum signal ai from each DSV, . This procedure requires a detection of the Moon with a good signal-to-noise ratio in three DSVs, as shown in Fig. 1, as the fitting procedure uses three independent parameters. The value for μ obtained this way was multiplied by the difference in θ between two neighbouring DSVs, which is 1.1∘, and then compared to the value calculated with AAPP in Table 1. These new lunar angles formed the basis for the final selection of intrusion events from the provisional shortlist based on the less accurate values calculated with AAPP (see Sect. 2.1). If the lunar angle is close to zero for a certain DSV, the adjacent DSVs produce light curves with a good signal-to-noise ratio as well, because they are only one beam diameter away. However, in cases where the Moon falls exactly in between two DSVs, the Moon is barely detectable in the other DSVs. Such intrusions happen only a few times per year and satellite, and are less useful for our purpose, because the Moon gives less signal when off centre of the FOV.
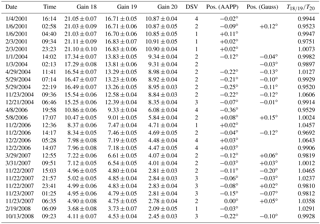
Table 1Results from Gaussian fits to the light curves of Moon intrusions in DSVs of AMSU-B on NOAA-16. Columns 1 and 2: date and time of occurrence of smallest lunar angle. Columns 3–5: gain in counts K−1. Column 6: number of DSV pixel closest to the Moon. Column 7: minimum lunar angle as calculated with AAPP. Column 8: minimum lunar angle as calculated from maximum signal in each DSV. Column 9: ratio of brightness temperatures in channels 18, 19 (averaged), and channel 20.
Given the fact that both the satellite and the reflector are constantly in motion, the image of the Moon is actually smeared over a certain region of the field of view. As a result, the signal is somewhat altered compared to the case where the Moon would remain at the same spot. However, as this “smear effect” is the same for all channels, it does not affect the ratio of the signal in different channels. The identification of the smallest lunar angles relies on the ratio of signals in different DSVs and is thus independent of the smear effect as well. Hence we did not characterize its size or impact on each signal.
2.2.2 Brightness temperatures
The value for a from the second Gauss fit now gives the number of counts the Moon would have provided, if it had been in the centre of the DSV, and it was used, after division by the gain, to calculate the ratios of the brightness temperatures in channels 18, 19, and 20 (last column in Table 1). The values from channels 18 and 19 were averaged in order to reduce the noise in the reference, to which channel 20, the one with the highest bias (see Sect. 1), is compared. In cases where the Moon could only be detected in two DSVs, we used the brightness temperatures as measured in the DSV that came closest to the Moon. This method was only applied, when we could conclude from the relative strengths of the signals in the two DSVs, where the Moon appeared, that the lunar angle must have been very small (< 0.2∘) in one of them. This way the impact of pointing uncertainties on the signal from the Moon is kept as small as possible. However, our values do not represent the actual temperature of the Moon, because we did not correct for the fact that it does not fill the beam.
This calculation ignores the cold space correction factors, i.e. the correction for Earth and platform radiation entering through the side lobes, but they should be the same for each sounding channel, because they use the same quasi-optic feed, and thus cancel out in the ratios of the signals that we consider here. The same is true for the warm load correction factors, which according to AAPP differ among the sounding channels only for AMSU-B on NOAA-17. The effect of the band correction that allows for the fact that the sounding channels receive slightly different fluxes because of their side bands being at different distances from 183.311 GHz was ignored, because it amounts to less than 2 ‰ and does not change with time.
2.2.3 Beam pattern
An important characteristic of the beam, namely its full width at half maximum, follows immediately from the peak width of the Gauss fit, which is related to the full width half maximum via . In the across-track direction the Moon can only be detected in three DSVs with sufficient signal-to-noise ratio, and the smear effect alters the measured beam shape. Therefore, it is less accurate than the one measured in the along-track direction, where the FWHM of the beam can be determined from light curves with dozens of points representing an almost perfect Gaussian. Random samples showed no deviations ≥ 0.15∘ from the nominal value of 1.1∘ for the FWHM of the beam.
2.3 Inter-band calibration (18–20)
As the brightness temperature of the disk-integrated Moon as seen by the microwave sounders is always more than 200 K (Yang and Weng, 2016), the Rayleigh–Jeans approximation of Planck's law is applicable (the difference between the spectral radiances at 200 K and 183 GHz according to Planck and Rayleigh–Jeans amounts to 2 %.), and its spectral radiance is proportional to the product of temperature and frequency squared. This means that the maximum signal from a Moon intrusion in counts, divided by the gain, should be in good approximation the same for all sounding channels. However, differences might be caused by the following two effects.
-
Incorrect gain values. The uncertainty associated with the gain has been calculated for the time of each Moon intrusion and is included in Table 1. The gain value assigned to the time of the Moon intrusion was obtained from interpolating the mean values a short time before and after the intrusion. The uncertainty of this gain value was then estimated from the variation of the gain values before and after the intrusion. We note that any error in the temperature of DSV and OBCT that was used in determining the gain cancels out in the following calculations, because we only consider ratios between the channels.
-
Imperfect co-registration of the channels. The Moon comes closer to the pointing direction of one channel than the pointing direction of another. However, this is unlikely as all sounding channels share the same path to the receiver (see Sect. 2.2.1). The difference in signal between a lunar angle of 0.05∘ and one of 0.15∘ – more than what was found for uncorrelated channels by Bonsignori (2018) – is only 1 %, assuming a Gaussian light curve and a FWHM of the beam of 1.1∘. Therefore, we consider this effect negligible.
A common misalignment of channels is irrelevant for our analysis, because it affects all signals in the same way and thus cancels out in their ratios. For the same reason an error in frequency would be negligible, because the brightness temperature of the Moon changes very little with frequency, and the local oscillator is the same for all sounding channels (Saunders, 1995a). Thus it should be possible to verify the stability of the gain ratio between different sounding channels, i.e. their inter-band calibration, with an accuracy that is essentially limited by the uncertainties of the gain and the parameters of the Gaussian fit.
2.4 Results
2.4.1 Uniformity of flux calibration
The average ratio between the signals obtained in channels 18, 19, and 20 is 1.001 ± 0.006 for all observations in Table 1 combined. It is 0.993 ± 0.008 for the twelve values from the years 2001 and 2004 and 1.007 ± 0.008 for the later Moon intrusions. Within the calculated uncertainties these figures are in agreement with the values derived by John et al. (2012) and Hanlon and Ingram (2015) from simultaneous nadir overpasses. The uncertainties were determined from the distribution of the measured values, i.e. they include contributions from the noise in each sounding channel.
2.4.2 Across-track pointing accuracy
For a comparison of the pointing directions of DSVs two and three in the across-track direction, as calculated with AAPP (min moon angle) and with the aid of a Gauss fit (see Sect. 2.2.1), we now consider only the years 2001 and 2004, because the noise was lowest in the beginning of the mission. We find a difference of −0.113∘ ± 0.019∘, i.e. the DSV direction determined with the Gauss fit leads the one calculated with AAPP by about 0.1∘ in the scan direction. The systematic error in the absolute pointing direction of the sounding channels of AMSU-B on NOAA-16 lies well below the upper limit of the overall, i.e. across- and along-track, pointing error of 0.2∘ for channel 16 that was given by Atkinson (2000b).
The above mentioned smear effect can cause a pointing error, because the Moon moves a short distance through the field of view during the finite duration of the measurement. However, the same effect is present with observations of Earth scenes, hence the pointing positions derived from the intrusions of the Moon in the DSV are more relevant than those calculated with AAPP.
2.5 Discussion
In the following, we rule out possible reasons for the trends found by John et al. (2012) and others in the sounding channels of AMSU-B on NOAA-16 with the aid of the results obtained from our analysis of the Moon intrusions. We start with the measurement equation for microwave sounders, as it is usually found in the literature (Labrot et al., 2011; MHS L1 PGS, 2013; Weng and Yang, 2016):
The elements of these equations are defined as follows:
-
Rs = Earth scene radiance;
-
Rw = warm calibration target radiance;
-
Rc = cold space radiance;
-
Cs = Earth scene counts;
-
= warm target calibration measurement counts, averaged over four pixels and seven scans;
-
= cold space calibration measurement counts, averaged over four pixels and seven scans;
-
Q = non-linear term;
-
u = non-linearity coefficient;
-
ΔR = correction due to non-unity antenna reflectivity;
-
α=1 – ;
-
= reflectivity of antenna for electric field parallel to the plane of incidence;
-
= reflectivity of antenna for electric field perpendicular to the plane of incidence;
-
θs = position of antenna for Earth scene relative to nadir;
-
θc = position of antenna for cold space relative to nadir.
In the following, we discuss the uncertainties belonging to each term in the measurement equation and decide which ones could have caused the bias trends on the basis of the complete picture of the behaviour of the instrument in flight. To simplify matters we assume that a difference of flux density expressed in K is proportional to the corresponding difference in W m−2 Hz−1, i.e. the Rayleigh–Jeans approximation is applicable (see Sect. 2.3).
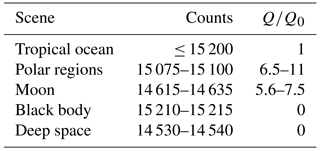
Table 2The range of relative values of the non-linearity term Q in the measurement equation for different scenes. The counts are from channel 20 in different orbits with Moon intrusions from the year 2008. Q0 is the non-linearity correction for observations over tropical ocean.
2.5.1 Non-linearity
The non-linearity correction coefficient is zero for
all sounding channels of all AMSU-B flight models at all reference
temperatures in the file of AMSU-B calibration parameters (amsub_clparams.dat, version 25) used by AAPP. In order to investigate
whether a non-linearity developed during the mission, we consider how the
corresponding bias would change as a function of scene temperature, bearing
in mind that
.
John et al. (2013a) find for Channel 20 (they call it Channel 5) of AMSU-B on
NOAA-16 a bias of about 3 K in the year 2008 relative to AMSU-B on NOAA-15,
which is mainly due to an anomalous decreasing trend of unknown origin for
N16. This bias is independent of the natural target chosen for the Earth
scene, Antarctica or tropical oceans. Similar phenomena with AMSU-A were
corrected by postulating a modified, time dependent u (Zou and Wang, 2011). However, the
values in Table 2 demonstrate that the bias should
be between 6 and 11 times larger in observations of polar regions and
between 5 and 8 times larger in observations of the Moon than when
derived from data collected over warm bodies of water, if it was due to
non-linearity with AMSU-B as well. The reason is that the effect of the
non-linearity on the calculated radiance becomes very small for scene
temperatures close to those of the black body or the cosmic microwave
background. The brightness temperature of the atmosphere in Channel 20 is of
course subject to variations, and the difference between the counts from
black body and deep space is rather small because of the instrument gain
degradation. However, when we allow an uncertainty of a factor of 2 in its
difference to the temperature of the black body, the spread of values of Q
for the different scenes in Table 2 is incompatible with the
observation that the biases depend very little on radiance. Non-linearity can
thus be ruled out as an explanation for the inter-channel trends.
2.5.2 Cold space temperature bias correction
The cold space temperature bias correction δTc,ch is for a given DSV, the same for all sounding channels of AMSU-B on NOAA-16 in the file of calibration parameters (version 25) used by AAPP. It varies between 1.09 and 1.26 K (Atkinson, 2000b) among the four possible DSV directions. In order to investigate whether the cold space temperature bias changed during the mission, we consider how its impact varies with scene temperature, bearing in mind that in first approximation, i.e. neglecting the non-linearity term, . We make use of the same reasoning as in Sect. 2.5.1 by constructing a contradiction between expected and observed variation of the bias with scene brightness.
Table 3The range of relative values of the cold space bias correction δT in the measurement equation for different scenes. The counts are from channel 20 in different orbits with Moon intrusions from the year 2008. δT is the change in the calculated scene temperature due to the cold space temperature bias correction, where the subscript 0 indicates the value for observations over tropical ocean.
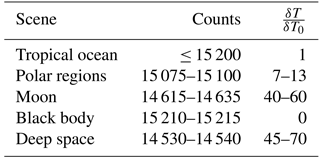
The values in Table 3 demonstrate that the bias should be up to 60 times larger in observations of the Moon than when derived from data collected over warm bodies of water. The reason is that the effect of the cold space temperature bias on the calculated radiance is largest for scene temperatures close to those of the cosmic microwave background. Even when the bias in Channel 20 were only 1 K, a lower limit in view of the variations reported by John et al. (2013a), it would amount to an error of 40–60 K in the combined signal from Moon and CMB in the DSV. The actual error is about an order of magnitude smaller (Burgdorf et al., 2016), hence cold space temperature bias can be ruled out as an explanation for the inter-channel trends as well.
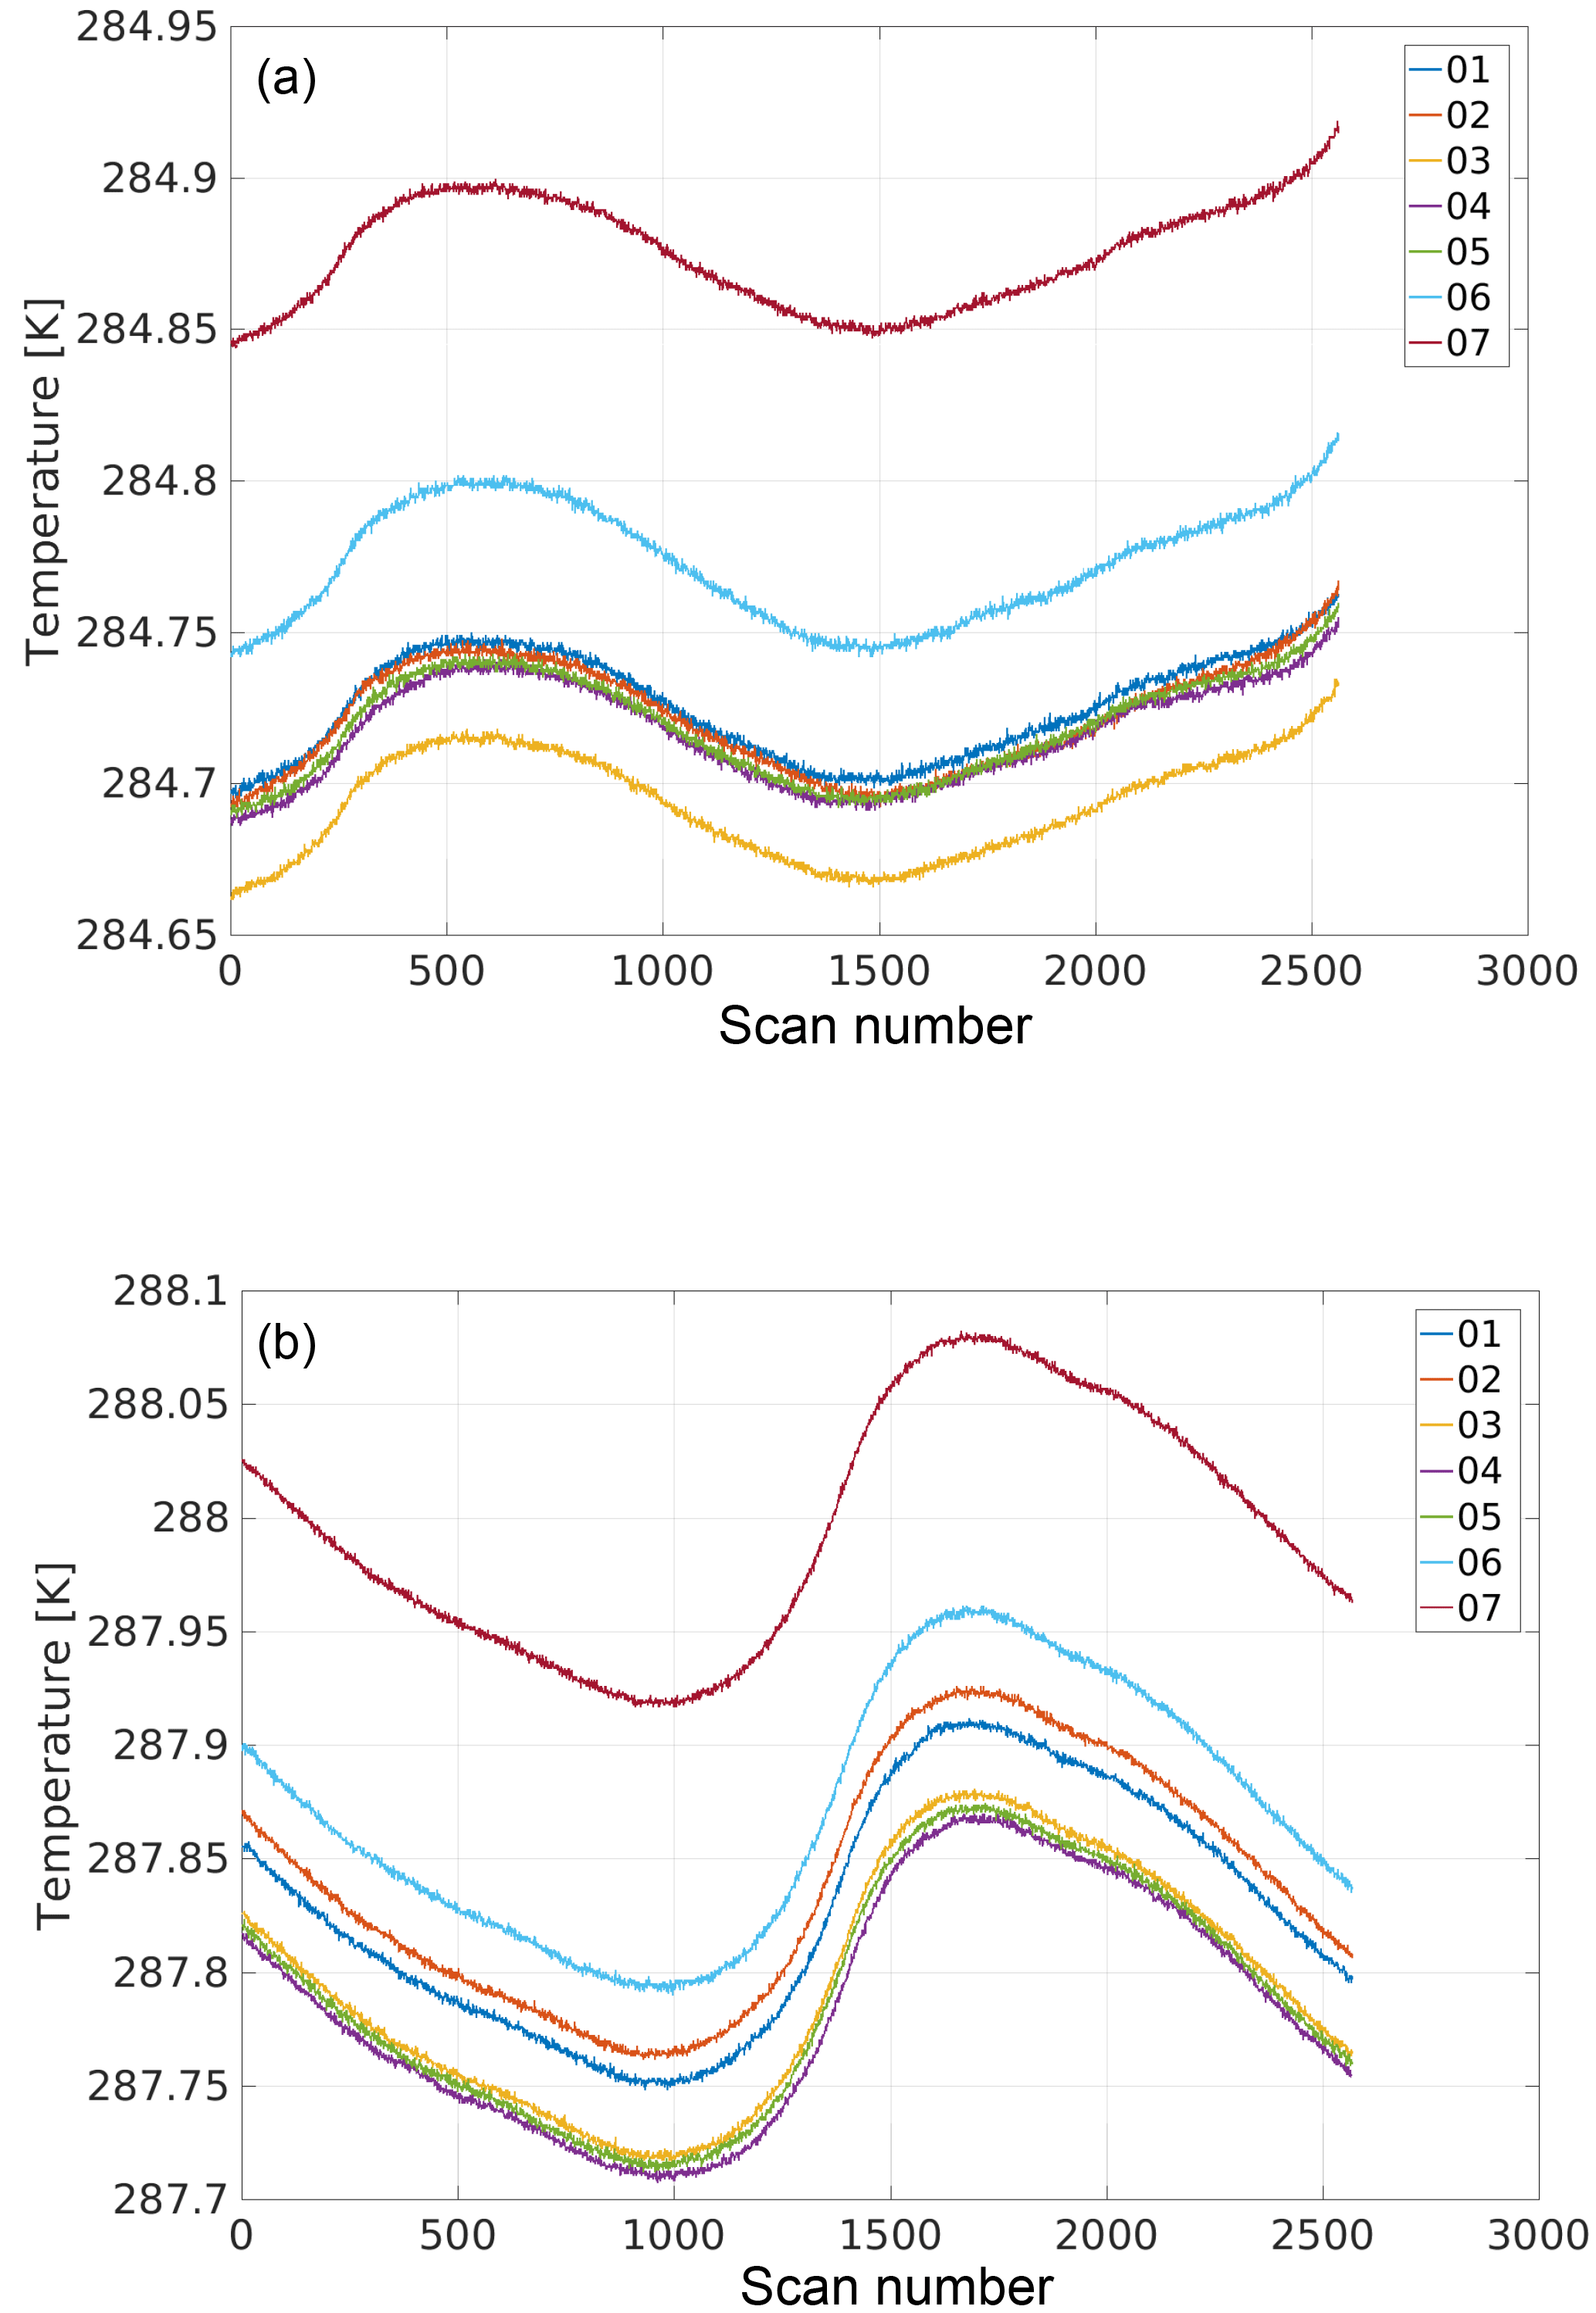
Figure 2Temperature measured by seven PRTs of the black body of AMSU-B on board NOAA-16 during two orbits 10 years apart: 12 February 2001 (a) and 30 July 2011 (b).
2.5.3 Warm target bias correction
The warm target bias correction δTbb,ch is zero for all sounding channels of all AMSU-B flight models at all reference temperatures in the file of AMSU-B calibration parameters (version 25) used by AAPP, except for channel 20 on FM3, where it is −0.16 K. Here the situation is the opposite of the previous case insofar as the warm target bias affects the measurements less for lower scene temperatures. This is intuitively clear and follows from the fact that the second term of the sum on the right side of the measurement equation is negative for . The Moon intrusions do therefore not help to characterize effects originating in the black body. A warm target bias correction for channel 20 about 10 times as large as the biggest value used by AAPP for any flight model would be needed. On top of that the correction for the other sounding channels, where the bias is different or not existent, would have to have opposite sign or be zero. While this possibility cannot be ruled out completely, it seems highly unlikely, especially given the fact that the platinum resistance thermometers (PRTs) on the black body of the instrument in question gave no hint at dramatic alterations to the temperature pattern of the black body; see Fig. 2 and for a discussion of temperature drifts Hans et al. (2017).
2.5.4 Non-unity antenna reflectivity
Another effect that cannot be characterized with Moon intrusions is the emission of the main reflector and the variation of its contribution to the antenna temperatures as it rotates during a scan. According to Eq. (3) a correction to the measured radiance is required that is proportional to trigonometric functions of the distance of the rotating reflector from nadir position and α. Its value for Earth scenes is quite different than the one for observations of the Moon, because of the different position of the reflector in either case. However, in the first approximation, it must be the same for all sounding channels, because they all operate at the same centre frequency of 183 GHz and should therefore have very similar values for α. The values found in the relevant calibration file from AAPP for MHS are at 183 GHz and at 190 GHz. The sign must be the same for all channels of AMSU-B, because they have the same polarization. Hence the maximum difference the non-unity antenna reflectivity can make among the sounding channels is , a negligible amount.
2.5.5 Shift of channel centre frequencies
Having discussed the main sources of error in the flux calibration we turn our attention to drifts of channel frequencies as a possible explanation of the bias that channel 20 exhibits when observing Earth scenes. (A change of centre frequency would make no difference to the Moon observations, see Sect. 2.3). An accurate value of B(ν+δν), i.e. the impact of a change in frequency on the measured flux, is difficult to calculate for channels 18 and 19, because the exact shape of the water vapour absorption line depends on the state of the atmosphere. However, it is possible to give at least an estimate of the shift in frequency required to change the measured radiance by 0.4 %, i.e. causing an error of about 1 K, for channel 20 because this one probes the well-characterized wings of the line profile (Bobryshev et al., 2018). It amounts to 3.5 GHz. This value is 50 times larger than the specification for frequency stability (Atkinson, 2001). As all sounding channels use the same local oscillator, the same frequency shift would apply to channel 18 with 10 times the effect on radiance. However, such an enormous bias is not observed.
2.5.6 Radio-frequency interference on NOAA-16
As we found no fault with the calibration of AMSU-B on NOAA-16, we searched for instrumental effects that could alter the counts used as input of the calibration process. Malfunction of the processing electronics can be ruled out, because the data from all channels are clocked into the same AMSU instrument processor. However, there is another phenomenon with the potential to strongly affect the counts, namely radio-frequency interference (RFI). The bias it causes can be positive or negative and depends on channel, scan angle, and the transmitter in use. It was demonstrated in ground tests that AMSU-B on NOAA-16 was susceptible in all channels to radiation of the spacecraft transmitters. The strongest effects were observed with channel 19 at the SARR (Search And Rescue Repeater) frequency, with channel 16 at the SARR frequency, and with channel 17 at the STX-1 (S-Band Transmitter #1, 1698 MHz) frequency (Ricketts and Atkinson, 1999). Modifications of the instrument, e.g. wrapping cables with electrically conductive aluminum tape, were carried out as a consequence of the problems encountered with AMSU-B on NOAA-15 and reduced this susceptibility by 1–2 orders of magnitude. From the NOAA-16 post launch orbital verification tests it was estimated that the remaining Earth view biases, though difficult to quantify, were within ±0.5 K when the transmitter is active (Atkinson, 2000a). However, Channel 17 produced even after launch a bias of 1.2 K for the space view due to interference with the STX-2 omni-directional antenna. Additionally, during the lifetime of the satellite the gain of the sounding channels decreased tremendously (see Table 1 and Hans et al., 2017). A reduced gain produces a reduced signal, which means that interference becomes relatively more important, as described by John et al. (2013b). The overall reduction of signal during the mission lifetime due to gain degradation, a factor of 6 for channel 19 between 2001 and 2010, could boost a bias of 0.5 K pre-launch up to 3 K and more during flight. Therefore, we conjecture that individual interference events caused a bigger and bigger bias over the years, but at the same time the noise equivalent difference in temperature (NEΔT) increased, making them still difficult to detect. We know from the experience with NOAA-15 that interference effects can be quite different for Earth and space views, hence RFI could be absent in the observations of the Moon while still affecting Cs.
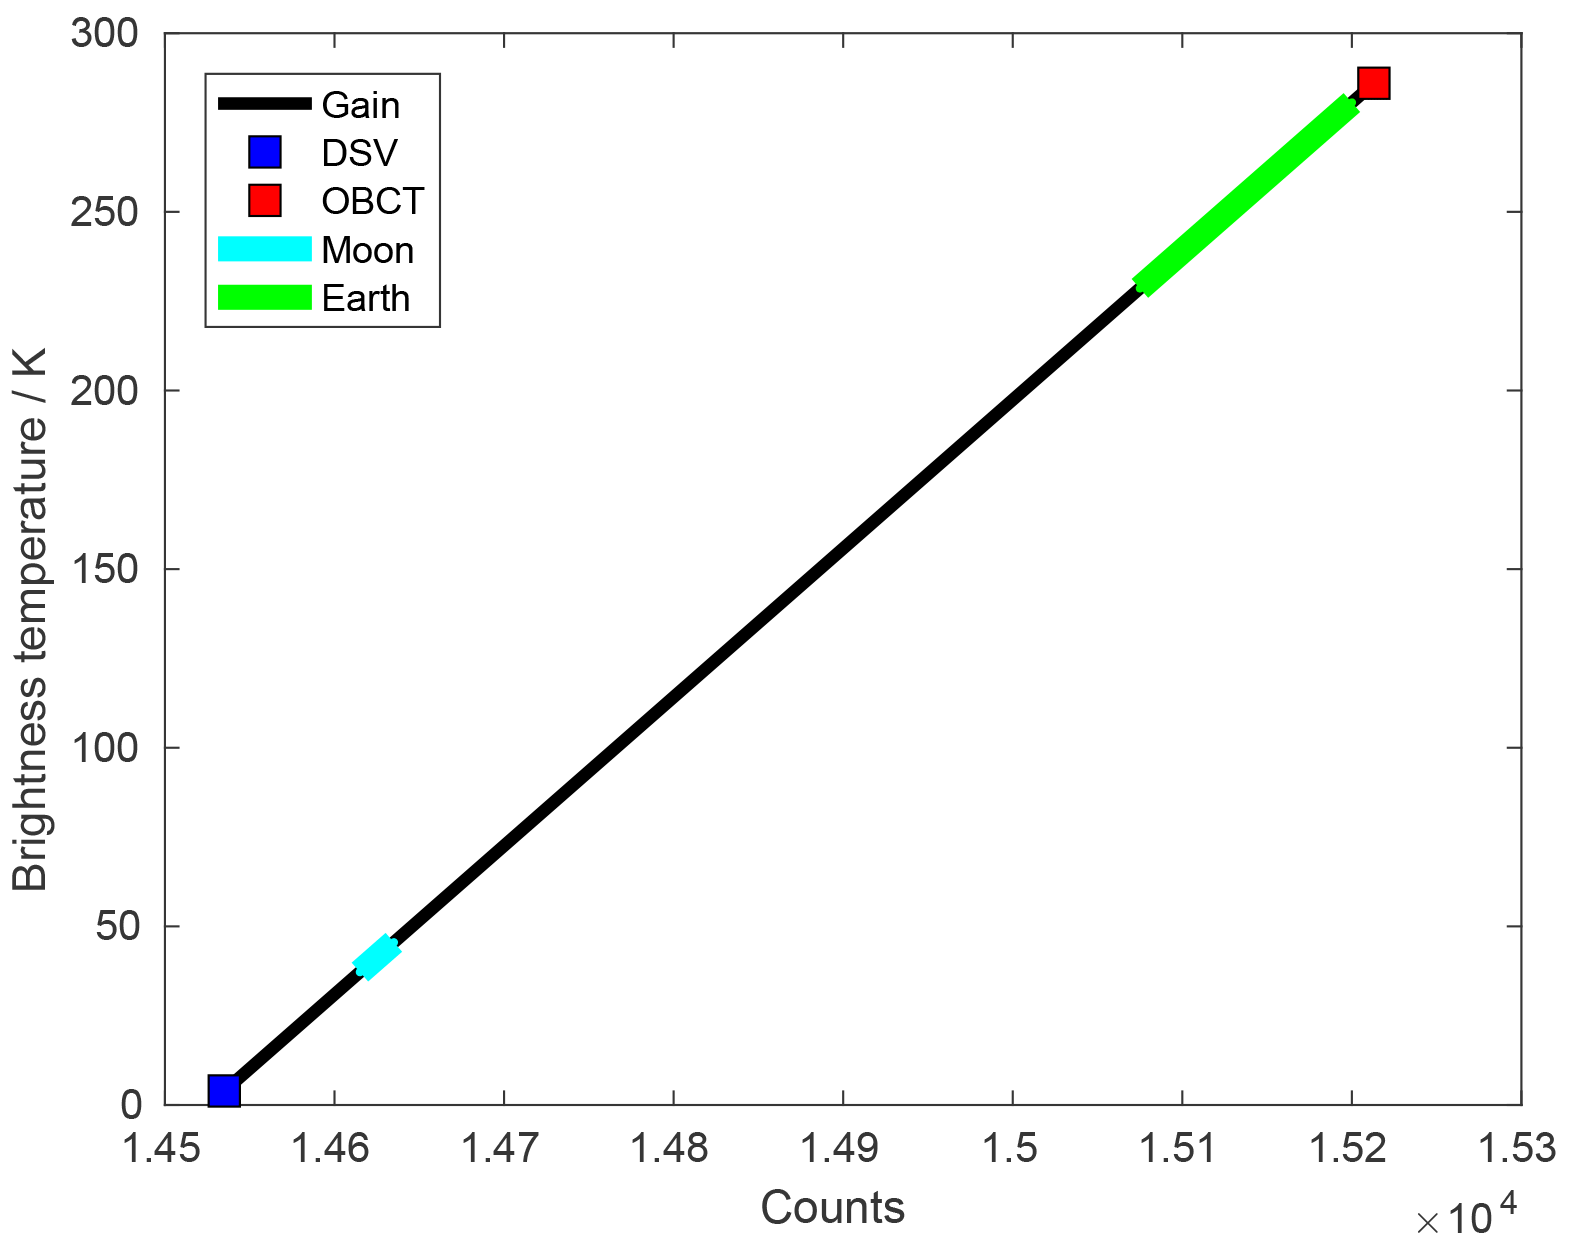
Figure 3Schematic representation of the signal range in counts and brightness temperature covered by deep space, Moon scenes, Earth scenes, and internal calibration target for channel 20 of AMSU-B on NOAA-16 in October 2008. A gain of 2.4 counts K−1 was assumed. The Moon gives a much lower signal than the Earth, because it fills only a fraction of the beam.
We have demonstrated that intrusions of the Moon in the DSV can be used to obtain otherwise inaccessible information about the characteristics of microwave sounders in flight. This is because the Moon provides a third flux reference, in addition to the CMB and the OBCT, with a spectrum that closely resembles a black body. This property makes it particularly suited for checks of the uniformity of sounding channels, where vicarious calibration is not an option. Another characteristic of the Moon is that it fills only a fraction of the beams of past and present microwave sounders and therefore provides a flux level much lower than Earth scene and OBCT (see Fig. 3). As a consequence, the Moon becomes a unique diagnostic tool for checking the cold space temperature bias correction and, in case of insufficient or missing SNOs, non-linearity. Such characterization of instrumental effects is essential for calculating uncertainties and harmonization coefficients of fundamental climate data records, as undertaken for example by the FIDUCEO project (FIDelity and Uncertainty of Climate data records from Earth Observations1).
In case of AMSU-B on NOAA-16 we found that the Moon signal from channel 20 agrees within 0.6 % with the average signal of channels 18 and 19. The following conclusions can be drawn.
-
The co-registration of the sounding channels is very good, and the beam solid angle of channel 20 is within 0.3 %, the same as the average beam solid angle of channels 18 and 19, else they could not have given the same value for a source much smaller than OBCT and DSV. This result was to be expected because of the common quasi-optic feed of all sounding channels with AMSU-B. However, the agreement among the sounding channels also proves that the Earth radiation entering the DSV pixels through the side lobes does not significantly alter the overall signal, because this radiation corresponds to different brightness temperatures in each channel. The scatter of the measured signal ratio can be fully explained by the uncertainties of the gain and the Gaussian fit.
-
We attribute the bias in the sounding channels of AMSU-B on NOAA-16 to a simple and well-known effect, namely radio frequency interference, by eliminating all other possible causes. Although this finding needs confirmation by a careful investigation of the interference in flight, we recommend excluding periods of active transmitters when calculating inter-calibration coefficients (Ferraro, 2015).
-
One type of bias identified by Zou and Wang (2011) with AMSU-A, namely inaccurate calibration non-linearity, was ruled out in our investigation of AMSU-B. This finding provides evidence that the approach taken in the FIDUCEO project of harmonizing AMSU-B and MHS with the help of simultaneous nadir overpasses is sound, because the calculation of time-dependent nonlinear coefficients in flight, which would render that method impractical, is unnecessary.
Our characterization of sounding channels in flight demonstrates the potential of using intrusions of the Moon in the DSV as diagnostic tool for AMSU-B. Still higher accuracy is possible with MHS because of its lower NEΔT. As MHS is equipped with a sounding channel at 190.3 GHz with its own quasi-optic feed and local oscillator, the co-registration, bias correction, etc. will be less uniform among the channels, making their characterization even more important. In order to include also the window channels in the kind of analysis we presented, the differences of the brightness temperature of the Moon between the different radio wavebands must be known. A model describing them with the required accuracy is not available and remains therefore a worthwhile task for the future.
The Moon came 304 times closer than 0.1∘ to the centre of a DSV of MHS on NOAA-18 between launch and 1 June 2018. This large number opens up the possibility to use the Moon as a reference for identifying the long-term stability of microwave sounders. For this purpose it will be advantageous to identify and to process the relevant level 1b data automatically. The essential steps of such a procedure are as follows.
-
Identify the Moon intrusions: this will be easy if the lunar angles are known (Octets 1473–1480 in the MHS level 1b files). All events where the Moon did not come closer than 0.4∘ to one of the DSVs and closer than 1.2∘ to at least one other DSV should be rejected.
-
For each intrusion detected in the previous step, a Gaussian should be fitted to the number of counts as a function of scan number for each DSV and channel. This requires removing the baseline counts, i.e. those that would be present without the Moon, e.g. with a polynomial fit to the counts in the scans before and after the Moon intrusion.
-
If the height of these Gaussians is significantly different from zero for three DSVs of each channel, then another Gaussian should be fitted to their amplitudes as a function of DSV number.
-
Finally the gain has to be calculated for each channel from the baseline counts and the counts obtained when viewing the OBCT. The amplitude of the Gaussian fit from the previous step then has to be divided by the gain.
However, due to occasional anomalies in the data it will always be necessary to inspect the Gaussian fits for outliers in the “light curves” and proper baseline removal.
We conclude with a description of the potential of the Moon for in-orbit verification of future microwave imagers like MWI (MicroWave Imager). For the channels with a smaller beam that are planned for these facilities, the method we described in this paper cannot be applied the same way, as the light curve will no longer have the shape of a Gaussian. This is because the finite size of the Moon and the asymmetric temperature distribution of its surface will become more relevant. A specially defined scan profile – in the ideal case a two-dimensional raster map with a step size of 0.1∘ as proposed by Bonsignori (2018) – will then be advantageous. It will enable measurements of the Moon's flux with much better signal-to-noise ratio, because it will fill a larger part of the beam, and it will provide several additional reference flux levels, because one can point at regions of the Moon with quite different temperatures. This way the non-linearity, to give just one example, can be characterized over a large flux range.
The level 1b data from AMSU-B presented in this manuscript are available from NOAA CLASS (Comprehensive Large Array-data Stewardship System).
IH investigated the gain and noise changes, MP investigated the stability of the OBCT and calculated, together with TL, the values in Table 1. SB contributed to the text and helped with the interpretation and presentation of the results. MB prepared the manuscript with contributions from all co-authors.
The authors declare that they have no conflict of interest.
These characterizations are part of the effort to quantify the uncertainty
budget for microwave sounders undertaken within the H2020 project, Fidelity
and Uncertainty in Climate-data records from Earth Observation (FIDUCEO).
FIDUCEO has received funding from the European Union's Horizon 2020 Programme
for Research and Innovation, under grant agreement no. 638822. Stefan A. Buehler
was partially supported by the Cluster of Excellence CliSAP (EXC177),
Universität Hamburg, funded through the DFG, by the German Federal Ministry
of Education and Research within the framework programme “Research for
Sustainable Development (FONA)”, under project HD(CP)2 (contracts O1LK1502B
and O1LK1505D), and by the DFG HALO research program (contract BU2253/3-1).
We are indebted to the referees, Christopher Merchant, and Roberto Bonsignori who noted
several errors and inaccuracies in the draft version of the manuscript and to
Oliver Lemke for contributing Fig. 1.
Edited by: S. Joseph Munchak
Reviewed by: Wesley Berg and Hu Yang
Atkinson, N. C.: AMSU-B EM Thermal Vacuum Test Report, EM, Met Office, Farnborough, 18 pp., 2000. a
Atkinson, N. C.: Performance of AMSU-B Flight Model 2 (FM2) during NOAA-L Post Launch Orbital Verification Tests, AMB112, Met Office, Farnborough, 24 pp., 2000. a, b
Atkinson, N. C.: Calibration, Monitoring and Validation of AMSU-B, Adv. Space Res., 28, 117–126, 2001. a
Bobryshev, O., Buehler, S. A., John, V. O., Brath, M., and Brogniez, H.: Is There Really a Closure Gap Between 183.31-GHz Satellite Passive Microwave and In Situ Radiosonde Water Vapor Measurements?, IEEE T. Geosci. Remote, 56, 2904–2910, 2018. a
Bonsignori, R.: In-orbit verification of microwave humidity sounder spectral channels coregistration using the moon, J. Appl. Remote Sens., 12, 025013, https://doi.org/10.1117/1.JRS.12.025013, 2018. a, b
Burgdorf, M., Buehler, S. A., Lang, T., Michel, S., and Hans, I.: The Moon as a photometric calibration standard for microwave sensors, Atmos. Meas. Tech., 9, 3467–3475, https://doi.org/10.5194/amt-9-3467-2016, 2016. a, b
Burgdorf, M., Lang, T., Michel, S., Buehler, S. A., and Hans, I.: The Moon as a diagnostic tool for microwave sensors, Gsics. Quarterly, 10, 4–5, 2016. a
Coates, R. J.: Lunar brightness variations with phase AT 4.3-mm wave length, Astrophys J., 133, 723–725, 1961. a
MHS L1 PGS (Level 1 Product Generation Specification), EUM.EPS.SYS.SPE.990006 v6, available at: https://www.eumetsat.int/website/home/Data/TechnicalDocuments/index.html (last access: 9 July 2018), 2013. a, b
Ferraro, R.: The Development of Advanced Microwave Sounding Unit-B (Amsu-B) and Microwave Humidity Sounder (MHS) Fundamental Climate Data Records (FCDR) for Hydrological Applications, DSR, CDR Program, 37 pp., 2015. a
Hanlon, H. and Ingram, W.: Fundamental Climate Data Record of Microwave Brightness Temperatures, CM-150, Eumetsat Satellite Application Facility on Climate Monitoring, 2015. a, b
Hans, I., Burgdorf, M., John, V. O., Mittaz, J., and Buehler, S. A.: Noise performance of microwave humidity sounders over their lifetime, Atmos. Meas. Tech., 10, 4927–4945, https://doi.org/10.5194/amt-10-4927-2017, 2017. a, b, c
John, V. O., Holl, G., Buehler, S. A., Candy, B., Saunders, R. W., and Parker, D. E.: Understanding intersatellite biases of microwave humidity sounders using global simultaneous nadir overpasses, J. Geophys. Res.-Atmos, 117, D02305, https://doi.org/10.1029/2011JD016349, 2012. a, b, c
John, V. O., Allan, R. P., Bell, W., Buehler, S. A., and Kottayil, A.: Assessment of intercalibration methods for satellite microwave humidity sounders, J. Geophys. Res.-Atmos., 118, 4906–4918, 2013. a, b
John, V. O., Holl, G., Atkinson, N., and Buehler, S. A.: Monitoring scan asymmetry of microwave humidity sounding channels using simultaneous all angle collocations, J. Geophys. Res.-Atmos., 118, 1–10, 2013. a
Labrot, T., Lavanant, L., Whyte, K., Atkinson, N., and Brunel, P.: AAPP Documentation Scientific Description, NWPSAF-MF-UD-001, Satellite Application Facility for Numerical Weather Prediction, 107 pp., 2011. a
Keihm, S. J.: A Lunar Calibration Model for the COBE DMR Experiment, Interoffice Memorandum, Jet Propulsion Laboratory, Pasadena, 1983.
McLellan, S.: Performance of AMSU-B Proto-Flight Model (PFM) during NOAA-K Post Launch Orbital Verification Tests, AMB106, Meteorological Office, Farnborough, 11 pp., 1998. a
Mangum, J. G.: Main-Beam Efficiency Measurements of the Caltech Submillimeter Observatory, Publ. Astron. Soc. Pac., 105, 117–122, 1993. a
Moradi, I., Meng, H., Ferraro, R. R., and Bilanow, S.: Geolocation and Scan Asymmetry Correction for NOAA POES Passive Microwave Instruments, IEEE T. Geosci. Remote, 51, 3625–3637, 2013. a
Ricketts, M. V. and Atkinson, N. C.: Pre-shipment EMC Susceptibility Tests for AMSU-B FM2 (August 1999), 6 pp., 1999. a
Saunders, R. W.: Results of AMSU-B Radiometric Characterisation Tests, Meteorological Office, Farnborough, 27 pp., 1995. a
Saunders, R. W., Hewison, T. J., Stringer, S. J., and Atkinson, N. C.: The Radiometric Characterization of AMSU-B, IEEE T. Microw. Theory., 43, 760–771, 1995. a
Weng, F. and Yang, H.: Validation of ATMS Calibration Accuracy Using Suomi NPP Pitch Maneuver Observations, Remote Sens.-Basel, 8, 332–346, 2016. a
Yang, H. and Weng, F.: Corrections for On-Orbit ATMS Lunar Contamination, IEEE T. Geosci. Remote, 54, 1918–1924, 2016. a
Zou, C.-Z. and Wang, W.: Intersatellite calibration of AMSU-A observations for weather and climate applications, J. Geophys. Res., 116, D23113, https://doi.org/10.1029/2011JD016205, 2011. a, b, c, d
http://www.fiduceo.eu/, last access: 9 July 2018