the Creative Commons Attribution 4.0 License.
the Creative Commons Attribution 4.0 License.
 | 23 Jul 2018
Exploring femtosecond laser ablation in single-particle aerosol mass spectrometry
Ramakrishna Ramisetty
Ahmed Abdelmonem
Xiaoli Shen
Harald Saathoff
Thomas Leisner
Size, composition, and mixing state of individual aerosol particles can be analysed in real time using single-particle mass spectrometry (SPMS). In SPMS, laser ablation is the most widely used method for desorption and ionization of particle components, often realizing both in one single step. Excimer lasers are well suited for this task due to their relatively high power density (107–1010 W cm−2) in nanosecond (ns) pulses at ultraviolet (UV) wavelengths and short triggering times. However, varying particle optical properties and matrix effects make a quantitative interpretation of this analytical approach challenging. In atmospheric SPMS applications, this influences both the mass fraction of an individual particle that is ablated, as well as the resulting mass spectral fragmentation pattern of the ablated material. The present study explores the use of shorter (femtosecond, fs) laser pulses for atmospheric SPMS. Its objective is to assess whether the higher laser power density of the fs laser leads to a more complete ionization of the entire particle and higher ion signal and thus improvement in the quantitative abilities of SPMS. We systematically investigate the influence of power density and pulse duration on airborne particle (polystyrene latex, SiO2, NH4NO3, NaCl, and custom-made core-shell particles) ablation and reproducibility of mass spectral signatures. We used a laser ablation aerosol time-of-flight single-particle mass spectrometer (LAAPTOF, AeroMegt GmbH), originally equipped with an excimer laser (wavelength 193 nm, pulse width 8 ns, pulse energy 4 mJ), and coupled it to an fs laser (Spectra Physics Solstice-100F ultrafast laser) with similar pulse energy but longer wavelengths (266 nm with 100 fs and 0.2 mJ, 800 nm with 100 fs and 3.2 mJ). We successfully coupled the free-firing fs laser with the single-particle mass spectrometer employing the fs laser light scattered by the particle to trigger mass spectra acquisition. Generally, mass spectra exhibit an increase in ion intensities (factor 1 to 5) with increasing laser power density (∼ 109 to ∼ 1013 W cm−2) from ns to fs laser. At the same time, fs-laser ablation produces spectra with larger ion fragments and ion clusters as well as clusters with oxygen, which does not render spectra interpretation more simple compared to ns-laser ablation. The idea that the higher power density of the fs laser leads to a more complete particle ablation and ionization could not be substantiated in this study. Quantification of ablated material remains difficult due to incomplete ionization of the particle. Furthermore, the fs-laser application still suffers from limitations in triggering it in a useful time frame. Further studies are needed to test potential advantages of fs- over ns-laser ablation in SPMS.
- Article
(3480 KB) - Full-text XML
-
Supplement
(2518 KB) - BibTeX
- EndNote


Atmospheric aerosols are known to have large impacts on climate change, air quality and human health, and these effects are strongly related to the chemical composition of individual aerosol particles (Fuzzi et al., 2015). Atmospheric aerosols are highly heterogeneous in composition due to the vast number of natural and anthropogenic sources, as well as transformation and mixing processes during their residence time in the atmosphere (Kulkarni et al., 2011). Most analyses of aerosol chemical composition focus on the bulk, not least due to the very small mass and number of molecules present in an average atmospheric particle, making single-particle studies challenging. However, the mixing state and composition of individual particles are crucial pieces of information for the assessment of particle interaction with light or water vapour and thus their contribution to climate change (Charles, 2012; IPCC, 2007; Jacobson, 2005; John, 2016; Laskin et al., 2018).
Single-particle mass spectrometry (SPMS) is a powerful tool for the investigation of the size-resolved chemical composition of individual atmospheric aerosol particles in real time (Brands et al., 2011; Gaie-Levrel et al., 2012; Murphy, 2007; Murphy et al., 2006; Pratt et al., 2009; Pratt and Prather, 2012; Zelenyuk et al., 2010). Although a two-step approach separating laser ablation and laser ionization bears several advantages for identifying specific molecules (Passig et al., 2017) many instruments currently still use single-step laser desorption and ionization. Single-particle mass spectrometers currently in use by different groups worldwide have very similar designs (Gaie-Levrel et al., 2012; Johnston, 2000; Murphy and Thomson, 1995; Zelenyuk et al., 2009). They usually consist of one or two scattering lasers that detect the particle size by particle time-of-flight, an ionization laser, commonly a nanosecond (ns) excimer laser for particle desorption and ionization in one single step, and the mass analyser (Murphy, 2007).
Quantitative analysis of single aerosol particles via laser ablation remains challenging, although several studies achieved advancements (Bhave et al., 2001; Fergenson et al., 2001; Gross et al., 2005; Healy et al., 2013), e.g. by detailed characterization of instrument sensitivity for individual chemical species and by optimizing ionization laser parameters to reduce fragmentation. However, so far no single-particle mass spectrometer is available for quantitative online analysis of particle mixtures. Single-step laser desorption and ionization with excimer lasers is highly non-linear (Zelenyuk and Imre, 2005). Usually, particles are not completely ablated (Ge et al., 1996; Murphy, 2007), and the ablation process leads to irreproducible spectra. The dominant yield of species with low ionization potential further limits the quantitative ability of ns-laser SPMS (Reilly et al., 2000). The absorption of photons depends on the optical properties of the chemical components of the particle, with important implications for core-shell or multi-component particles (Cahill et al., 2015). Reported approaches to improve the quantitative abilities of SPMS include two-step vaporization–ionization, where a CO2 laser was used prior to excimer laser ionization for the evaporation of the particles (Cabalo et al., 2000; Morrical et al., 1998; Smith et al., 2002; Whiteaker and Prather, 2003; Woods et al., 2002), or the use of a high power density Nd:YAG laser of 5 ns pulse duration with 100 mJ pulse energy (> 1010 W m−2) (Lee et al., 2005; Mahadevan et al., 2002; Zhou et al., 2007). Lee and Mahadevan found that the kinetic energy of ions produced from ns-laser pulses is proportional to the particle size with a power law relationship, which influences ion detection efficiency in traditional time-of-flight mass spectrometer optics. The power density is much higher for femtosecond (fs) laser pulses compared to nanosecond laser pulses. The interaction of a high-intensity laser beam with a solid particle leads to the generation of a plasma that increases its energy content, its average charge state, and its charge density during the pulse duration. Zhou et al. (2007) used a one-dimensional hydrodynamic model and experimental observations to explain ns-laser pulse interactions with particles and observed that the laser energy absorption efficiency and thus ionization efficiency increase with shorter pulse width (from 10 ns to 10 picoseconds, ps). Molecular dynamic model simulations by Schoolcraft et al. (2001, 2000) explained the process of laser desorption and ionization of submicron particles for amorphous and crystalline particles with and without inclusions as a function of the nature of the material.
Fs lasers are widely used in the fields of micromachining and nanoparticle ablation (Chichkov et al., 1996; Gattass and Mazur, 2008; Malvezzi, 2014; Richard et al., 2013; Tsuji et al., 2003). Fs-laser ablation mechanisms include Coulomb explosion (soft ablation) and phase explosion followed by thermal ablation (strong ablation), depending on fs-laser intensities (Amoruso et al., 1999; Leitz et al., 2011; Roeterdink et al., 2003; Zhou et al., 2007). Coulomb explosion and/or phase explosion happen in multi-photon ionization, depending on pulse energy. Because of the very short interaction time in the femtosecond laser ablation and ionization, it is considered to be almost instantaneous, with the resulting kinetic energy of the electrons high enough to immediately escape the target. Therefore, no space charge shielding of the sample should occur. Consequently, the target is left behind with a corresponding density of localised positive holes. Once a sufficient density of holes is achieved, the target surface becomes electrostatically unstable, resulting in a Coulomb explosion of ions, the Coulomb explosion takes place in the initial phase and/or phase explosion occurs at a higher stage of multi-photon ionization (Roeterdink et al., 2003). Various mechanisms of the fs-laser ablation (excitation, melting, ablation) were compared to the nanosecond laser ablation (Harilal et al., 2014; Malvezzi, 2014) at different timescales. Substantial atomization and strong cluster formation are the major effects due to the phase and/or Coulomb explosion in the fs-laser ablation (Malvezzi, 2014; Roeterdink et al., 2003; Xu et al., 2000; Zaidi et al., 2010). The fs-laser ablation generates more atomic ions than in the nanosecond laser ablation due to rapid energy transfer and also leads to the formation of more ion clusters because of the explosions. A brief comparison between nanosecond and femtosecond laser ablation mechanisms for different timescales is given in the Supplement (Fig. S1). Most of the processes discussed above are based on studies with solid substrates in material science in which laser ablation is widely used. Only a few studies have been done with single particles so far (Murphy and Thomson, 1995; Zhou et al., 2007). The ablation and ionization of airborne particles may be different from ablation of solid substrates, e.g. with respect to energy dissipation within the substrate. However, the basic principle of laser–matter interaction should be similar in both cases, especially within the first nanoseconds.
Potential differences in the ablation mechanism and resulting single-particle mass spectra as a function of pulse duration were also a focus of our studies. Compared to ns-laser ablation, the pulse duration of ultrashort (ps and fs) laser pulses is less than the typical ps time range of thermal diffusion effects. During ns-laser ablation thermal diffusion may reach deeper into the particles and the laser radiation may interact with the forming plume of ablated material. In contrast, for fs-laser ablation the plasma that formed near the particle surface without deeper thermal diffusion generates a plume by Coulomb and/or phase explosion which does not interact with the laser light (Fig. S1). The multi-photon ionization generates ions during the ablation phase, which may undergo association reactions in the expanding plume. The Coulomb explosions can also lead to ions with high kinetic energy which can lead to broader peaks in the mass spectra (Henyk et al., 2000a, b). In the case of fs-laser ablation, the higher photon density may favour multi-photon ionization, which may lead to the formation of new species during Coulomb or phase explosion. However, the ion formation mechanism is not well understood. Also, for the widely used ns lasers in SPMS, the ion formation mechanism is not completely understood (Murphy, 2007). Note that the ablated particle components move up to ∼ 5 µm during a 5 ns pulse or ∼ 0.1 nm during a 100 fs pulse and in both cases they remain well within the typical laser beam width. This estimate is based on an average ion speed of 1000 m s−1 (Marine et al., 1992; Walsh and Deutsch, 1991).
Ultimately, the resulting mass spectral pattern in SPMS will depend on the energy transferred to the particle via the ionization laser, which is related to pulse width, laser power, and wavelength. Shorter pulses exhibit higher power densities than longer pulses at the same laser energy. Higher power densities usually lead to higher ionization efficiencies, e.g. in multi-photon interactions, where the total ion intensity is proportional to the power density of the ionization laser (Malvezzi, 2014). High-energy, short-wavelength and short-pulse-duration ionization lasers may thus be a valid choice in single-particle ionization.
In this study we explore the potential of high power density fs-laser pulses for improved quantitative abilities of SPMS. We compare mass spectra of atmospherically relevant airborne particles and dedicated test particles from ns- and fs-laser ablation using a commercially available laser ablation aerosol time-of-flight mass spectrometer (LAAPTOF, AeroMegt GmbH). The results presented here are an extension of the work by Zawadowicz et al. (2015), who coupled a particle analysis by laser mass spectrometry (PALMS) with an fs laser (Spectra Physics Solstice-100F ultrafast laser) to investigate mass spectral patterns of NaCl, NH4NO3, and lead-doped NH4NO3 particles. Overall, they observed similar mass spectra in both ns- and fs-laser ablation but also showed that ions with high ionization energy such as Cl+ are more easily generated by the fs laser due to its higher power density. At the same time, their fs PALMS exhibited lower sensitivity to lead than the PALMS employing the ns laser.
To achieve a better understanding of fs-laser ablation in SPMS, we systematically obtained mass spectra of particles of different size, morphology (core-shell), and chemical composition for both ns- and fs-laser ionization. Please note that for this work the geometry of ablation–ionization laser beam particle interaction was not orthogonal as for the experiments described by Zawadowicz et al. (2015) but almost collinear, as this was favoured by the design of the LAAPTOF. Furthermore, we varied the power density of the ionization lasers by varying the laser energy and laser wavelength in the case of the fs laser (800 and 266 nm) and by changing the focus positions of the lasers. We describe qualitative and quantitative differences of the mass spectra obtained and discuss implications of our results for the quantitative abilities of the LAAPTOF, and SPMS in general.
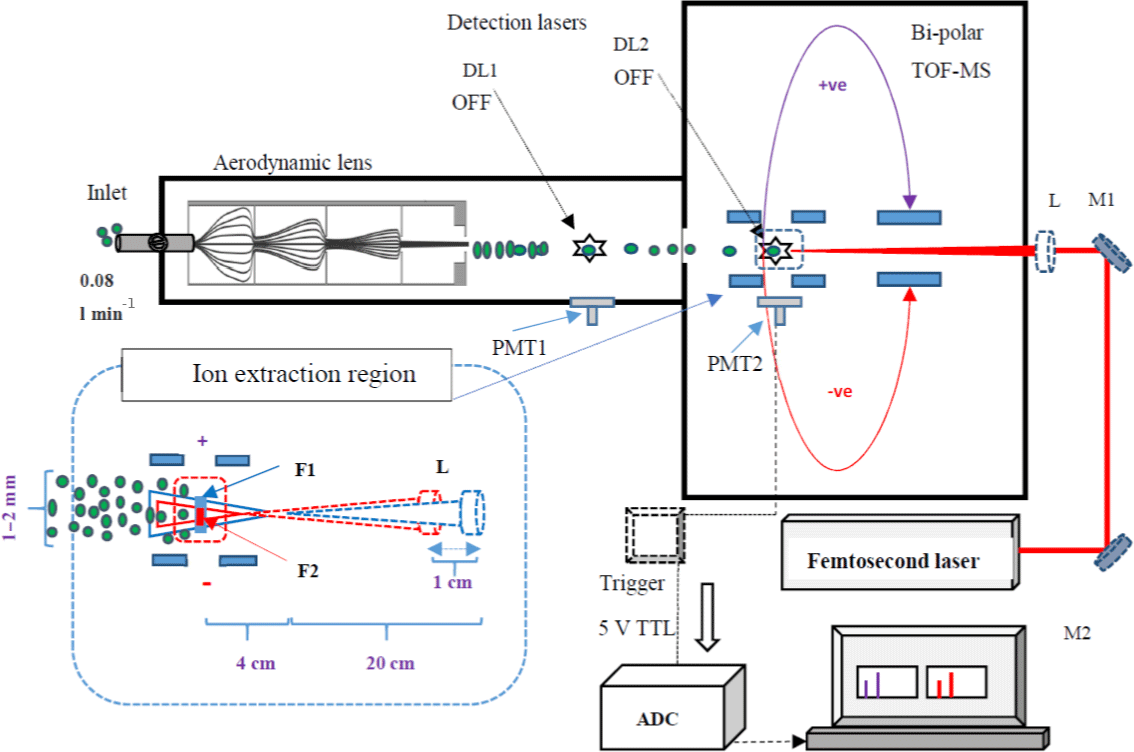
Figure 1Schematic diagram of the LAAPTOF coupled with the fs laser. The detection lasers DL1 and DL2 are turned off, as well as the first set of PMT (PMT1). PMT2 collects the scattered light from the interaction of the fs laser with the particle. The PMT2 signal is connected to the trigger box and produces a trigger with a 5 V TTL signal for the ADC data acquisition. M1 and M2 are mirrors, and the aerosol particles are shown as green dots. The corresponding spectra of each ablated particle are recorded and stored in the computer. The inset picture shows the centre of ion extraction region (dashed red square) and the variation in laser beam diameters for the two different lens or focus positions (F1 blue and F2 red). The laser focus is 3–4 cm before the ion extraction region. The counter-propagating particle beam (green dots) has a diameter of 1–2 mm depending on the particle type. Moving the lens 1 cm towards the ion extraction region (F2) reduces the beam diameter and increases the power density at the centre of the extraction region. Picture is not to the exact scale.
2.1 LAAPTOF
The LAAPTOF has already been described in several other publications (Gemayel et al., 2016; Marsden et al., 2016; Shen et al., 2018) and therefore here we will especially focus on those aspects related to its operation with the fs laser. The LAAPTOF consists of four major modules: an aerodynamic lens focusing incoming particles into a narrow beam, the sizing section with two ultraviolet (UV) 405 nm continuous-wave detection laser diodes (DL1, DL2) set 11.3 cm apart from each other, the laser ablation/particle ionization region, and a bipolar time-of-flight mass spectrometer (Fig. 1). In the sizing region, the time delay between the detection of the scattered laser light of DL1 and DL2 by photomultiplier tubes (PMT, Thorn EMI, UK, type 9781R) is used to calculate the size of particles in the range of 200–2500 nm. The particle size detection methods and detection efficiencies for the LAAPTOF have been described in several publications (Gemayel et al., 2016; Marsden et al., 2016; Shen et al., 2018). Shen et al. (2018) show a comparison of the performance of the instrument we used in this study with other (some of them modified) LAAPTOF instruments. The scattering signal from DL2 produces a 10 V transistor–transistor logic (TTL) electronic signal that triggers the 193 nm ns excimer laser (ArF, pulse width of 5–8 ns, adjustable pulse energy from 0 to 10 mJ, ATLEX-S, ATL Lasertechnik GmbH). The excimer laser shoots at the particle and at the same time triggers the data acquisition system with a 5 V TTL electronic signal. We varied the laser focus to the left–right and up–down, and determined the diameter of the particle beam to 1–2 mm, depending on particle type. The ns-laser beam is slightly defocused at the position F1, increasing the particle–laser interaction area, and the defocused beam diameter is 99 ± 31 µm where it encounters the aerosol particle (F1, Fig. 1). The focus position of the excimer laser is 20 cm from the lens, and ionization happens 3–4 cm after the focus position for F2 and F1. This is the distance from the focus point to the centre of the ion extraction region from where the ions are extracted into the mass analyser. The movable lens can be used to shift the focus position from F1 to F2 where the defocused beam diameter is 81 ± 7 µm, resulting in higher power densities acting on the particles. Please note that the position of the ionization region is quite well defined in this case, close to the centre of the ion extraction zone, due to the scattering signal of the second detection laser, whereas for the experiments with the fs laser we had to apply a different procedure to define this (see Sects. 2.2 and 3.1). Variation in the focus position allows the power density to be varied by a factor of ∼ 1.5 for otherwise similar conditions, for F1 and F2. The laser beam produces both positive and negative ions, which are deflected into the corresponding time-of-flight regions of the bipolar mass spectrometer. Typically, each particle hit by the excimer laser generates a positive and negative mass spectrum.
Table 1Parameters of the ns and fs lasers: λ is wavelength, E is energy per pulse, and τ is pulse duration. Beam diameters before focusing lens and at the two interaction positions F1 and F2.
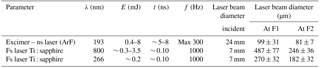
Table 2Excimer ns-laser and fs-laser pulse energies and corresponding power densities at positions F1 and F2. The corresponding beam diameters are given in Table S4.
2.2 Fs-laser-coupled LAAPTOF
The fs laser (Spectra Physics Solstice-100F ultrafast laser) we coupled to the LAAPTOF is a Ti : Sapphire source, emitting pulses of 800 nm radiation with 1 kHz. Pulse duration is ∼ 100 fs. The laser beam profile is close to Gaussian with a beam quality factor M2 < 1.3 (M2= 1 for an ideal Gaussian beam). The maximum pulse energy is ∼ 3.5 mJ. We also used a third harmonic generation module (Spectra Physics, TP-THG-F) to generate 266 nm pulses of 0.2 mJ and 100 fs duration. However, the resulting pulse energy of the laser was 1 order of magnitude smaller compared to the default 800 nm wavelength and led to a reduced light-scattering signal, and thus ineffective triggering of mass spectra recording, reduced particle detection, and lower ion signal. We therefore focus our analysis in this paper on fs-laser spectra at 800 nm wavelength. In this work, the peak power density (calculated as the power per beam area at focal point) is varied by changing the pulse energies. Excimer (ns-) and fs-laser beam parameters as well as pulse energies and corresponding peak power densities at focus points F1 and F2 are listed in Tables 1 and 2.
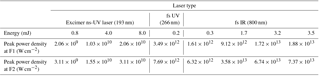
For the coupling of the fs laser with the LAAPTOF, a few technical changes were necessary. Figure 1 also includes a schematic of the modified LAAPTOF. Since it was not possible to trigger the fs laser, it was running in free-firing mode with a frequency of 1 kHz. To only record spectra from when a particle was hit by the fs laser, the scattered light from the fs-laser interaction with the particle detected by the second set of PMT was used to trigger the data acquisition. This and the fact that scattered light of the high-power fs laser could be detected by the PMT (yielding false particle size information) meant that both detection lasers were futile and thus switched off. This led to an absence of size information. To avoid loss of spectral signal due to the delay of ∼ 10 µs between triggering and the start of the data acquisition, the data acquisition was run in pre-trigger mode (Fig. 2). To define the ionization region for this case also close to the centre of the ion extraction region, a procedure selecting those mass spectra with more than 90 % of the maximum total ion intensities was applied (see Sect. 3.1).
A movable focusing lens set-up was used for multiple focusing positions between F1 and F2 further towards the inlet to better understand the effect of power density on mass spectral patterns (insert in Fig. 1). The laser beam diameters are calculated for all three wavelengths and for two different focus positions (Table S4). For the wavelength of 800 nm the laser beam diameters are 487 ± 77 and 246 ± 36 µm at the positions F1 and F2, respectively. The focal positions were varied to study the effect of power density on the mass spectra. The power densities at F2 are ∼ 3.5 times higher than at F1.
Figure 2Pre-trigger sampling mechanism of the data acquisition system. The data (input signal, the dotted wavy line) arriving before the trigger event (pre-trigger samples) are saved in the temporary memory of the data acquisition card and then combined with the trigger samples.
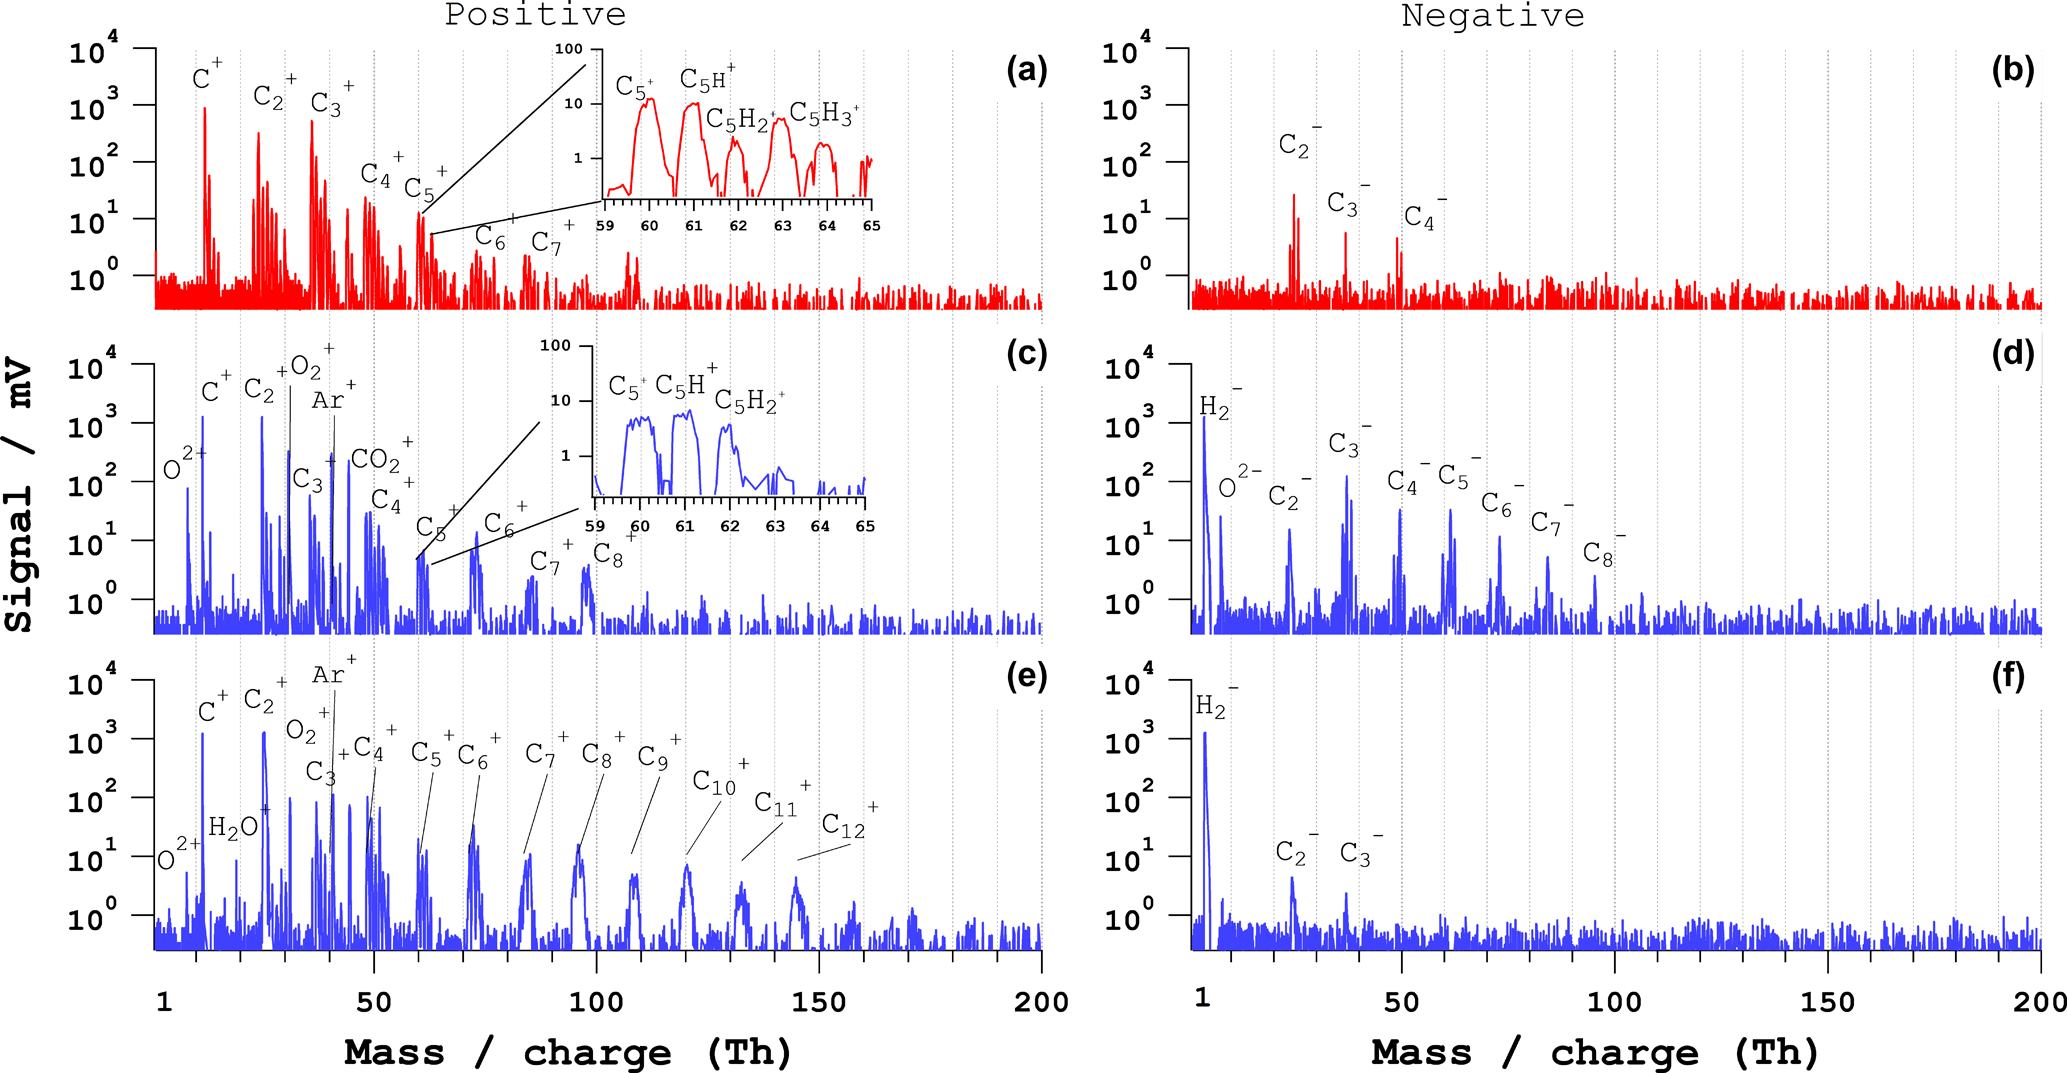
Figure 3Bipolar mass spectra of single PSL particles of dp=500 nm. (a, b) Typical ns-laser spectra, (c, d) fs-laser (λ=800 nm) spectra for 54 % of particles (type 1), and (e, f) fs-laser (λ= 800 nm) spectra for 42 % of particles (type 2). The pulse energy is 4 mJ for the ns laser and 3.2 mJ for the fs laser.
2.3 Particle types and experiments
For comparison of mass spectral patterns and signal intensities of fs- and ns-laser ablation in the LAAPTOF, we chose the following particle samples: monodisperse polystyrene latex (PSL) particles, core-shell particles with a gold core and shells of silver (Ag), silica (SiO2), and poly(allylamine hydrochloride) (PAH), salts (NaCl, NH4NO3), and spherical silica (SiO2) particles. The sample details are tabulated in Table S3. All samples were dissolved or diluted in nano-pure water (18 MΩ), nebulized (Topas ATM 221, Topas AG), and then dried with silica dryers (Topas AG). The dried aerosol particles were size-selected with a differential mobility analyser (DMA 3080, TSI) and sent to the LAAPTOF.
All samples were measured with different laser power densities corresponding to different energies for both ns and fs lasers (Table 2). Per sample and laser type and setting, we tried to record spectra from at least 500 particles (see Tables S1 and S2). Empty spectra were excluded in the data analysis.
3.1 Qualitative differences between ns- and fs-laser spectra
In the following, the qualitative differences between ns- and fs-laser positive and negative mass spectra are compared for typical pulse energies (4 mJ in the ns laser and 3.2 mJ in the fs laser). The mass spectra that are discussed in this section were selected to be representative of each particle type in the following manner. From the typically 200–600 useful single-particle mass spectra measured for each particle type, only those 30–40 % (60–240 spectra) with at least 90 % of the maximum total ion intensities were selected to ensure optimal hit of the particles by the ablation and ionization laser. These remaining spectra were classified using the fuzzy c-mean algorithm available in the LAAPTOF data analysis software. This typically resulted in two classes of mass spectra per particle type. For each class of mass spectra we manually selected 10 spectra representing all main characteristics and applied an additional mass axis calibration for each spectrum. These 10 spectra showed correlation coefficients of r= 0.7–0.9. An example demonstrating the reproducibility and representativeness of this selection process is given in the Supplement (Figs. S2–S5). Analysis of mass spectra for both polarities from this work resulted in mass resolutions at full width half maxima for masses 16, 24 and 48 of 458, 530, and 593. At this resolution we can distinguish peak differences on a single mass unit basis. Please note that most difficulties in peak assignment do not originate from mass resolution but from the jitter of the mass axis from spectrum to spectrum or particle to particle.
3.1.1 PSL particles
A comparison of typical mass spectra of individual PSL particles with a geometric diameter (dp) of 500 nm for ns and fs LAAPTOF is shown in Fig. 3. The positive ns-laser spectrum consists of series of carbon clusters C (n=1–7) and hydrogenated carbon clusters CnH (n=1–7, m=1–3) with different intensities (±10 %) for different single particles. The insert in Fig. 3a shows the clusters with five carbon atoms. All other carbon clusters have similar numbers of hydrogen atoms. The negative ns spectrum exhibits generally lower signal intensity and consists only of three major C (n=1–3) and CnH (m=1–2) peaks.
With the fs laser (800 nm, similar results for 266 nm, not shown), a total of ∼ 500 particle spectra were recorded. Of these, 54 % are of type 1 (Fig. 3c–d) and 42 % are of type 2 (Fig. 3e–f). Type 1 consists of series of positive and negative C, CnH (n=1–8, m=1–2), C and CnH (n=2–8, m=1–2) ions. The positive spectrum also exhibits signals at m∕z 18 and 16, which we assign to H2O+ and O+, potentially from residual water. The insert in Fig. 3c shows the clusters with five carbon atoms (C5H, m=0–2). The ion patterns are similar for positive ion clusters with different carbon atom numbers. The type 2 spectra consist of a longer series of carbon-containing clusters C and CnH (n=1–15, m=1–2) in positive mode. Signal intensity is lower in negative mode, with shorter carbon cluster series C (n=2–3). The type 1 spectra show more negative ion clusters than the type 2 spectra, whereas type 2 shows more positive ion clusters. One explanation for this observation could be that the type 2 spectra are generated from particles that are ionized closer to the positive ion extraction region, whereas the type 1 spectra may arise from particles ionized closer to the negative ion extraction region or in the middle of the ion extraction region of the mass spectrometer. Since the particle beam at the ionization region has a width of 1–2 mm and the laser beam a width between 487 ± 77 µm (F1) and 246 ± 36 µm (F2) it is possible that some particles are ionized closer to either one of the electrodes leading to these two types of mass spectra.
In both laser ablation methods we observe the formation of carbon clusters and hydrogenated carbon cluster ions from PSL particles. For fs-laser ablation, larger carbon clusters (> 7 carbon atoms) with (in positive mode) fewer hydrogen atoms (< 3 hydrogen atoms) are observed. In both laser ablation methods we observe the formation of carbon clusters and hydrogenated carbon cluster ions from PSL particles. For fs-laser ablation, larger carbon clusters (> 7 carbon atoms) with (in positive mode) fewer hydrogen atoms (< 3 hydrogen atoms) are observed. Such large clusters in the fs-laser spectra can potentially form during the Coulomb or phase explosion of the fs-laser ablation process but some studies claim that reactions of the primary ion species with the source plume can also generate larger clusters (Zaidi et al., 2015, 2010). For both laser pulse durations, the number of larger clusters increased with increasing laser pulse energy for the PSL spectra as has also been reported for ns-laser pulses by Weiss et al. (1997).
3.1.2 NaCl particles
Bipolar mass spectra of NaCl particles of an electrical mobility diameter (dm) of 400 nm for ns and fs laser are shown in Fig. 4. The positive ns-laser spectrum consists of atomic sodium and molecular ions (Na+, Na, and Na2Cl+ and Na3Cl ions. The negative ion spectrum consists of chlorine ions (Cl−, Cl, and sodium chloride cluster ions (NaCl, Na3Cl. The bipolar spectrum is representative of 55 % of a total of 600 spectra. The remaining spectra are empty or contain no features of NaCl.
From the fs-LAAPTOF measurements (800 nm, similar results for 266 nm, not shown) ∼ 80 single-particle spectra were considered for analysis. This low hit rate for the fs laser compared to the ns laser may be related to both the particle shape widening the particle beam and the reduced absorption at 800 nm compared to 193 nm. A representative single-particle bipolar spectrum is shown in Fig. 4c–d. The positive spectrum consists of Na+, , Cl+, Na2Cl+, , Na3Cl, ions, and H+, O ions, most likely from residual water. The negative spectrum consists of Na−, , Cl−, , Na2Cl−, Na2Cl, and ions. Around 20 % of particles exhibited less intense signals of Na and Na by ∼ 10 %, while the signals of the other ions were similar across the spectra.

Figure 4Bipolar mass spectra of NaCl single particles of dm= 400 nm. (a, b) Typical ns-laser spectra and (c, d) fs-laser (λ= 800 nm) spectra. The pulse energy is 4 mJ for the ns laser and 3.2 mJ for the fs laser.
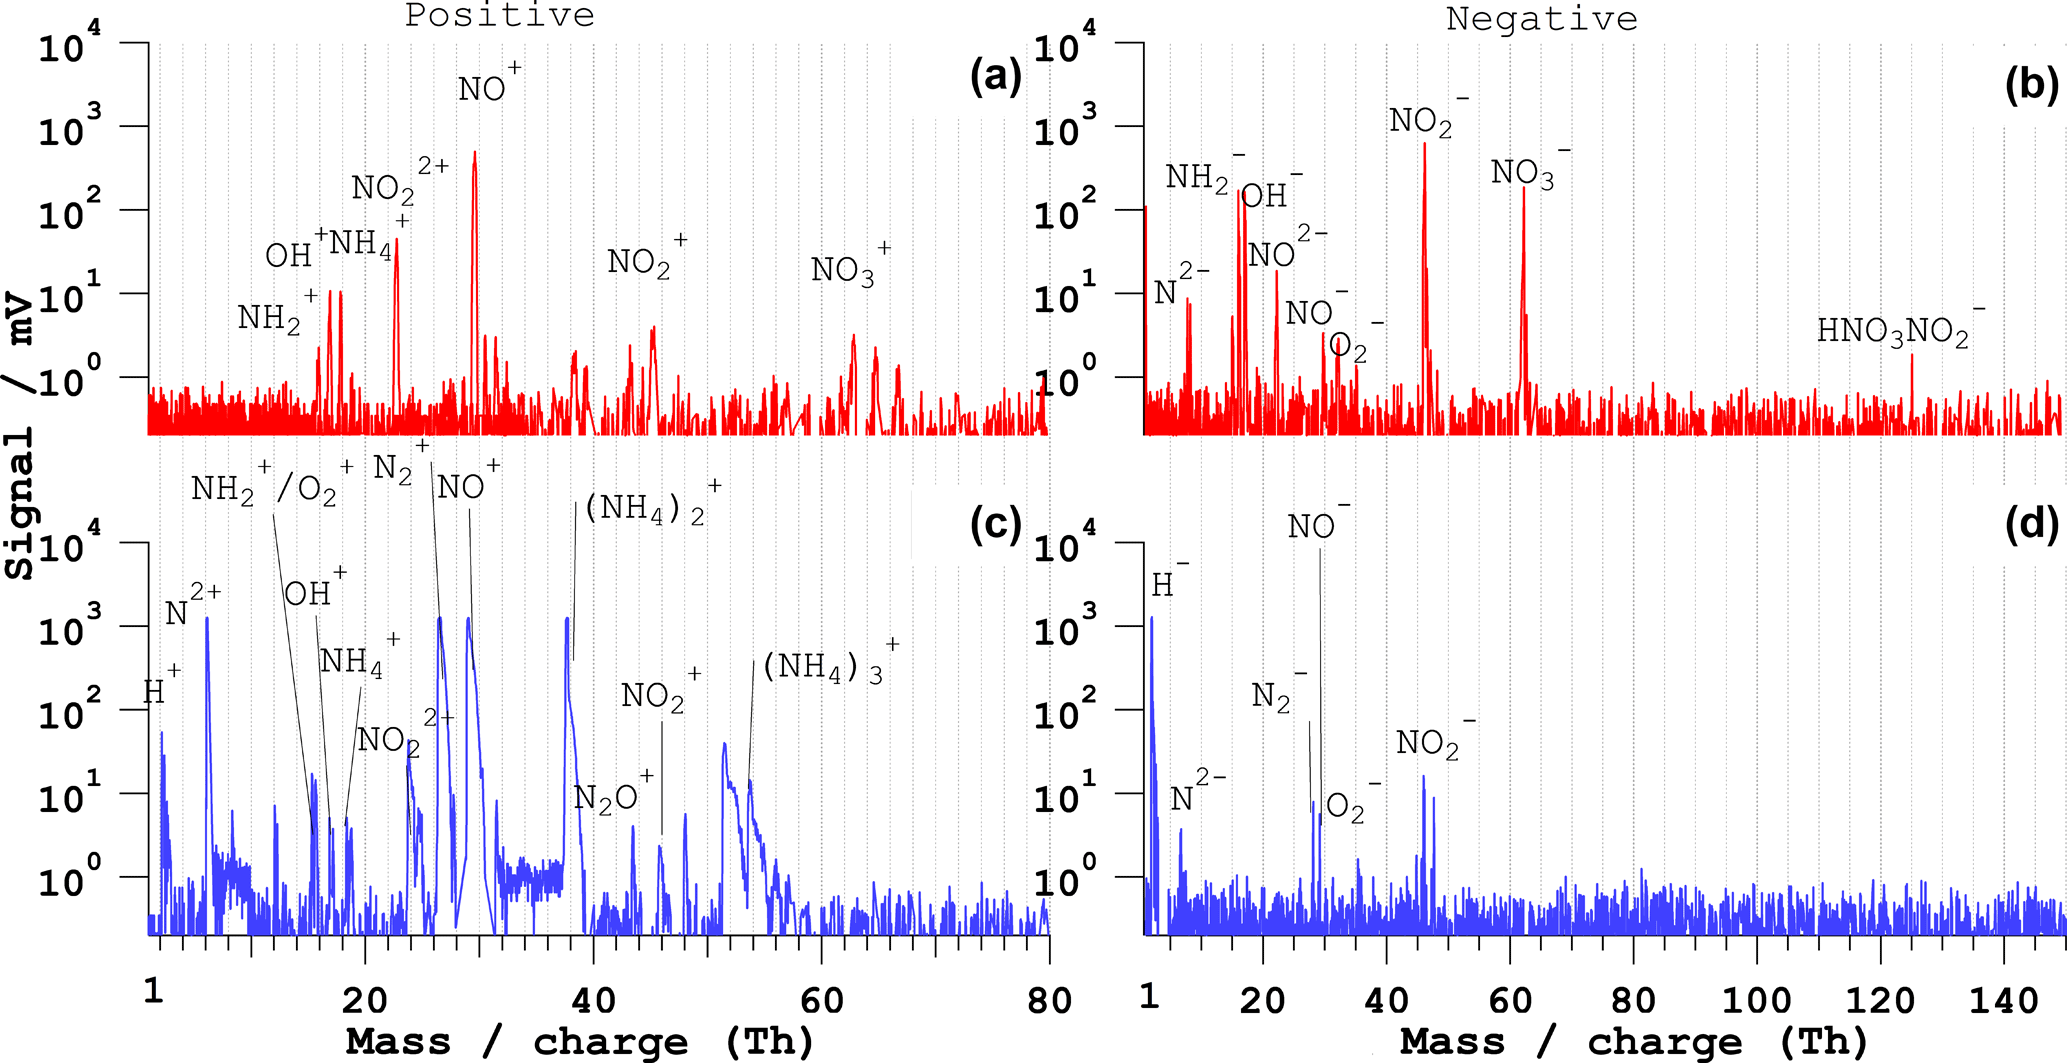
Figure 5Bipolar mass spectra of NH4NO3 particles of dp= 400 nm. (a, b) Typical ns-LAAPTOF spectra and (c, d) fs-LAAPTOF (λ= 800 nm) spectra. The pulse energy is 4 mJ for the ns laser and 3.2 mJ for the fs laser.
The qualitative difference between ns- and fs-LAAPTOF spectra is the presence of Cl+ and ions in positive fs spectra, and and ions in negative fs spectra, which are not commonly observed in ns spectra. In addition, and NaO ions (O likely from residual water) are present in the positive spectrum of the fs LAAPTOF. Zawadowicz et al. (2015) reported ions with similar combinations of Na and Cl in their fs-PALMS single-particle spectra but no NaO clusters. The dissociation energy of the NaCl molecule is 4.26 eV, which is smaller than the ionization energy of Na+ (5.13 eV) and Cl+ (12.96 eV). The electron affinities of Na− and Cl− are 0.52 and 2.35 eV, respectively (Sansonetti and Martin, 2005). In the case of ns-laser ablation with lower power density, NaCl can easily dissociate and form Na+ and Cl− ions. For Cl+ ion formation, twice as much energy (12.96 eV) is required, which is available during the fs-laser ablation process. Ionization energies are even higher for molecular Na and Cl, as well as for doubly charged Na and Cl ions. We also observed more cluster ions in the fs-laser spectra (Na2Cl+, , Na2Cl−, Na2Cl and Na4Cl compared to the ns-laser spectra, which again indicates a more complex ionization mechanism during fs-laser ablation. Several studies on fs-laser ablation of NaCl have observed the formation of cluster ions at higher power densities due to Coulomb or phase explosion, depending on excitation energy (Hada et al., 2014; Henyk et al., 2000a, b; Reif et al., 2004).
3.1.3 NH4NO3 particles
The positive and negative mass spectra of NH4NO3 particles with dm=400 nm for ns and fs LAAPTOF are shown in Fig. 5. The ns-laser spectrum is representative of 500 particles. The positive spectrum consists of ∕ O+, OH+, NH, NO, NO+, , and ion signatures, while the negative spectrum contains N2−, NH ∕ O−, OH−, NH, NO, NO−, , NO, NO, and HNO3NO ions.
The fs-LAAPTOF (800 nm) bipolar spectrum represents only 10 % of a total of 500 spectra. The majority of the particles were poorly hit and/or ionized. The positive spectrum contains H+, N, (NH, and (NH ions in addition to the ions observed in the ns-LAAPTOF positive spectrum; however there is no signature. There is a much lower (2 orders of magnitude) signal intensity in the negative spectrum compared to the positive spectrum. Only ∼ 1 % of negative fs-laser spectra exhibit significant signals (panel d), with peaks from N2−, N, NO−, , and NO ions, albeit with lower sensitivity.

Figure 6Bipolar mass spectra of SiO2 single particles of dp= 1100 nm. (a, b) Typical ns-laser spectra and (c, d) fs-LAAPTOF (λ= 800 nm) spectra. The pulse energy is 4 mJ for the ns laser and 3.2 mJ for the fs laser.
The ns-LAAPTOF bipolar spectrum is comparable to the ammonium nitrate single-particle spectrum obtained by the PALMS (Zawadowicz et al., 2015). NH4NO3 predominantly leads to positive ions ( ∕ O+, OH+, NH, NO, NO+, and are the most intense peaks). A clear signal was observed with the ns LAAPTOF for the HNO3NO ion in accordance with observations with an online laser desorption–ionization (LDI) mass spectrometer with excimer laser wavelength 193 nm (Neubauer et al., 1998), but in contradiction to observations with the PALMS (Zawadowicz et al., 2015) or the real-time single-particle mass spectrometer (RSMS) with excimer laser wavelength 193 nm (Reinard and Johnston, 2008). The fs-LAAPTOF positive spectrum consists of NxO (x= 0–2, y= 0–2), (NH (where x=1–3), H+, and N ions. The ionization energies of (NH (for x>1) cluster ions are very high (Dunlap and Doyle, 1996), which may be the reason for the absence of these ions in the ns spectra.
3.1.4 SiO2 particles
Mass spectra of individual SiO2 particles of dp= 1000 nm measured by ns and fs LAAPTOF are shown in Fig. 6. A bipolar spectrum of SiO2 particles, representative of about 80 % of 860 spectra from ns LAAPTOF obtained with 4 mJ pulse energy is presented in panels (a) and (b). The positive spectrum consists of Si+ and SiO+ ions. The negative spectrum contains O−, SiO, and ions. The other 20 % of spectra have three more SixO clusters (x=2–3, y=4–5).
Recent studies with a LAAPTOF by Marsden et al. (2016) of silicate (SiO4)-rich ambient dust particles featured similar mass spectral peaks, namely from Si+, SiO+, O−, SiO−, and SiO ions. Single-particle characterization studies of SiO2-rich particles by Cahill et al. (2015) with an aerosol time-of-flight mass spectrometer (ATOFMS) using a 266 nm Nd : YAG ionization laser also produced O−, SiO, and ions. Both studies presented similar spectra to the ones shown in Fig. 6a–b. Another ambient single-particle study with a PALMS powered with an excimer laser (193 nm, ∼ 4 mJ pulse energy) by Gallavardin et al. (2008) showed SixOy negative ion clusters (x=1–2, y=1–4), similar to the peaks in 20 % of spectra from our LAAPTOF (not shown here). Another experimental study of silica clusters with a 308 nm XeCl excimer-laser-coupled time-of-flight mass spectrometer observed clusters of silica (SiO units (n=1–6) (Xu et al., 2000).
The fs-LAAPTOF bipolar spectra for silica are shown in Fig. 6c–d, which is representative of ∼ 80 % of 530 particles. The positive spectrum consists of O+, Si+, O, SixO (x=1–3, ), and SixO (x=1–2, ) ions. The negative spectrum of O−, Si−, , SixO (x=1–6, ), and SixO (x=1–2, ) ions. To our knowledge there are no studies on the fs-laser ablation of individual silica particles; we thus cannot compare our spectra with other single-particle spectra. Kato et al. (2007) investigated fs- and ns-laser ablation of silica substrates, and silicon-rich solutions. They observed positive silicon clusters, Si (x=1–6), and claimed that ns-laser ablation leads to more fragmentation, whereas fs-laser ablation leads to better atomization with elemental ionization. With fs-laser ablation of silicon substrate, clusters of Si (n= up to 10) have been observed (Bulgakov et al., 2004).

Figure 7Bipolar mass spectra of gold–silver core-shell particles of dp= 600 nm. (a, b) Typical ns-LAAPTOF spectra and (c, d) fs-LAAPTOF (λ= 800 nm) spectra. The pulse energy is 4 mJ for the ns laser and 3.2 mJ for the fs laser.
The major difference between the positive ns-LAAPTOF and fs-LAAPTOF spectra is the existence of elemental oxygen (O+, O, and silica clusters (SiO, Si2O, Si2O, and Si3O in the fs-laser spectra. In the negative fs-laser spectra, O− and Si− elemental ions as well as SixO (x=1–6, ) and SixO (x=1–2, ) cluster ions are observed. Only O−, SiO, and ions are also common in ns-laser negative spectra. Another major difference is the high signal intensity in the fs-LAAPTOF spectra. Overall, fs-laser ablation yields more elemental information (positive silicon and positive oxygen) but also leads to higher-order clusters than ns-laser ablation. The increasing abundance of larger clusters with increasing laser pulse energy is shown in Fig. S6 for SiO2 particles.
Since the SiO2 is bonded covalently in nature, a high amount of energy is required to break it. Consequently, we observe both cations and anions of SiO2 constituents in the fs spectra. The 266 nm UV fs-LAAPTOF spectra of SiO2 particles contain similar spectral features (Fig. S10) but less intense signals than the 800 nm fs-laser spectra.
3.1.5 Gold–silver core-shell particles
A bipolar single-particle mass spectrum of gold–silver core-shell particles from ns LAAPTOF is shown in panels (a) and (b) of Fig. 7. This bipolar spectrum represents 27 % of a total of 850 particles or spectra. The peaks below 100 Th are fragments from the surfactant Cetyl-trimethylammonium bromide (CTAB), C19H42BrN, which was used to stabilize the gold–silver particles in the suspension. The positive spectrum consists of signals from the two silver isotopes Ag, of Au+, and AuO+. The negative spectrum contains signals from Ag, Au−, silver oxide isotopes AgO, and also silver dioxide (AgO2)−. About 43 % of the 850 spectra contain only signals from elemental silver and silver oxides, and no gold peaks. The remaining 30 % of single-particle spectra consist only of a signal from CTAB.
The respective fs-LAAPTOF bipolar spectrum is shown in Fig. 7c–d, which is representative of 19 % of ∼ 1500 particles. The positive spectrum consists of signals from the surfactant CTAB, elemental silver isotopes Ag, and silver oxide isotopes Ag. The negative spectrum is almost empty, with very small peaks of silver and silver oxide, and none of the fs-LAAPTOF spectra contains a gold signal. 8 % of the negative fs-LAAPTOF spectra have a clear signal from the surfactant and very small silver peaks.
The gold–silver particles contain a 300 nm gold core (nearly 67 % of total the weight percentage with a mass of 2.18 pg), and a 150 nm thick shell of silver (about 33 % of the total mass percentage with a mass of 1.08 pg). The ns-LAAPTOF mass spectral signatures, however, feature a higher signal for silver than for gold. More signals from both core and shell are observed when there is less surfactant signal in the ns spectra. The major difference between ns-LAAPTOF and fs-LAAPTOF spectra is the absence of gold peaks in the fs spectra. At the wavelength of the excimer ns laser (193 nm), the reflectance of both gold and silver are nearly 35 % (Kah et al., 2015). At the wavelength of the fs laser (800 nm), the reflectance is more than 95 % for both gold and silver. The high reflectance of gold and silver in the IR likely contributes to the reduced ablation of the core. Although the reflectance of these particles is much lower at 266 nm these fs-laser pulses were also not capable of generating a significant signal from the core for the reduced pulse energy of 0.2 mJ.
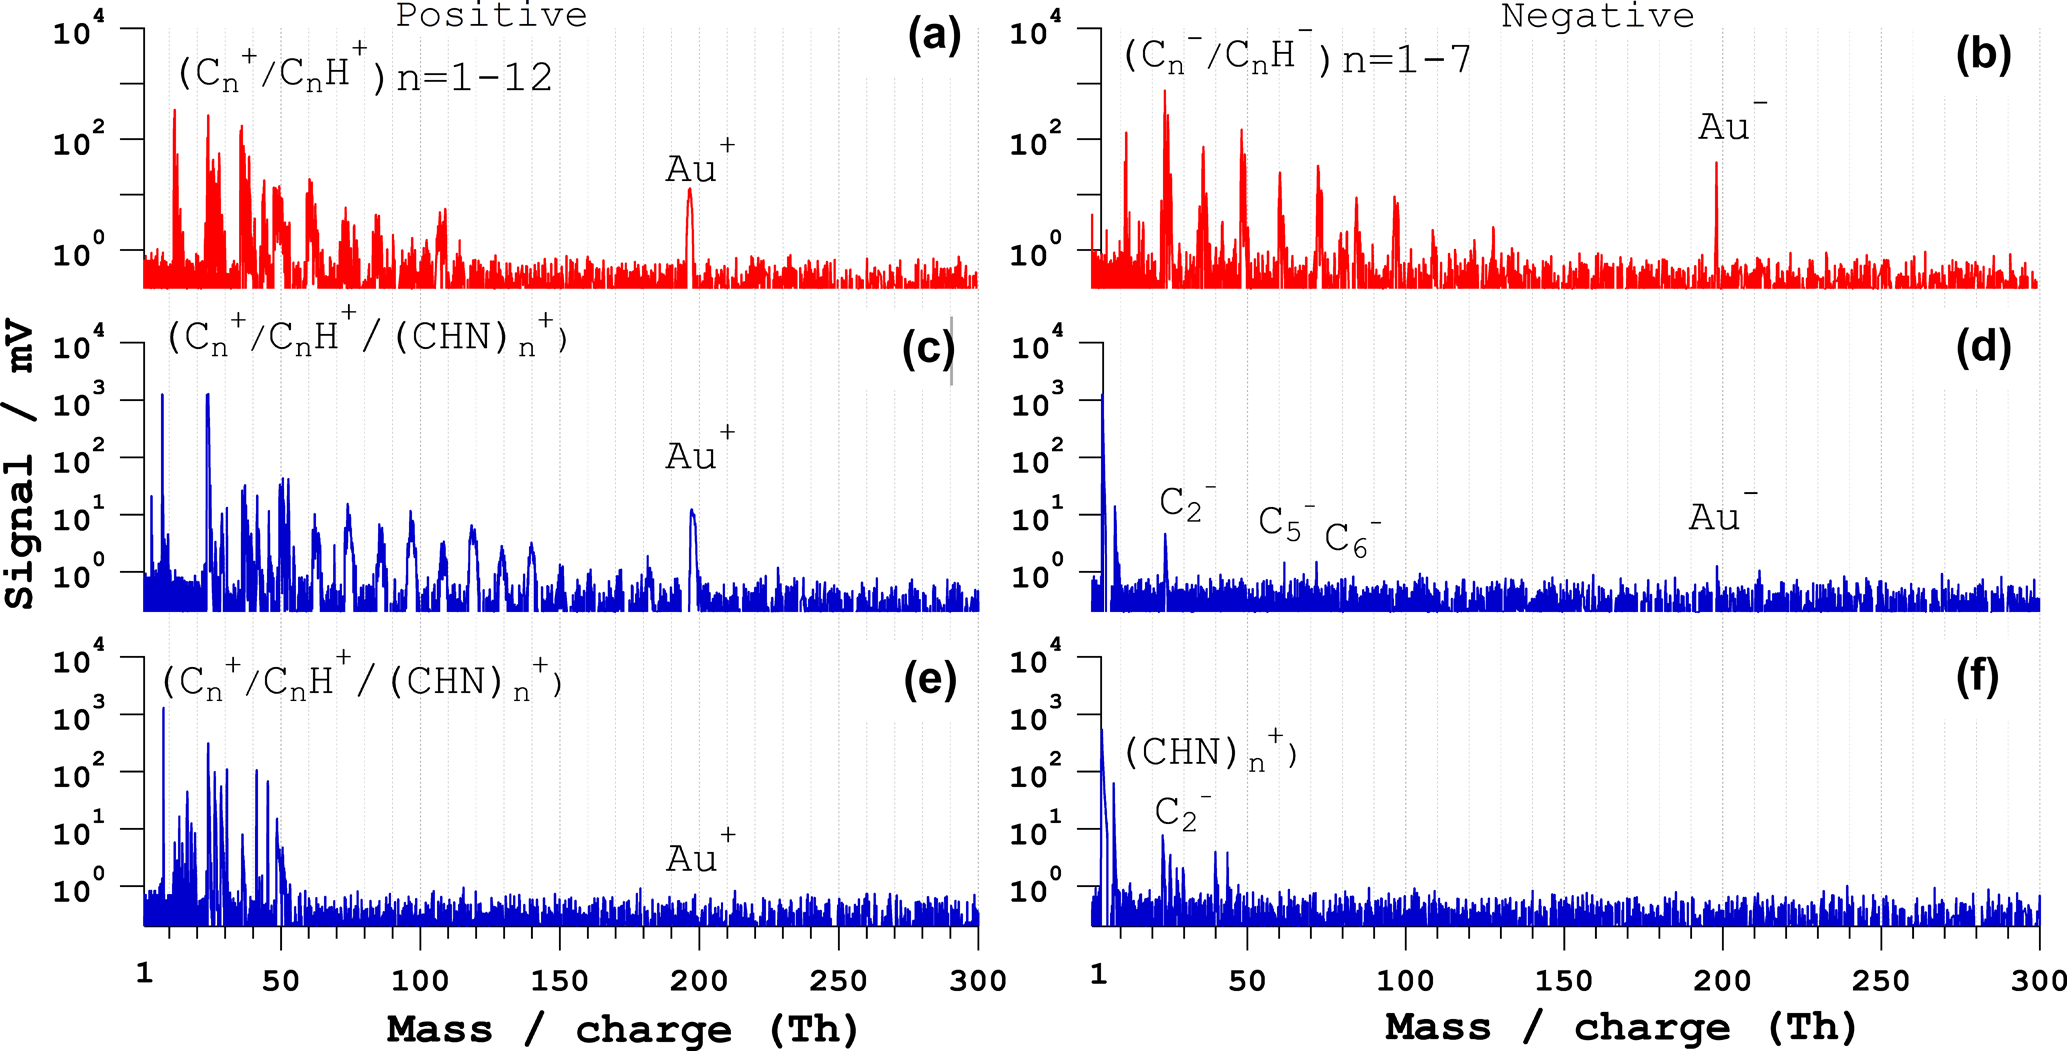
Figure 8Bipolar mass spectra of Au-PAH core-shell particles. (a, b) Typical ns-LAAPTOF spectra and (c, d) fs-LAAPTOF (λ= 800 nm) spectrum that contains both gold and PAH signals, (e, f) fs-LAAPTOF (λ= 800 nm) spectrum without gold signal. The pulse energy is 4 mJ for the ns laser and 3.2 mJ for the fs laser.
The existence of gold and silver oxides in both ns- and fs-laser spectra may be explained by oxygen-containing coatings on the particles, e.g. water or surfactants. However, we cannot fully exclude interactions of the ablated plume with background ions or residual water like in the study by Neubauer et al. (1998).
3.1.6 Gold-poly(allylamine hydrochloride) core-shell particles
The second type of core-shell particles we tested for mass spectral comparison between ns and fs laser is made of a gold core (dp=300 nm) and an organic polymer (poly(allylamine hydrochloride), PAH) shell (coating thickness = 50 nm). Ns- and fs-LAAPTOF spectra are shown in Fig. 8.
The ns-LAAPTOF bipolar spectrum (panels a and b) is representative of 44 % of a total of 450 particles. It features signals from the organic PAH shell (elemental carbon C, and hydrocarbons CnH, as well as elemental gold (Au ions. The remaining 56 % of spectra mainly consist of signals from the PAH shell and exhibit no or almost no signals from the gold core.
Two types of fs-LAAPTOF spectra are shown in panels (c)–(f). The spectra are representative of 10 and 15 % of the total number of spectra (1000). Spectra that do not contain gold or PAH signals are excluded, as are spectra that contain only background signal peaks (Ar+, CO. Figure 8c–d is representative of a spectrum that contains a distinctive signal from the gold core, and C ions as well as CnH cluster ions. The second type (panels e–f) does not exhibit any signal from the gold core and also less signal from the carbon clusters. The spectra with both an organic shell and gold core signature are most likely produced from particles that were hit very close to the centre of the laser beam. The spectra without the gold signature are most likely produced from particles interacting only with part of the laser beam. Please note that the particle beam has a diameter ranging between 1 and 2 mm, while the laser beam diameter ranges between 246 and 487 µm (see Table S4).
The comparison between ns- and fs-LAAPTOF spectra of gold-PAH core-shell particles reveals more signal from carbon clusters, which are similar to the peaks from PSL particles, in the fs spectra. The signal from the gold core was only observed in one of a total of 1000 particles, again due to the low absorption of gold in the IR (Manca et al., 2007; Pereira et al., 2015). The spectra of gold-PAH particles from the 266 nm fs LAAPTOF (not shown) also did not exhibit signal from the gold core, and only low signal intensity from the PAH shell.
The third type of core-shell particles, Au-SiO2, produced mass spectra and no signal from the gold core at both fs-laser wavelengths (Fig. S2). Signal from the gold core was again observed in the ns-laser spectra. They contained Si, SiO, SiO2 positive ions, as well as hydrocarbon ions from the surfactant, and negative hydrocarbon, elemental carbon, and oxygen signals from the SiO2 shell.
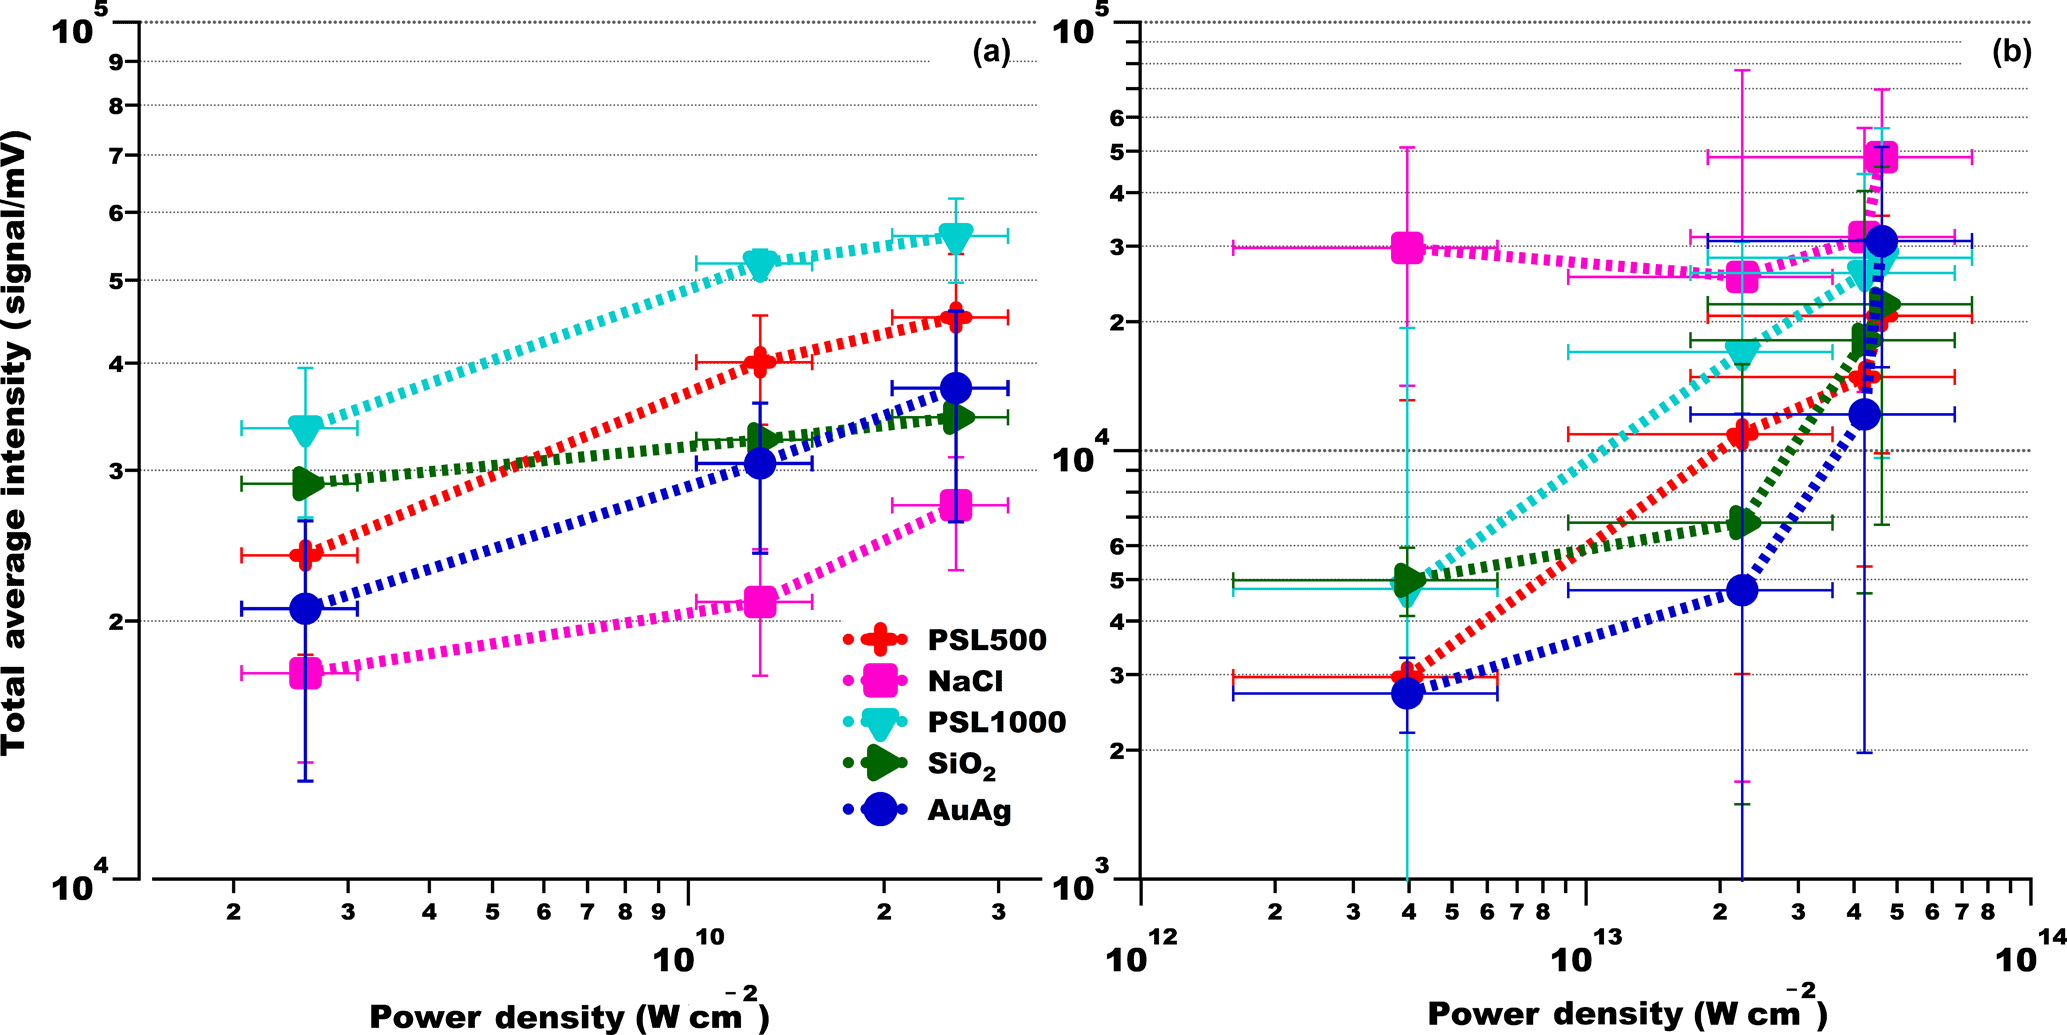
Figure 9Average ion intensity versus laser power density for different particle types. (a) Excimer laser and (b) fs laser. Error bars of the average ion signal intensity correspond to ±1 standard deviation, error bars of the power density to the value of power density of the laser beam at the corresponding possible maximum and minimum position of particle–laser interaction.
3.1.7 Fs-laser ablation with a wavelength of 266 nm
The mass spectra obtained for fs-laser pulses of 266 nm wavelength and 0.2 mJ energy/pulse show very similar features for all the samples measured as obtained for the other fs-laser wavelength of 800 nm. Please note that about 80 % of the spectra collected for 266 nm was empty due to the reduced light-scattering signal and corresponding ineffective triggering of mass spectra recording. Furthermore, the mass spectra containing information have lower average intensity of 3 to 5 times for all particle types compared to those obtained for fs-laser pulses of 800 nm, with a similar energy of 0.3 mJ per pulse. A discussion on single-particle mass spectra for 266 nm (fs laser) in comparison with those obtained using 193 nm (ns laser) and 800 nm (fs laser) is presented in the Supplement (Figs. S7–S13).
3.2 Signal intensity as a function of laser power density and particle size
3.2.1 Signal intensity variation with laser power density
We investigated the relationship between ion signal intensity and laser power density for all particle samples. The increase in power density from the lowest (0.8 mJ) to the highest (8 mJ) excimer laser pulse energy corresponds to 1 order of magnitude (2.06 × 10⁹–2.06 × 10¹⁰ W cm−2). For the fs laser, the energy was varied from 0.3 to 3.5 mJ, corresponding to more than 1 order of magnitude difference in power density. Due to the large spectrum-to-spectrum variance, average signal intensities per power density settings were calculated for 20 mass spectra that are representative of the typical spectra discussed in Sect. 3.1 (Fig. S2).
The mass spectra generated with the fs laser have on average a factor of 5 higher total ion intensity compared to those generated with the ns laser. Average signal intensity versus power density for both ns and fs lasers is shown in Fig. 9. All samples exhibit an increase in average signal intensity (by a factor of up to 5, depending on particle type) with increasing ns- or fs-laser (800 nm) power. The exception is NaCl, which seems to be more efficiently ionized (compare Sect. 3.1.2) at the higher power densities of the fs laser compared to the ns laser, albeit with a saturation effect. Based on our limited data and the available literature one can only speculate about potential reasons. The observed slight saturation effect of signal intensity at higher power densities for both lasers and most particle types may be due the Coulomb repulsion among the ions during multi-photon ionization, observed by L'Huillier et al. (1987). Furthermore, penetration of the plasma into the particles with increasing power density may be limited due to absorption of part of the additional power by the plasma near the surface.
Figure S14 shows the same data as Fig. 1 but separated for focus positions F1 and F2. Note that for the fs laser, due its free-firing mode, the ionization position and corresponding power density are highly uncertain and represent a best estimate. Consequently, we cannot rule out an overlap between possible power densities corresponding to F1 and F2.
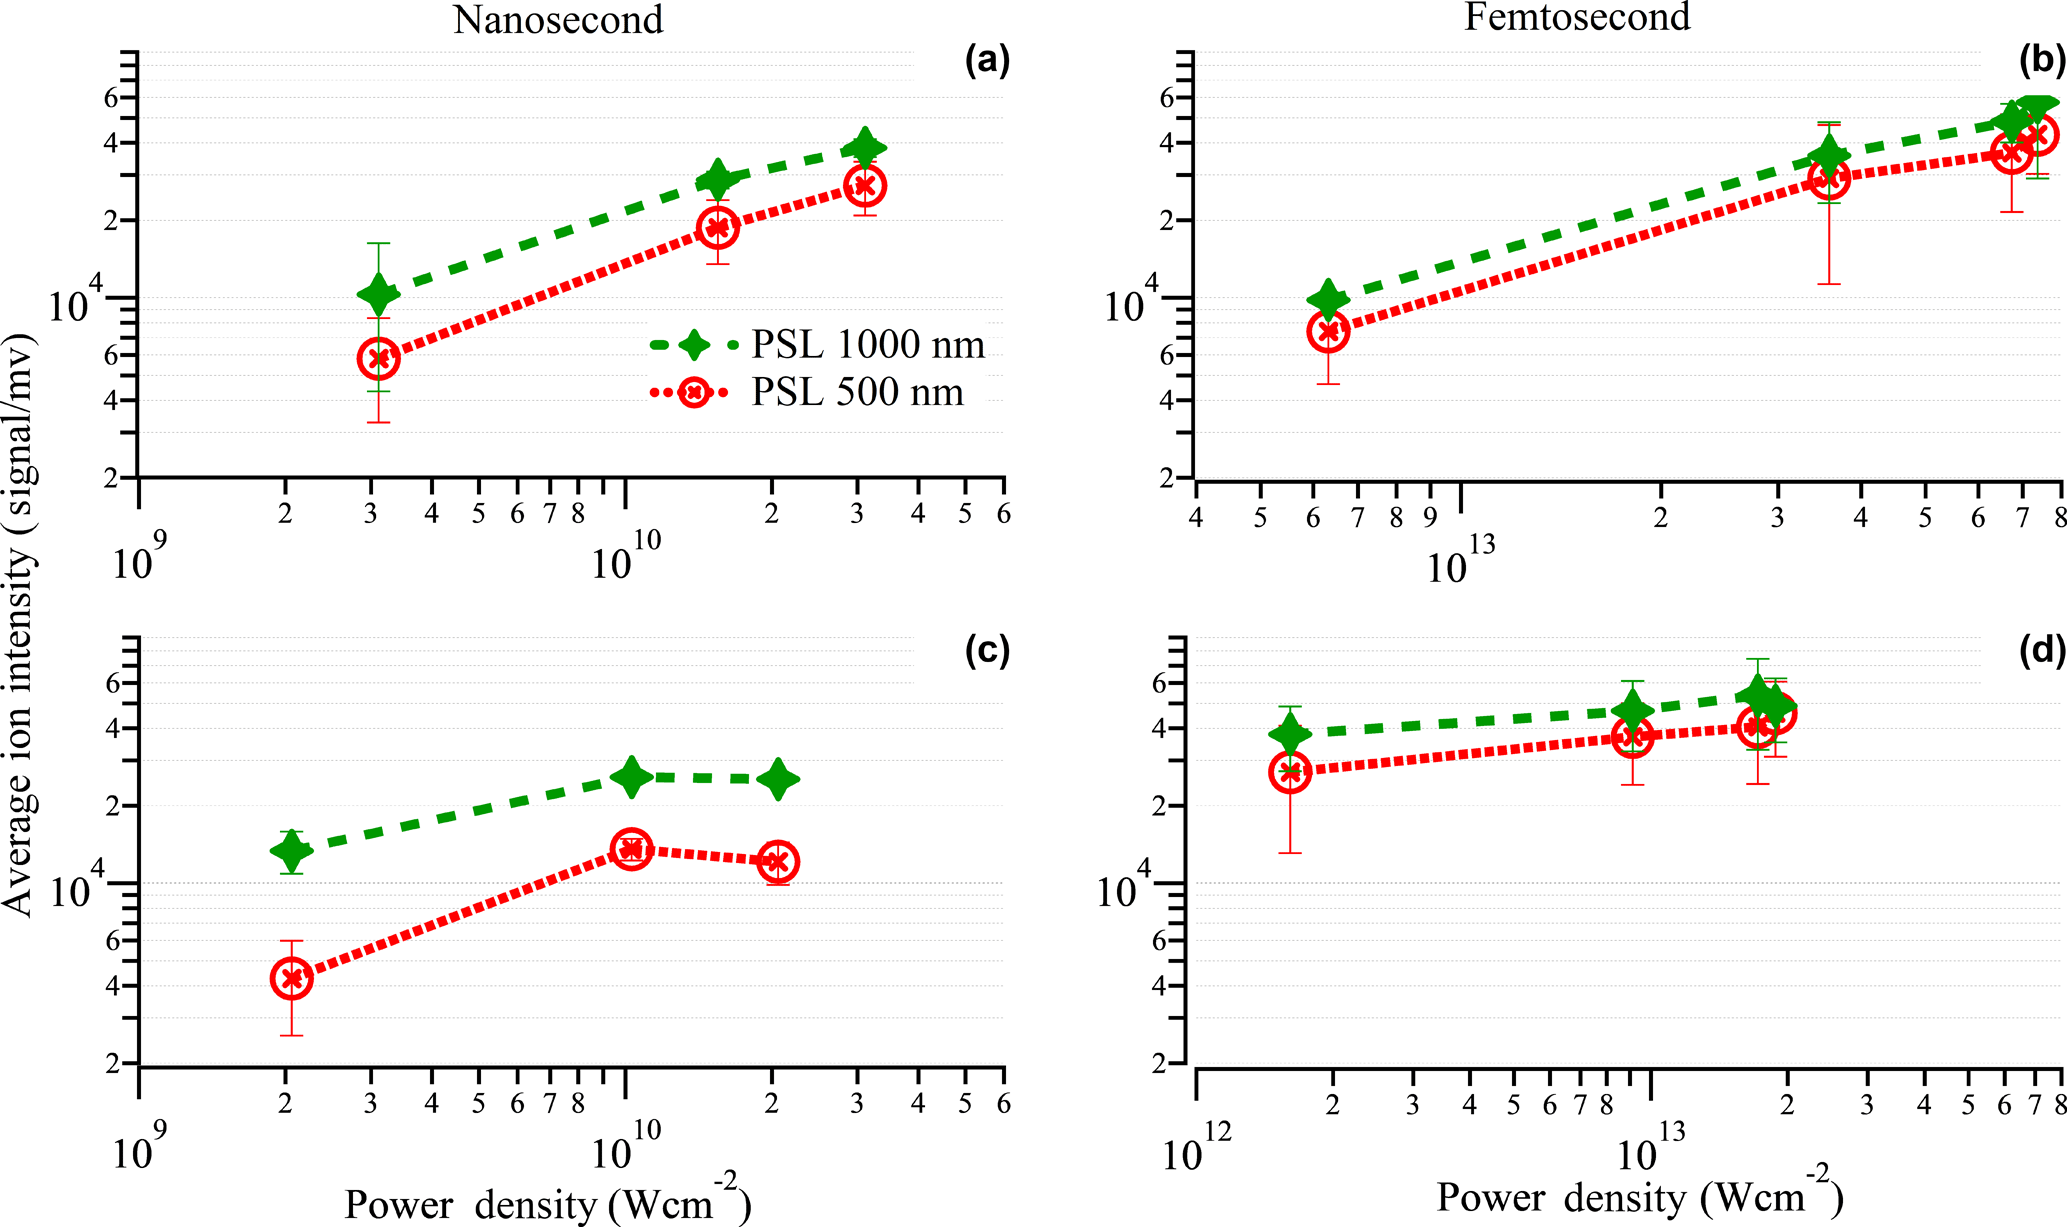
Figure 10Variation in average total ion intensity with respect to the size of PSL particles. The total ion intensities were averaged for 10 representative spectra of each particle type. Particle diameters are 500 nm for red circles, and 1000 nm for green triangles). (a, b) At the focus position F2 and (c, d) at the focus position F1.
3.2.2 Ion signal intensity variation with particle size
To explore the quantitative abilities of the fs and ns laser we also investigated the average ion signal intensity variation as a function of laser power density with respect to particle size (Fig. 10a, b) using PSL particles of 500 and 1000 nm diameter. Similar subplots (Fig. 10c–d) are shown for focus position F1 with lower power density. The average signal intensity for the 1000 nm size particles as a function of the excimer laser power density is 2–4 times higher compared to the signal intensity for 500 nm particles for both focus positions. The femtosecond laser produced average ion signals only 1.5–2 times larger for 1000 nm particles compared to 500 nm particles. However, this difference between ns- and fs-laser ion intensities for these different particle sizes is within the uncertainties and also has to be verified for different types of particles. The mass ratio of the two particle sizes is 8; hence much larger than the relative differences in the total ion intensities. The ratio of the surface area of the 1000 nm PSL and 500 nm PSL particles is 4, which is comparable to the maximum intensity difference observed. This could be an indication that the ionization scales with the particle surface area. The increase in ion signal thus does not scale linearly with the difference in mass of the two particles sizes and of the total material that is potentially ablated. Similar effects were observed for RbNO3 and (NH4)2SO4 particles (Reents et al., 1994). This demonstrates the quantitative limitations of both ns- and fs-laser ablation.
We coupled the commercially available single-particle mass spectrometer LAAPTOF, originally equipped with an ns excimer laser, with a free-firing fs laser to investigate mass spectral patterns and signal intensity for a variety of atmospherically relevant aerosol particles and dedicated test particles. We successfully employed the fs laser light scattered by the particles to trigger mass spectra acquisition with a certain pre-trigger. Particle types sampled (and their diameter) include PSL particles (500, 1000 nm), NaCl (400 nm), NH4NO3 (400 nm), Silica (1000 nm), and gold–silver, gold-SiO2, and gold-PAH core-shell particles (600, 400, and 400 nm).
Overall, mass spectral signatures for ns-and fs-laser ablation and different particle types are fairly similar. Generally, ns-laser spectra for the same particle type exhibit higher reproducibility of the spectral pattern than fs-laser spectra with the LAAPTOF in counter-propagating geometry. This is most likely because the ns laser can be triggered, which leads to some limitation of the physical extent of the potential interaction region of particle and laser beam, which is not the case for the free-firing fs laser. Please note that between 30 and 40 % of the spectra obtained using the fs laser have the same spectral features, which demonstrates the reproducibility within a single type of measurement and which is a good basis with which to compare results for different measurement conditions. Qualitative differences between fs- and ns-laser spectra vary depending on particle type. Larger clusters (CnHm clusters with n>7 for PSL particles, or higher order SiO2 clusters) were observed in the higher power density fs-laser spectra. Such larger clusters in the fs-laser spectra can potentially form during the Coulomb or phase explosion of the fs-laser ablation process. Some studies claim that also reactions of the primary ion species with the source plume may generate the larger clusters (Zaidi et al., 2010). However, these complex processes of fs-laser ionization are beyond the scope of this paper but require further study. We find that these large clusters in fs-laser spectra do not necessarily improve the quantitative abilities of SPMS. For NaCl particles, only in fs-laser spectra were high ionization energy species like Cl+ or N+ detected. Fs-laser ablation also led to the formation of oxides, e.g. core-shell particles, silica particles, and silver oxides, for the gold–silver core-shell particles.
Apart from differences in the ionization process, laser wavelength and particle optical properties also play an important role in SPMS, especially for core-shell particles or inhomogeneously mixed particles. However, for fs-laser ablation it seems that the rapid plasma formation on the surface, e.g. of the core-shell particles, prevents a deeper impact and hence ablation and ionization of core material at least for shell thicknesses of 150 nm. The mass spectra available from the fs laser with 266 nm and an energy of 0.2 mJ have shown very similar spectra to the fs laser operating with 800 nm and 0.3 mJ. Despite the relatively small number of usable spectra for 266 nm, we consider it very likely that high power densities and hence multi-photon ionization taking place for both wavelengths lead to the formation of similar ions, which points to similar ion formation mechanisms. However, a more detailed discussion of possible ion formation mechanisms is not possible based on the data available.
Generally, fs-laser-generated mass spectra show higher total ion intensities compared to those from the ns laser by a factor of 1 to 5. Variation in power density does not have a large impact on mass spectral patterns for both laser types but influences ion signal intensity. The average ion signal intensity is increased by a factor of 2–5 with an increase in laser power density of at least 1 order of magnitude for both laser modes. Ion signal intensity also shows a (albeit non-linear) dependency on particle size, as tested for PSL particles with diameters of 500 and 1000 nm. This non-linearity would warrant further investigation for these instruments to improve their quantitative abilities. The smaller impact of particle size on ion signal intensity for the fs laser compared to the ns-laser system observed here indicates that fs lasers might not be the most effective way of improving SPMS quantification. High-energy (∼ 100 mJ) nanosecond lasers may be a better choice than high power density fs lasers due to the operational ease and cost.
The idea that the higher power density that can be achieved with fs-laser pulses leads to a more complete particle ablation and ionization could not be substantiated in this study. However, the cluster formation nature of fs-laser ablation rewards more studies with aerosol particles to understand and correlate the results for potential improvements in quantification and mixing state analysis. Further tests including, for example, two-step ionization or delayed extraction are needed to investigate potential advantages of fs- over ns-laser ablation in atmospheric SPMS.
Data will be provided upon request to the authors.
The supplement related to this article is available online at: https://doi.org/10.5194/amt-11-4345-2018-supplement.
RR set up the experiment, did the measurements, analysed the data and wrote the manuscript. AA operated the femtosecond laser system and did the optical coupling. XS helped with the set-up. HS, TL, and CM developed the scientific approach, and supported the experimental procedures and data analysis. RR, HS, and CM developed the manuscript. All co-authors participated in scientific discussions on the interpretation of the results.
The authors declare that they have no conflict of interest.
The authors would like to thank Daniel J. Cziczo and his team for their work
which was base for our project. The Authors would like to thank Denis Duft
for scientific discussions, Divya Kumar for laser beam profile calculations
and Georg Scheurig, Steffen Vogt, and Frank Schwarz for their technical
support. This work was funded by the Ministerium für Wissenschaft,
Forschung und Kunst in Baden-Württemberg, Germany in the programme
Research Seed Capital. AA is grateful to the German Research Foundation for
support (DFG, AB 604/1-1 and AB 604/1-2).
The
article processing charges for this open-access
publication
were covered by a Research
Centre of the Helmholtz
Association.
Edited by: Francis
Pope
Reviewed by: Cristian Focsa and two anonymous referees
Amoruso, S., Bruzzese, R., Spinelli, N., and Velotta, R.: Characterization of laser-ablation plasmas, J. Phys. B-At. Mol. Opt., 32, R131, https://doi.org/10.1088/0953-4075/32/14/201, 1999.
Bhave, P. V., Allen, J. O., Morrical, B. D., Fergenson, D. P., Cass, G. R., and Prather, K. A.: A Field-Based Approach for Determining ATOFMS Instrument Sensitivities to Ammonium and Nitrate, Environ. Sci. Technol., 36, 4868–4879, 2001.
Brands, M., Kamphus, M., Böttger, T., Schneider, J., Drewnick, F., Roth, A., Curtius, J., Voigt, C., Borbon, A., Beekmann, M., Bourdon, A., Perrin, T., and Borrmann, S.: Characterization of a Newly Developed Aircraft-Based Laser Ablation Aerosol Mass Spectrometer (ALABAMA) and First Field Deployment in Urban Pollution Plumes over Paris During MEGAPOLI 2009, Aerosol Sci. Tech., 45, 46–64, 2011.
Bulgakov, A. V., Ozerov, I., and Marine, W.: Silicon clusters produced by femtosecond laser ablation: non-thermal emission and gas-phase condensation, Appl. Phys. A, 79, 1591–1594, 2004.
Cabalo, J., Zelenyuk, A., Baer, T., and Miller, R. E.: Two-Color Laser Induced Evaporation Dynamics of Liquid Aerosols Probed by Time-of-Flight Mass Spectrometry, Aerosol Sci. Tech., 33, 3-19, 2000.
Cahill, J. F., Fei, H., Cohen, S. M., and Prather, K. A.: Characterization of core-shell MOF particles by depth profiling experiments using on-line single particle mass spectrometry, Analyst, 140, 1510–1515, 2015.
Charles, K.: Chemistry and Composition of Atmospheric Aerosol Particles, Annu. Rev. Phys. Chem., 63, 471–491, 2012.
Chichkov, B. N., Momma, C., Nolte, S., von Alvensleben, F., and Tünnermann, A.: Femtosecond, picosecond and nanosecond laser ablation of solids, Appl. Phys. A, 63, 109–115, 1996.
Dunlap, B. I. and Doyle, R. J.: Ammonium Nitrate Cluster Ions, J. Phys. Chem., 100, 5281–5285, 1996.
Fergenson, D. P., Song, X.-H., Ramadan, Z., Allen, J. O., Hughes, L. S., Cass, G. R., Hopke, P. K., and Prather, K. A.: Quantification of ATOFMS Data by Multivariate Methods, Anal. Chem., 73, 3535–3541, 2001.
Fuzzi, S., Baltensperger, U., Carslaw, K., Decesari, S., Denier van der Gon, H., Facchini, M. C., Fowler, D., Koren, I., Langford, B., Lohmann, U., Nemitz, E., Pandis, S., Riipinen, I., Rudich, Y., Schaap, M., Slowik, J. G., Spracklen, D. V., Vignati, E., Wild, M., Williams, M., and Gilardoni, S.: Particulate matter, air quality and climate: lessons learned and future needs, Atmos. Chem. Phys., 15, 8217–8299, https://doi.org/10.5194/acp-15-8217-2015, 2015.
Gaie-Levrel, F., Perrier, S., Perraudin, E., Stoll, C., Grand, N., and Schwell, M.: Development and characterization of a single particle laser ablation mass spectrometer (SPLAM) for organic aerosol studies, Atmos. Meas. Tech., 5, 225–241, https://doi.org/10.5194/amt-5-225-2012, 2012.
Gallavardin, S. J., Froyd, K. D., Lohmann, U., Moehler, O., Murphy, D. M., and Cziczo, D. J.: Single Particle Laser Mass Spectrometry Applied to Differential Ice Nucleation Experiments at the AIDA Chamber, Aerosol Sci. Tech., 42, 773–791, 2008.
Gattass, R. R. and Mazur, E.: Femtosecond laser micromachining in transparent materials, Nat. Photon., 2, 219–225, 2008.
Ge, Z., Wexler, A. S., and Johnston, M. V.: Multicomponent Aerosol Crystallization, J. Colloid Interf. Sci., 183, 68–77, 1996.
Gemayel, R., Hellebust, S., Temime-Roussel, B., Hayeck, N., Van Elteren, J. T., Wortham, H., and Gligorovski, S.: The performance and the characterization of laser ablation aerosol particle time-of-flight mass spectrometry (LAAP-ToF-MS), Atmos. Meas. Tech., 9, 1947–1959, https://doi.org/10.5194/amt-9-1947-2016, 2016.
Gross, D. S., Barron, A. R., Sukovich, E. M., Warren, B. S., Jarvis, J. C., Suess, D. T., and Prather, K. A.: Stability of single particle tracers for differentiating between heavy- and light-duty vehicle emissions, Atmos. Environ., 39, 2889–2901, 2005.
Hada, M., Zhang, D., Pichugin, K., Hirscht, J., Kochman, M. A., Hayes, S. A., Manz, S., Gengler, R. Y. N., Wann, D. A., Seki, T., Moriena, G., Morrison, C. A., Matsuo, J., Sciaini, G., and Miller, R. J. D.: Cold ablation driven by localized forces in alkali halides, Nat. Comm., 5, 3863, https://doi.org/10.1038/ncomms4863, 2014.
Harilal, S. S., Freeman, J. R., Diwakar, P. K., and Hassanein, A.: Femtosecond Laser Ablation: Fundamentals and Applications, in: Laser-Induced Breakdown Spectroscopy: Theory and Applications, edited by: Musazzi, S. and Perini, U., Springer Berlin Heidelberg, Berlin, Heidelberg, 2014.
Healy, R. M., Sciare, J., Poulain, L., Crippa, M., Wiedensohler, A., Prévôt, A. S. H., Baltensperger, U., Sarda-Estève, R., McGuire, M. L., Jeong, C.-H., McGillicuddy, E., O'Connor, I. P., Sodeau, J. R., Evans, G. J., and Wenger, J. C.: Quantitative determination of carbonaceous particle mixing state in Paris using single-particle mass spectrometer and aerosol mass spectrometer measurements, Atmos. Chem. Phys., 13, 9479–9496, https://doi.org/10.5194/acp-13-9479-2013, 2013.
Henyk, M., Wolfframm, D., and Reif, J.: Ultra short laser pulse induced charged particle emission from wide bandgap crystals, Appl. Surf. Sci., 168, 263–266, 2000a.
Henyk, M., Wolfframm, D., and Reif, J.: Ultrafast laser desorption from transparent insulators, Nucl. Instrum. Meth. B, 166–167, 716–721, 2000b.
IPCC: Climate change 2007: The physical science basis, Cambridge University Press, New York, NY, 2007.
Jacobson, M. Z.: Fundamentals of Atmospheric Modeling, Cambridge University Press, Cambridge, 2005.
John, S.: Atmospheric Chemistry and Physics: From Air Pollution to Climate Change, Wiley, 1152 pp., 2016.
Johnston, M. V.: Sampling and analysis of individual particles by aerosol mass spectrometry, J. Mass Spectrom., 35, 585–595, 2000.
Kah, P., Rajan, R., Martikainen, J., and Suoranta, R.: Investigation of weld defects in friction-stir welding and fusion welding of aluminium alloys, Int. J. Mech. Mater. Des., 10, 26, https://doi.org/10.1186/s40712-015-0053-8, 2015.
Kato, T., Kobayashi, T., Matsuo, Y., Kurata-Nishimura, M., Oyama, R., Matsumura, Y., Yamamoto, H., Kawai, J., and Hayashizaki, Y.: Comparison between femtosecond and nanosecond laser ablation of solution samples applied on a substrate, J. Phys. Conf. Ser., 59, 372, https://doi.org/10.1088/1742-6596/59/1/078, 2007.
Kulkarni, P., Baron, P. A., and Willeke, K.: Introduction to Aerosol Characterization, in: Aerosol Measurement, John Wiley & Sons, Inc., 2011.
Laskin, J., Laskin, A., and Nizkorodov, S. A.: Mass Spectrometry Analysis in Atmospheric Chemistry, Anal. Chem., 90, 166–189, 2018.
Lee, D., Park, K., and Zachariah, M. R.: Determination of the Size Distribution of Polydisperse Nanoparticles with Single-Particle Mass Spectrometry: The Role of Ion Kinetic Energy, Aerosol Sci. Tech., 39, 162–169, 2005.
Leitz, K.-H., Redlingshöfer, B., Reg, Y., Otto, A., and Schmidt, M.: Metal Ablation with Short and Ultrashort Laser Pulses, Physics Proc., 12, 230–238, 2011.
L'Huillier, A., Jönsson, L., and Wendin, G.: Multiphoton ionization of many-electron atoms, Int. J. Quantum Chem., 31, 833–840, 1987.
Mahadevan, R., Lee, D., Sakurai, H., and Zachariah, M. R.: Measurement of Condensed-Phase Reaction Kinetics in the Aerosol Phase Using Single Particle Mass Spectrometry, J. Phys. Chem. A, 106, 11083–11092, 2002.
Malvezzi, A. M.: Laser–Matter Interaction in LIBS Experiments, in: Laser-Induced Breakdown Spectroscopy: Theory and Applications, edited by: Musazzi, S. and Perini, U., Springer Berlin Heidelberg, Berlin, Heidelberg, 2014.
Manca, L., Boštjan, J., Danilo, S., and Rok, K.: In situ synthesis of Ag nanoparticles in polyelectrolyte multilayers, Nanotechnology, 18, 325601, https://doi.org/10.1088/0957-4484/18/32/325601, 2007.
Marine, W., Scotto d'Aniello, J. M., and Gerri, M.: Velocity measurement of the ablated particles during picosecond laser ablation, Mater. Sci. Eng. B-Adv., 13, 57–62, 1992.
Marsden, N., Flynn, M. J., Taylor, J. W., Allan, J. D., and Coe, H.: Evaluating the influence of laser wavelength and detection stage geometry on optical detection efficiency in a single-particle mass spectrometer, Atmos. Meas. Tech., 9, 6051–6068, https://doi.org/10.5194/amt-9-6051-2016, 2016.
Morrical, B. D., Fergenson, D. P., and Prather, K. A.: Coupling two-step laser desorption/ ionization with aerosol time-of-flight mass spectrometry for the analysis of individual organic particles, J. Am. Soc. Mass Spectr., 9, 1068–1073, 1998.
Murphy, D. M.: The design of single particle laser mass spectrometers, Mass Spectrom. Rev., 26, 150–165, 2007.
Murphy, D. M. and Thomson, D. S.: Laser Ionization Mass Spectroscopy of Single Aerosol Particles, Aerosol Sci. Tech., 22, 237–249, 1995.
Murphy, D. M., Cziczo, D. J., Froyd, K. D., Hudson, P. K., Matthew, B. M., Middlebrook, A. M., Peltier, R. E., Sullivan, A., Thomson, D. S., and Weber, R. J.: Single-particle mass spectrometry of tropospheric aerosol particles, J. Geophys. Res.-Atmos., 111, D23S32, https://doi.org/10.1029/2006JD007340, 2006.
Neubauer, K. R., Johnston, M. V., and Wexler, A. S.: Humidity effects on the mass spectra of single aerosol particles, Atmos. Environ., 32, 2521–2529, 1998.
Passig, J., Schade, J., Oster, M., Fuchs, M., Ehlert, S., Jäger, C., Sklorz, M., and Zimmermann, R.: Aerosol Mass Spectrometer for Simultaneous Detection of Polyaromatic Hydrocarbons and Inorganic Components from Individual Particles, Anal. Chem., 89, 6341–6345, 2017.
Pereira, S. O., Trindade, T., and Barros-Timmons, A.: Biotinylation of optically responsive gold/polyelectrolyte nanostructures, Gold Bull., 48, 3–11, 2015.
Pratt, K. A., Mayer, J. E., Holecek, J. C., Moffet, R. C., Sanchez, R. O., Rebotier, T. P., Furutani, H., Gonin, M., Fuhrer, K., Su, Y., Guazzotti, S., and Prather, K. A.: Development and Characterization of an Aircraft Aerosol Time-of-Flight Mass Spectrometer, Anal. Chem., 81, 1792–1800, 2009.
Pratt, K. A. and Prather, K. A.: Mass spectrometry of atmospheric aerosols – Recent developments and applications, Part II: On-line mass spectrometry techniques, Mass Spectrom. Rev., 31, 17–48, 2012.
Reents, W. D. J., Downey, S. W., Emerson, A. B., Mujsce, A. M., Muller, A. J., Siconolfi, D. J., Sinclair, J. D., and Swanson, A. G.: Real-time compositional analysis of submicrometre particles, Plasma Sources Sci. T., 3, 369, https://doi.org/10.1088/0963-0252/3/3/020, 1994.
Reif, J., Costache, F., Eckert, S., and Henyk, M.: Mechanisms of ultra-short laser pulse ablation from ionic crystals, Appl. Phys. A, 79, 1229–1231, 2004.
Reilly, P. T. A., Lazar, A. C., Gieray, R. A., Whitten, W. B., and Ramsey, J. M.: The Elucidation of Charge-Transfer-Induced Matrix Effects in Environmental Aerosols Via Real-Time Aerosol Mass Spectral Analysis of Individual Airborne Particles, Aerosol Sci. Tech., 33, 135–152, 2000.
Reinard, M. S. and Johnston, M. V.: Ion Formation Mechanism in Laser Desorption Ionization of Individual Nanoparticles, J. Am. Soc. Mass Spectr., 19, 389–399, 2008.
Richard, E. R., Xianglei, M., Jhanis, J. G., and Jong-Hyun, Y.: Femtosecond vs. nanosecond laser pulse duration for laser ablation chemical analysis, Spectroscopy, 28, available at: http://www.spectroscopyonline.com/femtosecond-vs-nanosecond-laser-pulse-duration-laser-ablation-chemical-analysis (last access: 27 June 2018), 2013.
Roeterdink, W. G., Juurlink, L. B. F., Vaughan, O. P. H., Diez, J. D., Bonn, M., and Kleyn, A. W.: Coulomb explosion in femtosecond laser ablation of Si(111), Appl. Phys. Lett., 82, 4190–4192, 2003.
Sansonetti, J. E. and Martin, W. C.: Handbook of Basic Atomic Spectroscopic Data, J. Phys. Chem. Ref. Data, 34, 1559–2259, 2005.
Schoolcraft, T. A., Constable, G. S., Jackson, B., Zhigilei, L. V., and Garrison, B. J.: Molecular dynamics simulations of laser disintegration of amorphous aerosol particles with spatially nonuniform absorption, Nucl. Instrum. Meth. B, 180, 245–250, 2001.
Schoolcraft, T. A., Constable, G. S., Zhigilei, L. V., and Garrison, B. J.: Molecular Dynamics Simulation of the Laser Disintegration of Aerosol Particles, Anal. Chem., 72, 5143–5150, 2000.
Shen, X., Ramisetty, R., Mohr, C., Huang, W., Leisner, T., and Saathoff, H.: Laser ablation aerosol particle time-of-flight mass spectrometer (LAAPTOF): performance, reference spectra and classification of atmospheric samples, Atmos. Meas. Tech., 11, 2325–2343, https://doi.org/10.5194/amt-11-2325-2018, 2018.
Smith, G. D., Woods, E., DeForest, C. L., Baer, T., and Miller, R. E.: Reactive Uptake of Ozone by Oleic Acid Aerosol Particles: Application of Single-Particle Mass Spectrometry to Heterogeneous Reaction Kinetics, J. Phys. Chem. A, 106, 8085–8095, 2002.
Tsuji, T., Kakita, T., and Tsuji, M.: Preparation of nano-size particles of silver with femtosecond laser ablation in water, Appl. Surf. Sci., 206, 314–320, 2003.
Walsh, J. T. and Deutsch, T. F.: Measurement of Er:YAG laser ablation plume dynamics, Appl. Phys. B, 52, 217–224, 1991.
Weiss, M., Verheijen, P. J. T., Marijnissen, J. C. M., and Scarlett, B.: On the performance of an on-line time-of-flight mass spectrometer for aerosols, J. Aerosol Sci., 28, 159–171, 1997.
Whiteaker, J. R. and Prather, K. A.: Detection of Pesticide Residues on Individual Particles, Anal. Chem., 75, 49–56, 2003.
Woods, E., Smith, G. D., Miller, R. E., and Baer, T.: Depth Profiling of Heterogeneously Mixed Aerosol Particles Using Single-Particle Mass Spectrometry, Anal. Chem., 74, 1642–1649, 2002.
Xu, C., Long, Y., Qian, S., and Li, Y.: The generation mechanism of silicon oxide–aluminum oxide compound clusters by laser ablation of siliceous materials, Micropor. Mesopor. Mat., 39, 351–358, 2000.
Zaidi, A. A., Hu, A., Wesolowski, M. J., Fu, X., Sanderson, J. H., Zhou, Y., and Duley, W. W.: Time of flight mass spectrometry of polyyne formation in the irradiation of liquid alkanes with femtosecond laser pulses, Carbon, 48, 2517–2520, 2010.
Zaidi, A. A., Alkhesho, I., Karimi, R., Sanderson, J. H., and Duley, W. W.: Femtosecond laser ablation of solid methane, Int. J. Mass Spectrom., 376, 32–34, 2015.
Zawadowicz, M. A., Abdelmonem, A., Mohr, C., Saathoff, H., Froyd, K. D., Murphy, D. M., Leisner, T., and Cziczo, D. J.: Single-Particle Time-of-Flight Mass Spectrometry Utilizing a Femtosecond Desorption and Ionization Laser, Anal. Chem., 87, 12221–12229, 2015.
Zelenyuk, A. and Imre, D.: Single Particle Laser Ablation Time-of-Flight Mass Spectrometer: An Introduction to SPLAT, Aerosol Sci. Tech., 39, 554–568, 2005.
Zelenyuk, A., Yang, J., Choi, E., and Imre, D.: SPLAT II: An Aircraft Compatible, Ultra-Sensitive, High Precision Instrument for In-Situ Characterization of the Size and Composition of Fine and Ultrafine Particles, Aerosol Sci. Tech., 43, 411–424, 2009.
Zelenyuk, A., Imre, D., Earle, M., Easter, R., Korolev, A., Leaitch, R., Liu, P., Macdonald, A. M., Ovchinnikov, M., and Strapp, W.: In Situ Characterization of Cloud Condensation Nuclei, Interstitial, and Background Particles Using the Single Particle Mass Spectrometer, SPLAT II, Anal. Chem., 82, 7943–7951, 2010.
Zhou, L., Park, K., Milchberg, H. M., and Zachariah, M. R.: Understanding the Interaction of an Intense Laser Pulse with Nanoparticles: Application to the Quantification of Single Particle Mass Spectrometry, Aerosol Sci. Tech., 41, 818–827, 2007.