the Creative Commons Attribution 4.0 License.
the Creative Commons Attribution 4.0 License.
 | 30 Jul 2018
Development of an incoherent broadband cavity-enhanced absorption spectrometer for in situ measurements of HONO and NO2
Min Qin
Bin Ouyang
Wu Fang
Keding Lu
Ke Tang
Shuaixi Liang
Fanhao Meng
Zhaokun Hu
Pinhua Xie
Wenqing Liu
Rolf Häsler
Gaseous nitrous acid (HONO) is an important source of OH radicals in the troposphere. However, its source, especially that during daytime hours remains unclear. We present an instrument for simultaneous unambiguous measurements of HONO and NO2 with high time resolution based on incoherent broadband cavity-enhanced absorption spectroscopy (IBBCEAS). To achieve robust performance and system stability under different environment conditions, the current IBBCEAS instrument has been developed with significant improvements in terms of efficient sampling as well as resistance against vibration and temperature change, and the IBBCEAS instrument also has low power consumption and a compact design that can be easily deployed on different platforms powered by a high-capacity lithium ion battery. The effective cavity length of the IBBCEAS was determined using the absorption of O2-O2 to account for the “shortening” effect caused by the mirror purge flows. The wall loss for HONO was estimated to be 2.0 % via a HONO standard generator. Measurement precisions (2σ) for HONO and NO2 are about 180 and 340 ppt in 30 s, respectively. A field inter-comparison was carried out at a rural suburban site in Wangdu, Hebei Province, China. The concentrations of HONO and NO2 measured by IBBCEAS were compared with a long optical path absorption photometer (LOPAP) and a NOx analyzer (Thermo Fisher Electron Model 42i), and the results showed very good agreement, with correlation coefficients (R2) of HONO and NO2 being ∼0.89 and ∼0.95, respectively; in addition, vehicle deployments were also tested to enable mobile measurements of HONO and NO2, demonstrating the promising potential of using IBBCEAS for in situ, sensitive, accurate and fast simultaneous measurements of HONO and NO2 in the future.
- Article
(9027 KB) - Full-text XML
- BibTeX
- EndNote


Nitrous acid (HONO) is an important photochemical precursor of hydroxyl radical (OH) through Reaction (R1) and has been found worldwide to play a key role in enhancing the formation of photochemical smog and other secondary pollutants such as O3, HNO3 and secondary organic aerosols in polluted atmospheric boundary layers (Perner and Platt, 1979; Kleffmann et al., 1998, 2005).
Recent field and modeling studies have shown that Reaction (R1) contributes significantly to OH radical budgets not only during the early morning when the other HOx sources such as the photolysis of O3 and HCHO are still weak, but also throughout the entire day (Alicke et al., 2002; Kleffmann, 2007).
HONO can be emitted directly into the atmosphere through combustion processes such as biomass burning, industrial burning, domestic heating and internal combustion engine burning (Pitts Jr. et al., 1984; Kurtenbach et al., 2001; Xu et al., 2015). Additionally, HONO can also be formed through several homogeneous gas-phase reactions (Pagsberg et al., 1997; Zhang and Tao, 2010; Li et al., 2014) as well as the photolysis of different gaseous nitrophenols (Bejan et al., 2006). In addition to the gas-phase formation pathways, heterogeneous reactions between NO2 and water on surfaces are well known to produce HONO effectively (Kleffmann et al., 1998, 1999). In most occasions, emissions, homogeneous gas-phase and heterogeneous reactions were unable to fully match the observed high daytime HONO levels. Thus, photochemical processes were proposed to explain the missing HONO sources. The photolysis of surface-adsorbed nitrate () or nitric acid (HNO3) can lead to NO2 or HONO, which then partition to the gas phase (Zhou et al., 2011). Furthermore, Su et al. (2011) showed that nitrites could be a source of HONO through soil biological processes. To summarize, many HONO formation mechanisms have been proposed based on laboratory or field studies (Kleffmann, 2007; Spataro and Ianniello, 2014), and we suspect that the relative importance of these mechanisms varies depending on a number of factors such as geographic location (rural vs. urban), surface properties at the interested site, time of day (high vs. low actinic flux) and meteorological factors such as relative humidity.
Development of analytical instruments that are capable of providing accurate and fast HONO measurements is one of the primary and most crucial steps towards a full understanding of the atmospheric behavior of HONO. So far three major categories of techniques have been developed for HONO field measurements: wet chemistry, mass spectrometry and optical spectroscopy. Wet chemical techniques mainly contain annular denuder ion chromatography (annular denuder-IC; Ferm and Sjödin, 1985), wet denuder-IC (Neftel et al., 1996), mist chamber-IC (Dibb et al., 2004), DNPH(2,4-dinitrophenylhydrazone) derivatization/high-performance liquid chromatography (Zhou et al., 1999) and long optical path absorption photometer (LOPAP; Heland et al., 2001). These offer high sensitivities with detection limits in the lower ppt, but they generally measure gaseous HONO by absorbing it with liquid solutions to convert to nitrite anion. As a result, they are indirect measurements and may potentially suffer from chemical interferences and sampling artifacts. More recently, chemical ionization mass spectrometry has been used to measure HONO using I− ionization (Veres et al., 2015). Reported 3σ detection limit was ∼30 ppt, but dynamic calibration was required to derive sensitivity coefficient towards HONO detection.
Spectroscopic techniques for HONO detection are mostly based on differential optical absorption spectroscopy (DOAS; Perner and Platt, 1979), incoherent broadband cavity-enhanced absorption spectroscopy (IBBCEAS; Gherman et al., 2008), tunable diode laser spectroscopy (TDLS; Li et al., 2008) or laser-induced fluorescence (LIF; Liao et al., 2006).
Among these, IBBCEAS was first introduced by Fiedler et al. (2003). It offers in situ, high-sensitivity, chemical interference-free and direct concentration measurements (like DOAS) while maintaining high spatial resolution. IBBCEAS has been successfully deployed to measure many atmospheric trace gases like NO2, HONO, IO, O3, I2, IO, OIO, SO2, NO3, N2O5, CHOCHO, methylglyoxal and aerosol extinction coefficients. IBBCEAS has gradually been applied to the study of HONO (Gherman et al., 2008; Wu et al., 2011, 2014; Reeser et al., 2013; Scharko et al., 2014; Min et al., 2016), with continued improvements in sensitivity.
However, the results of the field inter-comparison between IBBCEAS and LOPAP in Hong Kong were far from satisfactory, and there were some inconsistencies in the quantitative assessment of HONO, and Wu et al indicated that IBBCEAS system stability might be perturbed by environmental and experimental conditions (such as variation of temperature, pressure, humidity, environmental vibration, etc.), and the accurate retrieval of HONO concentration was very challenging (Wu et al., 2014).
In this paper, we describe an incoherent broadband cavity-enhanced absorption spectrometer in detail. To achieve robust performance and system stability under different environment conditions, the current IBBCEAS instrument has been significantly improved in terms of efficient sampling as well as resistance against vibration and temperature change. The effective cavity length of the IBBCEAS, the wall loss of HONO, and the Allan variance analysis are discussed. We deployed the IBBCEAS instrument to simultaneously measure ambient concentrations of HONO and NO2 at a rural site (Wangdu, Hebei Province) in northern China from 26 June to 9 July 2014, and compared the results with a LOPAP instrument for HONO measurements and a NOx analyzer for NO2 measurements. In December 2014, the IBBCEAS instrument was successfully deployed in a car for mobile measurements of HONO and NO2 and results from this deployment will also be briefly presented.
2.1 Theory of IBBCEAS
The principle of the IBBCEAS system was systematically introduced by Fiedler et al. (2003) and will only be introduced briefly here. The optical extinction α(λ) in the cavity intrinsically consists of the absorption and scattering, caused by the gas samples. The light intensities transmitted through an empty cuvette and sample-filled cuvette are measured along with the effective absorption path length and α(λ) can be described as
where R(λ) is the wavelength-dependent reflectivity of mirrors, I(λ) is the light intensities transmitted through the optical cavity with the absorbing species inside, I0(λ) is the light intensities transmitted through the empty optical cavity without absorbing trace gases or aerosols at the same temperature and pressure as the sample spectrum, αRay(λ) is the wavelength-dependent extinction coefficient for Rayleigh scattering at the same pressure and deff is the effective cavity length. Concentrations of the light-absorbing gases are obtained by applying nonlinear least squares fittings to the observed absorption coefficients using the DOASIS program (Kraus, 2006).
2.2 Optical system
The IBBCEAS instrument consists of a UV LED light source, two highly reflective mirrors, an optical cavity and a spectrometer (Fig. 1). The light emitted by the UV LED (365 nm, LZ1-00UV00, LEDengin) was directly coupled to the optical cavity by an achromatic lens (f=60 mm, Edmund), which was then reflected back and forth between the two highly reflective mirrors (CRD Optics) resulting in a long photon residence time and long optical path length. The light transmitted through the cavity was coupled into an optical fibre (600 µm, Ocean Optics) by another achromatic lens (f=60 mm, Edmund) which was finally received by a charge coupled device (CCD) spectrometer (QE65000, Ocean Optics).

Figure 1(a) Photograph of the IBBCEAS instrument (the case was removed for this picture to show the structure of the IBBCEAS instrument); (b) schematic of the IBBCEAS instrument.
The near-ultraviolet LED was supplied by a 1000 mA constant current source and emitted about 1680 mW optical power at around 365 nm with full width at half maximum (FWHM) of 13 nm. To maintain the stability of the light source, the LED was mounted on a temperature-controlled cooling stage stabilized at 20±0.05 ∘C by a temperature sensor (PT1000) and a thermoelectric cooler. The highly reflective mirrors (1 m radius of curvature) were mounted on each end of the PFA optical cavity (separated by 55 cm). While spectral filtering of the LED's FWHM seems unnecessary, there is unwanted stray light caused by slight impurity in the chip epitaxy at wavelengths outside the high reflectivity range. Thus, a band-pass filter (BG3, Newport) was placed at the end of the optical cavity to prevent it from entering the spectrometer.
2.3 Flow system
As shown in Fig. 1b, ambient air was drawn through the particle filter and the air inlet tube (OD 4 mm, length 3 m) by a gas pump (KNF) at 6 SLPM (standard liters per minute) so that the residence time of the sampled air in the inlet tube was less than 0.5 s. Part of the air sample went into the optical cavity, and the rest went through a bypass tube. A rotameter was used to control the air flow rate in the bypass gas line. Air pressure, temperature and humidity were measured at the outlet of the cavity. To minimize the wall loss of HONO, materials for the inlet tube and the optical cavity were exclusively PFA Teflon, well known for its chemical inertness.
Strong Mie scattering during high aerosol loading periods greatly shortens the effective optical length and degrades the IBBCEAS detection sensitivity (Wu et al., 2014). As a result, aerosol particles were removed by a 1 µm PTFE filter membrane (Tisch Scientific) placed in front of our IBBCEAS instrument inlet. Further protection was done by continuously purging the two mirrors with high purity N2 to block the contact between the mirrors and the sample airflow. Flow rates of these two purge lines were controlled at ∼0.1 SLPM by two mass flow controllers (MFCs, CS200A, Sevenstar). A third MFC was used to control the sample flow rate at 1–3 SLPM.
For the measurements at rural or farmland sites, relative humidity in sampling flow was usually very high, especially in the mornings. To avoid water condensation in the inlet line, sampling tube of our IBBCEAS instrument was heated to using temperature-controlled heating wires.
2.4 Hardware
This IBBCEAS instrument has been developed with significant improvements in terms of efficient sampling as well as resistance against vibration and temperature change to achieve robust performance in different field environments. For example, we found that the parameters of the CCD spectrometer changed with temperature especially when it dropped below 5 ∘C. To ensure the IBBCEAS works across a wide ambient temperature range (5–35 ∘C), insulation foam was attached to the internal walls of the instrument shell, and infrared heating lamps and cooling fans were incorporated in the IBBCEAS instrument so that the internal temperature of the instrument can be regulated to suitable temperatures using a PID feedback loop.
To overcome the effect of vibrations for the measurements on mobile platforms, the PFA optical cavity were enfolded in the tailor-made stainless steel pipe shroud and fixed on a 12 mm thick aluminium plate, and anti-vibration mounts were utilized at the bottom of the IBBCEAS instrument frame. Experimental results have demonstrated that normal vibrations should not affect spectral stability of this instrument.
The IBBCEAS instrument has low power consumption. The UV LED light source, the temperature control system of UV LED and the gas pump are rated at 5, 15 and 35 W, respectively. The total power consumption of the spectrometer, the various sensors, mass flowmeters and the thermostat cooling fan is about 40 W. Thus, the total power usage of the instrument is less than 100 W excluding the notebook computer. It can be powered for dozens of hours by a high-capacity lithium ion battery.
A photograph of the IBBCEAS instrument used in rural measurements (CAREBEIJING-NCP 2014 campaign) is shown in Fig. 1a, and the whole system is controlled via a computer. The photograph shows that the IBBCEAS instrument, at 1100 mm (L) × 220 mm (W) × 270 mm (H), is smaller than other IBBCEAS instruments (Kennedy et al., 2011; Wu et al., 2014; Min et al., 2016). It can be easily placed in a car or airplane for field application for measuring HONO and NO2.
3.1 Calibrations of mirror reflectivity
IBBCEAS is different from differential optical absorption spectroscopy (DOAS). The optical path length in DOAS can be measured directly, but according to Eq. (1), the mirror reflectivity in IBBCEAS must be accurately determined before concentration calculation. Here, methods widely used to calibrate mirror reflectivity (through the difference of Rayleigh scattering or a known concentration of an absorber) were compared.
The first method uses gases (He and N2) with different Rayleigh scattering cross sections. The mirror reflectivity curve can be calculated with Eq. (2) as described by Washenfelder et al. (2008).
where and IHe(λ) are the light intensities transmitted through the optical cavity when the cavity is filled with N2 or He, respectively, and are the extinction coefficients caused by Rayleigh scattering of N2 and He, respectively, and d0 is the length of the cavity. Note that d0 is different from deff. Because the entire cavity is filled with the calibration gases in this step. N2 (99.9999 %) or He (99.9999 %) are added to the cavity at 0.1 SLPM. The IBBCEAS instrument then records stable N2 and He spectra and the reflectivity of the mirrors can be calculated from Eq. (2).
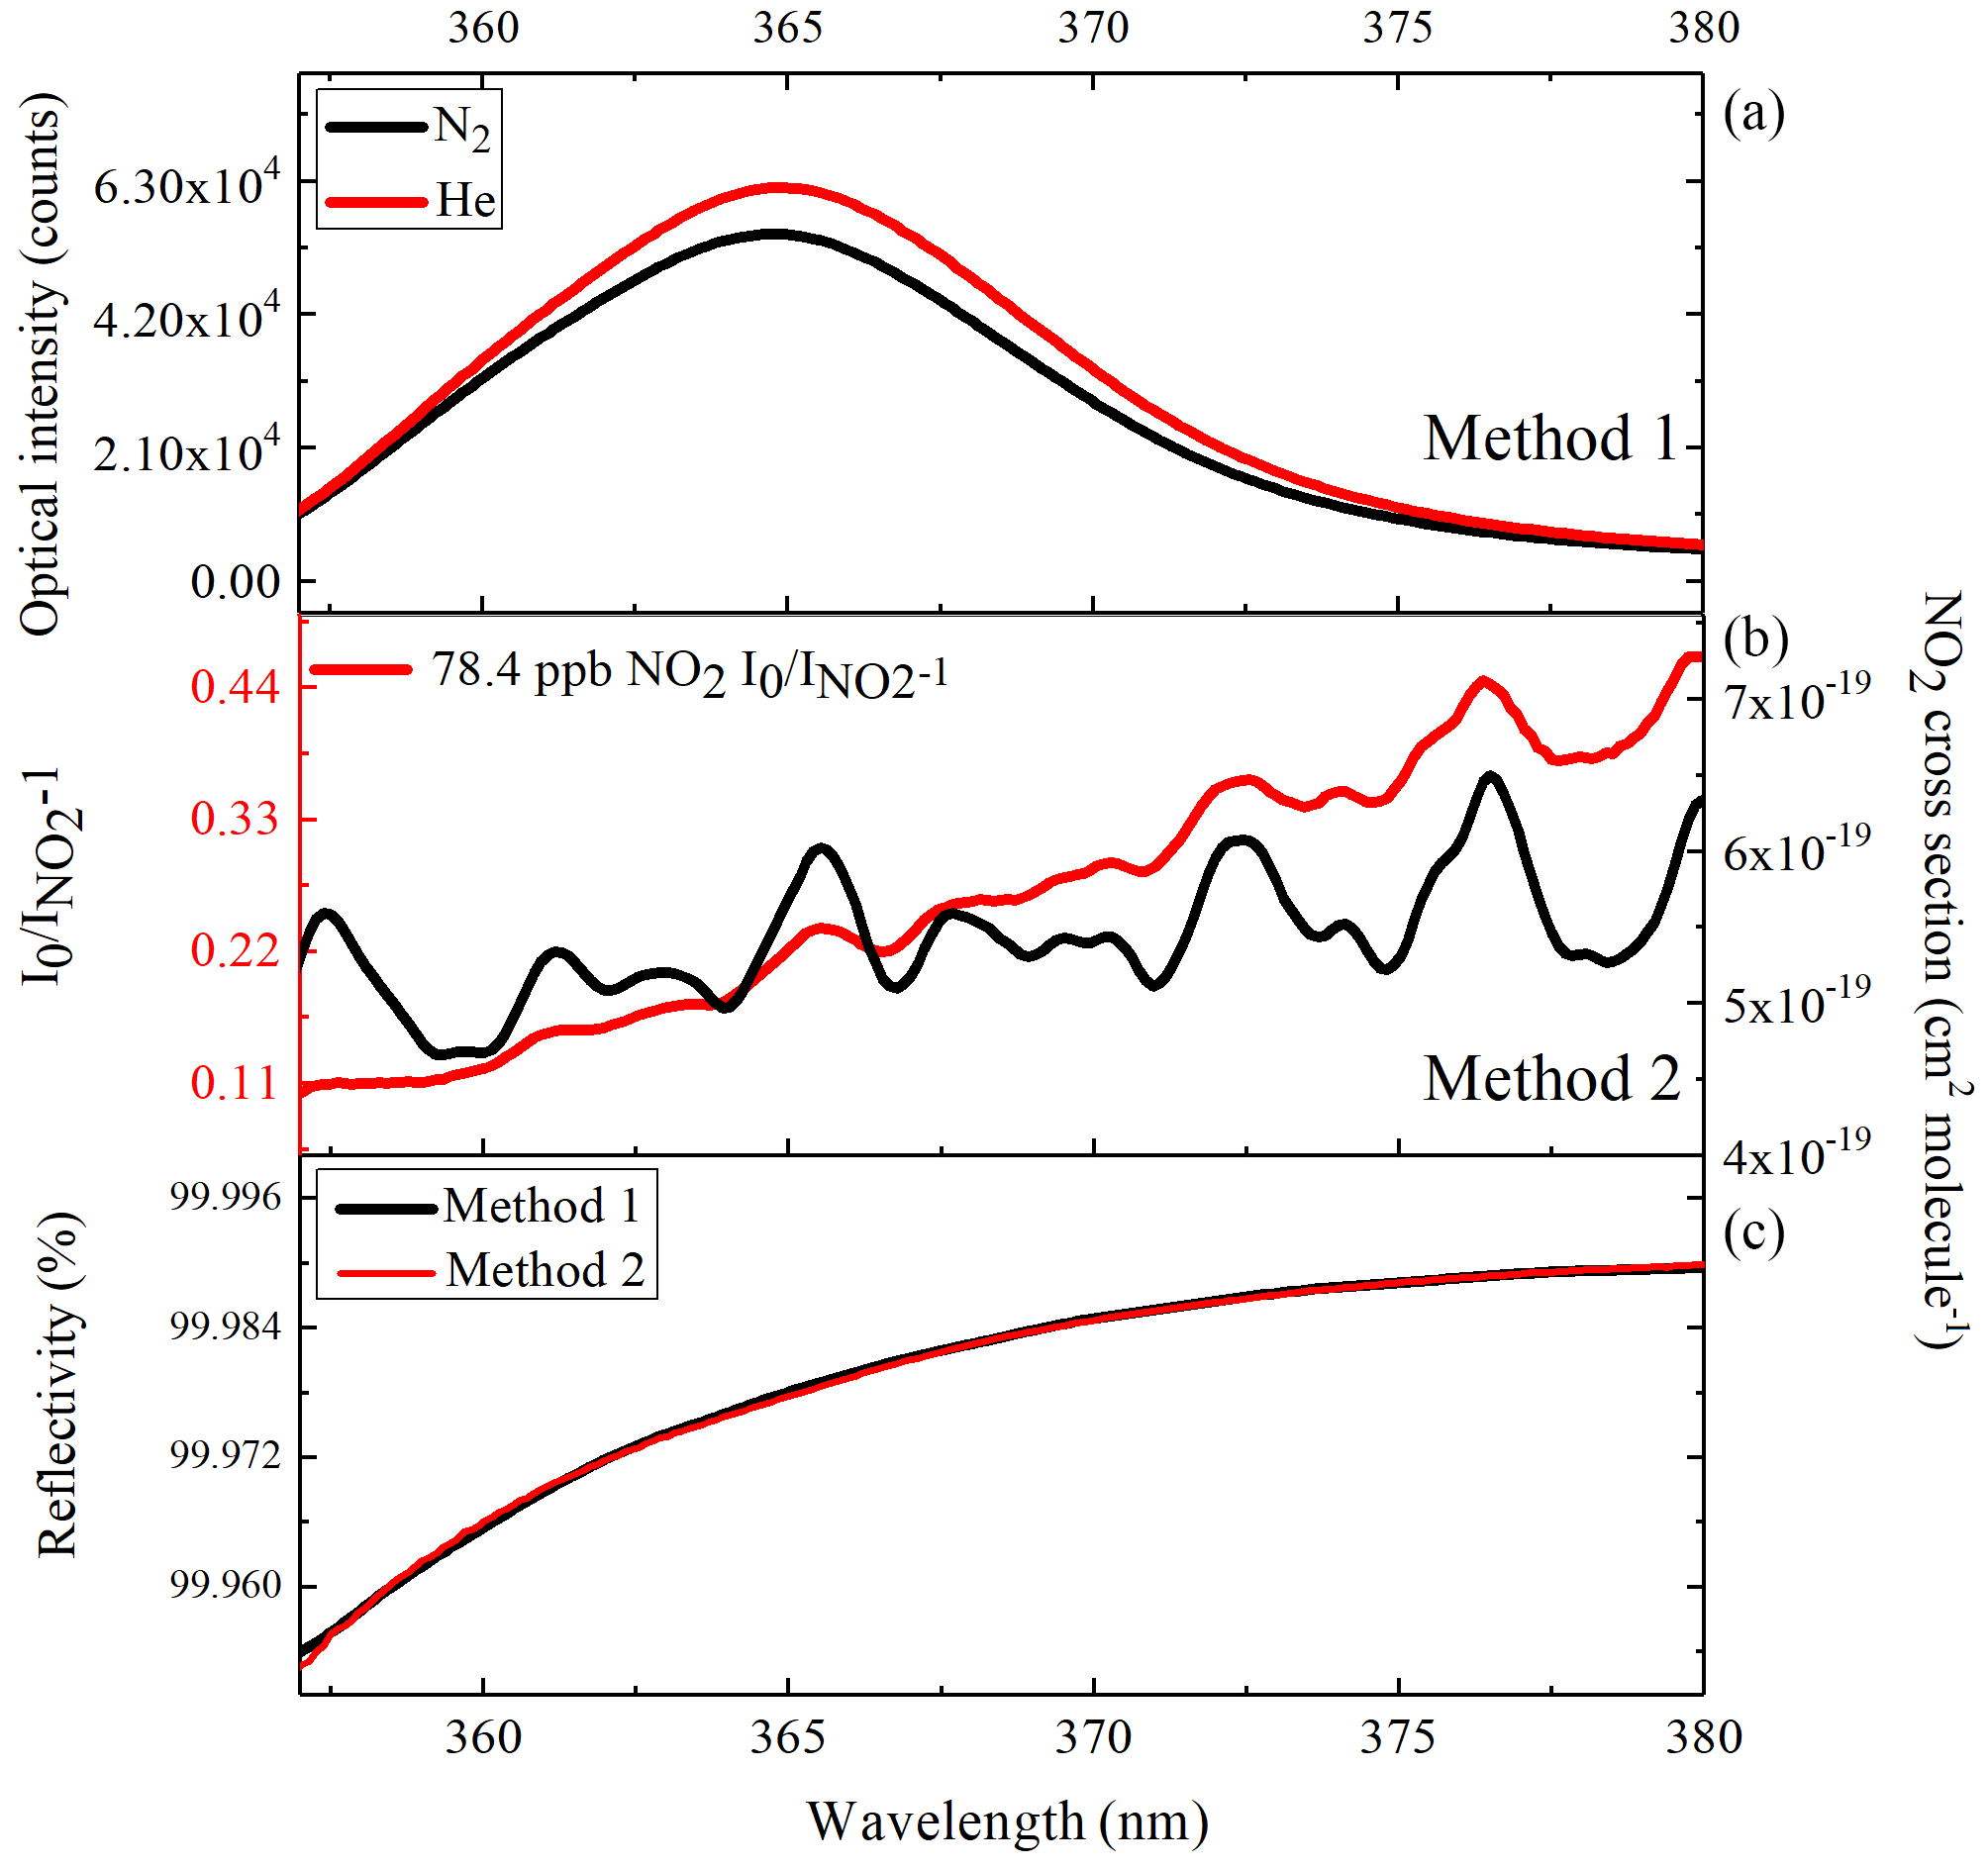
Figure 2(a) The red curve is the transmitted intensity spectrum when the cavity is filled with He, and the black curve is that when the cavity is filled with N2; (b) the red curve is the absorption spectrum of 78.4 ppb NO2 seen by IBBCEAS, and the black curve is the NO2 cross section; (c) the derived curve of mirror reflectivity.
The second method uses a known concentration of NO2. To get the accurate concentration of NO2, we used a mixture of standard NO and O3 and then diluted it in high-purity N2 gas, and mirror reflectivity curve at the same temperature and pressure as the normal sampling measurements can be calculated with the reverse process of Eq. (1).
During CAREBEIJING-NCP campaign, we calibrated the mirror reflectivity by these two different methods in a container and the results are shown in Fig. 2. Reflectivity curves obtained from the two methods between 359 and 380 nm are shown in Fig. 2c, which exhibit excellent agreement. The mirror reflectivity at HONO peak absorption wavelength (368.2 nm) was found to be ∼0.99983 during CAREBEIJING-NCP campaign.
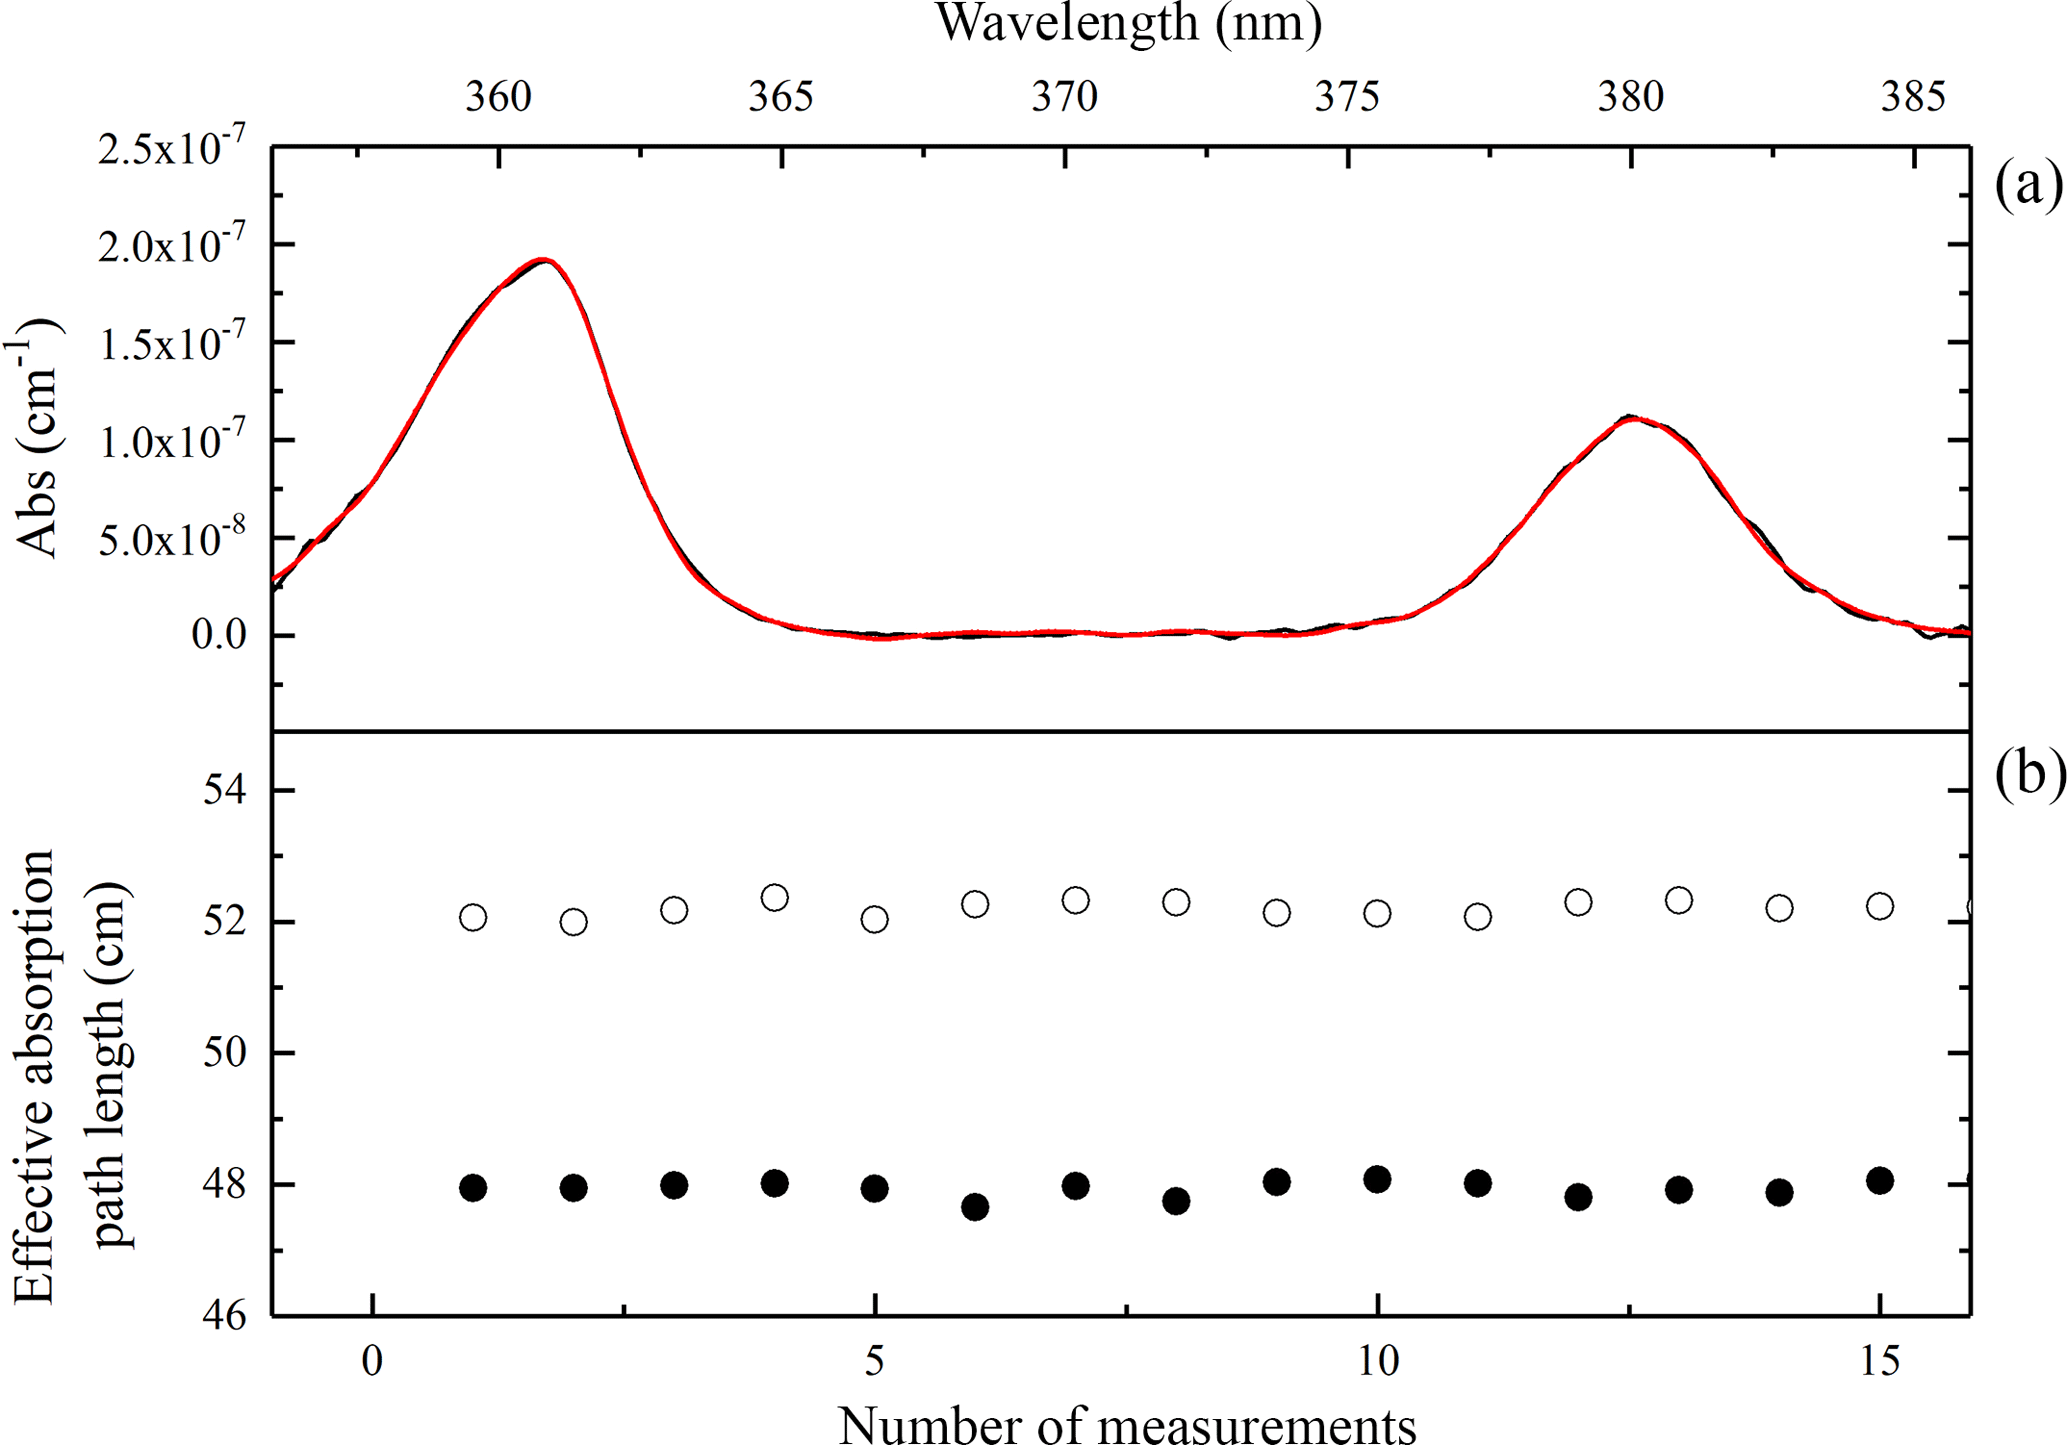
Figure 3(a) Examples of concentration retrieval with O2-O2. Here, the black line is the measured spectrum and the red line is the fitted O2-O2 absorption spectrum. (b) The black dots are the effective absorption path length with 0.1 SLPM purge flows and 1 SLPM sampling flow, and the circles are the effective absorption path length with 0.1 SLPM purge flows and 3 SLPM sampling flow.
3.2 Effective cavity length
Reflectivity of the mirrors employed in IBBCEAS is usually > 99.95 %. If contaminants in the airflow come into contact with the mirrors for a long time, aerosol particles or organic species might get adsorbed on the surfaces of the mirrors, causing reflectivity degradation. Without protection, surfaces of highly reflective mirrors are easily contaminated, particularly in severely polluted areas like northern China. A common practice, as is also adopted in the current study, is that two purge lines are placed in front of the mirrors, creating a volume that is filled with high-purity N2 instead of sample gas. This has the effect of reducing the effective absorption pathlength inside the cavity, which should be characterized through proper experiments.
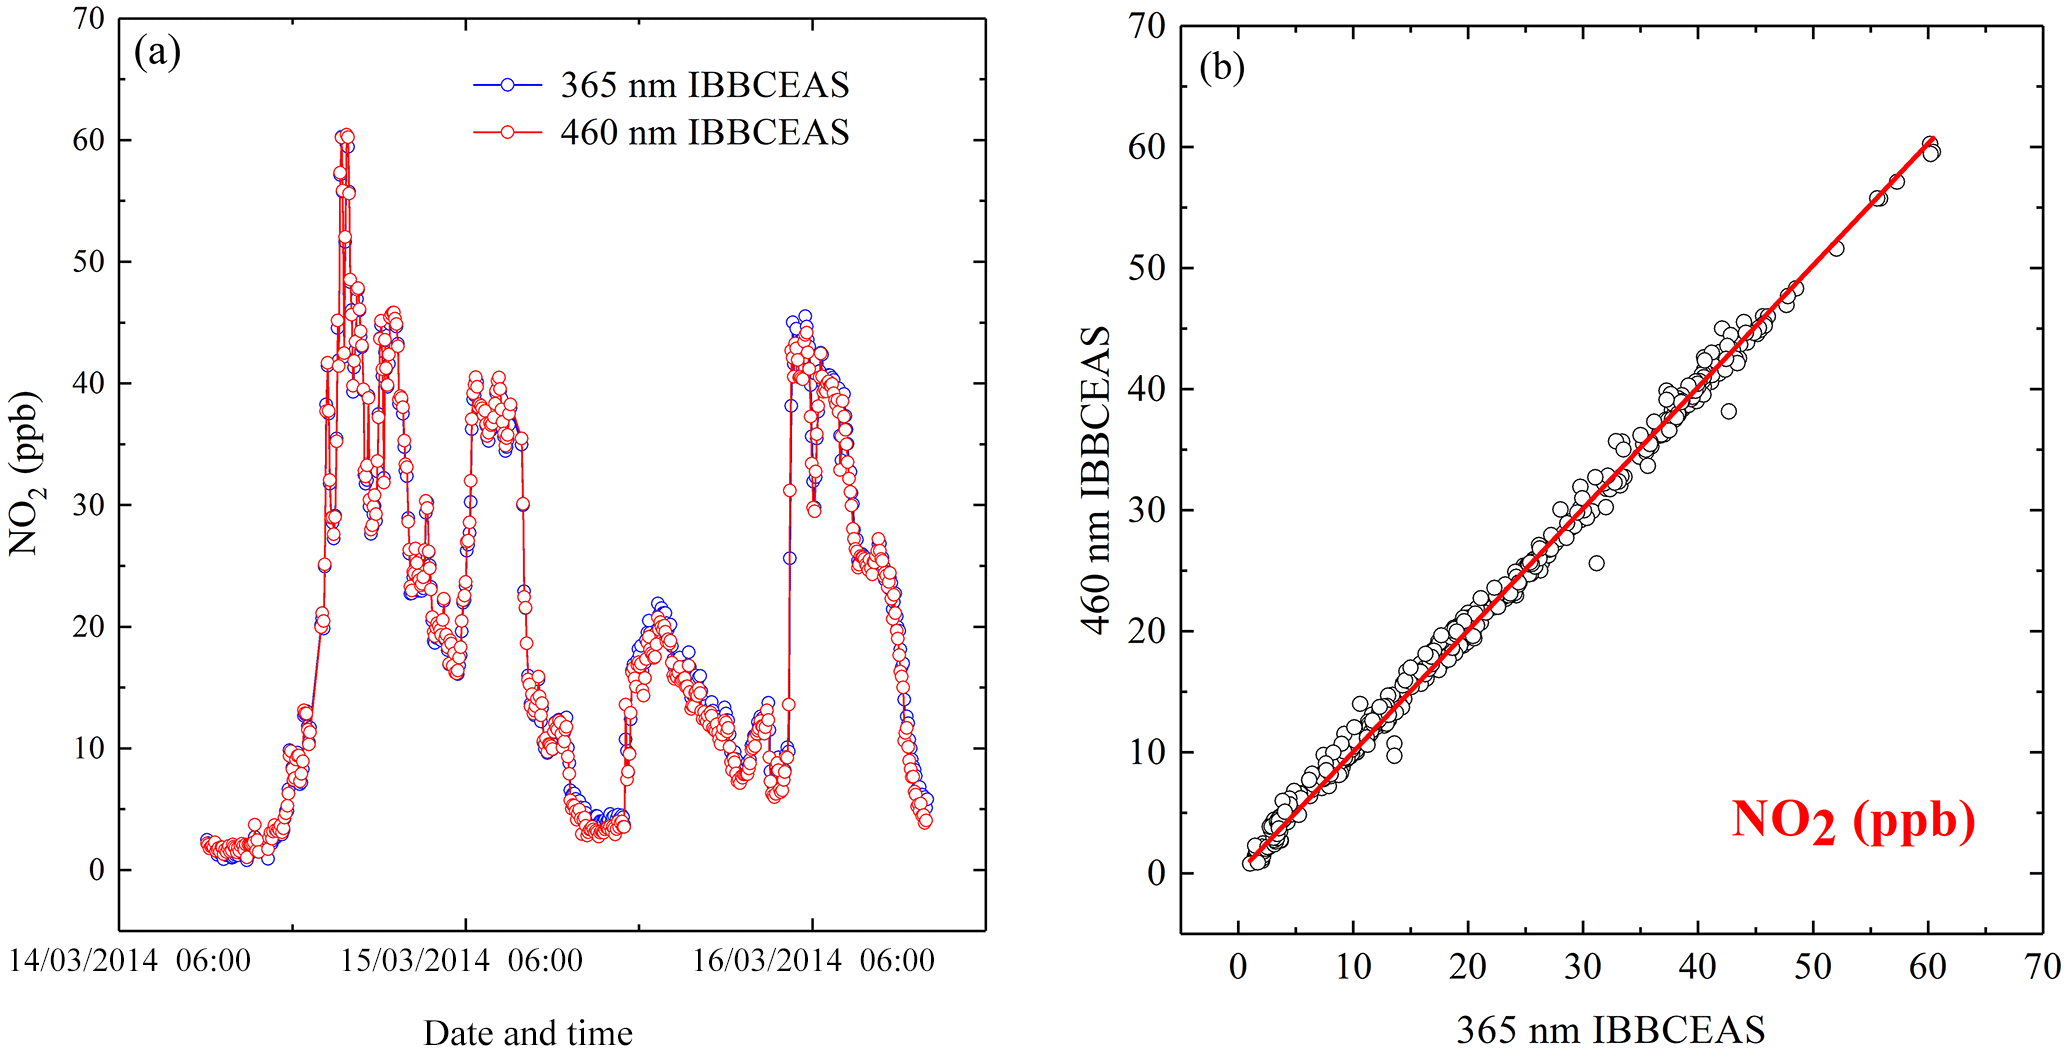
Figure 4(a) Time series measurements of NO2 from the 365 nm IBBCEAS and 460 nm IBBCEAS. (b) Correlation plot of between the two NO2 measurements.
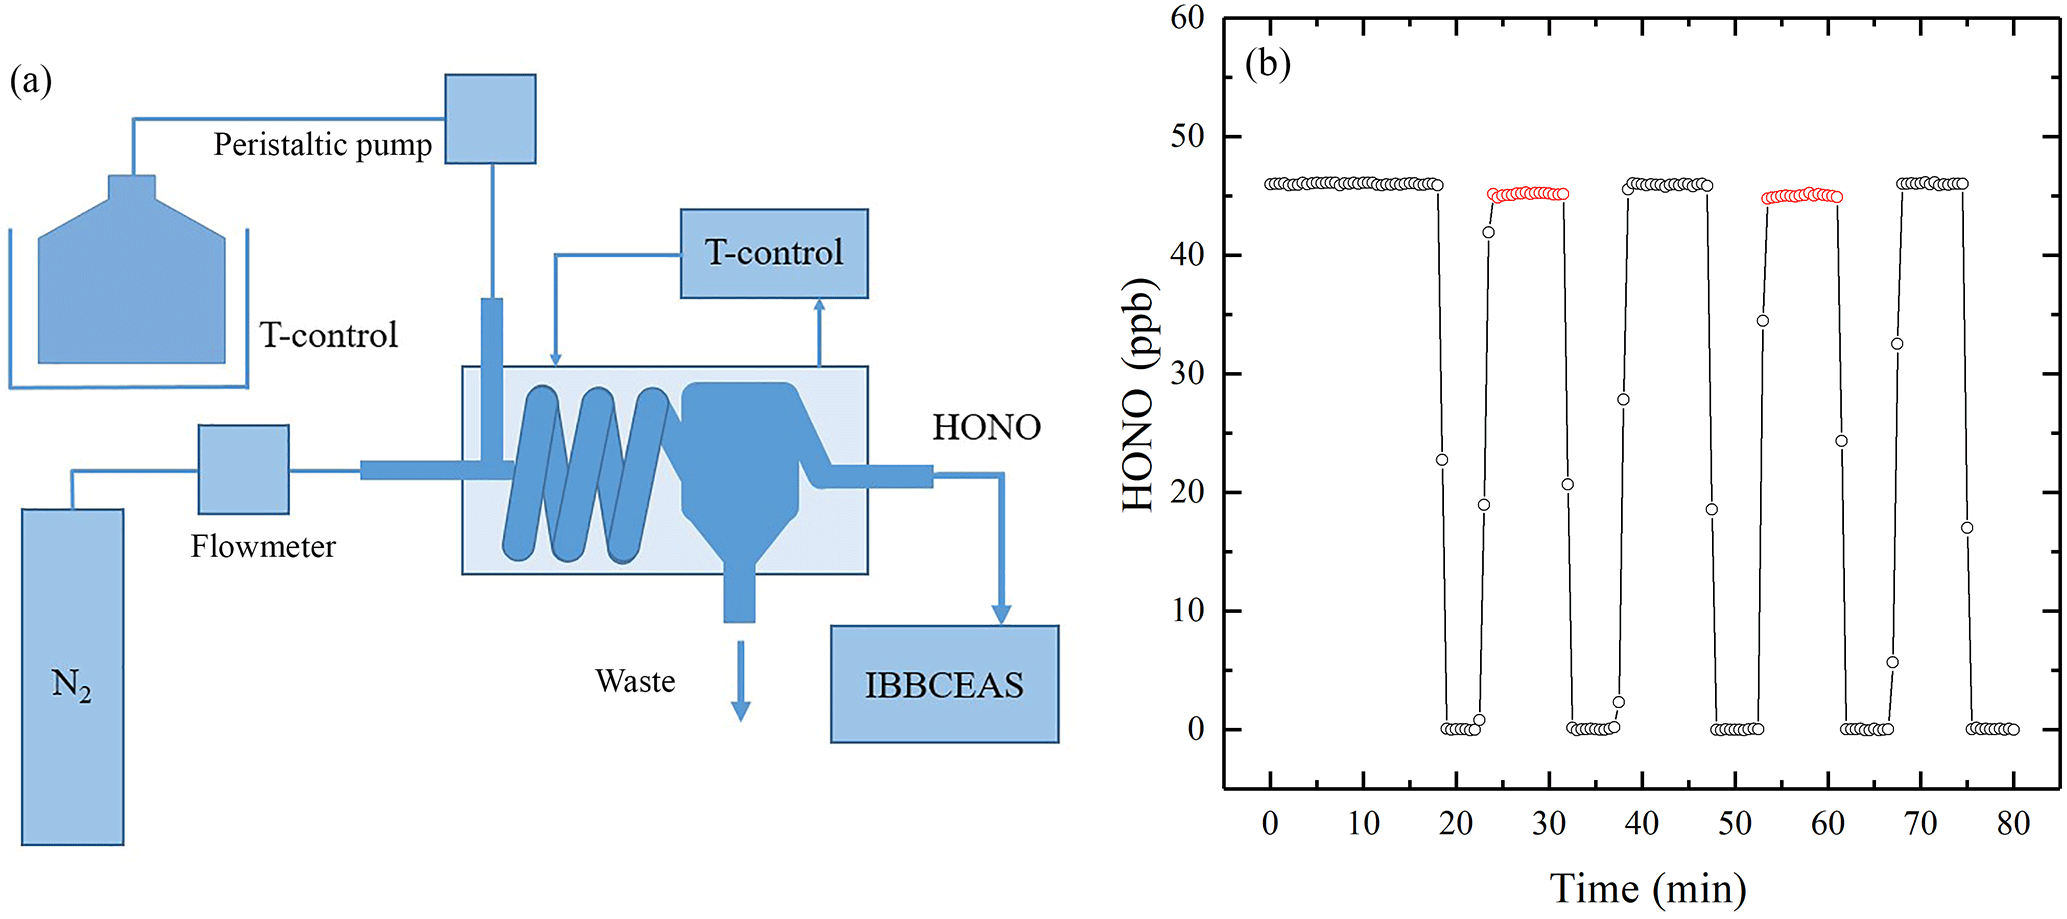
Figure 5(a) The schematic of HONO standard generator. (b) Black circles correspond to observed [HONO] from the HONO standard generator; red circles correspond to the measured [HONO] with the extra 1 m PTFE filter, 3 m PFA inlet tube and the simulative PFA optical cavity tube added in front of the IBBCEAS instrument.
3.2.1 Past practices of determining the effective cavity length
To quantify this effect, Meinen et al. (2010) utilized computational fluid dynamics to calculate the characteristics of the flow inside the cavity. Thalman and Volkamer (2010) and Kennedy et al. (2011) determined the effective cavity length through calibrations with known amounts of water vapor. Hoch et al. (2014) placed the gas inlet of the IBBCEAS instrument in the middle of cavity, and the effective cavity length was taken as being the distance between the two gas outlets. Similarly, Vaughan et al. (2008) estimated the effective absorption path length as the distance between the point of introduction of the sample and the pump outlet. Johansson et al. (2014) believed that the effective cavity length is a function of the purge flow rate for a certain sample flow. They calibrated using known concentrations of I2. However, Reeser et al. (2013) and Scharko et al. (2014) reckoned that the effect of the mirrors' purge flow on the final measured concentration was negligible.
3.2.2 Determining the effective cavity length by pure oxygen
In the spectral range of the 365 nm LED, NO2 (Voigt et al., 2002), HONO (Stutz et al., 2000) and O2-O2 collision pair (Greenblatt et al., 1990) have clear absorption peaks. In this paper, pure oxygen was utilized to quantify the effective cavity length making use of the fact that the O2-O2 collision pair has two absorption peaks near 361 and 380 nm. Furthermore, it is easy to obtain, and its concentration can be known with high accuracy.
Particle-free standard gases were used in this experiment. Nominal [O2] can be retrieved from the observed absorption of the O2-O2 pair, with or without purging flows. The value of deff is calculated as
where [O2]on and [O2]off are the retrieved [O2] (from the O2-O2 absorption) with or without the purge flows. Using this method, the geometric cavity length of the IBBCEAS instrument was 55.0 cm and the effective cavity length was determined to be 48.0±0.5 cm when the sample flow of pure oxygen is 1 SLPM and the two purge flows are both 0.1 SLPM, as shown in Fig. 3.
The above result shows that in our case the effect of the mirrors' purge flow on the final measured concentration is not negligible. We also note that for the current IBBCEAS instrument, the determined effective absorption path length is not equal to the distance between the inlet and outlet of the sample flow.
3.2.3 Verification of the effective cavity length
To verify the accuracy of the effective cavity length derived using pure oxygen, results from this 365 nm IBBCEAS instrument were compared with those from another 460 nm LED IBBCEAS instrument that runs without purge flows. To distinguish the two IBBCEAS instruments, 365 nm IBBCEAS and 460 nm IBBCEAS are used hereafter, and the 460 nm IBBCEAS have been described in another paper (Ling et al., 2013).
A 2-day atmospheric measurement of NO2 was deployed on the sixth floor of the laboratory building (northwest of Hefei, China) from 11:00, 14 March 2014, to 11:00, 16 March 2014. Time is given in this paper as CST (China standard time, UTC + 8 h). The two IBBCEAS instruments shared the same sample inlet. The sample flow was filtered with a PTFE filter to remove atmospheric aerosols and then divided into two gas lines of the instruments. Time series of NO2 by the 365 nm IBBCEAS and 460 nm IBBCEAS are shown in Fig. 4a. During this period, concentration of NO2 varied between 0.8 and 60 ppb with a time-averaged value of 19.5 ppb. The combined data sets are shown in Fig. 4b with least-square fitting giving R2=0.996, a slope of 0.988±0.0027 and an intercept of 0.503±0.0064 ppb, which demonstrates the accuracy of the proposed method in deriving deff for the 365 nm IBBCEAS.
3.3 Sample loss and secondary formation
3.3.1 Sample loss
Unlike DOAS or open-path IBBCEAS, close-path IBBCEAS instrument has wall surfaces which means that potential sample loss and secondary formation for HONO on surfaces should both be considered.
To determine if the sample loss of HONO, a HONO standard generator was developed to supply stable concentrations of HONO (Kleffmann et al., 2004; Liu et al., 2016). The schematic of the HONO standard generator is shown in Fig. 5a, and it contains a mixed solution of NaNO2, dilute sulfuric acid, a peristaltic pump, a mass flowmeter, a thermostatic bath and a custom-made spiral tunnel. The mixture solution of NaNO2 and dilute sulfuric acid and the spiral tunnel were both cooled by the thermostatic bath. The mixed liquid was pumped into the spiral tunnel by a peristaltic pump, and pure nitrogen was simultaneously added as controlled by a mass flowmeter. Under acidic conditions, HNO2(l) dissolved in the solution evaporates. If temperature (5 ∘C) and flow rates of the mixture solution (2 L min−1) and nitrogen (2 L min−1) are held constant, a stable concentration of gaseous HONO can be generated. Additionally, we could change the HONO concentration easily by changing the key parameters of the HONO standard generator.
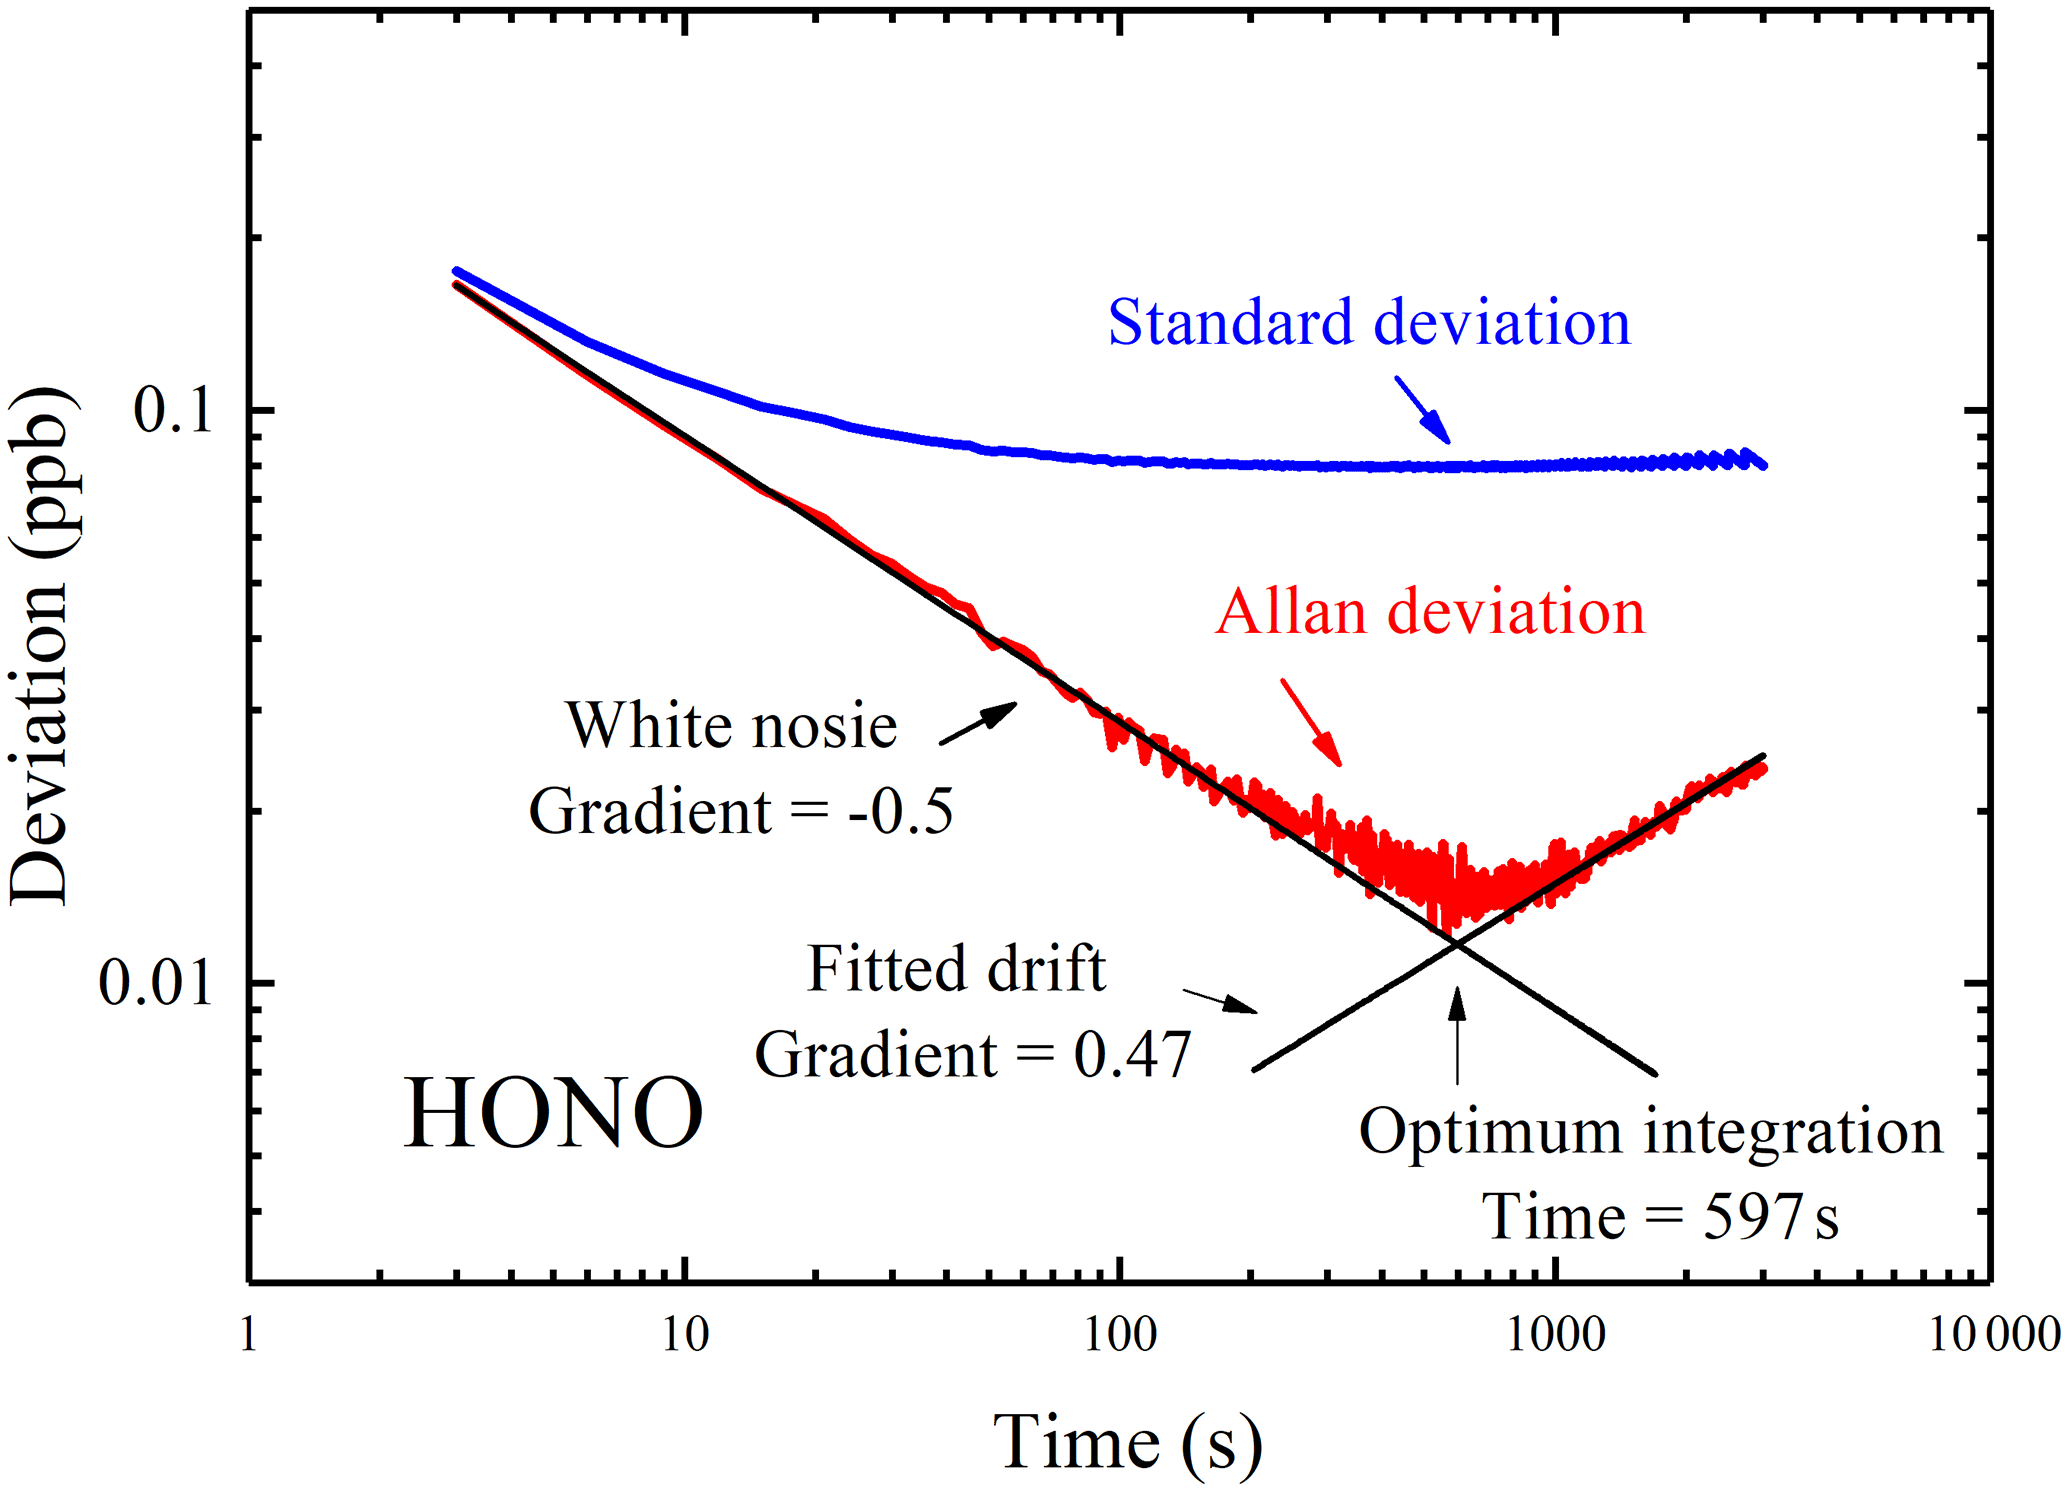
Figure 6Standard deviation and Allan deviation plots for measurements of HONO. For integration times of below 110 s the Allan deviation decreases approximately as (gradient of −0.5). The minima of the Allan deviation indicate the optimum averaging time for maximum detection performance.
This experiment was operated in the laboratory as follows:
-
HONO from the standard generator directly flowed into the IBBCEAS instrument, with its steady-state concentration measured by IBBCEAS.
-
The HONO source was replaced by a fast N2 flow (10 SLPM) which was kept running for about 5 min.
-
A second 1 µm PTFE filter, 3 m length PFA inlet tube and a piece of PFA tube of the same dimension as that of the optical cavity were added upstream of the IBBCEAS cavity to reproduce any potential loss on the particle filter, inlet and cavity walls. The HONO flow was re-introduced through the extra components and the IBBCEAS cavity and the new steady-state HONO concentration was measured by IBBCEAS.
-
The particle filter, PFA inlet tube and the PFA “cavity” tube were all removed, and pure nitrogen was again run through the IBBCEAS instrument.
In this experimental cycle, the relative humidity(RH) was about 65 % and temperature was about 23 ∘C, the sample loss of the IBBCEAS instrument for HONO was found to be about 2.0 % (from average 46.0 ppb to average 45.1 ppb), as shown in Fig. 5b. We also repeated this experiment at different RH levels, and found that the sample loss of the IBBCEAS instrument for HONO was about 2.1 % at 25 % RH and about 1.9 % at 50 % RH, suggesting a weak RH dependence of the sample loss of the IBBCEAS instrument for HONO. Furthermore, we also studied the sample loss of the IBBCEAS instrument for NO2 as the similar approach and found that it was negligible.
Meanwhile, we found that once the fast N2 flow was introduced into the IBBCEAS, the observed [HONO] rapidly fell below the detection limit, suggesting that the amount of HONO adsorbed on the surface of the filter or PFA tubes might be negligibly small.
In addition, varying the current supply could change the emission intensity of the LED light source. The observed [HONO] saw little change, suggesting that photolysis of HONO by the 365 nm UV LED inside the optical cavity is negligible.
3.3.2 Secondary formation
To investigate any potential secondary HONO formation on the inlet or cavity walls from NO2, about 80 ppb NO2 at different RH levels (about 20 % RH, 30 % RH, 50 % RH and 70 % RH) flowed through a 3 m PFA inlet tube into the IBBCEAS instrument for a long time at typical sampling flow rates, respectively, no [HONO] was observed in the optical cavity, suggesting that the secondary HONO formation is negligible for this IBBCEAS instrument under this typical operation condition. However, for the complex field condition, possible contribution from artificially produced HONO along the inlet line and/or in instrument are more difficult to characterize under different atmospheric conditions. For this work, we have made efforts to minimize HONO sampling artifacts. The inlet and optical cavity made exclusively of PFA Teflon (well known for its chemical inertness) were used to minimize the generation and wall loss of HONO and the air flow rate was increased to reduce the residence time.
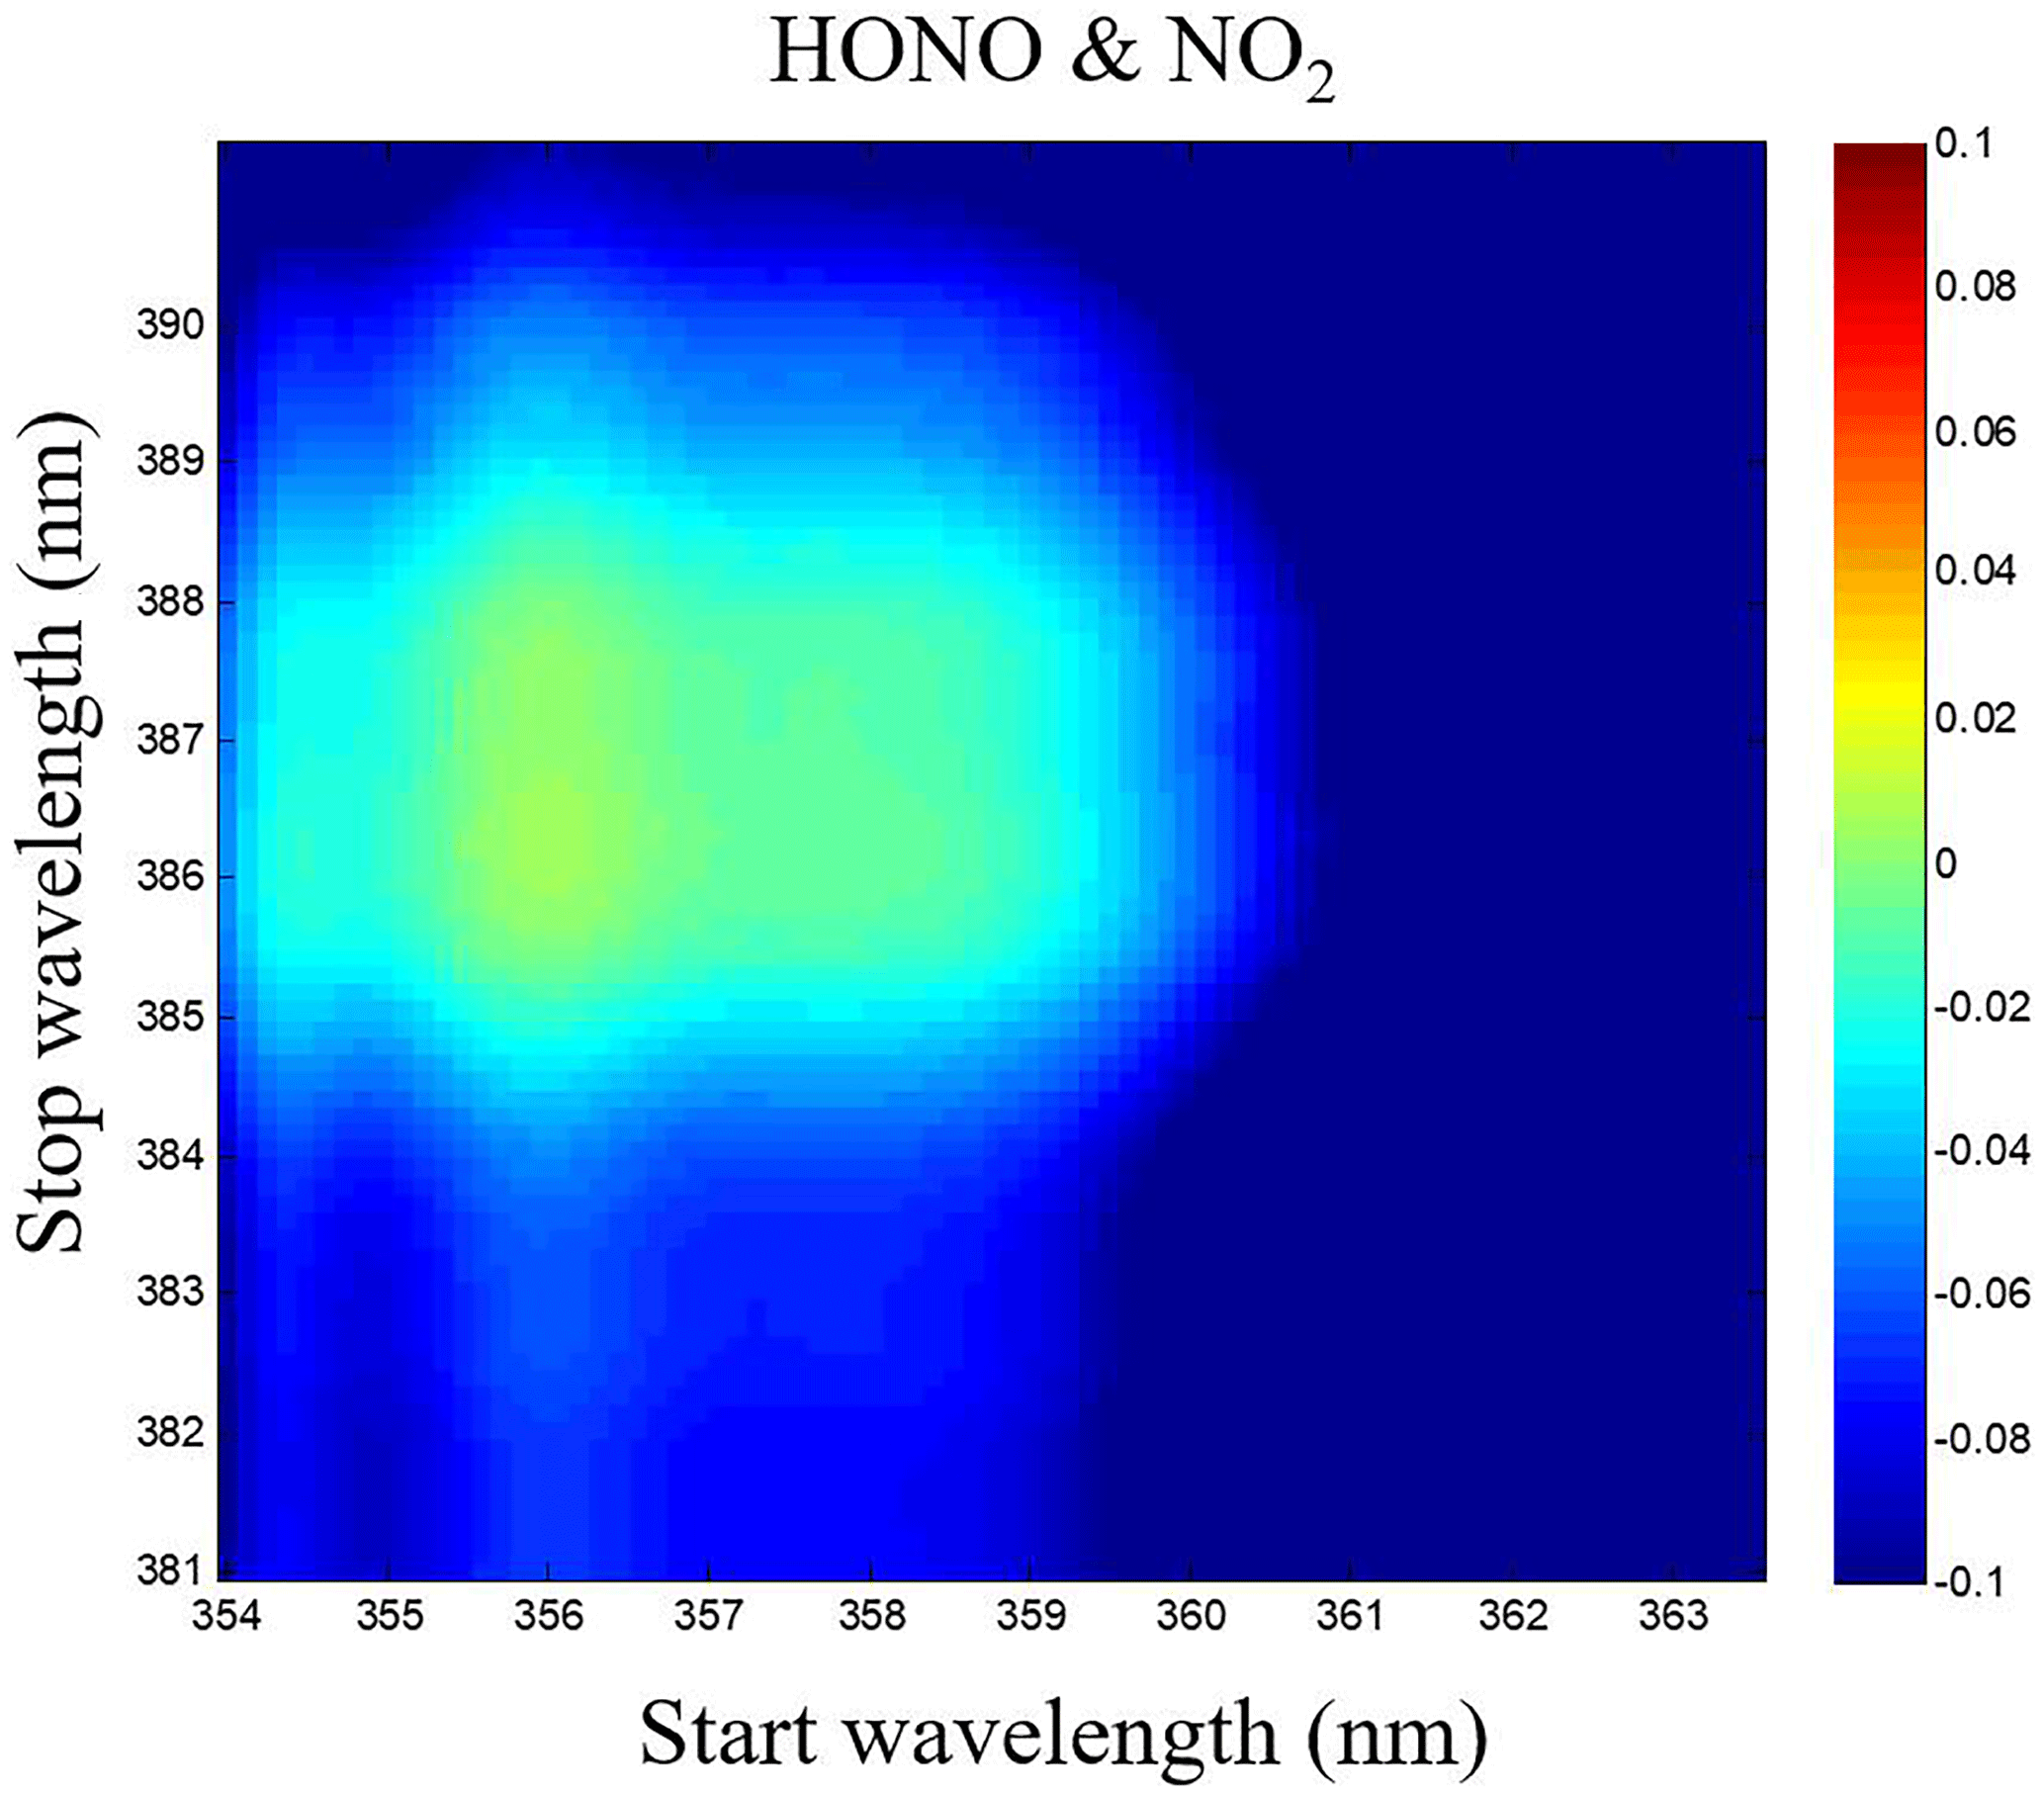
Figure 7Correlations matrix of HONO and NO2 for different wavelength intervals in the 354–391 nm wavelength range.
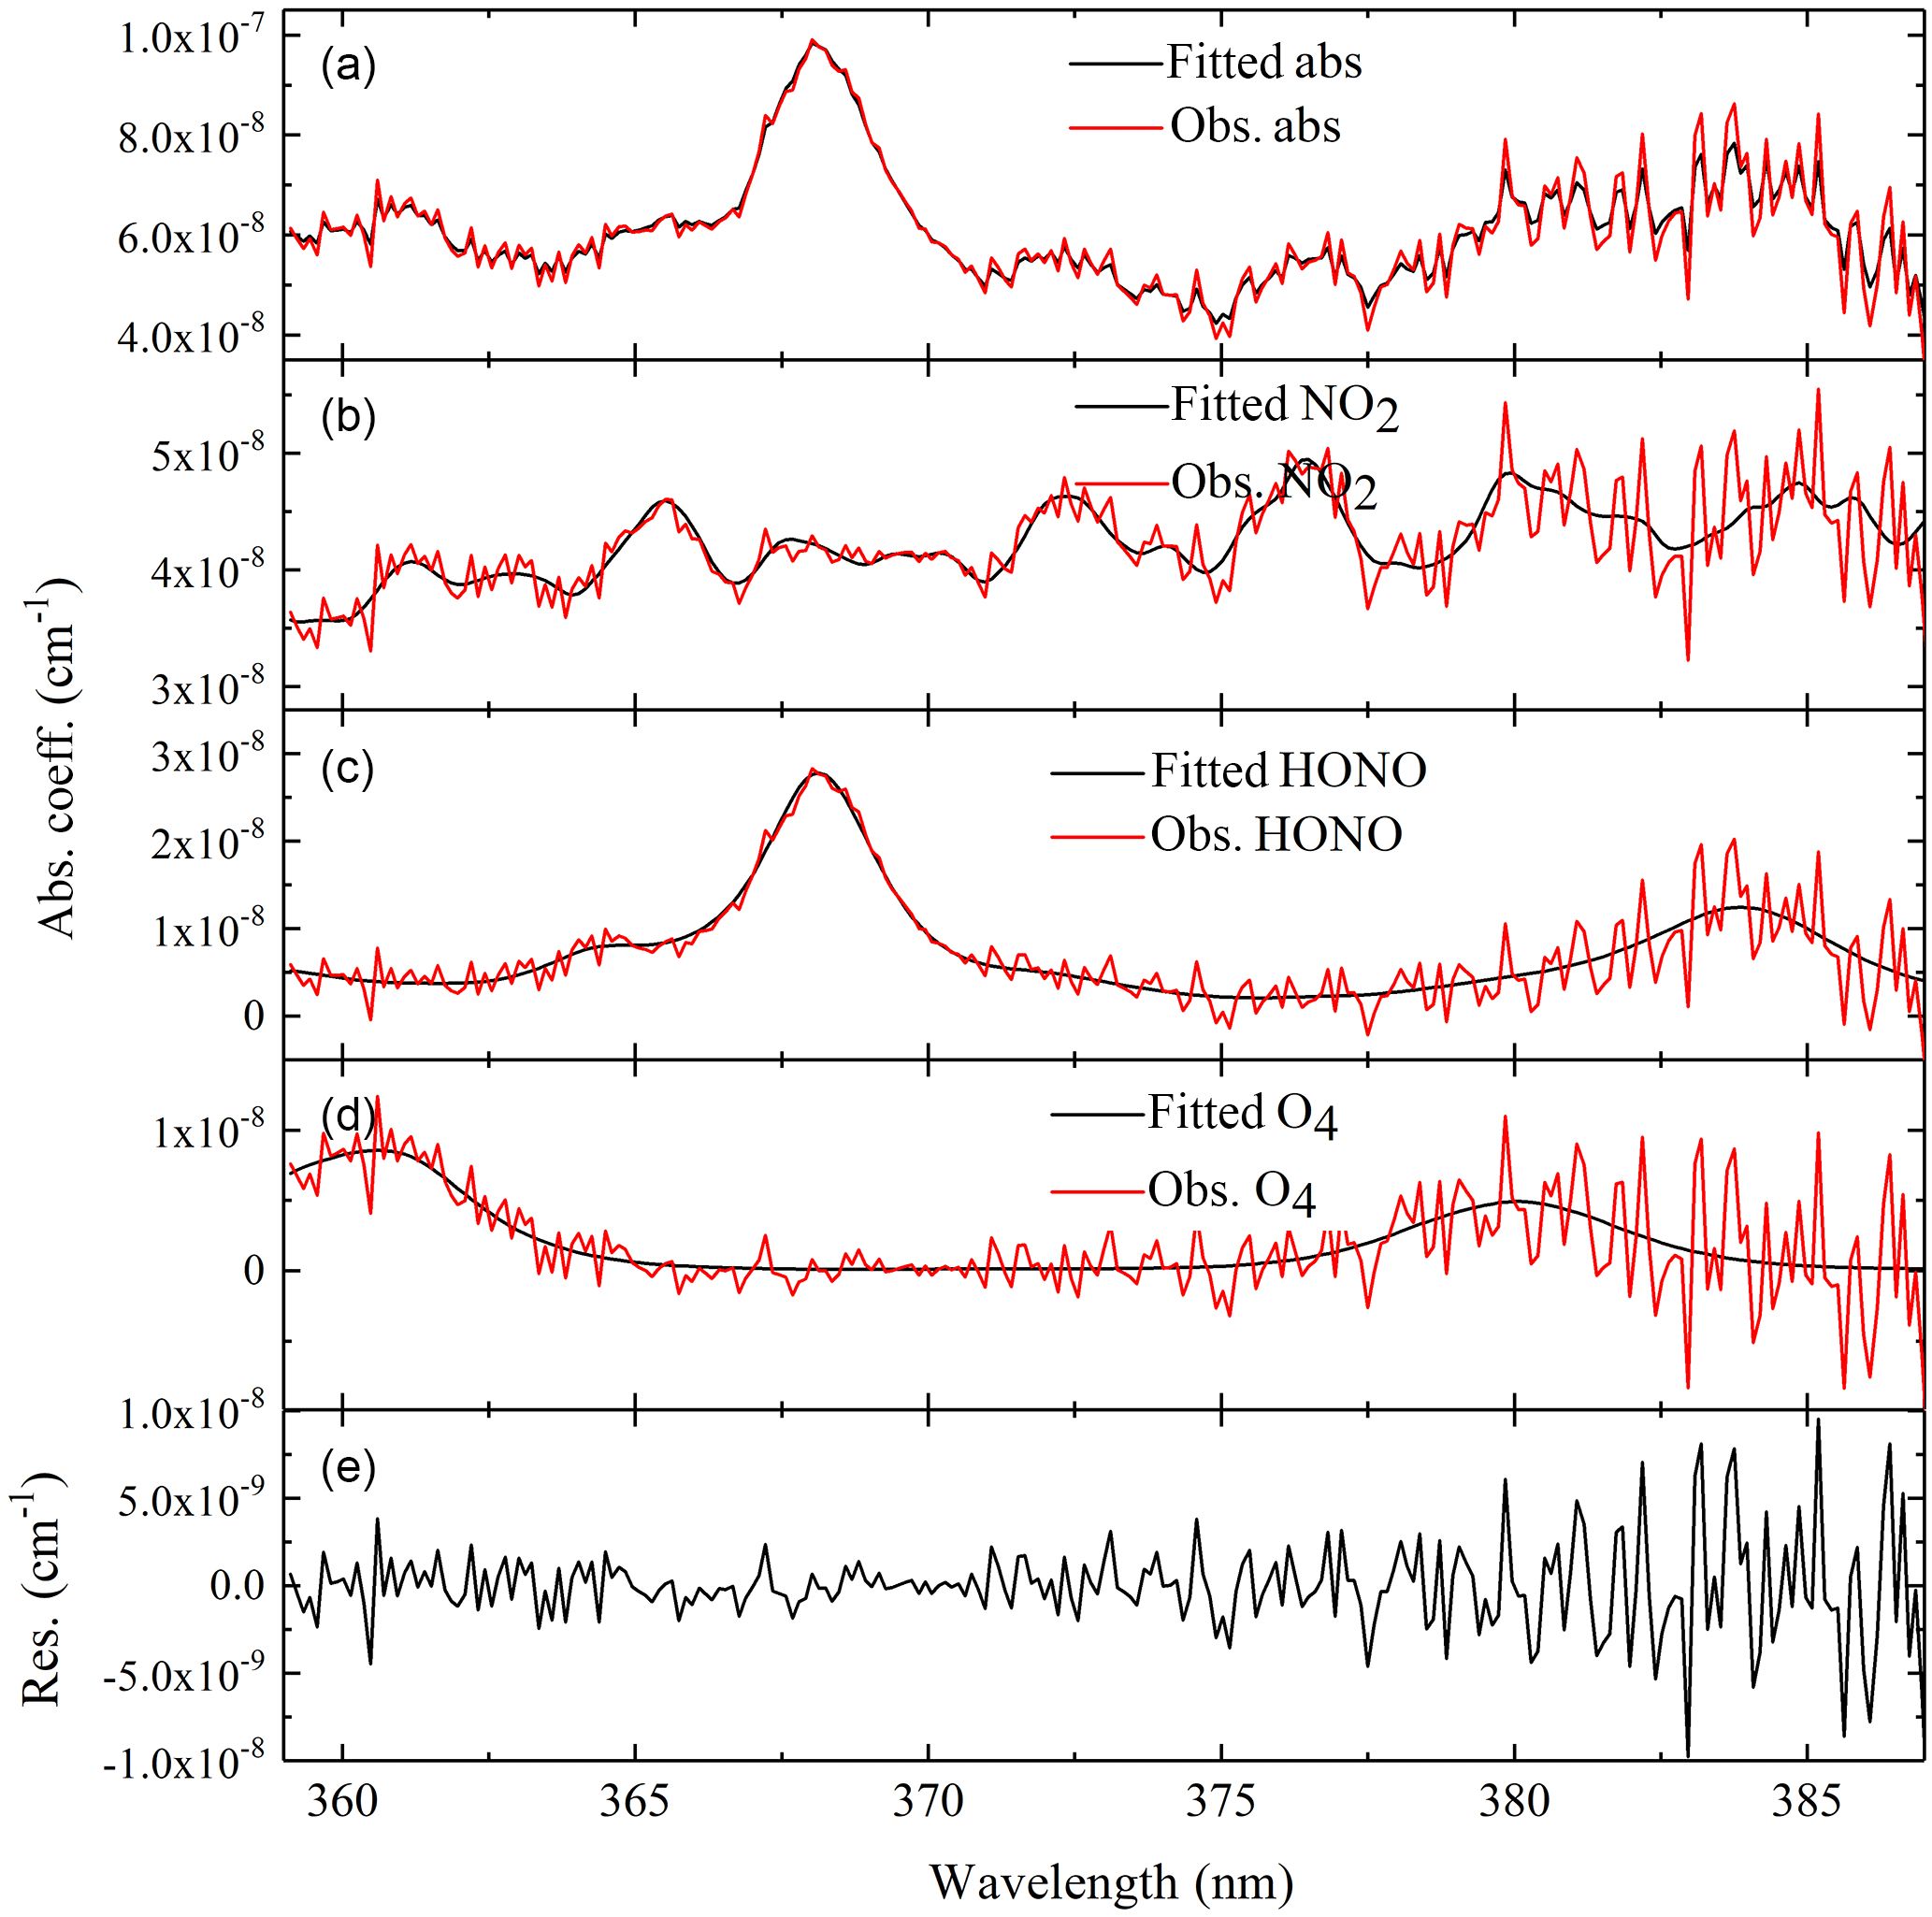
Figure 8Example of retrieved and fitted absorption spectra of NO2 and HONO measured at 12:44 CST on 28 June. (a) shows the absorption measurement by IBBCEAS. The absorption features due to NO2 and HONO can be clearly seen. (b–d) show the same spectrum plotted in the first panel. They are decomposed into individual absorption contributions from NO2 (3.05±0.17 ppb), HONO (2.53±0.093 ppb) and O4 ([O2] is close to 21 %). (e) is the residual spectrum (standard deviation = 2.76405 × 10⁻⁹ cm−1).
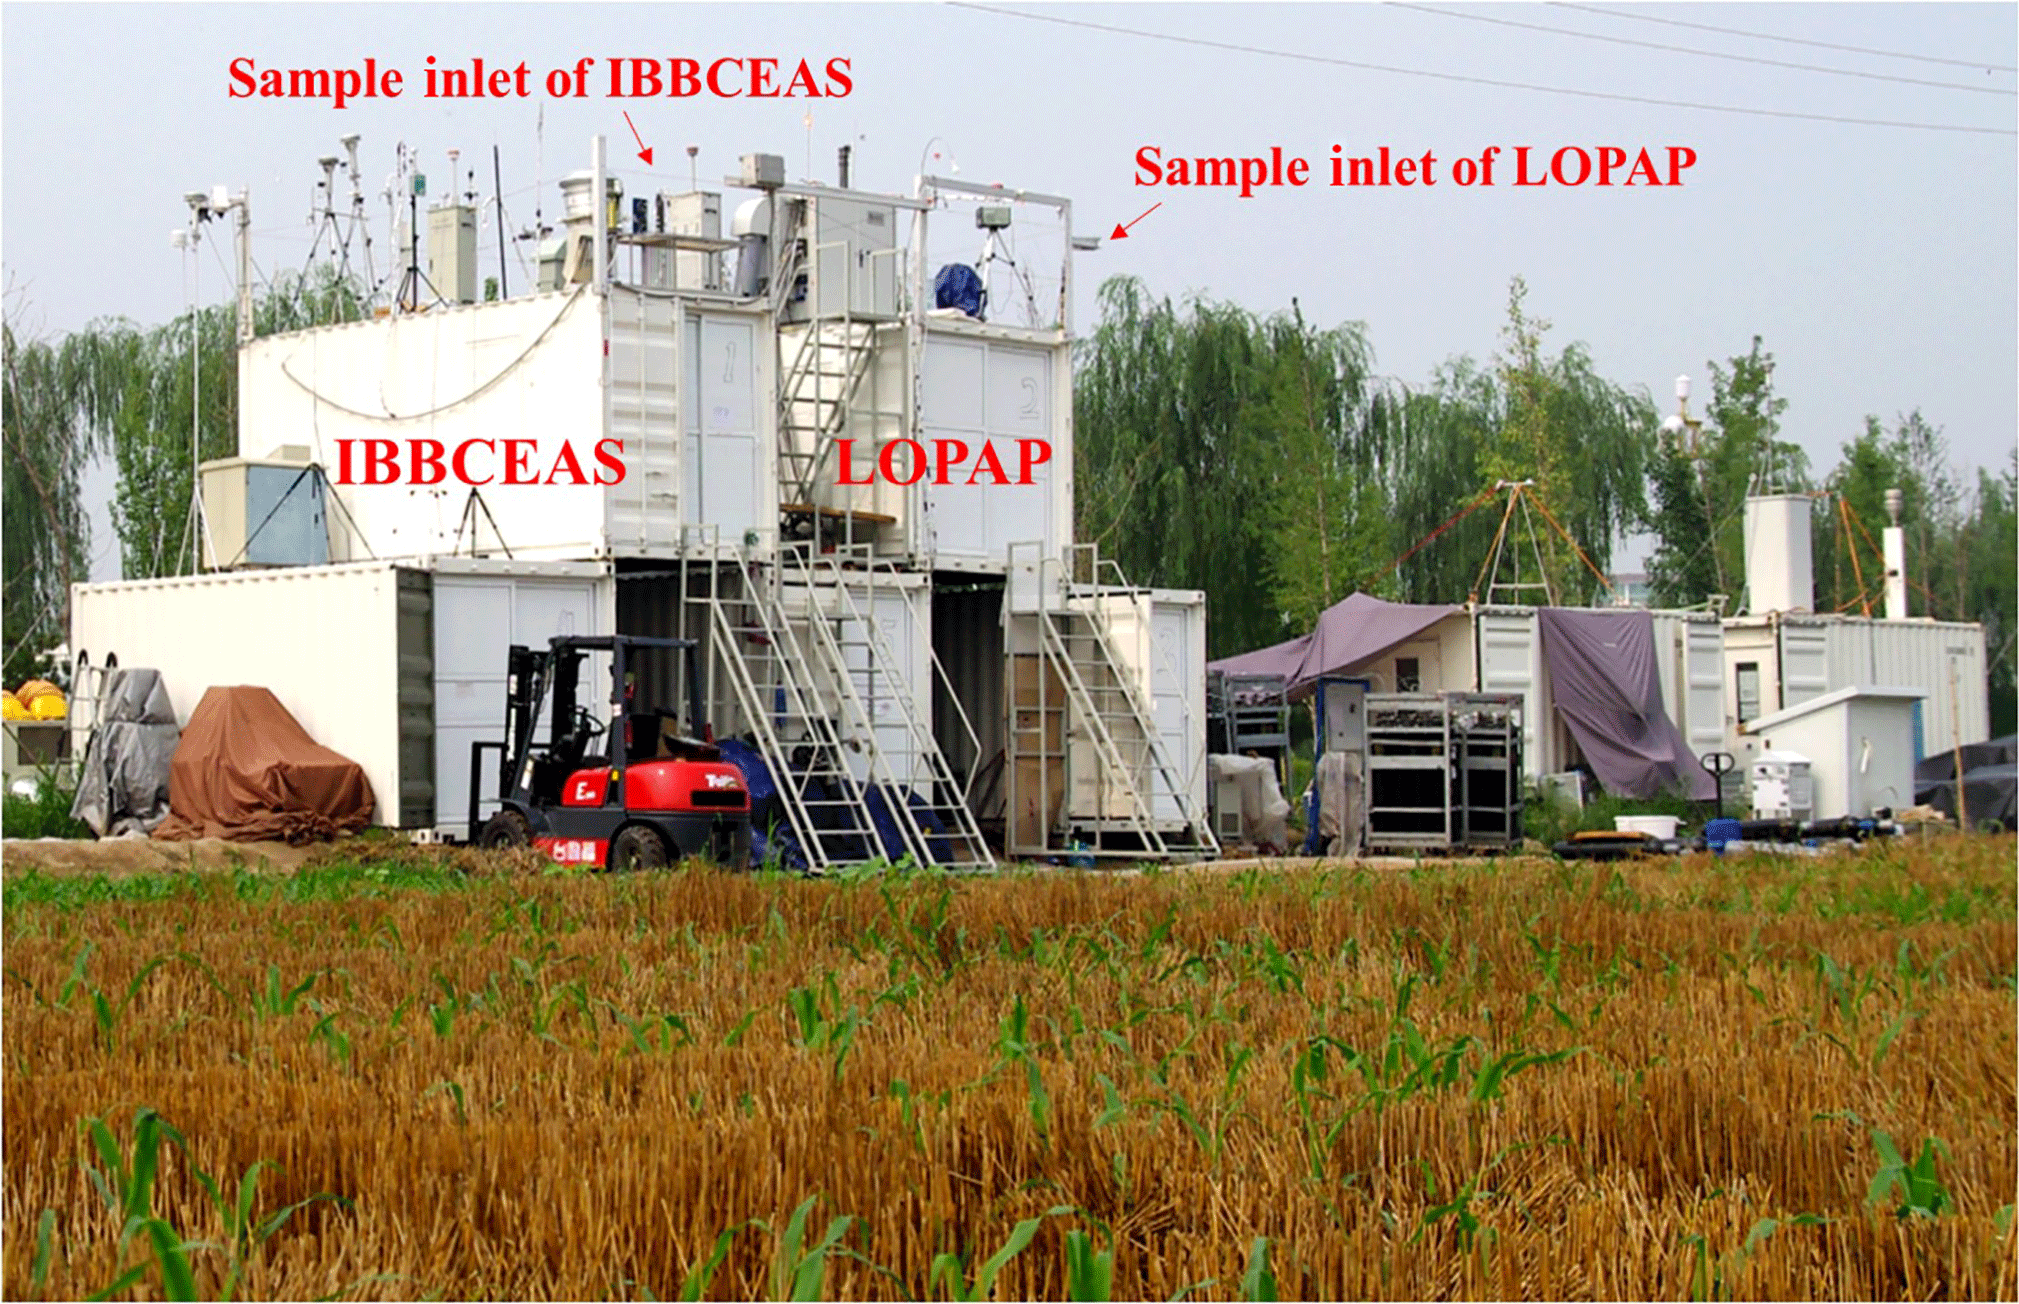
Figure 9The measurement site of CAREBEIJING and the container in which the IBBCEAS instrument was placed.
3.4 Instrument stability and detection limit
An Allan variance analysis was carried out to evaluate the sensitivity and long-term stability of the IBBCEAS instrument. First, pure N2 spectra were recorded using a long sequence of 10 046 measurements of I(λ) (integration time = 3 s per spectrum. A 120 s subset of the aforementioned spectra was averaged to yield I0(λ). Time series of HONO retrieved from the pure N2 spectra was then retrieved using Eq. (1). Second, the time series of HONO were used to generate a number of sets of time series corresponding to different averaging times, t, and different total number of elements at each averaging time, N. This used averaging of successive measurements (e.g., a time series of N=10 046 measurements for t=3 s; a time series of N=5023 measurements for t=6 s, etc.; Nmin=10). Finally, the standard variance, , and the Allan variance, , of the time series were calculated for each integration time using the following:
where from i=1 to N was the retrieved [HONO] in the time series obtained at each averaging time t, and μ is the average concentration of HONO over the entire period. The standard deviation provides a measure of the instrument's detection limit for a given integration time, while the Allan deviation indicates the instrument's long-term stability.
For a measurement dominated by random white noise, the Allan deviation decreases as with a gradient as shown in Fig. 6. At longer averaging times, the difference between successive measurements (i.e., two at adjacent t values) is comparable to the systematic time-dependent drifts in the instrument. Increasing integration time yields no benefit in decreasing the Allan deviation if the integration time exceeds 597 s. The minimum of the Allan deviation plot indicates the averaging time that produces maximum detection accuracy. To capture the rapid variation of HONO in the field, time resolution of the IBBCEAS instrument was typically set to 30 s, and the inferred 1σ detection limit of HONO is about 90 ppt at this integration time. We compared the detection limit and time resolution of different IBBCEAS instruments for HONO measurement, and this IBBCEAS instrument has shown reasonably good performance, as is shown in Table 1.
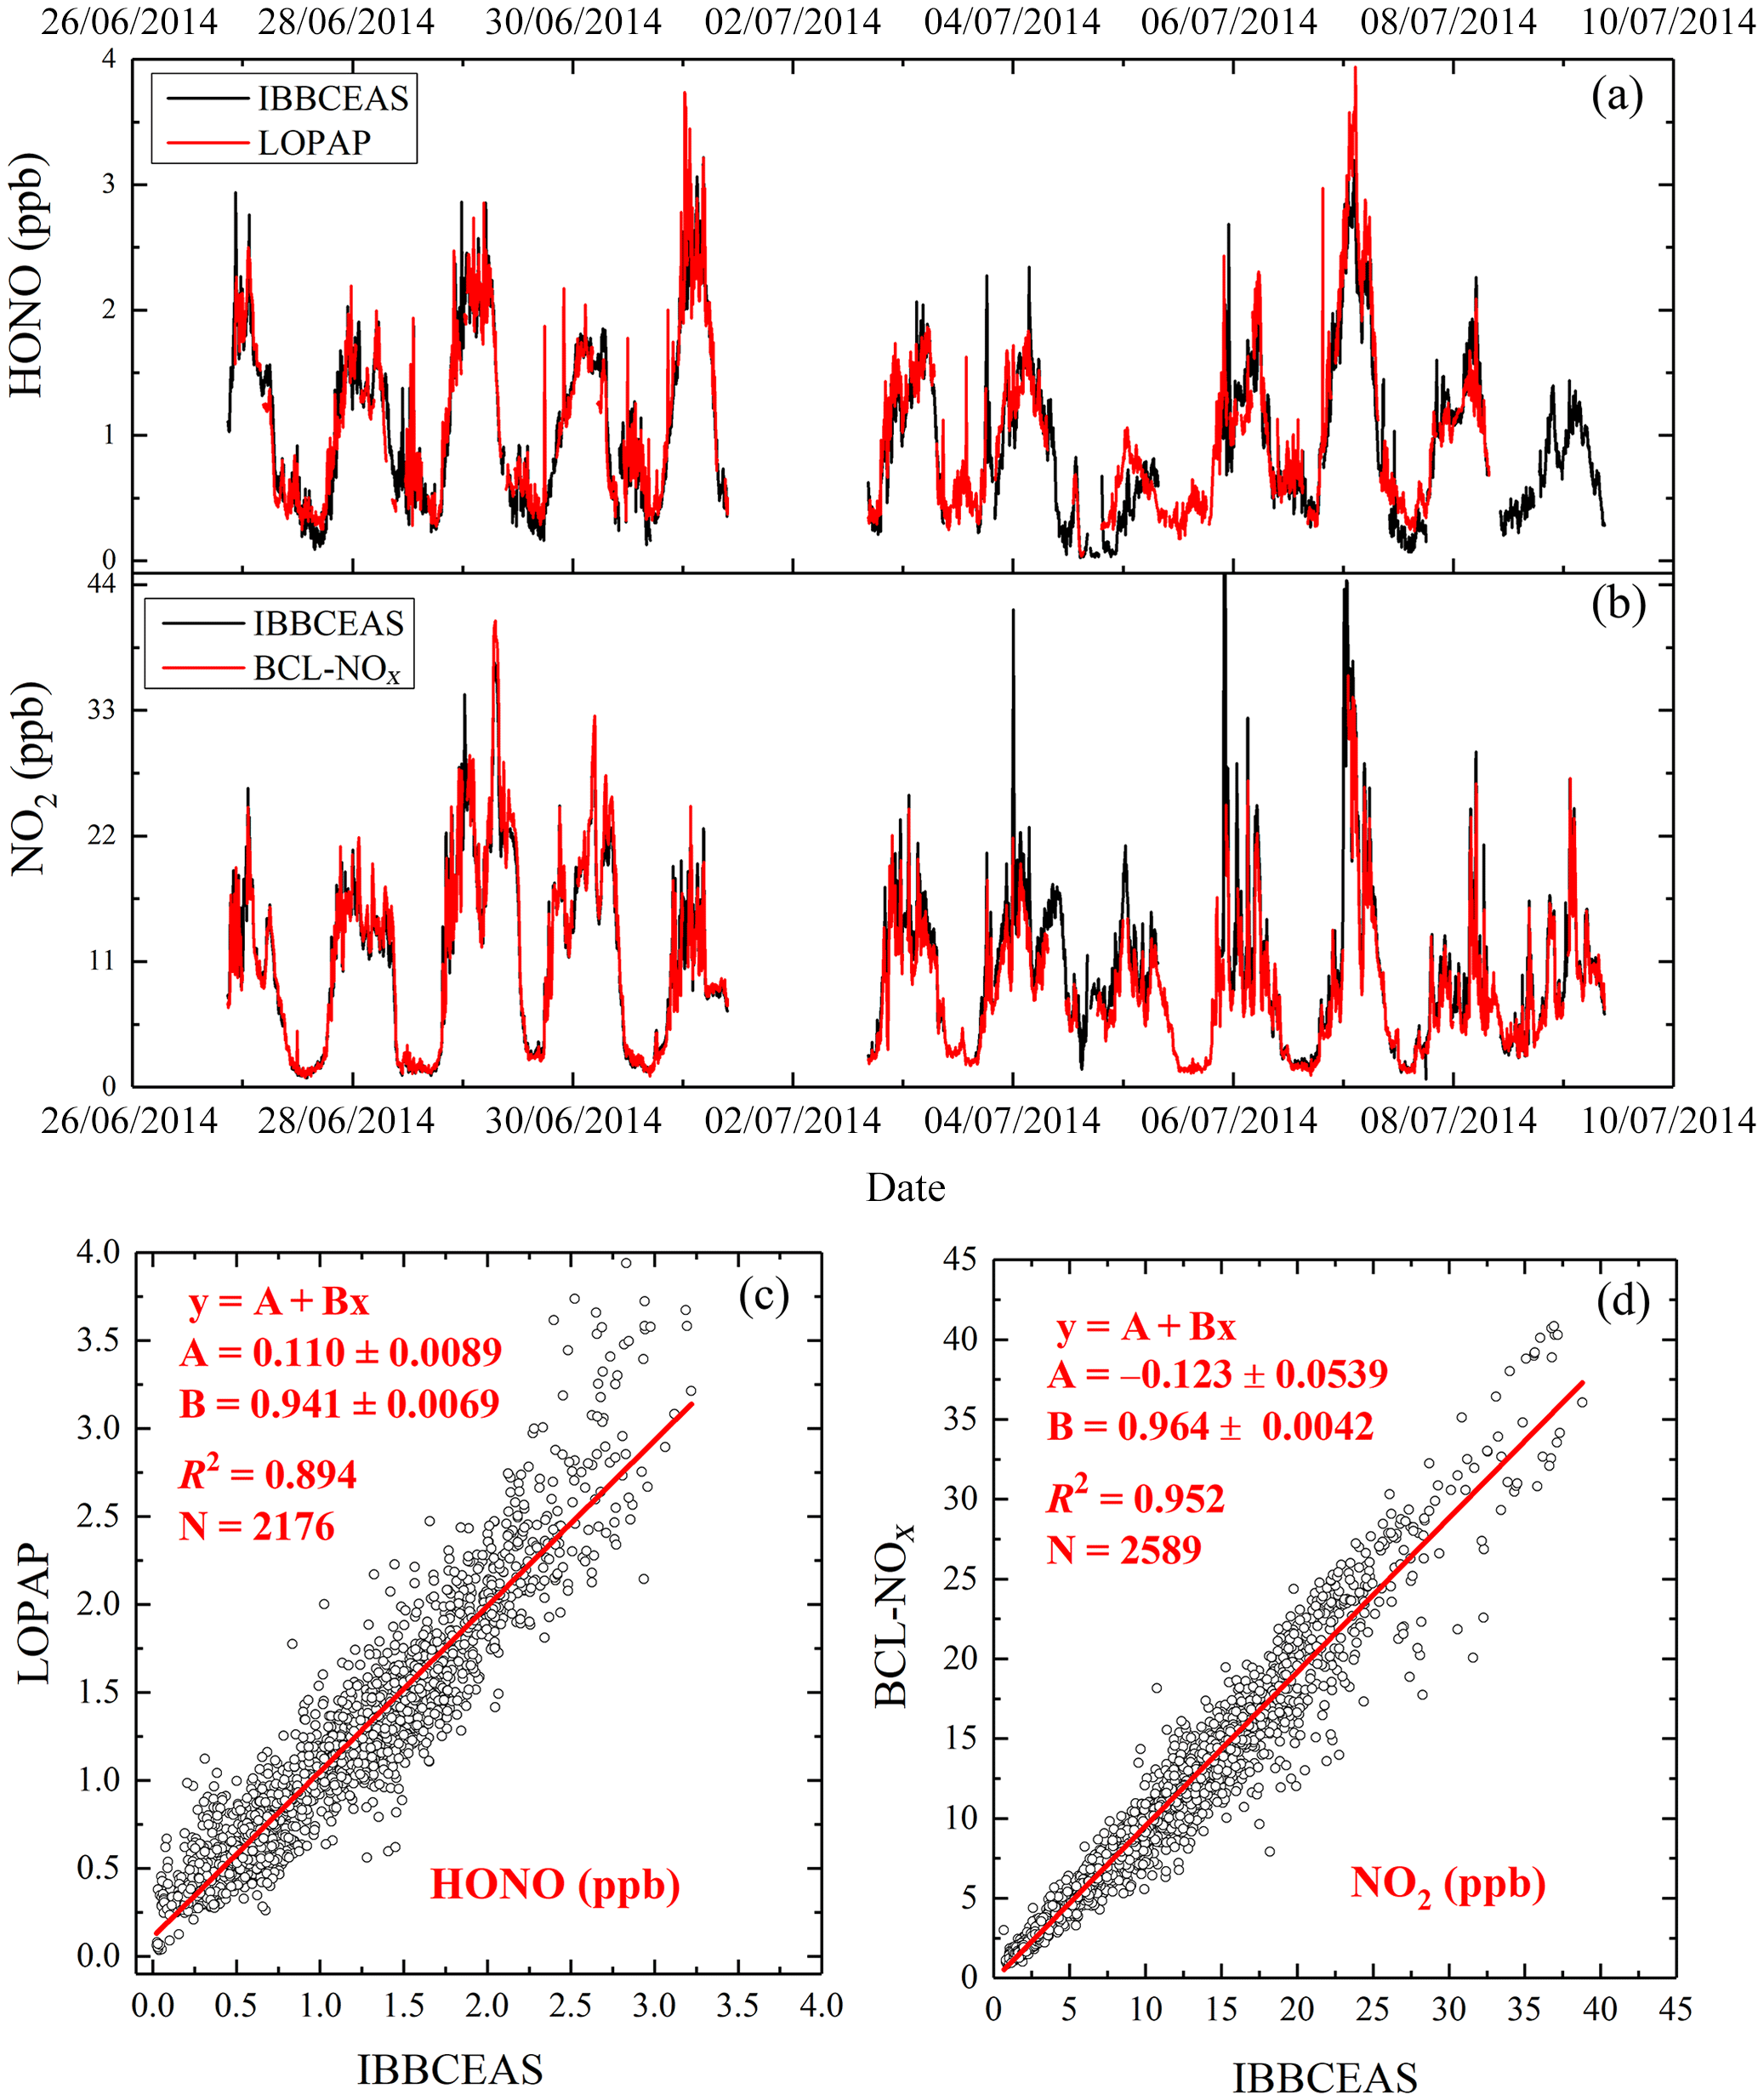
Figure 10(a) Time series of HONO measured by the IBBCEAS instrument and LOPAP; (b) time series of NO2 measured by the IBBCEAS instrument and the BLC-NOx analyzer; (c) correlation plot of the two [HONO] time series (data averaged to 5 min base); (d) correlation plot of the two [NO2] time series (data averaged to 5 min base).
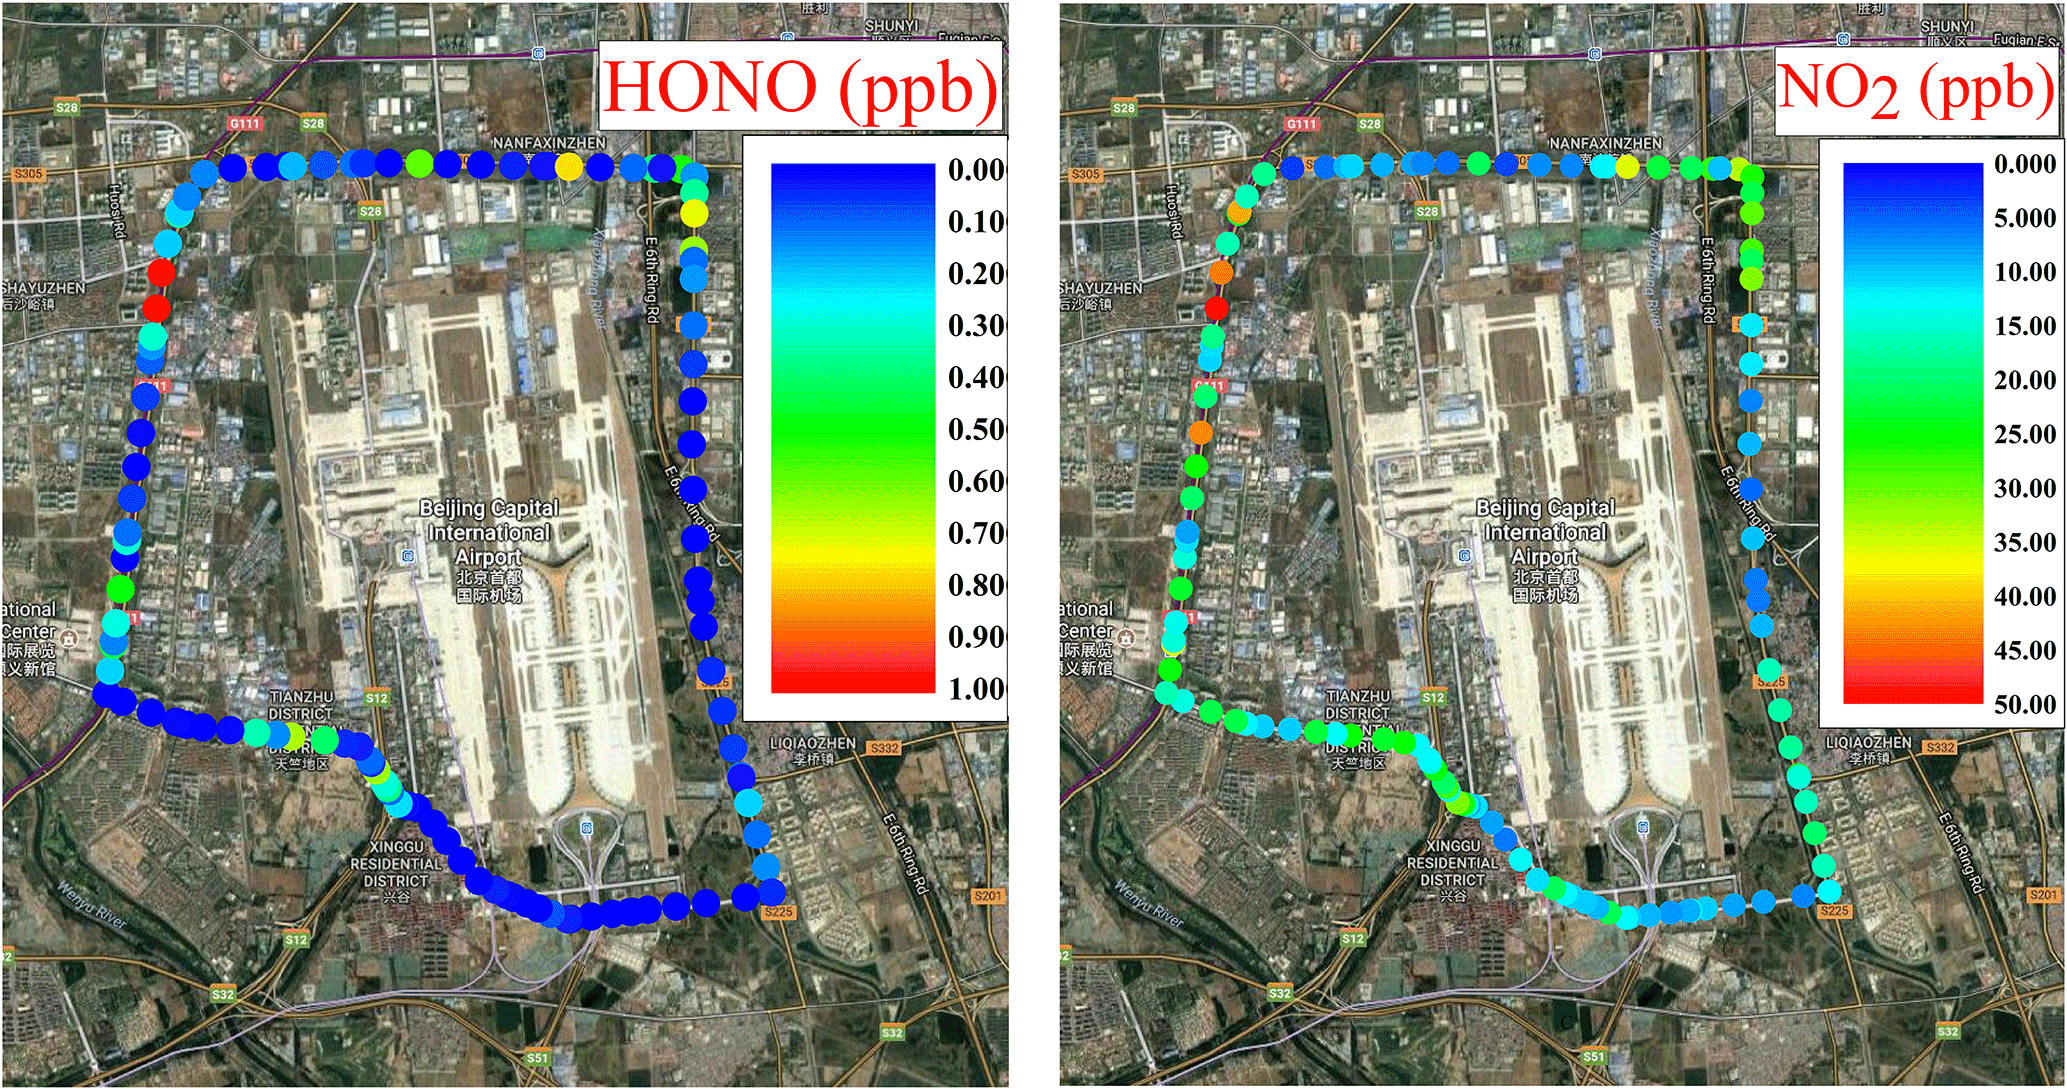
Table 1Characteristics of typical IBBCEAS instruments for HONO measurements.

3.5 Concentration retrieval
The HONO and NO2 concentrations are retrieved via least-square fitting of their absorption cross sections to the measured absorption coefficient α(λ) using the retrieval software DOASIS (Kraus, 2006). These cross-sections were obtained by convolving the high-resolution reference cross section of HONO (Stutz et al., 2000), NO2 (Voigt et al., 2002) and O4 (Greenblatt et al., 1990) with an instrument function of 0.40 nm FWHM. The reference spectrum adjustment parameters such as central wavelength shift and the peak squeeze were considered within the retrieval software and a fifth-order polynomial was used to account for smooth variation in the spectral background. Of these parameters, the retrieval wavelength range is one of the most important ones. To determine the optimum wavelength region for fitting, we comprehensively considered the emission profile of the LED light source, the absorption peak of the measured gases, the mirror reflectivity and the correlations of different absorption cross sections. Furthermore, in an attempt to identify the settings that would minimize cross interference of HONO and NO2, calculations of correlations matrix were performed for a range of fitting intervals starting between 354 and 363.5 nm and ending between 381 and 391 nm, in a similar way as what was done in Vogel et al. (2013). The correlations matrix of HONO and NO2 for different wavelength intervals in the 354–391 nm wavelength range was reported in Fig. 7, and the fitting range of HONO and NO2 was finally chosen to be 359–387 nm to reduce the cross interference of these two absorbing gases.
Figure 8 presents data on HONO and NO2 measurements from an absorption spectrum of ambient air in Wangdu. The concentrations of HONO and NO2 were 2.53 and 3.05 ppb at 12:44 CST, 28 June 2014, respectively.
The total relative uncertainty of the IBBCEAS instrument was estimated to be approximately 9 % considering the uncertainty in the cross sections (5 %), reflectivity (5 %), spectral fitting (4 %), effective cavity length (3 %), pressure in the cavity (1 %), ΔI∕I0 (1 %) and sample loss (0.5%).
4.1 Field inter-comparison of IBBCEAS vs. LOPAP for HONO, and IBBCEAS vs. BLC-NO2 analyzer for NO2
A field inter-comparison was carried out at a rural site (38.68∘ N, 115.18∘ E; northern China) in Wangdu, Hebei Province, between June and July, 2014, to validate the performance of the IBBCEAS instrument. This was done during the Campaigns of Air Pollution Research in Megacity Beijing and North China Plain (CAREBEIJING-NCP, 2014). The site was located in farmland area (mainly wheat and corn) with few nearby factories. The only main highway (G4) near the site was being rebuilt and blocked, and thus there was little influence from traffic. All instruments were placed in seven temperature-stabilized lab containers (Fig. 9). The IBBCEAS instrument was placed inside one that was stacked on top of another container; hence, the sampling height of the IBBCEAS instruments was about 7 m above the ground.
The IBBCEAS instrument introduced in this paper was compared with a long optical path absorption photometer (LOPAP) that is the same HONO instrument used during the Zeppelin measurements in the troposphere (Li et al., 2014). Figure 10a and c show that the [HONO] measured by this IBBCEAS instrument agreed well with that by LOPAP with R2=0.894. The regression of LOPAP [HONO] against the IBBCEAS [HONO] yields a slope of 0.941±0.0069 with an offset of 0.110±0.0089 ppb. Note that the time resolution of the IBBCEAS instrument (< 1 min) is higher than that of the LOPAP instrument (5 min). Thus, the data were averaged to every 5 min, and some of the rapid variations of [HONO] were captured by the IBBCEAS instrument only.
In addition, NO2 concentrations were compared with those from a chemiluminescence analyzer (Thermo Fisher Electron Model 42i equipped with a blue light converter, noted as “BLC-NO2 analyzer”) to verify the accuracy of the IBBCEAS instrument for NO2. The magnitude of R2 (0.952) suggests very good agreement between the two instruments (Fig. 10b and d). The regression of BLC-NOx [NO2] against IBBCEAS [NO2] resulted in a slope of 0.964±0.0042 with an offset of ppb.
Compared to the field inter-comparison between IBBCEAS and LOPAP in Hong Kong (Wu et al., 2014), these agreements demonstrated that our IBBCEAS instrument can achieve robust performance and system stability in the field, and the IBBCEAS technique shows promising capabilities for measuring environmental HONO and NO2 at their typical ambient levels.
4.2 Mobile measurements of HONO and NO2
Due to its compact design, the IBBCEAS instrument can be easily deployed in a car to measure the spatial distribution of HONO and NO2. In a trial, the IBBCEAS instrument was powered by the lithium battery, and the ambient air was drawn into the IBBCEAS instrument though an inlet fixed on the roof of the car. The route of the experiment was around the Beijing International Airport to measure the daytime traffic emission in Beijing from 11:00 to 13:00 CST on 10 December 2014. The day of the measurement was sunny and the average temperature was about 4 ∘C. Because of the prevailing strong northern wind, the air mass was relatively clean with a mean PM2.5 concentration of about 14 µg m−3. The spatial distributions of HONO and NO2 from the 30 s averaged data are shown in Fig. 11, with the HONO and NO2 concentrations ranging from the instrument detection limit to 2.0 and 49.6 ppb, respectively, and the mean concentrations of HONO and NO2 were 0.25 and 16.82 ppb, respectively. The high values of HONO and NO2 were both mainly found at the crossroads with heavy traffic. At the maximum HONO concentration captured en route (∼2.0 ppb), [HONO] ∕ [NO2] ratio was about 4.1 %, and the location where this maxima HONO concentration occurred was the intersection of the Jingshen Road (G101) and Huosha Road (XD20), both of which are major traffic arteries with many heavy trucks, buses and cars. We suspect the high value of HONO may have come from direct traffic emissions. Thus, the mobile IBBCEAS instrument offers a good way to study the direct emission of HONO from road traffic or potential sources owing to its easy deployment and high temporal resolution.
We present an IBBCEAS instrument used for the simultaneous monitoring of environmental HONO and NO2. This IBBCEAS instrument has been developed with significant improvements in efficient sampling, vibration resistance and temperature resistance by application of the purge flows, bypass flow and different thermostats. Additionally, the IBBCEAS instrument also has low power consumption and a compact design that can be easily deployed on the different platforms and powered only by a high-capacity lithium ion battery.
The effective cavity length of the IBBCEAS was determined using the absorption of O2-O2 to account for the “shortening” effect caused by the mirror purge flows. The wall loss for HONO was estimated to about 2.0 % via a HONO standard generator. The instrument performance was evaluated and validated, and this demonstrated the precision needed for field measurements of HONO and NO2, i.e., 180 and 340 ppt in 30 s, respectively. The calculated accuracy for these measurements is about 9.0 %.
The IBBCEAS instrument was verified as a useful method for measurements of HONO and NO2 in polluted field environments in China. Inter-comparisons with other techniques generally showed good agreement, demonstrating the promising potential of using IBBCEAS for sensitive, accurate and fast simultaneous measurements of HONO and NO2 in the future.
The data used in this study are available from the corresponding author upon request (mqin@aiofm.ac.cn).
MQ, PX and WL contributed to the conception of the study. JD and WF built the IBBCEAS instrument. JD, SL, KT and FM performed the experiments. XL and RH provided the data of LOPAP. KL provided the data of Thermo Fisher Electron Model 42i and helped with building the HONO standard generator. JD performed the data analyses and wrote the manuscript. ZH provided Fig. 7. BO and MQ edited and developed the manuscript.
The authors declare that they have no conflict of interest.
This work was supported by the National Natural Science Foundation of China
(grant nos. 91544104, 41571130023, 41705015 and 21190052).
Edited by: Murray Hamilton
Reviewed by: three
anonymous referees
Alicke, B., Platt, U., and Stutz, J.: Impact of nitrous acid photolysis on the total hydroxyl radical budget during the Limitation of Oxidant Production/Pianura Padana Produzione di Ozono study in Milan, J. Geophys. Res.-Atmos., 107, LOP 9-1–LOP 9-17, 2002.
Bejan, I., Abd El Aal, Y., Barnes, I., Benter, T., Bohn, B., Wiesen, P., and Kleffmann, J.: The photolysis of ortho-nitrophenols: a new gas phase source of HONO, Phys. Chem. Chem. Phys., 8, 2028–2035, https://doi.org/10.1039/B516590C, 2006.
Dibb, J. E., Huey, L. G., Slusher, D. L., and Tanner, D. J.: Soluble reactive nitrogen oxides at South Pole during ISCAT 2000, Atmos. Environ., 38, 5399–5409, 2004.
Ferm, M. and Sjödin, A.: A sodium carbonate coated denuder for determination of nitrous acid in the atmosphere, Atmos. Environ., 19, 979–983, 1985.
Fiedler, S. E., Hese, A., and Ruth, A. A.: Incoherent broad-band cavity-enhanced absorption spectroscopy, Chem. Phys. Lett., 371, 284–294, 2003.
Gherman, T., Venables, D. S., Vaughan, S., Orphal, J., and Ruth, A. A.: Incoherent Broadband Cavity-Enhanced Absorption Spectroscopy in the near-Ultraviolet: Application to HONO and NO2, Environ. Sci. Technol., 42, 890–895, https://doi.org/10.1021/es0716913, 2008.
Greenblatt, G. D., Orlando, J. J., Burkholder, J. B., and Ravishankara, A. R.: Absorption measurements of oxygen between 330 nm and 1140 nm, J. Geophys. Res., 95, 18577–18582, 1990.
Heland, J., Kleffmann, J., Kurtenbach, R., and Wiesen, P.: A new instrument to measure gaseous nitrous acid (HONO) in the atmosphere, Environ. Sci. Technol., 35, 3207–3212, 2001.
Hoch, D. J., Buxmann, J., Sihler, H., Pöhler, D., Zetzsch, C., and Platt, U.: An instrument for measurements of BrO with LED-based Cavity-Enhanced Differential Optical Absorption Spectroscopy, Atmos. Meas. Tech., 7, 199–214, https://doi.org/10.5194/amt-7-199-2014, 2014.
Johansson, O., Mutelle, H., Parker, A. E., Batut, S., Demaux, P., Schoemaecker, C., and Fittschen, C.: Quantitative IBBCEAS measurements of I2 in the presence of aerosols, Appl. Phys. B-Lasers O., 114, 421–432, https://doi.org/10.1007/s00340-013-5536-9, 2014.
Kennedy, O. J., Ouyang, B., Langridge, J. M., Daniels, M. J. S., Bauguitte, S., Freshwater, R., McLeod, M. W., Ironmonger, C., Sendall, J., Norris, O., Nightingale, R., Ball, S. M., and Jones, R. L.: An aircraft based three channel broadband cavity enhanced absorption spectrometer for simultaneous measurements of NO3, N2O5 and NO2, Atmos. Meas. Tech., 4, 1759–1776, https://doi.org/10.5194/amt-4-1759-2011, 2011.
Kleffmann, J.: Daytime sources of nitrous acid (HONO) in the atmospheric boundary layer, ChemPhysChem, 8, 1137–1144, 2007.
Kleffmann, J., Becker, K. H., and Wiesen, P.: Heterogeneous NO2 conversion processes on acid surfaces: Possible atmospheric implications, Atmos. Environ., 32, 2721–2729, https://doi.org/10.1016/s1352-2310(98)00065-x, 1998.
Kleffmann, J., Becker, K. H., Lackhoff, M., and Wiesen, P.: Heterogeneous conversion of NO2 on carbonaceous surfaces, Phys. Chem. Chem. Phys., 1, 5443–5450, https://doi.org/10.1039/a905545b, 1999.
Kleffmann, J., Benter, T., and Wiesen, P.: Heterogeneous reaction of nitric acid with nitric oxide on glass surfaces under simulated atmospheric conditions, J. Phys. Chem. A, 108, 5793–5799, https://doi.org/10.1021/jp040184u, 2004.
Kleffmann, J., Gavriloaiei, T., Hofzumahaus, A., Holland, F., Koppmann, R., Rupp, L., Siese, M., and Wahner, A.: Daytime formation of nitrous acid: A major source of OH radicals in a forest, Geophys. Res. Lett., 32, 347–354, 2005.
Kraus, S. G.: DOASIS: A Framework Design for DOAS, Dissertation, University of Mannheim, Mannheim, Germany, 2006.
Kurtenbach, R., Becker, K. H., Gomes, J. A. G., Kleffmann, J., Lörzer, J. C., Spittler, M., Wiesen, P., Ackermann, R., Geyer, A., and Platt, U.: Investigations of emissions and heterogeneous formation of HONO in a road traffic tunnel, Atmos. Environ., 35, 3385–3394, 2001.
Li, X., Rohrer, F., Hofzumahaus, A., Brauers, T., Haeseler, R., Bohn, B., Broch, S., Fuchs, H., Gomm, S., Holland, F., Jaeger, J., Kaiser, J., Keutsch, F. N., Lohse, I., Lu, K., Tillmann, R., Wegener, R., Wolfe, G. M., Mentel, T. F., Kiendler-Scharr, A., and Wahner, A.: Missing Gas-Phase Source of HONO Inferred from Zeppelin Measurements in the Troposphere, Science, 344, 292–296, https://doi.org/10.1126/science.1248999, 2014.
Li, Y. Q., Schwab, J. J., and Demerjian, K. L.: Fast time response measurements of gaseous nitrous acid using a tunable diode laser absorption spectrometer: HONO emission source from vehicle exhausts, Geophys. Res. Lett., 35, L04803, https://doi.org/10.1029/2007gl031218, 2008.
Liao, W., Case, A. T., Mastromarino, J., Tan, D., and Dibb, J. E.: Observations of HONO by laser-induced fluorescence at the South Pole during ANTCI 2003, Geophys. Res. Lett., 33, L09810, https://doi.org/10.1029/2005gl025470, 2006.
Ling, L., Xie, P., Qin, M., Fang, W., Jiang, Y., Hu, R., and Zheng, N.: In situ measurements of atmospheric NO2 using incoherent broadband cavity-enhancedabsorption spectroscopy with a blue light-emitting diode, Chin. Opt. Lett., 11, 063001, https://doi.org/10.3788/COL201311.063001, 2013.
Liu, Y., Lu, K., Dong, H., Li, X., Cheng, P., Zou, Q., Wu, Y., Liu, X., and Zhang, Y.: In situ monitoring of atmospheric nitrous acid based on multi-pumping flow system and liquid waveguide capillary cell, J. Environ. Sci., 43, 273–284, https://doi.org/10.1016/j.jes.2015.11.034, 2016.
Meinen, J., Thieser, J., Platt, U., and Leisner, T.: Technical Note: Using a high finesse optical resonator to provide a long light path for differential optical absorption spectroscopy: CE-DOAS, Atmos. Chem. Phys., 10, 3901–3914, https://doi.org/10.5194/acp-10-3901-2010, 2010.
Min, K.-E., Washenfelder, R. A., Dubé, W. P., Langford, A. O., Edwards, P. M., Zarzana, K. J., Stutz, J., Lu, K., Rohrer, F., Zhang, Y., and Brown, S. S.: A broadband cavity enhanced absorption spectrometer for aircraft measurements of glyoxal, methylglyoxal, nitrous acid, nitrogen dioxide, and water vapor, Atmos. Meas. Tech., 9, 423–440, https://doi.org/10.5194/amt-9-423-2016, 2016.
Nakashima, Y. and Sadanaga, Y.: Validation of in situ Measurements of Atmospheric Nitrous Acid Using Incoherent Broadband Cavity-enhanced Absorption Spectroscopy, Anal. Sci., 33, 519–524, 2017.
Neftel, A., Blatter, A., Hesterberg, R., and Staffelbach, T.: Measurements of concentration gradients of HNO2 and HNO3 over a semi-natural ecosystem, Atmos. Environ., 30, 3017–3025, 1996.
Pagsberg, P., Bjergbakke, E., Ratajczak, E., and Sillesen, A.: Kinetics of the gas phase reaction OH + NO(+M)→HONO(+M) and the determination of the UV absorption cross sections of HONO, Chem. Phys. Lett., 272, 383–390, 1997.
Perner, D. and Platt, U.: Detection of nitrous acid in the atmosphere by differential optical absorption, Geophys. Res. Lett., 6, 917–920, 1979.
Pitts Jr., J. N., Biermann, H. W., Winer, A. M., and Tuazon, E. C.: Spectroscopic identification and measurement of gaseous nitrous acid in dilute auto exhaust, Atmos. Environ. 18, 847–854, 1984.
Reeser, D. I., Kwamena, N.-O. A., and Donaldson, D.: Effect of Organic Coatings on Gas-Phase Nitrogen Dioxide Production from Aqueous Nitrate Photolysis, J. Phys. Chem. C, 117, 22260–22267, 2013.
Scharko, N. K., Berke, A. E., and Raff, J. D.: Release of Nitrous Acid and Nitrogen Dioxide from Nitrate Photolysis in Acidic Aqueous Solutions, Environ. Sci. Technol., 48, 11991–12001, https://doi.org/10.1021/es503088x, 2014.
Spataro, F. and Ianniello, A.: Sources of atmospheric nitrous acid: State of the science, current research needs, and future prospects, J. Air Waste Manage., 64, 1232–1250, https://doi.org/10.1080/10962247.2014.952846, 2014.
Stutz, J., Kim, E., Platt, U., Bruno, P., Perrino, C., and Febo, A.: UV-visible absorption cross sections of nitrous acid, J. Geophys. Res.-Atmos., 105, 14585–14592, 2000.
Su, H., Cheng, Y., Oswald, R., Behrendt, T., Trebs, I., Meixner, F. X., Andreae, M. O., Cheng, P., Zhang, Y., and Pöschl, U.: Soil nitrite as a source of atmospheric HONO and OH radicals, Science, 333, 1616–1618, https://doi.org/10.1126/science.1207687, 2011.
Thalman, R. and Volkamer, R.: Inherent calibration of a blue LED-CE-DOAS instrument to measure iodine oxide, glyoxal, methyl glyoxal, nitrogen dioxide, water vapour and aerosol extinction in open cavity mode, Atmos. Meas. Tech., 3, 1797–1814, https://doi.org/10.5194/amt-3-1797-2010, 2010.
Vaughan, S., Gherman, T., Ruth, A. A., and Orphal, J.: Incoherent broad-band cavity-enhanced absorption spectroscopy of the marine boundary layer species I2, IO and OIO, Phys. Chem. Chem. Phys., 10, 4471–4477, https://doi.org/10.1039/b802618a, 2008.
Veres, P. R., Roberts, J. M., Wild, R. J., Edwards, P. M., Brown, S. S., Bates, T. S., Quinn, P. K., Johnson, J. E., Zamora, R. J., and de Gouw, J.: Peroxynitric acid (HO2NO2) measurements during the UBWOS 2013 and 2014 studies using iodide ion chemical ionization mass spectrometry, Atmos. Chem. Phys., 15, 8101–8114, https://doi.org/10.5194/acp-15-8101-2015, 2015.
Vogel, L., Sihler, H., Lampel, J., Wagner, T., and Platt, U.: Retrieval interval mapping: a tool to visualize the impact of the spectral retrieval range on differential optical absorption spectroscopy evaluations, Atmos. Meas. Tech., 6, 275–299, https://doi.org/10.5194/amt-6-275-2013, 2013.
Voigt, S., Orphal, J., and Burrows, J. P.: The temperature and pressure dependence of the absorption cross-sections of NO2 in the 250–800 nm region measured by Fourier-transform spectroscopy, J. Photoch. Photobio. A, 149, 1–7, https://doi.org/10.1016/S1010-6030(01)00650-5, 2002.
Washenfelder, R. A., Langford, A. O., Fuchs, H., and Brown, S. S.: Measurement of glyoxal using an incoherent broadband cavity enhanced absorption spectrometer, Atmos. Chem. Phys., 8, 7779–7793, https://doi.org/10.5194/acp-8-7779-2008, 2008.
Wu, T., Chen, W., Fertein, E., Cazier, F., Dewaele, D., and Gao, X.: Development of an open-path incoherent broadband cavity-enhanced spectroscopy based instrument for simultaneous measurement of HONO and NO2 in ambient air, Appl. Phys. B, 106, 501–509, https://doi.org/10.1007/s00340-011-4818-3, 2011.
Wu, T., Zha, Q., Chen, W., Xu, Z., Wang, T., and He, X.: Development and deployment of a cavity enhanced UV-LED spectrometer for measurements of atmospheric HONO and NO2 in Hong Kong, Atmos. Environ., 95, 544–551, https://doi.org/10.1016/j.atmosenv.2014.07.016, 2014.
Xu, Z., Wang, T., Wu, J., Xue, L., Chan, J., Zha, Q., Zhou, S., Louie, P. K. K., and Luk, C. W. Y.: Nitrous acid (HONO) in a polluted subtropical atmosphere: Seasonal variability, direct vehicle emissions and heterogeneous production at ground surface, Atmos. Environ., 106, 100–109, 2015.
Zhang, B. and Tao, F.-M.: Direct homogeneous nucleation of NO2, H2O, and NH3 for the production of ammonium nitrate particles and HONO gas, Chem. Phys. Lett., 489, 143–147, https://doi.org/10.1016/j.cplett.2010.02.059, 2010.
Zhou, X., Qiao, H., Deng, G., and Civerolo, K.: A Method For The Measurement Of Atmospheric Hono Based On Dnph Derivatization And Hplc Analysis, Environ. Sci. Technol, 33, 3672–3679, 1999.
Zhou, X., Zhang, N., TerAvest, M., Tang, D., Hou, J., Bertman, S., Alaghmand, M., Shepson, P. B., Carroll, M. A., and Griffith, S.: Nitric acid photolysis on forest canopy surface as a source for tropospheric nitrous acid, Nat. Geosci., 4, 440–443, 2011.