the Creative Commons Attribution 4.0 License.
the Creative Commons Attribution 4.0 License.
 | 31 Aug 2018
The first evaluation of formaldehyde column observations by improved Pandora spectrometers during the KORUS-AQ field study
Elena Spinei
Andrew Whitehill
Alan Fried
Martin Tiefengraber
Travis N. Knepp
Scott Herndon
Jay R. Herman
Moritz Müller
Nader Abuhassan
Alexander Cede
Dirk Richter
James Walega
James Crawford
James Szykman
Lukas Valin
David J. Williams
Russell Long
Robert J. Swap
Youngjae Lee
Nabil Nowak
Brett Poche
The Korea–United States Air Quality Study (KORUS-AQ) conducted during May–June 2016 offered the first opportunity to evaluate direct-sun observations of formaldehyde (HCHO) total column densities with improved Pandora spectrometer instruments. The measurements highlighted in this work were conducted both in the Seoul megacity area at the Olympic Park site (37.5232∘ N, 27.1260∘ E; 26 m a.s.l.) and at a nearby rural site downwind of the city at the Mount Taehwa research forest site (37.3123∘ N, 127.3106∘ E; 160 m a.s.l.). Evaluation of these measurements was made possible by concurrent ground-based in situ observations of HCHO at both sites as well as overflight by the NASA DC-8 research aircraft. The flights provided in situ measurements of HCHO to characterize its vertical distribution in the lower troposphere (0–5 km).
Diurnal variation in HCHO total column densities followed the same pattern at both sites, with the minimum daily values typically observed between 6:00 and 7:00 local time, gradually increasing to a maximum between 13:00 and 17:00 before decreasing into the evening. Pandora vertical column densities were compared with those derived from the DC-8 HCHO in situ measured profiles augmented with in situ surface concentrations below the lowest altitude of the DC-8 in proximity to the ground sites. A comparison between 49 column densities measured by Pandora vs. aircraft-integrated in situ data showed that Pandora values were larger by 16 % with a constant offset of 0.22 DU (Dobson units; R2=0.68). Pandora HCHO columns were also compared with columns calculated from the surface in situ measurements over Olympic Park by assuming a well-mixed lower atmosphere up to a ceilometer-measured mixed-layer height (MLH) and various assumptions about the small residual HCHO amounts in the free troposphere up to the tropopause. The best comparison (slope ; intercept DU; and ) was achieved assuming equal mixing within ceilometer-measured MLH combined with an exponential profile shape. These results suggest that diurnal changes in HCHO surface concentrations can be reasonably estimated from the Pandora total column and information on the mixed-layer height. More work is needed to understand the bias in the intercept and the slope relative to columns derived from the in situ aircraft and surface measurements.
- Article
(7740 KB) - Full-text XML
- BibTeX
- EndNote


Formaldehyde (HCHO) is a key constituent in tropospheric chemical cycling. Its abundance is dominated by secondary formation through the oxidation of methane and non-methane hydrocarbons. It is also short lived, undergoing photolysis or oxidation by OH within a few hours under typical daytime conditions. As such, HCHO provides an important indicator of the integrated oxidation of hydrocarbons that contributes to tropospheric ozone production in the presence of nitrogen oxides. The degradation of HCHO can also constitute an important secondary source of HOx (HO + HO2), serving to amplify oxidation rates in polluted atmospheres. A more detailed discussion of HCHO chemistry can be found in Fried et al. (2011) and references therein.
The attributes described above make HCHO an important test species in evaluating our mechanistic understanding of tropospheric oxidation reactions as well as a valuable proxy for hydrocarbon emissions. Remote sensing of HCHO promises valuable insight into the emissions and processes driving tropospheric chemistry. For instance, satellite measurements of HCHO by the Global Ozone Monitoring Experiment (GOME) (Fu et al., 2007; Palmer, 2003; Palmer et al., 2006; Shim et al., 2005), SCanning Imaging Absorption SpectroMeter for Atmospheric CHartographY (SCIAMACHY) (Wittrock et al., 2006), and Ozone Monitoring Instrument (OMI) (Marais et al., 2012) have been used to map the isoprene emissions on a global scale. In combination with remote sensing of NO2, satellite observations of HCHO have been explored for their utility in assessing the factors contributing to ozone pollution by mapping areas of NOx-controlled vs. volatile organic compound (VOC)-controlled ozone formation (Jin et al., 2017; Jin and Holloway, 2015; Schroeder et al., 2016; Duncan et al., 2010)
With the promise of both temporal and spatial information for HCHO on the horizon from a constellation of geostationary satellites (Zoogman et al., 2017), other possible uses for satellite observations of HCHO are emerging. Recent work by Schroeder et al. (2016) suggests that column HCHO shows promise as a proxy for surface ozone. Valin et al. (2016) examine the relationship between column HCHO and its dependence on OH production and VOC reactivity, demonstrating the importance of this information to improving satellite-derived emissions estimates for isoprene and other hydrocarbons. These efforts to further develop and improve the use of future satellite observations elevate the need for ground-based remote sensing to validate satellite-measured HCHO columns. Remote-sensing differential optical absorption spectroscopy (DOAS) has been widely used to measure HCHO from ground (Lee et al., 2005; MacDonald et al., 2012; Pikelnaya et al., 2007; Vlemmix et al., 2015), aircraft (Baidar et al., 2013), and satellite (Bauwens et al., 2016; De Smedt et al., 2015) platforms. The uncertainties of the DOAS-derived HCHO columns are impacted by the DOAS fit uncertainty and the uncertainty in the air mass factors. Validation of such measurements is challenging due to air volume sampling differences between different platforms.
In this paper we present HCHO total columns from DOAS measurements of unscattered direct-sun (DS) photons using NASA/GSFC (National Aeronautics and Space Administration/Goddard Space Flight Center) Pandora instruments and in situ measurements over two sites during the Korea–United States Air Quality Study (KORUS-AQ) conducted in May–June 2016 in South Korea.
Pandora instruments are field grade spectroscopic UV–Vis systems (Herman et al., 2009). They are part of the growing joint NASA- (USA) and European Space Agency-sponsored Pandonia Global Network (PGN). The main goal of PGN is to provide consistent ground-based total NO2, HCHO, and O3 columns for satellite validation. The major advantages of PGN are uniform instrument design and calibration, and centralized data monitoring, processing, and distribution. Direct-sun-observation geometry eliminates the need for atmospheric radiative transfer modeling and simplifies data interpretation. PGN currently operates 75 instruments and is expected to have about 300 instruments by 2020–2021. Their product quality assurance is extremely important for satellite validation.
Pandoras deployed during KORUS-AQ were retrofitted with new UV grade fused silica windows with broadband antireflection coating (ARC, 250–700 nm). This modification from the earlier versions of Pandora (pre-2016) was necessary to decrease spurious spectral structure in DS spectra. This new ARC window improved NO2 and O3 measurements and made HCHO retrieval from Pandora DS measurements possible for the first time. KORUS-AQ Pandora measurements are extensively evaluated with both ground-based and airborne in situ observations of HCHO available during this study.
The rest of the paper is organized in the following sections. Section 2 describes in detail ground-based (Pandora and in situ) and aircraft measurements during the KORUS-AQ 2016 study. Section 3 explains how HCHO vertical column densities are calculated from the in situ measurements (aircraft and surface) for comparison with Pandora column measurements. Section 4 shows the results by comparing HCHO vertical columns from Pandora, surface, and aircraft measurements. Section 5 focuses on conclusions.
KORUS-AQ fielded a multi-perspective suite of observations including both remote sensing and in situ observations of air quality at ground sites across the peninsula and on research aircraft collecting valuable data on conditions aloft. Pandora spectrometers were used to observe total columns of HCHO at five locations, but two sites in particular also included ground-based in situ measurements of HCHO and frequent atmospheric profiling overflights by the NASA DC-8 aircraft with an in situ measurement of HCHO on board.
The first site was located in the Seoul megacity at Olympic Park (37.5232∘ N, 127.1260∘ E; 26 m a.s.l.), which the DC-8 overflew routinely during the study, visiting the site three times per day at the beginning, middle, and end of many research flights. These overflights were typically at 300 m during a descent over the city that ended below 30 m during a “missed approach” over the runway at Seoul Air Base approximately 8 km to the south (Fig. 1b).
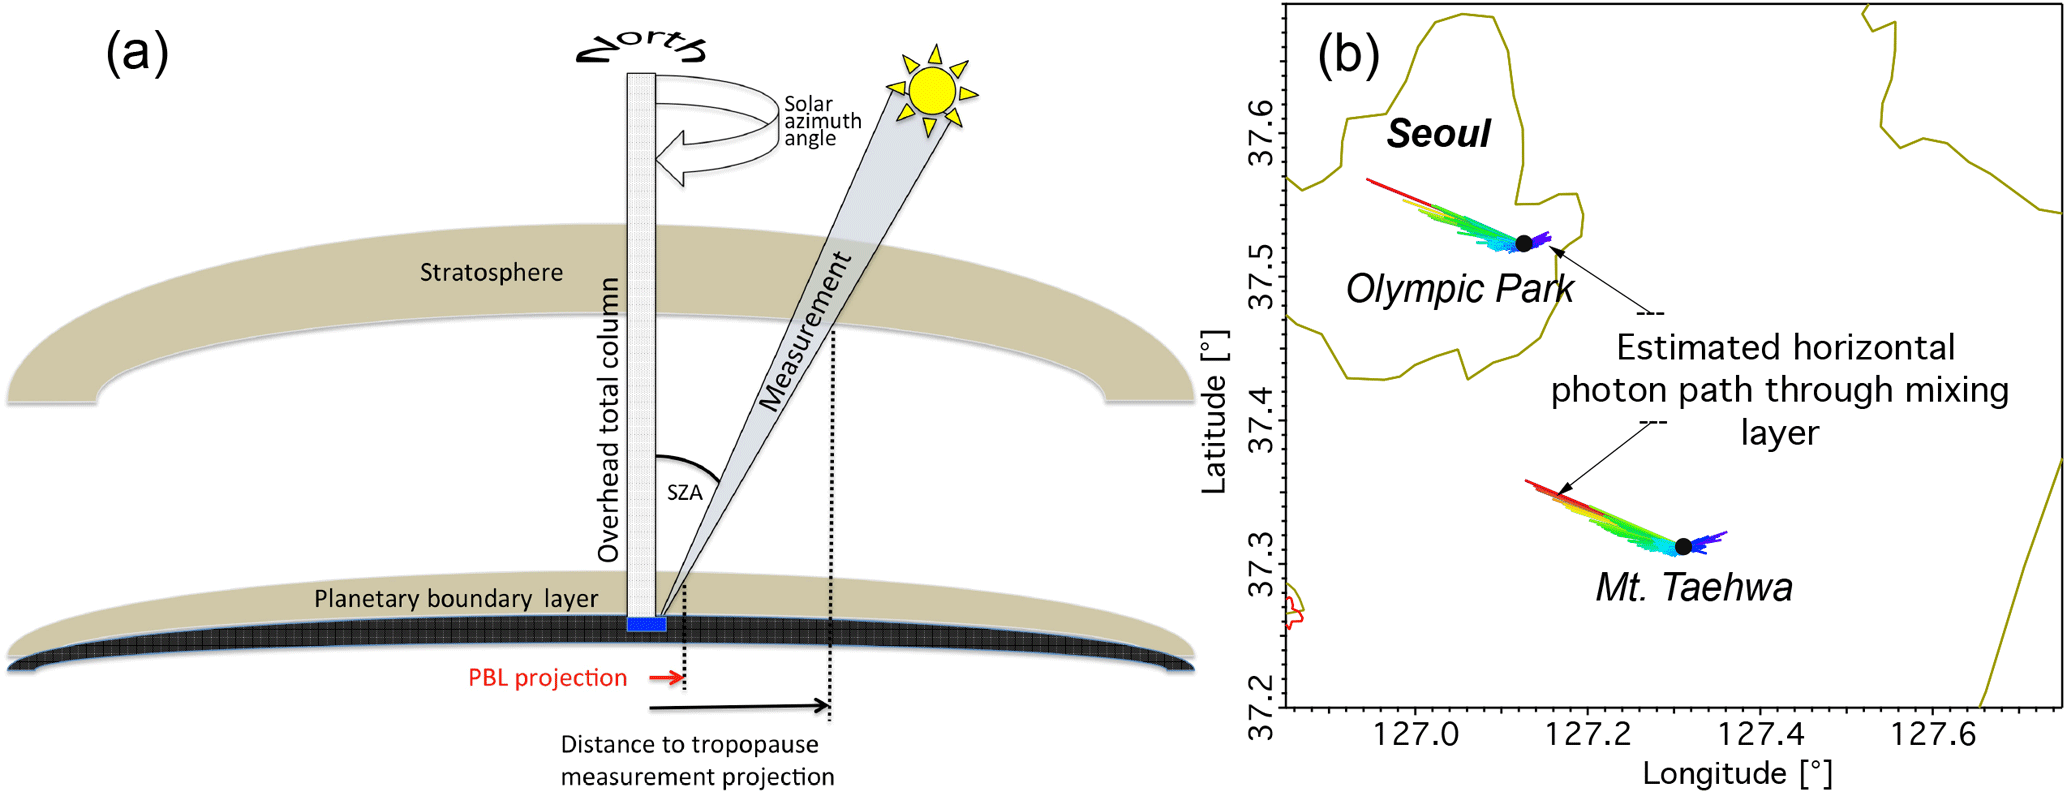
Figure 1(a) Schematic of direct-sun-observation geometry; (b) estimated photon path through mixing layer derived from Vaisala Ceilometer CL51 backscatter profiles (910 nm) over Olympic Park and Mt. Taehwa during KORUS-AQ. Color coding represents time of the day (blue – morning (horizontal distance: 1.5 km); red – evening (horizontal distance: 6 km)).
The second site was at Mount Taehwa (37.3123∘ N, 127.3106∘ E; 160 m a.s.l.), a research forest site located approximately 29 km southeast of the Olympic Park site and in the predominant downwind sector of transport for the Seoul megacity plume. Overflights of Mt. Taehwa were routinely performed following a missed approach at Seoul Air Base and was followed by a spiral ascent to 7.6 km altitude to provide a complete profile of in situ HCHO in the lower atmosphere over Korea.
2.1 Pandora measurements
The instrument consists of a small Avantes low-stray-light spectrometer (280–525 nm with 0.6 nm spectral resolution with 5 times oversampling) connected to an optical head by a 400 µm core diameter single-strand fiber optic cable. The optical head is attached to a small two-axis positioner, capable of accurate pointing to track the sun's center (±0.2∘). A diffuser is included in the optical path to minimize the effect of small pointing errors. Direct-sun spectra are taken at variable integration times (2.5 ms to 4 s) with a total measurement duration of 40 s.
Pandora spectra are automatically collected and submitted to NASA/LuftBlick servers for centralized uniform processing by the Blick Software Suite (Cede, 2017). All standard operational Pandora data products are available at http://pandonia.net/data (last access: 24 August 2018) (note that HCHO is not a standard product at the time of this publication).
Pandoras measure unscattered solar photons in a narrow cone (2.1∘ field of view (FOV) full width at half maximum with a diffuser and 1.6∘ FOV without the diffuser) at a specific solar azimuth and zenith direction that changes from east in the morning to west in the evening. Figure 1 shows the schematics of DS observation geometry where detected photons travel through the atmosphere in a slant path.
2.1.1 Pandora HCHO vertical column retrieval
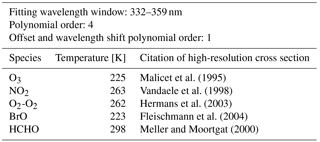
Table 1DOAS fitting parameters used to calculate HCHO ΔSCD from Pandora direct-sun measurements.
HCHO total vertical column densities are calculated from Pandora measurements of unscattered sun photons (with visible light blocked by a U340 filter) using the DOAS technique (Platt and Stutz, 2008). The analysis consists of the following steps, described in detail by Cede (2017):
- a.
Correction of the DS collected spectra (level L0 to L1) for dark current, charge-coupled device (CCD) nonlinearity, latency effect, pixel response nonuniformity, filter transmission, instrument temperature sensitivity, stray light, wavelength shift, etc.
- b.
Selection of the reference spectrum, ideally, a Pandora-measured reference spectrum with the smallest possible HCHO absorption and highest signal-to-noise ratio. In this study all spectra with low measurement noise collected around local noon (±30 min) during the entire campaign were averaged to create a single reference spectrum.
- c.
Calculation of HCHO differential slant column densities (ΔSCD) relative to the reference spectrum using the DOAS equation (Cede, 2017):
, where i is the index for pixels inside the limits of the fitting window, i=1 to n, and the center wavelength of pixel i is λi; F0i is the reference spectrum at pixel i used in the fitting; Fi is the L1 data for pixel i; POFFSi is the offset polynomial evaluated at pixel i; τsFIXi is the “known” slant optical depth at pixel i; j is the atmospheric absorber index, j=1 to nGAS; τsji is the slant optical depth of absorber j for slant column qsj and effective temperature Tj at pixel i; PSMOi is the smooth-part polynomial evaluated at pixel i; and PRESCi is the resolution change polynomial evaluated at pixel i. Since the reference spectrum contains an unknown amount of HCHO, retrieved slant columns are the difference between true HCHO slant columns (qs) and slant columns in the reference spectrum (qsREF). We will use SCD for qsHCHO notation in the rest of this paper.
The fitting window used in this study to calculate HCHO columns is 332–359 nm (PSMO=4). In addition to HCHO, other gases present in the atmosphere absorb in the selected fitting window: ozone (O3), nitrogen dioxide (NO2), oxygen collision complex (O2O2), and bromine monoxide (BrO). Their high-resolution molecular absorption cross sections were convolved with the Pandora instrument slit function prior to DOAS fitting and are listed in Table 1 (for convolution details see Cede, 2017).
- d.
Calculation of the air mass factor for DS observation geometry (AMFDS) according to Eq. (2):
, where REarth is the distance from the center of the Earth to the measurement location, SZA∗ is the geometrical solar zenith angle corrected for refraction, and heff is the effective profile-concentration-weighted height of a background HCHO distribution over ocean (4.3 km; Millet et al., 2006). heff has a very small effect on accuracy of AMFDS at SZA <80∘ as evaluated in this study (see discussion of “uncertainty in the DS AMF” below).
- e.
Estimation of HCHO slant column density in the reference spectrum (SCDref) using the modified Langley extrapolation method (MLE). Herman et al. (2009) reported its application to NO2 measurements. MLE is a statistical method based on the assumption that during a sufficiently long measurement period the vertical column densities (VCDs) of the trace gas of interest (here HCHO) will reach a certain minimum level at different times of the day (AMF). This assumption might not hold, especially if the species in question has a systematic diurnal pattern. Practical implementation of MLE consists in subsetting all the measured ΔSCD data in AMF bins and performing a linear regression on the lowest 2 percentile of low-noise L1 data. The intercept from the linear regression represents SCDref at AMF =0. Depending on the data filtering for instrumental/atmospheric noise and upper and lower AMF limits, SCDREF over Olympic Park ranges from 1.035±0.06 to 1.22±0.04 DU (Dobson unit molecules cm−2); over Mt. Taehwa it ranges from 0.74±0.03 to 0.82±0.04 DU. In all cases the quality of the linear fit is very high (R2>0.97). Higher SCDref were the result of data limitation to AMF between 1.2 and 4. In this study we estimated SCD DU for Olympic Park and 0.74±0.08 DU at Mt. Taehwa. We selected a smaller SCDREF from the range since it is more representative of the “standard” implementation of MLE by the PGN personnel, mainly based on NO2 data processing experience.
- f.
Calculation of the HCHO VCD (L2 Pandora data):
2.1.2 Pandora HCHO VCD uncertainty budget
The total error in the Pandora direct-sun HCHO VCD (εVCD) combines errors in ΔSCD and SCDref calculation and errors in AMF determination. εVCD can be estimated by summing the corresponding errors in quadrature according to Eq. (4) (assuming all the components are independent of each other).
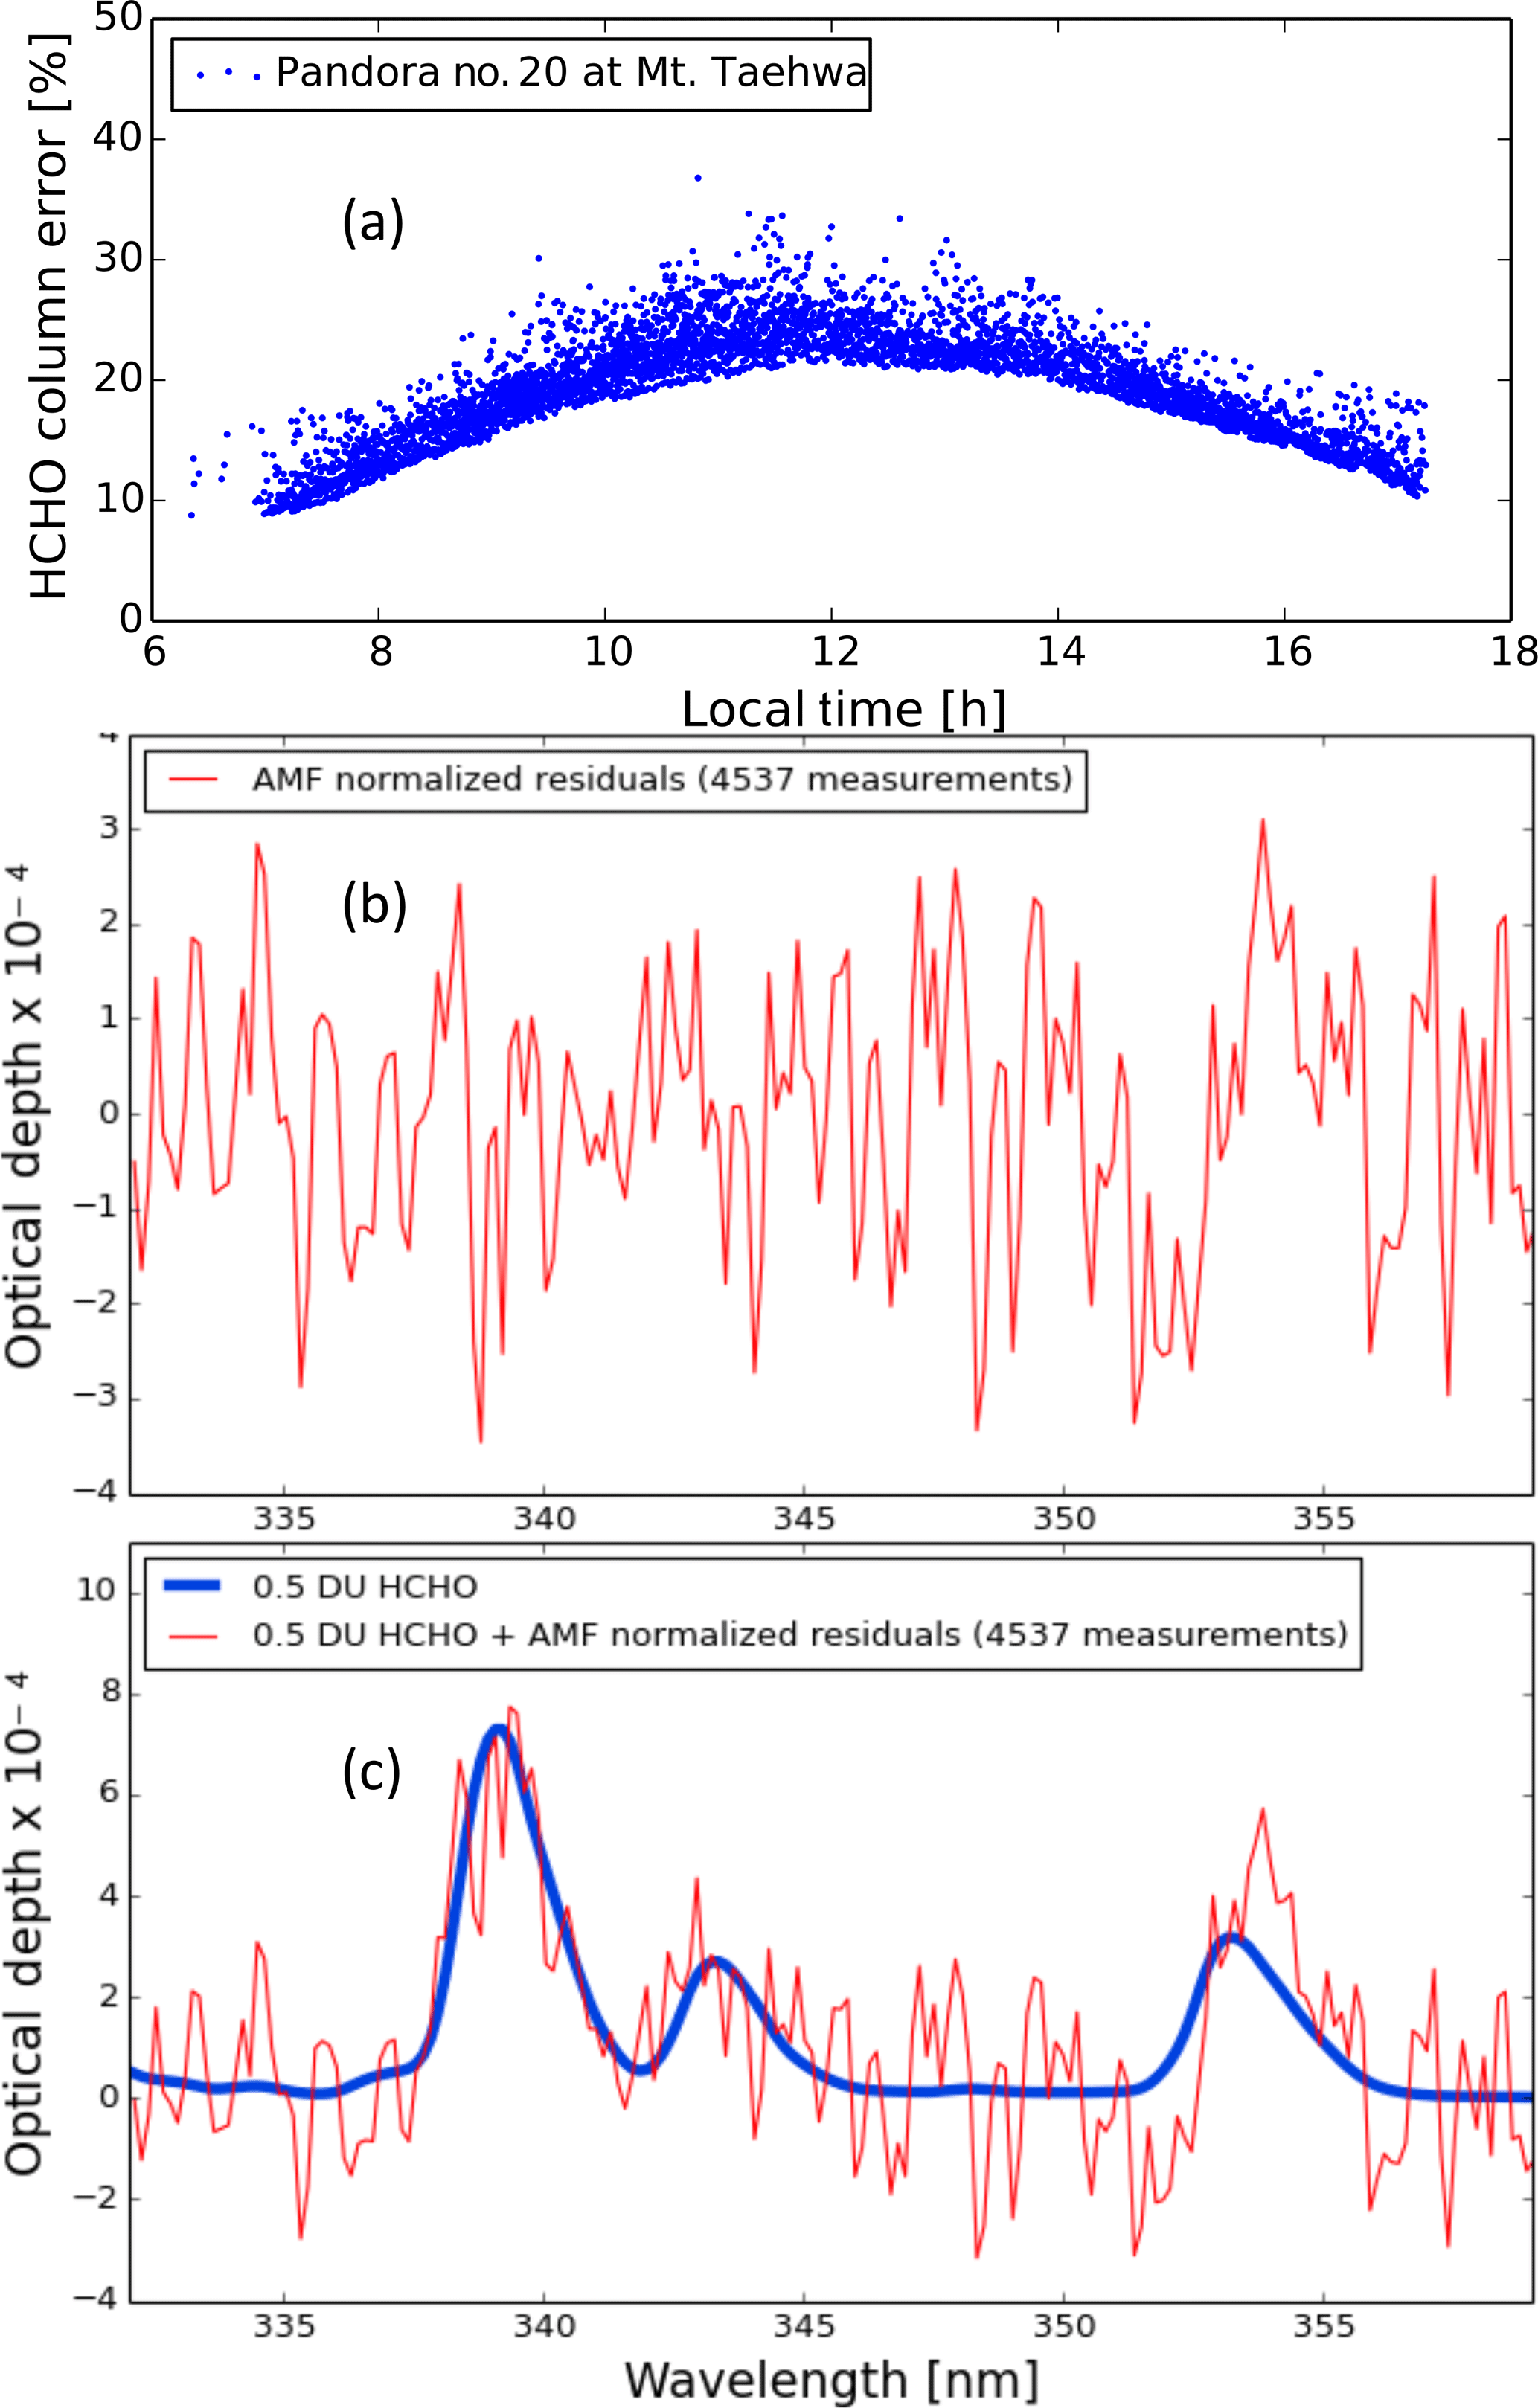
Figure 2(a) Estimation of total HCHO column errors from Pandora direct-sun measurements during KORUS-AQ (May–June 2016) at Mt. Taehwa; (b) common DOAS fitting optical depth residuals normalized by direct-sun AMF (4537 measurements); (c) optical depth of 0.5 DU HCHO (convolved with Pandora instrument transfer function).
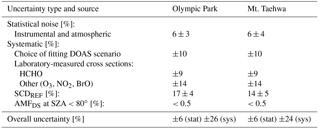
Table 2Pandora HCHO total column error budget from direct-sun measurements.
- a.
Uncertainties in ΔSCD are due to (1) statistical errors of the DOAS fitting and (2) systematic errors in the laboratory-measured molecular absorption cross sections and their temperature dependence, wavelength calibration, and cross correlation between absorption cross sections of different molecules (choice of fitting wavelength window) (Platt and Stutz, 2008; Stutz and Platt, 1996). In this study statistical errors of the DOAS fitting are calculated by the BlickSFA algorithm (Cede, 2017), which accounts for atmospheric and instrumental noise.
Selection of a fitting scenario (332–359 nm; see Table 1) can result in an error of ±10 %. This error was determined by performing DOAS fittings using different scenarios (324–359, 336–359, variation of PSMO in Eq. (1), inclusion and exclusion of BrO absorption, and fitting O3 temperature-dependent cross section). All of the scenarios resulted in comparable DOAS fitting residual optical depth root mean square (rms).
Uncertainties due to the laboratory-measured high-resolution molecular cross sections (σ) used in DOAS fitting (after convolution) propagate into the retrieved HCHO SCD. The effect of other gas σ errors depends on cross correlation between different cross sections and instrumental noise in a specific fitting window. Pinardi et al. (2013) reported that, for multi-axis DOAS geometry (336.5–359 nm), error due to σ(O3) selection (Bogumil et al., 2003, vs. Malicet et al., 1995) can result in HCHO ΔSCD error of 13 % (ΔSCD), error due to σ(NO2) selection (Vandaele et al., 1998, vs. Burrows et al., 1998) in HCHO ΔSCD error of up to 5 %, and σ(BrO) selection (Fleischmann et al., 2004, vs. Wilmouth et al., 1999) in HCHO ΔSCD error of about 2 %, totaling 14 %. Uncertainty in HCHO cross section is 9 %. We adopt Pinardi et al. (2013) estimates for Pandora HCHO total error calculation in this study and will perform more sensitivity studies with Pandora data in the future. Special attention will be given to the effect of gas atmospheric effective temperature on the DOAS fitting results.
Uncertainty due to extraneous spectral structure (ESS) in DS spectra (even with the new ARC window) is harder to evaluate and will be the subject of future studies. Figure 2b shows an example of common optical depth residuals calculated by the DOAS fitting algorithm of 4537 cloud and spatial stray-light-free DS measurements and scaled by DS AMF. Figure 2c illustrates the effect of this residual spectrum on the retrieval of 0.5 DU (background levels) of HCHO. Some of this common residual spectrum is potentially due to ESS. At this point we estimate that the error due to ESS is on the order of 0.025 DU.
- b.
Uncertainties in the SCDREF () calculated from MLE are driven by the data availability and diurnal changes in HCHO optical depth relative to the reference time optical depth. MLE requires at least 2 weeks of measurements during relatively cloud-free conditions that are collected uniformly at all SZAs from minimum up to at least 75∘ (AMF =3.5). Based on different data filtering for MLE, we assume that the error is about 17 %±4 % over Olympic Park and about 14 %±5 % over Mt. Taehwa. SCDREF is not truly independent of the uncertainty in ΔSCD, especially the systematic component (e.g., selection of the fitting scenario).
- c.
Uncertainty in the DS AMF is less than 1 % at SZA smaller than 80∘. At large SZAs (>80∘) the error arises from (1) uncertainty in the assumed species profile; (2) uncertainty in the appropriate measurement time and, therefore, the SZA itself due to longer integration times; (3) AMF wavelength dependence due to atmospheric refraction; (4) uncertainty in effective SZA calculation due to refraction; and (5) larger contribution of the scattered photons at longer integration times. In this study only DS measurements taken at SZA <80∘ were considered to reduce AMF error to <0.5 %.
We estimate that the total error in DS Pandora HCHO total column measurements during KORUS-AQ is [±6 (statistical) ±25 (systematic)] % at SZA <80∘. Table 2 summarizes all the error sources.
Figure 2a demonstrates dependence of the total HCHO error on the measurement time (AMF) according to Eq. (4). The V shape is mostly due to the error in SCDREF. The “direction” of the V shape depends on whether SCDREF is overestimated (Λ) or underestimated (V). Since the errors were added in quadrature, Fig. 2a shows an overestimation effect.
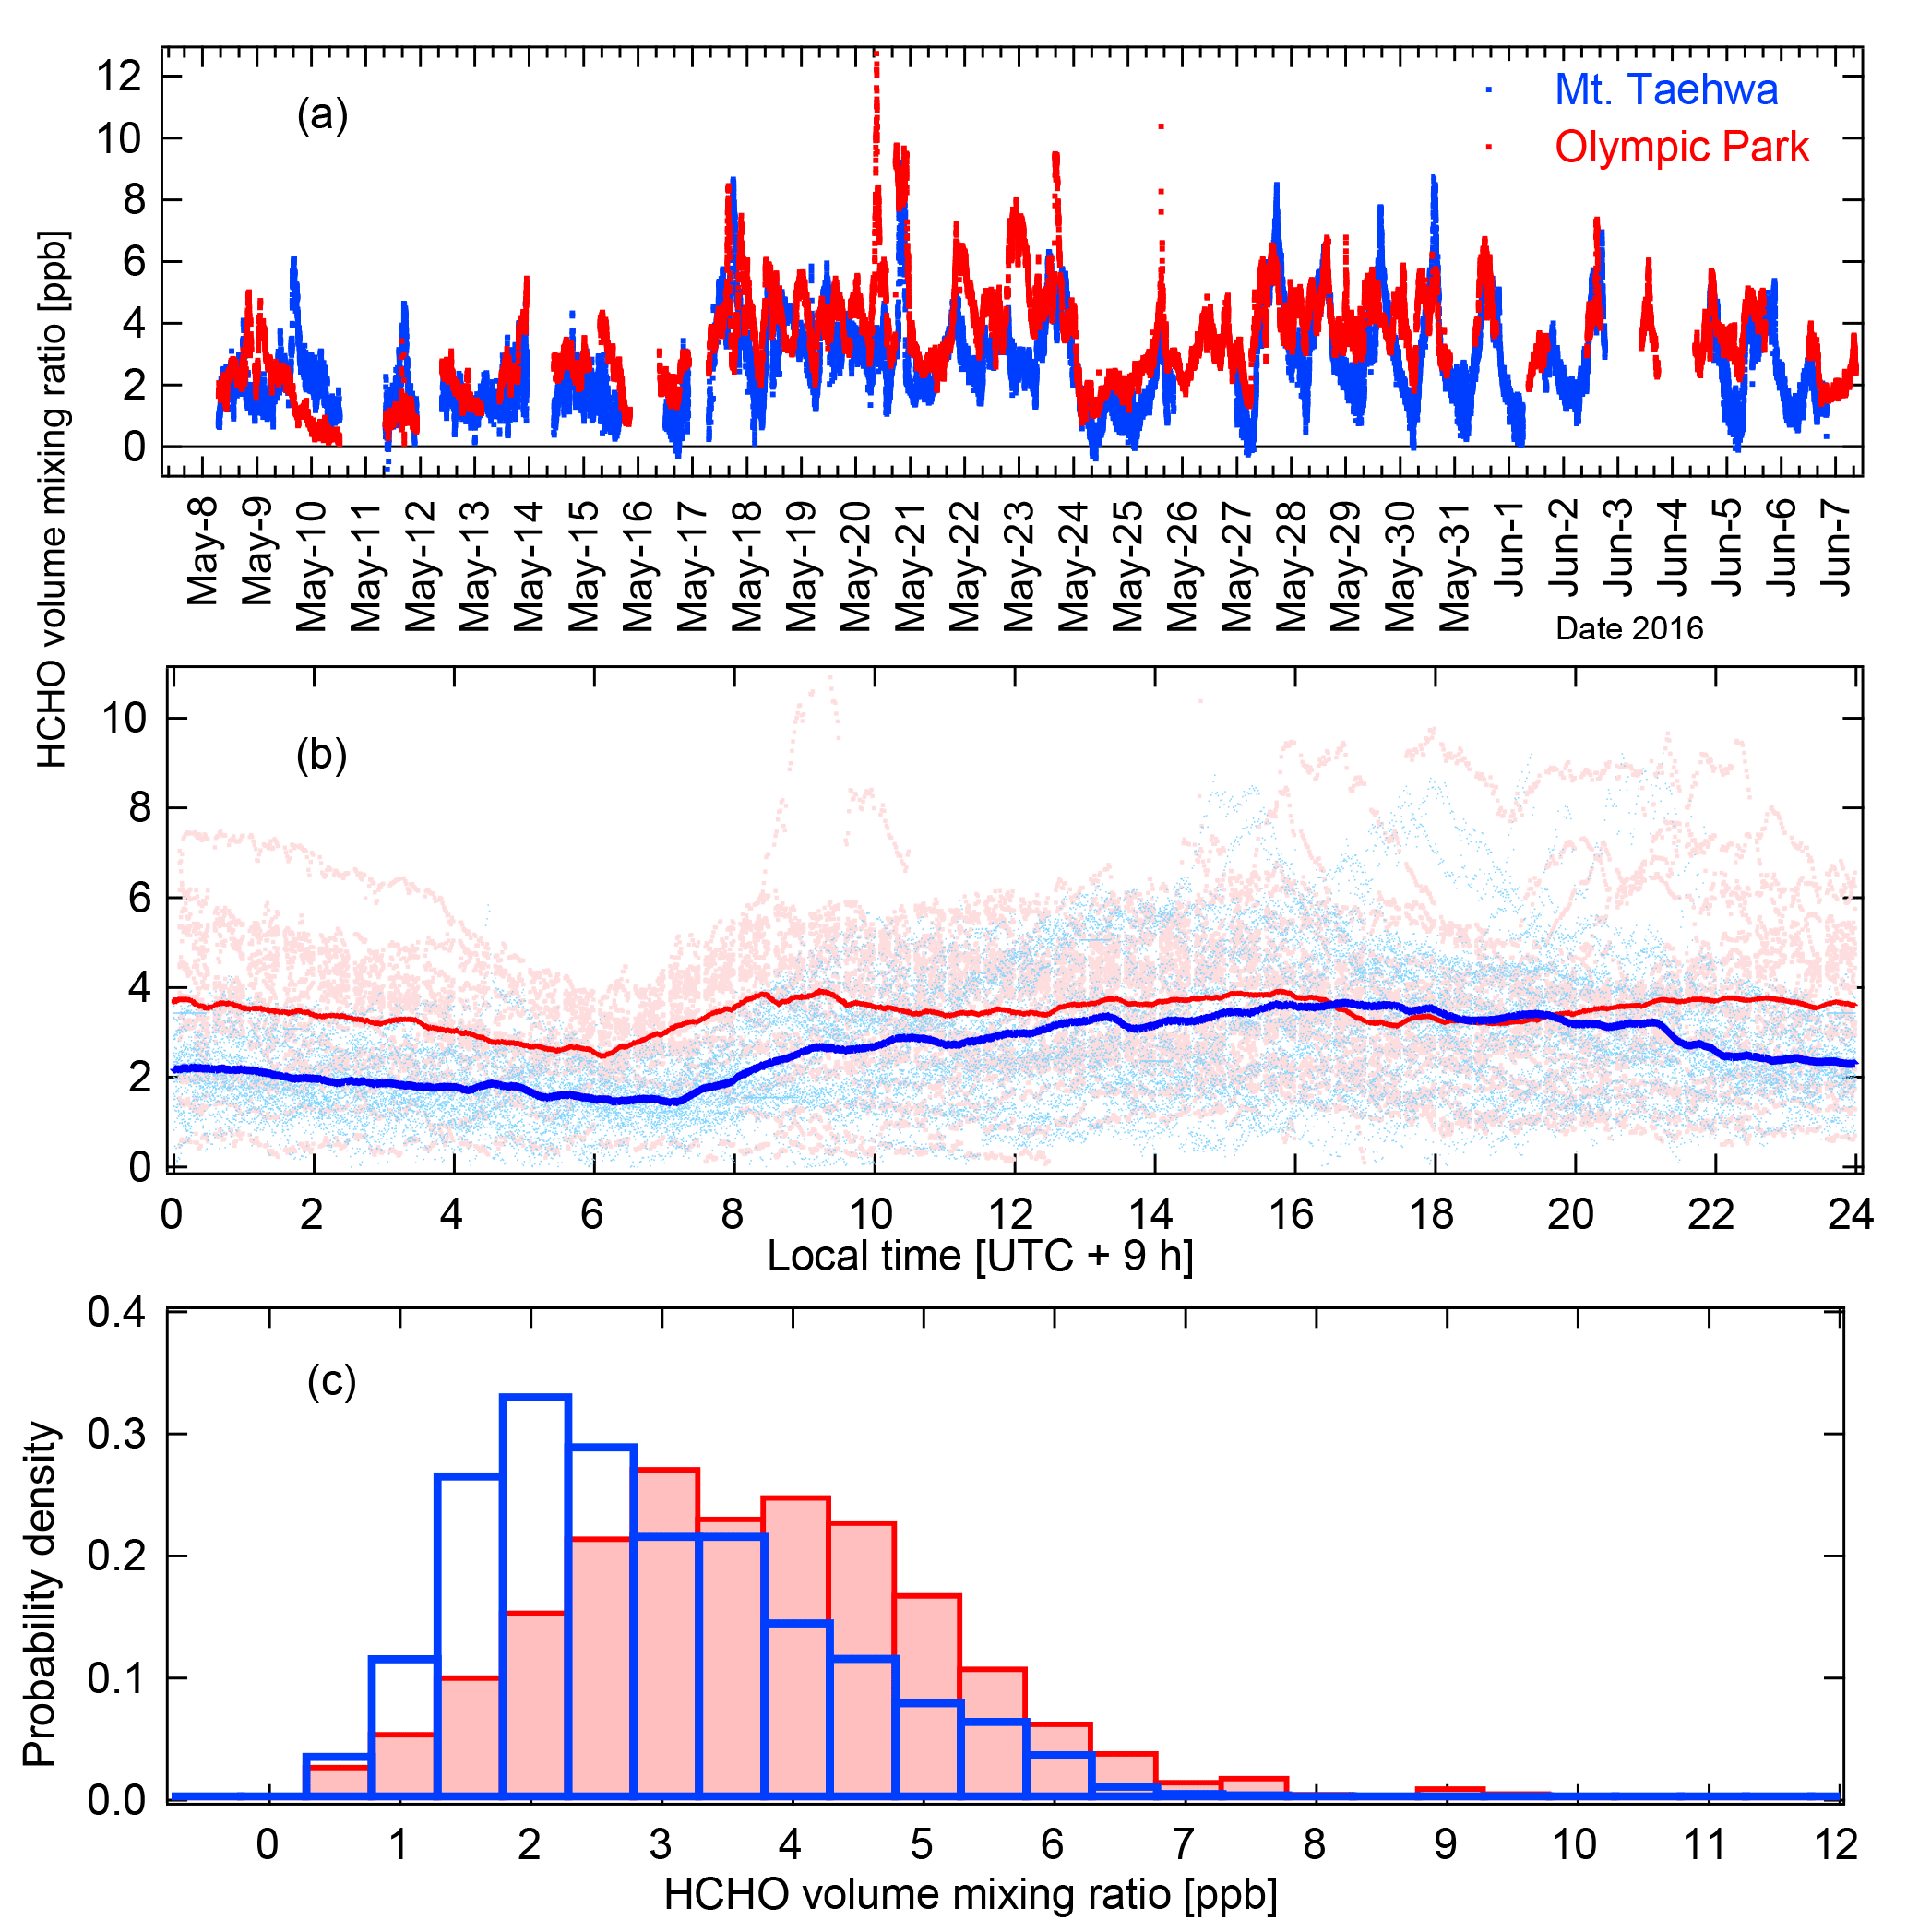
Figure 3(a) In situ HCHO volume mixing ratios measured at Olympic Park and Mt. Taehwa; (b) diurnal variation of HCHO volume mixing ratios at Olympic Park and Mt. Taehwa (solid lines represent running averaged data); (c) overlapping histograms of the HCHO distribution at Olympic Park and Mt. Taehwa during KORUS-AQ.
2.2 Ground-based in situ measurements at Olympic Park and Mt. Taehwa
Surface HCHO concentrations were measured at Mt. Taehwa and Olympic Park by tunable infrared laser direct absorption spectroscopy (Li et al., 2013) with quantum cascade lasers at mid-IR wavelengths (QC-TILDAS from Aerodyne Research, Inc.). In situ HCHO measurements were conducted by the US Environmental Protection Agency (EPA) at the Olympic Park research site, and by Aerodyne Research, Inc., at the Mt. Taehwa site.
Light from 1765 cm−1 (Olympic Park) and 2831.6 cm−1 (Mt. Taehwa) quantum cascade lasers were passed through a 0.5 L absorption cell with an effective path length of 76 m. Air was sampled at 12 L min−1 from a heated glass inertial inlet system located at a height of around 10 and 15 m above ground level for Olympic Park and Mt. Taehwa sites, respectively. The inertial inlet kept particulate matter greater than 100 nm out of the absorption cell in the instrument. A critical orifice controlled the instrument flow rate. The pumping speed dictated the cell pressure (35–45 torr). All tubing between the inertial inlet and the measurement cell was Teflon and heated to 30 ∘C.
Absorption measurements were made relative to a zero-air background gas obtained from an ultra-high-purity zero-air gas cylinder. Backgrounds were taken through the same inertial inlet used to measure samples. A 30 s background (with a 15 s flush time) was taken every 10–15 min. Nitrogen (N2) was flowed constantly through a permeation tube heated to 50 ∘C to provide a reference gas. This was added to the sample stream for 90 s every 15 min as a standard addition to monitor instrument stability over time.
Spectra were averaged for 1 s intervals and fit using a nonlinear least squares fitting algorithm, with parameters based on the HITRAN database (Gordon et al., 2017). One-second HCHO data were averaged to 10 and 60 s averages to improve precision. The Allan deviation (estimate for precision) is 0.100 ppb for 10 s HCHO data and 0.060 ppb for 60 s data. Estimated accuracy is approximately 10 %.
Figure 3 shows time-coincident in situ surface HCHO volume mixing ratios (vmr) at Olympic Park and Mt. Taehwa. The average vmr during the campaign at Mt Taehwa was 2.68±1.45 ppb (min ppb; max =9.22 ppb; median =2.39 ppb; Q25=1.59 ppb; Q75=3.51 ppb). Somewhat higher vmr's were observed at Olympic Park: 3.46±1.59 ppb ( ppb; ppb; median =3.35 ppb; Q25=2.38 ppb; Q75=4.40 ppb). In general, HCHO surface diurnal variation followed the same pattern at both sites with the minimum daily HCHO concentrations typically observed between 6:00 and 7:00 local time and gradual increasing to the maximum between 13:00 and 17:00. The largest differences between the sites were detected during night and morning hours (from about 21:00 to 11:00 local time). While these statistics provide a valuable overview of surface HCHO at these two sites, a deeper exploration of this behavior is beyond the scope of this paper and will be provided in other articles on KORUS-AQ exploring the details of air quality chemistry during the study.
2.3 Airborne in situ measurements on board the NASA DC-8
The Compact Atmospheric Multispecies Spectrometer (CAMS) is a dual-channel infrared laser absorption spectrometer that provided measurements of HCHO with 1 s time resolution on the NASA DC-8. A comprehensive description of CAMS can be found in Richter et al. (2015). Briefly, mid-IR laser light at 3.53 µm (2831.6 cm−1) is generated by nonlinear mixing of near-IR lasers in a periodically poled lithium niobate (PPLN) crystal. The combined beams are directed through a multipass Herriott absorption cell (pathlength of 89.6 m) through which ambient air is continuously sampled at a pressure of 50 torr. The lasers are modulated and scanned through an isolated vibrational-rotational HCHO absorption line (2831.6 cm−1). A 1-standard-deviation limit of detection in ambient air is 30 to 50 pptv in 1 s. Based upon the accuracy of our standards along with other factors, we estimate an overall accuracy of 4 to 6 % in determining the ambient mixing ratio.
There were a total of 20 local flights of the DC-8 over Korea from 2 May to 10 June 2016. As described earlier, flights included routine overflight of the two sites as well as vertical profiling in their vicinity multiple times per day. Figure 4 shows a summary of all flight trajectories and measured HCHO over and near the two sites. We “assigned” data collected below 3 km to a respective site if the ground distance from the site to the aircraft was less then 15 km (Fig. 4a and d). This resulted in a total of 38 DC-8-measured profiles over Mt. Taehwa and 43 over Olympic Park.
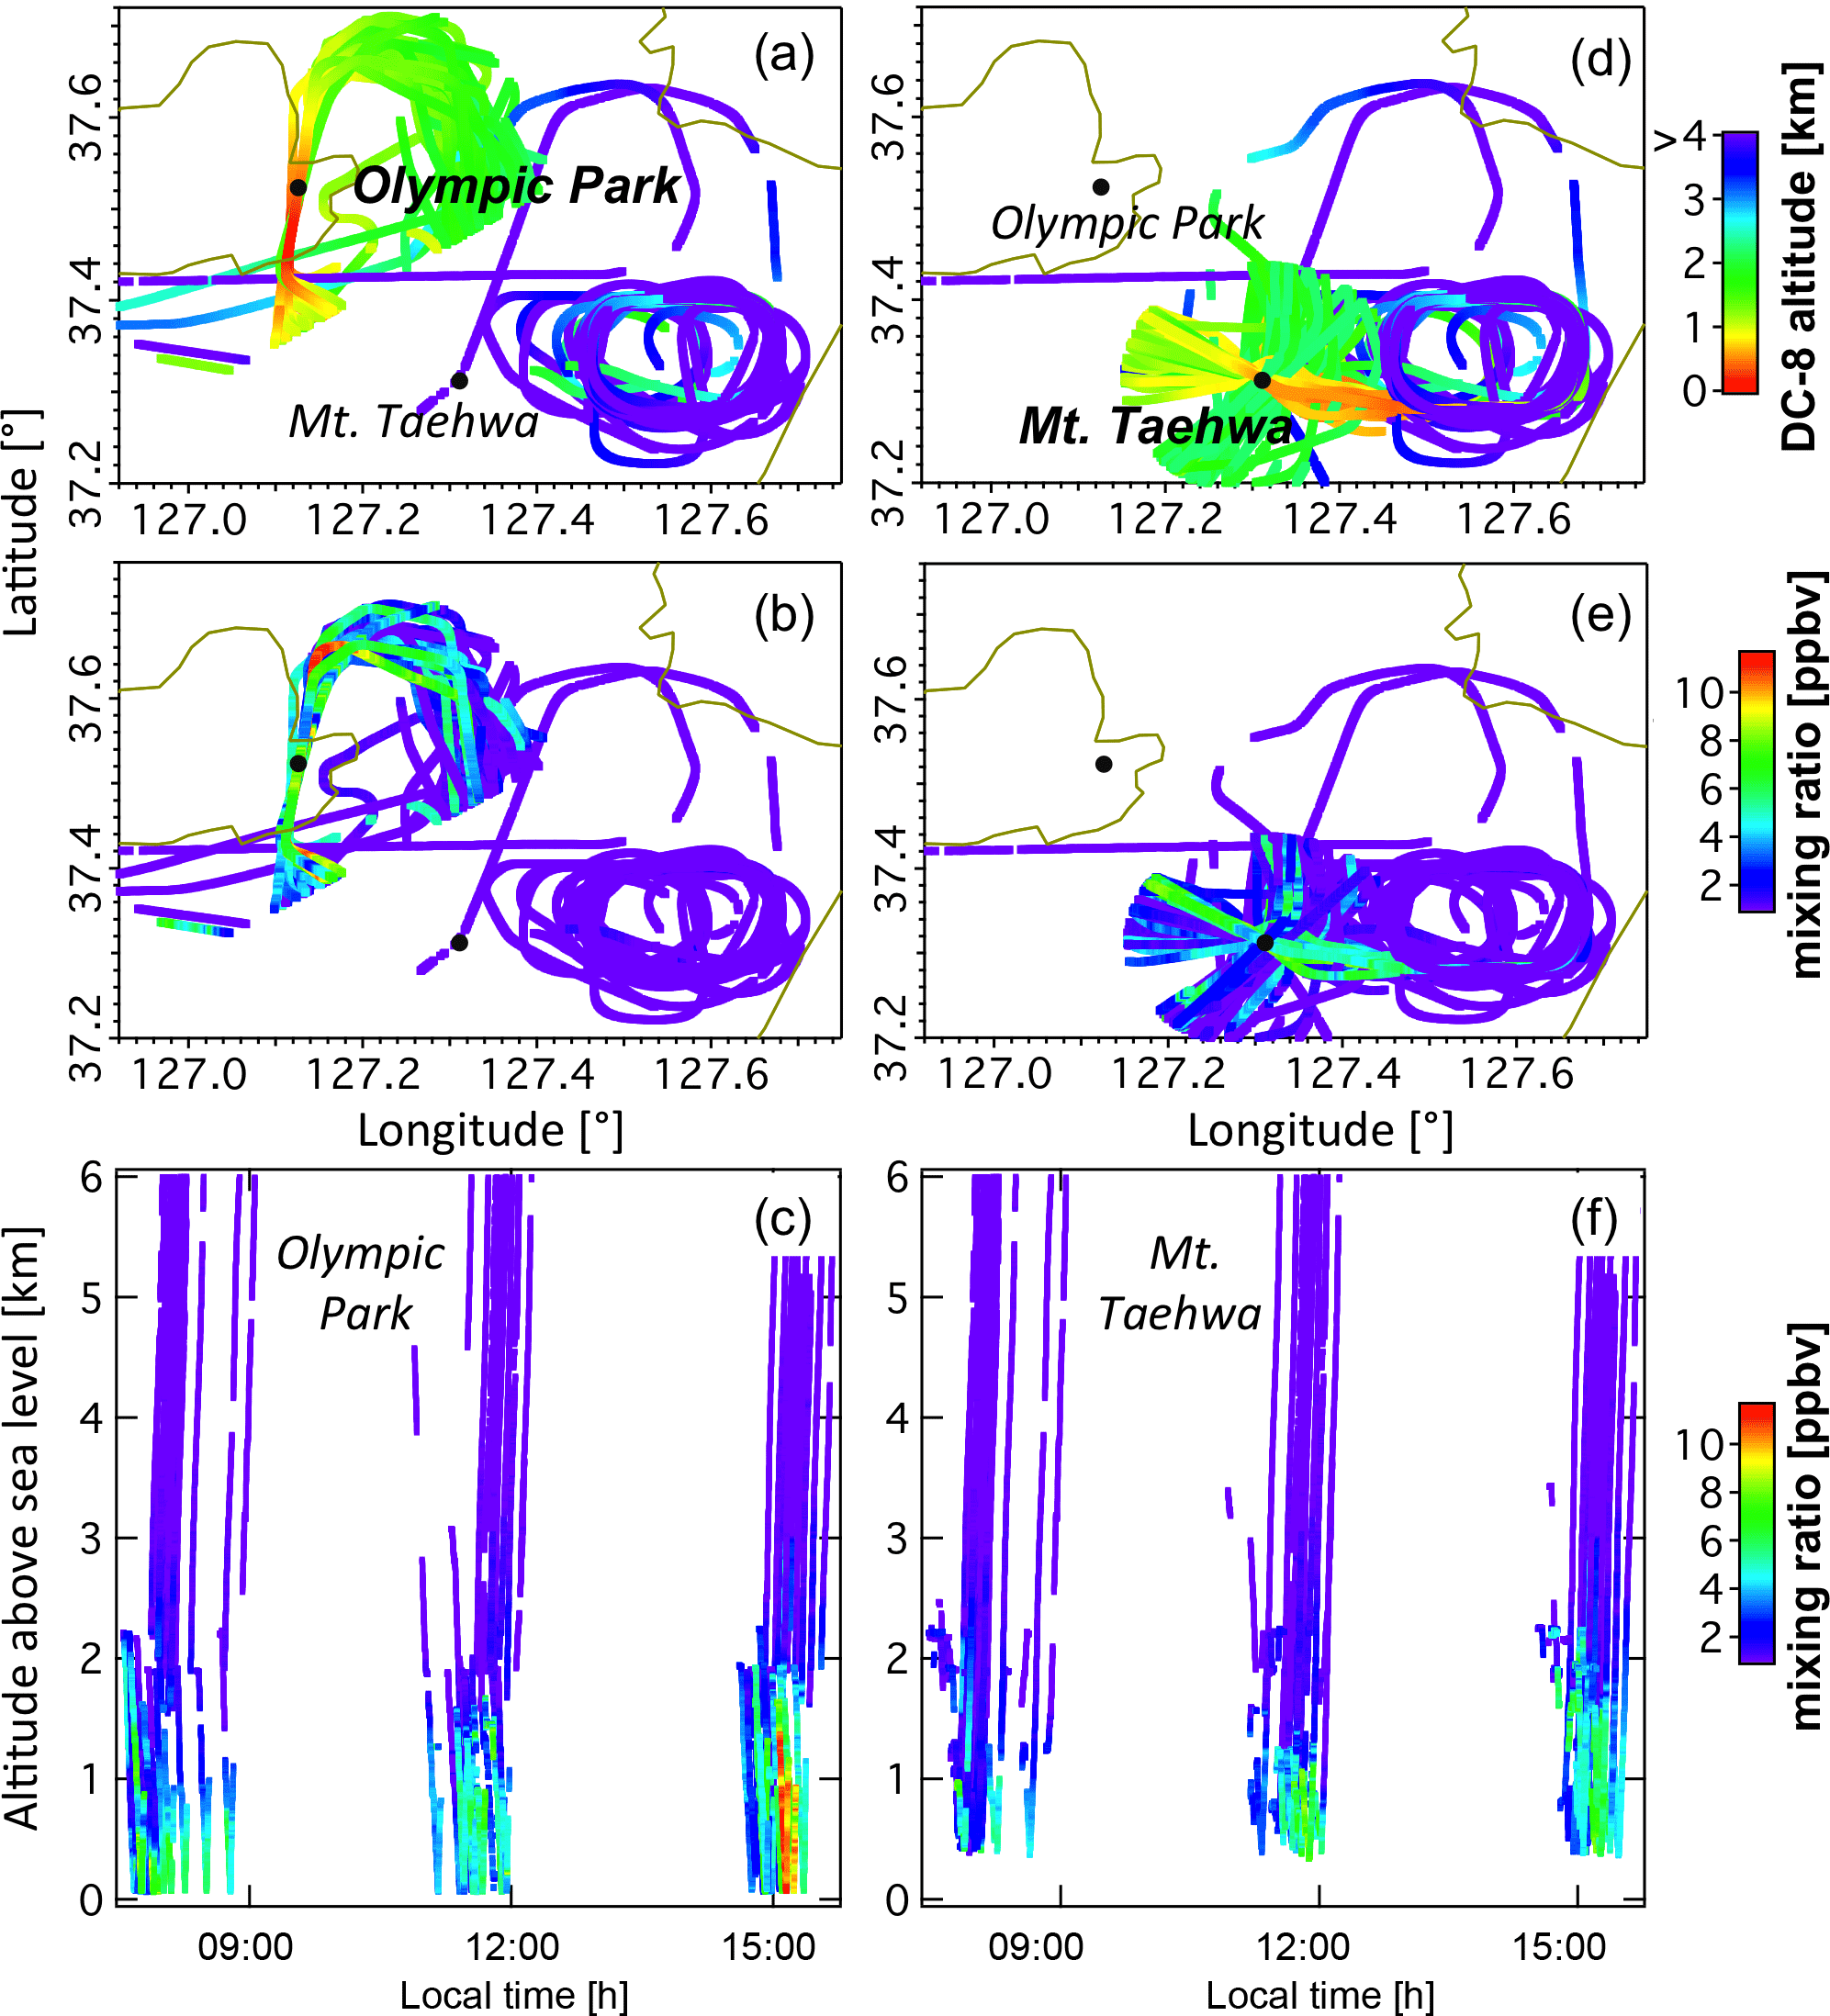
Figure 4Summary of all DC-8 flights over Olympic Park and Mt. Taehwa: (a, d) DC-8 GPS altitude above sea level, (b, e) HCHO mixing ratios measured on board DC-8 as a function of latitude and longitude, and (c, f) HCHO mixing ratios measured on board DC-8 as a function of altitude and local time. Distance between Mt. Taehwa and Olympic Park sites is approximately 29 km.
Most DC-8 measurements directly above the Mt. Taehwa site were done at an altitude of 0.6–1 km a.s.l., reaching the minimum altitudes in a narrow path when approaching the site from the west and descending to the east before conducting the spiral ascent (Fig. 4d). In-line overpasses over Olympic Park extended to a maximum height of 2–3 km north of the site with a variable minimum altitude (0.1±0.17 km) south of the site (Fig. 4a). Measurements above 3.5 km have little impact on HCHO vertical column variability (mean ppb) during the entire study. Considering the short distance between the Olympic Park and Mt. Taehwa sites and the minimal variability of free-tropospheric HCHO compared to boundary layer variability, we complement the in-line overpasses over Olympic Park (up to 2–3 km) with the higher-altitude portion from profiles over Mt. Taehwa (from 2–3 to 6–8 km) that are measured within 30 min from the end of the in-line Olympic Park overpass. Figure 4 (c and f) shows diurnal changes in the HCHO vertical distribution. The largest variability in HCHO was observed in the lowest 1 km at both sites as a function of time of day. HCHO was confined to shallow layers in the morning (0.5–0.8 km) and then expanded to up to 2–3 km around 15:00–16:00 local time due to enhanced production and vertical mixing. Morning HCHO profiles and profiles with low mixing ratios tend to have an exponential function shape. Conversely, profiles during mid-afternoon can be described by a uniform value in the mixed layer with exponential decay to a minimum free-tropospheric concentration around 4 km.
3.1 Integration of airborne measurements to determine column densities
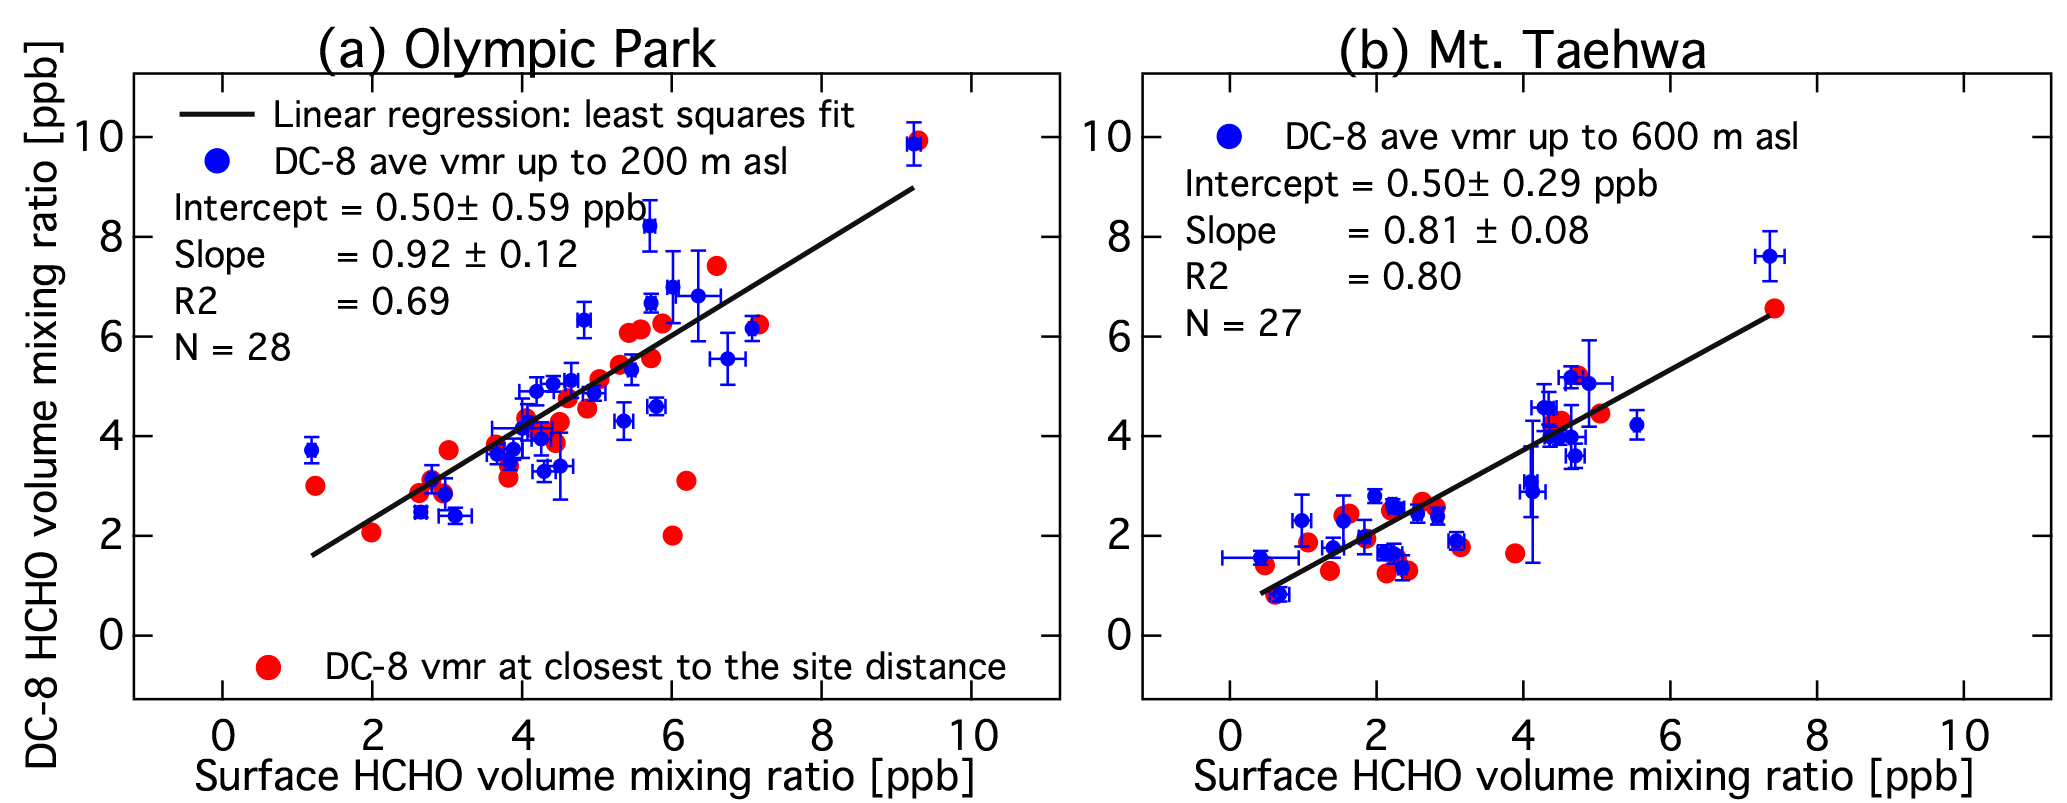
Figure 5Correlation between surface in situ and near-surface DC-8 measurements at Olympic Park (a) and Mt. Taehwa (b) during KORUS-AQ. All available aircraft measurements were averaged from the lowest DC-8 altitude up to 200 m above sea level (a.s.l.) at Olympic Park and up to 600 m a.s.l. at Mt. Taehwa (blue circles). Measurements at the closest DC-8 location to the sites are also shown (red circles).
Figure 5 shows the linear correlation between the in situ ground-based measurements at each site and the aircraft measurements averaged over the lowest 200 m in proximity to the Olympic Park site and the lowest 600 m a.s.l. near the Mt. Taehwa site. The total duration of flight time needed to sample the corresponding vertical distances was between 0.5 and 3 min. This resulted in ground distance coverage of 17.4±5.9 km around Mt. Taehwa and 9.1±1.5 km around Olympic Park. Generally, near-surface averaged aircraft observations were lower than the in situ measured surface concentrations (slope of 0.92 at Olympic Park and 0.81 at Mt. Taehwa). DC-8 altitude at the closest site distance (<0.2 km) was 0.44±0.02 km over Olympic Park and 0.65±0.10 km over Mt. Taehwa.
The absolute difference between the averaged near-surface DC-8 and in situ measurements was 0.74±0.65 ppb for Olympic Park and 0.62±0.40 ppb for Mt. Taehwa. The correlation (R2) between the in situ ground-based and near-surface DC-8-measured HCHO concentrations is 0.69 for Olympic Park and 0.80 for Mt. Taehwa. This suggests some spatial HCHO heterogeneity in the vertical (surface to 200 and 470 m) and horizontal (up to 23 km) directions.
To account for the partial column between the surface and the lowest aircraft altitude, we complement DC-8 profiles with the in situ surface measurements. Air density at the surface was calculated from the Lufft WS501 measurements of temperature and pressure at Mt. Taehwa. There were no pressure measurements at Olympic Park, so we scaled pressure from Osan Air Base to the Mt. Taehwa altitude. Temperature measurements at Olympic Park did not cover the entire campaign, so we used temperature from Mt. Taehwa (+2 K) on a few missing data days. We also exclude in situ HCHO measurements at Mt. Taehwa on 2 June 2016 due to the unreasonably low measurements during the whole day. The partial column above the aircraft was calculated using the mixing ratio measured at the highest DC-8 altitude up to the tropopause height, which varied around 12.77±1.63 km. The tropopause height was calculated from the radiosonde temperature profiles launched from Osan Air Base during the campaign. We estimate that the partial column above the aircraft altitude is about 0.05 to 0.07 DU. These added partial columns above DC-8 maximum altitudes up to the tropopause accounted for about 5 %±4 % of the total columns. The added column below the lowest DC-8 altitudes down to the site surface accounted for 16 %±7 % over Mt. Taehwa and 3 %±1 % over Olympic Park.
Total columns from DC-8 HCHO profiles were determined by numerical integration of the volume number density from the lowest to the highest altitudes. Errors in derived DC-8 HCHO total columns are comprised of the instrumental uncertainties of the measurements, errors in temperature and pressure profiles, errors due to spatial and temporal heterogeneity of the HCHO distribution in the sampled air relative to the specific volume over the site, and errors due to extrapolation to the parts of the atmosphere not sampled by the aircraft. In this study we approximate errors due to spatial and temporal heterogeneity of the HCHO distribution by comparing DC-8 measurements within the lowest 200 m for Olympic Park and 470 m for Mt. Taehwa to the in situ surface mixing ratios (see Fig. 5). This uncertainty source leads to a potential underestimation of 8 % for Olympic Park and 19 % for Mt. Taehwa. Instrumental errors are random and are on the order of 4 %–6 %. We assume that the uncertainty in the partial column above the DC-8 is 50 %, which translates to about 2.5 % of the total column. We assume that the uncertainty in the partial column below the DC-8 minimum altitude is dominated by the uncertainty due to heterogeneity. Another source of error in the calculated columns over Olympic Park is the potential heterogeneity above the highest DC-8 altitude above Olympic Park (2–3 km) and Mt. Taehwa. When all these sources are considered, the total error in derived VCD from the aircraft measurements is about () % for Olympic Park and () % over Mt. Taehwa. Negative errors indicate underestimation of the total column (heterogeneity and altitude “undersampling” errors were added in quadrature, assuming their independence).
3.2 Deriving column densities from surface measurements and mixing layer height
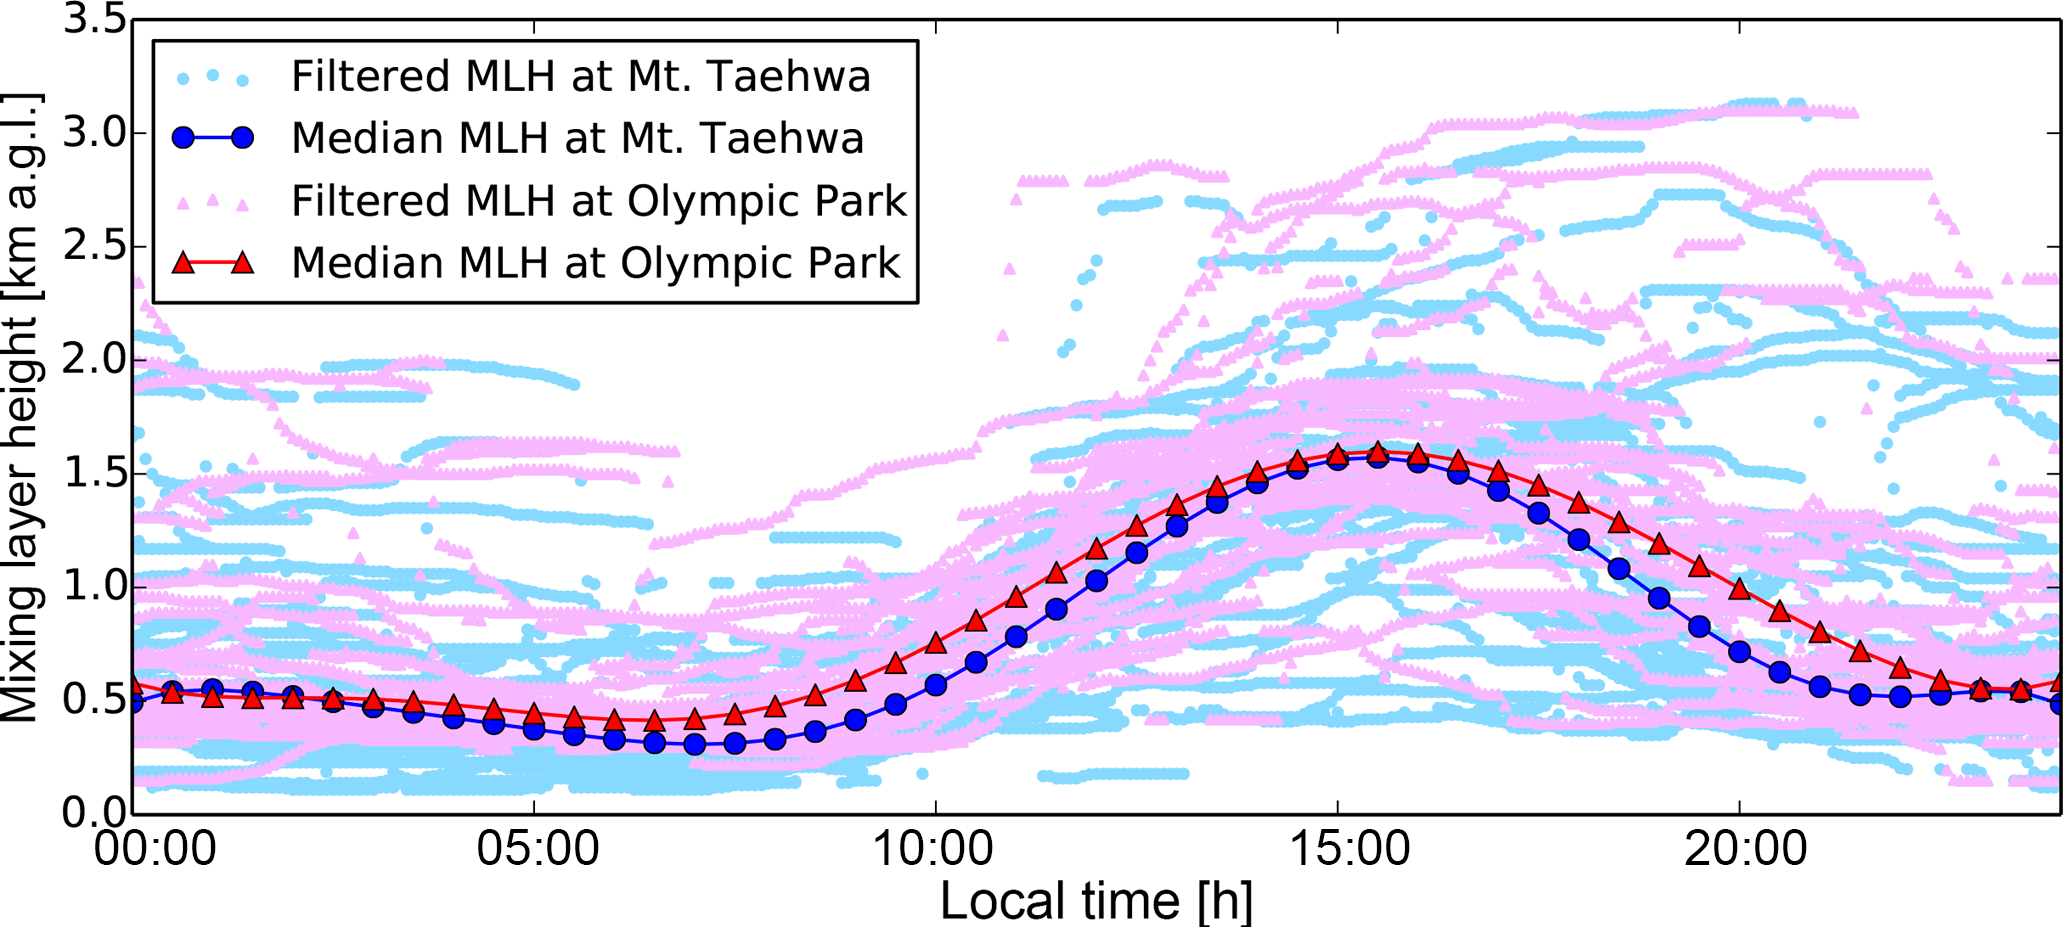
Figure 6Mixing layer height (MLH) above ground level derived from Vaisala Ceilometer CL51 backscatter profiles (910 nm) over Olympic Park and Mt. Taehwa during KORUS-AQ.
Given the broader availability of Pandora observations and surface HCHO measurements without the benefit of complementary airborne sampling, we also developed estimates for column densities depending only on in situ surface measurements and information on mixing layer height (MLH) derived from Vaisala Ceilometer CL51 backscatter profiles at 910 nm (Knepp et al., 2017). The main assumption is that most of the HCHO column is located in the well-mixed layer. Figure 6 shows MLH derived from the backscatter profiles at Mt. Taehwa and Olympic Park. The estimated MLH diurnal changes are very similar at both sites. The minimum MLH (300–500 m) is during the night and early morning hours (22:00–8:00). Planetary boundary layer growth typically starts around 7:00–8:00 in the morning and reaches its maximum (1.5–2 km) around 15:00–16:00 local time. On some days, however, the estimated MLH peaks later (around 18:00) and is significantly higher (around 3 km). Measured MLHs, however, are somewhat lower at Mt. Taehwa compared to Olympic Park in the morning and late afternoon. Diurnal changes in ceilometer-measured MLH have the same trend as the diurnal changes in the vertical distribution of HCHO measured from the aircraft (see Fig. 4c, f and Sect. 2.3) confirming our assumption.
To estimate the total column from in situ surface concentrations, we (1) filtered and averaged the MLH data for both sites to generate “measured” MLH and (2) created a median MLH as a function of local time of day from all measurements. A median MLH was used to test the hypothesis of whether a “generic seasonal” estimation of MLH can be applied to relate in situ surface and column HCHO measurements.
Ceilometer-measured MLH can exhibit sporadic variations that are not related to the true changes of MLH. We have examined effect of several filtering schemes on the total columns: (1) no filtering with 5 min averaging of raw MLH; (2) running median (±300 points); (3) running median (±150 points); (4) averaging raw MLH over 5 min after removing data that have large differences with the running median (300 points) >300 m; and (5) averaging raw MLH over 5 min after removing data that have differences with the running median (150 points) >300 m. In general, filtering of MLH has a small effect on the agreement between the remote-sensing columns and columns derived from the in situ measurements (R2 standard deviation of 0.02). The running median (±300 points) produced the best agreement and is used in the calculation of ground-up columns.
We calculated total columns from in situ measurements (ground-up VCD) using four different profile shapes: (1) a uniform HCHO mixing ratio up to the median MLH with a free-tropospheric mixing ratio of 0.23 ppb from the MLH to the average tropopause height of 12.77 km; (2) same as (1) but using the “measured” MLH; (3) a uniform HCHO mixing ratio up to the median MLH with a free-tropospheric mixing ratio that exponentially decreases above the MLH to 0.23 ppb within 3×MLH or 4 km (whichever is smaller) and remains constant up to the average tropopause height of 12.77 km; and (4) same as (3) but using the “measured” MLH.
Free-tropospheric vmr of 0.23±0.14 ppb is derived from DC-8 in situ measurements during KORUS-AQ. For a location with no aircraft measurements free-tropospheric vmr can be estimated from chemical transport models (see Fried et al., 2011)
A single temperature and pressure profile for the whole campaign was generated from all available radiosonde measurements. This profile was scaled to account for surface temperature and pressure changes during the campaign within the MLH.
4.1 Diurnal variability of HCHO columns
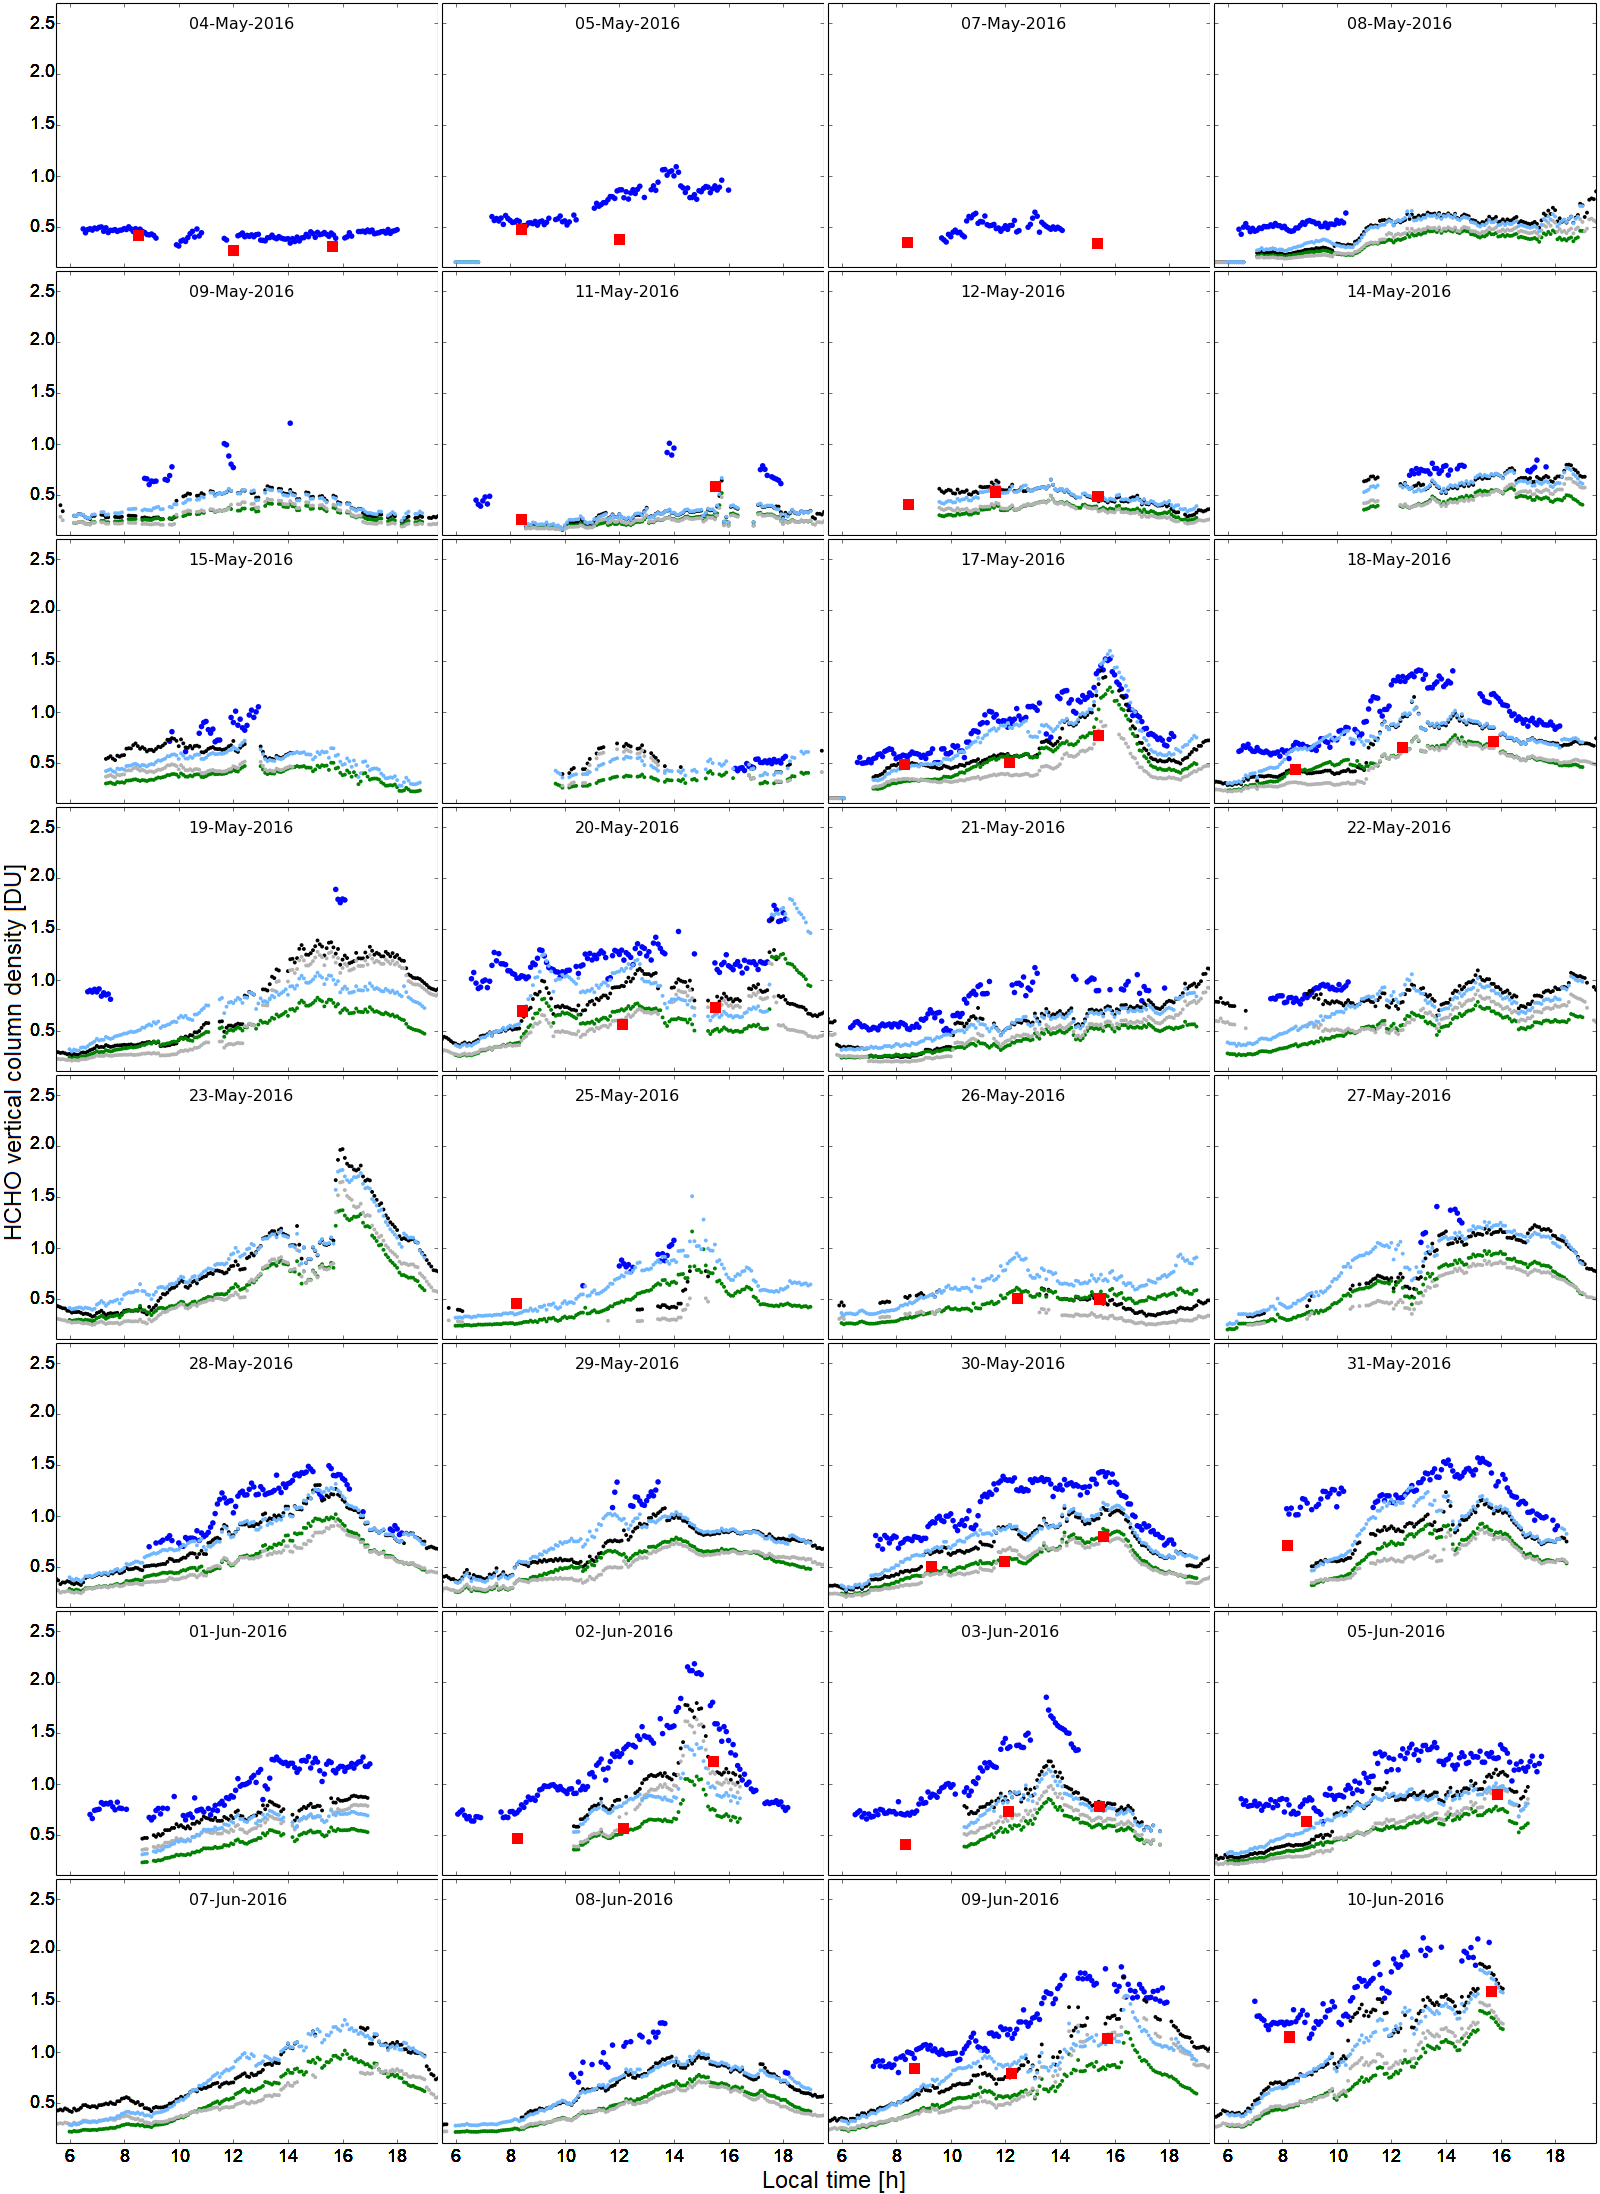
Figure 7Vertical column densities at Olympic Park during KORUS-AQ derived from Pandora direct-sun measurements (•); DC-8 (from surface to 12.77 km, ▪); and surface concentrations and profile shapes: (1) box with a median MLH (green), (2) box with a measured MLH (grey); (3) box+exponential profile with a median MLH (light blue), and (4) box+exponential profile with a measured MLH (black).
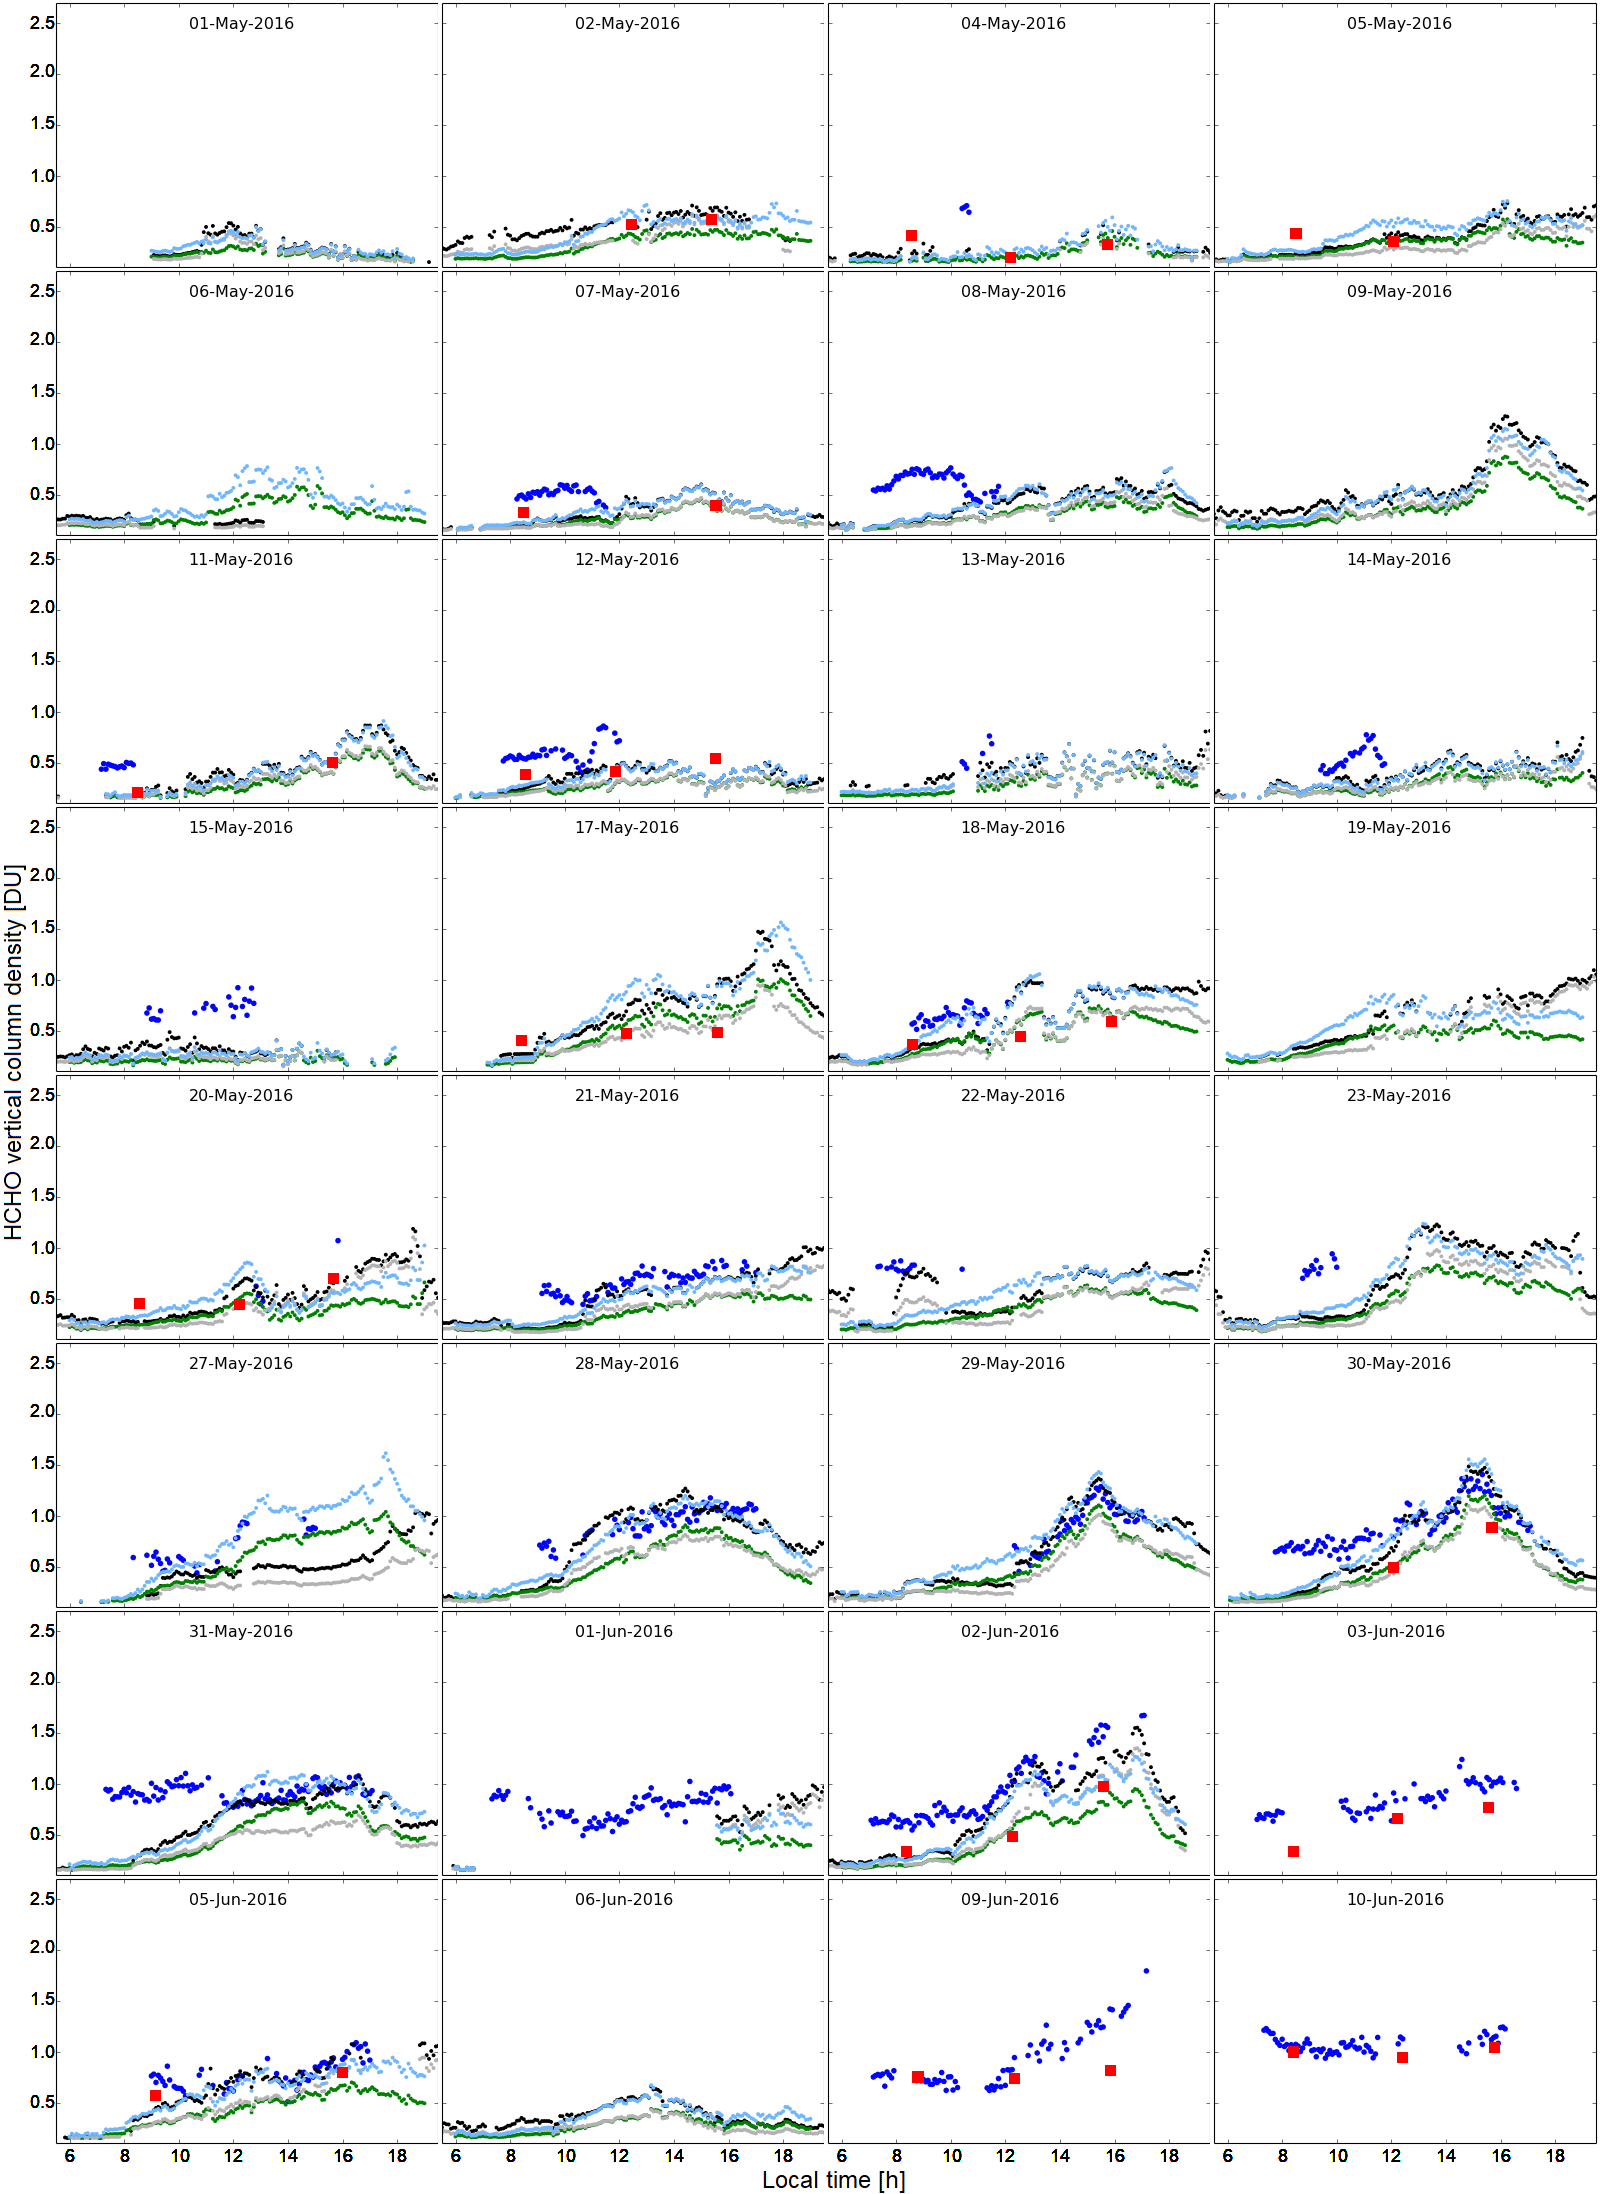
Figure 8Vertical column densities at Mt. Taehwa during KORUS-AQ derived from Pandora direct-sun measurements (•); DC-8 (from surface to 12.77 km, ▪); and surface concentrations and profile shapes: (1) box with a median MLH (green), (2) box with a measured MLH (grey), (3) box+exponential profile with a median MLH (light blue), and (4) box+exponential profile with a measured MLH (black).
Total columns from Pandora direct-sun measurements, DC-8 aircraft profiles, and surface measurements (using four profile shape assumptions) are shown in Fig. 7 for Olympic Park and Fig. 8 for Mt. Taehwa. Days with no or limited data (e.g., cloud-screened Pandora data) were excluded from these figures. Diurnal changes for all of the column estimations show similar trends with minimum VCD typically in early morning and maximum VCD around 14:00–16:00 local time. Figures 7 and 8 show the effect of the assumed profile shapes on the derived “ground-up” columns. As expected, the profile shapes (2 – grey) and (4 – light blue) that use measured MLH result in the largest VCD when MLH is larger than the median values. This is obvious on 19 May 2016 (Olympic Park), when measured MLH in the afternoon was 3 km compared to a median MLH of 1.5 km (Fig. 9). Considering that exponential function addition to the box shape is limited to 4 km (or 3×MLH, whichever is smaller), the larger the MLH, the smaller the difference between the derived VCD from the corresponding box and box–exponential profile shapes. This is also demonstrated by the afternoon data on 19 May 2016, when ground-up VCD from the box profile shape (2) and box–exponential profile shape (4) have a very small offset between them. However, when MLH is significantly lower than 4 km, exponential decay from the surface-measured concentration to 0.23 ppb can add a substantial amount to the total column.
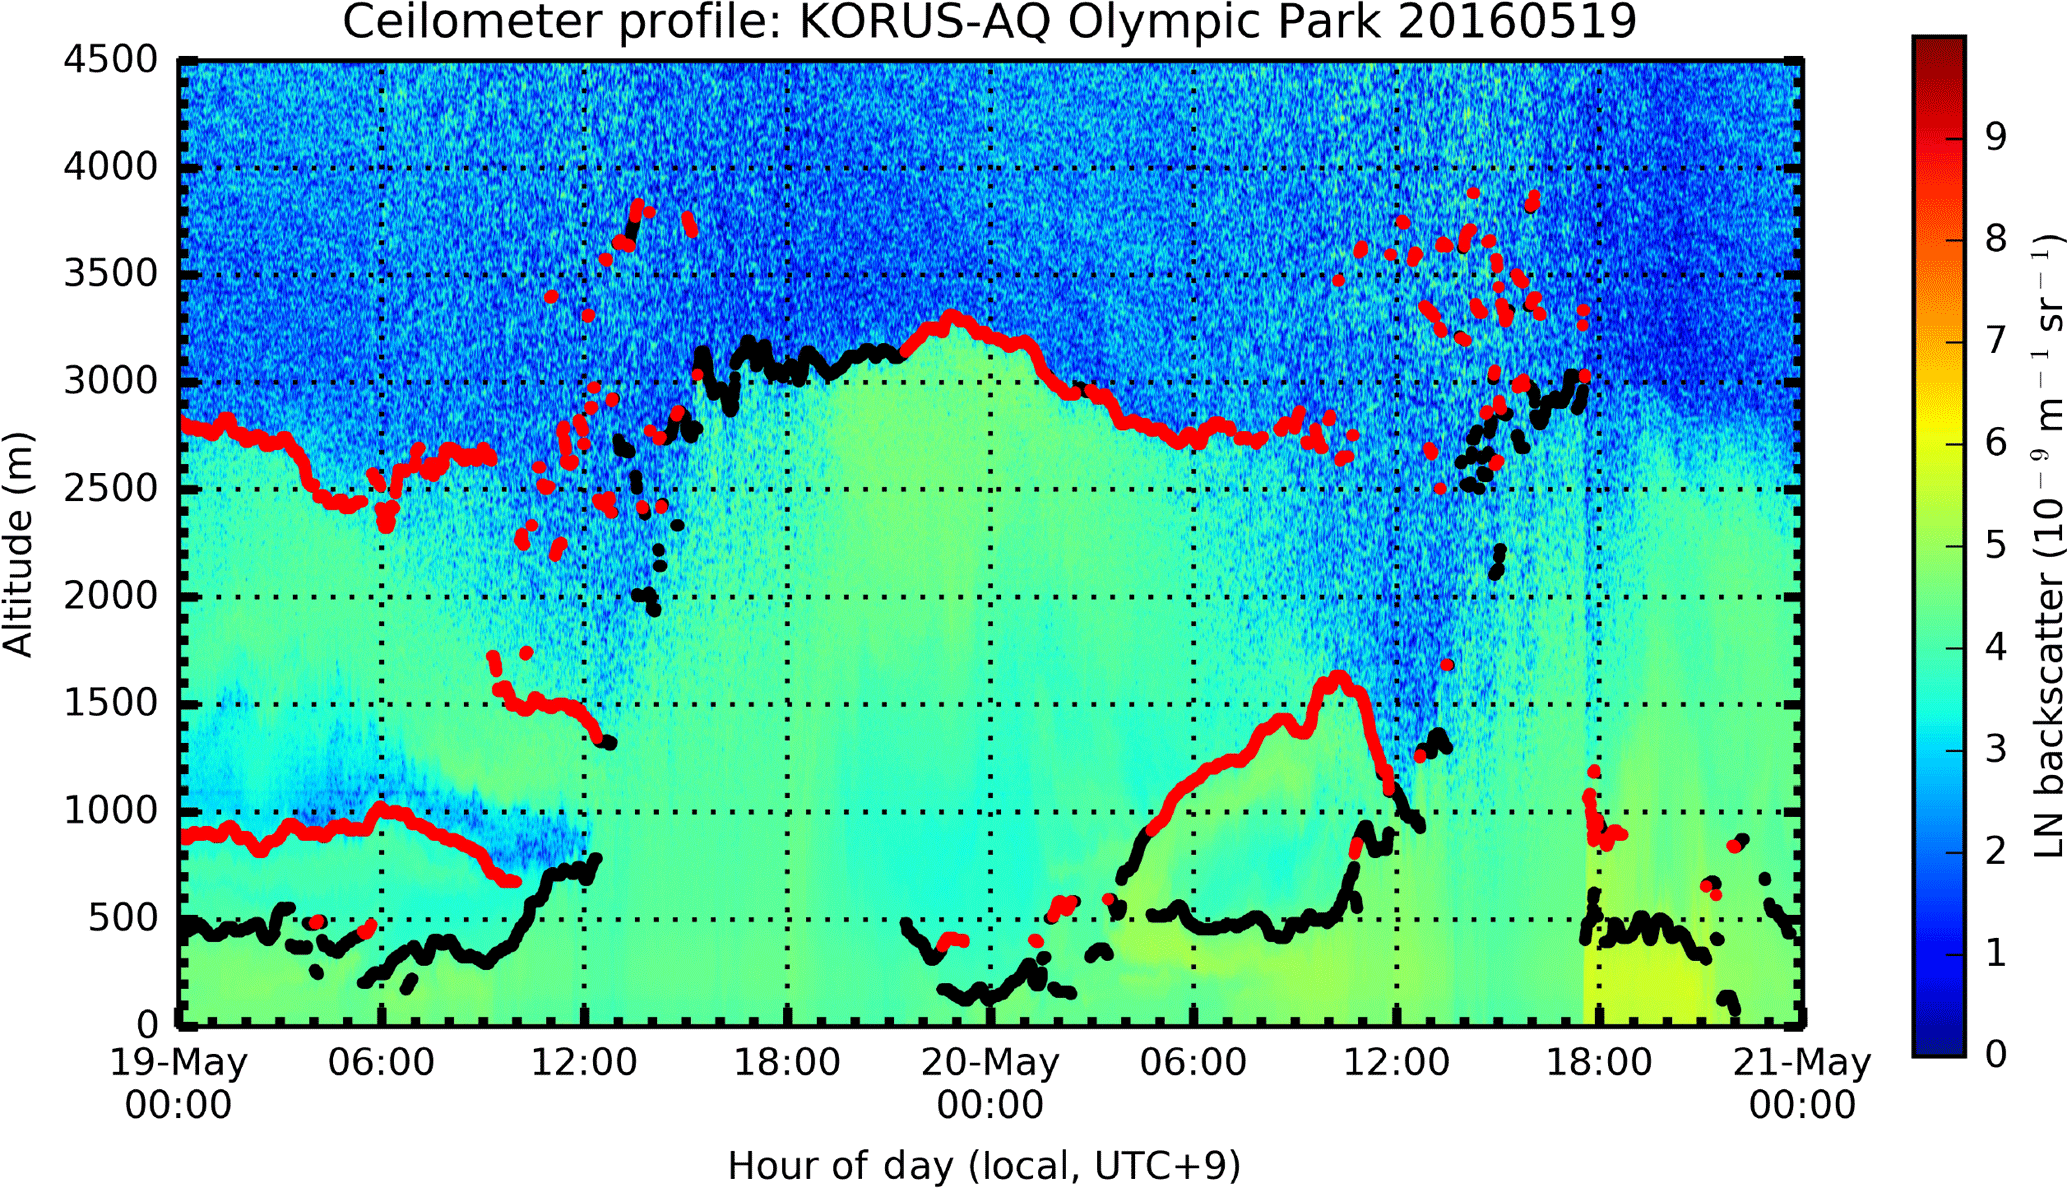
Figure 9Vaisala Ceilometer CL51 backscatter measurements (910 nm) on 19 and 20 May 2016 at Olympic Park, during KORUS-AQ. Black dots represent MLH used in this study.
Ground-up and Pandora columns both exhibit similar HCHO changes on a smaller scale (e.g., 20 May 2016 around 18:00 at Olympic Park). The absolute values, however, are different. In addition, Pandora total columns tend to have a smaller rate of change between 6:00 and 10:00 in the morning compared to the ground-up columns at both sites. This could be an indication of underestimation of Pandora SCDREF or inability of the selected profile shapes to capture true HCHO vertical distribution. Support for the later reason was seen in the ceilometers measurements (see Fig. 9), where on the majority of days the ceilometer captured residual layers above the morning mixing layer (ML). The residual layers persisted until late morning when growth of the ML reached the top of the residual layers. The rapid growth of the ML, which is typical in early morning hours, would also explain the larger rate of change in the morning hours in the ground-up columns.
4.2 Comparison of DC-8 HCHO columns with Pandora and ground-up columns
DC-8-integrated columns tend to be within the variability of the ground-up columns from the four profile shapes and are typically smaller than the Pandora measurements. Figure 10a shows linear regression between Pandora and DC-8 HCHO columns at the two sites, with the slope equal to 1.16±0.23, the intercept equal to 0.22±0.16 DU, and an R2 of 0.68 (49 measurements). Interpretation of the differences, however, is not straightforward since there are multiple occasions when the agreement is very good (e.g., within 0.15 DU on 5 and 10 June 2016 at Mt. Taehwa and 4 May 2016 at Olympic Park). On the other hand, there are days (e.g., 20 and 30 May 2016 at Olympic Park) when the differences between the DC-8 and Pandora VCD are 0.5–1 DU. Such large differences for some days and small differences for other days cannot be explained by the errors in SCDREF or SCD measurements alone and most likely are the result of spatial and temporal heterogeneity of HCHO distribution and differences in volume sampling by DC-8 and Pandora. Pandora column overestimation of 16 % relative to DC-8 HCHO columns is within the potential underestimation errors in DC-8 columns of ∼11 % for Olympic Park and 19 % for Mt. Taehwa. It also can indicate a potential error due to DOAS fitting scenario selection.
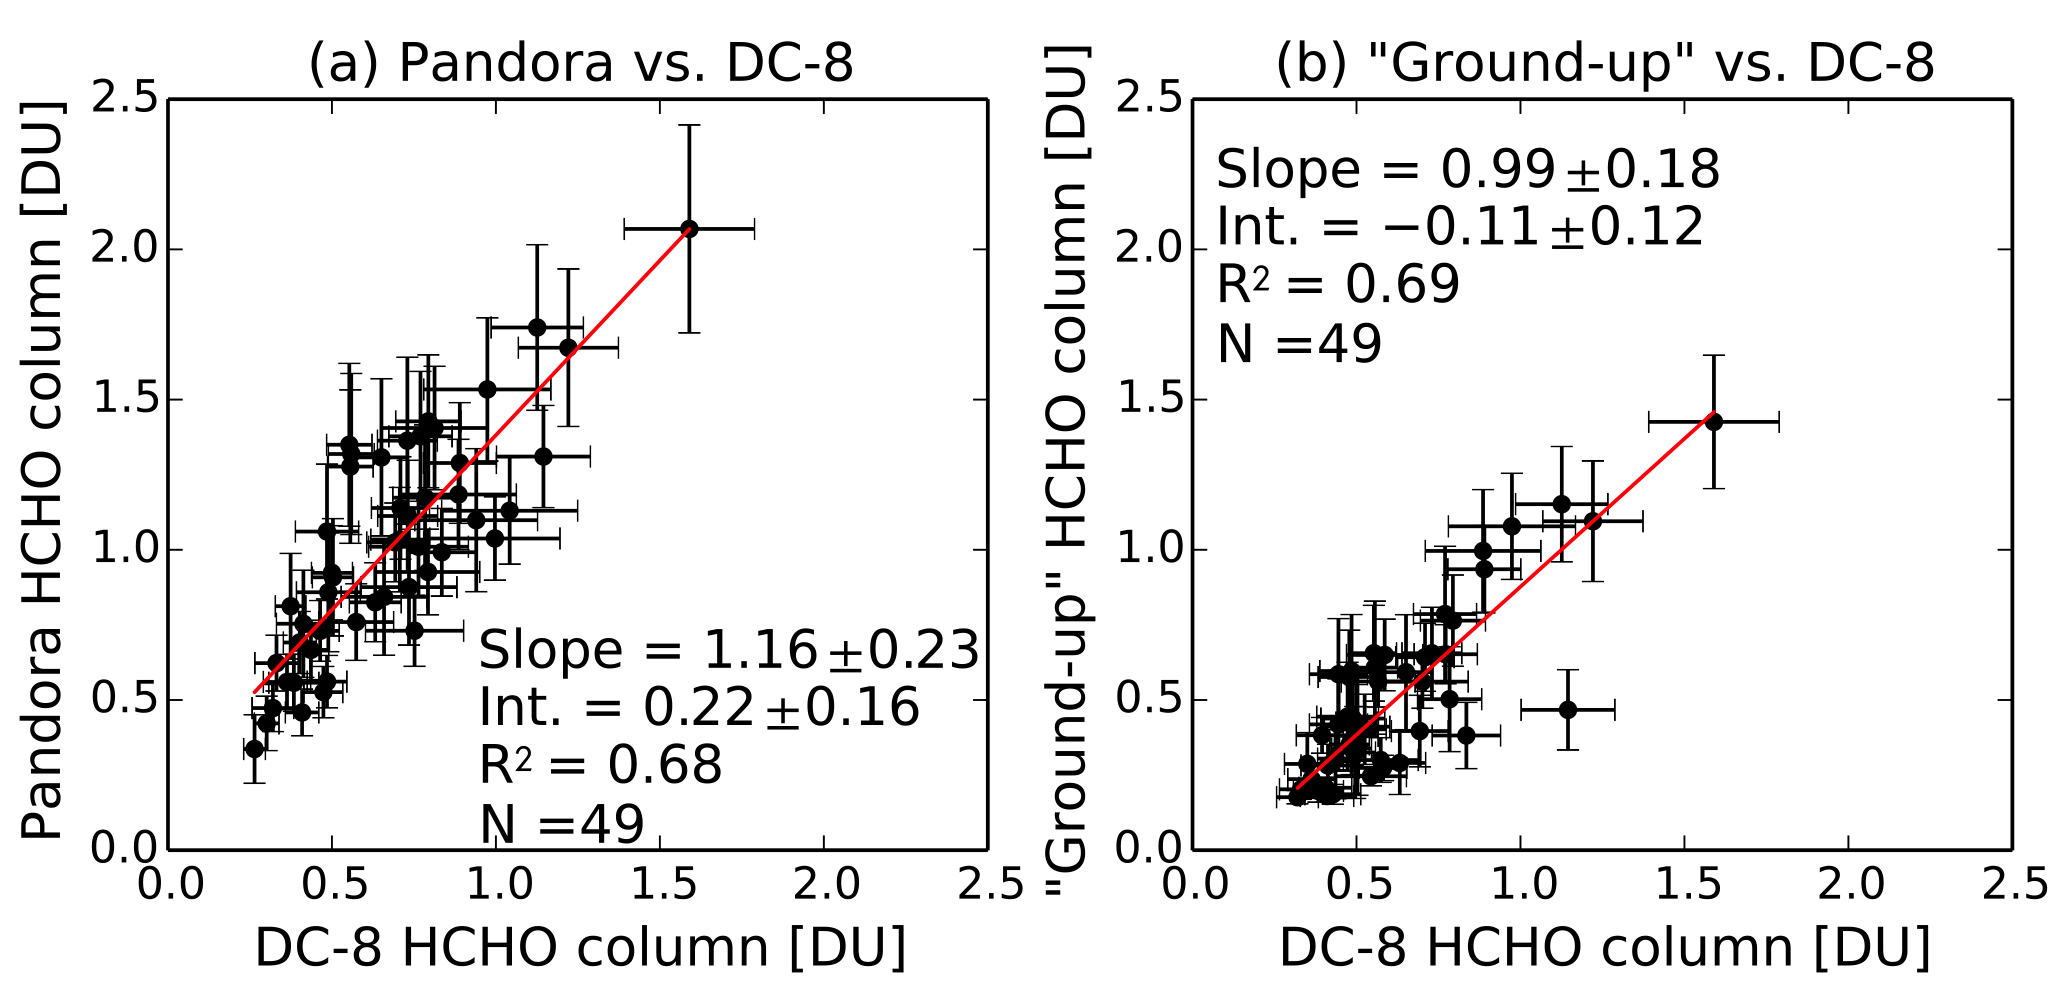
Figure 10Correlation between HCHO columns for (a) Pandora and DC-8-integrated vertical columns and (b) “ground-up” (surface vmr within measured MLH, box profile shape) and DC-8-integrated columns at Olympic Park and Mt. Taehwa during KORUS-AQ.
Table 3Linear correlation between HCHO total columns from Pandora direct-sun measurements and columns calculated from in situ surface concentration measurements based on different profile shape assumptions (Y) vs. HCHO-integrated columns from DC-8 (X).
1 All measurements are averaged over 5 min intervals. 2 Pandora measurements are filtered based on the maximum relative instrumental/atmospheric HCHO column error of 15 % and maximum normalized residual rms of 0.002. n/a – not applicable
Figure 10b shows linear regression analysis results for ground-up columns best agreeing with the DC-8 columns (box profile shape with measured MLH, 2). This profile shape has a linear regression correlation R2 of 0.69, a slope of 0.99±0.18, and an intercept of DU. The error in surface-derived columns represents a standard deviation between the 4 different profile shapes used to create the columns. Table 3 shows that the agreement is much worse between DC-8 HCHO VCD and ground-up VCD for other profile shapes. This discrepancy can be an indication that the chosen profile shapes are not representative of the actual HCHO distribution, especially for very shallow MLH.
4.3 Comparison of Pandora HCHO columns with ground-up columns
Based on the DC-8-measured HCHO profile discussion and diurnal changes in the ceilometer-determined MLH, we do not expect any meaningful correlation between the Pandora total columns and in situ surface concentrations. Indeed, Fig. 11a and c show a general correspondence between surface HCHO measurements at Olympic Park and Mt. Taehwa and Pandora column measurements, but the relationship is too diffuse to allow surface values to be derived from column measurements or vice versa.
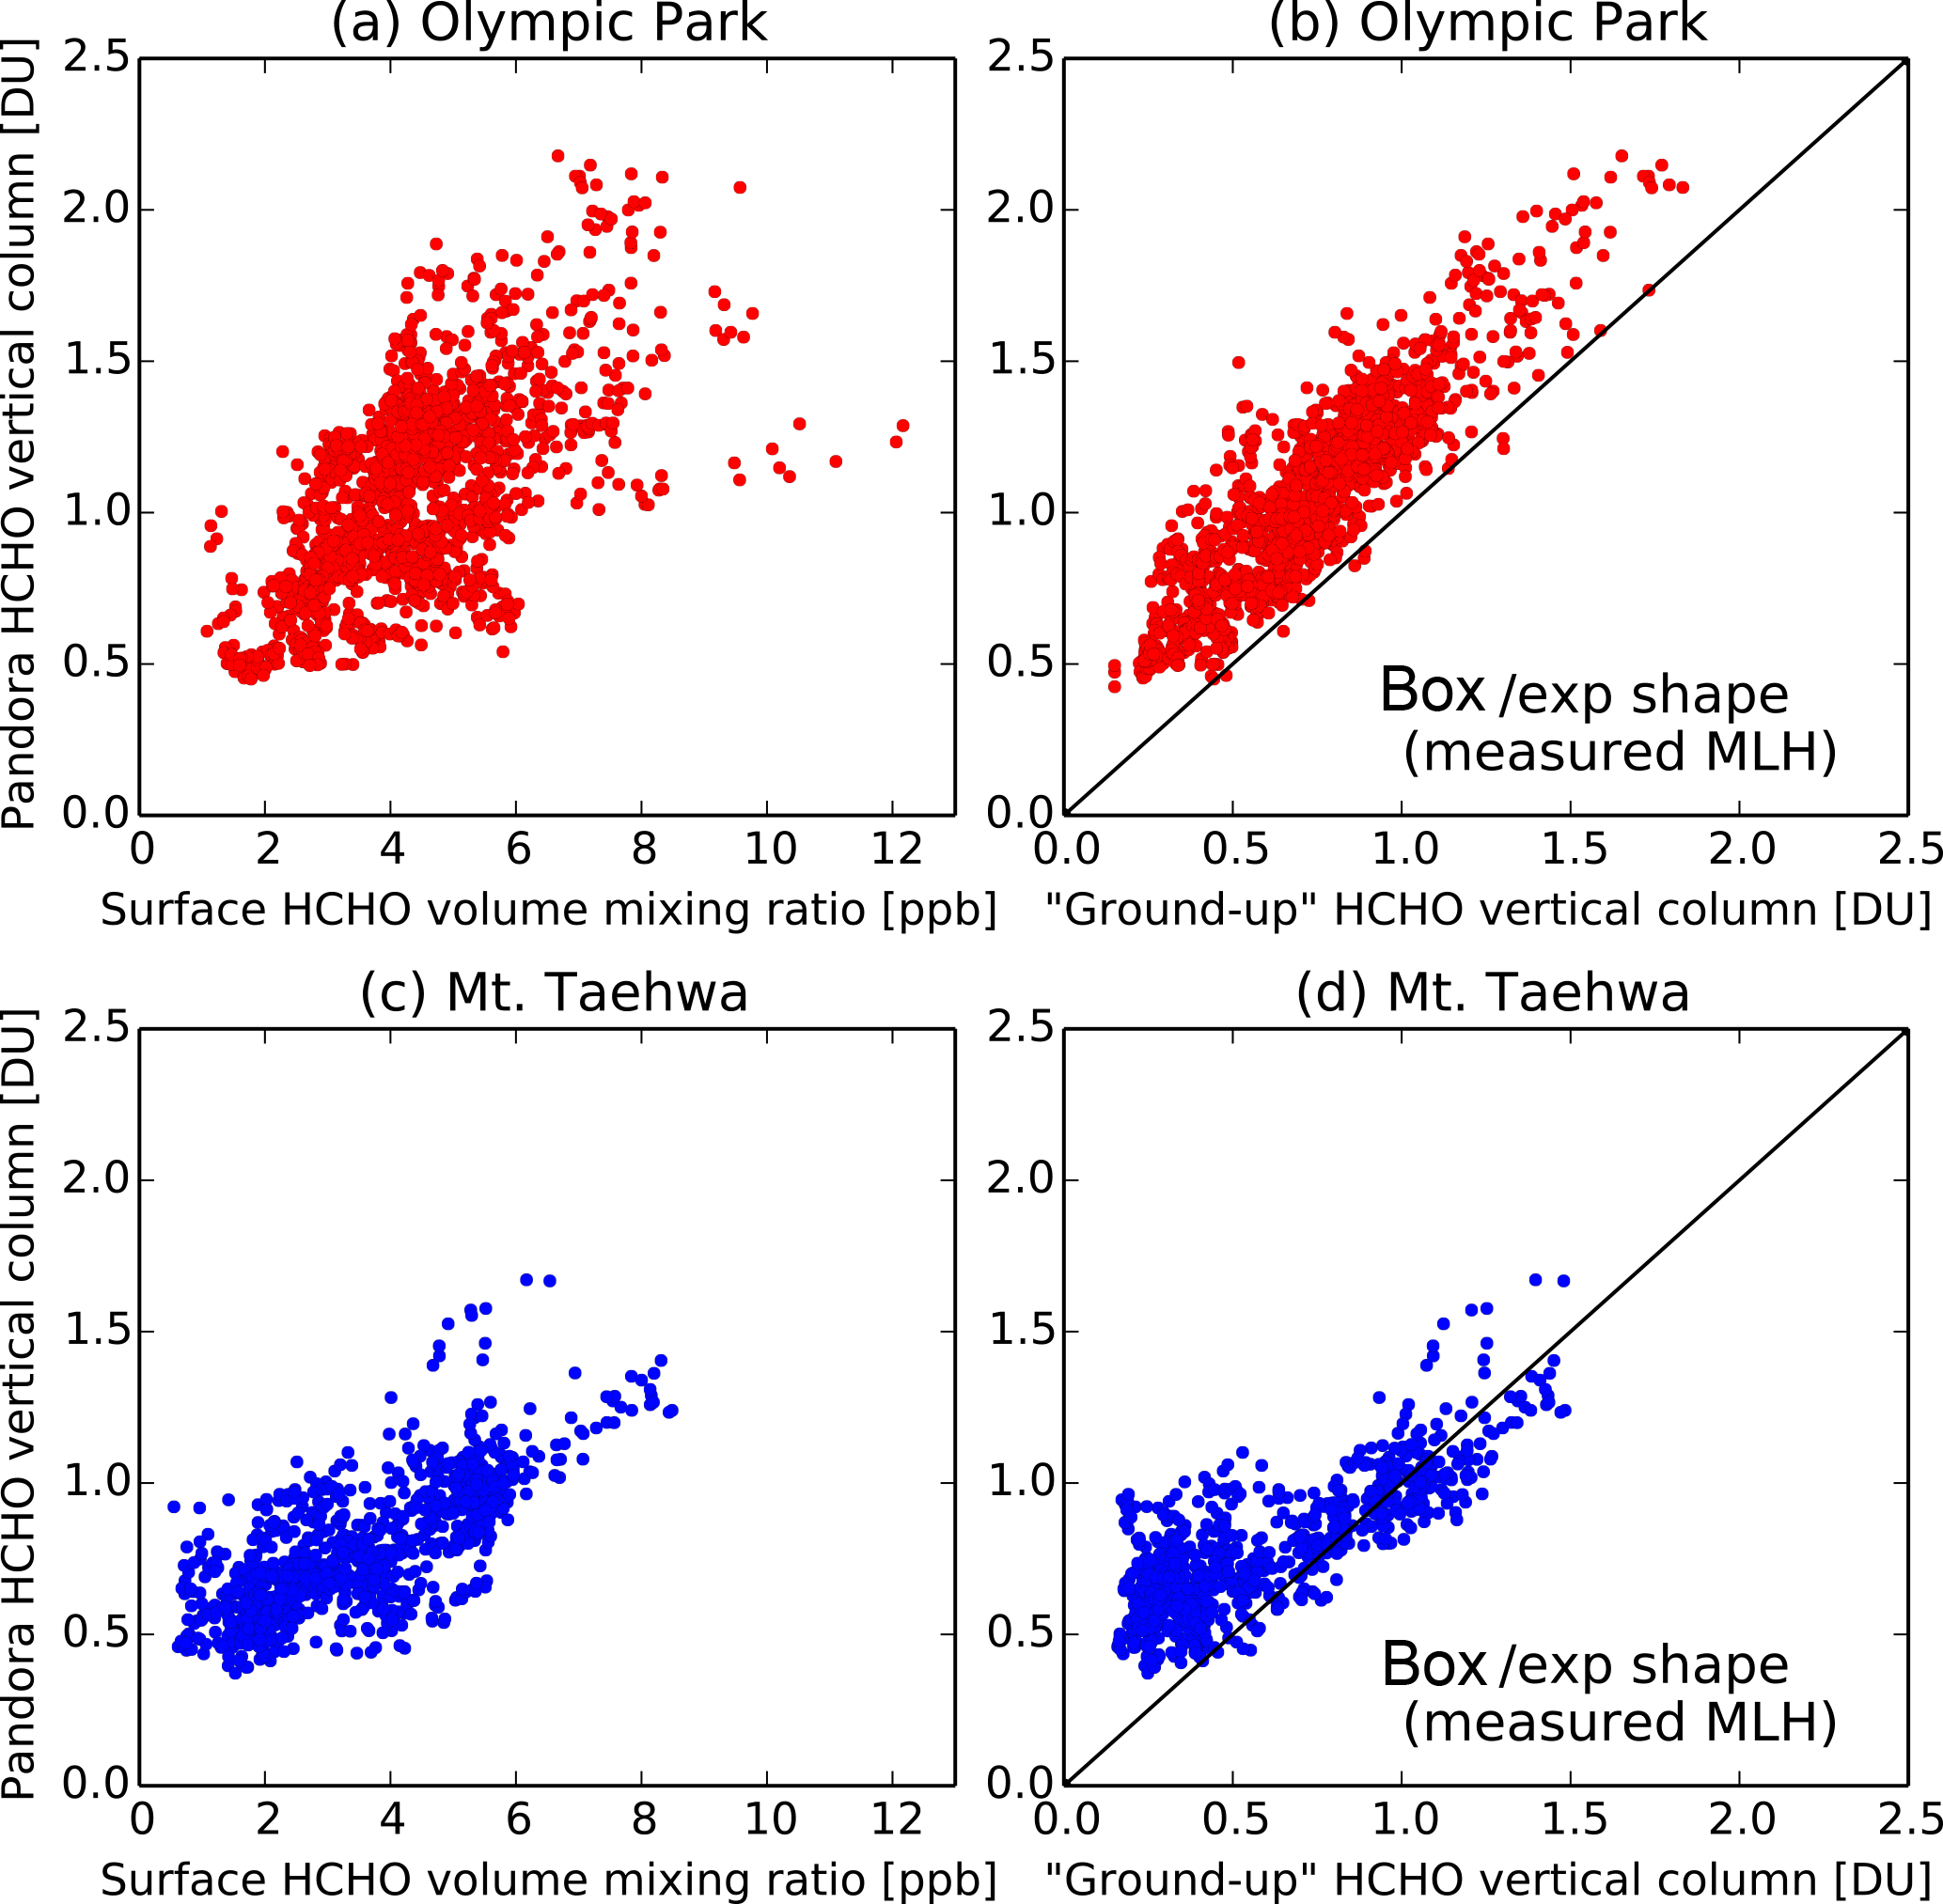
Figure 11Pandora-measured HCHO vertical column densities vs. surface in situ mixing ratios and columns calculated from the surface vmr at Olympic Park and Mt. Taehwa during KORUS-AQ (May–June 2016).
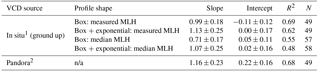
Linear regression analysis in Fig. 11 was done between Pandora (y axis) and ground-up (x axis) HCHO columns to identify which profile shape is more representative of Pandora column measurements. The best correlation () and slope (1.03±0.03) were determined for profile shape 4 (box and exponential profile with measured MLH) at Olympic Park (see Fig. 11b). The intercept of 0.29±0.02 DU could be the result of incorrect selection of a DOAS fitting window, which can cause a constant offset. To improve the agreement between Pandora and ground-up column diurnal patterns, a more in-depth analysis is required to determine if a larger SCDref is needed, causing a larger offset, or if the ground-up columns systematically underestimated due to elevated layers not captured in the ground-up model.
Table 4Linear correlation between HCHO total columns from Pandora direct-sun measurements (Y) and columns calculated from in situ surface concentration measurements based on different profile shape assumptions (X). All measurements are averaged over 5 min intervals. The least absolute residual fitting method is used.
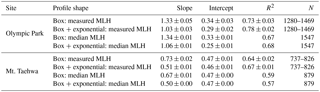
Table 4 summarizes linear regression results for all profile shapes. Standard deviations in Table 4 for the profile shapes with measured MLH represent the effect of different filtering of MLH data. In general, the effect of MLH filtering is very small. For columns derived from the box and exponential profile shape with the measured MLH and only 5 min MLH averaging, the correlation with Pandora columns (R2) is 0.76. The same profile shape but using a 300-point running median resulted in correlation (R2) of 0.80. In the absence of measured MLH a median MLH combined with an exponential function still can be relatively accurately used to estimate a near-surface concentration from Pandora HCHO columns (R2=0.68; slope =1.06).
The correlation between Pandora and ground-up columns at Mt. Taehwa is worse than at Olympic Park since there were fewer full-day Pandora measurements at Mt. Taehwa because of instrumental issues early in the campaign. There were several days that had only morning Pandora measurements. During morning hours measured MLH was relatively shallow (∼300 m) at Mt. Taehwa and the agreement between very small ground-up columns and Pandora columns was poor. Figure 11d shows that for ground-up columns greater than 0.7 DU the agreement is significantly improved (negligible offset, and slope close to 1). More investigation is needed to understand the differences between the two sites.
We have presented a first evaluation of Pandora total column HCHO measurements collected in continuous direct-sun-observation mode during the KORUS-AQ 2016 field study. The total column measurements were compared to the integrated DC-8 in situ profile measurements and in situ scaled columns assuming different profile shapes.
The following observations were made.
-
The largest sources of uncertainty in Pandora HCHO DS column measurements are from the following:
- a.
Systematic errors due to selection of the fitting window and choice of the cross sections. The combined error is on the order of ±25 % and is responsible for an offset in vertical column that is mostly independent of AMF. More studies will be done to understand the effect of gas atmospheric effective temperatures on the retrieval results.
- b.
Estimation of SCDREF in the reference spectrum using MLE, is on the order of 14 %–17 %. This error depends on the diurnal variation of HCHO optical depth for DS AMF. Further studies are needed to understand the effect of MLE on derived SCDREF for conditions with very small HCHO production rates and/or very systematic diurnal patterns. Error in SCDREF introduces AMF-dependent error in HCHO total columns resulting in up- or down-bowing of the diurnal changes.
- a.
-
The statistical HCHO total column errors were %. This indicates that using new head sensor ARC window significantly reduced the spurious spectral structure present in the previous versions of Pandora DS measurements.
-
DC-8 in situ profile measurements were done over limited altitude ranges. On average the DC-8-integrated columns were complemented with (a) about 5 %±4 % of the total columns from the maximum DC-8 altitude to tropopause over Mt. Taehwa and (b) column below the lowest DC-8 altitudes down to the site surface of 16 %±7 % over Mt. Taehwa and 3 %±1 % over Olympic Park. No profile measurements were conducted above 2–3 km over Olympic Park. An assumption was made that HCHO vertical distributions above DC-8 maximum altitude over Olympic Park are the same as those 25–40 km southeast over Mt. Taehwa.
-
DC-8 in situ profile measurements (<3 km) used in this evaluation were within a 15 km radius of each site. The DC-8 flight trajectories did not coincide with the Pandora east–south–west direct-sun line of sight.
-
DC-8 measurements in the lowest 200 and 470 m above Olympic Park and Mt. Taehwa were on average 8 % and 19 % lower than the time-coincident surface concentrations at the corresponding sites indicating spatial (vertical and horizontal) heterogeneity of HCHO distribution within 15–20 km.
-
Pandora HCHO total columns were on average 16 % larger than DC-8-integrated profiles with an offset bias of 0.22 DU and correlation coefficient (R2) of 0.68. The source of this difference will require further evaluation since underestimation of DC-8-integrated final total columns and overestimation of Pandora total columns are possible. This issue can be potentially resolved in the future by placing Pandora at the “touchdown” location and sky scanning in addition to DS measurements in the aircraft direction.
-
DC-8-measured morning HCHO profiles and profiles with low mixing ratios had an exponential function shape. Profiles during mid-afternoon can be described by a uniform value in the mixed layer with exponential decay to a minimum free-tropospheric concentration around 4 km (0.23 ppb).
-
Based on DC-8 profile shape and ceilometer backscatter estimation of MLH we calculated total columns from in situ measurements (ground-up VCD) using four different profile shapes: (1) a uniform HCHO vmr up to the median MLH with a free-tropospheric mixing ratio of 0.23 ppb from the MLH to the average tropopause height of 12.77 km; (2) same as (1) but using the measured MLH; (3) a uniform HCHO mixing ratio up to the median MLH with a free-tropospheric mixing ratio that exponentially decreases above the MLH to 0.23 ppb within 3×MLH or 4 km (whichever is smaller) and remains constant up to the average tropopause height of 12.77 km; and (4) same as (3) but using the measured MLH. The main goal was to determine whether any of these profile shapes can be used to convert column measurement into surface concentrations.
-
Comparison between Pandora and ground-up columns over Olympic Park suggested that profile shape (4) with measured MLH and exponential decay produced the best agreement (slope ; intercept DU; and ). The source of the offset bias is not clear at this point. These results suggest that reasonable estimation of the surface concentration can be done from the total column HCHO and MLH data.
-
Pandora HCHO columns and ground-up columns disagree the most early in the morning, when MLHs are very shallow, and the ceilometers detect elevated residual layers. This disagreement is likely due the tested shapes not adequately capturing the elevated layers during these conditions (aerosol-driven MLH is not representative of HCHO distribution when elevated layers are present).
-
Based on DC-8 and ground-up comparison, Pandoras were able to capture diurnal variation of HCHO column with some positive bias. This makes Pandora an excellent validation instrument for TEMPO (Tropospheric Emissions: Monitoring of Pollution).
All data used in this work can be downloaded from NASA Data Archive: https://www-air.larc.nasa.gov/missions/korus-aq/ (KORUS-AQ, 2018).
The authors declare that they have no conflict of interest.
The authors would like to acknowledge the
National Institute of Environmental Research (NIER) for its tremendous
effort during KOUR-AQ. In particular we would like to thank NIER for its
effort in establishing the Olympic Park research site and their assistance with
logistics for measurements at both Olympic Park and Mt. Taewha Forest. This
work was supported under the NASA Tropospheric Chemistry Program and the EPA
Air, Climate, and Energy Research Program. Although this paper has been
reviewed by the EPA and approved for publication, it does not necessarily
reflect EPA policies or views. Mention of trade names or commercial products
does not constitute endorsement or recommendation for
use.
Edited by: Hendrik Fuchs
Reviewed by: three anonymous referees
Baidar, S., Oetjen, H., Coburn, S., Dix, B., Ortega, I., Sinreich, R., and Volkamer, R.: The CU Airborne MAX-DOAS instrument: vertical profiling of aerosol extinction and trace gases, Atmos. Meas. Tech., 6, 719–739, https://doi.org/10.5194/amt-6-719-2013, 2013.
Bauwens, M., Stavrakou, T., Müller, J.-F., De Smedt, I., Van Roozendael, M., van der Werf, G. R., Wiedinmyer, C., Kaiser, J. W., Sindelarova, K., and Guenther, A.: Nine years of global hydrocarbon emissions based on source inversion of OMI formaldehyde observations, Atmos. Chem. Phys., 16, 10133–10158, https://doi.org/10.5194/acp-16-10133-2016, 2016.
Bogumil, K., Orphal, J., Homann, T., Voigt, S., Spietz, P., Fleischmann, O., Vogel, A., Hartmann, M., Kromminga, H., Bovensmann, H., Frerick, J., and Burrows, J.: Measurements of molecular absorption spectra with the SCIAMACHY pre-flight model: instrument characterization and reference data for atmospheric remote-sensing in the 230–2380 nm region, J. Photoch. Photobio. A, 157, 167–184, https://doi.org/10.1016/S1010-6030(03)00062-5, 2003.
Burrows, J. P., Dehn, A., Deters, B., Himmelmann, S., Richter, A., Voigt, S., and Orphal, J.: Atmospheric remote-sensing reference data from gome: part 1. temperature-dependent absorption cross-sections of NO2 in the 231–794 nm range, J. Quant. Spectroc. Ra., 60, 1025–1031, https://doi.org/10.1016/S0022-4073(97)00197-0, 1998.
Cede, A.: Manual for Blick Software Suite 1.3, available at: http://pandonia.net/media/documents/BlickSoftwareSuite_Manual_v7.pdf (last access: 24 August 2018), 2017.
De Smedt, I., Stavrakou, T., Hendrick, F., Danckaert, T., Vlemmix, T., Pinardi, G., Theys, N., Lerot, C., Gielen, C., Vigouroux, C., Hermans, C., Fayt, C., Veefkind, P., Müller, J.-F., and Van Roozendael, M.: Diurnal, seasonal and long-term variations of global formaldehyde columns inferred from combined OMI and GOME-2 observations, Atmos. Chem. Phys., 15, 12519–12545, https://doi.org/10.5194/acp-15-12519-2015, 2015.
Duncan, B. N., Yoshida, Y., Olson, J. R., Sillman, S., Martin, R. V., Lamsal, L., Hu, Y., Pickering, K. E., Retscher, C., Allen, D. J., and Crawford, J. H.: Application of OMI observations to a space-based indicator of NOx and VOC controls on surface ozone formation, Atmos. Environ., 44, 2213–2223, https://doi.org/10.1016/j.atmosenv.2010.03.010, 2010.
Fleischmann, O. C., Hartmann, M., Burrows, J. P., and Orphal, J.: New ultraviolet absorption cross-sections of BrO at atmospheric temperatures measured by time-windowing Fourier transform spectroscopy, J. Photoch. Photobio. A, 168, 117–132, https://doi.org/10.1016/j.jphotochem.2004.03.026, 2004.
Fried, A., Cantrell, C., Olson, J., Crawford, J. H., Weibring, P., Walega, J., Richter, D., Junkermann, W., Volkamer, R., Sinreich, R., Heikes, B. G., O'Sullivan, D., Blake, D. R., Blake, N., Meinardi, S., Apel, E., Weinheimer, A., Knapp, D., Perring, A., Cohen, R. C., Fuelberg, H., Shetter, R. E., Hall, S. R., Ullmann, K., Brune, W. H., Mao, J., Ren, X., Huey, L. G., Singh, H. B., Hair, J. W., Riemer, D., Diskin, G., and Sachse, G.: Detailed comparisons of airborne formaldehyde measurements with box models during the 2006 INTEX-B and MILAGRO campaigns: potential evidence for significant impacts of unmeasured and multi-generation volatile organic carbon compounds, Atmos. Chem. Phys., 11, 11867–11894, https://doi.org/10.5194/acp-11-11867-2011, 2011.
Fu, T.-M., Jacob, D. J., Palmer, P. I., Chance, K., Wang, Y. X., Barletta, B., Blake, D. R., Stanton, J. C., and Pilling, M. J.: Space-based formaldehyde measurements as constraints on volatile organic compound emissions in east and south Asia and implications for ozone, J. Geophys. Res., 112, D06312, https://doi.org/10.1029/2006JD007853, 2007.
Gordon, I. E., Rothman, L. S., Hill, C., Kochanov, R. V., Tan, Y., Bernath, P. F., Birk, M., Boudon, V., Campargue, A., Chance, K. V., Drouin, B. J., Flaud, J.-M., Gamache, R. R., Hodges, J. T., Jacquemart, D., Perevalov, V. I., Perrin, A., Shine, K. P., Smith, M.-A. H., Tennyson, J., Toon, G. C., Tran, H., Tyuterev, V. G., Barbe, A., Császár, A. G., Devi, V. M., Furtenbacher, T., Harrison, J. J., Hartmann, J.-M., Jolly, A., Johnson, T. J., Karman, T., Kleiner, I., Kyuberis, A. A., Loos, J., Lyulin, O. M., Massie, S. T., Mikhailenko, S. N., Moazzen-Ahmadi, N., Müller, H. S. P., Naumenko, O. V., Nikitin, A. V., Polyansky, O. L., Rey, M., Rotger, M., Sharpe, S. W., Sung, K., Starikova, E., Tashkun, S. A., Auwera, J. V., Wagner, G., Wilzewski, J., Wcisło, P., Yu, S., and Zak, E. J.: The HITRAN2016 molecular spectroscopic database, J. Quant. Spectrosc. Ra., 203, 3–69, https://doi.org/10.1016/j.jqsrt.2017.06.038, 2017.
Herman, J., Cede, A., Spinei, E., Mount, G., Tzortziou, M., and Abuhassan, N.: NO2 column amounts from ground-based Pandora and MFDOAS spectrometers using the direct-sun DOAS technique: Intercomparisons and application to OMI validation, J. Geophys. Res., 114, D13307, https://doi.org/10.1029/2009JD011848, 2009.
Hermans, C., Vandaele, A. C., Fally, S., Carleer, M., Colin, R., Coquart, B., Jenouvrier, A., and Merienne, M.-F.: Absorption Cross-section of the Collision-Induced Bands of Oxygen from the UV to the NIR, in: Weakly Interacting Molecular Pairs: Unconventional Absorbers of Radiation in the Atmosphere, edited by: Camy-Peyret, C. and Vigasin, A. A., Springer Netherlands, Dordrecht, 193–202, 2003.
Jin, X. and Holloway, T.: Spatial and temporal variability of ozone sensitivity over China observed from the Ozone Monitoring Instrument: ozone sensitivity over china, J. Geophys. Res.-Atmos., 120, 7229–7246, https://doi.org/10.1002/2015JD023250, 2015.
Jin, X., Fiore, A. M., Murray, L. T., Valin, L. C., Lamsal, L. N., Duncan, B., Folkert Boersma, K., De Smedt, I., Abad, G. G., Chance, K., and Tonnesen, G. S.: Evaluating a Space-Based Indicator of Surface Ozone-NOx-VOC Sensitivity Over Midlatitude Source Regions and Application to Decadal Trends: Space-Based Indicator of O3 Sensitivity, J. Geophys. Res.-Atmos., 122, 10439–10461, https://doi.org/10.1002/2017JD026720, 2017.
Knepp, T. N., Szykman, J. J., Long, R., Duvall, R. M., Krug, J., Beaver, M., Cavender, K., Kronmiller, K., Wheeler, M., Delgado, R., Hoff, R., Berkoff, T., Olson, E., Clark, R., Wolfe, D., Van Gilst, D., and Neil, D.: Assessment of mixed-layer height estimation from single-wavelength ceilometer profiles, Atmos. Meas. Tech., 10, 3963–3983, https://doi.org/10.5194/amt-10-3963-2017, 2017.
KORUS-AQ: An International Cooperative Air Quality Field Study in Korea, available at: https://www-air.larc.nasa.gov/missions/korus-aq/, last access: 24 August 2018.
Lee, C., Kim, Y. J., Hong, S.-B., Lee, H., Jung, J., Choi, Y.-J., Park, J., Kim, K.-H., Lee, J.-H., Chun, K.-J., and Kim, H.-H.: Measurement of Atmospheric Formaldehyde and Monoaromatic Hydrocarbons using Differential Optical Absorption Spectroscopy during Winter and Summer Intensive Periods in Seoul, Korea, Water Air Soil Poll., 166, 181–195, https://doi.org/10.1007/s11270-005-7308-6, 2005.
Li, J. S., Chen, W., and Fischer, H.: Quantum Cascade Laser Spectrometry Techniques: A New Trend in Atmospheric Chemistry, Appl. Spectrosc. Rev., 48, 523–559, https://doi.org/10.1080/05704928.2012.757232, 2013.
MacDonald, S. M., Oetjen, H., Mahajan, A. S., Whalley, L. K., Edwards, P. M., Heard, D. E., Jones, C. E., and Plane, J. M. C.: DOAS measurements of formaldehyde and glyoxal above a south-east Asian tropical rainforest, Atmos. Chem. Phys., 12, 5949–5962, https://doi.org/10.5194/acp-12-5949-2012, 2012.
Malicet, J., Daumont, D., Charbonnier, J., Parisse, C., Chakir, A., and Brion, J.: Ozone UV spectroscopy. II. Absorption cross-sections and temperature dependence, J. Atmos. Chem., 21, 263–273, https://doi.org/10.1007/BF00696758, 1995.
Marais, E. A., Jacob, D. J., Kurosu, T. P., Chance, K., Murphy, J. G., Reeves, C., Mills, G., Casadio, S., Millet, D. B., Barkley, M. P., Paulot, F., and Mao, J.: Isoprene emissions in Africa inferred from OMI observations of formaldehyde columns, Atmos. Chem. Phys., 12, 6219–6235, https://doi.org/10.5194/acp-12-6219-2012, 2012.
Meller, R. and Moortgat, G. K.: Temperature dependence of the absorption cross sections of formaldehyde between 223 and 323 K in the wavelength range 225–375 nm, J. Geophys. Res.-Atmos., 105, 7089–7101, https://doi.org/10.1029/1999JD901074, 2000.
Millet, D. B., Jacob, D. J., Turquety, S., Hudman, R. C., Wu, S., Fried, A., Walega, J., Heikes, B. G., Blake, D. R., Singh, H. B., Anderson, B. E., and Clarke, A. D.: Formaldehyde distribution over North America: Implications for satellite retrievals of formaldehyde columns and isoprene emission, J. Geophys. Res., 111, D24S02, https://doi.org/10.1029/2005JD006853, 2006.
Palmer, P. I.: Mapping isoprene emissions over North America using formaldehyde column observations from space, J. Geophys. Res., 108, 4180, https://doi.org/10.1029/2002JD002153, 2003.
Palmer, P. I., Abbot, D. S., Fu, T.-M., Jacob, D. J., Chance, K., Kurosu, T. P., Guenther, A., Wiedinmyer, C., Stanton, J. C., Pilling, M. J., Pressley, S. N., Lamb, B., and Sumner, A. L.: Quantifying the seasonal and interannual variability of North American isoprene emissions using satellite observations of the formaldehyde column, J. Geophys. Res., 111, D12315, https://doi.org/10.1029/2005JD006689, 2006.
Pikelnaya, O., Hurlock, S. C., Trick, S., and Stutz, J.: Intercomparison of multiaxis and long-path differential optical absorption spectroscopy measurements in the marine boundary layer: intercomparison of max- and LP-DOAS, J. Geophys. Res.-Atmos., 112, D10S01, https://doi.org/10.1029/2006JD007727, 2007.
Pinardi, G., Van Roozendael, M., Abuhassan, N., Adams, C., Cede, A., Clémer, K., Fayt, C., Frieß, U., Gil, M., Herman, J., Hermans, C., Hendrick, F., Irie, H., Merlaud, A., Navarro Comas, M., Peters, E., Piters, A. J. M., Puentedura, O., Richter, A., Schönhardt, A., Shaiganfar, R., Spinei, E., Strong, K., Takashima, H., Vrekoussis, M., Wagner, T., Wittrock, F., and Yilmaz, S.: MAX-DOAS formaldehyde slant column measurements during CINDI: intercomparison and analysis improvement, Atmos. Meas. Tech., 6, 167–185, https://doi.org/10.5194/amt-6-167-2013, 2013.
Platt, U. and Stutz, J.: Differential optical absorption spectroscopy: principles and applications, Springer, Berlin, 2008.
Richter, D., Weibring, P., Walega, J. G., Fried, A., Spuler, S. M., and Taubman, M. S.: Compact highly sensitive multi-species airborne mid-IR spectrometer, Appl. Phys. B, 119, 119–131, https://doi.org/10.1007/s00340-015-6038-8, 2015.
Schroeder, J. R., Crawford, J. H., Fried, A., Walega, J., Weinheimer, A., Wisthaler, A., Müller, M., Mikoviny, T., Chen, G., Shook, M., Blake, D. R., Diskin, G., Estes, M., Thompson, A. M., Lefer, B. L., Long, R., and Mattson, E.: Formaldehyde column density measurements as a suitable pathway to estimate near-surface ozone tendencies from space: O3-CH2O relationship, J. Geophys. Res.-Atmos., 121, 13088–13112, https://doi.org/10.1002/2016JD025419, 2016.
Shim, C., Wang, Y., Choi, Y., Palmer, P. I., Abbot, D. S., and Chance, K.: Constraining global isoprene emissions with Global Ozone Monitoring Experiment (GOME) formaldehyde column measurements, J. Geophys. Res., 110, D24301, https://doi.org/10.1029/2004JD005629, 2005.
Stutz, J. and Platt, U.: Numerical analysis and estimation of the statistical error of differential optical absorption spectroscopy measurements with least-squares methods, Appl. Optics, 35, 6041, https://doi.org/10.1364/AO.35.006041, 1996.
Valin, L. C., Fiore, A. M., Chance, K., and González Abad, G.: The role of OH production in interpreting the variability of CH2O columns in the southeast U.S.: OH, VOC and CH2O Columns in the southeast U.S.A., J. Geophys. Res.-Atmos., 121, 478–493, https://doi.org/10.1002/2015JD024012, 2016.
Vandaele, A. C., Hermans, C., Simon, P. C., Carleer, M., Colin, R., Fally, S., Mérienne, M. F., Jenouvrier, A., and Coquart, B.: Measurements of the NO2 absorption cross-section from 42 000 cm−1 to 10 000 cm−1 (238–1000 nm) at 220 K and 294 K, J. Quant. Spectrosc. Ra., 59, 171–184, https://doi.org/10.1016/S0022-4073(97)00168-4, 1998.
Vlemmix, T., Hendrick, F., Pinardi, G., De Smedt, I., Fayt, C., Hermans, C., Piters, A., Wang, P., Levelt, P., and Van Roozendael, M.: MAX-DOAS observations of aerosols, formaldehyde and nitrogen dioxide in the Beijing area: comparison of two profile retrieval approaches, Atmos. Meas. Tech., 8, 941–963, https://doi.org/10.5194/amt-8-941-2015, 2015.
Wilmouth, D. M., Hanisco, T. F., Donahue, N. M., and Anderson, J. G.: Fourier Transform Ultraviolet Spectroscopy of the A2Π3∕2 X2Π3∕2 Transition of BrO, J. Phys. Chem. A, 103, 8935–8945, https://doi.org/10.1021/jp991651o, 1999.
Wittrock, F., Richter, A., Oetjen, H., Burrows, J. P., Kanakidou, M., Myriokefalitakis, S., Volkamer, R., Beirle, S., Platt, U., and Wagner, T.: Simultaneous global observations of glyoxal and formaldehyde from space, Geophys. Res. Lett., 33, L16804, https://doi.org/10.1029/2006GL026310, 2006.
Zoogman, P., Liu, X., Suleiman, R. M., Pennington, W. F., Flittner, D. E., Al-Saadi, J. A., Hilton, B. B., Nicks, D. K., Newchurch, M. J., Carr, J. L., Janz, S. J., Andraschko, M. R., Arola, A., Baker, B. D., Canova, B. P., Chan Miller, C., Cohen, R. C., Davis, J. E., Dussault, M. E., Edwards, D. P., Fishman, J., Ghulam, A., González Abad, G., Grutter, M., Herman, J. R., Houck, J., Jacob, D. J., Joiner, J., Kerridge, B. J., Kim, J., Krotkov, N. A., Lamsal, L., Li, C., Lindfors, A., Martin, R. V., McElroy, C. T., McLinden, C., Natraj, V., Neil, D. O., Nowlan, C. R., O'Sullivan, E. J., Palmer, P. I., Pierce, R. B., Pippin, M. R., Saiz-Lopez, A., Spurr, R. J. D., Szykman, J. J., Torres, O., Veefkind, J. P., Veihelmann, B., Wang, H., Wang, J., and Chance, K.: Tropospheric emissions: Monitoring of pollution (TEMPO), J. Quant. Spectrosc. Ra., 186, 17–39, https://doi.org/10.1016/j.jqsrt.2016.05.008, 2017.