the Creative Commons Attribution 4.0 License.
the Creative Commons Attribution 4.0 License.
 | 05 Oct 2018
Cloud liquid water path in the sub-Arctic region of Europe as derived from ground-based and space-borne remote observations
Vladimir S. Kostsov
Anke Kniffka
Dmitry V. Ionov
Tropospheric clouds are a very important component of the climate system and the hydrological cycle in the Arctic and sub-Arctic. Liquid water path (LWP) is one of the key parameters of clouds urgently needed for a variety of studies, including the snow cover and climate modelling at northern latitudes. A joint analysis was made of the LWP values obtained from observations by the SEVIRI satellite instrument and from ground-based observations by the RPG-HATPRO microwave radiometer near St Petersburg, Russia (60∘ N, 30∘ E). The time period of selected data sets spans 2 years (December 2012–November 2014) excluding winter months, since the specific requirements for SEVIRI observations restrict measurements at northern latitudes in winter when the solar zenith angle is too large. The radiometer measurement site is located very close to the shore of the Gulf of Finland, and our study has revealed considerable differences between the LWP values obtained by SEVIRI over land and over water areas in the region under investigation. Therefore, special attention was paid to the analysis of the LWP spatial distributions derived from SEVIRI observations at scales from 15 to 150 km in the vicinity of St Petersburg. Good agreement between the daily median LWP values obtained from the SEVIRI and the RPG-HATPRO observations was shown: the rms difference was estimated at 0.016 kg m−2 for a warm season and 0.048 kg m−2 for a cold season. Over 7 months (February–May and August–October), the SEVIRI and the RPG-HATPRO instruments revealed similar diurnal variations in LWP, while considerable discrepancies between the diurnal variations obtained by the two instruments were detected in June and July. On the basis of reanalysis data, it was shown that the LWP diurnal cycles are characterised by considerable interannual variability.
- Article
(7908 KB) - Full-text XML
- BibTeX
- EndNote


The interest of studying the sub-Arctic atmosphere is enhanced due to the so-called “Arctic amplification” effect. This feedback effect is expected to enhance the response of the Arctic climate system to both anthropogenic and natural forcing compared to the planet as a whole. The large seasonal and interannual variation in low- and high-pressure systems and associated environmental variability due the location of the Baltic Sea between the North Atlantic and Eurasian air masses make northern Europe especially important for studying atmospheric processes (Eriksson et al., 2007). Callaghan et al. (2010) applied statistical techniques to the long-term data obtained in the Swedish sub-Arctic and noted that changes in climate were associated with reduced temperature variability, particularly the loss of cold winters and cool summers, and an increase in extreme precipitation events that cause mountain slope instability and infrastructure failure. The findings of Callaghan et al. (2010) demonstrated that the recent warming period is very different in character from that in the late 1930s and early 1940s and that we could be now entering a new climate era.
In the studies devoted to the possible consequences of climate change, much attention is paid to the hydrological cycle due to the fact that the snow cover greatly influences surface albedo, vegetation period, soil warming/freezing and ecosystems. Dankers and Christensen (2005) presented a model-based assessment of the impact of climate changes on sub-Arctic hydrology in the separate regions of northern Finland and Norway. The impact of climate change on snow cover and soil temperatures in the high-latitude regions was studied by Mellander et al. (2007) for different scenarios of CO2 emission.
Clouds are a very important component both of the climate system and the hydrological cycle since interactions between clouds and seasonal snow cover are expected to have a significant effect on climate and its variation in the Arctic and sub-Arctic (Zhang et al., 1996). On the basis of model calculations Zhang et al. (1996) have shown that the melting rate of the snowpack increases for thin clouds and decreases for thick clouds with increasing liquid water path (LWP). Moreover, clouds may have a negative impact on snowmelt when the LWP is very large. Beesley (2000) presented the results of model studies of the effect of clouds on the ice thickness in Arctic and showed, in particular, that interactions between the Arctic and midlatitudes are considerable and very important.
The clouds in Arctic and in sub-Arctic are intensively studied using different observation platforms and remote-sensing methods. Garrett and Zhao (2013) described a method of retrieving various parameters of thin clouds from ground-based infrared radiation measurements by an interferometer and applied this method to observational data obtained in Alaska (the limitation of the method is the inapplicability to thick clouds that radiate as a black body). The cloud liquid water path is one of the target atmospheric parameters obtained from microwave (MW) remote measurements. Several ground-based microwave radiometers are permanently functioning at northern latitudes as the elements of the MWRnet – An International Network of Ground-based Microwave Radiometers (http://cetemps.aquila.infn.it/mwrnet/main_files/MWRnetmap.html, last access: 25 September 2018). However the measurement network is rather coarse in that region. Special measurement campaigns with microwave radiometers were carried out in Europe with the focus on liquid water path, which revealed problems relevant to the comparison of the measured LWP with models of different grid size (Meijgaard and Crewell, 2005). Microwave radiometers delivering information on LWP also function on board satellites. Besides, there are satellite instruments that measure LWP using other electromagnetic ranges (visible-infrared). The climatology of LWP obtained from satellite observations was presented by Elsaesser et al. (2017). The importance of combining visible-infrared imager data and passive microwave LWP observations for estimating uncertainties and improving the accuracy of these observations was demonstrated by Greenwald et al. (2018).
It should be emphasised that LWP is an essential climate variable, and the assessment and improvement of the accuracy of LWP data obtained from different platforms and instruments is still a problem. Lohmann and Neubauer (2018) reported that global annual mean LWP values over oceans derived from measurements by different satellite sensors have a very broad range of 30–90 g m−2; besides, both retrievals from visible–near-infrared sensors and microwave sensors have biases in LWP data. The validation campaigns for LWP measurements from space often use ground-based LWP observations by microwave radiometers as reference data since they have a precision that is superior to current satellite remote-sensing techniques (Roebeling et al., 2008a).
Along with the high accuracy of LWP retrievals, other advantages of the ground-based MW observations should be mentioned. Ground-based MW instruments operate with very high temporal resolution (1–2 s), continuously for very long periods of time, in unattended mode, independently of solar illumination and nearly at all weather conditions. The evident advantage of satellite observations is their global scale; however the MW satellite sensors deliver the information only over water areas since the emissivity of the land surface is highly variable. The superiority of the SEVIRI instrument working in visible–near-infrared range is due to its ability to make observations over water areas and land surface, but only when the atmosphere is illuminated by the Sun, since the instrument measures the reflected solar radiation.
This study exploits the LWP measurements taken by the ground-based microwave radiometer RPG-HATPRO (Radiometer Physics GmbH – Humidity And Temperature PROfiler) operating at the measurement site of St Petersburg State University, Russia, and the satellite measurements taken by the SEVIRI (Spinning Enhanced Visible and Infrared Imager) instrument over the area in the vicinity of St Petersburg (60∘ N, 30∘ E). The geographical area under investigation can be considered as belonging to a sub-Arctic region of Europe if we use the general definition of sub-Arctic region as a territory located in the latitude range 50–70∘. The comparisons of the LWP measurements taken in the present study are to a certain extent the continuation of a series of investigations done previously by Roebeling et al. (2008a, b), and Greuell and Roebeling (2009). Roebeling et al. (2008a) determined the accuracy and precision of LWP retrievals from SEVIRI on board Meteosat-8 using 1 year of LWP retrievals from microwave radiometer measurements of two CloudNET (http://www.cloud-net.org/, last access: 25 September 2018) stations located in the United Kingdom (Chilbolton) and France (Palaiseau). The obtained results were generalised as being related to northern Europe. In particular, the overestimation of instantaneous LWP values by SEVIRI was detected during winter, and this overestimation was suggested to be caused by neglecting cloud inhomogeneities in the SEVIRI retrieval algorithm. It should be emphasised that the microwave ground-based measurements were selected as a reference for validation since this type of measurement has a precision that is superior to current satellite remote sensing techniques (Roebeling et al., 2008a). Roebeling et al. (2008b) examined the consistency between LWP and geometrical thickness values inferred from the SEVIRI measurements. In the study by Roebeling et al. (2008b), the LWP and geometrical thickness from the SEVIRI retrievals were compared to a statistically significant set of collocated and synchronised ground-based measurements at two above-mentioned CloudNET stations. The dual-channel passive microwave radiometers of Chilbolton (22.2 and 28.8 GHz) and Palaiseau (24 and 37 GHz) were used for the ground-based observation of LWP, while geometrical thickness was obtained from cloud radar and lidar observations. Greuell and Roebeling (2009) investigated in great detail the significant problem of working out the standards for validation of the LWP measurements by the SEVIRI instrument. Since the differences between the satellite-derived and the ground-based LWP values are partly associated with the validation procedure itself through the scale difference and parallax effect, minimising these types of differences is the essential part of any comparison. Greuell and Roebeling (2009) proposed to perform averaging of the ground-based microwave measurements with a Gaussian weight function, by using a timescale that is considerably longer than the time of the cloud movement across the validation area (by a factor of 3–15).
Similarly to the articles by Roebeling et al. (2008a, b), and Greuell and Roebeling (2009), the present article is focused on the comparison of the LWP values obtained by the SEVIRI satellite instrument and the ground-based microwave radiometer. However, there are two important peculiarities.
The latitude of the St Petersburg measurement site is higher than the latitudes of Chilbolton and Palaiseau stations. As a result, the solar zenith angle values are larger and can lead to an increase in the SEVIRI measurement errors. Also, the size of the footprint is larger than at the other locations. The validation of the SEVIRI measurements under these conditions is important for the problem of monitoring the sub-Arctic territories.
The St Petersburg measurement site is located at about 3 km distance from the shore of the Gulf of Finland, while the above-mentioned stations are located far from large water areas. Since the LWP values can be essentially different over land and sea surfaces (Karlsson, 2003), and taking into account the finite spatial resolution of the satellite observations, one can suggest that the validation procedure becomes more difficult under these conditions. In the present study, much attention is paid to the investigation of this problem.
The main goals of the present study were to identify the problems in the comparison of HATPRO and SEVIRI measurements of LWP at high latitudes over the complex terrain, which includes land and water areas, to analyse the frequency distributions and diurnal cycles derived from measurements of the two instruments and to assess systematic and unsystematic discrepancies between the satellite and ground-based data sets.
2.1 RPG-HATPRO original data
The 14-channel microwave radiometer RPG-HATPRO (generation 3), developed for the retrieval of temperature and humidity profiles in the troposphere along with LWP and integrated water vapour (Rose et al., 2005) has been routinely functioning at the measurement site of St Petersburg State University (59.88∘ N, 29.83∘ E) since June 2012 with a sampling interval about 1–2 s and an integration time of 1 s. The complete description of radiometers of the HATPRO type (below we shall omit “RPG-“ for simplicity) can be found at the website of the manufacturer (http://www.radiometer-physics.de, last access: 25 September 2018). All information on experimental set-up and the measurement site can be found in the paper by Kostsov et al. (2016). The LWP values are derived from the microwave radiation brightness temperature measurements by two separate and independent retrieval algorithms. The first algorithm is the built-in regression technique that had been developed by the manufacturer. The second algorithm is based on the inversion of the radiative transfer equation (so-called “physical algorithm”) and uses the well-known and widely applied approach of simultaneous retrieval of profiles of several atmospheric parameters that influence the radiative transfer at frequencies corresponding to spectral channels of a radiometer. The description of the physical algorithm, estimation of the retrieval accuracy for different parameters and the examples of retrievals can be found in the paper by Kostsov (2015a). The multiparameter retrieval procedure accounting for the a priori information of different types that had been used in the physical algorithm is presented in detail in the paper (Kostsov, 2015b). The results of the cross-validation of the regression algorithm and physical algorithm are described in the article by Kostsov et al. (2018). Kostsov et al. (2018) found out that the response of the regression algorithm to artefacts in the input data is considerably larger than the response of the physical algorithm. Also, there are problems with the detection of cloud-free periods from the data obtained by the regression algorithm. The conclusion was that the utilisation of the physical algorithm is more preferable. Therefore, only the results obtained by the physical algorithm have been used in the present study.
The estimations of the accuracy of LWP retrievals by the HATPRO radiometer near St Petersburg were made previously (Kostsov et al., 2018) on the basis of the analysis of cloud-free situations and calculations of the error matrix of the physical algorithm. The analysis of cloud-free situations has shown 0.009–0.011 kg m−2 for bias and 0.001 kg m−2 for random error. It should be noted that the corresponding values reported in the study by Maetzler and Morland (2009) are 0.002–0.005 and 0.001 kg m−2. The error matrix calculations showed that the random error varies in the range 0.001–0.008 kg m−2 for all observed LWP values (up to 1 kg m−2). Cossu et al. (2015) obtained a slightly higher bias of LWP retrievals using ground-based MW radiometry, which constituted 0.01–0.02 kg m−2, and they also estimated the random error at 10 %–20 % for LWP greater than 0.1 kg m−2.
The time period 1 December 2012–30 November 2014 is considered in the present study due to the following reasons: (1) the instrument functioned without failure and interruptions, (2) the obtained data volume is sufficient for derivation of statistical characteristics, (3) the measurement data were already validated and analysed for this time period (Kostsov et al., 2018). There were 13 calibrations of the instrument during this period of time, including seven absolute calibrations with liquid nitrogen and six sky-tipping calibrations. The interval between absolute calibrations varied from 2 to 4 months.
2.2 SEVIRI original data
The SEVIRI-derived LWP measurements are part of the climate data record CLAAS 2 (CLoud property dAtAset using SEVIRI – edition 2). It was created by the Satellite Application Facility on Climate Monitoring (CM SAF) based on the SEVIRI measurements on the geostationary MSG satellites (Benas et al., 2017; Stengel et al., 2014). SEVIRI scans the Earth in 12 spectral channels, ranging from the visible (0.6 µm) to the near infrared (14.4 µm) in the electromagnetic spectrum with bandwidths between 0.14 and 2 µm. The scans are taken with a temporal resolution of 15 min. The ground pixel size varies from 3 km at nadir to about 11 km near the edge of SEVIRI's field of view. In the vicinity of St Petersburg the ground pixel size is about 7 km. The CLAAS data record was created from measurements of all SEVIRI instruments on board the MSG 1–3 satellites and covers the time span 2004–2015. It was processed using a single retrieval system with an instrument intercalibration based on MODIS Aqua (Meirink et al., 2013) data to ensure the exclusion of artificial temporal inhomogeneity.
The cloud physical properties (CPPs) retrieval algorithm uses the channels at 1.6 and 0.6 µm. In the visible channel the influence of the cloud's optical thickness is mainly translated into reflectance, whereas in the near infrared the variation in reflectance is caused by variations in effective radius of the cloud droplets. With the help of detailed radiative transfer calculations, look-up tables were created and the observed reflectances are interpolated. The LWP data obtained by SEVIRI have already been used in a number of studies of the temporal and spatial characteristics of clouds of different types, in particular by Kniffka et al. (2014).
In the validation document of CM SAF (Finkensieper et al., 2016), the bias of the LWP measurements is specified to be 0.00007 kg m−2 for monthly mean values compared to MODIS and the bias-corrected root mean square error amounts to 0.0101 kg m−2. Here the complete field of view of SEVIRI and the monthly means from 2004 to 2015 were analysed. A comparison with AMSR-E was also conducted and showed a bias of 0.0034 kg m−2 and a bias-corrected root mean square error of 0.034 kg m−2. Unfortunately, this comparison was based only on a single overpass of AMSR-E. In Roebeling et al. (2008a) comparisons were made for the three sites Cabauw (Netherlands), Chilbolton (United Kingdom) and Palaiseau (France) for a time series of 4 years. Here the bias was found to be 0.005 kg m−2 in summer and 0.010 kg m−2 in winter, while the variance was stable with 0.030 kg m−2. Please note that the latter study was based on a retrieval algorithm state from 10 years ago. Since then, the retrieval has undergone many modifications, which led to an overall improvement.
In the present study, non-averaged LWP and CPH (cloud phase) fields (level 2 data) from the CLAAS 2 data set were used for the time period of ground-based original data (1 December 2012–30 November 2014).
2.3 Data selection procedure and data sets for comparisons
High-quality ground-based MW measurements were taken as the main criterion in the data selection procedure. This criterion included the fulfilment of three requirements.
The measurement days had to be completely rain-free. It means that all rain flag values must have been equal to zero from 00:00:00 UTC to 23:59:59 UTC for every single day. The reason to completely exclude the days with rain from consideration is the following. Not only during a rainfall event but also for a rather long period of time after it are the data provided by HATPRO erroneous, since the radio dome of the instrument is wet. The duration of this after-rain period for St Petersburg site was estimated in the study by Kostsov et al. (2018) at 4–6 h. Moreover, it was demonstrated in the mentioned study that situations are possible in which measurements are erroneous even before the rainfall event, when the rain sensor has not yet detected the rain signal. It is evident that even one rainfall event in a day results in a considerable loss of data. It should be mentioned that SEVIRI retrievals fail in cases of strong vertical LWP gradients and especially during rainfall events.
The measurement process must not have had gaps, which are defined as periods of 15 min or more without measurements.
The quality flag of MW measurements had to be zero for all retrievals, which means the convergence of the iteration process of physical retrieval for every single measurement is successful.
The first and second requirements are important since the MW measurements should be averaged over the time period of several dozens of minutes in order to be consistent with a single pixel measurement from space. Rainfall events and gaps in the measurement process can spoil the averaging results. Also, for the estimation of the mean diurnal cycle, it is desirable that all days have an uninterruptible flow of measurements. The absence of rain and measurement gaps ensures that this condition is met.
The specific requirements for the SEVIRI observations restrict measurements just after sunrise and before sunset when the solar zenith angle (SZA) is too large. Therefore, all MW and satellite measurements, when SZA was greater than 72∘, have been excluded from consideration, as in the study by Roebeling et al. (2008a). As a result, no measurements during the winter months of December and January could be selected for analysis, and the number of measurements selected in February was small.
The sampling interval (the interval between instantaneous measurements) of routinely performed ground-based MW observations is about 1–2 s since the sampling period (the integration time of the incoming atmospheric signal) is equal to 1 s. It is important because the retrieval algorithms are typically non-linear and therefore the retrieval needs to be made on high temporal resolution brightness temperature data for subsequent averaging of the results but not vice versa. Also, it should be mentioned that situations can be very different and in particular convective boundary layer clouds have high variability. However, there are situations when keeping the sampling interval as small as possible is problematic. If an instrument is functioning in the mode of azimuth scanning or zenith scanning, some time is needed to change pointing. Also, an instrument can be set to make the mixed-mode observations. In this case the interval between measurements in a certain mode can be rather large. It was noted by Rose et al. (2005) that the integration time (and also the sampling interval) should not be greater than 20 s in order for the short-period variations of tropospheric humidity and cloud liquid water to be registered, and in this case the temporal resolution is comparable to the resolution of state-of-the-art numerical weather prediction (NWP) models. Kostsov et al. (2016) applied the information theory approach to the analysis of the ground-based MW measurements and performed calculations of the information volume for data sets with different sampling intervals. The obtained results have shown that even for constant atmospheric conditions the sampling interval should not be greater than 100–200 s, so that maximum information could be extracted from MW measurements. Though this conclusion had more theoretical value than a practical one, for the present study we have chosen two original MW data sets that differ by the sampling intervals 120 and 10 s.
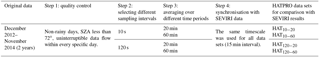
There are several slightly different schemes for averaging MW data so that the resulting value best represents the LWP obtained by the SEVIRI instrument for one pixel. Roebeling et al. (2008a) reported that averaging the MW retrievals of LWP had been done over a 20 min period assuming a wind speed of about 10 m s−1 and the SEVIRI field of view (4 km2×7 km2). In the study (Roebeling et al., 2008b), a time period of 30 min was mentioned as the period taken for averaging. Greuell and Roebeling (2009) proposed to compute the ground-based LWP by averaging the MW measurements with a Gaussian weight function by using a timescale that is considerably longer than the time during which the clouds move across the validation area (by a factor of 3–15). Simultaneously, they recommended computing the satellite data by averaging the LWP retrieved by SEVIRI over the pixels surrounding the ground station by means of a Gaussian weight function with a length scale defining the validation area. A comprehensive discussion of the aggregation of the ground-based LWP data to coarser timescales was presented by Meijgaard and Crewell (2005), who considered the comparison of ground-based LWP observations with the estimates from NWP models. Taking into account the mentioned findings, in the present study we used two schemes with different averaging periods of 20 and 60 min; however the weighting function is not Gaussian but is a boxcar for simplicity. All data selection steps are summarised in Table 1. This table also presents the designation of four HATPRO data sets HATn−m used for comparison. It should be noted that all comparisons have been made for the SEVIRI ground pixel, which is nearest to the radiometer site. If other pixels are considered, they will be mentioned explicitly.
Table 1The data selection steps and the designation of HATPRO data sets.
Simultaneously with synchronisation between the HATPRO and SEVIRI values of LWP, the cloud phase was controlled. The algorithm that is used for processing raw data obtained by the SEVIRI instrument delivers the parameter CPH, which identifies the cloud phase at the cloud top. The CPH values 0, 1 and 2 correspond to the clear case, liquid phase and ice crystals. Only liquid phase clouds were considered; therefore all SEVIRI measurements with CPH = 2 were excluded from further analysis and from synchronisation with the HATPRO results.
Every HATn−m data set was divided into two ensembles corresponding to different scenarios of observations (seasonal periods). The description of these periods is given in Table 2. The division was done on the basis of atmospheric temperature and humidity criterion: the data were attributed either to the warm and humid (WH) period or to the cold and dry (CD) period. The corresponding time intervals are 1 May–30 November and 1 December–30 April. The mean vertical distribution and standard deviation of temperature and humidity for the mentioned periods can be found in the paper by Kostsov et al. (2016). As one can see from Table 2, the number of selected days during the WH period is noticeably larger than during the CD period. The total number of 210 days means that about 28 % of the whole 2-year data set is suitable for comparative analysis.
Table 2Seasonal periods for comparison of HATPRO and SEVIRI data.
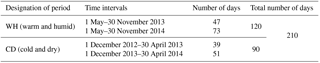
Figure 1 shows the location of 441 SEVIRI measurement pixels selected for analysis of the large terrain surrounding St Petersburg and the location of nine pixels corresponding to the small terrain in the vicinity of the radiometric measurement site. The large terrain comprises parts of the Gulf of Finland, Karelian Isthmus and Ladoga Lake and the region to the south and south-west of St Petersburg. The small terrain size is about 20 km×20 km2. The northern part of it is a water area and the southern part is a land area. The radiometer is located close to the shore of the Gulf of Finland at a distance of 2.7 km from the coastline. The centre of pixel 243 is nearest to the measurement site; the distance is 1.5 km. The accuracy of SEVIRI's geolocation depends on the actual satellite on which the instrument is mounted and amounts approximately to 1.32 km in a north–south direction and 0.15 km in an east–west direction as stated in the document on MSG level 1.5 image data description (https://www.eumetsat.int/website/home/Data/TechnicalDocuments/index.html?lang=EN, last access: 25 September 2018) plus an additional error of 1.5 km in both directions in the data prior to 2017 because of an undetected pixel offset. Greuell and Roebeling (2009) studied the influence of the parallax effect (the horizontal displacement of a cloud viewed by a ground-based radiometer in a satellite image) on the results of the comparison of the data obtained by SEVIRI and ground-based microwave radiometers. Obviously, this influence is not significant for homogeneous cloud fields and for clouds at low heights. The estimations of the parallax effect for Chilbolton and Palaiseau stations calculated by Greuell and Roebeling (2009) in terms of horizontal displacement were 3.1 and 2.6 km correspondingly, assuming a cloud top height of 3 km. Based on these values and accounting for the higher latitude of the St Petersburg measurement site, we can expect the parallax effect for the St Petersburg measurement site to be about 3 km or more in terms of the displacement in the northerly direction. This means that the satellite image point corresponding to a cloud view by the HATPRO radiometer is located over the coastline or over the water of the Gulf of Finland.
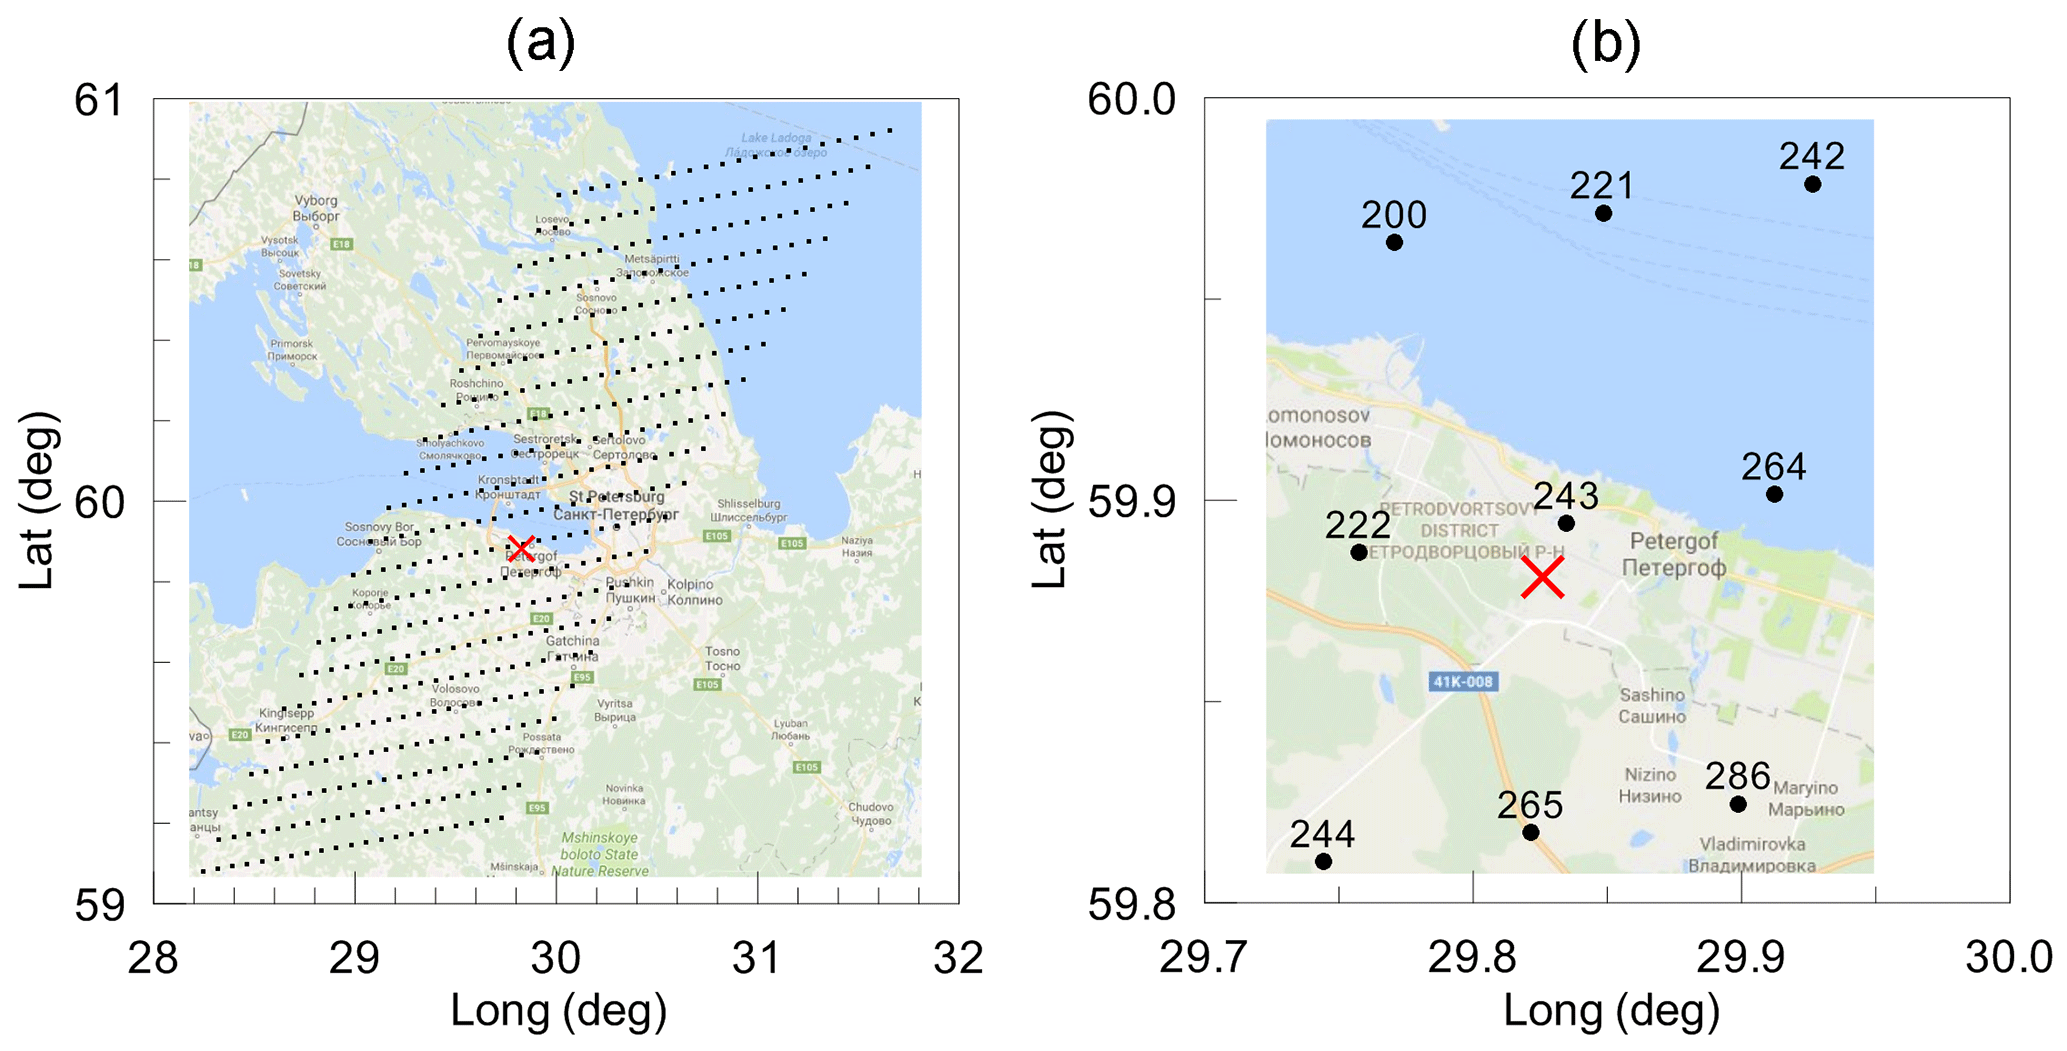
Figure 1The location of 441 SEVIRI measurement pixels (dots) selected for analysis (a, large terrain) and the location of the pixels nearest to the radiometric measurement site (b, small terrain, pixel numbers are shown). The position of the HATPRO radiometer is marked by the red cross. The distance from the centre of pixel 243 to the radiometer is equal to 1.5 km. The distance from the centre of pixel 242 to the radiometer is equal to 12 km.
Figure 2The maps of the mean LWP values (kg m−2, colour scale) calculated for the large terrain (a) and small terrain (b) and for the 2-year period 1 December 2012–30 November 2014 (measurements by the SEVIRI instrument).
Before performing any comparisons of the satellite and ground-based data we analysed the spatial distribution of the LWP values obtained from the SEVIRI measurements over the large and small terrains as defined in Fig. 1. Figure 2 presents the maps of the mean LWP values calculated for the large and small terrains and for the whole considered 2-year period of observations (about 20 000 data points per pixel). Comparing Figs. 1 and 2, one can see that the difference between the LWP over land and over water is clearly visible. Over water areas, the mean LWP value is less than 0.075 kg m−2, while the LWP exceeds these value over land. In order to assess whether this gradient can influence the results of the comparison of the SEVIRI and the HATPRO data, we plotted similar maps, only for the data selected for comparison and considered the WH and the CD periods separately (about 4000 and 2000 data points per pixel respectively); see Fig. 3. The land–sea gradient of the mean LWP values can be seen for both periods. The magnitude of the land–sea difference for mean LWP values (0.032 kg m−2) is comparable to the value calculated for the whole 2-year period of observations (0.040 kg m−2). However, the mean LWP values themselves are much lower than those obtained for the whole 2-year period. This result is obvious since the rainy days were excluded from the analysis, which causes the presence of a large number of low-LWP and clear atmospheric conditions in the selected ensembles. If we consider the CD period, we can see that the land–sea gradient in the mean LWP values is noticeably lower than for the WH period. Similar maps of the median LWP values are given in Appendix 1.
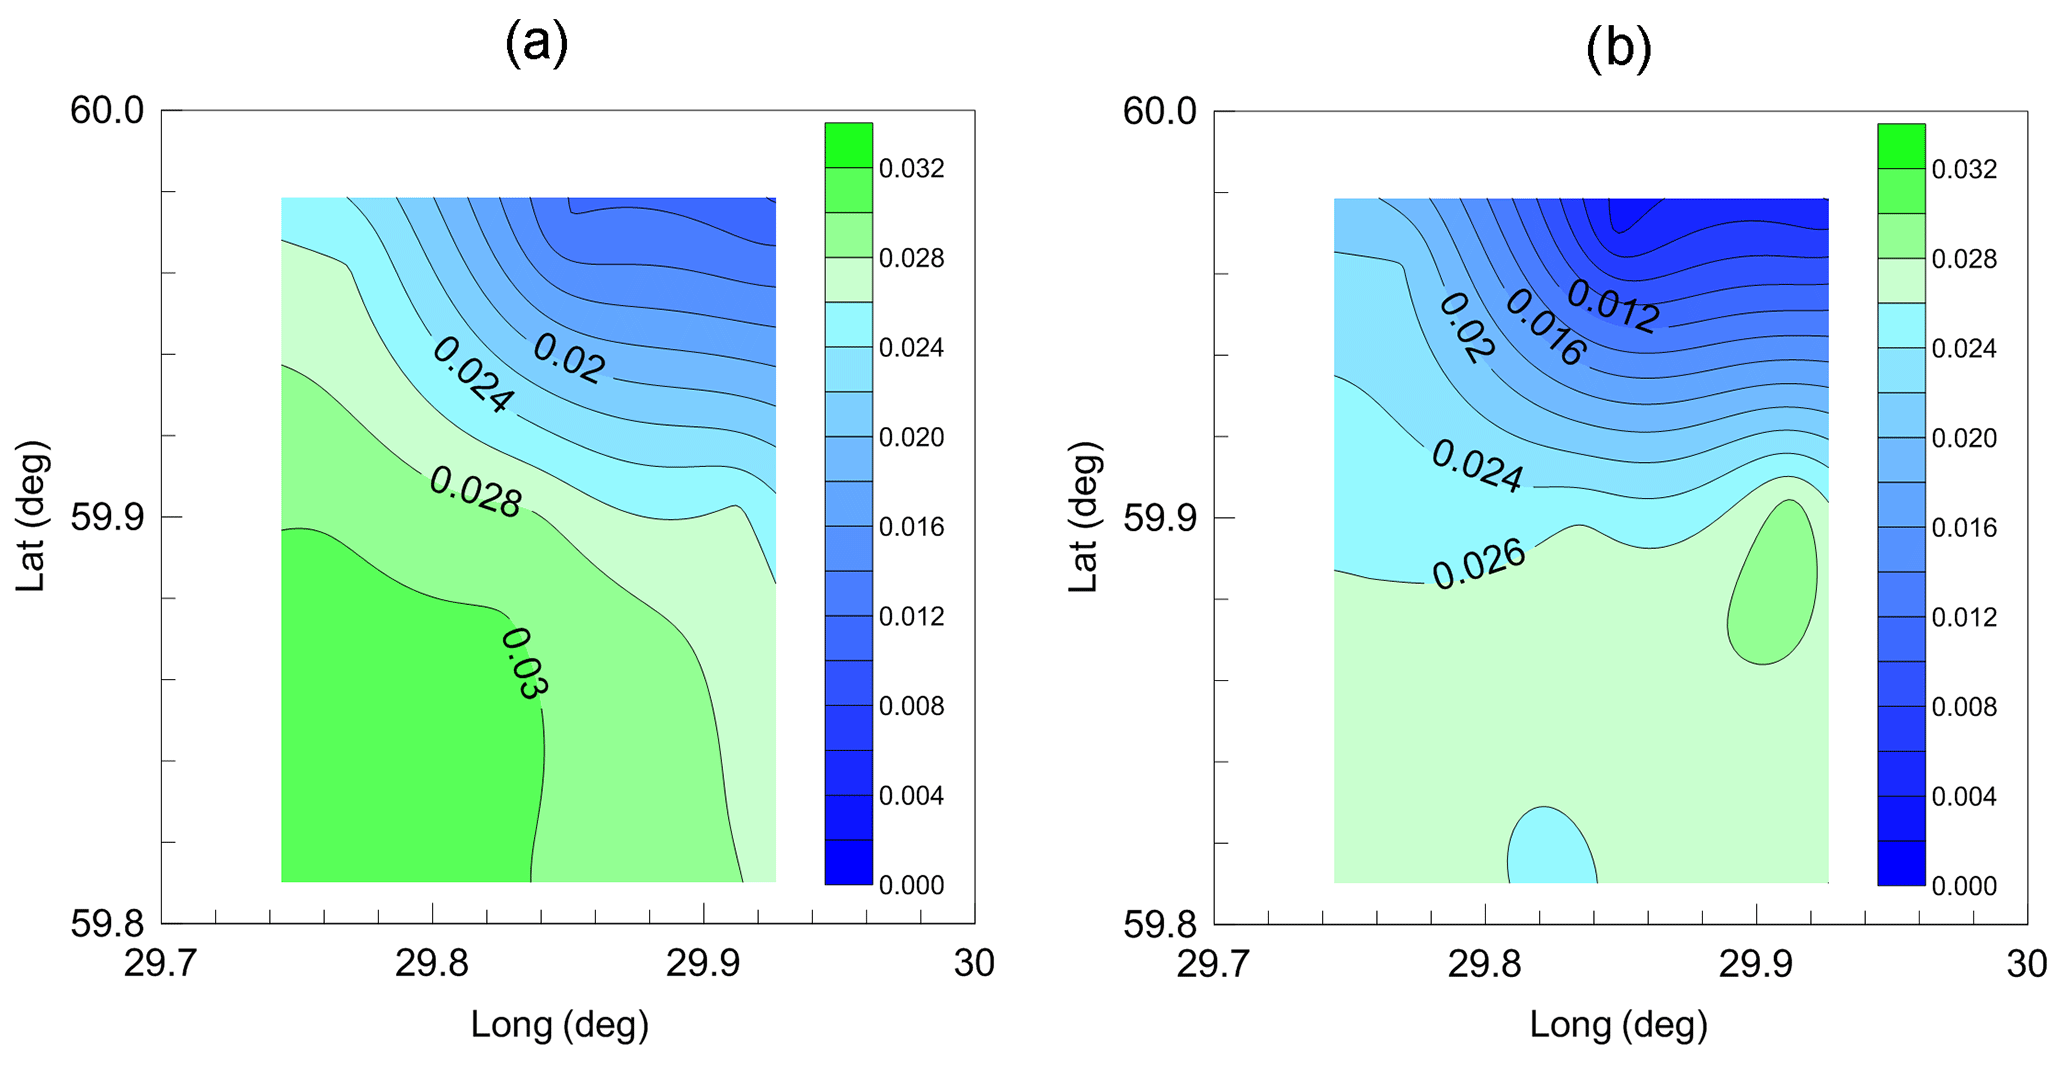
Figure 3The map of the mean LWP values (kg m−2, colour scale) calculated for the small terrain and for the WH (a) and CD (b) data sets (measurements by the SEVIRI instrument).
It should be noted that the land–sea differences of cloud characteristics in northern Europe were detected earlier. Karlsson (2003) compiled regional cloud climatologies covering the Scandinavian region on the basis of processing data from the NOAA Advanced Very High Resolution Radiometer (AVHRR) instrument for the period 1991–2000. Considerable local-scale variation in cloud amounts was found in the region. During the spring and summer seasons, as a contrast to winter and autumn conditions, much less cloudiness was found over seawater and major lakes. It was suggested that the cold sea surface temperatures in the Baltic Sea (especially in spring and early summer due to inflow of cold fresh water from melting snow) lead to a considerable stabilisation of near-surface layer of the troposphere. This explanation agrees well with what was detected in our study: the land–sea gradient in the mean LWP values for the CD period is noticeably lower than for the WH period.
Taking into account the estimated considerable values of the parallax effect and the land–sea LWP gradient, one can come to the conclusion that the combination, in specific cases, can influence the results of the comparison of the SEVIRI and the HATPRO data. In order to investigate this possible influence, not one but two SEVIRI pixels were chosen for analysis: 243 and 221. For simplicity, below we shall refer to the “main” pixel 243 as pixel 0.
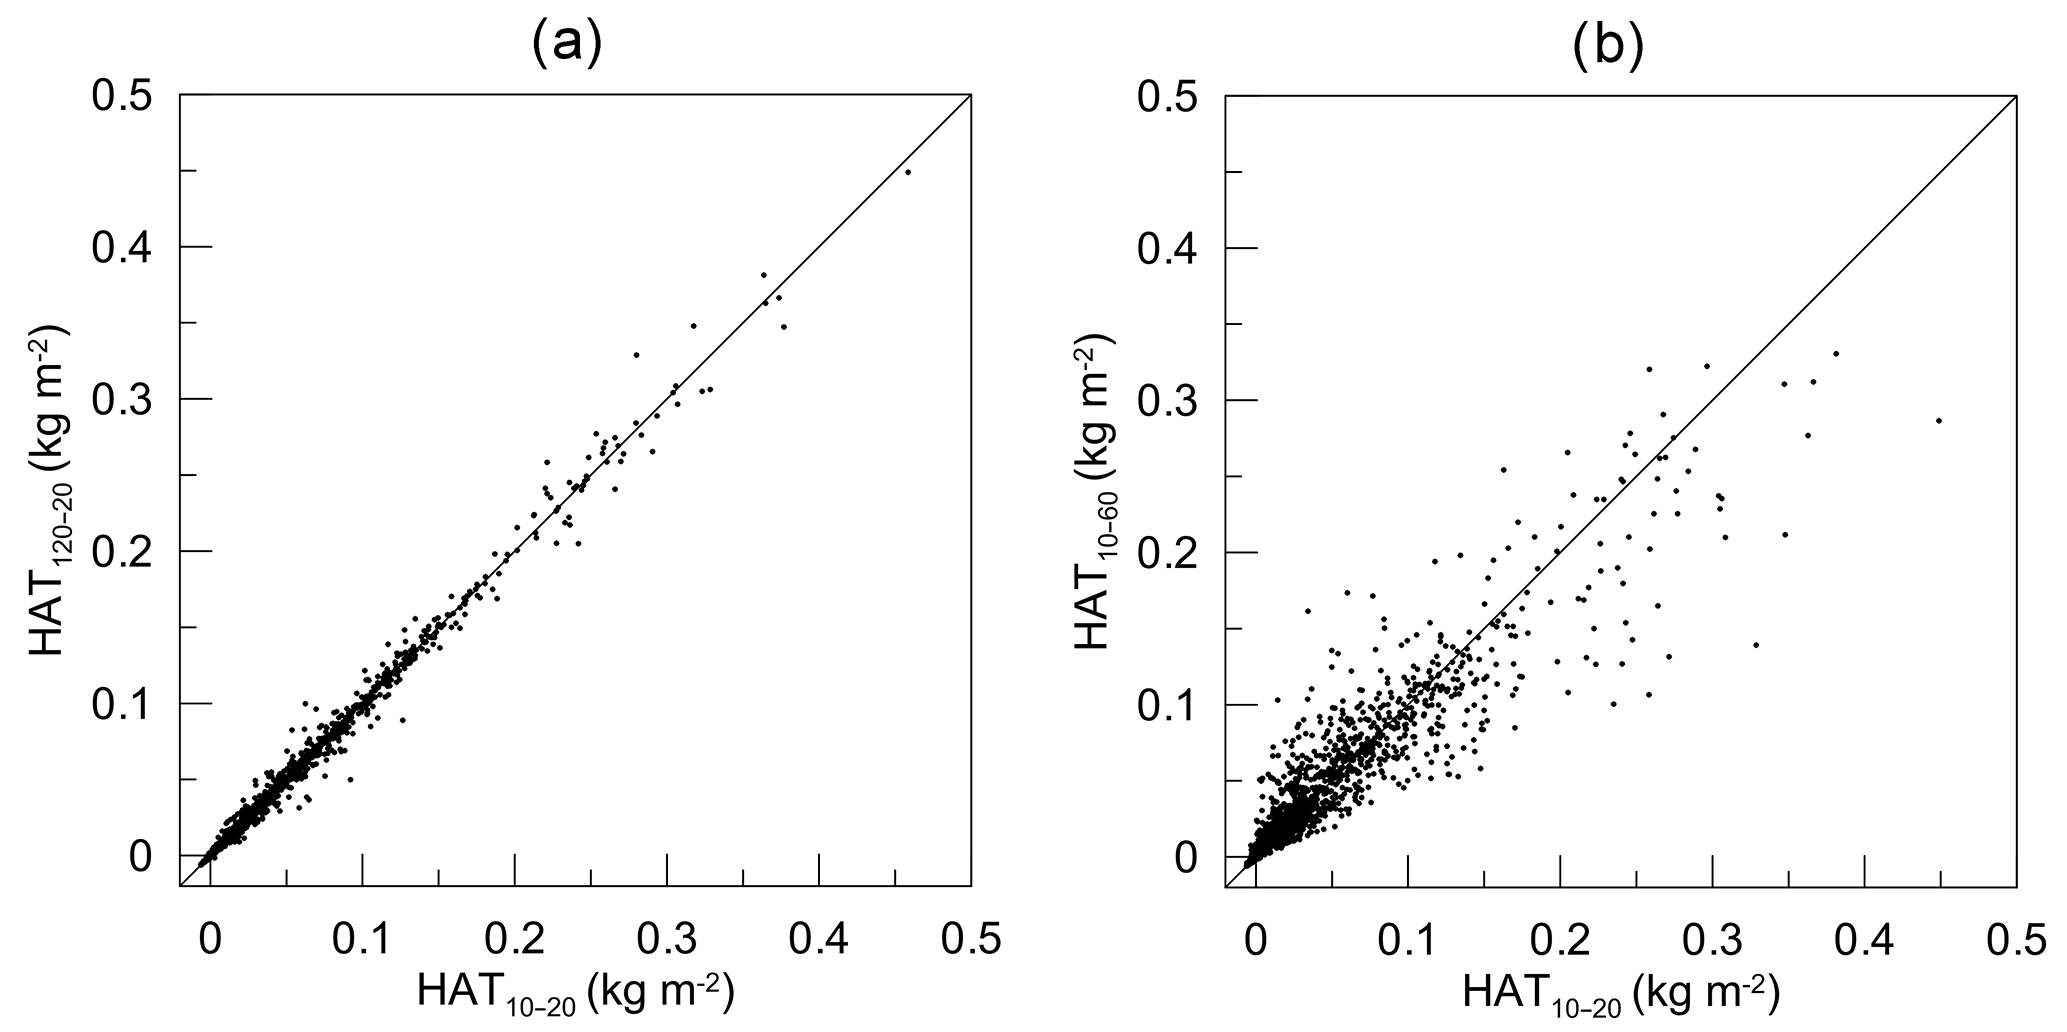
Figure 4The scatter plots of LWP data contained in different HATPRO data sets; see Table 1. Panel (a) illustrates the influence of the sampling interval and (b) illustrates the influence of the averaging period.
Concluding this section, we consider how different schemes of sampling and averaging of the HATPRO original data influence the HATPRO LWP values taken for comparison with the results obtained by SEVIRI. Two scatter plots are presented in Fig. 4. The first scatter plot shows the LWP values contained in data sets HAT10−20 and HAT120−20 (see Table 1) and gives the impression of the influence of the sampling interval on the data averaged over the same time period (in the considered case averaging over the 20 min period was done and the two sampling intervals were compared – 10 and 120 s). One can see that this influence is noticeable but is not as strong as the influence of the averaging period, which is illustrated by the second scatter plot. The second plot displays the LWP data sampled every 10 s but averaged over 20 and 60 min. The maximal difference between LWP values in this case can reach 50 % and more. Therefore, for comparisons of HATPRO and SEVIRI data, we took only two of four data sets that have the same sampling interval (10 s) but different averaging periods (20 and 60 min; HAT10−20 and HAT10−60).
Since LWP, spatial distribution and temporal evolution of clouds are highly variable characteristics, the analysis of specific atmospheric conditions (case study) can be very useful for understanding how different factors influence the results of the comparison of the ground-based and satellite data.
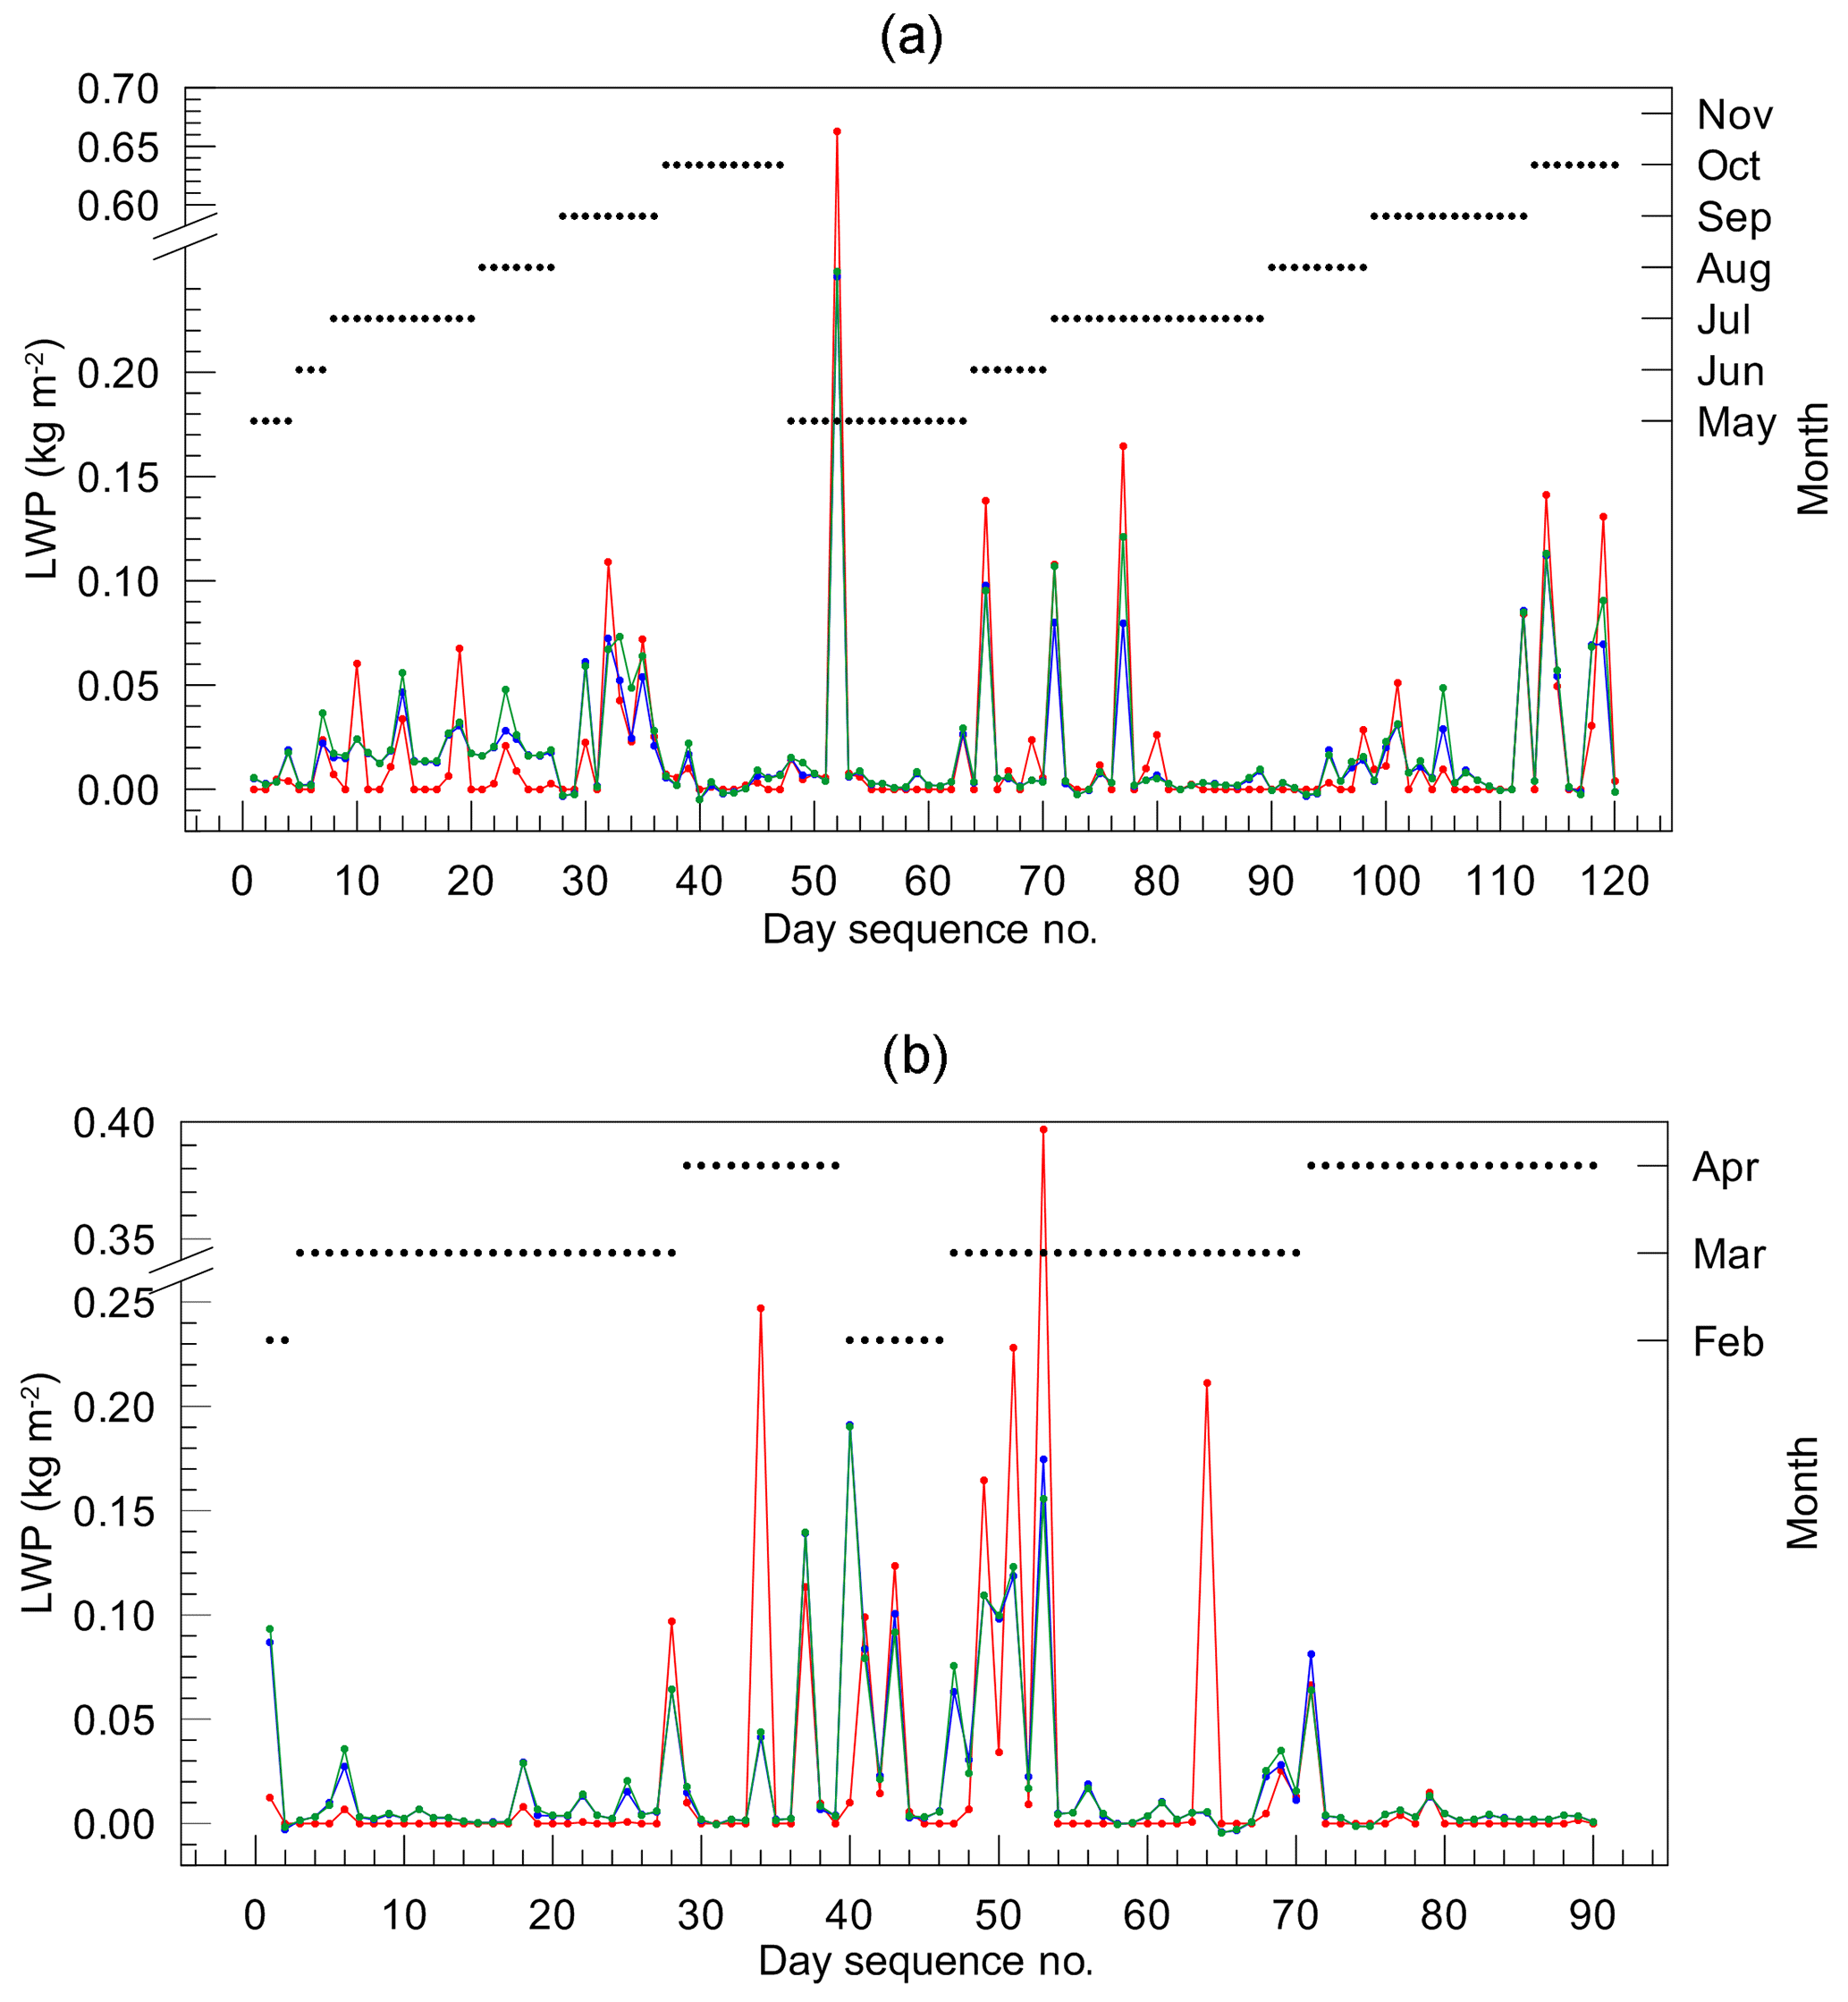
Figure 5The daily median LWP values obtained by SEVIRI (red dots) and HATPRO (blue dots for HAT10−20 and green dots for HAT10−60) as a function of day sequence number for the WH and CD seasons (a and b correspondingly). Colour dots are connected by lines only for demonstrative purpose. Black dots in combination with the right y axis indicate the month of measurements.
First of all, in order to have the impression of the overall agreement of the HATPRO and the SEVIRI data in different seasons, let us consider the daily median LWP values obtained by SEVIRI and HATPRO. These values are shown in Fig. 5 as a function of day sequence number, which corresponds to the simple consecutive enumeration of days in the data sets. Also, the figure presents the distribution of days in the data sets over months. This distribution is practically uniform in the WH data set, but it should be noted that a relatively large number of measurements were suitable for comparison in July, and in June only a few measurements were suitable for comparison. In the CD data set, the measurements in December and January are not present at all because of the large SZA that restricts the SEVIRI observations. There are only a few measurements suitable for comparison in February, but there are a large number of measurements in April and March. We note that March is one of the most cloud-free months in St Petersburg but according to the selection criteria (see Sect. 2) the cloud-free days were also included in the data sets. As far as mostly clear-sky conditions are concerned (median LWP close to zero), we note that the agreement of HATPRO and SEVIRI data for these situations is very good, which can be seen from Fig. 5. This conclusion is valid for both seasons. For cloudy days, the agreement is noticeably better during the WH season, excluding day 52, when the difference between the SEVIRI and the HATPRO LWP values is very large and constitutes about 0.4 kg m−2.
Table 3The bias (SEVIRI minus HATPRO) and rms difference (kg m−2) between the daily median LWP values derived from satellite and ground-based observations. Correlation coefficient rc is also given.
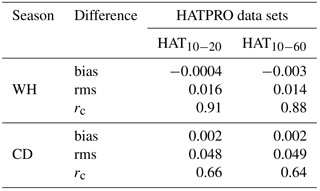
The estimates of the bias and rms difference between the daily median LWP values derived from satellite and ground-based observations are given in Table 3. Since there was only 1 day with an extremely large discrepancy between the results (day 52), we excluded this day from the calculations (this is 14 May 2014 and the reasons for the large discrepancies are discussed below). The daily median values averaged over the data sets constitute 0.017 and 0.02 kg m−2 for WH and CD data sets correspondingly. The values of the differences calculated for the HAT10−20 and the HAT10−60 data sets are very close, so preference can be given neither to the averaging of the radiometer data over 20 min interval nor to averaging over the 60 min interval. The rms difference was estimated at 0.016 kg m−2 for a warm season, which is considerably lower than the rms difference for a cold season, which is 0.048 kg m−2. The bias is very small and it is negative for the WH season and positive for the CD season. It should be emphasised that the correlation coefficients for the WH season are considerably larger than for the CD season.
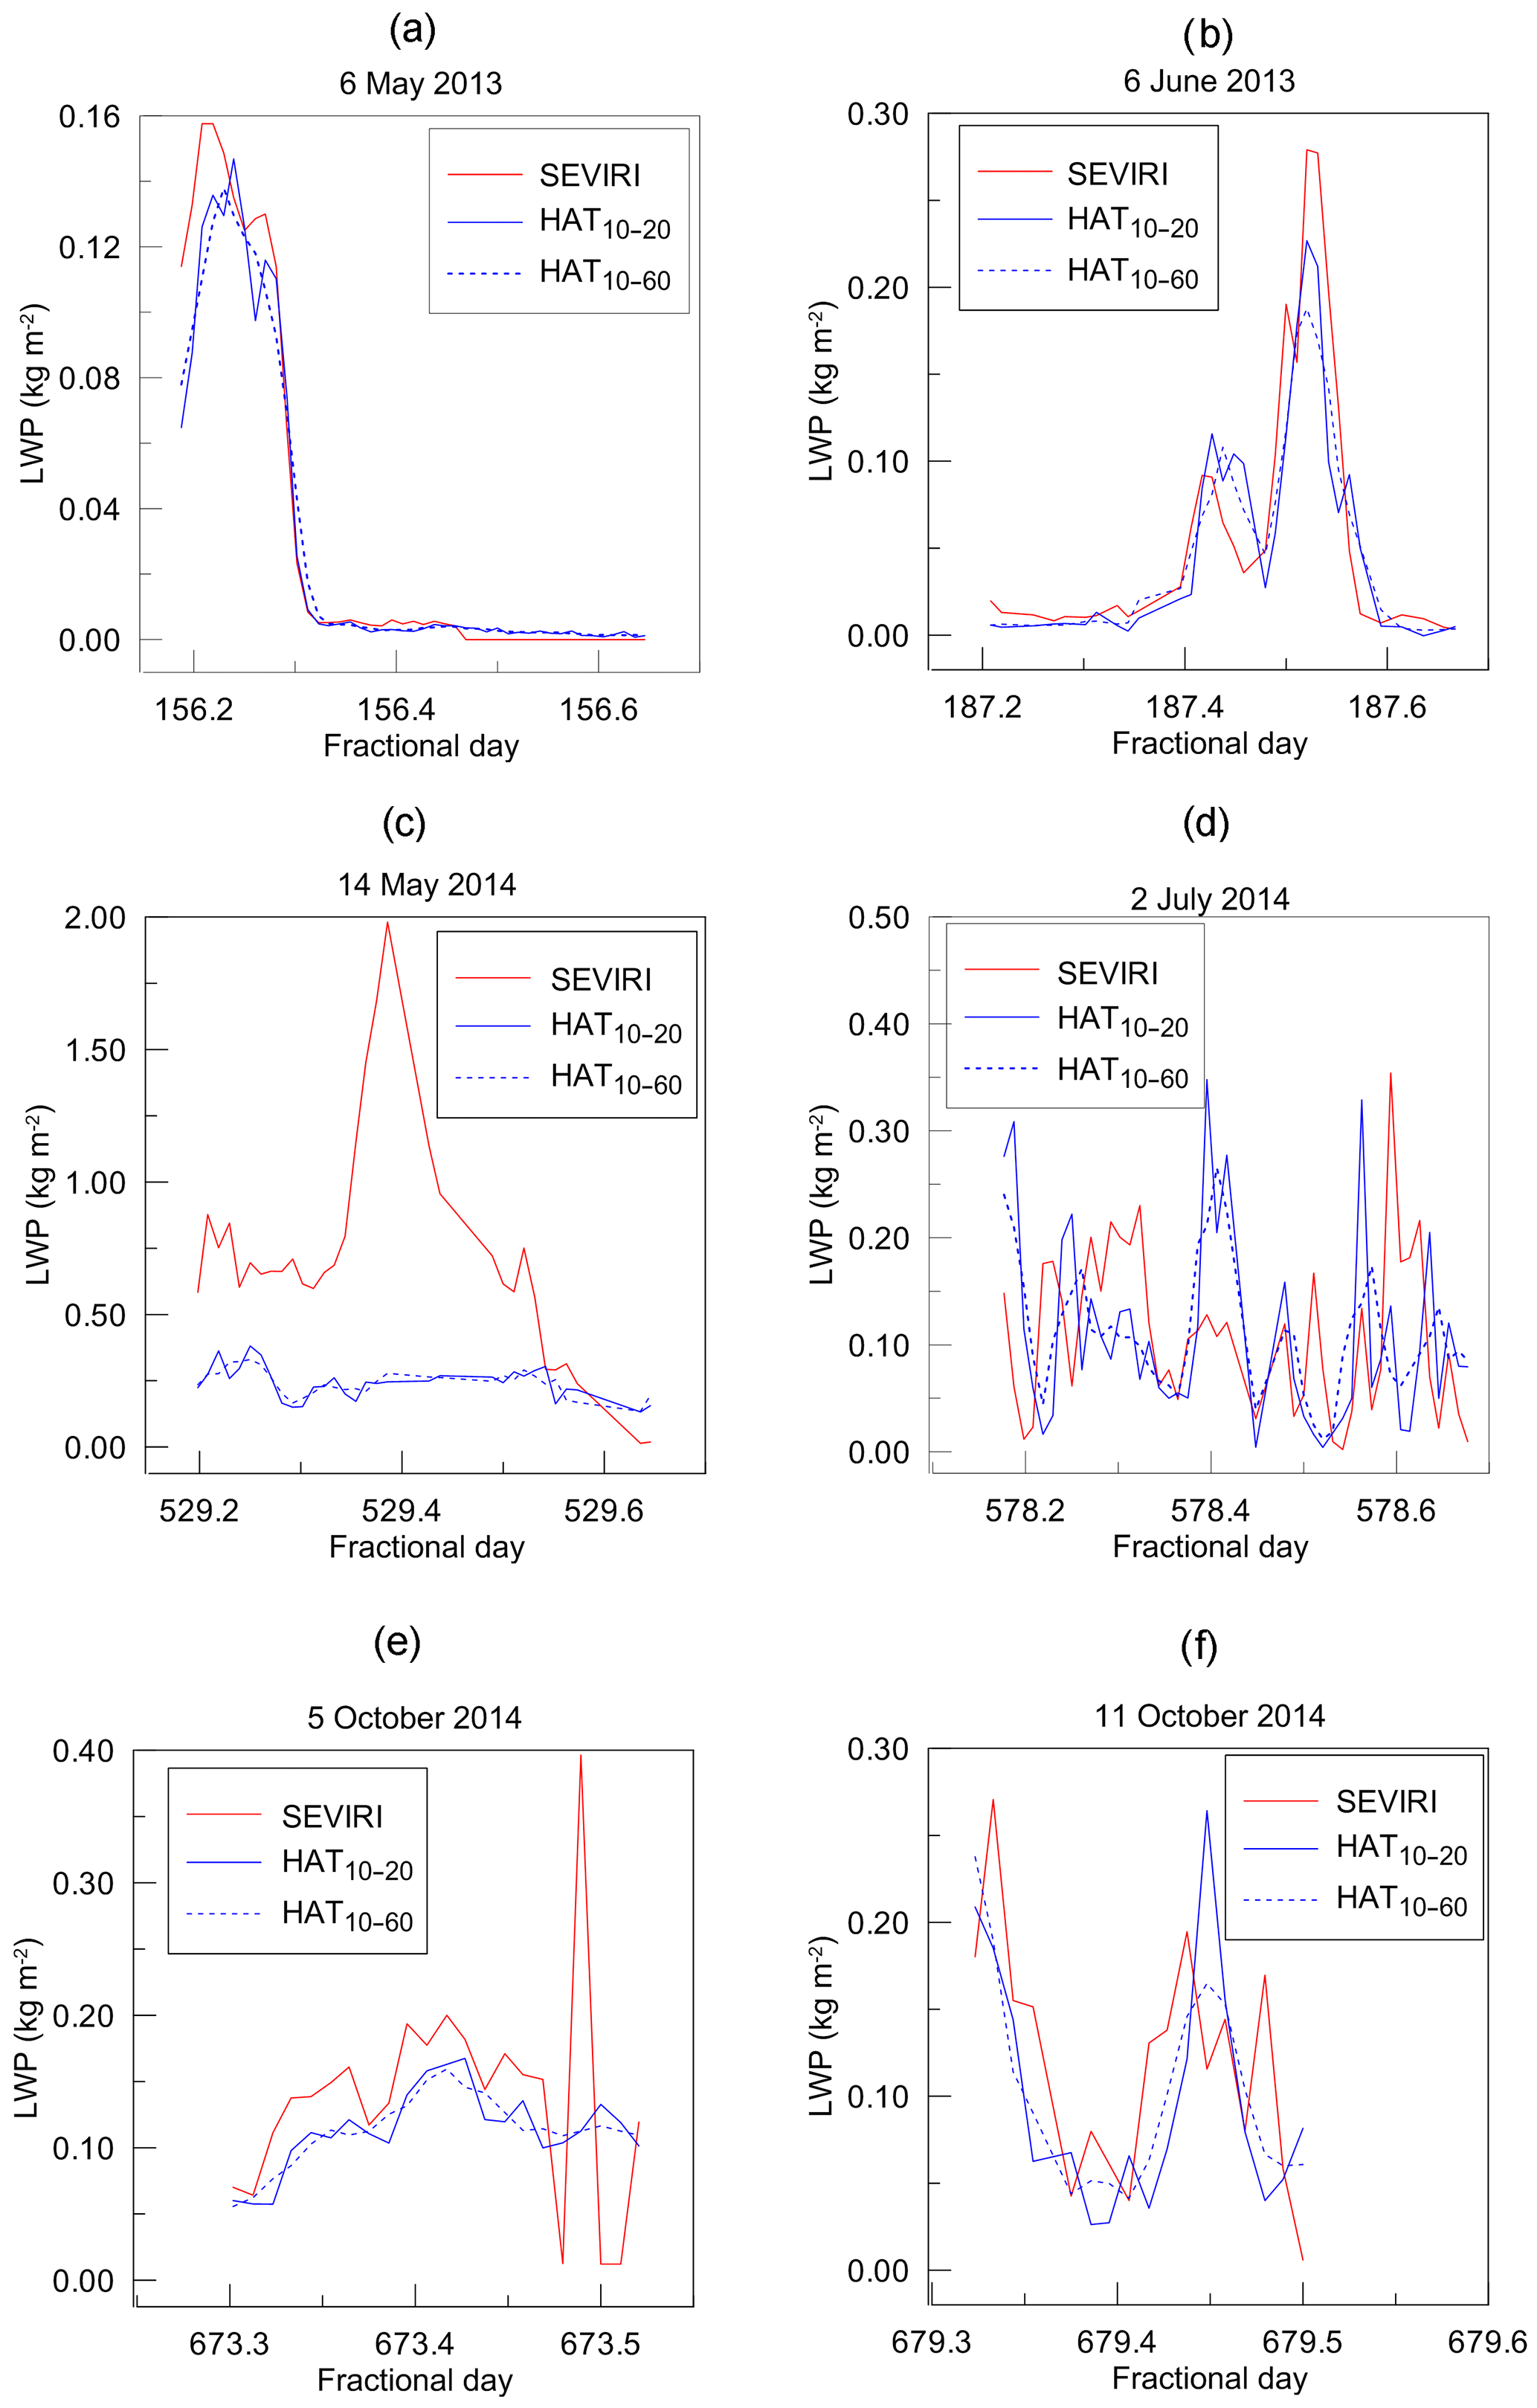
Figure 6The examples of instantaneous measurements of LWP by SEVIRI and by HATPRO (two HATPRO data sets used were HAT10−20 and HAT10−60). Several days of the WH season are shown (1 day is one panel).
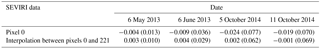
Figure 6 presents the examples of instantaneous measurements of LWP by SEVIRI and by HATPRO (the two HATPRO data sets used were HAT10−20 and HAT10−60) for several days in the WH season. These days were selected for the purpose of demonstrating the cases with good and bad agreement between the data. A very good agreement can be seen on 6 May 2013 and 6 June 2013. On 6 May 2013 the clouds were present in the early morning and the rest of the day was cloud-free. On 6 June 2013 the clouds appeared in the afternoon and disappeared in the evening. For both cases the qualitative and quantitative agreement of the HATPRO and the SEVIRI results can be considered excellent. It should be taken into account that the day fraction is bound to UTC, not the local time, and the time difference is 3 h. A very good agreement is also demonstrated on 11 October 2014 when HATPRO and SEVIRI show two maxima of LWP during the day; however the second maximum is narrower for HATPRO. The day 5 October 2014 presents an example of a combination of good and bad agreement between the data. Most of the time, HATPRO and SEVIRI show the same very smooth temporal behaviour of LWP, but in the late afternoon sudden oscillations appear in the SEVIRI data.
The examples of the considerable disagreement between the HATPRO and the SEVIRI data are the measurements on 2 days: 14 May 2014 and 2 July 2014. On 14 May 2014 the LWP was nearly constant and close to 0.25 kg m−2 according to the HATPRO radiometer observations while SEVIRI provided much higher quantities (with the peak of 2 kg m−2) most of the time except for 3 h in the evening. On 2 July 2014 both instruments detected high variability in LWP with the same magnitude, but there was no correlation between the satellite and the ground-based measurements. In order to identify the reasons for strong discrepancies between the data we have analysed the results of meteorological observations at the St Petersburg meteorological station (WMO ID 26063) during these 2 days. According to records, rain was detected on 14 May 2014 in the morning and in the evening. On 2 July 2014, drizzle was detected in the morning and in the afternoon. It is important to stress that the rain sensor attached to the HATPRO instrument did not detect rainfall events during these 2 days. This fact leads to important conclusions: it is not sufficient to control the observational conditions only at the radiometer site, and the data selection criteria used in the present study should be supplemented by additional requirements. For example, in the considered case, the SEVIRI data showed unrealistically high values reaching 2 kg m−2 and the droplet effective radius was also high (about 24 µm), which is either an error or the droplets were mainly raindrops. The quality flag of the SEVIRI results did not hint at errors but the cloud type was supercooled.
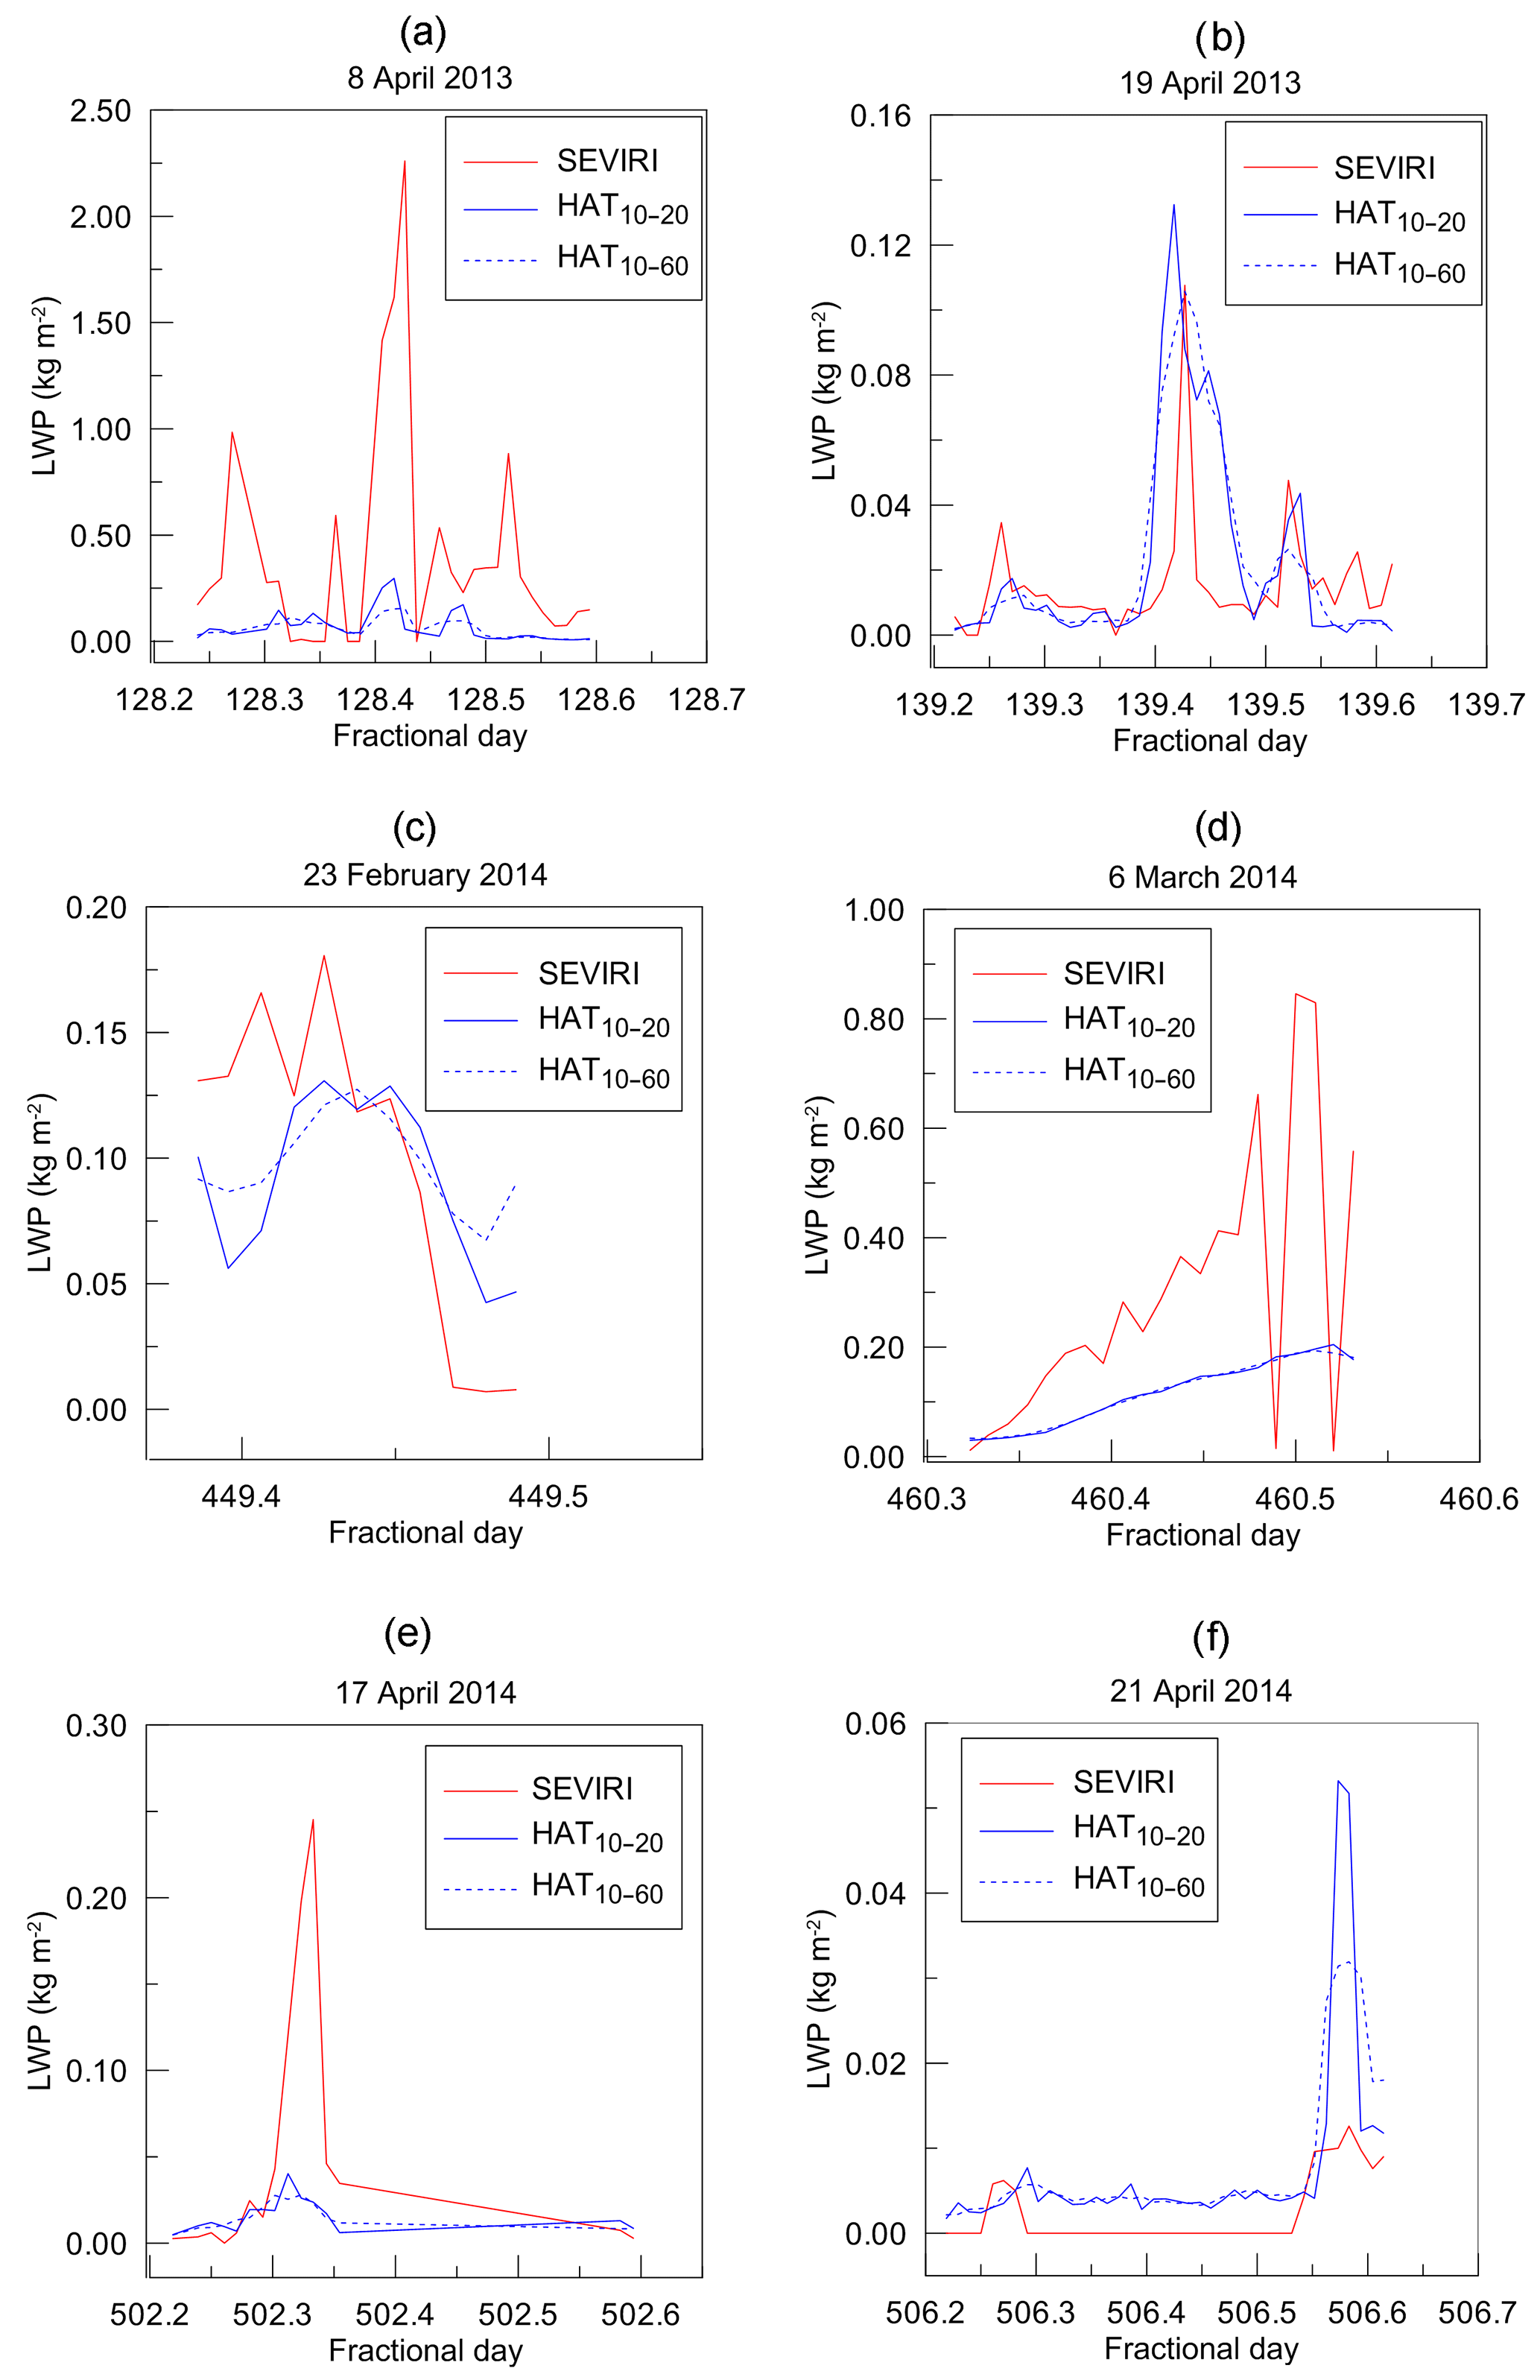
Figure 7The examples of instantaneous measurements of LWP by SEVIRI and by HATPRO (two HATPRO data sets used were HAT10−20 and HAT10−60). Several days of the CD season are shown (1 day is one panel).
Figure 7 presents the examples of instantaneous measurements of LWP by SEVIRI and by HATPRO for several days of the CD season. One can see that in contrast to the WH season there are no cases with excellent agreement between HATPRO and SEVIRI. There is one case of good agreement, 19 April 2013, which demonstrates the same qualitative and quantitative behaviour of LWP detected by the two instruments. The other cases in Fig. 7 display considerable differences reaching sometimes one order of magnitude. However, despite large differences, the HATPRO and the SEVIRI observations provided the same qualitative behaviour from LWP on 17 April 2014 (one maximum of LWP in the morning) and on 21 April 2014 (one lower maximum of LWP in the morning and one higher maximum of LWP in the evening). The observation records at the meteorological station indicate the light snowfall on 8 April 2013, when SEVIRI produced extremely large values of LWP. It should be noted that the SEVIRI algorithm identified the clouds in this case as supercooled. Rain was detected at the meteorological station on 23 February 2014 in the morning and in the afternoon, just before and after the period of LWP observations shown in Fig. 7. We stress that the rain sensor attached to the HATPRO instrument did not detect rainfall events on this day.
It should be emphasised that, as one can see from Figs. 6 and 7, there is no preference on whether to perform averaging of the HATPRO data over 20 min or over 60 min. For the cases with good data agreement, both HAT10−20 and HAT10−60 data sets correspond well to the satellite data. For the cases with large discrepancies, the difference between the HATPRO and SEVIRI data is several times higher, or even by an order of magnitude higher, than the difference between the corresponding values of the HAT10−20 and HAT10−60 data sets.
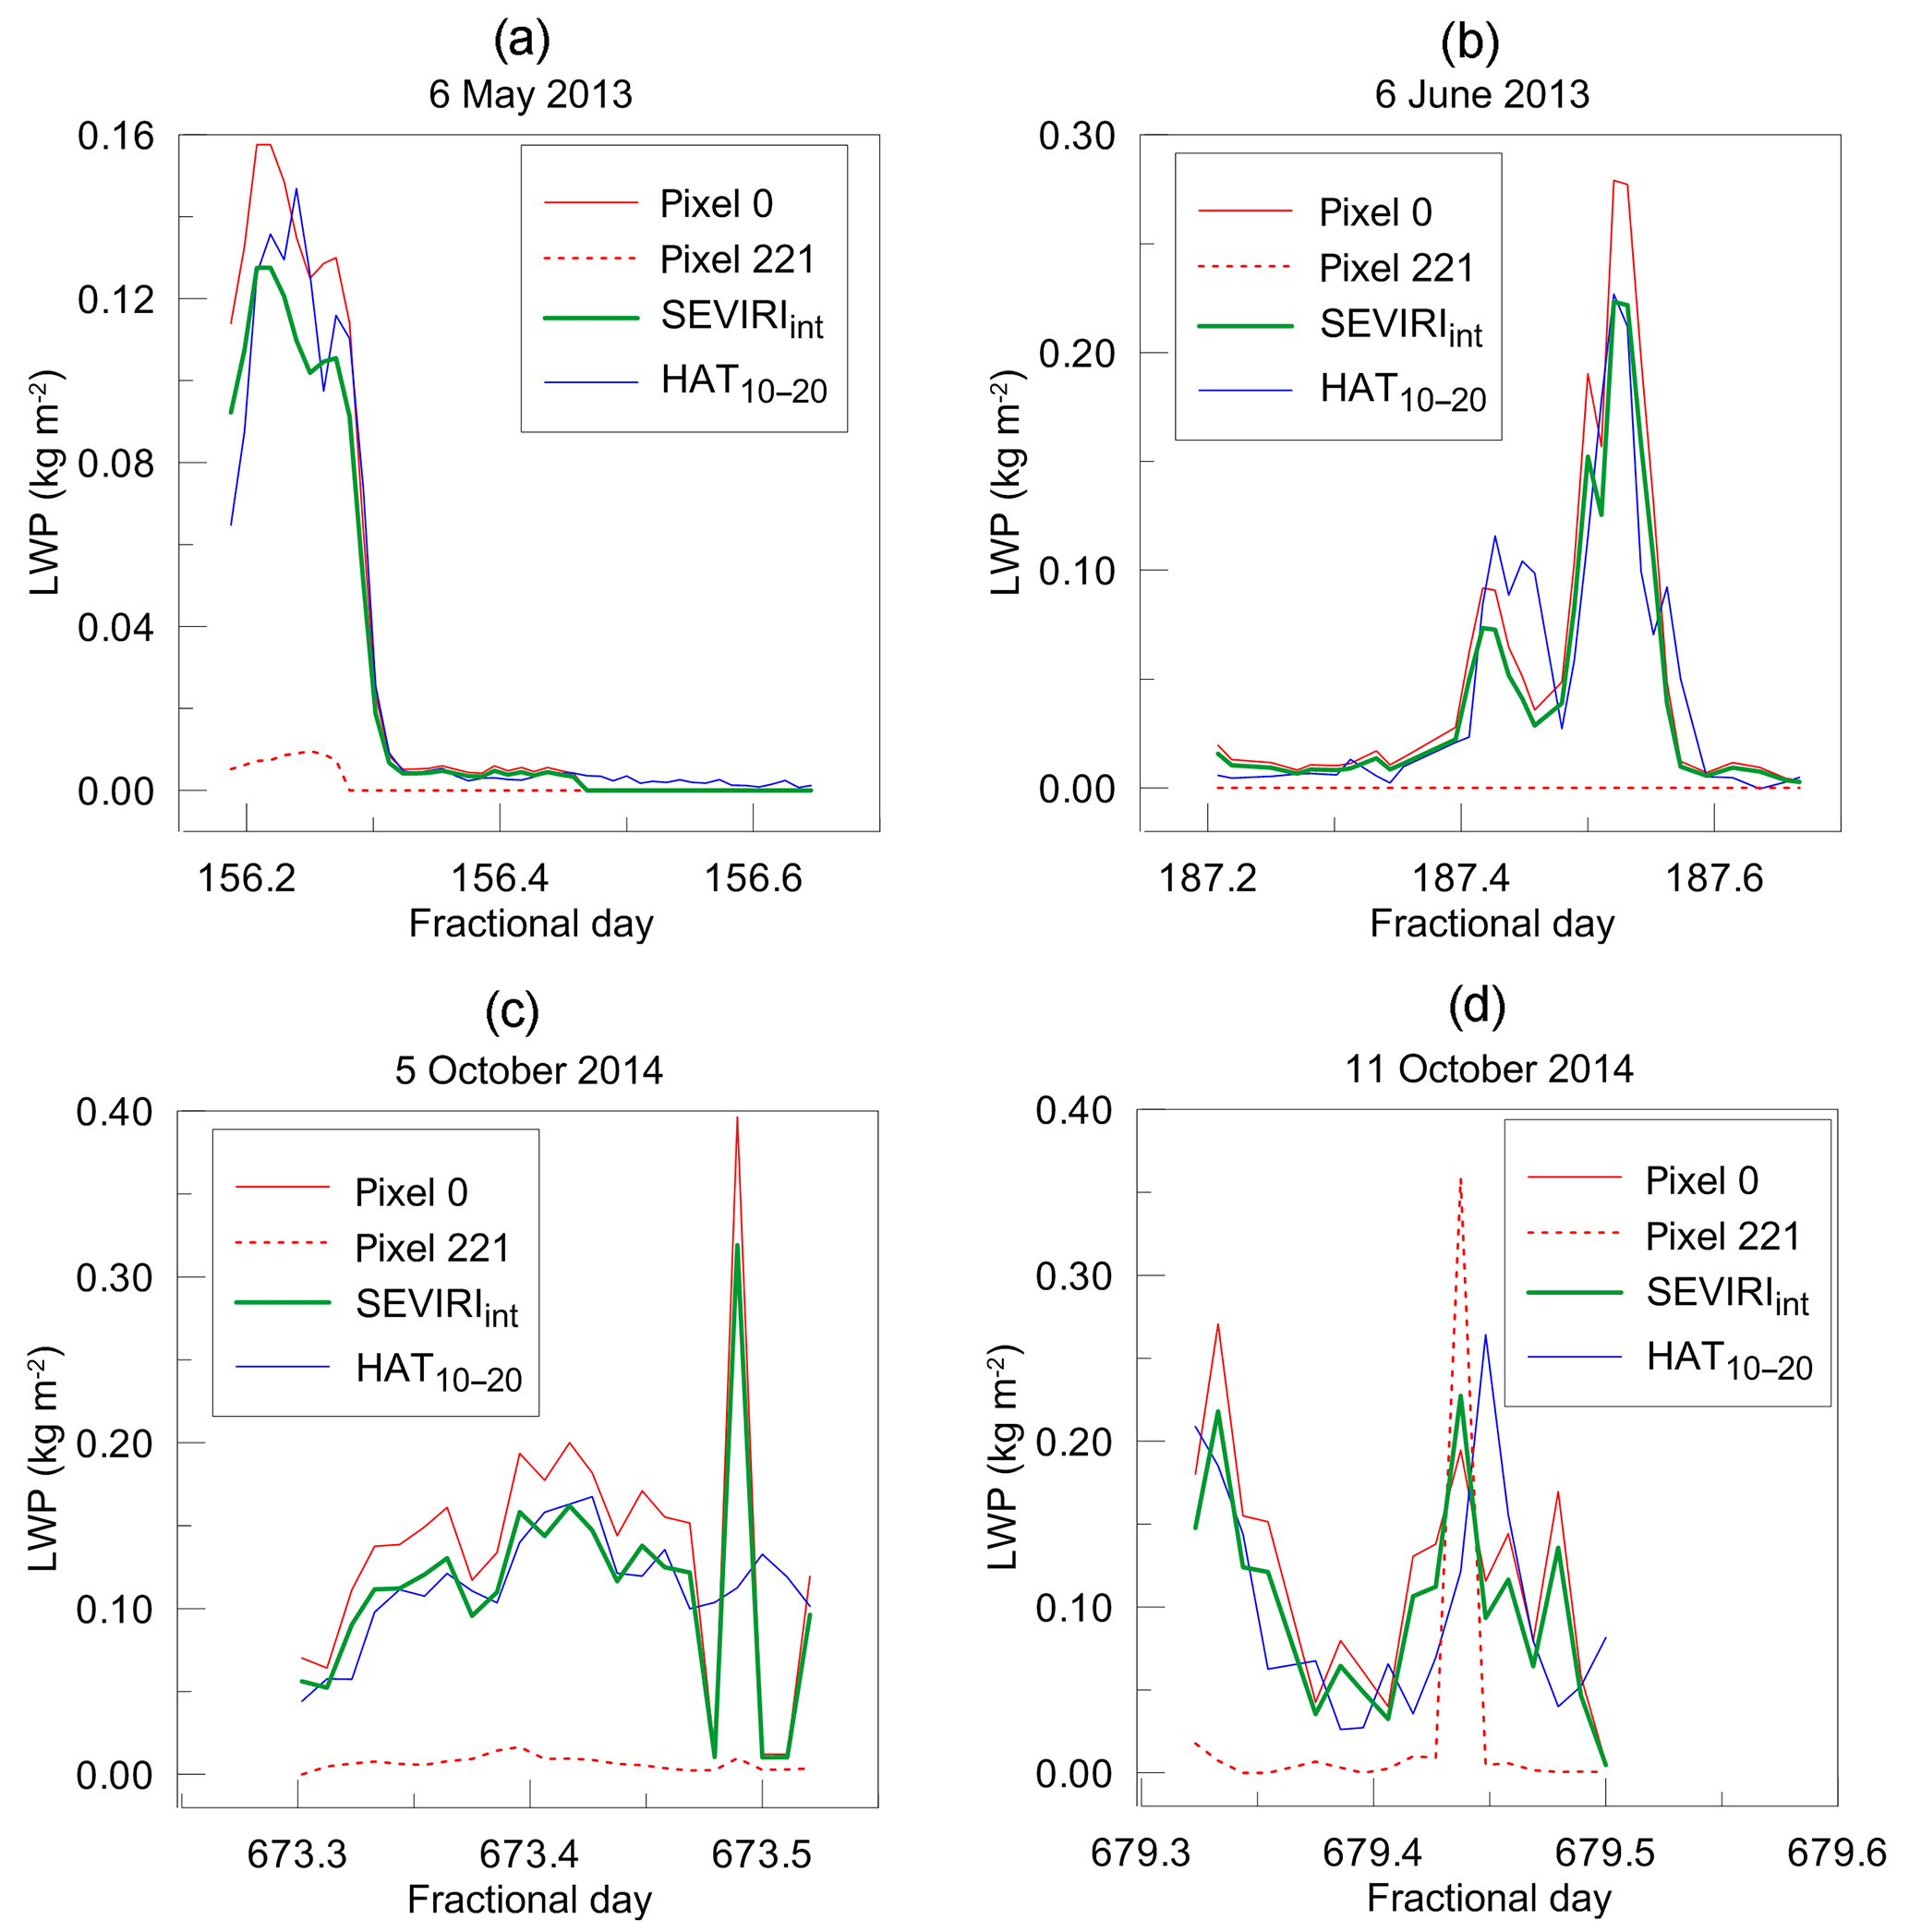
Figure 8The examples of instantaneous measurements of LWP by SEVIRI (pixel 0, pixel 221 and the interpolated value) and by HATPRO (HAT10−20 data set used). Several days of the WH season are shown (1 day is one panel).
An analysis of cases with very good data agreement gives the opportunity to estimate the influence of the LWP spatial gradients on the results of the comparison of the satellite and the ground-based data. As mentioned in Sect. 3, the parallax effect for the St Petersburg measurement site is expected to be no less than 3 km in terms of the displacement to the northerly direction; i.e. the satellite image point corresponding to a cloud view by the HATPRO radiometer is located over the coastline or over the water of the Gulf of Finland. The long-term observations by SEVIRI revealed considerable difference in LWP over land and sea that means the strong inhomogeneity of the cloud distribution in the vicinity of the radiometer site. Under these conditions the parallax effect should be compensated in one way or another. This compensation can be done by the interpolation of the LWP values observed for pixels 0 (243) and 221 (see Fig. 1). In order to obtain the rough estimation of the parallax effect and its compensation, in Fig. 8 we plotted several examples of instantaneous measurements of LWP by SEVIRI for pixel 0, pixel 221 and the result of the linear interpolation of these LWP values to the parallax point. We compare these three quantities with the HAT10−20 data set. First of all, it should be emphasised that in all selected cases the LWP values for pixel 221 were close to zero except for a short period of time on 11 October 2014 and at the same time, the LWP values for pixel 0 were rather large and variable, explicitly demonstrating the land–sea difference in LWP. The interpolated LWP values are lower than the values for pixel 0 except for the short period of time on 11 October 2014. These interpolated values in general are closer to the corresponding values of the HAT10−20 data set than the values observed for pixel 0. The improvement of the agreement after interpolation can be clearly seen on 6 May 2013 and on 6 June 2013 at the second maximum of LWP. On 5 October the interpolated values show excellent agreement with the HATPRO data most of the time, excluding 3 h in the afternoon when the SEVIRI data were oscillating. On 11 October one can also see definite improvement of the agreement between the HATPRO and SEVIRI data after interpolation. Table 4 presents the bias (HATPRO minus SEVIRI) and rms difference between the LWP values derived from satellite and ground-based observations for the cases shown in Fig. 8. In every case the interpolation resulted in considerable decrease in the absolute value of the bias. The rms difference also decreased; however the effect is not so pronounced as for the bias.
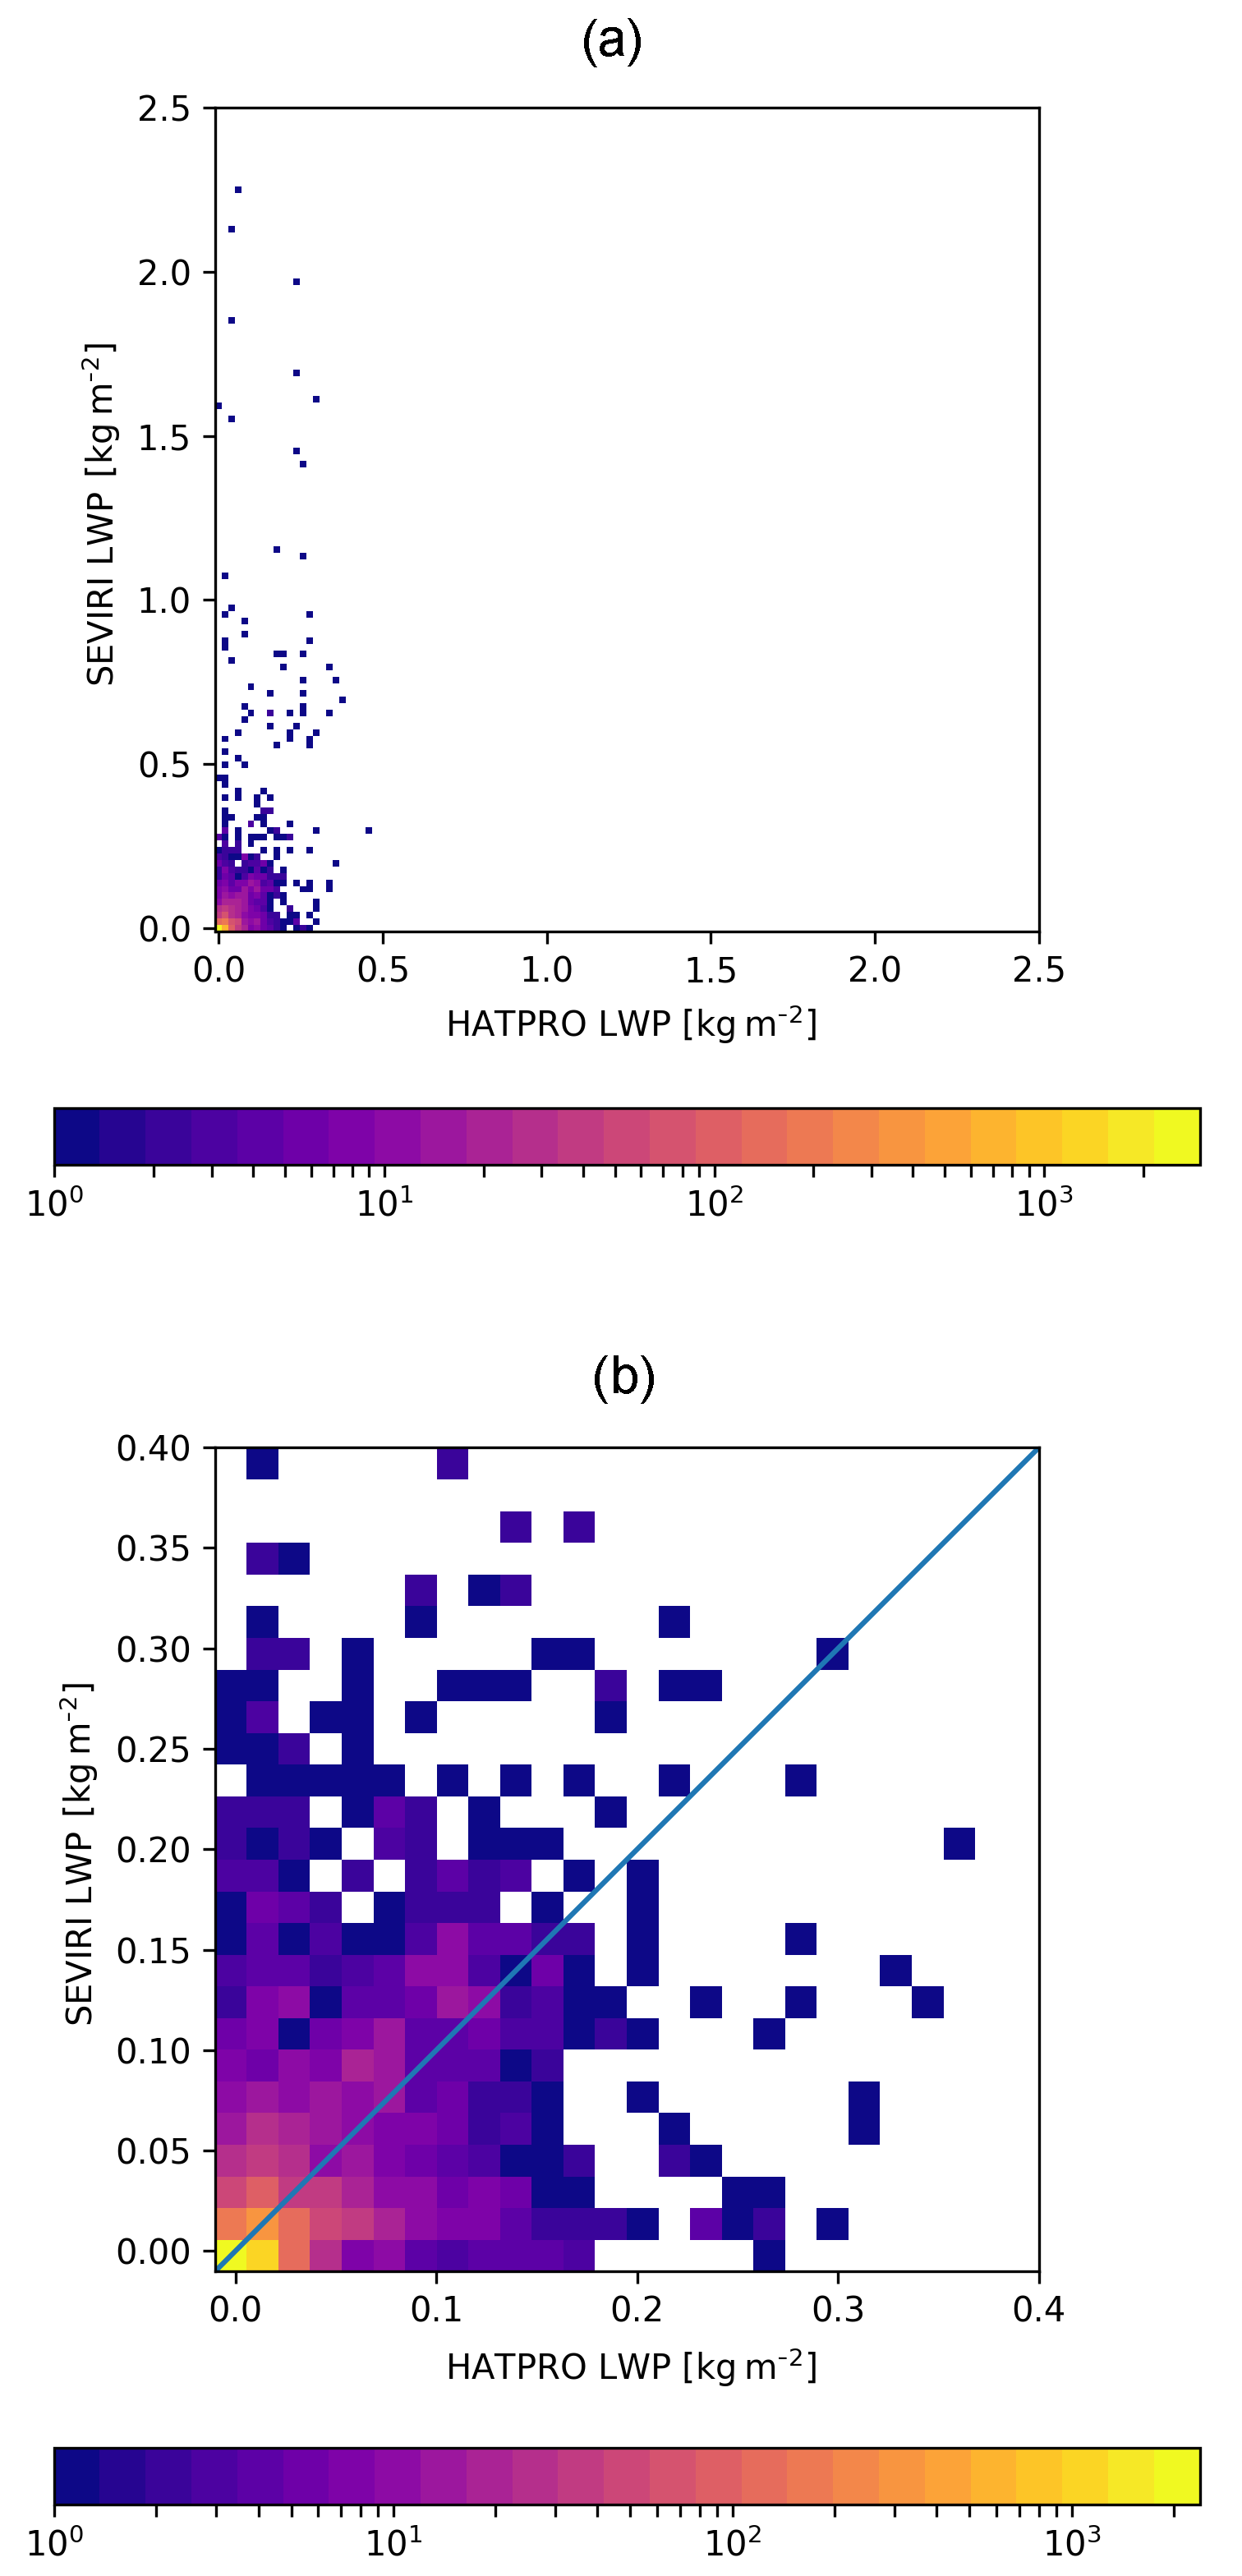
Figure 9Comparison of the HATPRO and SEVIRI instantaneous measurements by means of two-dimensional histogram with number-of-occurrence colour scale. (a) Extra high LWP values are shown. (b) Only LWP < 0.4 kg m−2 are shown.
Table 4The bias (HATPRO minus SEVIRI) and rms difference (shown in brackets) between the LWP values derived from satellite and ground-based observations (kg m−2) for the cases shown in Fig. 8.
5.1 Seasonal features
We begin our analysis by making a comparison of the instantaneous HATPRO and SEVIRI measurements of LWP by means of a two-dimensional histogram with the number-of-occurrence colour scale that is displayed in Fig. 9. This plot gives an impression of the overall agreement of measurements disregarding seasonal features. First of all, attention should be paid to the presence of a noticeable number of very high LWP values detected by the SEVIRI instrument and reaching 2.3 kg m−2. However, the number of occurrence of these measurements is very small if compared to the number of occurrence of the small values. The two-dimensional histogram for LWP < 0.4 kg m−2 shown in the lower panel of Fig. 9 demonstrates that the largest number of occurrence is observed for small LWP that do not exceed 0.03 kg m−2. The agreement between HATPRO and SEVIRI data for these values is good. For higher values, the agreement is not evident. This fact is not surprising since the agreement between instantaneous measurements is influenced by time, distance, weather conditions, type of cloudiness and the parameters of time averaging of the HATPRO data.
Now we analyse the conventional one-dimensional LWP frequency distributions in order to examine possible qualitative differences in HATPRO and SEVIRI measurements. The data were filtered to exclude the clear cases (LWP < 0.001 kg m−2) and the extreme cases (LWP > 0.4 kg m−2). It should be noted that data filtering was done for collocated pairs of measurements: if one value in a pair was out of range, the whole pair was filtered out. The bin size was selected at 0.02 kg m−2 and the frequency of occurrence was normalised with the total number of observations for the respective time interval. We show the distributions for the WH and the CD periods in Fig. 10 (1617 and 482 data samples correspondingly). Figure 11 displays the monthly distributions for 6 months with the largest number of instantaneous measurements (200–500 values per month). February, August and October were not taken into consideration due to a noticeably smaller number of data points.
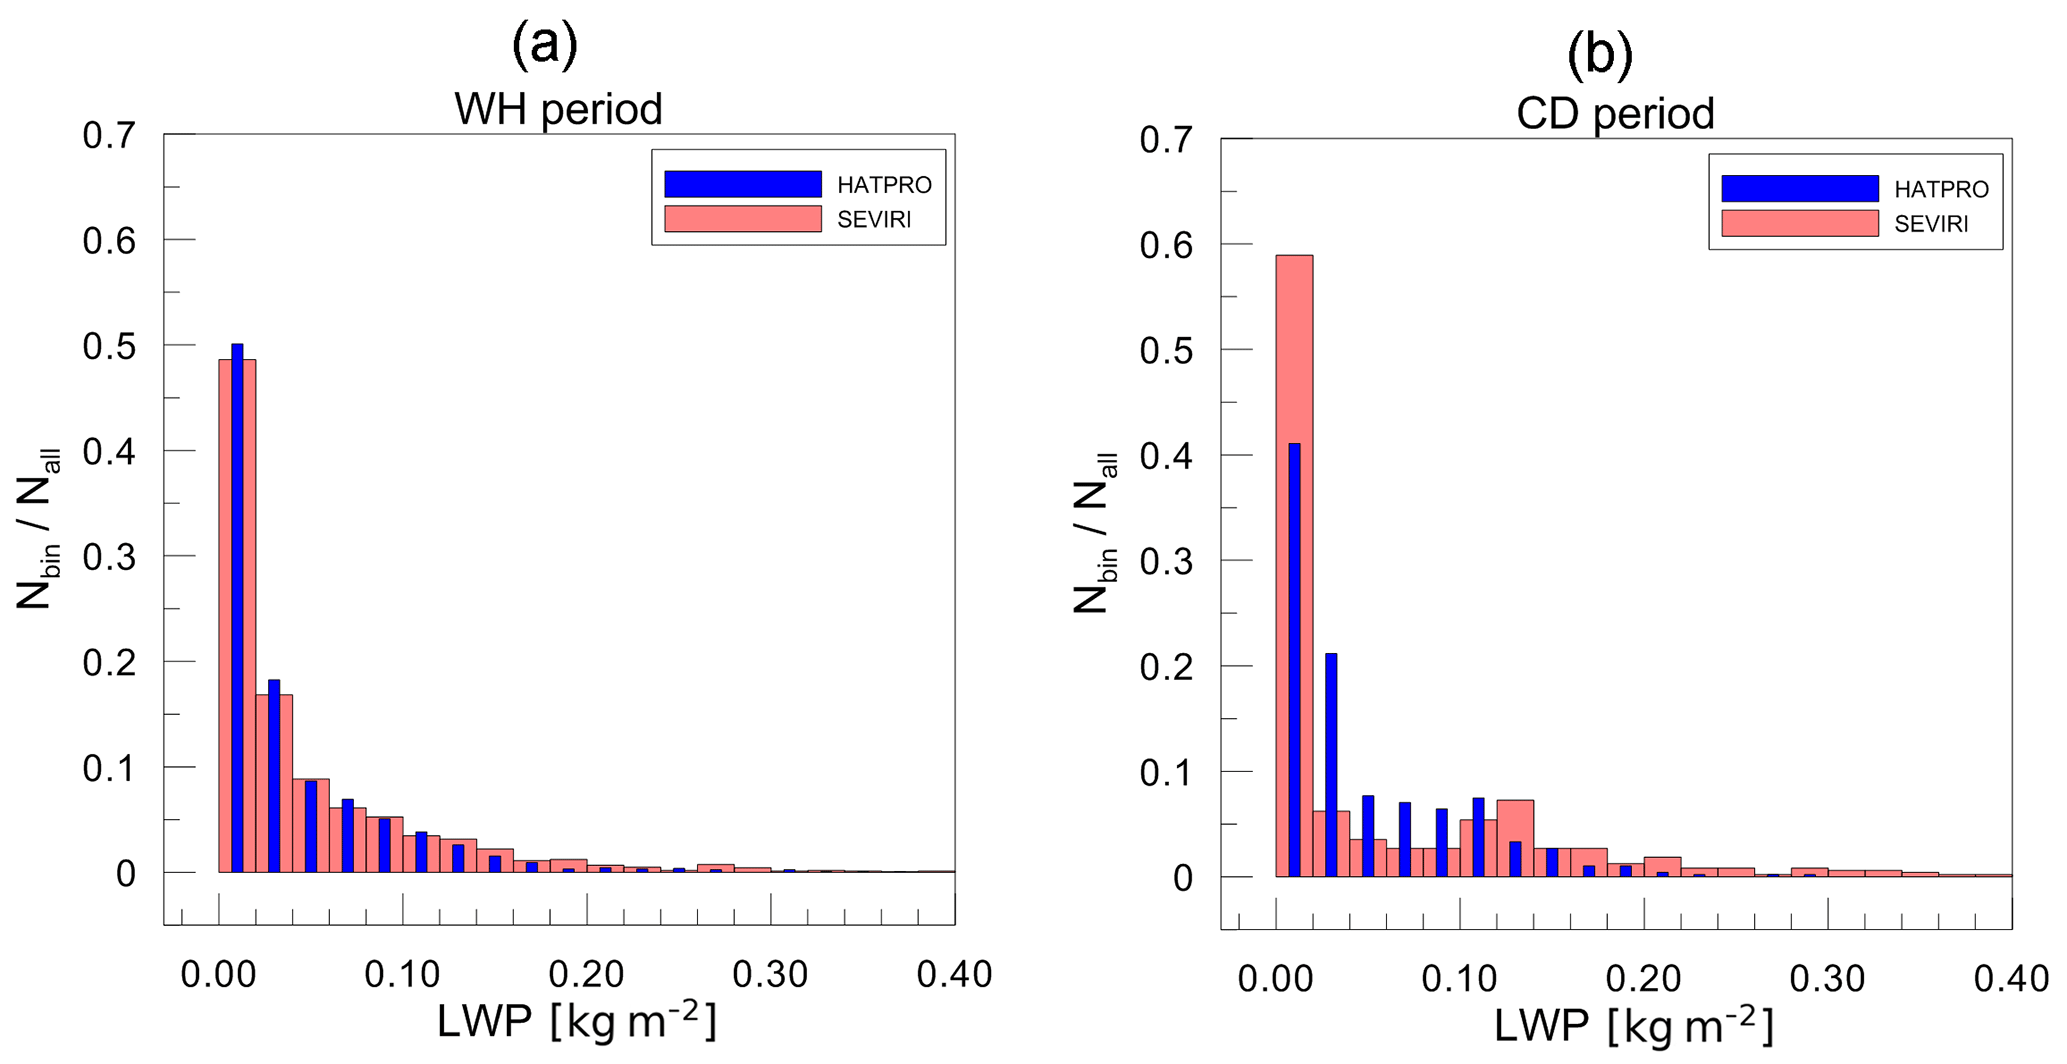
Figure 10Seasonal frequency distribution of LWP for HATPRO and SEVIRI normalised with the total number of occurrence for the WH period (a) and the CD period (b).
The distributions for WH and CD periods of both SEVIRI and HATPRO show that the average LWP is low compared to LWP distributions that were averaged over the complete field of view of SEVIRI, also called “SEVIRI disc” (Kniffka et al., 2014). The distributions are log-normal. For the CD period, the distribution has a bimodal structure, which is more pronounced for the results from SEVIRI. The secondary maximum for the distribution from SEVIRI is clearly identified at 0.12–0.14 kg m−2, and here it reaches about 13 % of the first peak. In case of HATPRO the secondary maximum is not very pronounced but it constitutes 20 % of the first peak and is located at 0.10–0.12 kg m−2. The maximum of distributions for WH and CD periods is in the bin 0.0–0.02 kg m−2 for both HATPRO and SEVIRI. For the WH period, LWP frequencies quickly decline from the maximal number of occurrence of about 0.5 at low LWP values to smaller frequencies of 0.09 at LWP ≈ 0.05 kg m−2. For the CD period, the decline from the peak is more rapid for SEVIRI results: the frequency for LWP ≈ 0.03 kg m−2 is already about 0.06, while for HATPRO results it is about 0.21.
Since the distributions obtained for seasonal periods differ considerably, we also analysed the monthly distributions. In order to avoid misinterpreting the results, we have chosen for our analysis only the months with the largest number of instantaneous measurements. As can be seen from Fig. 11, the bimodal structure of the distributions is detected for March, April, May and June (spring and early summer) with a secondary maximum located at 0.10–0.14 kg m−2. The distributions for July and September are monomodal and resemble the seasonal distribution for WH period. The agreement between the SEVIRI and the HATPRO results is very good for all presented months of the WH period.
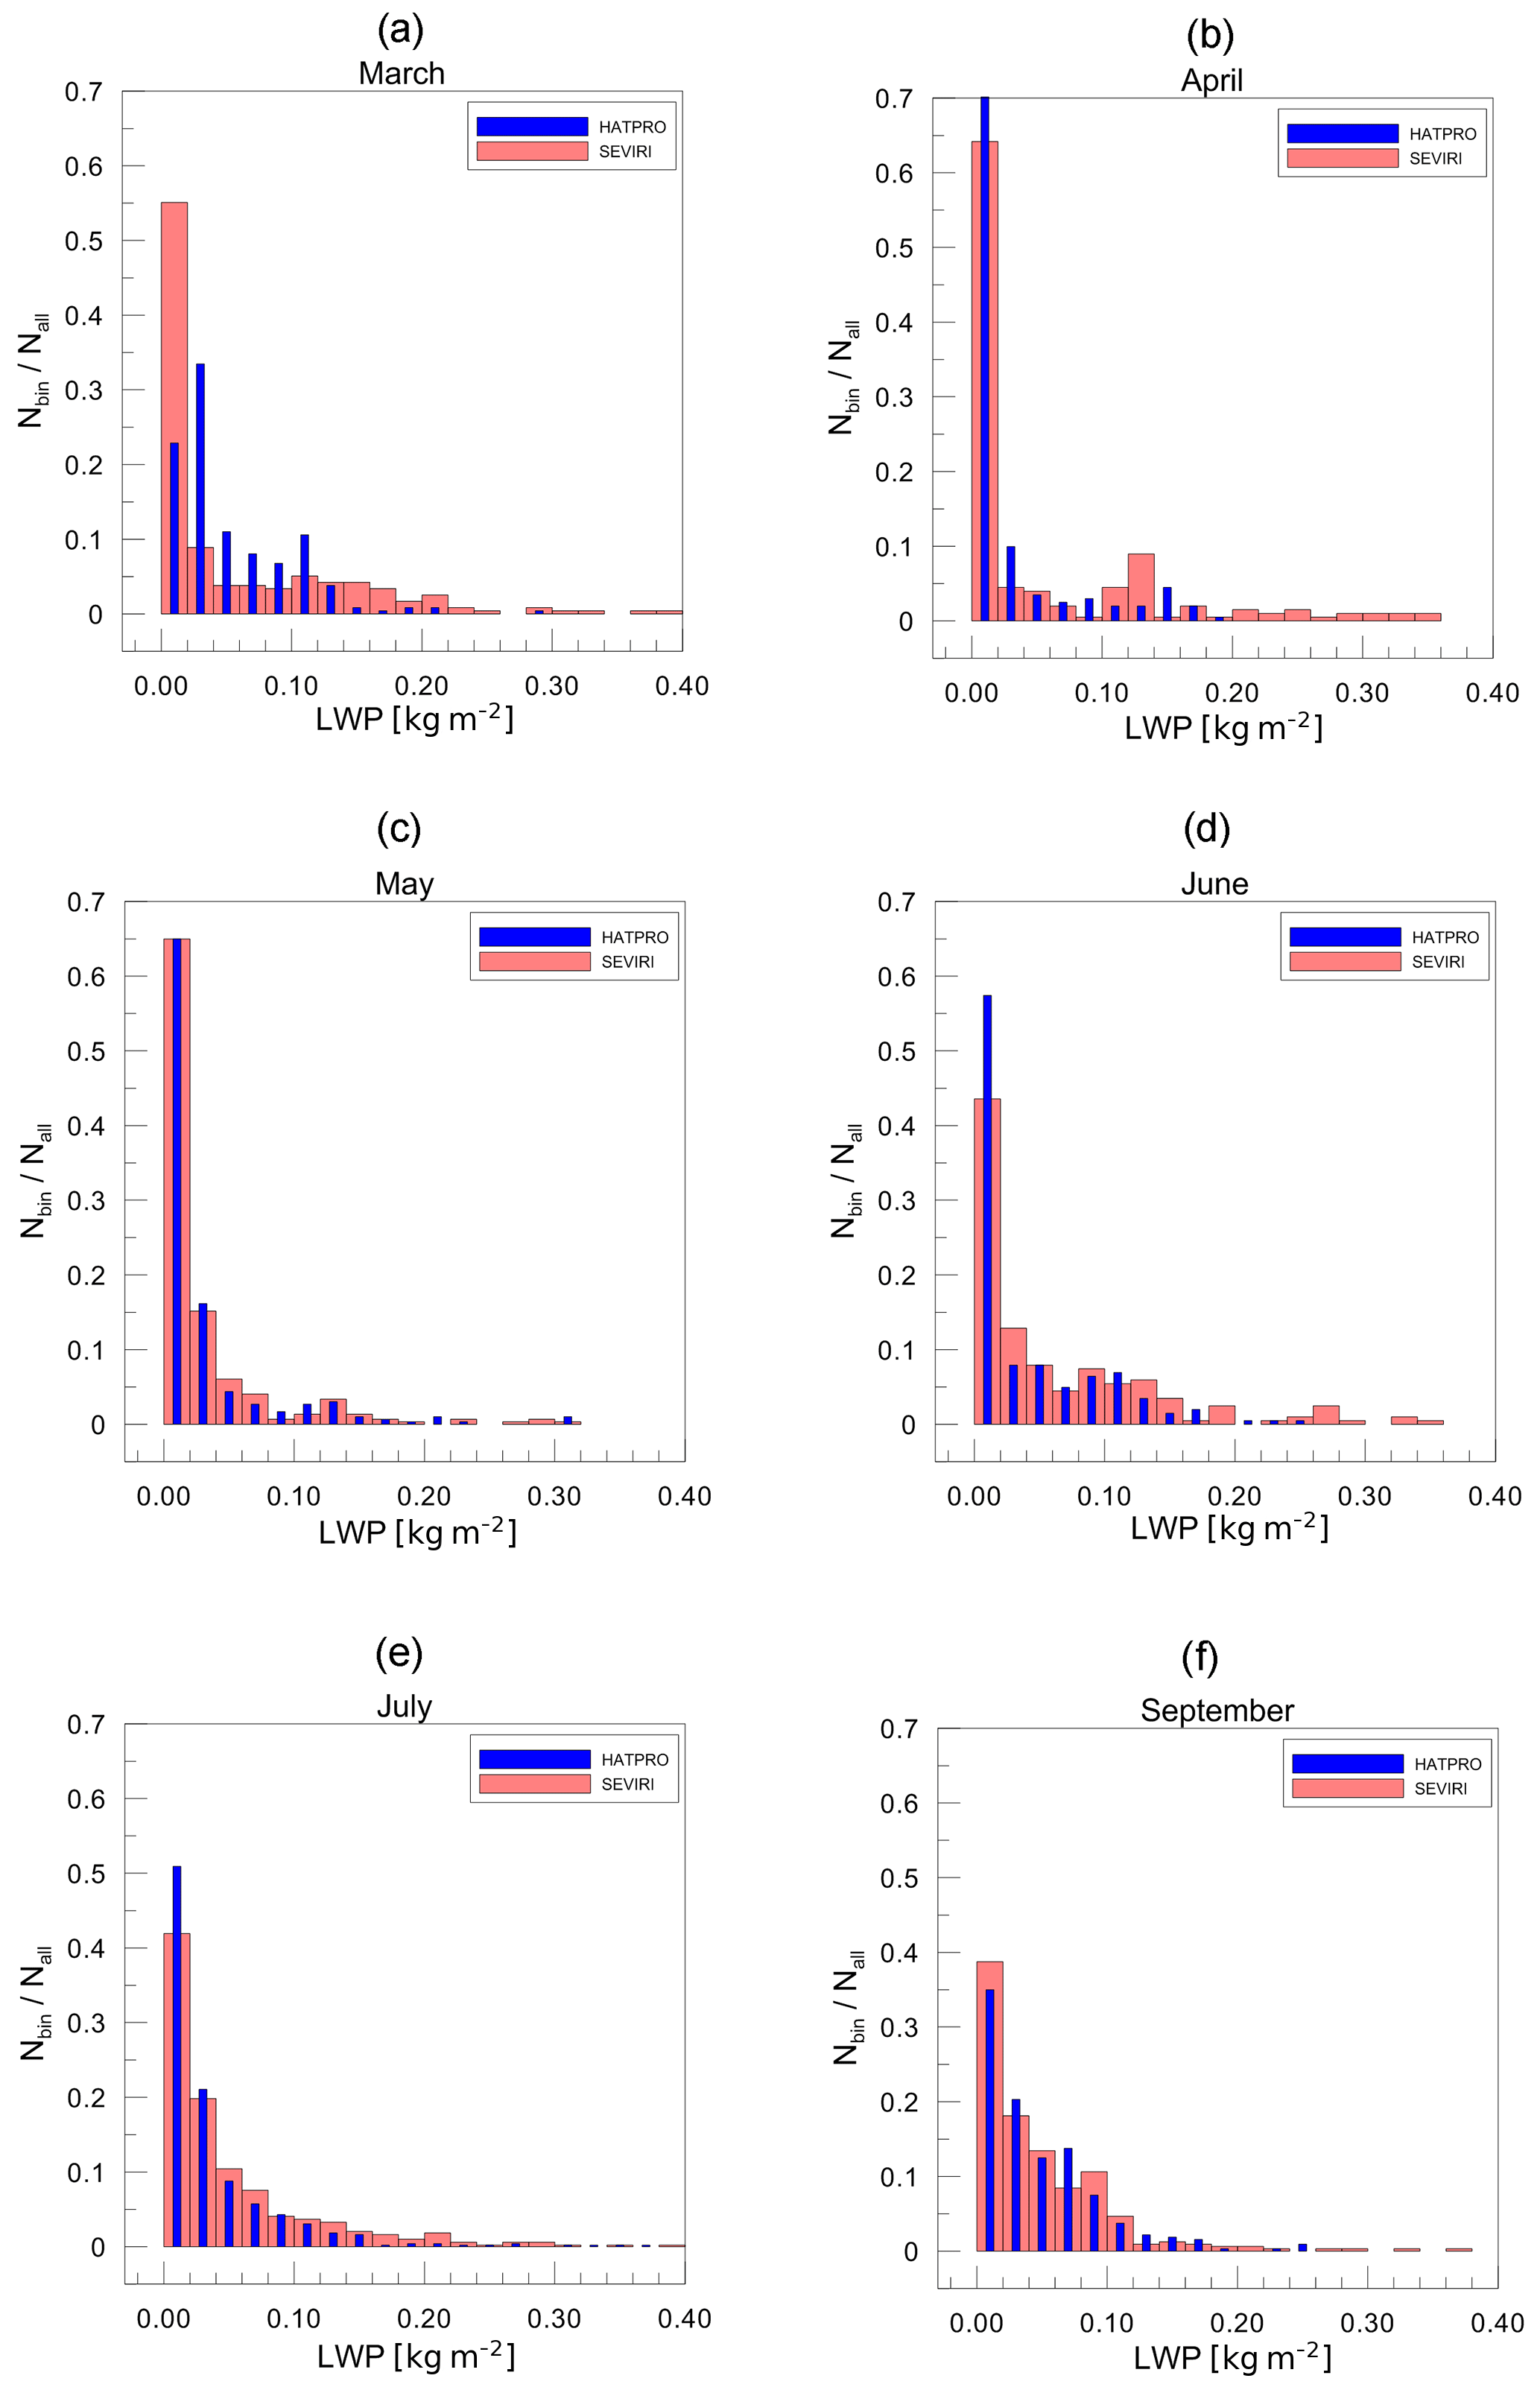
Figure 11Monthly frequency distribution of LWP for HATPRO and SEVIRI normalised with the total number of occurrence. Six months with the largest number of instantaneous measurements are shown.
The distributions do not fall directly into one of the four categories in Kniffka et al. (2014), where all cloud types were characterised with mono-modal distributions; however they do resemble the low-cloud category the most. The average all-disc values range from 0.0672 to 0.0862 kg m−2 (depending on the season), while the average HATPRO (SEVIRI) LWPs amount to 0.0182 (0.0274) and 0.0243 (0.0310) kg m−2 for the cold, dry period and the warm, humid period. The climate of St Petersburg is maritime, where low stratiform clouds occur most frequently. Thicker, presumably convective, clouds with LWP > 0.1 kg m−2 form the secondary maximum in the distributions and occur in both periods (at the end of the CD period and at the beginning of the WH period).
5.2 Analysis of discrepancies
The distributions of SEVIRI's LWP is shifted to higher values in all months. The secondary maxima are particularly more pronounced than for HATPRO, and the unfavourable observing conditions with a large viewing zenith angle cause large uncertainties. The root mean square error splits into its systematic (σs) and unsystematic (σu) parts following Anand et al. (1991) and is displayed in Fig. 12. The initial data pairs (SEVIRI, HATPRO) were taken into account if at least one of the data sources provided LWP > 0. As can be clearly seen, the σs dominates the unsystematic fluctuations in all months; the average σs is 0.07 kg m−2, while the σu amounts to 0.03 kg m−2. The σu stays relatively constant over the analysed time period with a standard variation (derived from the monthly σu values) of 0.006 kg m−2; however the σs has a standard deviation of 0.053 kg m−2. The month-to-month variation of σs is about 9 times higher and exhibits a clear seasonal cycle with the smallest values in February and March, then the highest values from April to June and smaller values again from July to October. This result is unexpected because the summer months allow for the best viewing conditions for the SEVIRI and therefore the error should be smallest. However, the error could increase in summer due to high variability of convective clouds, which reduces the representativeness of the HATPRO measurements for the SEVIRI pixel and complicates the comparison in contrast to situations with more stratiform conditions that are typically more frequent in winter. The detailed discussion of the problem of representativeness can be found in the paper by Slobodda et al. (2015). In this study, the SEVIRI retrieval produces some unrealistically high values of LWP mainly in the months April, May and June (up to 2.5 kg m−2), which influence the RMSE to a large extent. In April, 1.1 % of the SEVIRI measurements showed LWP > 0.7 kg m−2, which did not occur in the HATPRO measurements at all.
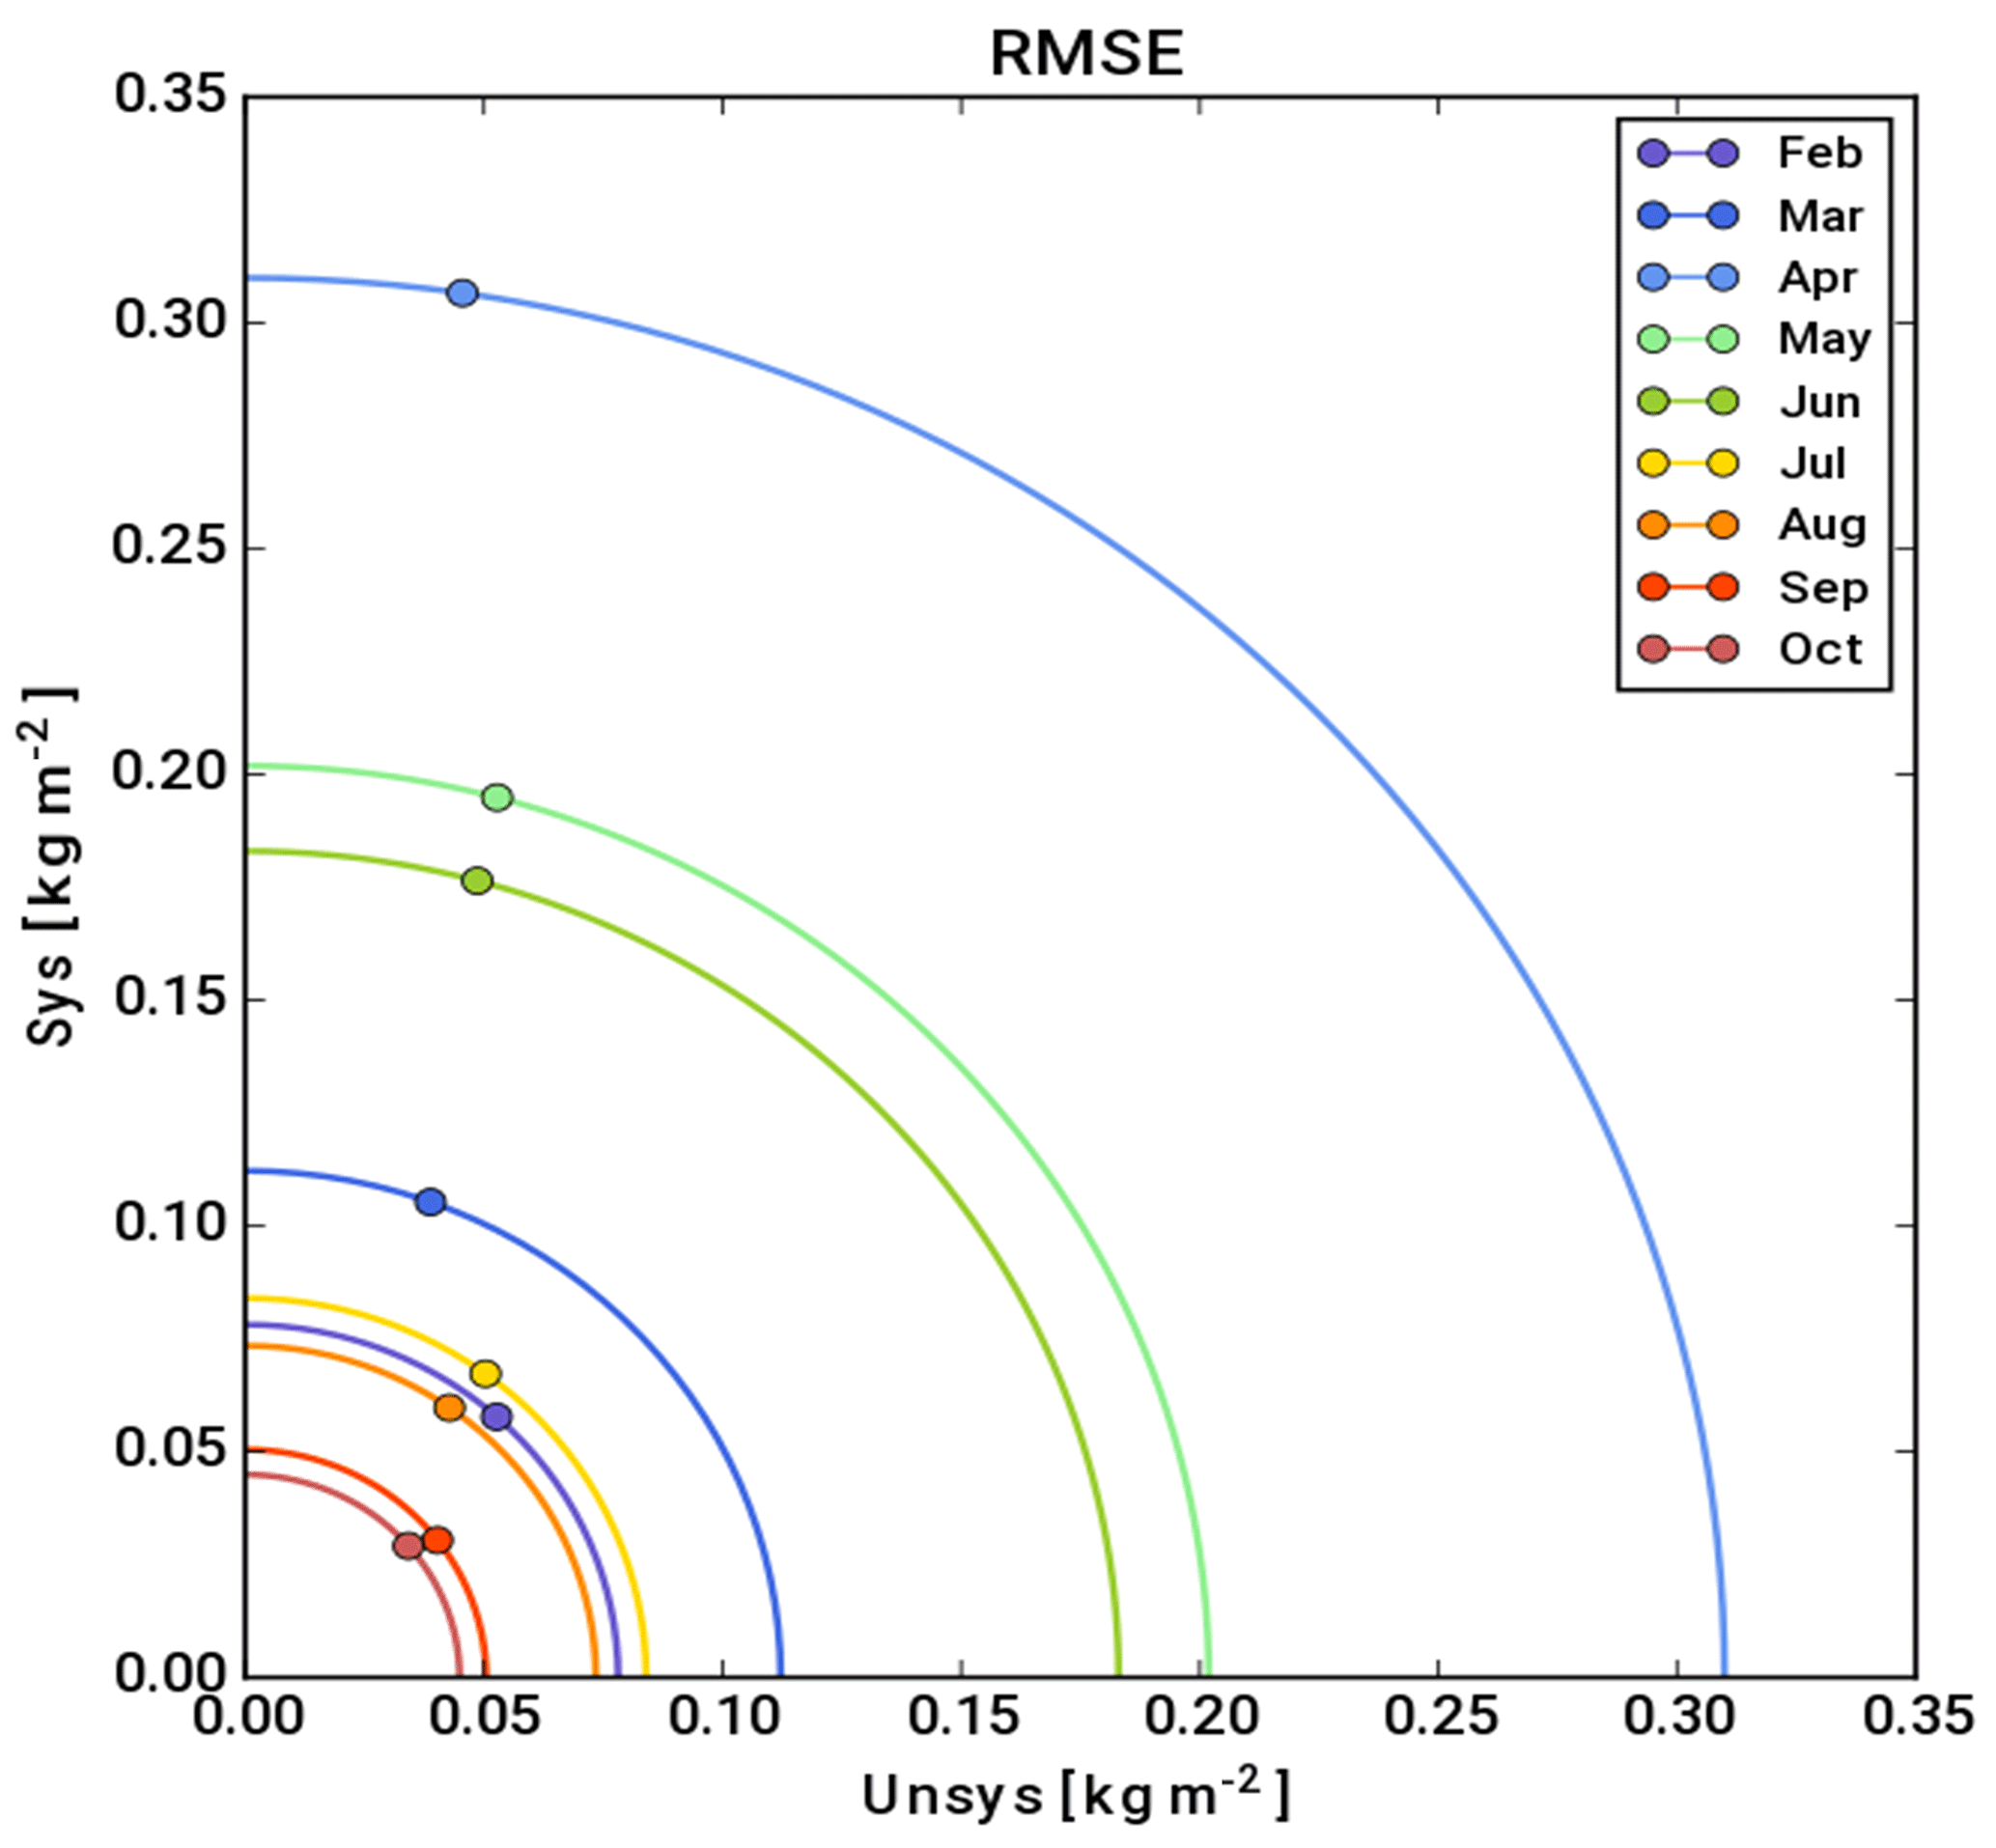
Figure 12Root mean square error divided into systematic and unsystematic parts for all months. The radii of the circles correspond to the monthly averaged RMSE values. Blue colours represent the cold and dry period; warm colours represent the warm and humid period.
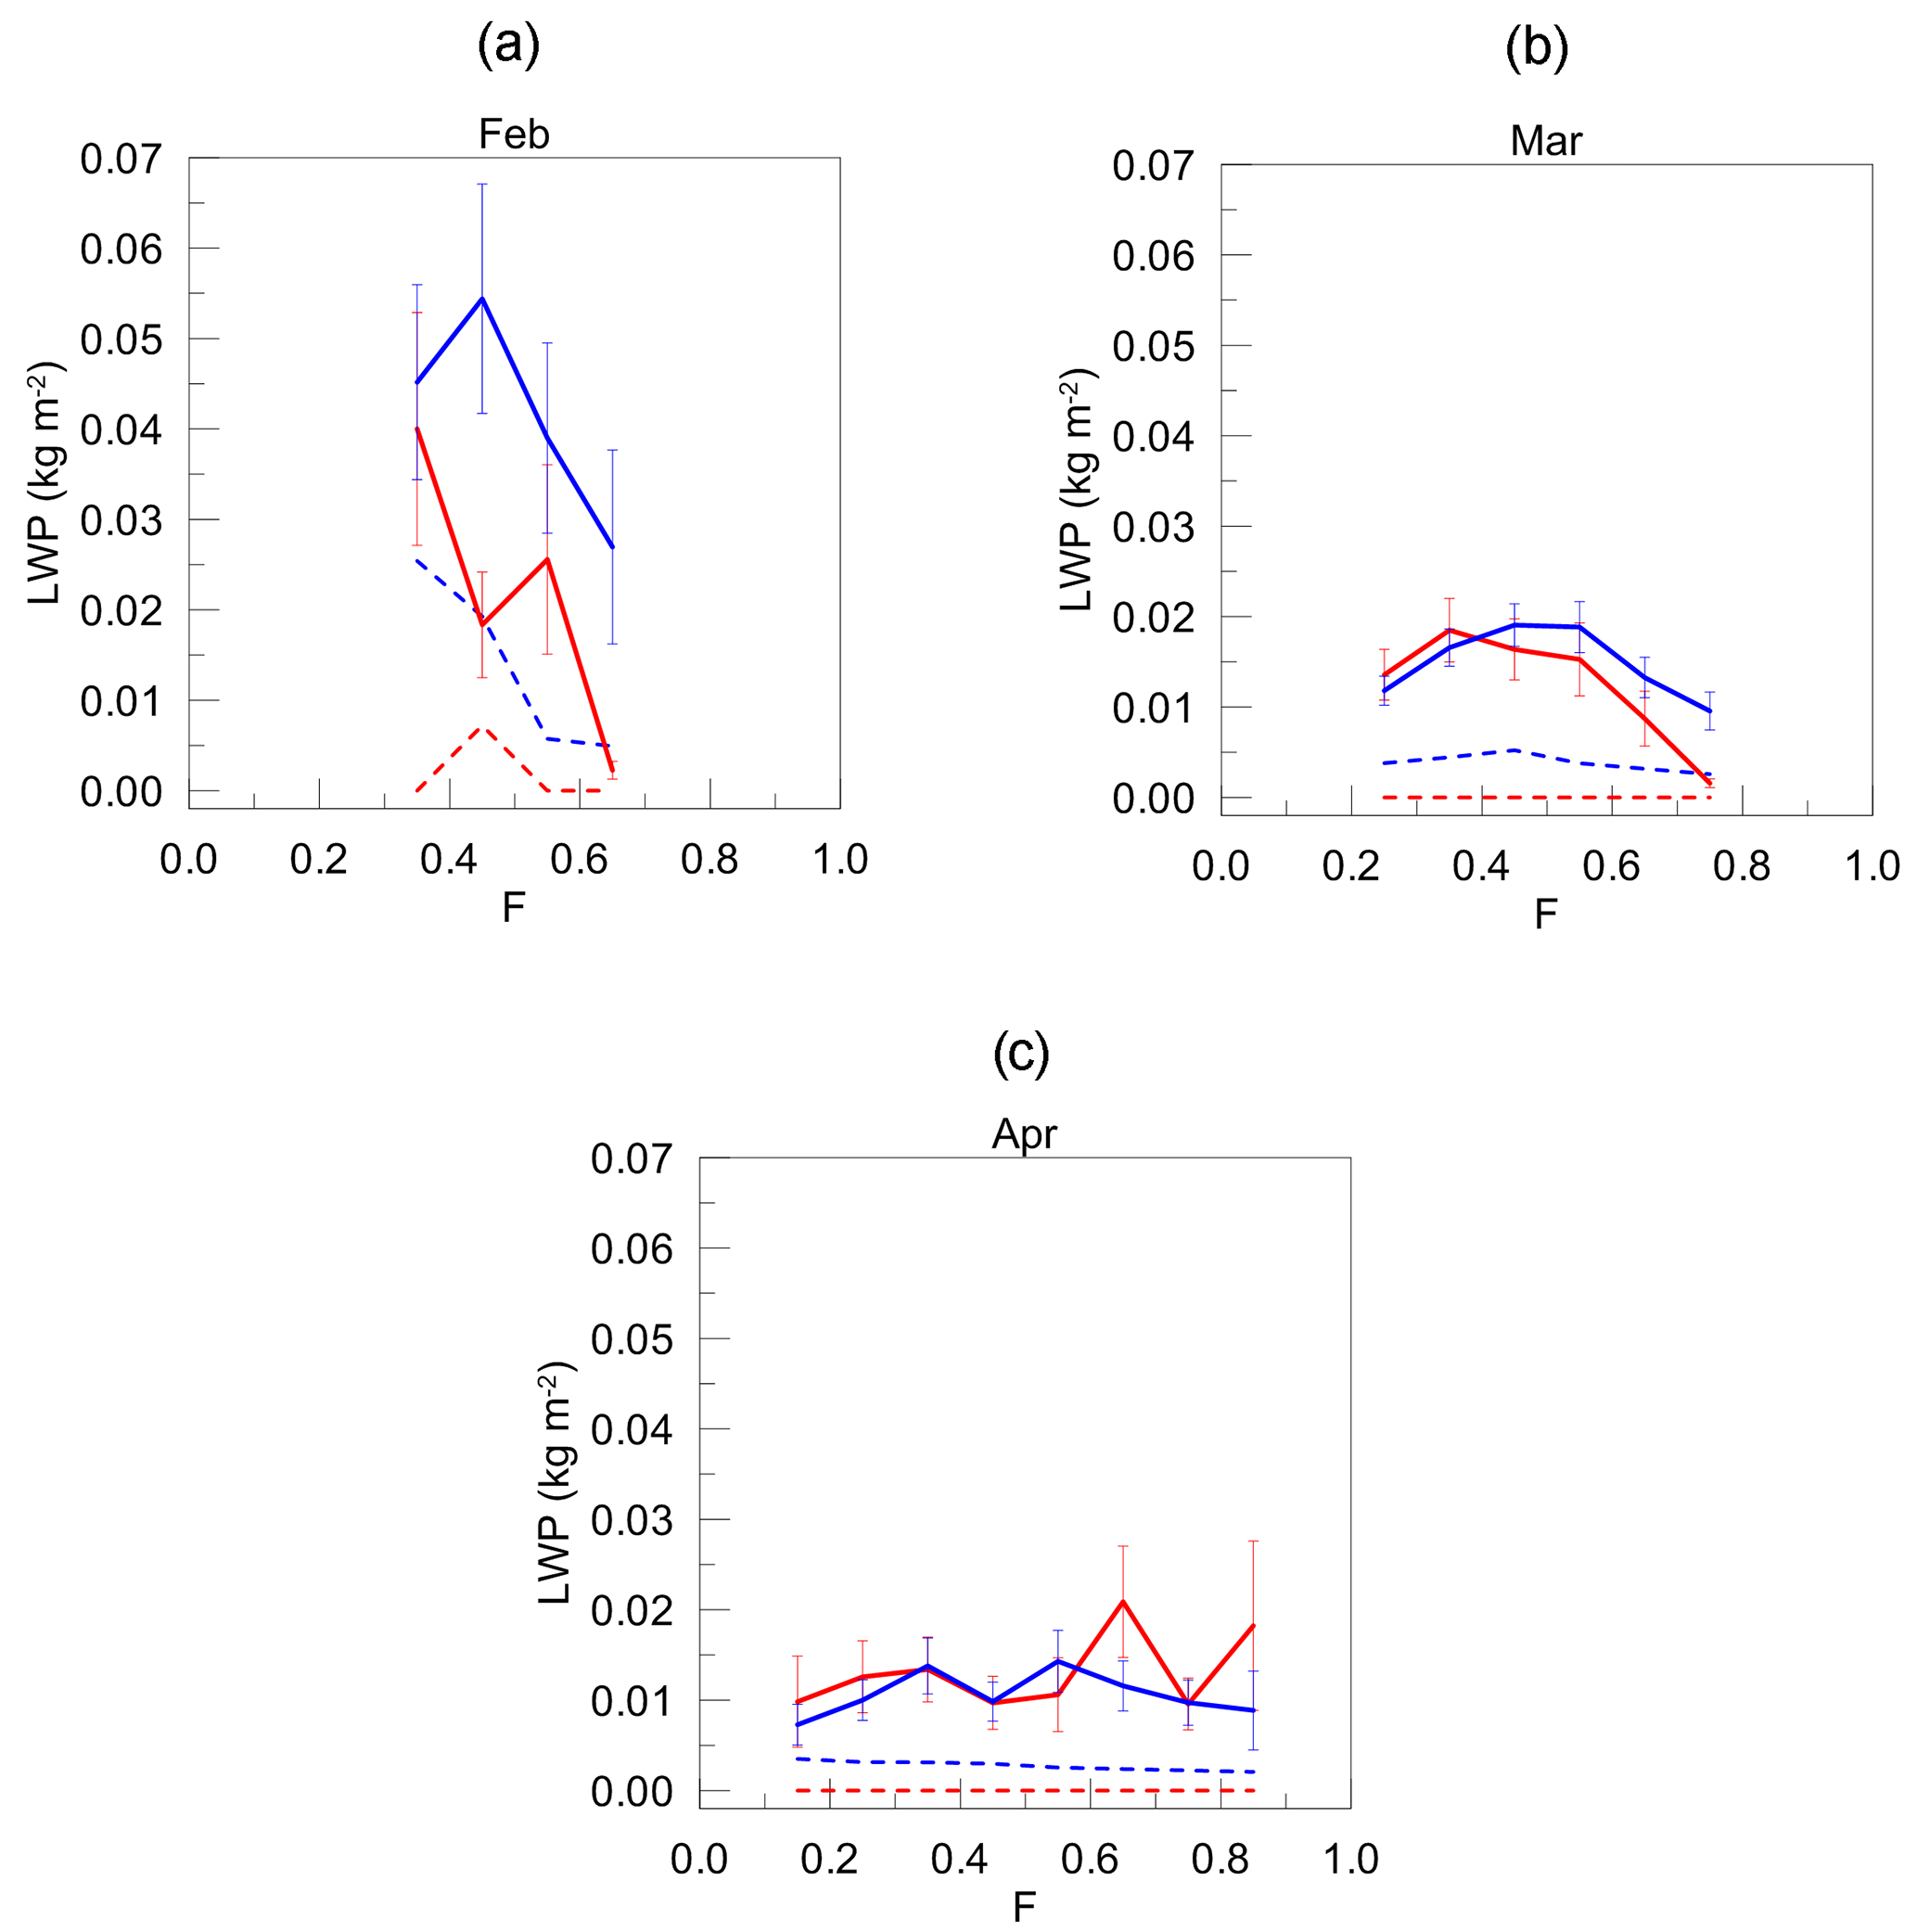
Figure 13The mean (solid) and the median (dashed) LWP retrieved from HATPRO (blue) and SEVIRI (red) as a function of a fraction of a day F for February, March and April (the CD ensemble data), where the fraction of a day is a normalised period between SZA = 90∘ in the morning (F = 0) and SZA = 90∘ in the evening (F = 1). Error bars denote the standard deviation of the mean values.
The sources of systematic and unsystematic discrepancies are multiple. They may be related to the retrieval algorithms, time-averaging parameters of HATPRO data, viewing conditions of SEVIRI and also to weather conditions, type, height, spatial and temporal evolution of clouds, and the magnitude of the parallax effect. The analysis of the details of retrieval algorithms is beyond the scope of the present study. The variation in the averaging period was shown to have a minor influence on the comparison results. Therefore, while making the analysis we focused on weather and cloudiness conditions provided by the SEVIRI observations simultaneously with LWP data. The cases of the unrealistically high LWP values obtained by SEVIRI were analysed in detail and it was found that the corresponding clouds are all of type supercooled, the assigned cloud optical thickness value is quite often 100 and the effective radius of the droplets is rather big. The cloud top height did not show anything specific; clouds were between 2600 and 9800 m. The quality mask revealed no abnormal situations: solar illumination was good, viewing conditions were fine, the input from numerical weather prediction showed no low-level inversion and all measurement channels were present. On the basis of this information, we suggest that the possible supercooled clouds with simultaneously very high effective radii can indicate the presence of erroneous retrieval results. According to the retrieval algorithm, clouds are marked as supercooled if the probability of ice is lower than 0.5 and the temperature is below 273 K. One can suppose that our cases of unrealistically high LWP values obtained by SEVIRI are misclassified ice clouds. This idea is also in line with the high effective radii.
The diurnal cycle of LWP is an important characteristic which is necessary for numerical models, since clouds have a strong influence on the Earth's radiation budget. Both considered instruments are capable of registering the diurnal cycle. HATPRO operates at day and night. The SEVIRI observations are limited by the condition SZA < 72∘, so for sub-Arctic territories the observation period during a day differs greatly depending on the season. Figures 13 and 14 present the mean and the median LWP values as a function of a fraction of a day F, where the fraction of a day is a normalised period between SZA = 90∘ in the morning (F=0) and SZA = 90∘ in the evening (F=1). This period was divided into 10 subintervals. All LWP values less than 0.4 kg m−2 falling within each subinterval during selected month of the years 2013 and 2014 were used as a source for calculations of mean and median values corresponding to a subinterval. The reason for the given upper limit for LWP is the fact that the value 0.4 kg m−2 was reported earlier as a threshold LWP between a non-rainy and rainy atmosphere (Maetzler, 1992). Subintervals with a number of measurements less than 10 were excluded from analysis. We see that due to the limitations of the SEVIRI observations the shortest diurnal cycles are in February, March and October with 40 %, 60 % and 60 % of the daylight correspondingly. It is necessary to remember that the initial data sets consist of rain-free days only; therefore the analysed diurnal cycles do not present an overall estimate but only the subset of purely liquid clouds during rain-free days.
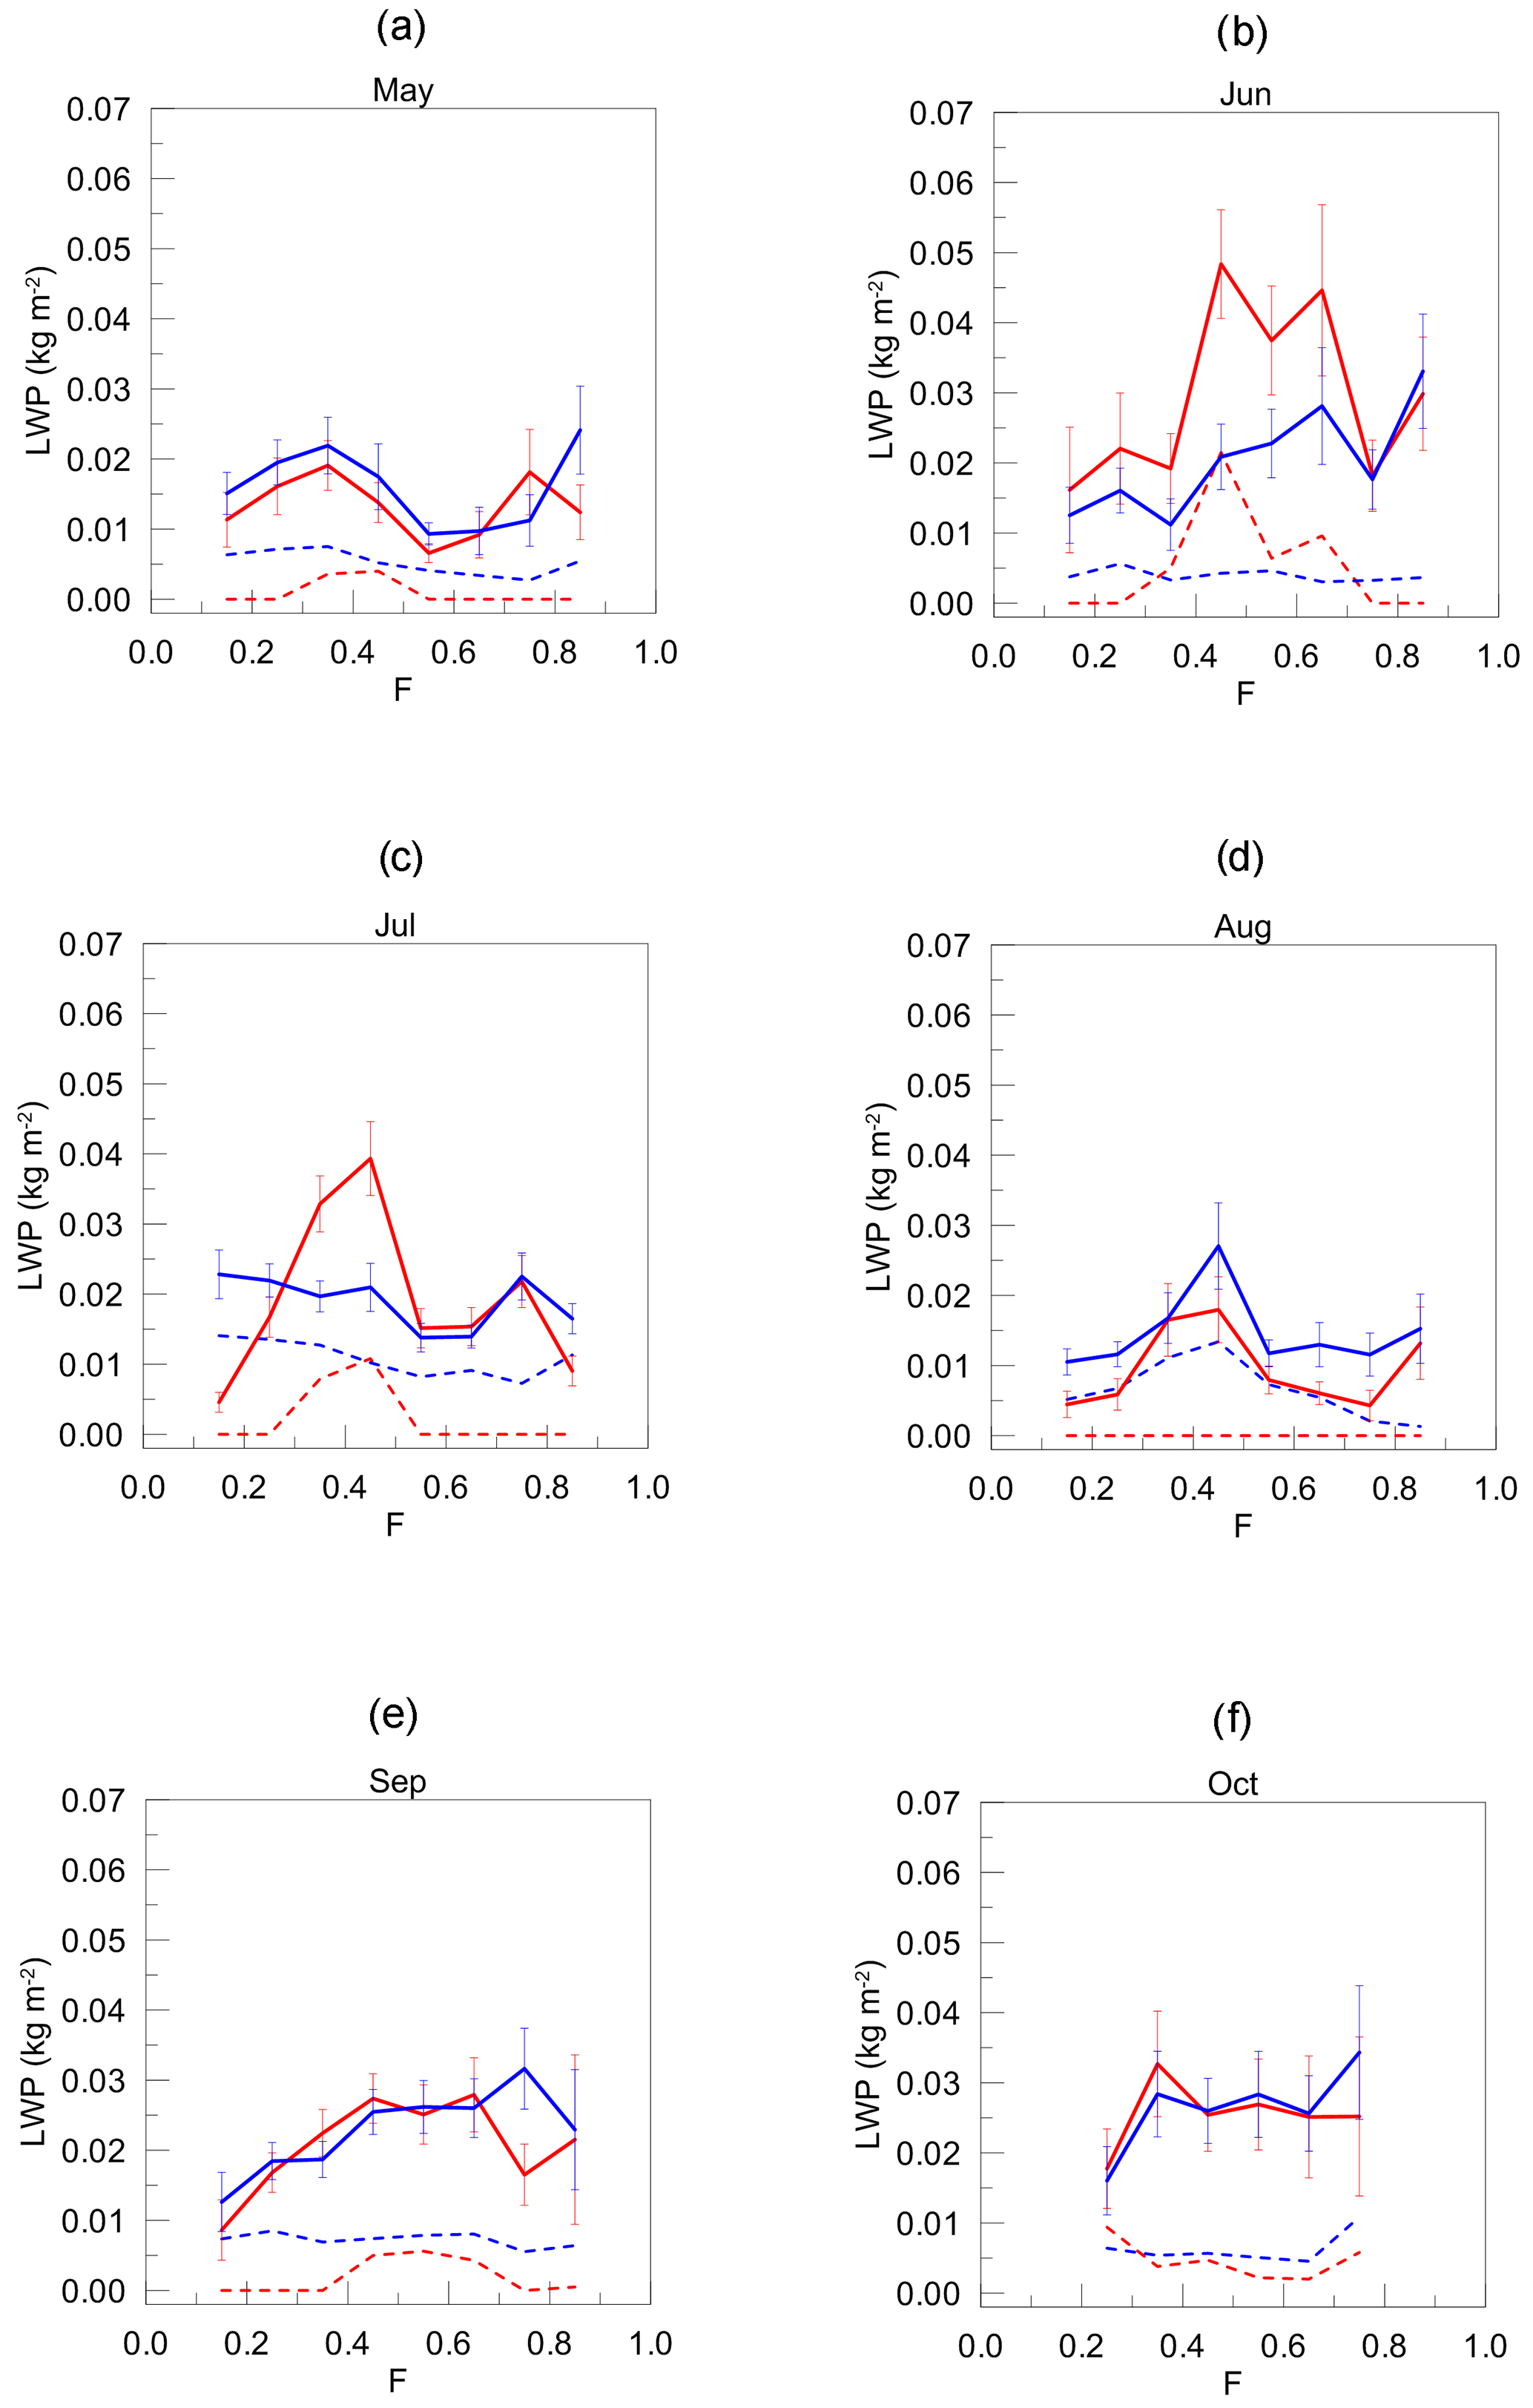
Figure 14The mean (solid) and the median (dashed) LWP retrieved from HATPRO (blue) and SEVIRI (red) as a function of a fraction of a day F for May, June, July, August, September, and October (the WH ensemble data), where the fraction of a day is a normalised period between SZA = 90∘ in the morning (F = 0) and SZA = 90∘ in the evening (F = 1). Error bars denote the standard deviation of the mean values.
First, we would like to pay attention to the fact that the comparison of median values gives an impression of the lack of agreement between the HATPRO and the SEVIRI data. At the same time, good agreement is clearly seen for several months if the mean values are considered. For many cases the SEVIRI median LWP is lower than the corresponding HATPRO results and exactly equal to zero, while HATPRO shows some variations of median LWP. We suggest two possible reasons for that: (1) the relatively low number of source data and (2) the underestimation of small LWP values by SEVIRI (zero LWP output in cases when HATPRO detects low LWP). We restrict further analysis only to mean LWP values and omit the word “mean” for simplicity.
For the cold and dry season, the LWP diurnal cycles obtained by the two instruments agree very well for March and April. For most subintervals, the discrepancy is less than the sum of standard deviations of the mean LWP values. For February, there is only a qualitative agreement – the decrease in LWP during the observational period was detected by both instruments.
For the warm and humid season, the LWP diurnal cycles obtained by the two instruments agree very well for 4 months: May, August, September and October. For June and July, the two instruments revealed very large differences in LWP in the first half of a day but showed similar LWP cycles for F>0.7 and F>0.5 for June and July correspondingly.
One can see that the detected LWP cycles differ from month to month. Some common feature can be noticed for the summer months: the SEVIRI instrument detected two maxima – the higher one at about noon and the lower one in the evening. A possible reason for the first maximum could be the developing convection. For other months it is difficult to propose any simple explanations of the LWP cycle and to conclude whether these cycles are typical for the considered months or not. Concluding this section, we would like to emphasise the importance of taking into account the interannual variability of diurnal cycles. Our estimations of the interannual variability were based on the reanalysis data and are presented in Appendix B. It was shown that the average diurnal cycles calculated for the period of our study (2013–2014) noticeably differ from cycles obtained for the longer period 2003–2012. Since the temporal and spatial resolutions of the reanalysis data are considerably coarser than of the SEVIRI and HATPRO data, the direct comparison of diurnal cycles is not possible.
Liquid water path is one of the key parameters of clouds that are urgently needed for a variety of studies relevant to climate modelling at northern latitudes. The LWP measurements taken by the ground-based microwave radiometer RPG-HATPRO (Radiometer Physics GmbH – Humidity And Temperature PROfiler) functioning at the measurement site of St Petersburg State University, Russia, and taken by the SEVIRI (Spinning Enhanced Visible and Infrared Imager) satellite instrument over the area in the vicinity of St Petersburg (60∘ N, 30∘ E) were compared. The geographical area under investigation can be considered to belong to the sub-Arctic region of Europe (the latitude range 50–70 ∘). The time period of selected data sets spans 2 years (December 2012–November 2014), excluding winter months, since the specific requirements for SEVIRI observations restrict measurements at northern latitudes in winter when the solar zenith angle is too large.
High-quality ground-based MW measurements were taken as the main criterion for the data selection procedure and 210 rain-free observation days were selected for comparison. Purely liquid clouds were considered, and the control was done using the cloud-phase parameter of the SEVIRI data. The ground-based and satellite data were synchronised and divided into two data sets corresponding to two seasons: cold and dry (December–April) and warm and humid (May–October). The original data provided by the HATPRO instrument were time averaged in order to conform to the 1 pixel measurement by the SEVIRI instrument.
The results of the comparison of the LWP values retrieved from the HATPRO and SEVIRI observations in the vicinity of St Petersburg have shown the following.
There is no influence either of the sampling interval (10 or 120 s) or of the averaging period (20 or 60 min) of the original HATPRO data on the results of the HATPRO–SEVIRI data comparisons. (The given values of the averaging period correspond to the values of advection velocity of about 6 and 2 m s−1.)
There are two site-specific features. First, the land–sea gradient of LWP is clearly revealed by the satellite observations. The magnitude of the land–sea difference for mean LWP values calculated for a 2-year period is about 0.040 kg m−2, which is about 50 % relative to the mean value over land. The radiometer site is located close to the coastline of the Gulf of Finland in the area of large LWP spatial gradients. The parallax effect of the satellite observations was estimated at about 3 km in terms of the displacement to the northerly direction. It can be compensated by linear interpolation of two pixels from the SEVIRI measurements. Taking into account the estimated considerable values of the parallax effect and the land–sea LWP gradient, one can come to the conclusion that the combination of both in specific cases can influence the results of the comparison of the SEVIRI and the HATPRO data. The second site-specific feature is the high-latitude location of the radiometer site and the large pixel size at this high latitude. That resulted in the lack of SEVIRI measurements in the cold and dry season.
Case studies of the instantaneous measurements revealed that a possible reason for very large occasional discrepancies between the HATPRO and SEVIRI data is local rainfall events in the vicinity of the radiometer site which are not detected by the rain sensor attached to the radiometer but which appear in the field of view of the satellite instrument. The SEVIRI algorithm misclassification of the ice clouds as supercooled water clouds can be another reason for the discrepancies. Therefore, we focused on the analysis of the median instead of instantaneous values. The comparison of the daily median LWP values demonstrated the rms difference of 0.016 kg m−2 for a warm season, which is considerably lower than the rms difference for a cold season, which is 0.048 kg m−2. The daily median values averaged over the data sets constitute 0.017 and 0.02 kg m−2 for WH and CD data sets correspondingly. The bias is very small and it is negative for the WH season and positive for the CD season.
The frequency distributions of both SEVIRI and HATPRO show that the average LWP is low compared to all-disc LWP distributions obtained by the SEVIRI instrument in previous studies. The distributions are log-normal and have a bimodal structure, which can be seen particularly in the months of February and September. The distributions do not fall directly into one of the four categories in Kniffka et al. (2014), where all cloud types where characterised with mono-model distributions; however they do resemble the low-cloud category the most.
The systematic difference between LWP obtained by HATPRO and SEVIRI dominates over the unsystematic discrepancies in all months. The month-to-month variation of the systematic difference exhibits a clear seasonal cycle with smallest values in February and March, then highest values from April to June and smaller values again from July to October. This result is unexpected because the summer months allow for the best viewing conditions for both HATPRO and SEVIRI, and therefore the error should be smallest. In this study, the SEVIRI retrieval produces some unrealistically high values of LWP mainly in the months April, May and June (up to 2.5 kg m−2), which influence the RMSE to a large extent. In April, 1.1 % of the SEVIRI measurements showed LWP > 0.7 kg m−2, which did not occur in the HATPRO measurements at all. In our opinion, in order to further analyse the reasons for these systematic differences, it would be useful to combine the HATPRO and SEVIRI data with collocated LWP data produced by the AVHRR instrument. Though the LWP measurement over the St Petersburg site is taken by AVHRR only once per day, the size of the ground pixel of AVHRR is smaller than that of SEVIRI and this information would be very helpful.
For the cold and dry season, the LWP diurnal cycles obtained by the two instruments agree very well for March and April. For February, there is only a qualitative agreement. For the warm and humid season, the LWP diurnal cycles obtained by the two instruments agree very well for 4 months: May, August, September and October. For June and July, the two instruments revealed very large differences in LWP in the first half of a day. Some common feature can be noticed for the summer months: the SEVIRI instrument revealed two maxima – the higher one at about noon and the lower one in the evening. A possible reason for the first maximum can be the developing convection. For other months it is difficult to propose any simple explanation of the LWP cycle and to conclude whether these cycles are typical for considered months or not.
In order to represent the diurnal evolution of LWP, the reanalysis data were taken into consideration. The outputs of MACC and ERA-Interim data sets averaged over the period of 2003–2012 demonstrated similar daytime LWP evolution. However, averaging the ERA-Interim data over the relatively short period of the present study (2013–2014), produced a different result, pointing to the high interannual LWP changes, which may mask an expected daytime evolution.
As a final conclusion, we briefly name the identified problems relevant to the comparison of HATPRO and SEVIRI measurements of LWP at high latitudes over the complex terrain which includes land and water areas. A more extensive database is needed for comparisons, especially for analysis of the cold and dry season in order to explain, in particular, the differences between the observational and reanalysis-based LWP diurnal cycles. Additionally, the reasons for the occasional very large discrepancies between HATPRO and SEVIRI data have still to be confirmed.
The LWP data derived from the SEVIRI observations are available at https://www.cmsaf.eu. The LWP data derived from the RPG-HATPRO observations at the measurement site of St Petersburg State University are available upon request (please write to Vladimir Kostsov at vlad@troll.phys.spbu.ru).
The median LWP value for CD period is equal to zero over the whole small terrain, which means that clear-sky conditions prevail in selected observations.

Figure A1The maps of the median LWP values (kg m−2, colour scale) calculated for the large terrain (a) and small terrain (b) and for the 2-year period 1 December 2012–30 November 2014 (measurements by the SEVIRI instrument).

Figure A2The map of the median LWP values (kg m−2, colour scale) calculated for the small terrain and for the WH (a) and CD (b) data sets (measurements by the SEVIRI instrument).
In order to evaluate possible diurnal cycles of LWP over St Petersburg, multiannual data of reanalysis were considered. Two data sets were explored, ERA-Interim and MACC, both of which exploited an assimilation of experimental observations and were based on the European Centre for Medium-Range Weather Forecasts' (ECMWF, http://www.ecmwf.int/, last access: 25 September 2018) Integrated Forecast System (IFS). ERA-Interim is the ECMWF reanalysis that covers the period from 1979 to the present time (Dee et al., 2011). MACC (Monitoring Atmospheric Composition and Climate) is a special reanalysis of atmospheric composition that works by assimilating satellite data into a global model, covering the period 2003–2012 (Innes et al., 2013). Both data sets are global, with a spatial resolution of ∼80 km on 60 vertical levels from the surface up to 0.1 hPa. Since MACC is limited to the time period of 2003–2012, we considered the same period for the ERA-Interim data set for compliance. Reanalysis data were extracted over an area of 59.875–60.000∘ N∕29.750–29.875∘ E, enclosing the site of microwave radiometer observations near St Petersburg. To represent the diurnal evolution of LWP, the outputs of MACC and ERA-Interim data sets were averaged over the period of 2003–2012 at a 3 h time step (00:00, 03:00, 09:00, 12:00, 15:00, 18:00 and 21:00 UTC). Examples of derived average diurnal variations in April, July and October are shown in Fig. B1. In general, LWP in April is relatively low (∼0.02 kg m−2), with a weak variation during a day. Averaged over 2003–2012, LWP displays higher values () and stronger variation in July and October, both in MACC and ERA-Interim data sets. Maximum LWP in summer (July) and in autumn (October) occurs in the early afternoon, roughly at ∼ 15:00 LT (up to ). However, the absolute values of average LWP MACC and ERA-Interim data are somewhat different, with a distinctly higher amplitude of summer variation (July), derived from the data of MACC compared to ERA-Interim. These amplitudes, calculated as the difference between the maximum and minimum LWP values for the months from February to October, are presented in Fig. B2. The amplitude of LWP diurnal variation averaged over 2003–2012 is higher in summer, with a maximum in June and July of and when derived from the data of ERA-Interim and MACC, accordingly. Thus, two reanalysis data sets (ERA-Interim and MACC) assume similar daytime LWP evolution over St Petersburg, when averaged in 2003–2012: the maximum in the early afternoon and stronger in summer time (presumably due to the increase in convection). However, if one looks at the ERA-Interim data averaged over the period of our study (2013–2014), this conclusion is no longer so certain (see Fig. B1, bottom plot). Except in April, the average daytime LWP evolution in July and October, averaged over 2013–2014, is very different from the results of reanalysis of ERA-Interim and MACC over 2003–2012. Also, it should be noted that for 2013–2014 the July maximum is at 12:00, while the maximum in October is at 09:00. Besides, the amplitude of LWP diurnal variation is less in 2013–2014 compared to 2003–2012, with no maximum in summer (see Fig. B2). To sum up, the exploration of reanalysis data over St Petersburg reveals the presence of LWP diurnal variation but at the same time points to the high interannual LWP changes, which may mask an expected daytime evolution when averaged over the relatively short period of 2013–2014.

Figure B1The average diurnal LWP variations over St Petersburg in April, July and October, derived from the data of reanalysis: MACC 2003–2012 (a), ERA-Interim 2003–2012 (b) and ERA-Interim 2013-2014 (c).
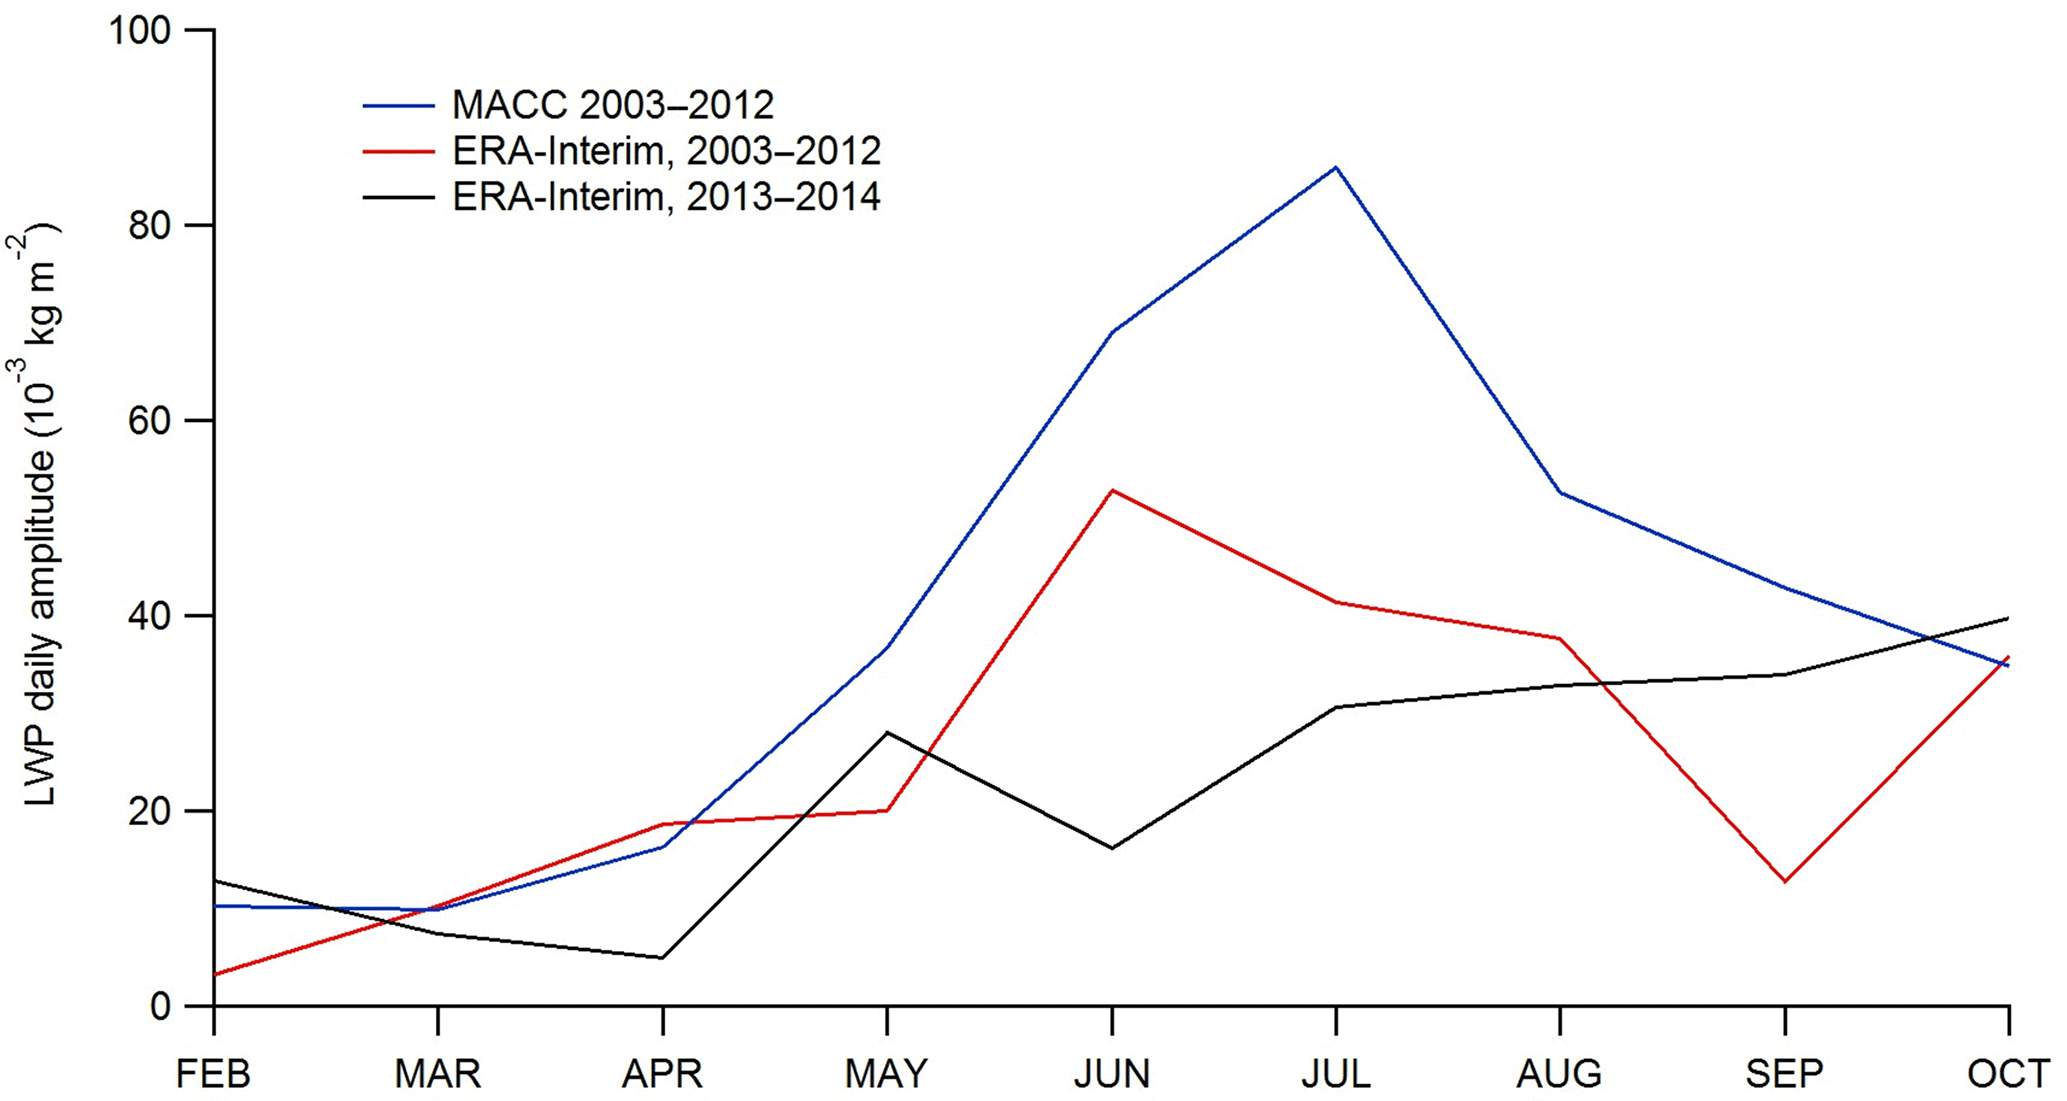
Figure B2The amplitudes of LWP diurnal variation, calculated as a difference between the maximum and minimum LWP values for each month of the year, derived from the data of reanalysis (MACC 2003–2012, ERA-Interim 2003–2012 and ERA-Interim 2013–2014).
VSK and AK conceived the study together. VSK prepared the original draft of the manuscript with contributions from AK and DVI. AK was in charge of the SEVIRI data analysis, DVI was in charge of the analysis of diurnal variations of LWP derived from the experimental data and reanalysis. Together VSK, AK, and DVI interpreted the results, reviewed and edited the manuscript.
The authors declare that they have no conflict of interest.
The operation of the RPG-HATPRO instrument was provided by the Research
Centre GEOMODEL of St Petersburg State University
(http://geomodel.spbu.ru/, last access: 25 September 2018). Microwave
radiometric measurements and data processing were supported by Russian
Science Foundation through the project no. 14-17-00096. Ground-based and
satellite data analyses was supported by Russian Foundation for Basic
Research through the project no. 16-05-00681.
Edited by: Alexander Kokhanovsky
Reviewed by: Darrel Baumgardner and three anonymous referees
Anand, H., Foster, M. S., Krishnamagaru, R., and Passi, R. M.: VERMOD Capabilities, VERMOD 1.0 and Future, Institute for Naval Oceanography, Technical Memo, June 1991, 33 pp., available at: https://ntrl.ntis.gov/NTRL/dashboard/searchResults/titleDetail/ADA239801.xhtml (last access: 25 September 2018), 1991.
Beesley, J. A.: Estimating of the effect of clouds on the arctic surface energy budget, J. Geophys. Res., 105, 10103–10117, 2000.
Benas, N., Finkensieper, S., Stengel, M., van Zadelhoff, G.-J., Hanschmann, T., Hollmann, R., and Meirink, J. F.: The MSG-SEVIRI-based cloud property data record CLAAS-2, Earth Syst. Sci. Data, 9, 415–434, https://doi.org/10.5194/essd-9-415-2017, 2017.
Callaghan, T. V., Bergholm, F., Christensen, T. R., Jonasson, C., Kokfelt, U., and Johansson, M.: A new climate era in the sub-Arctic: Accelerating climate changes and multiple impacts, Geophys. Res. Lett., 37, L14705, https://doi.org/10.1029/2009GL042064, 2010.
Cossu, F., Hocke, K., and Maetzler C.: A 10-Year Cloud Fraction Climatology of Liquid Water Clouds over Bern Observed by a Ground-Based Microwave Radiometer, Remote Sens., 7, 7768–7784, https://doi.org/10.3390/rs70607768, 2015.
Dankers, R. and Christensen, O. B.: Climate change impact on snow coverage, evaporation and river discharge in the sub-arctic Tana basin, Northern Fennoscandia, Climatic Change, 69, 367–392, https://doi.org/10.1007/s10584-005-2533-y, 2005.
Dee, D. P., Uppala, S. M., Simmons, A. J., Berrisford, P., Poli, P., Kobayashi, S., Andrae, U., Balmaseda, M. A., Balsamo, G., Bauer, P., Bechtold, P., Beljaars, A. C. M., van de Berg, L., Bidlot, J., Bormann, N., Delsol, C., Dragani, R., Fuentes, M., Geer, A. J., Haimberger, L., Healy, S. B., Hersbach, H., Hólm, E. V., Isaksen, L., Kållberg, P., Köhler, M., Matricardi, M., McNally, A. P., Monge-Sanz, B. M., Morcrette, J.-J., Park, B.-K., Peubey, C., de Rosnay, P., Tavolato, C., Thépaut, J.-N., and Vitart, F.: The ERA-Interim reanalysis: configuration and performance of the data assimilation system, Q. J. Roy. Meteor. Soc., 137, 553–597, https://doi.org/10.1002/qj.828, 2011.
Elsaesser, G. S., O'Dell, C. W., Lebsock, M. D., Bennartz, R., Greenwald, T. J., and Wentz, F. J.: The Multisensor Advanced Climatology of Liquid Water Path (MAC-LWP), J. Climate, 30, 10193–10210, https://doi.org/10.1175/JCLI-D-16-0902.1, 2017.
Eriksson, C., Omstedt, A., Overland, J. E., Percival, D. B., and Mofjeld, H. O.: Characterizing the European Sub-Arctic Winter Climate since 1500 Using Ice, Temperature, and Atmospheric Circulation Time Series, J. Climate, 20, 5316–5334, https://doi.org/10.1175/2007JCLI1461.1, 2007.
Finkensieper, S., Meirink, J.-F., van Zadelhoff, G.-J., Hanschmann, T., Benas, N., Stengel, M., Fuchs, P., Hollmann, R., and Werscheck, M.: CLAAS-2: CM SAF CLoud property dAtAset using SEVIRI – Edition 2, Satellite Application Facility on Climate Monitoring, https://doi.org/10.5676/EUM_SAF_CM/CLAAS/V002, 88 pp., 2016.
Greenwald, T. J., Bennartz, R., Lebsock, M., and Teixeira, J.: An Uncertainty Data Set for Passive Microwave Satellite Observations of Warm Cloud Liquid Water Path, J. Geophys. Res.-Atmos., 123, 3668–3687, https://doi.org/10.1002/2017JD027638, 2018.
Greuell, W. and Roebeling, R. A.: Toward a Standard Procedure for Validation of Satellite-Derived Cloud Liquid Water Path: A Study with SEVIRI Data, J. Appl. Meteor. Climatol., 48, 1575–1590, https://doi.org/10.1175/2009JAMC2112.1, 2009.
Garrett, T. J. and Zhao, C.: Ground-based remote sensing of thin clouds in the Arctic, Atmos. Meas. Tech., 6, 1227–1243, https://doi.org/10.5194/amt-6-1227-2013, 2013.
Inness, A., Baier, F., Benedetti, A., Bouarar, I., Chabrillat, S., Clark, H., Clerbaux, C., Coheur, P., Engelen, R. J., Errera, Q., Flemming, J., George, M., Granier, C., Hadji-Lazaro, J., Huijnen, V., Hurtmans, D., Jones, L., Kaiser, J. W., Kapsomenakis, J., Lefever, K., Leitão, J., Razinger, M., Richter, A., Schultz, M. G., Simmons, A. J., Suttie, M., Stein, O., Thépaut, J.-N., Thouret, V., Vrekoussis, M., Zerefos, C., and the MACC team: The MACC reanalysis: an 8 yr data set of atmospheric composition, Atmos. Chem. Phys., 13, 4073–4109, https://doi.org/10.5194/acp-13-4073-2013, 2013.
Karlsson, K.: A 10 Year Cloud Climatology Over Scandinavia Derived From NOAA Advanced Very High Resolution Radiometer Imagery, Int. J. Climatol., 23, 1023–1044, https://doi.org/10.1002/joc.916, 2003.
Kniffka, A., Stengel, M., Lockhoff, M., Bennartz, R., and Hollmann, R.: Characteristics of cloud liquid water path from SEVIRI onboard the Meteosat Second Generation 2 satellite for several cloud types, Atmos. Meas. Tech., 7, 887–905, https://doi.org/10.5194/amt-7-887-2014, 2014.
Kostsov, V. S.: Retrieving Cloudy Atmosphere Parameters from RPG-HATPRO Radiometer Data, Izvestiya, Atmos. Ocean. Phys., 51, 156–166, https://doi.org/10.1134/S0001433815020085, 2015a.
Kostsov, V. S.: General approach to the formulation and solution of the multi-parameter inverse problems of atmospheric remote sensing with measurements and constraints of different types, Int. J. Remote Sens., 36, 2973–3004, https://doi.org/10.1080/01431161.2015.1054961, 2015b.
Kostsov, V. S., Timofeyev, Yu. M., Zaitsev, N. A., Poberovsky, A. V., and Osipov, S. I.: Application of the information approach to the analysis of two-year microwave observations of the atmosphere by the RPG-HATPRO radiometer at St. Petersburg University, Int. J. Remote Sens., 37, 3346–3364, https://doi.org/10.1080/01431161.2016.1199060, 2016.
Kostsov, V. S., Ionov, D. V., Biryukov, E. Yu., and Zaitsev, N. A.: Cross-validation of two liquid water path retrieval algorithms applied to ground-based microwave radiation measurements by the RPG-HATPRO instrument, Int. J. Remote Sens., 39, 1–22, https://doi.org/10.1080/01431161.2017.1404163, 2018.
Lohmann, U. and Neubauer, D.: The importance of mixed-phase and ice clouds for climate sensitivity in the global aerosol-climate model ECHAM6-HAM2, Atmos. Chem. Phys., 18, 8807–8828, https://doi.org/10.5194/acp-18-8807-2018, 2018.
Maetzler, C.: Ground-based observations of atmospheric radiation at 5, 10, 21, 35, and 94 GHz, Radio Sci., 27, 403–415, 1992.
Maetzler, C. and Morland, J.: Refined Physical Retrieval of Integrated Water Vapor and Cloud Liquid for Microwave Radiometer Data, IEEE T. Geosci. Remote, 47, 1585–1594, https://doi.org/10.1109/TGRS.2008.2006984, 2009.
Meijgaard, E. and Crewell, S.: Comparison of model predicted liquid water path with ground-based measurements during CLIWA-NET, Atmos. Res., 75, 201–226, https://doi.org/10.1016/j.atmosres.2004.12.006, 2005.
Meirink, J. F., Roebeling, R. A., and Stammes, P.: Inter-calibration of polar imager solar channels using SEVIRI, Atmos. Meas. Tech., 6, 2495–2508, https://doi.org/10.5194/amt-6-2495-2013, 2013.
Mellander, P.-E., Lofvenius, M. O., and Laudon, H.: Climate change impact on snow and soil temperature in boreal Scots pine stands, Climatic Change, 85, 179–193, https://doi.org/10.1007/s10584-007-9254-3, 2007.
Roebeling, R. A., Deneke, H. M., and Feijt, A. J.: Validation of cloud liquid water path retrievals from SEVIRI using one year of CloudNET observations, J. Appl. Meteorol. Clim., 47, 206–222, https://doi.org/10.1175/2007JAMC1661.1, 2008a.
Roebeling, R. A., Placidi, S., Donovan, D. P., Russchenberg, H. W. J., and Feijt, A. J.: Validation of liquid cloud property retrievals from SEVIRI using ground-based observations, Geophys. Res. Lett., 35, L05814, https://doi.org/10.1029/2007GL032115, 2008b.
Rose, T., Crewell, S., Löhnert, U., and Simmer, C.: A Network Suitable Microwave Radiometer for Operational Monitoring of the Cloudy Atmosphere, Atmos. Res., 75, 183–200, 2005.
Slobodda, J., Hünerbein, A., Lindstrot, R., Preusker, R., Ebell, K., and Fischer, J.: Multichannel analysis of correlation length of SEVIRI images around ground-based cloud observatories to determine their representativeness, Atmos. Meas. Tech., 8, 567–578, https://doi.org/10.5194/amt-8-567-2015, 2015.
Stengel, M., Kniffka, A., Meirink, J. F., Lockhoff, M., Tan, J., and Hollmann, R.: CLAAS: the CM SAF cloud property data set using SEVIRI, Atmos. Chem. Phys., 14, 4297–4311, https://doi.org/10.5194/acp-14-4297-2014, 2014.
Zhang, T., Stamnes, K., and Bowling, S. A.: Impact of clouds on surface radiative fluxes and snowmelt in the Arctic and Subarctic, J. Climate, 9, 2110–2123, 1996.
- Abstract
- Introduction
- Data set description
- Data overview: LWP differences over sea and land
- Case study
- Statistical LWP assessment
- LWP diurnal cycle analysis
- Summary and conclusion
- Data availability
- Appendix A: The median LWP maps for the large and small terrains
- Appendix B: The diurnal cycle interannual variability as derived from reanalysis data
- Author contributions
- Competing interests
- Acknowledgements
- References