the Creative Commons Attribution 4.0 License.
the Creative Commons Attribution 4.0 License.
Experiments with CO2-in-air reference gases in high-pressure aluminum cylinders
Michael F. Schibig
Duane Kitzis
Pieter P. Tans
Long-term monitoring of carbon dioxide (CO2) in the atmosphere is key for a better understanding of the processes involved in the carbon cycle that have a major impact on further climate change. Keeping track of large-scale emissions and removals (sources and sinks) of CO2 requires very accurate measurements. They all have to be calibrated very carefully and have to be traceable to a common scale, the World Meteorological Organization (WMO) CO2 X2007 scale, which is maintained by the National Oceanic and Atmospheric Administration (NOAA) Earth System Research Laboratory (ESRL) in Boulder, CO, USA. The international WMO GAW (Global Atmosphere Watch) program sets as compatibility goals for the required agreement between different methods and laboratories ±0.1 µmol mol−1 for the Northern Hemisphere and ±0.05 µmol mol−1 for the Southern Hemisphere. The reference gas mixtures used to pass down and distribute the scale are stored in high-pressure aluminum cylinders. It is crucial that the standards remain stable during their entire time of use. In this study the tested vertically positioned aluminum cylinders showed similar CO2 enrichment during low-flow conditions (0.3 L min−1), which are similar to flows often used for calibration gases in practical applications. The average CO2 enrichment was 0.090±0.009 µmol mol−1 as the cylinder was emptied from about 150 to 1 bar above atmosphere. However, it is important to note that the enrichment is not linear but follows Langmuir's adsorption–desorption model, where the CO2 enrichment is almost negligible at high pressures but much more pronounced at low pressures. When decanted at a higher rate of 5.0 L min−1 the enrichment becomes 0.22±0.05 µmol mol−1 for the same pressure drop. The higher enrichment is related to thermal diffusion and fractionation effects in the cylinder, which were also dependent on the cylinder's orientation and could even turn negative. However, the low amount of CO2 adsorbed on the cylinder wall and the fact that the main increase happens at low pressure lead to the conclusion that aluminum cylinders are suitable to store ambient CO2-in-dry-air mixtures provided they are not used below 20 bar. In cases where they are used in high-flow experiments that involve significant cylinder temperature changes, special attention has to be paid to possible fractionation effects.
- Article
(10233 KB) - Full-text XML
- BibTeX
- EndNote
The amount of the emissions in combination with the radiative forcing makes carbon dioxide (CO2) the most important anthropogenic greenhouse gas (GHG) (Hofmann et al., 2006; IPCC, 2013). CO2 exchanges rapidly between the atmosphere, oceans and terrestrial biosphere (the “fast exchange”) and it exchanges very slowly with carbonate rocks. The current combustion of coal, oil and natural gas constitutes a large-scale transformation of fossilized organic matter to CO2 gas that is now overwhelming natural exchange processes. The CO2 emissions are practically irreversible; removal from the atmosphere and oceans by natural sedimentation and erosion will take thousands of years. The fast exchange implies that not only does CO2 influence climate, but the oceans as well as the terrestrial biosphere can gain or lose carbon as climate change unfolds, which is often called the “carbon–climate feedback”. This feedback constitutes a major uncertainty for climate projections. We need to create an accurate record of changing sources and sinks to the atmosphere in order to diagnose and quantify these feedbacks as they occur.
Downwind of a source region atmospheric CO2 is enhanced relative to upwind. However such enhancements/depletions due to regional sources/sinks are typically very small on regional to continental scales, so that long-term monitoring with very accurate measurements is necessary. Small systematic errors between measurement stations can lead to misassignment of sources or sinks; noisy measurements might obscure interesting signals that could help to identify processes and calculate their contribution to the carbon cycle (e.g., Masarie et al., 2011). High-quality measurements start with careful calibrations, preferably traceable to the International System of Units (SI), or, if not possible as in the case of isotopic ratios, to an artifact chosen by convention (e.g., Vienna Pee Dee Belemnite, VPDB, for 13C ∕ 12C). Within the World Meteorological Organization (WMO) Global Atmosphere Watch (GAW) network, GHGs traceability is maintained by the use of a unique hierarchy of CO2-in-(dry)-air mixtures (and similarly for CH4, N2O) in high-pressure cylinders. The hierarchy starts from the primary standards (with link to SI) to secondaries and tertiaries, all with known CO2 mole fraction derived from the higher level, ultimately calibrating the instrument making air measurements. Careful calibration procedures make the result independent of which instrument or method is used. The resulting data stand on their own; they do not depend on models or a priori estimates and assumptions and are unbiased within a known uncertainty range.
The World Meteorological Organization coordinates GHG measurements around the world, through its Global Atmosphere Watch program, and during biannual meetings of the international participating laboratories (the community) goals have been set for the level of compatibility between different stations. The community recommends the WMO CO2 X2007 scale (WMO, 2016), and they defined a compatibility goal of ±0.1 µmol mol−1 (1 standard deviation) for CO2 datasets of the Northern Hemisphere (WMO, 2006, 2007, 2011, 2012, 2014, 2016; Zellweger et al., 2016). For the Southern Hemisphere this number is even lower at ±0.05 µmol mol−1 because smaller source intensities, due to the large proportion of ocean surface, give rise to smaller spatial gradients than in the Northern Hemisphere. The WMO CO2 X2007 scale is embodied in 15 primary standards, which are measured once every 2 years on a manometric system that provides SI traceable values by the National Oceanic and Atmospheric Administration (NOAA) Earth System Research Laboratory (ESRL) in Boulder, USA (Zhao et al., 1997; Zhao and Tans, 2006). The primary standards are used to transfer the calibration scale to secondary and subsequently to tertiary standards. The tertiary standards are sent to the different laboratories around the world to calibrate their CO2 measurements. To meet the WMO's compatibility goal of 0.1 (or 0.05) µmol mol−1, it is crucial that the standards remain stable during their entire time of use, and/or that they are recalibrated at reasonable intervals, and that appropriate laboratory practices are being followed. The latter are included in the biannual WMO reports as “Expert Group Recommendations”. At field stations (Schibig et al., 2015) but also in laboratory experiments (Langenfelds et al., 2005; Leuenberger et al., 2015; Miller et al., 2015; Brewer et al., 2018), standard gases typically show some CO2 enrichment with decreasing pressure. Those studies attributed the CO2 enrichment to different effects such as Langmuir monolayer adsorption–desorption, gravimetric fractionation, thermal fractionation or Rayleigh-distillation-related effects for example. Evaluating 10 years of calibration tank measurements, Keeling et al. (2007) found a downward drift in their aluminum calibration tanks relative to steel, which they attributed to surface conditioning. In this study, three hypotheses were tested: (i) the increase in the CO2 mole fraction in the sample gas with decreasing pressure is different for each individual cylinder; (ii) at low-flow rates, the Langmuir monolayer adsorption–desorption model is sufficient to describe the observed CO2 enrichment with decreasing pressure; and (iii) the stability of the CO2 mole fraction with decreasing pressure is better in SGS (Superior Gas Stability®, Luxfer, USA) cylinders than in untreated aluminum cylinders. To check the first hypothesis, eight cylinders were repeatedly filled and decanted and the CO2 enrichment of the individual measurements were compared. The second hypothesis was investigated by decanting the cylinders at different flow rates. At low flow the temperature changes due to the decreasing pressure are negligible, whereas at a high-flow setting the fast pressure decrease induces cooling and substantial temperature gradients in the cylinder. If only adsorption and desorption effects are at work, the CO2 enrichment of the high-flow experiments can be expected to be the same as with the low-flow experiments, unless the wall equilibration times are long (at least several hours) such that during high-flow experiments the walls do not equilibrate as during low-flow experiments. In that case one could expect to see a smaller wall effect. Additionally, the cylinders were positioned in different orientations, which again should not have any influence on the measured CO2 mole fraction of the outflowing gas if only adsorption–desorption effects are involved. Furthermore, heating bands were used to alter the temperature of the cylinder wall to learn more about potential temperature issues. To check the third hypothesis, two of the eight tested cylinders were SGS cylinders, but they were used exactly the same way as the ordinary cylinders. If their surface treatment is beneficial to the CO2 stability, the experiments with SGS cylinders should stand out clearly.
2.1 Sample cylinders
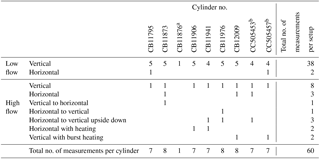
To measure the CO2 development over the lifetime of a cylinder eight cylinders were repeatedly filled to about 130 bar at Niwot Ridge Station, CO, USA. The filling was done the exact same way as for the standard cylinders NOAA fills to be used as calibration gas tanks (Kitzis, 2017). Six of the eight cylinders were Luxfer L6XTable aluminum cylinders, which are the same type NOAA uses for the CO2 standards – two were Luxfer L6XTable SGS (Superior Gas Stability) aluminum cylinders (Table 1). Cylinder CB11876 was excluded from the set and was replaced with CB11941 after the first run, because the cylinder valve's sealing surface got scratched badly. The 29.5 L cylinders were fitted with Rotarex Series D200 brass packless valves (Rotarex, Luxembourg) to be used with two stage pressure reducers (Scott Specialty model 51-14B-590) and a chromed brass CGA connection. The regulators were connected to the measurement system by Quick Connects (SS-QC4-B-4PM and SS-QC4-D-400 for the samples and SS-QM2-B-2PM and SS-QM2-D-200 for the standards, respectively; Swagelok, USA) and 1∕8 inch stainless steel tubing (Swagelok, USA).
2.2 Measurement system
The CO2 measurement system was based on a customized replacement unit of NOAA's tall tower network (Andrews et al., 2014). To measure CO2 mole fractions a nondispersive infrared (NDIR) gas analyzer (LI-7000, LI-COR, USA) was used. In March 2017, the original CO2 analyzer stopped working and had to be replaced by a spare analyzer of the same make and model. The system was controlled by a CR-1000 measurement and control data logger (Campbell Scientific, USA), and a Windows laptop was used to communicate with the CR-1000 and to store the data. The pressure regulators were equipped with digital pressure readers on the high-pressure side (EW-68075-10, Cole-Parmer Instrument Company, USA), and the pressure is measured relative to atmospheric pressure. To avoid complete drainage, the sample cylinders were excluded from the measurement sequence as soon as the pressure dropped below a preset threshold.
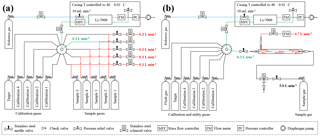
Figure 1Schematic of the low-flow measurements system setup with the 10-port VICI valve (a) and the high-flow measurement system setup with the 16-port VICI valve (b). The red lines and numbers indicate the gas that is drained to the room to maintain a steady flow out of the cylinder, the green lines and numbers are what goes into the analyzer, and the blue lines are the reference gas flow.
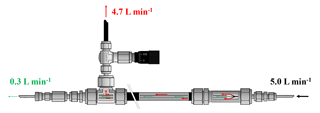
Figure 2Flow schematic of the high-flow inlet system. The sample gas enters on the right side at 5.0 L min−1. A small aliquot of 0.3 L min−1 goes to the analyzer, and the remainder of 4.7 L min−1 goes to the exhaust. The ratio between the gas going to the analyzer and the exhaust, respectively, is set by the dimensions of the inner and outer tube and can be adjusted by the needle valve on the exhaust side.
2.2.1 Low-flow measurements setup
In the low-flow setting the cylinders were hooked to a VICI (Valco Instruments Co. Inc., USA) multiport valve, which was used to switch between the different calibration gases and the sample gas cylinders. Until 8 November 2016, it was a 10-port valve (EMT2SD10MWE, Valco Instruments Co. Inc., USA), where ports 1 to 5 were used for the sample gases and ports 6 to 10 were connected to the calibration gases C1, C2, C2, C4 and the target gas. The valve was later upgraded to a 16-port valve (EMT2SD16MWE, Valco Instruments Co. Inc., USA), which allowed measuring all sample cylinders from their initial pressure down to their final pressure in one single run. With the new 16-port valve ports 1 to 8 were used for the samples, and ports 9 to 13 were used for the calibration and target gases. The working pressure for the calibration as well as the target and sample gas was set to about 1 bar. To allow a constant flow out of the sample cylinders throughout the whole run, solenoids were used in each sample line to open bypass lines for the cylinders that were not currently measured. The bypass lines led to needle valves, where the flow was adjusted to 0.3 L min−1 for each sample cylinder individually. The bypass line of the cylinder currently measured remained closed. This ensured that all the gas flowed through the analyzer, kept the flow rate coming out of the cylinder stable, and avoided potential fractionation at the tee unions due to pressure and/or temperature gradients between the arm and the runs of the tee unions (Fig. 1a).
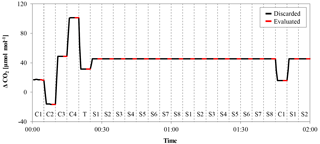
Figure 3Example of a calibration sequence from a low-flow measurement. The x axis represents time and the y axis the delta signal of the NDIR analyzer. The gas measured is indicated by the codes at the bottom of the figure (“C” is calibration gas, “T” is target gas and “S” is sample gas), and the switching of the valve is marked by the dashed vertical lines. Each gas was measured for 5 min, to avoid mixing and memory effects; the first 3 min were discarded (black lines) and only the last 2 min (red lines) were used for further evaluation.
2.2.2 High-flow measurements setup
In the high-flow setting, the gas was drained out of the cylinder at 5.0 L min−1, which is why a cylinder lasted only about 12 to 13 h. Only one sample tank was measured per run; otherwise, too much detail might be lost, especially towards the end of the experiment, where we expected the enrichment to happen (Fig. 1b). Originally the measurement system was designed to operate with sample gas flows of about 0.2–0.3 L min−1. To achieve a flow of 5.0 L min−1 out of a sample cylinder, 4.7–4.8 L min−1 had to be bypassed in a non-fractionating manner. To do so an inlet system similar to an open-split design was built (Fig. 2). The gas enters the inlet system on one end at a flow rate of 5.0 L min−1 and flows through a 0.5 inch stainless steel union and then through a 0.5 inch Synflex tube. In the center of the 0.5 inch tube, a 1∕8 inch stainless steel tube takes an aliquot of air to the measurement system, and the rest leaves at the other end through the exhaust. The length of the outer tube is 0.25 m, which in combination with the high flow is sufficient to avoid back diffusion of outside air through the open split. Because the ambient pressure is too low for the pressure controller to maintain the set pressure of 1030 mbar, the working pressure of the pressure regulator of the sample gases was increased to 1.5 bar and a needle valve was used to provide a small backpressure. The needle valve increased or decreased the resistance of the exhaust to the lab and thereby the ratio of the flows. Measurements of the same cylinder connected to the high-flow inlet and the low-flow inlet resulted in the same CO2 mole fraction, proving that the sampled small flow is not fractionated from the large bypass flow.
2.2.3 Measurement protocol
The CO2-analyzer reported 5 s values to the data logger, which in turn logged 30 s averages. Ten of these 30 s averages were taken together into one 5 min block that formed the basic unit used for the measurement sequence. The calibration, target and sample gas measurements were done in a repetitive cyclic sequence that was made up of the aforementioned 5 min blocks and whose order was defined in the control program. In the very beginning of each cycle, a full calibration with a single block of each calibration gas (C1, C2, C3, C4) as well as a block of target gas measurement was done. Then, the program switched through all connected samples several times, measuring a block C1 in between to catch short-term drifts of the measurement system (Fig. 3). When a cycle was finished, a new cycle was started, again by measuring blocks of all four calibration gases first. At the end, an additional calibration with all four calibration gases and the target gas was made.
In the low-flow setup with multiple samples, the sequence cycled between the sample cylinders until two blocks of every sample cylinder were subsequently measured. Then a block of C1 was measured to catch the analyzer's short-term drift. This was repeated three times, before another full calibration was done. In cases where all eight sample lines were used, one cycle took 275 min; a whole run, where the cylinders were measured from full until empty, lasted about 9 to 10 days. In the low-flow measurements, the target gas block was added every 1000th minute, which resulted in about 12 additional blocks of target gas measurements in one complete run. To avoid contamination, the sample cylinders were excluded from the sequence as soon as their high pressure reached 1 bar.
In the high-flow setup, the calibration sequence was similar to the low-flow measurements. In the beginning of every cycle, there was again a complete calibration sequence. After the calibration, the sample block was repeated 10 times followed by one block of C1 and again 10 blocks of sample gas that completed the cycle. This was repeated until the sample cylinder's high pressure reached the preset pressure threshold of 1.5 bar. A target gas block was added every 150th minute, which yielded about four additional target gas measurements per run. In order to catch as much sample measurements as possible within the last few bars of the sample cylinders' lifetime, some additional conditions related to the sample pressure were added to the measurement sequence: (i) no full calibration below 35 bar sample pressure, (ii) no target gas measurement below 15 bar and (iii) no C1 below 8 bar. A run was finished by measuring all four calibration gases as well as the target gas. The initial calibration in the low-flow measurements sometimes showed noisy measurements, most probably due to run-in effects of the whole system. While 4 h in the low-flow measurements corresponds only to a fraction of the whole run, it would be about a third of a high-flow run. To avoid run-in effects, a 2 h flush cycle with gas similar to the sample gases was added prior to the first calibration measurement.
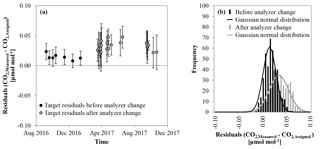
Figure 4(a) Average of the difference of the target gas measurement minus the assigned CO2 mole fraction for each run against time; black indicates the measurements before the analyzer change and grey after the analyzer change in March 2017. The error bars correspond to the standard deviation of the individual target gas measurements within each run. (b) Histogram of the residuals of the target gas measurements; again, black stands for the measurements before and grey after the analyzer change.
In some high-flow runs, heat was applied to the sample cylinder. In cases where the heating system was used to apply heat over a longer time period and keep the sample cylinder at a certain temperature, the heating started as soon as the cylinder reached 30 bar pressure. Heating the whole cylinder to 30 ∘C took about 1 h. To avoid losing a lot of gas while the set temperature was not reached, the sample gas flow was shut off during this period and the idle time was used to measure all calibration gases. During the remaining time, flush gas was measured in order to keep the system in steady state. For the heat bursts, the setup was slightly different. The heating started when the cylinder pressure reached 50 bar and lasted until the thermostat measured 30 ∘C, usually at about 40 bar. During the heating, the measurement cycle continued without any further changes.
The values reported by the LI-7000 are the difference between the signals of the sample and the reference cell, which is flushed continuously with a reference gas at a flow rate of 10 mL min−1. To calculate the CO2 mole fractions of the sample and target measurements, the raw Δ signals of the calibration gas measurements were interpolated over time, and together with the assigned values of the calibration gases a quadratic calibration function was calculated for each individual sample or target measurement. To guarantee a proper flushing between different gases and to avoid memory and mixing effects, only the last 2 min of each 5 min block were averaged into one CO2 mole fraction value and used for further calculations. Since we were only dealing with dry cylinder gases (H2O < 1 µmol mol−1), the drying unit was bypassed and no water correction was applied.
2.2.4 System performance
To estimate the accuracy and repeatability of the system, differences of target minus target were calculated for each block of target gas measurement. The differences show a normal distribution with a small positive bias of 0.02±0.02 µmol mol−1. There seems to be a difference in the target gas measurements before and after the end of March 2017 (Fig. 4a). Between these two periods C1 had to be changed because it reached the end of its lifetime. A few days later the CO2 analyzer had to be changed as well due to a malfunction. Before that period, the average of the target gas differences was 0.01±0.01 µmol mol−1. After the C1 and the CO2 analyzer were replaced, it became 0.03±0.02 µmol mol−1 (Fig. 4a and b). The assigned values of the calibration gases have currently a reproducibility of 0.01 µmol mol−1 (1σ). If we assume independent errors between the old C1 and the replacement C1, their difference can be expected to be within 0.01 µmol mol−1 at 1σ, which is smaller than the difference between the two periods. Because of that and since the noise grew as well, the change is most likely caused by the exchange of the analyzer. A change of the C3 at the end of September 2017 did not have any significant influence on the precision or accuracy. However, despite the small bias, the accuracy and precision are still excellent for an NDIR CO2 measurement system. Furthermore, since we are only interested in the changes in the CO2 mole fraction over the lifetime of a cylinder, the small bias is only of minor importance. The repeatability is much more meaningful because it shows the detection limit of our experiment.
2.3 Auxiliary systems
2.3.1 Temperature measurement
Thermistors were used during the high-flow experiments to measure the temperature development of the cylinder surface and on the pressure regulator. The used thermistors were negative temperature coefficient (NTC) sensors (PR103J2, U.S. Sensor Corp., USA) with an accuracy guaranteed by the manufacturer of ±0.05 ∘C. The voltages of the thermistors were measured by a Keysight 34901A data acquisition/switch unit with a 34908A 40-channel multiplexer module (Keysight Technologies, USA) and logged on a laptop PC. During high-flow measurements, the temperature was read once a minute, during the one low-flow experiment with temperature measurement once every 5 min. The voltage was converted into temperature values by using the Steinhart–Hart equation (Steinhart and Hart, 1968).
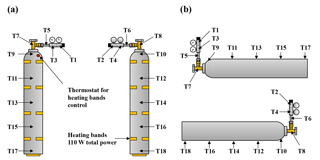
To fix the thermistors to the regulator (T1–T6), the cylinder valve (T7–T8) and the cylinder (T9–T18) and to insulate them from influences from room air, small pieces of rubber foam and duct tape were used. To detect potential biases in the temperature measurement, two thermistors were fixed at similar positions opposing each other, and the thermistors (T19–T25) not attached to the cylinder were bundled and used as background measurement (Fig. 5a and b).
2.3.2 Heating
To learn more about the involved processes, heat was applied in some measurements, steadily over a longer time period or as a single burst. To do so, small heating bands (Minco, USA) with an overall heating power of 110 W were attached to the cylinder by using aluminum foil tape. Eight bands were equally distributed in pairs on four levels along the cylinder; the ninth band was attached to the bottom of the cylinder (Fig. 5a). The heaters were switched on and off by the measurement sequence; the end temperature was set to 30 ∘C and regulated by a control unit with a thermostat. For safety reasons the cylinders were wrapped in a thin fire-proof glass wool mat during these experiments; the insulating effect of the glass wool mat should be negligible.
2.4 CO2 enrichment estimates
2.4.1 Langmuir adsorption–desorption model I
Each low-flow measurement run of every cylinder was used to fit individually a function based on the Langmuir adsorption–desorption model (Langmuir, 1916, 1918) as derived by Leuenberger et al. (2015):
where corresponds to the measured CO2 mole fraction, stands for the CO2 molecules adsorbed by the cylinder wall expressed as a mole fraction, is the CO2 mole fraction at the start pressure P0 in bar, P is the actual pressure in bar, and K is the ratio of the adsorption and desorption rate constants and has the units bar−1 (see Leuenberger et al., 2015, for more information). To find K, and , an R script using the nonlinear least squares fitting algorithm (nls) was used. Because the CO2 enrichment in aluminum cylinders was small, the fit seems to be relatively insensitive to K. Therefore, the algorithm was not able to find K values with a high confidence level and ultimately K was fixed at 0.001 bar−1 to find the other coefficients of the model, as will be explained later.
2.4.2 Langmuir adsorption–desorption model II
We also took a different approach to find values for the adsorbed CO2 and the exchange rate K starting from a slightly altered Langmuir's adsorption desorption model (Langmuir, 1916, 1918):
with θ being the fraction of the total number of available sites that are occupied (dimensionless), K corresponding to the ratio of the adsorption and desorption rate constants here in the units m3 mol−1, and ρx being the average amount density (mol m−3) of CO2 in the gas phase. In this approach, θ is a function of CO2 only, not of total gas pressure. With the trace gas mole fraction X and the average amount density ρa of air molecules, ρx can be written as the product of two independent variables:
Assuming the ideal gas law with P being the pressure, V the volume, R the gas constant, T the temperature and na the total amount of air (moles) in the gas phase, we also have
The total amount of trace gas ntot can be written as the sum of the amount of trace gas adsorbed to the walls nad and the amount of trace gas in the cylinder air ngas:
The amount of molecules adsorbed to the wall nad can be expressed as
in which a is the available wall space (maximum amount of adsorbed molecules, expressed in moles), a number that we do not know, so that we have for the total amount of trace gas, in the gas phase and on the wall divided by the volume,
By draining some air (dρa, which is negative) with its current mole fraction X out of a cylinder, a certain amount of trace gas will be removed (Xdρa) and the partitioning between the gas phase and the wall will change. If we also assume that the relevant quantities are uniform inside the cylinder, the corresponding change in trace gas per volume can be written as
which we rearranged into the following equation,
and subsequently into
By substituting dρx in Eq. (10) with Xdρa+ρadX, it can be rearranged to
The gas pressure (and the amount density) varies over a large range from 150 to 1 bar, whereas the quotient varies only little. Therefore, we can integrate Eq. (11) numerically in successive steps from 150 bar to 1 bar, as follows:
Assuming the ideal gas law, it could also be rewritten as
with P being the pressure (bar). However, also with this different approach, it was not possible to determine K and a independently. There is not enough information in the data at the low observed enrichments. A range of solutions, in which there is a tight anti-correlation between K and a, can reproduce the enrichment at a pressure of 1 bar. However, with higher K values the enrichment effect becomes more and more concentrated at low pressures, so that at some point the observed shape of the observations can not be met. Therefore, K and the corresponding coverage factor θ (at 150 bar) have to be low.
2.4.3 Estimating K based on the CO2 measurements
To find a value for K, a process of elimination was used. Given that the residuals between the data and the fit function of a good fit are normally distributed, K can be found by fitting the adsorption–desorption equation but with a fixed K value, starting with a value close to 0. Then, K is increased step wise, until the residuals are not normally distributed anymore. To improve the sensitivity of this method, only CO2 measurements below 30 bar were taken into account, where the increase in the CO2 mole fraction is more pronounced. These calculations were done for 10 different low-flow cylinder measurements. The resulting K values were averaged and the standard deviation was calculated. This K value might not be the best fit, but it gives a good estimate about the upper boundary of possible K values. To make sure the residuals of all fits stay well within the normally distributed range, the K value was considered to be the difference (average K value minus standard deviation), which resulted in 0.002 bar−1. To be on the safe side, K was set in the nls algorithm to 0.001 bar−1.
2.4.4 Rayleigh distillation model and its combination with the Langmuir adsorption–desorption model I
Additionally to the Langmuir adsorption–desorption model, a Rayleigh distillation function (Rayleigh, 1902; Matsubaya and Matsuo, 1982; Langenfelds et al., 2005) was fitted to the data as well; it had the form
where X corresponds to the measured CO2 mole fraction; X0 corresponds to the initial CO2 mole fraction; P and P0 correspond to the actual and initial pressure, respectively; and α is the fractionation factor for the gas leaving the cylinder. The outflowing gas is depleted in CO2 if α < 1, leaving the gas in the cylinder slightly enriched in CO2 (and vice versa). With ongoing outflow, the effect gets stronger because the gas in the cylinder becomes more and more enriched. However, to make Rayleigh distillation possible, a fractionating process has to be involved, namely that the CO2 mole fraction of outflowing gas is either enriched or depleted with respect to the cylinder average. A possible reason for fractionation in the cylinders is a temperature gradient in the cylinder. Heavier molecules tend to accumulate at the cooler end of a gas reservoir, while the lighter molecules are slightly more represented at the warmer end. If the sample air is taken from, for example, the warmer part of the gas column, it will be slightly depleted in the heavier molecule while the gas in the cylinder becomes enriched. If only low-flow experiments are considered, it is not possible to distinguish between Langmuir adsorption–desorption effects and Rayleigh fractionation; both functions give equally reasonable fits, which is one reason the high-flow experiments were needed (see hypothesis ii in the introduction). To each of the high-flow measurements a fit based on the Langmuir adsorption–desorption and a fit based on the combination of the Langmuir and Rayleigh distillation function were calculated. The Langmuir fit was again calculated with K fixed at 0.001 bar−1; and were estimated by a nonlinear least squares algorithm in an R script. In cases of the combination, the Langmuir part was calculated with fixed coefficients that correspond to the averaged coefficients of the low-flow experiments. The coefficients X0 and α of the Rayleigh distillation term were again determined using R's nls algorithm using the following equation:
where is the average coefficient of the low-flow experiments, K is again the ratio of the adsorption and desorption rate constants (fixed at 0.001 bar−1), P is the actual pressure, P0 is the initial pressure, X0 corresponds to the CO2 mole fraction before the enrichment and α is the fractionation factor, which is close to one. To test whether the enrichment follows a Rayleigh fractionation, ln(X∕X0) can be plotted against −ln(P∕P0) after the data has been corrected for Langmuir adsorption–desorption effects. If there is Rayleigh fractionation, the points should line up, following a line with a slope of 1α.
No data selection was applied to the measured data. However, in the beginning of these experiments, some runs showed run-in effects between the first two calibration points, most probably due to an insufficiently flushed reference line due to the very small flow. These measurements were excluded from any further calculations. The run-in effects vanished mostly when an additional flush gas cylinder with a 2 h flushing sequence was added to the measurement sequence.
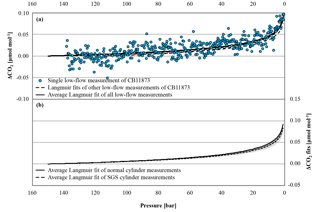
Figure 6(a) The blue circles represent the CO2 mole fraction measurement of a low-flow experiment started on 17 October 2016 with CB11873 vertically positioned as a function of pressure; note the inverse pressure scale. The black dashed lines are the individual fits following the Langmuir model of the other low-flow experiments done with CB11873 vertically positioned; the black solid line represents the average Langmuir fit using all low-flow experiments with the cylinders vertically positioned. (b) The black solid and dashed lines correspond to the average Langmuir fit of all normal and SGS cylinder measurements, respectively, that were done under low-flow conditions; the greyed area corresponds to the standard deviation of the averages. In order to plot all data in one plot, the corresponding (– was subtracted from the measurements and the fits in both panels.
3.1 Low-flow measurements
In the low-flow mode, 38 full tanks were depleted with vertically positioned cylinders to see whether the CO2 mole fraction change with decreasing pressure is different in each individual cylinder and whether SGS cylinders perform better than normal cylinders. All low-flow measurements followed a similar pattern with a very small, almost linear, CO2 mole fraction increase down to about 30 bar that becomes much stronger from there. A fit following Langmuir's adsorption–desorption model was calculated for each cylinder measurement and used to estimate the average CO2 enrichment with decreasing pressure. Using the actual pressure measurements, the average CO2 enrichment is 0.089±0.013 µmol mol−1 (Fig. 6a); the given error corresponds to the standard deviation (1σ) of individual cylinder drainings. However, values for the CO2 enrichment of the individual cylinder measurements might not be entirely comparable, since each cylinder had a different initial pressure. Therefore, we calculated the CO2 enrichment for each cylinder measurement using the same pressure span of 150 to 1 bar. This results in an average CO2 enrichment of 0.090±0.009 µmol mol−1, which is the same within the given uncertainty. The variation of the enrichment was very low, indicating that the CO2 enrichment with decreasing pressure is not cylinder dependent. The two SGS cylinders do not show a significantly different behavior; the shape of the CO2 enrichment with decreasing pressure as well as the amount is the same as for the normal cylinders within the given uncertainty (Fig. 6 b). As mentioned above, the coefficient K of the Langmuir model had a fixed value of 0.001 bar−1, but also the value of the initially adsorbed CO2, was relatively constant throughout all measurements with an average of 0.0165±0.0016 µmol mol−1 at the initial pressure. When fitting a function based on Rayleigh distillation, the average of the fractionation factor α is 0.999957±0.000004, which would cause a CO2 increase of about 0.085 µmol mol−1 when the pressure drops from 150 to 1 bar. The given uncertainty range of 0.000004 corresponds to about 9.3 % of (1–0.999957). Considering the calculated CO2 enrichment of 0.085 µmol mol−1, 9.3 % equates to about 0.008 µmol mol−1, which is consistent with the measurement system's repeatability of 0.01 µmol mol−1 as deduced from the target gas measurements before the analyzer change.
Additionally, a low-flow run with two horizontally positioned cylinders (one normal and one SGS cylinder) was done. Again the Langmuir fit functions of the two cylinder measurements were used to estimate the average CO2 enrichment, which was 0.019±0.003 µmol mol−1 for the measured pressure drop and 0.021±0.004 µmol mol−1 for a pressure drop from 150 to 1 bar, respectively, which is hardly significant considering the detection limit of the measurement system. One of the two cylinders was equipped with thermistors, similar to the high-flow setup, representing at the same time the only low-flow run with temperature measurements (Fig. 5 b). The temperature measurements did not reveal any features related to the pressure drop in the cylinder. The observed periodical cylinder temperature changes with an amplitude of about 1 K were mainly driven by changes in the room temperature due to the air conditioning regulation and not by the gas decanting (Fig. 7).
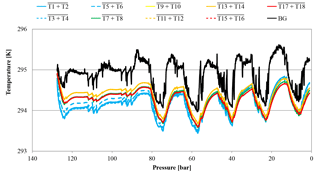
Figure 7Temperature development of CB11795 during the low-flow measurement with horizontally positioned cylinders as a function of pressure; note the inverse pressure scale. The lines represent averages of the following thermistors. Pressure regulator to stem: solid blue, T1 and T2; dotted blue, T3 and T4; dashed blue, T5 and T6. Cylinder valve: green, T7 and T8. Cylinder body: yellow, T9 and T10; dashed orange, T11 and T12; solid orange, T13 and T14; dashed red, T15 and T16; solid red, T17 and T18. Laboratory background: black, T19 to T25.
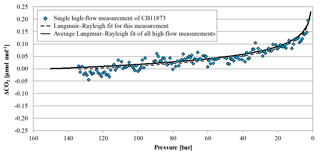
Figure 8The blue diamonds represent the CO2 mole fraction measurement of the high-flow experiment done on 5 April 2017 with CB11873 vertically positioned as a function of pressure; note the inverse pressure scale. The black dashed line is a fit following the combined Langmuir adsorption–desorption and Rayleigh distillation model; the black solid line represents the average of the combined Langmuir and Rayleigh fit using all high-flow experiments with vertically positioned cylinders. In order to plot all data in one plot, the corresponding (– was subtracted from the measurements and the fits.
3.2 High-flow measurements
3.2.1 Vertically positioned cylinders
In high-flow mode, each of the six normal and the two SGS cylinders were drained once with cylinders vertically positioned, to find out whether Langmuir adsorption–desorption is the only process enriching the CO2 mole fraction with decreasing pressure. The average enrichment calculated from the Langmuir-only fits corrected to a pressure drop from 150 to 1 bar was 0.24±0.04 µmol mol−1 (Fig. 8). The average value for was 0.043±0.008 µmol mol−1, which is about 2.5 times bigger than the value found in the low-flow experiments (K was again fixed at 0.001 bar−1). If the combined Langmuir–Rayleigh fit is used with the Langmuir coefficients fixed from the low-flow measurements, the enrichment adjusted to a pressure drop of 150 to 1 bar is 0.22±0.05 µmol mol−1, which is basically the same within the uncertainties. The average fractionation factor α is 0.99993±0.00002, which corresponds to a CO2 depletion in the outflowing gas. Subtracting the Langmuir function with the low-flow coefficients from the measurements and using the residuals to plot ln(X∕X0) against −ln(P∕P0) yields an elongated cloud with slope of 1α, indicating that Rayleigh distillation might be responsible for the additional CO2 enrichment seen in the high-flow measurements (Fig. 9). At the same time, the temperature development of the cylinder and the pressure regulator were measured (Fig. 10a). At the front end of the regulator, where the working pressure reduction happens, the temperature dropped rapidly by about 6.76±0.59 K within 94±22 min with the given errors being the standard error (1σ) of the mean of all runs. The thermistors indicate also a slightly bigger temperature drop of 7.01±0.62 K within 98±23 min at the first stage compared to the second stage, although the difference is hardly significant. The stem of the regulator showed a reduced temperature drop of about 4.58±0.44 K with the minimum delayed by about 133±33 min. The cylinder valve follows much closer the temperature of the cylinder body than the temperature of the regulator. It shows a drop of 2.33±0.25 K with the minimum occurring 234±25 min after the beginning of the gas flow. The temperature of the cylinder was measured at five evenly distributed distances. The average temperature drops from the top to the bottom level were 2.29±0.23, 2.40±0.19, 2.53±0.17, 2.58±0.18 and 2.55±0.21 K, respectively, with the minima occurring at 251±29, 266±23, 281±17, 286±16 and 283±22 min after the gas flow was initiated. The temperatures of the different levels of the cylinder body follow each other closely until one after the other reaches the minimum. Then they start to fan out until the end of the experiment, reaching a spread of 0.55±0.13 K with the level near the ground showing the lowest temperature and the level near the shoulder showing the highest temperature.
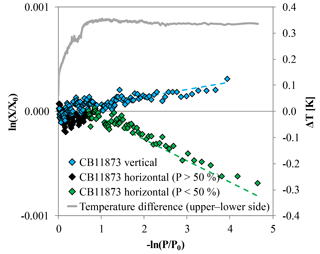
Figure 9CO2 measurements of high-flow experiments with CB11873 corrected for Langmuir adsorption–desorption effects based on the low-flow experiments; the vertically positioned cylinder is shown in blue and the horizontally positioned cylinder is shown in black for the first half and green for the second half of the run. The data are plotted such that fractionations caused by Rayleigh distillation would follow a line with slope 1α, with α being the fractionation factor. These lines are indicated by the dashed lines in corresponding colors that were calculated based on an averaged α from all available experiments. The grey line plotted on the secondary y axis is the temperature difference between T15 and T16 corresponding to the upper and the lower side of the horizontally positioned cylinder. It reaches its maximum after the cylinder is about half empty, which is when the fractionation seems to start.
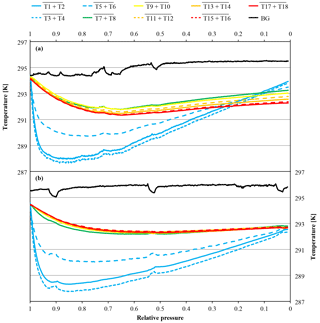
Figure 10Temperature measurements against relative pressure; note the inverse x axis. Because the initial pressures of the two cylinders were slightly different (CB11873 at 140.0 bar and CB12009 at 128.2 bar), the pressure is expressed as relative pressure (P∕P0) in order to use the same x axes for both panels. The measurements in panel (a) come from a high-flow experiment with a vertically positioned cylinder (CB11873 on 4 May 2017); the temperatures in panel (b) were measured during a high-flow experiment with a horizontally positioned cylinder (CB12009 on 8 May 2017). The lines represent averages of the following thermistors. Pressure regulator to stem: solid blue, T1 and T2; dotted blue, T3 and T4; dashed blue, T5 and T6. Cylinder valve: green, T7 and T8. Cylinder body: yellow, T9 and T10; dashed orange, T11 and T12; solid orange, T13 and T14; dashed red, T15 and T16; solid red, T17 and T18. Laboratory background: black, T19 to T25.
3.2.2 Horizontally positioned cylinders
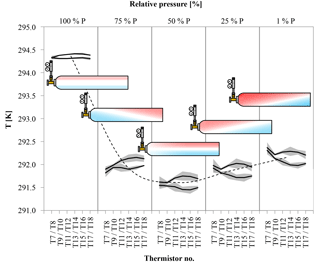
Figure 11Temperature difference between the upper and the lower side of the cylinder (in horizontal position) at five different stages of decanting. The temperature is given on the y axis, the black lines are the average temperature along the upper and lower side of the cylinder derived from three runs; the shaded areas correspond to the standard deviation. The position of the temperature measurement along the cylinder is given for each stage individually on the x axis in the form of the thermistor number (see Fig. 5); the relative pressure is given as bins on the secondary x axis. The black dashed line serves as an indicator for the general temperature development of the cylinder; it corresponds to the average of T11 to T14. The red and blue colors in the cylinders represent a possible distribution of warm (red) and cool (blue) air within the cylinder derived from the temperature measurements on the outside of the cylinder.
Three more runs were done with the cylinders horizontally positioned to measure the CO2 changes with different temperature gradients compared to the vertically positioned cylinders. In cases where the temperature gradient has no influence on the observed CO2 changes with decreasing cylinder pressure, the outcome of these measurements should be the same as with vertically positioned cylinders. In the beginning of the experiments, the temperature of the regulator, the stem and the valve show a fast drop to minimal temperatures followed by a slow gradual temperature increase, similar to the vertically positioned cylinders. Also the cylinder valve follows closely the temperature of the cylinder body, although it seems to cool down a bit more and appears to be slightly more influenced by the regulator stem compared to the measurements with the vertical cylinders. The maximal temperature drops of the regulator from the front end to the stem are 6.40±0.18, 6.72±0.22 and 4.66±0.31 K, respectively, with delay times of 112±16, 109±21 and 194±43 min after starting the gas flow. The cylinder valve shows a temperature drop of 2.81±0.52 K with a time delay of 251±15 min. The temperatures of the cylinder body show a different behavior. If the corresponding thermistors of the lower and the upper side are averaged, similarly to the measurements with vertically positioned cylinders, the temperature drop seems to be the same everywhere within the uncertainties. From the valve end to the bottom end of the cylinder the average temperature drops of the three measurements are 2.82±0.64, 2.80±0.59, 2.83±0.67, 2.80±0.67 and 2.78±0.67 K, with time delays of 292±38, 292±36, 291±35, 299±33 and 299±35 min, respectively (Fig. 10b). The given uncertainties correspond to the standard deviation (1σ) of the average over the three runs. However, if the temperature development of each thermistor is evaluated individually, interesting details can be found. Since the three cylinders had slightly different starting pressures, the pressures had to be converted into a relative pressure measure in order to make them comparable. To do so the pressure at each measurement was divided by the initial pressure (P∕P0) where 1 (or 100 %) stands for a full cylinder and 0 means the cylinder is empty. The temperature measurements of each thermistor during the three runs were matched according to the relative pressure and, to make the temperatures comparable, the difference of the temperature measured by the individual thermistor minus the cylinder body average (including the valve) was calculated. The results of the three runs were averaged and the standard deviation calculated. On the cylinder body, the temperature of the upper thermistor is usually higher than the temperature of its counterpart at the lower side (Fig. 11). The temperatures of the two thermistors at the valve are the same within uncertainty. In the beginning, there is no significant temperature gradient along the cylinder body. At 75 % relative pressure, the front end is cooler than the cylinder body and the difference between the upper and the lower side starts to grow with the largest difference of 0.25 K in the middle of the cylinder body. At 50 % relative pressure the temperature distribution becomes symmetrical, with the lowest difference at the front end and the largest difference still in the middle of the cylinder body. There the temperature difference is about 0.3 K and remains stable for the rest of the experiment. This is also the point where the CO2 depletion starts to follow the 1α slope in the logarithmic plot indicating Rayleigh fractionation as will be shown later in this section (Fig. 9). At 25 % relative pressure the valve and the shoulder start to warm up (Fig. 11). While the temperature gradient along the cylinder becomes smaller on the upper side, the gradient along the lower side is increasing. The largest difference is again at the middle of the body: it is still about 0.30 K. At 1 % relative pressure, the temperature gradient at the upper side almost vanished while it is the largest now for the lower side. The largest temperature difference of about 0.30 K is still at the middle of the cylinder body. The mole fraction measurements of these cylinders looked completely different. From the start of the measurement down to about 30 bar, the CO2 mole fraction of all three cylinders showed first a slight decrease of about 0.05 µmol mol−1, followed by a small increase back to the original CO2 level. From 30 bar until the end of the measurement, the CO2 measurements show a steep CO2 depletion (Fig. 12). If only the Langmuir function was used, had to become negative, which is physically impossible. Using the combined Langmuir–Rayleigh fit function with the Langmuir coefficients fixed to the values from the low-flow setting gives us an average CO2 depletion of 0.20±0.03 µmol mol−1 over a pressure drop from 150 to 1 bar. The average fractionation factor α is 1.00014±0.00003, indicating a CO2 enrichment in the outflowing sample gas, in contrast to the vertical cylinders (Fig. 9). The slope still follows 1α, consistent with Rayleigh fractionation. In all three runs the logarithmic plots show a flat plateau in the beginning. The decrease starts in all three runs at −ln(P/P0)≈0.7, which corresponds roughly to a half-empty cylinder. If only the CO2 measurements below 50 % of the cylinder's pressure are used to calculate α, then the average fractionation factor for the outflow becomes 1.00021±0.00004, indicating an even stronger fractionation with a final average depletion of µmol mol−1.
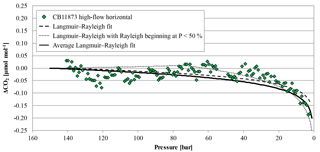
Figure 12The green diamonds represent the CO2 mole fraction measurement of the high-flow experiment done on 4 May 2017 with CB11873 horizontally positioned as a function of pressure; note the inverse pressure scale. The black dashed line is a fit following the combined Langmuir adsorption–desorption and Rayleigh distillation model, the black dotted line is a fit following the combined Langmuir adsorption–desorption and Rayleigh distillation model with the Rayleigh distillation starting when the cylinder is half empty, and the black solid line represents the average of the combined Langmuir and Rayleigh fit using all high-flow experiments with horizontally positioned cylinders. In order to plot all data in one plot, the corresponding (– was subtracted from the measurements and the fits.
3.2.3 Moving cylinders into different orientations while measuring
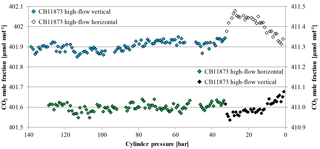
Figure 13CO2 mole fraction as a function of pressure; note the inverse x axis. The blue and empty diamonds belong to the primary y axis and were measured on CB11873 during a high-flow experiment, where the cylinder was first vertically positioned and then laid down at 32.1 bar (indicated by the empty diamonds). The green and black diamonds belong to the secondary y axis and were measured on CB11976 during a high-flow experiment, where the cylinder was first horizontally positioned and then put up at 32.7 bar (indicated by the black diamonds).
One high-flow run each was done with a cylinder being in horizontal position and then put into vertical position at about 30 bar and vice versa. If there are different air masses in the cylinder with different temperatures and therefore depleted or enriched CO2 mole fractions, moving the cylinder should cause a sudden change in the temperature measurements as well as in the CO2 measurements of the sample gas. The tank that was first in a horizontal position showed a very stable CO2 mole fraction (411.00±0.02 µmol mol−1) down to 32.7 bar when it was put up into a vertical position (Fig. 13). With the movement, the CO2 mole fraction dropped within 15 min by about 0.08 µmol mol−1 and, from there on, showed similar enrichment behavior to the other measurements of vertically positioned cylinders with a CO2 increase of about 0.12 µmol mol−1. Also the opposite experiment showed stable CO2 mole fractions (401.90±0.02 µmol mol−1) until it was laid down at 32.1 bar. As soon as it was in a horizontal position the CO2 mole fraction jumped up within 25 min by about 0.13 µmol mol−1 and decreased in a similar manner to the other horizontally positioned cylinders with a CO2 decrease of about 0.14 µmol mol−1. Interestingly, the two cylinder measurements seem to mirror each other pretty well (Fig. 13). The temperature development of the regulators looks the same as for other high-flow measurements and the temperature of the cylinder body shows similar main characteristics, such as a fast drop in the beginning and a slow increase after reaching a minimum. However, there are some interesting differences. Until the cylinders are moved, the temperature measurements follow the usual individual pattern, the temperatures of the vertical cylinder drop and fan out, and the ones of the horizontal cylinder drop but stay together. After the cylinders are moved, the temperature measurements of the cylinder that is now horizontal converge (Fig. 14a) while the ones of the cylinder that is now vertical fan out (Fig. 14b).
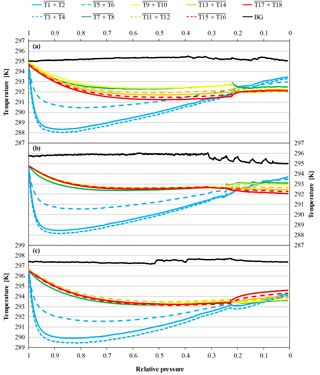
Figure 14Temperature measurements against relative pressure; note the inverse x axis. Because the initial pressures of the cylinders were slightly different (CB11873 in panel a at 138.4 bar, CB11976 in panel b at 128.9 bar and CB11976 in panel c at 133.9 bar, respectively), the pressure is expressed as relative pressure (P∕P0) in order to use the same x axes for all three panels. Panel (a) shows the temperature measurements of a high-flow experiment, where a vertically positioned cylinder was laid down (CB11873 at 32.1 bar); panel (b) shows a high-flow experiment, where a horizontally positioned cylinder was put up (CB11976 at 32.7 bar); and panel (c) shows the temperature of a cylinder that was horizontally positioned and then put upside down (CB11976 at 32.2 bar). The lines represent averages of the following thermistors. Pressure regulator to stem: solid blue, T1 and T2; dotted blue, T3 and T4; dashed blue, T5 and T6. Cylinder valve: green, T7 and T8. Cylinder body: yellow, T9 and T10; dashed orange, T11 and T12; solid orange, T13 and T14; dashed red, T15 and T16; solid red, T17 and T18. Laboratory background: black, T19 to T25.
Three additional runs were done, where the cylinders were first in a horizontal position and then put in a vertical position but with their valves at the bottom. During the first run, the handling of the cylinder did not go as smooth as planned and the turning of the cylinder took several attempts. Also the data logger for the thermistors stopped after about 2 h. The CO2 mole fraction of the first run is stable at 401.74±0.02 µmol mol−1; after the manipulation at 30.7 bar it stepped up by 0.05 µmol mol−1 and remained stable at 401.79±0.02 µmol mol−1 until the cylinder was empty. The second cylinder was also stable at 401.85±0.02 µmol mol−1 until it was put up on its valve side at 32.2 bar, then the CO2 mole fraction dropped by 0.08 µmol mol−1 to 401.77±0.02 µmol mol−1, where it remained stable until the cylinder was empty. The third cylinder again showed stable CO2 mole fraction; in the beginning it was at 401.83±0.02 µmol mol−1. At 27.8 bar it was put up and the CO2 mole fraction dropped by 0.10 µmol mol−1, where it stayed at 401.72±0.02 µmol mol−1 until the cylinder was empty. The temperature measurements of the two cylinders show the same behavior and they are comparable to the ones where the horizontal cylinder was brought into a vertical position. The only difference is that, after the fanning out of the different temperature levels, the temperatures at the bottom of the cylinder are the highest and the temperatures at the valve, which is here the lower end, are the lowest (Fig. 14c).
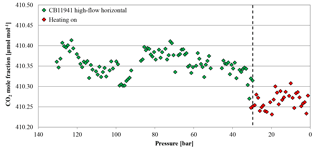
Figure 15CO2 mole fraction of a high-flow experiment as a function of pressure; note the inverse x axis. The cylinder (CB11941 on 22 June 2017) was horizontally positioned throughout the whole experiment. The CO2 mole fraction was measured down to 30 bar (green diamonds). At 30 bar (indicated by the dashed line), the flow was interrupted and the cylinder was heated up to 30 ∘C; after the set temperature was reached, the CO2 measurement continued (red diamonds). The heating caused a small pressure increase, which is why the first two points of the resumed measurements appear slightly above the pressure threshold of 30 bar.
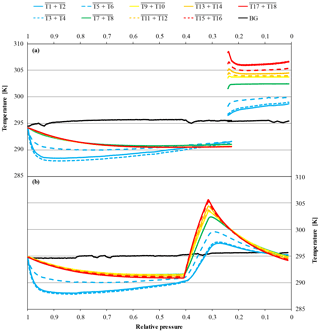
Figure 16Temperature measurements against relative pressure; note the inverse x axis. Because the initial pressures of the cylinders were slightly different (CB11941 at 130.5 bar and CB12009 at 124.0 bar, respectively), the pressure is expressed as relative pressure (P∕P0) in order to use the same x axes for both panels. Panel (a) shows the temperature measurements of a high-flow experiment where a horizontally positioned cylinder (CB11941 on 21 June 2017) was measured until it reached 30 bar. At 30 bar, the flow was stopped and the heating turned on. After the thermostat read 30 ∘C, the flow was switched back on and the measurement continued with the heating keeping it at a steady temperature until the end. The heating created a small pressure increase which is responsible for the small overlap in the x axis and is clearly visible in the background temperature. Panel (b) shows a high-flow experiment, where a vertically positioned cylinder (CB12009 on 26 September 2017) got a burst of heat at 50 bar. The heating was maintained until the thermostat read 30 ∘C. After reaching the threshold, the heating was switched off (at 40.8 bar). During the burst heating, the CO2 measurements continued. The lines represent averages of the following thermistors. Pressure regulator to stem: solid blue, T1 and T2; dotted blue, T3 and T4; dashed blue, T5 and T6. Cylinder valve: green, T7 and T8. Cylinder body: yellow, T9 and T10; dashed orange, T11 and T12; solid orange, T13 and T14; dashed red, T15 and T16; solid red, T17 and T18. Laboratory background: black, T19 to T25.
3.2.4 Heating cylinders
Two horizontally positioned cylinders were measured with constant heating up to 30 ∘C starting at a cylinder pressure of 30 bar. In cases where the heating induces convection in the cylinder, we expect the sample gas to become well mixed and no CO2 enrichment besides Langmuir adsorption–desorption as in the low-flow experiments. The mole fraction of the first cylinder was stable before and after the heating was started at 410.36±0.03 and 410.27±0.02 µmol mol−1, respectively (Fig. 15). The second cylinder showed no changes in the CO2 mole fraction before and during the heating. The average CO2 mole fraction coming out of the cylinder before and after heating was 410.99±0.03 and 410.99±0.02 µmol mol−1, respectively. The temperature measurements of the two cylinders are in good agreement (Fig. 16a). In the beginning, they show the same pattern as the other high-flow measurements with horizontally positioned cylinders, a temperature drop with the onset of the gas flow and almost no dispersion of the temperatures along the cylinder. At 30 bar, the heating began and the temperature increased and overshot slightly. Since the thermostat was attached to the shoulder of the cylinder, the temperature measured there is closest to the preset 30 ∘C. From there it increased by about 4.5 K with a maximum at the bottom of the cylinder. A possible reason for the cylinder being warmer at the bottom end might be the thicker wall at the shoulder that results in a bigger thermal mass and the additional heat band at the bottom of the cylinder. Due to the inconsistency of the two runs, it is impossible to tell whether the mixing induced by convection prevented thermal fractionation or not. Two vertically positioned cylinders were measured with burst heating up to 30 ∘C, starting at 50 bar. The first cylinder did not seem to be affected by the heat burst; before heating the CO2 mole fraction was stable at 401.91±0.02 µmol mol−1, and after heating the CO2 mole fraction followed the same pattern as with vertically positioned high-flow experiments with no heating, resulting in a CO2 enrichment of 0.15 µmol mol−1. Unfortunately, the measurement cycle started a full calibration at about 52 bar, which is why there are no CO2 data while heating. Also the temperature data logging stopped working after 4 h, missing the interesting part of the experiment. In the second run, the CO2 mole fraction was stable at 401.71±0.02 µmol mol−1 before the heating was switched on. With the beginning of the heating, the CO2 mole fraction increased by about 0.10 µmol mol−1, but again a full calibration obscures partly what happened during the heat burst. When the heaters were turned off, the CO2 mole fraction fell back on values similar to high-flow runs with vertical cylinders without heating and followed their enrichment pattern from there. The enrichment from the beginning of the heating until the cylinder was empty corresponded to 0.13 µmol mol−1 (Fig. 17). Initially the temperature development looks about the same as for other vertically positioned cylinders: the temperature is coolest at the bottom and highest at the shoulder. After the heating was switched on, the temperature gradient was inverted almost immediately and after about 1 h the set temperature was reached. As soon as the heat bands were switched off, the temperature began to sink and the temperature gradient turned back eventually (Fig. 16b). The two experiments showed that quick heat bursts have only a short effect on the sampling gas and are not sufficient to produce much mixing of the cylinder gas.
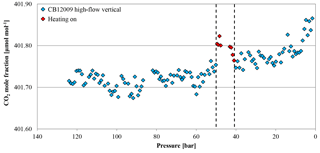
Figure 17CO2 mole fraction of a high-flow experiment as a function of pressure; note the inverse x axis. The cylinder (CB12009 on 26 September 2017) was vertically positioned throughout the whole experiment. The CO2 mole fraction was measured down to 50 bar (blue diamonds). At 50 bar (indicated by the first dashed line), the heating was switched on but the CO2 measurements continued during the heating phase (red diamonds). After the heating's thermostat indicated that the cylinder reached 30 ∘C, the heating was switched off (indicated by the second dashed line) and the CO2 mole fraction was measured until the end (again blue diamonds).
4.1 Low-flow measurements
The low-flow measurements with cylinders vertically positioned show repeatedly comparable CO2 enrichment with decreasing pressure. Neither the normal nor the SGS cylinders showed any unique features with respect to CO2 enrichment. Therefore, the conclusion can be drawn that the observed CO2 enrichment for ambient level CO2-in-dry-air mixtures stored in this type of aluminum cylinder is universal. The only low-flow temperature measurement available was done on one of two horizontally positioned cylinders. Towards the end of these measurements, the laboratory's air conditioning was not very stable, varying by up to 1.5 K. The temperature variation is also visible in the CO2 mole fraction of two cylinders measured, making it impossible to calculate the CO2 enrichment of this run properly. However, during the first few days, when the background temperature was more stable, the temperature measurements also reveal that the slow pressure drop of the low-flow setting does not cause a big temperature drop in the cylinders. Therefore, the CO2 enrichment in the low-flow experiments is most probably not temperature driven, but rather caused by CO2 desorbing from the walls with decreasing pressure, following Langmuir's adsorption–desorption model. Assuming a pressure of 150 bar, a K value of 0.001 bar−1 and using these values in Langmuir's equation predicts occupation of the available wall spaces of about 13 %. Using a very simplified geometrical approach results in a higher estimate of the occupied wall spaces. Assuming the inner surface of the cylinder Acyl is 0.75 m2, the area a CO2 molecule occupies corresponds to the collision diameter squared ( m), the number of molecules per mole is defined as mol−1, a pressure of P=150 bar, a volume of Vcyl=29.5 L, a temperature of T=293.15 K, and using the µmol mol−1 from the low-flow measurements, the fraction of occupied spaces can be calculated to be %. There is not enough information in the data to determine which of the two numbers is closer to reality. As mentioned in the methods section, a range of solutions can reproduce the observed enrichment at a pressure of 1 bar. But since with higher K values the enrichment effect becomes more and more pronounced at lower pressures, so that the observed shape can not be met, K and the corresponding coverage factor θ (at 150 bar) have to be low. A second conclusion is that the aluminum cylinders are a good choice to store CO2-in-dry-air mixtures. In the case of gravimetrically prepared standards, the CO2 mole fraction is calculated by weighing the CO2 and the air that have been added to the cylinder. Because part of the CO2 is adsorbed by the cylinder wall, the assigned CO2 mole fraction of the sample gas might be overestimated, leading to a small bias in the calibration of CO2 measurements if not corrected properly. This effect is likely worse with smaller cylinders, where the surface-to-volume ratio is bigger and should be taken into account when preparing CO2 standards gravimetrically or when preparing mother–daughter cylinders for comparison projects between different analyzers and/or laboratories.
4.2 High-flow measurements
The CO2 enrichment in the high-flow measurement with vertically positioned cylinders was on average 2.5 times higher than in the low-flow measurements. This corresponds well with the value of 0.047 µmol mol−1 found by Leuenberger et al. (2015) in a similar experiment. However, since the cylinders for the low-flow and the high-flow experiments were prepared the same way, there is no reason why the CO2 adsorbed by the wall should be that much higher. Also the ratio of the adsorption–desorption rate (K), although slightly temperature dependent, does not explain the difference of the CO2 enrichment between the low and the high-flow experiments. Following the van't Hoff equation (van't Hoff, 1900), assuming a desorption energy of −10 kJ mol−1 and using the maximum measured temperature drop of about 10 K, the coefficient K would only vary by about 10 %. But as mentioned in the methods section, the fit function is very insensitive to K anyway. A possible explanation for the stronger CO2 enrichment might be thermally driven processes. As the air expands inside the cylinder because the pressure drops, it will undergo adiabatic cooling. The cooling will be partially shared with the cylinder wall through circulation and diffusion of the air. The air will circulate because the air near the walls will tend to remain warmer than in the core. The temperature measurements during the high-flow experiments with vertically positioned cylinders show a temperature drop of about 2.5 K at the cylinder surface caused by the pressure drop. The temperature difference between the different levels becomes gradually bigger and is about 0.5 K between the top and the bottom end at the end of the run. This is consistent with cool air sinking in the cylinder while warmer air is rising. Assuming that there are only slow laminar flows in the cylinder and because air is a poor heat conductor, it is likely that the air inside the cylinder is forming a considerably cooler core. In equilibrium, CO2 will be depleted slightly in air that is warmer and in contact with air that is cooler by ∼0.06 ppm K−1 at 400 ppm (Chapman and Cowling, 1970). The upright position of the cylinder might add to the effect by separating the warm and the cool end spatially. By draining gas from the cylinder, the warm depleted air comes out first and leaves slightly CO2-enriched air in the cylinder. The cooler CO2-enriched air follows later. Plotting ln(X∕X0), corrected for Langmuir desorption using the low-flow coefficients, against −ln(P∕P0), the points line up nicely with a slope of 1α, supporting the idea of Rayleigh fractionation being partly responsible for the CO2 enrichment in the high-flow experiments (Fig. 9). We also have to remember that in this situation the cylinder air is not perfectly mixed any more, and the air leaving the cylinder does not sample the cylinder uniformly.
Besides adsorption–desorption effects, Rayleigh fractionation seems to be at work in the high-flow measurements with a horizontal positioned cylinder as well, causing a net decrease in the CO2 mole fraction with decreasing pressure. When looking at the logarithmic plot (Fig. 9), the points form first a plateau with stable CO2 mole fractions. The points seem to indicate an onset of Rayleigh fractionation when the cylinder is half empty. This is also the moment when the measured temperature difference between the lower and the upper side reaches its maximum, which is maintained until the end of the measurement. An approximate possible explanation might be found by consulting the temperature measurements (Fig. 11). The temperature gradients along the cylinder and between the upper and the lower side change with decreasing pressure. At the very start there is almost no gradient visible, neither along the cylinder nor between the upper and the lower side. Between the start and 75 % of the initial pressure, the temperature measurements indicate a cooling at the cylinder's shoulder and at the lower side. The cooling of the shoulder is most probably induced by heat conduction from the cylinder through the cylinder valve to the even cooler regulator. When the cylinder is half empty, the whole temperature distribution starts to shift. The temperature gradient along the upper side seems to mirror the temperature gradient along the lower side, with the difference in the middle of the cylinder body being highest. Until now, the cooler air was always close to the valve, while the warmer air was at the upper bottom end of the cylinder. In the cooler air, CO2 becomes enriched and is drained out first based on its proximity to the valve. Therefore, the air remaining in the cylinder becomes slowly depleted in CO2. Additionally, the warmer air at the upper bottom side might impair or even block off convection, enhancing the depletion. As the pressure drop in the regulator gradually decreases, the cooling at the valve end becomes weaker and starts to warm up, slightly affecting the shoulder, too. With the pressure decreasing further and the air at the valve end being removed steadily, the warmer air from the upper bottom of the cylinder that is now depleted in CO2 gradually becomes sample air. A second factor might be that the colder air has slightly lower viscosity. At the end of the run, the most depleted air from the farthest end of the cylinder is moved to the valve by expansion and causes the lowermost CO2 measurements. This observation will need to be explained by a model of the expansion and outflow, combined with circulation, heat conduction and diffusive mixing in the cylinder.
When the cylinders are moved during the measurements, it becomes obvious that the air in the cylinder is separated into different air masses of different temperatures. If a cylinder's orientation is changed from a vertical to a horizontal position, the temperature gradient initially remains the same along the cylinder body. A temperature difference between the now lower and upper cylinder wall starts to build up. The conservation of the gradient's vertical orientation proves that the jump in the CO2 mole fraction that occurs when a cylinders orientation is changed is in accordance with the aforementioned thermal diffusion fractionation, where CO2 gets enriched in cool air that accumulates at the bottom of the cylinder. By laying it down, the cool CO2-enriched air flows along the cylinder to the valve and is drained, while the CO2-depleted warmer air goes to the upper side of the cylinder. The cool air gets warmed by the cylinder wall and a weak convection is started that mixes the lower layers of air in the cylinder. With further decreasing pressure and gas expansion, the depleted air from the upper side gets mixed into the drained air, thereby causing the CO2 decrease measured by the system. In the opposite case in which the cylinder is horizontal first and then put up into a vertical position, the cool air sinks to the bottom and the warm depleted air goes up to the top where it gets drained first. That causes the initial CO2 drop after the repositioning. The cooler CO2-enriched air at the bottom gets again warmed by the cylinder walls, inducing a weak convection. Due to the convection and the gas expansion caused by the decreasing pressure, CO2-enriched air gets increasingly mixed into the drained air causing the measured increase in the CO2 mole fraction.
With the three cylinders that were moved upside down, the picture is not very clear. Also the results from the experiments with constant heating from a pressure of 30 bar to 1 bar do not draw a distinct picture. While the first cylinder does not seem to be affected by the heating, the second shows a drop in the CO2 mole fraction and remains stable until the end of the experiment. Since the temperature gradient between the bottom and the valve end is quite large while heating, the CO2 drop could be caused by mixing of the air masses due to convection induced by the heating. But why only one cylinder shows that feature while the other has a stable CO2 mole fraction throughout the whole experiment remains unclear. Burst heating has only a short-term effect. Since the heat burst is not able to penetrate deep into the air in the cylinder, it affects only the outermost layers. The temperature measurements show that the cylinder becomes warmer at the bottom than at the valve end, probably due to the ninth heat band at the bottom and the slight cooling of the regulator at the valve end. This might cause the outermost CO2-enriched layers from the bottom to rise and generate the measured CO2 peak when it reaches the valve. The effect is transient, finishing before the heating is finished. Shortly after the heating is stopped, the inversed temperature gradient returns to its usual distribution, supporting the assumption that the heat burst did not penetrate deeply into the cylinder gas. This is also backed by the measurements of the CO2 mole fraction that besides the short spike show a similar CO2 increase to the vertically positioned cylinder in high-flow mode.
Six 29.5 L Luxfer L6X® as well as two 29.5 L Luxfer L6X® SGS aluminum cylinders were used to investigate the stability of the CO2 mole fraction of ambient level CO2-in-air mixtures with decreasing pressure. In low-flow settings (0.3 L min−1), the Langmuir adsorption–desorption model using averaged coefficients is sufficient to describe the CO2 enrichment. With this function, the CO2 enrichment over a pressure range of 150 to 1 bar was calculated to be 0.090±0.009 µmol mol−1, where the given error corresponds to the standard deviation (1σ) of the fitted CO2 enrichment of the individual cylinder drainings. The tested aluminum cylinders behaved always the same within uncertainties; the individual cylinders did not show distinct unique features. This is also true for the SGS cylinders, indicating no benefit in using these tanks for CO2 measurements at ambient level. This opens the possibility to use a general correction function in case a calibration cylinder on a field station runs empty. However, we still recommend changing calibration cylinders before the pressure drops below 30 bar in order to avoid the steepest part of the enrichment at the lowest pressures and the corrections that add uncertainty to the measurements. At the same time the currently recommended threshold of 20 bar (WMO, 2016) is supported by measurements of this study. Using the low-flow coefficients for the Langmuir model, a drop from 150 to 30 bar results in a CO2 enrichment of about 0.026 µmol mol−1, whereas a drop from 150 to 20 bar yields a CO2 enrichment of 0.034 µmol mol−1, which is still well within the WMO compatibility goal between laboratories. By using bigger cylinders (e.g., 50 L) the surface-to-volume ratio becomes smaller compared to the 29.5 L cylinders used in this study, which might be beneficial in minimizing the CO2 enrichment effect at lower pressures. We discourage the use of smaller cylinders as their surface-to-volume ratio increases. Approximating the top and bottom area of a cylinder as a disk perpendicular to the cylinder length (l), and assuming that the effective adsorption area remains the same where the radius (r) has been compressed, the surface-to-volume ration scales as (2πrl + 2/rl. We expect a commonly used Luxfer N060 (internal volume 10.7 L) to be worse by ∼30 %.
In high-flow settings (5.0 L min−1), additional thermal diffusion effects and Rayleigh fractionation come into play that add to, or can overrule, the simultaneously ongoing Langmuir adsorption–desorption. Depending on the positioning of the cylinder, CO2 can be increasing or decreasing with decreasing pressure. We have demonstrated that these effects very likely do play a role, but before a satisfactory explanation can be attempted a considerable number of additional controlled experiments, as well as modeling of the flow and mixing in cylinders, will be necessary. A further benefit could be gained by using a CRDS (cavity ring-down spectroscopy) gas analyzer because it does not need to be calibrated as often as an NDIR analyzer and it could measure several gas species, such as CH4 or CO, simultaneously.
All data are publicly available at https://doi.org/10.15138/G3263N (Schibig et al., 2018).
MFS, DK and PPT designed the experiments. DK provided the gas tanks and was responsible for the fillings. PPT developed the model in Sect. 2.4.2. MFS was responsible for the measurement system as well as the data analysis and prepared the manuscript with contributions from all co-authors.
The authors declare that they have no conflict of interest.
The authors like to thank Philip Handley, Jonathan Kofler, Tim Newberger,
Jack A. Higgs and Thomas Legard for their technical support to build and
maintain the CO2 measurement system as well as Allen Jordan and Emrys
Hall for their help and expertise to build and run the temperature
measurement system. Michael F. Schibig is supported by an Early Postdoc
Mobility fellowship from the Swiss National Science Foundation (SNSF).
Edited by: Brigitte Buchmann
Reviewed by: two anonymous referees
Andrews, A. E., Kofler, J. D., Trudeau, M. E., Williams, J. C., Neff, D. H., Masarie, K. A., Chao, D. Y., Kitzis, D. R., Novelli, P. C., Zhao, C. L., Dlugokencky, E. J., Lang, P. M., Crotwell, M. J., Fischer, M. L., Parker, M. J., Lee, J. T., Baumann, D. D., Desai, A. R., Stanier, C. O., De Wekker, S. F. J., Wolfe, D. E., Munger, J. W., and Tans, P. P.: CO2, CO, and CH4 measurements from tall towers in the NOAA Earth System Research Laboratory's Global Greenhouse Gas Reference Network: instrumentation, uncertainty analysis, and recommendations for future high-accuracy greenhouse gas monitoring efforts, Atmos. Meas. Tech., 7, 647–687, https://doi.org/10.5194/amt-7-647-2014, 2014.
Brewer, P. J., Brown, R. J. C., Resner, K. V., Hill-Pearce, R. E., Worton, D. R., Allen, N. D. C., Blakley, K. C., Benucci, D., and Ellison, M. R.: Influence of Pressure on the Composition of Gaseous Reference Materials, Anal. Chem., 90, 3490–3495, https://doi.org/10.1021/acs.analchem.7b05309, 2018.
Chapman, S. and Cowling, T. G.: The Mathematical Theory of Non-uniform Gases: An Account of the Kinetic Theory of Viscosity, Thermal Conduction and Diffusion in Gases, illustrated, 3rd ed., Cambridge University Press, Cambridge, England, 1970.
Hofmann, D. J., Butler, J. H., Dlugokencky, E. J., Elkins, J. W., Masarie, K., Montzka, S. A., and Tans, P.: The role of carbon dioxide in climate forcing from 1979 to 2004: introduction of the Annual Greenhouse Gas Index, Tellus B, 58, 614–619, https://doi.org/10.1111/j.1600-0889.2006.00201.x, 2006.
IPCC: Climate Change 2013: The Physical Science Basis. Contribution of Working Group I to the Fifth Assessment Report of the Intergovernmental Panel on Climate Change, Cambridge University Press, Cambridge, UK and New York, NY, USA, 1535 pp., 2013.
Keeling, R. F., Manning, A. C., Paplawsky, W. J., and Cox, A. C.: On the long-term stability of reference gases for atmospheric O2∕N2 and CO2 measurements, Tellus B, 59, 3–14, https://doi.org/10.1111/j.1600-0889.2006.00228.x, 2007.
Kitzis, D. R.: Preparation and Stability of Standard Reference Air Mixtures: available at: https://www.esrl.noaa.gov/gmd/ccl/airstandard.html (last access: 25 January 2018), 2017.
Langenfelds, R. L., van der Schoot, M. V., Francey, R. J., Steele, L. P., Schmidt, M., and Mukai, H.: Modification of air standard composition by diffusive and surface processes, J. Geophys. Res.-Atmos., 110, D13307, https://doi.org/10.1029/2004JD005482, 2005.
Langmuir, I.: The constitution and fundamental properties of solids and liquids, Part I. Solids, J. Am. Chem. Soc., 38, 2221–2295, https://doi.org/10.1021/ja02268a002, 1916.
Langmuir, I.: The adsorption of gases on plane surfaces of glass, mica and platinum, J. Am. Chem. Soc., 40, 1361–1403, https://doi.org/10.1021/ja02242a004, 1918.
Leuenberger, M. C., Schibig, M. F., and Nyfeler, P.: Gas adsorption and desorption effects on cylinders and their importance for long-term gas records, Atmos. Meas. Tech., 8, 5289–5299, https://doi.org/10.5194/amt-8-5289-2015, 2015.
Masarie, K. A., Pétron, G., Andrews, A., Bruhwiler, L., Conway, T. J., Jacobson, A. R., Miller, J. B., Tans, P. P., Worthy, D. E., and Peters, W.: Impact of CO2 measurement bias on CarbonTracker surface flux estimates, J. Geophys. Res.-Atmos, 116, D17305, https://doi.org/10.1029/2011JD016270, 2011.
Matsubaya, O. and Matsuo, S.: Limitation to the application of Rayleigh distillation, Geochem. J., 16, 149–156, https://doi.org/10.2343/geochemj.16.149, 1982.
Miller, W. R., Rhoderick, G. C., and Guenther, F. R.: Investigating Adsorption/Desorption of Carbon Dioxide in Aluminum Compressed Gas Cylinders, Anal. Chem., 87, 1957–1962, https://doi.org/10.1021/ac504351b, 2015.
Rayleigh, L.: LIX. On the distillation of binary mixtures, The London, Edinburgh, and Dublin Philosophical Magazine and Journal of Science, 4, 521–537, https://doi.org/10.1080/14786440209462876, 1902.
Schibig, M. F., Steinbacher, M., Buchmann, B., van der Laan-Luijkx, I. T., van der Laan, S., Ranjan, S., and Leuenberger, M. C.: Comparison of continuous in situ CO2 observations at Jungfraujoch using two different measurement techniques, Atmos. Meas. Tech., 8, 57–68, https://doi.org/10.5194/amt-8-57-2015, 2015.
Schibig, M. F., Kitzis, D., and Tans, P. P.: Experiments with CO2 -in-air reference gases in high-pressure aluminum cylinders, Atmos. Meas. Tech. Discuss., https://doi.org/10.5194/amt-2018-42, 2018 (data available at: https://doi.org/10.15138/G3263N, last access: 10 October 2018).
Steinhart, J. S. and Hart, S. R.: Calibration curves for thermistors, Deep-Sea Res., 15, 497–503, https://doi.org/10.1016/0011-7471(68)90057-0, 1968.
van't Hoff, J. H.: Die Gesetze des chemischen Gleichgewichtes für den verdünnten, gasförmigen oder gelösten Zustand, 17, Verlag von Wilhelm Engelmann, Leipzig, Germany, 1900.
WMO: 13th WMO/IAEA Meeting of Experts on Carbon Dioxide Concentration and Related Tracers Measurement Techniques, Boulder, CO, USA, 19–22 September 2005, GAW Report No. 168, World Meteorological Organization, Geneva, Switzerland, 2006.
WMO: 14th WMO/IAEA Meeting of Experts on Carbon Dioxide Concentration and Related Tracers Measurement Techniques, Helsinki, Finland, 10–13 September 2006, GAW Report No. 186, World Meteorological Organization, Geneva, Switzerland, 2007.
WMO: 15th WMO/IAEA Meeting of Experts on Carbon Dioxide Concentration and Related Tracers Measurement Techniques, Jena, Germany, 7–10 September 2009, GAW Report No. 194, World Meteorological Organization, Geneva, Switzerland, 2011.
WMO: 16th WMO/IAEA Meeting of Experts on Carbon Dioxide Concentration and Related Tracers Measurement Techniques (GGMT-2011), Wellington, New Zealand, 25–28 October 2011, GAW Report No. 206, World Meteorological Organization, Geneva, Switzerland, 2012.
WMO: 17th WMO/IAEA Meeting of Experts on Carbon Dioxide Concentration and Related Tracers Measurement Techniques (GGMT-2013), Beijing, China, 10–13 October 2013, GAW Report No. 213, World Meteorological Organization, Geneva, Switzerland, 2014.
WMO: 18th WMO/IAEA Meeting of Experts on Carbon Dioxide Concentration and Related Tracers Measurement Techniques (GGMT-2015), La Jolla, CA, USA, 13–17 September 2015, GAW Report No. 229, World Meteorological Organization, Geneva, Switzerland, 2016.
Zellweger, C., Emmenegger, L., Firdaus, M., Hatakka, J., Heimann, M., Kozlova, E., Spain, T. G., Steinbacher, M., van der Schoot, M. V., and Buchmann, B.: Assessment of recent advances in measurement techniques for atmospheric carbon dioxide and methane observations, Atmos. Meas. Tech., 9, 4737–4757, https://doi.org/10.5194/amt-9-4737-2016, 2016.
Zhao, C. L. and Tans, P. P.: Estimating uncertainty of the WMO mole fraction scale for carbon dioxide in air, J. Geophys. Res.-Atmos., 111, D08S09, https://doi.org/10.1029/2005JD006003, 2006.
Zhao, C. L., Tans, P. P., and Thoning, K. W.: A high precision manometric system for absolute calibrations of CO2 in dry air, J. Geophys. Res.-Atmos., 102, 5885–5894, https://doi.org/10.1029/96JD03764, 1997.


