the Creative Commons Attribution 3.0 License.
the Creative Commons Attribution 3.0 License.
High-range resolution spectral analysis of precipitation through range imaging of the Chung-Li VHF radar
Shih-Chiao Tsai
Jenn-Shyong Chen
Yen-Hsyang Chu
Ching-Lun Su
Jui-Hsiang Chen
Multi-frequency range imaging (RIM) has been operated in the Chung-Li very high-frequency (VHF) radar, located on the campus of National Central University, Taiwan, since 2008. RIM processes the echo signals with a group of closely spaced transmitting frequencies through appropriate inversion methods to obtain high-resolution distribution of echo power in the range direction. This is beneficial to the investigation of the small-scale structure embedded in dynamic atmosphere. Five transmitting frequencies were employed in the radar experiment for observation of the precipitating atmosphere during the period between 21 and 23 August 2013. Using the Capon and Fourier methods, the radar echoes were synthesized to retrieve the temporal signals at a smaller range step than the original range resolution defined by the pulse width, and such retrieved temporal signals were then processed in the Doppler frequency domain to identify the atmosphere and precipitation echoes. An analysis called conditional averaging was further executed for echo power, Doppler velocity, and spectral width to verify the potential capabilities of the retrieval processing in resolving small-scale precipitation and atmosphere structures. Point-by-point correction of range delay combined with compensation of range-weighting function effect has been performed during the retrieval of temporal signals to improve the continuity of power spectra at gate boundaries, making the small-scale structures in the power spectra more natural and reasonable. We examined stratiform and convective precipitation and demonstrated their different structured characteristics by means of the Capon-processed results. The new element in this study is the implementation of RIM on spectral analysis, especially for precipitation echoes.
- Article
(16782 KB) - Full-text XML
- BibTeX
- EndNote


For decades, radars have been used to investigate various phenomena in the Earth's atmosphere, with a detection height ranging from the atmospheric boundary layer at an altitude of hundreds of meters to the ionosphere at an altitude of hundreds of kilometers. In 1974, a very high-frequency (VHF) radar with phased array was first employed to observe clear-air turbulence and atmospheric wind fields in the troposphere, stratosphere, and mesosphere (Woodman and Guillen, 1974), later termed MST (mesosphere–stratosphere–troposphere) radar. This type of radar receives the radar echoes scattered or reflected from the atmospheric refractivity irregularities, and it can also detect the echoes from raindrops, ice crystals, and snowflakes through Rayleigh scattering. In the precipitation observations with VHF radars, the terminal velocities of rain drops can be estimated from the Doppler spectra of precipitation and clear-air echoes (Fukao et al., 1985; Larsen and Röttger, 1987; Chilson et al., 1993). Moreover, VHF radars can also be used to examine the height of the melting layer, the sizes and distributions of precipitation particles, and so on (Chu et al., 1991; Chu and Lin, 1994; Rao et al., 1999; Su et al., 2009).
VHF phased-array radars for atmospheric observations typically transmit pulse with a finite coverage in range. The range resolution of pulsed radar echoes can be improved either by using pulse coding technique or by shortening the pulse width. However, a shorter pulse width contains less power and reduces the detectable height. In view of this, Franke (1990) introduced a frequency-hopped technique to the VHF pulsed radar. In its early stage of development, the frequency-hopped technique used only two frequencies, alternately, for transmission and was used to examine a Gaussian-distributed atmospheric layer structure in the range gate. Chilson et al. (2003) implemented the frequency-hopped technique using more than two frequencies in an ultra-high-frequency (UHF) radar, which facilitates the investigation of Kelvin–Helmholtz instabilities and the dynamics of subsidence inversion. The frequency-hopped technique with several frequencies, commonly referred to as range imaging (RIM; Palmer et al., 1999) or frequency domain radar interferometric imaging (FII; Luce et al., 2001), has been useful for remote sensing of the atmosphere. Further investigations of the RIM technique and its applications have been made by many researchers (Luce et al., 2007, 2010; Chen et al., 2016a, b; Chilson et al., 2001; Chilson, 2004; Yu et al., 2010, and the references therein). Among numerous previous studies of RIM, Chilson et al. (2001) and Luce et al. (2007) compared the generalized refractive index profiles estimated from radiosonde data and the echo power (brightness distribution) retrieved from the RIM, and demonstrated that the vertical structures in the troposphere identified by the RIM technique were natural phenomena and not artificial results. In a later study, Chilson (2004) applied time-signal inversion process to the RIM data to obtain temporal signals in sub-gates and executed the spectral analysis for each sub-gate, giving high-resolution spectra of the atmospheric echoes in the range direction. To improve the continuity of the brightness distribution through the range gate boundaries, Chen and Zecha (2009) developed a calibration process for the RIM, and in a later study Chen et al. (2016a) proposed further a procedure of point-by-point calibration for the RIM analysis of precipitation echoes in the time domain. Such a calibration procedure was applied in this study.
VHF radar is more capable of monitoring the atmosphere and precipitation simultaneously than conventional weather radar. To examine the respective characteristics of precipitation and atmosphere, separation of precipitation and atmospheric echoes, typically through spectral analysis, is necessary. Usually, we can identify atmospheric and precipitation echoes in the Doppler spectra, and employ the moment method to estimate the atmospheric and precipitation parameters (e.g., echo power, Doppler velocity, and spectral width). In the time domain, however, Palmer et al. (2005) used high-pass and low-pass filters to separate atmospheric and precipitation echoes and explored the effects of turbulence on precipitation. In a different way, Williams (2012) conducted a campaign with VHF and UHF radars, and separated hydrometeor motions, to which the UHF radar is sensitive, from the echo spectra of the VHF radar. Furthermore, Gan et al. (2015) also proposed some methods to separate clear-air echoes from hydrometeor echoes for reducing errors of spectral parameters.
Based on the aforementioned progress in the radar remote sensing of atmosphere using multi-frequency techniques, we made a study of precipitation, using the time-signal inversion process of RIM data as well as the calibration procedures developed by Chen and Zecha (2009) and Chen et al. (2016a). The observed data were collected during 21–23 August 2013, from the Chung-Li VHF radar located in northwestern Taiwan. The time-signal inversion and the calibration process in the RIM analysis are reviewed in Sect. 2. The experimental setup of the Chung-Li VHF radar and a two-dimensional optical disdrometer are described in Sect. 3. In Sect. 4, a comparison of Fourier RIM and Capon RIM spectral analyses is made. The procedure of point-by-point calibration (range delay and range-weighting function corrections) was applied to mitigating discontinuities in the range power spectra of the time-retrieved precipitation and atmospheric echoes. Effectiveness of the point-by-point calibration was verified in quantity, and different precipitation patterns were examined. Conclusions are drawn in Sect. 5.
2.1 Time-signal inversion and spectral analysis
Range imaging uses frequency diversity to retrieve the power density (e.g., brightness distribution) as a function of range (Palmer et al., 1999). It is similar to the coherent radar imaging (CRI), which estimates the power density as a function of angular location from the echoes received by several receiving channels (Woodman, 1997; Palmer et al., 1998).
According to Chilson (2004), by giving sn(t) as the column vector of temporal signals for N carrier-frequency pulses where n=1, …, N, the temporal signals at a specific range location can be retrieved by multiplying the original echo signals of different frequencies with their respective weightings, as expressed by
where j indicates the sub-gate in a range gate specified in the RIM process, and w is the weighting matrix (wjn is the components of w) that modulates the phases and amplitudes of radar signals to cause constructive interference at specific positions. A component of the weighting matrix based on linear approach is the Fourier method, as expressed by
where kn is the nth carrier wavenumber and rj is the sub-gate range. Another form of the weighting matrix can be derived from the Capon method (Palmer et al., 1999; Yu and Palmer, 2001). The Capon method is a self-adaptive signal processing. According to Palmer et al. (1999), the components of the weighting matrix was derived as
where ej=[ei2k1rjei2k2rj…ei2knrj]T, and V is the cross spectrum matrix (also known as the visibility spectrum) of the signals of frequency pairs. Previous studies (Palmer et al., 1998; Yu et al., 2000, 2010) suggested that the Capon method is more capable of inhibiting the noise than the Fourier method. Substituting Eq. (3) into Eq. (1) yields the temporal signals of the sub-gates.
Radar returns from different targets at different Doppler frequencies cannot be distinguished in the time-domain imaging processing. Therefore, the temporal signals are converted into the frequency domain, usually using Fourier transform, to obtain the Doppler spectra of the targets for further analysis. For a vertically pointed radar beam, the Doppler frequency shifts of precipitation echoes are always positive (toward radar) with magnitudes generally larger than those of atmospheric echoes, especially in lower atmosphere. In addition, the height variation of the Doppler velocity of the stratiform precipitation echoes is characterized by a steep gradient around melting layer zone that is responsible for bright-band structure in echo intensity. The Doppler velocity of the atmospheric echoes is relatively variable with height. These features make it possible to separate rain and atmospheric echoes in Doppler spectral domain. In our study, we dealt with the case of the raindrops with the fall velocities larger than 4 m s−1, so we set Doppler velocities between −4 and −10 m s−1 as the echoes of precipitation and between −2 and 2 m s−1 as the clear-air echoes. The moment method was used to estimate the echo powers, Doppler frequency shifts, and Doppler bandwidths of the respective echoes in the spectral domain.
The Capon method is a convenient, efficient, and robust procedure for processing the multi-frequency radar data (Yu and Palmer, 2001). Nevertheless, this method is subject to a limitation in spectral analysis. When the number of carrier frequencies used for RIM is lower than that of the spectral lines of signals (i.e., Doppler velocities of different targets), this method fails to resolve the Doppler velocities effectively and overlooks objects with weaker echo power (or brightness; Li and Stoica, 1996; Garbanzo-Salas and Hocking, 2015). In this study, only the echoes from atmospheric refractivity fluctuations and precipitation particles are concerned, and so five frequencies used for RIM to analyze the echoes from these two major targets are adequate.
2.2 Correcting time delay and range-weighting function effect
Previous studies have demonstrated that properly correcting the time delay and range-weighting function effect on the radar echoes can improve the continuity of the RIM brightness distribution at gate boundaries (Chen and Zecha, 2009). The time delay of the radar echoes occurs possibly during the propagation of signals in the media and the signal processing in the radar system, which leads to a range error in computation. On the other hand, the range-weighting function contributes different weightings to the brightness values at various range locations, which should be corrected to restore the microscale structures in the radar volume. To determine the time delay of the radar echoes and the range-weighting function, Chen and Zecha (2009) assumed that the RIM-processed brightness values around the gate boundary of two neighboring range gates could be very close to each other after proper correction. Based on this concept, an estimator for computing the mean squared error (MSE) of a pair of brightness values at two neighboring range gates was used in their study:
where B1i and B2i are the two sequences of brightness values estimated around the gate boundary and in the overlapped regions of two neighboring gates. N is the sequence number of brightness values, which is 31 in this study. For example, the sequences of B1 (B2) are the values in the lower (upper) range gate with respect to the center of the sampling range gate and thus can be estimated at the range locations between 60 and 90 m (−90 and −60 m) for a 150 m sampling gate with an imaging step of 1 m. Iterated computations with different range/time delays and range-weighting functions (Gaussian form was assumed) are executed in accordance with Eq. (4) to find the minimum value of B such that the optimal correcting parameters of range/time delay and range-weighting function are obtained. It is worth mentioning that the Capon method may give extra range weightings to the brightness values, and such an effect has been included in the range-weighting function determined from Eq. (4).
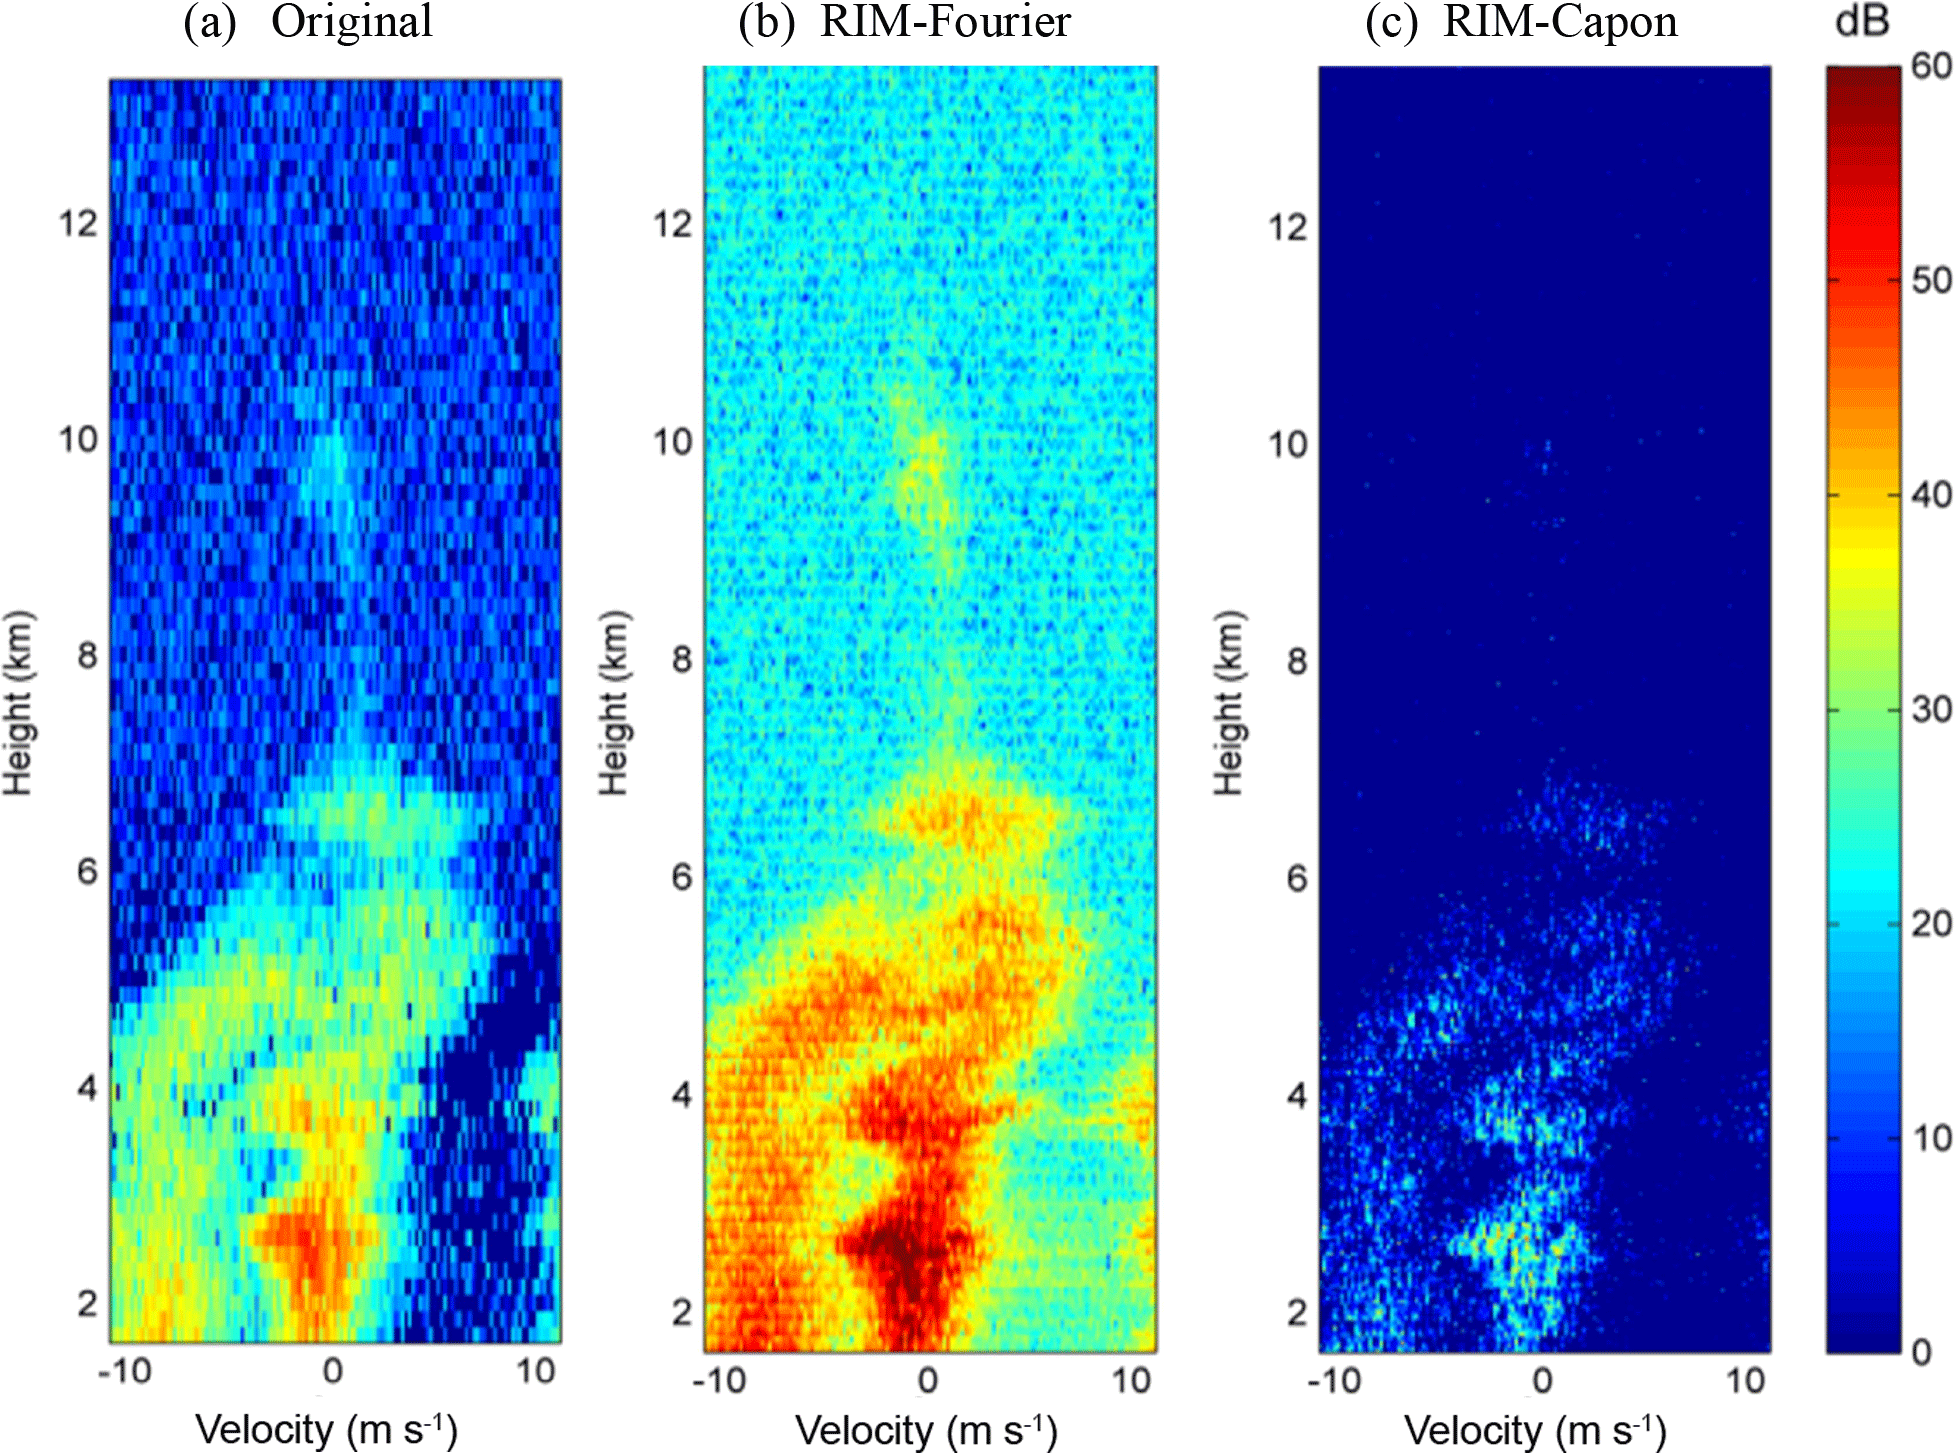
Figure 1(a) Power spectra at the original resolution of 150 m. Data time and date: 19:17:20 UT, 21 August 2013. Panels (b, c) are Fourier RIM and Capon RIM power spectra, respectively. A constant range delay and range-weighting function corrections have been made in range imaging. Imaging step is 15 m.
The Chung-Li VHF radar is a monostatic pulsed radar with three square antenna arrays arranged in a triangle. Each array consists of 64 Yagi antennas that are laid out in an 8 × 8 square, and can launch and receive signals both obliquely and vertically. After Chen et al. (2009) exhibited the first RIM observation using this radar, a large amount of RIM data have been collected by the same radar (Chen et al., 2016a). The present study employed the data collected between 21 and 23 August 2013, when the typhoon Trami passed through the Taiwan area and both stratiform and convective precipitation occurred. Observations were conducted by vertically transmitting and receiving radar signals at carrier frequencies of 51.5, 51.75, 52, 52.25, and 52.5 MHz. The following radar parameters were set: inter-pulse period of 200 µs, pulse width of 1 µs, number of coherent integrations of 128, lowest sampling height of 1.5 km, sampling step of 1 µs, and number of range gates of 80. The time interval between two data points at the same frequency was 0.128 s, that is, the product of inter-pulse period, the numbers of coherent integrations, and the number of carrier frequencies. The record length used for each estimate in the data analysis was 49 s. The range resolution was 150 m corresponding to the 1 µs pulse width, and the observational height range was between 1.5 and 13.35 km. A two-dimensional optical disdrometer installed next to the Chung-Li VHF radar site was employed to measure the raindrop size distribution, rainfall rate, fall velocities of raindrops, and shapes and sizes of the hydrometeor particles. In this study, only the rainfall rate was used to indicate the occurrence of precipitation during the VHF radar observation.
4.1 RIM power spectral analysis
On the basis of the RIM analysis procedure proposed by Palmer et al. (1999), the brightness value as a function of Doppler frequency, f, and range, r, estimated through the Fourier and Capon methods are expressed, respectively, by
Fig. 1b and c show two maps of power spectra obtained in accordance with Eqs. (5) and (6) with the same data set (19:17:20 UT, 21 August 2013). The imaging step was 15 m, with corrections of using a constant range delay and Gaussian range-weighting function. Figure 1a displays the echo spectra at the original range resolution (150 m), in which clear-air and precipitation echoes with Doppler velocities, respectively, of around −0.5 and around −8 m s−1 below the range of about 5 km were observed. As seen, the intensities of the power spectra obtained by the Fourier and Capon methods were very different. The former was much more intense than the latter by about 25 dB on average. Compared with the original power spectra, the RIM-retrieved power spectral quality seemed not to have improved, especially with the presence of salient artificial discontinuity in the height distribution of echo intensities at the edges of range gates. In view of this, the time-signal inversion made with Eq. (1) was utilized in the following analysis. Although the temporal signals can be retrieved at any range location with Eq. (1), the range resolution of the retrieved signals is subject to the limitation of the number of carrier frequencies and the radar wavelength.
Figure 2 shows the power spectra of the case shown in Fig. 1 but with the time-retrieved signals. The signal inversion was executed at a range step of 15 m. A comparison between Figs. 1 and 2 shows that, irrespective of the high degree of similarity between the Fourier-retrieved power spectra, a substantial improvement with an about 20 dB increase in intensity can be seen in the Capon-retrieved power spectra estimated with the time-retrieved signals. Nevertheless, both power spectra in Fig. 2 display marked discontinuities at range gate boundaries that are especially evident in the altitudinal variations of precipitation echoes. To improve the continuity of the retrieved power spectra at range gate boundaries for the precipitation, a point-by-point calibration of range delay and range-weighting function effect was applied, and its effectiveness was also investigated, as addressed in the following section.
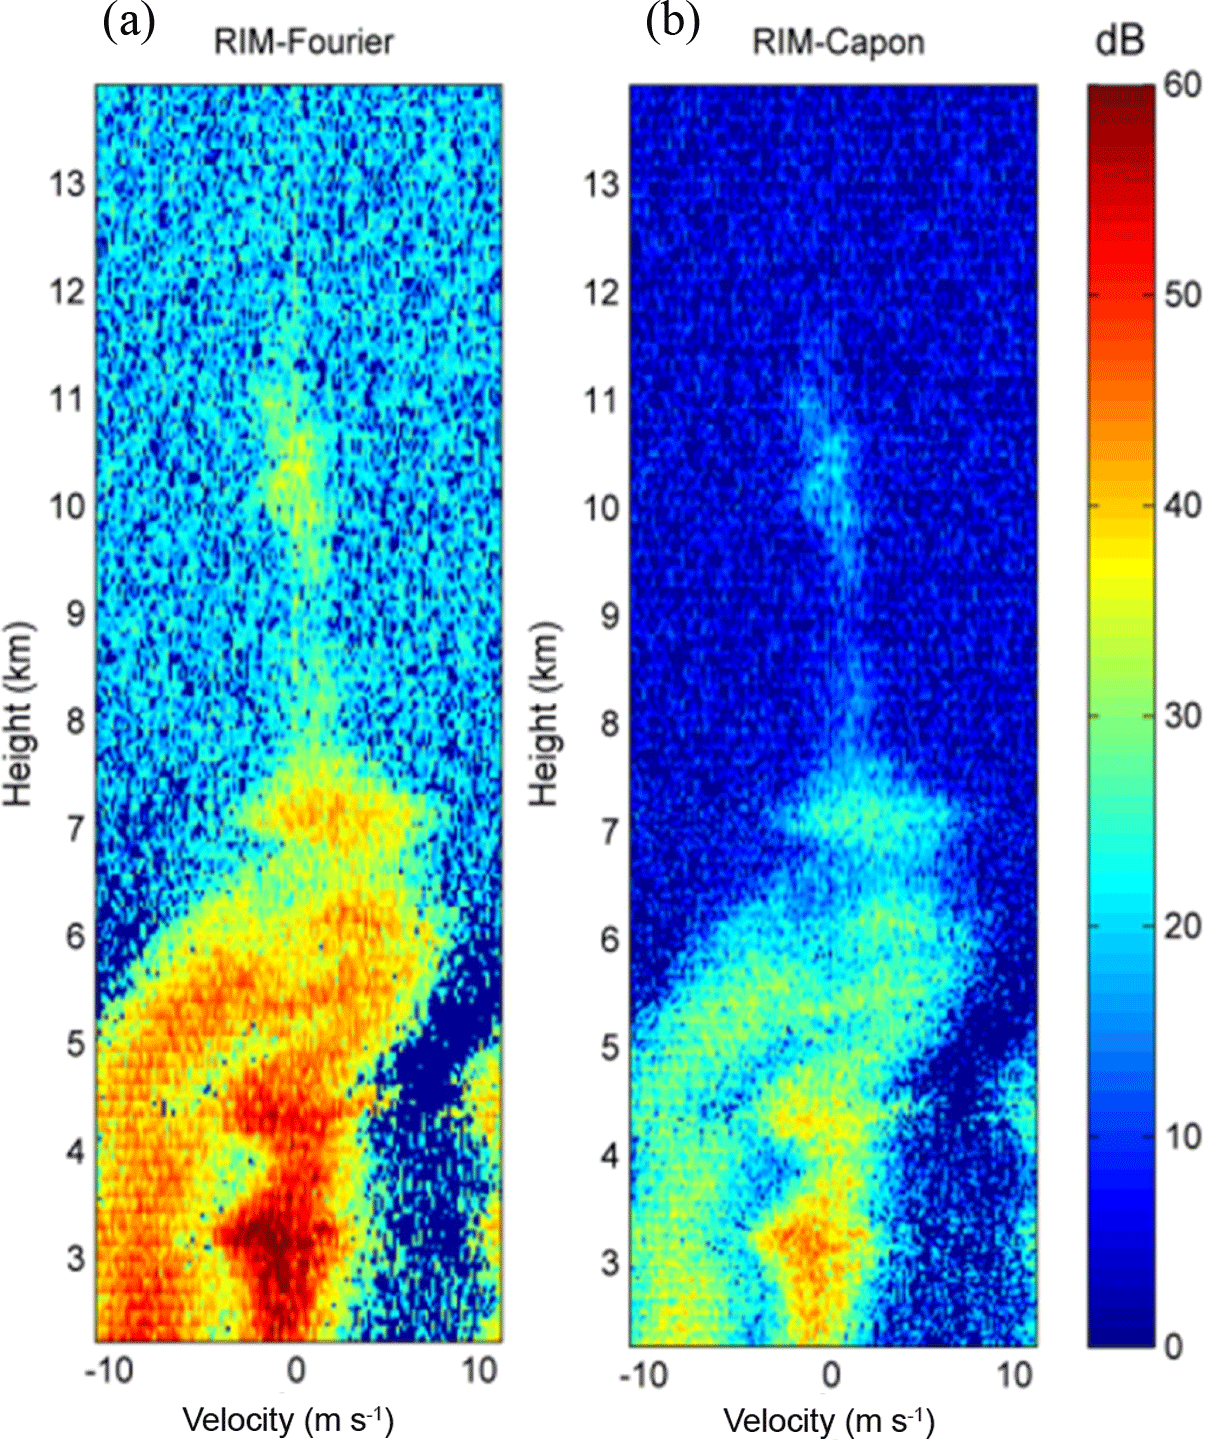
Figure 2(a) Fourier RIM and (b) Capon RIM power spectra obtained with the temporal signals retrieved from the same radar data in Fig. 1. Imaging step is 15 m.
4.2 Improvement of RIM power spectra for atmospheric and precipitation echoes
Dynamic behaviors of atmosphere and precipitation structures at small scales could be resolved in the RIM-retrieved power spectra, with very fine imaging range step (several to tens of meters) that is much smaller than the original range gate width (150 m). However, as shown in Figs. 1 and 2, the disadvantage of using RIM to process the precipitation echoes is the presence of artificial discontinuities in the power spectra at range gate boundaries; regardless, the range delay and range-weighting function effect have been corrected using the procedure used by Chen and Zecha (2009).
In order to mitigate the artificial discontinuity in power spectra at range gate boundaries, the point-by-point correcting procedure for the range delay and range-weighting function was employed (Chen et al., 2016a); the results are shown in Fig. 3. Figure 3a shows the rain rate observed by the disdrometer installed next to the Chung-Li radar site. As indicated, pronounced rain rate occurred during the period between 18:37:00 and 19:54:00 UT. Figure 3b and c are, respectively, enlarged plots of atmospheric and precipitation power spectra that are taken from Fig. 2, in which the constant range delay and Gaussian range-weighting function are used for image calibration. As seen, the discontinuities in the atmospheric power spectra were too vague to identify throughout the altitude. By contrast, the discontinuities in the precipitation power spectra were so distinct that they can be easily seen at range gate boundaries. Notice that in the calibration approach proposed by Chen and Zecha (2009), the optimal values of range delay and range-weighting function for correction were obtained by assuming a continuity of atmospheric refractivity fluctuations across the gate boundaries. However, this condition may not be valid for the precipitation particles characterized by discrete and discontinuous distribution of the hydrometeors in nature.
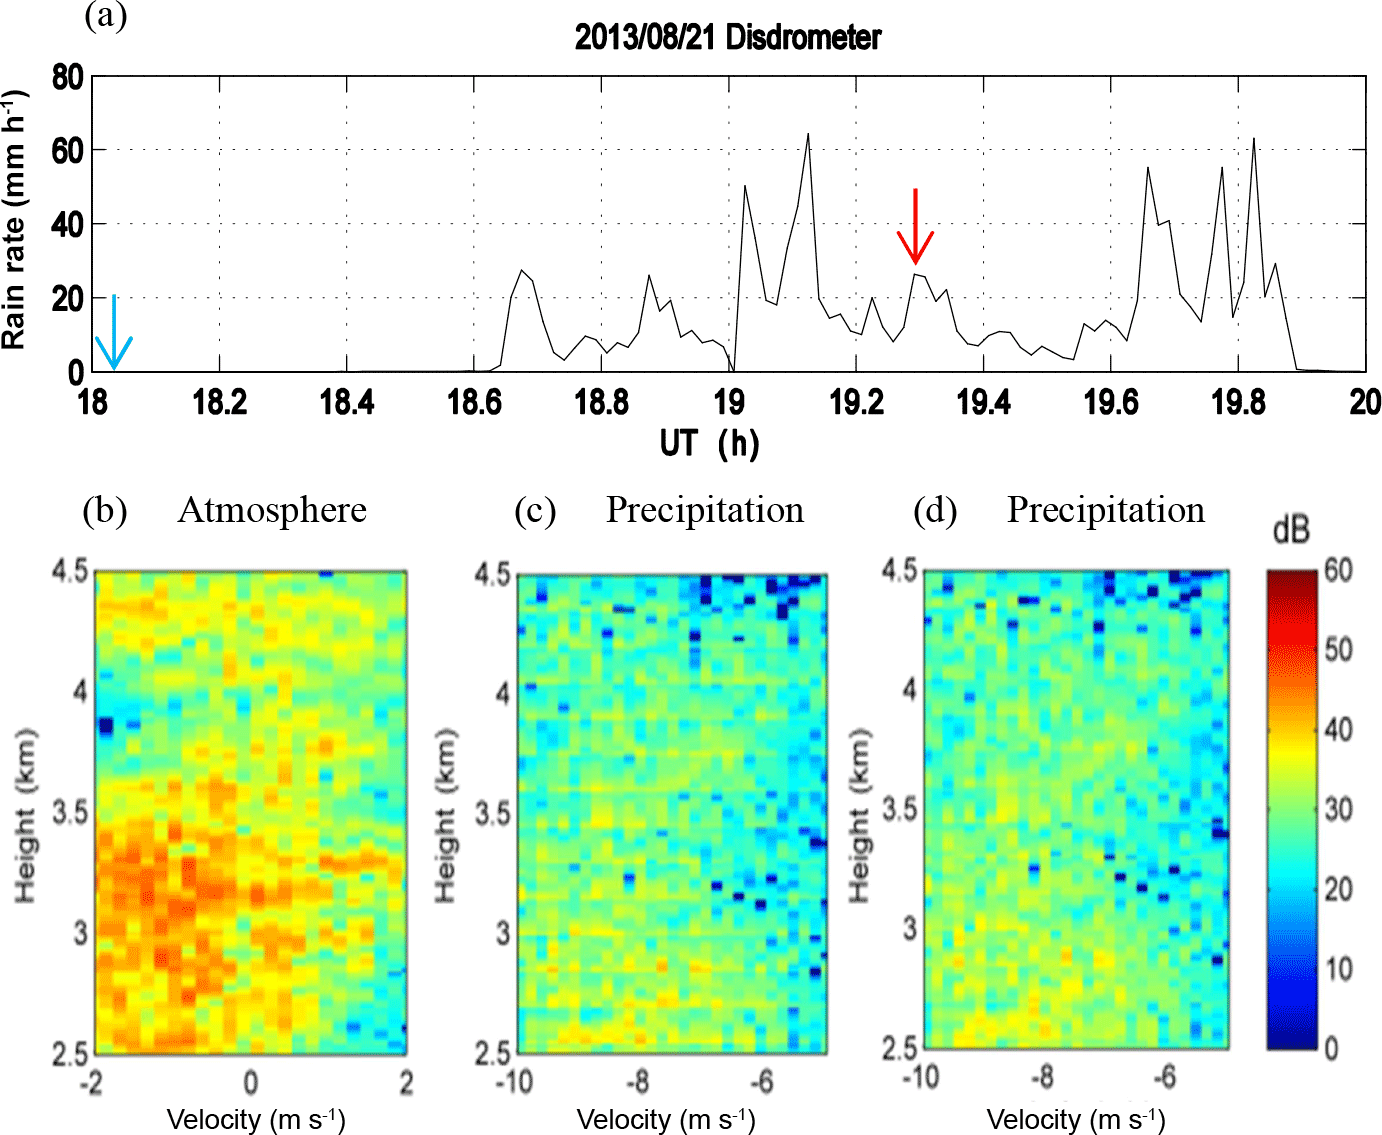
Figure 3(a) Rain rate detected by a disdrometer. Panels (b, c) are, respectively, power spectra of atmosphere and precipitation echoes at the moment indicated by the red arrow in (a). A constant range delay is used for correction. (d) Same as (c) but with point-by-point correction of range delay.
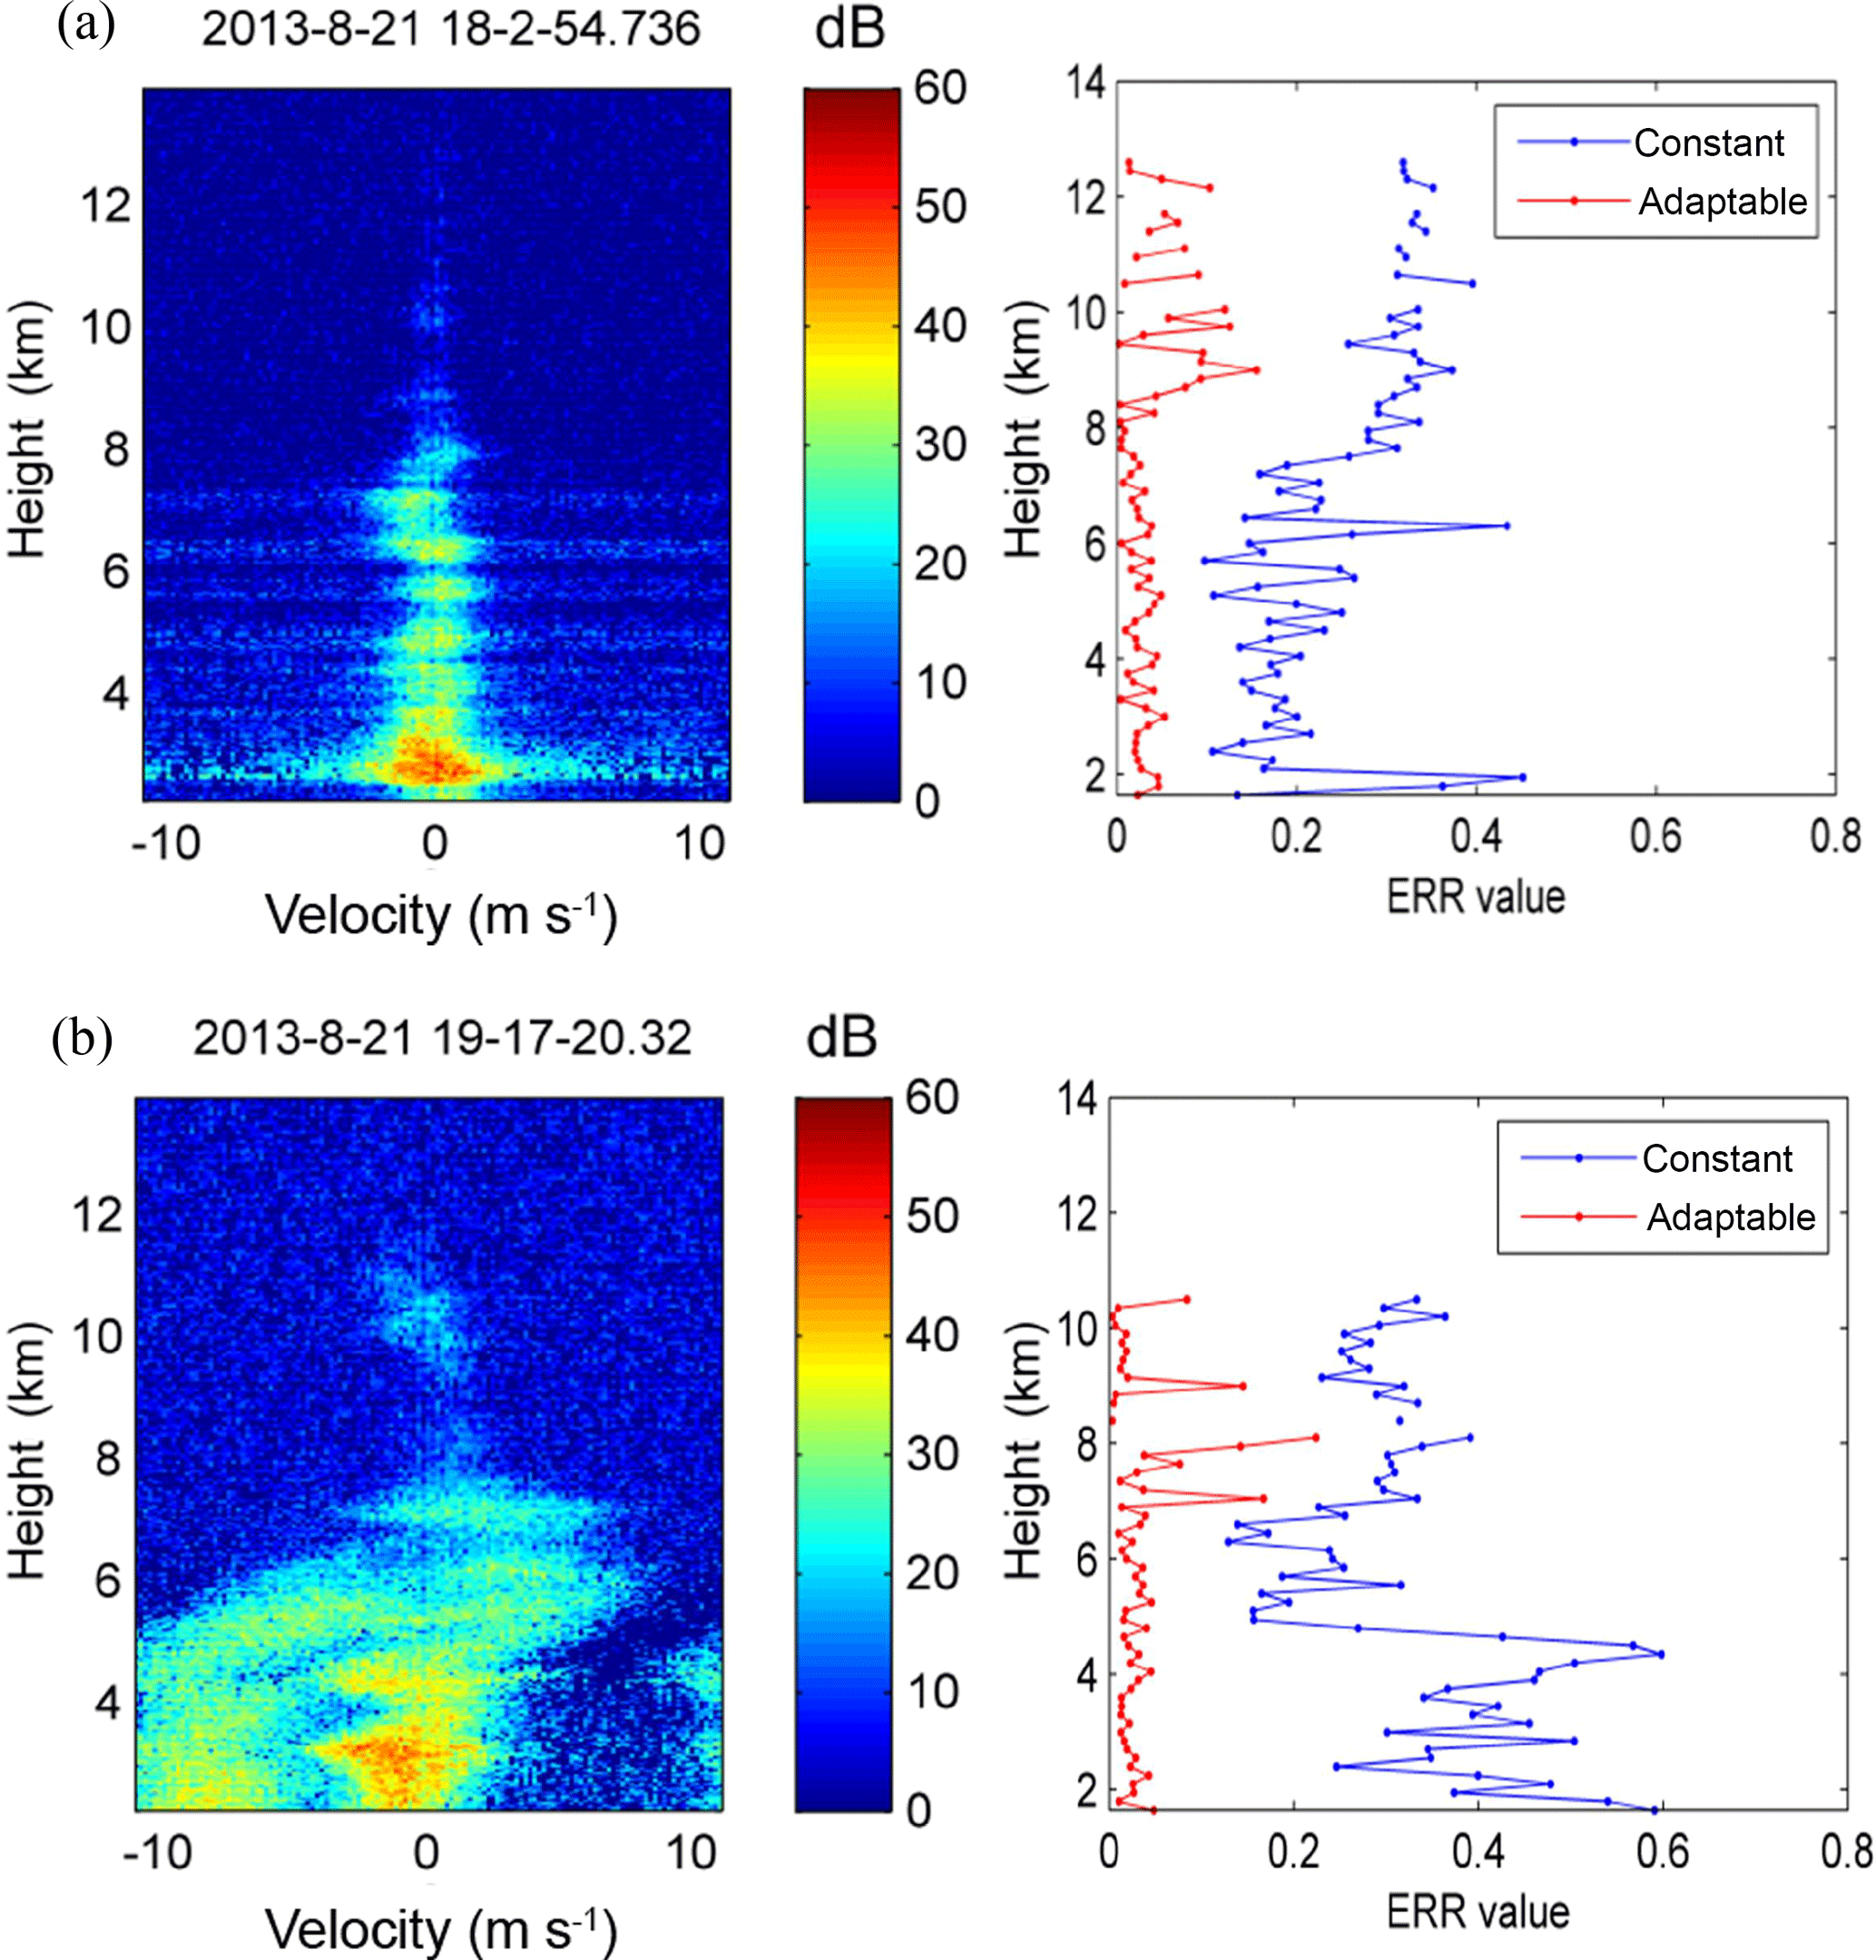
Figure 4(a) Left: Capon RIM power spectra of atmospheric echoes at the moment indicated by the blue arrow in Fig. 3a (data time and date: 18:02:54 UT, 21 August 2013); right: height variations of the MSEs obtained with constant and adaptable corrections. (b) Same as (a) but for the circumstances with precipitation at the moment indicated by the red arrow in Fig. 3a (data time and date: 19:17:20 UT, 21 August 2013).
The point-by-point correcting procedure with an adjustable-range delay proposed by Chen et al. (2016a) may be useful to mitigate the discontinuity of precipitation power spectra at gate boundaries, as shown in Fig. 3d. This correcting procedure has been demonstrated to be effective in the time-domain processing of RIM, but not in the frequency domain. Comparing Fig. 3d with Fig. 3c shows that the feature of continuity has been improved greatly at gate boundaries. The improvement can be evaluated via the MSEs of brightness values estimated by Eq. (4) with constant and adjustable-range delay corrections, as shown in Fig. 4. The left panel of Fig. 4a displays the RIM power spectra of atmospheric refractivity echoes without any precipitation (referring to Fig. 3a), and the right panel of Fig. 4a shows the MSE values as function of height. As seen, the MSEs of adjustable correction were all below 0.2, whereas the MSEs of constant correction were apparently larger. We noticed that the MSE values increased or were not shown (MSE of 0) above the height of 8 km for both correction processing, which were due to low signal-to-noise ratio (SNR) and/or fewer radar echoes through the range gates. The correction processing ignored the situation of SNR < 0.125 by giving an MSE of 0, and provided a less proper fitting curve of the range-weighting function at lower SNR that might cause larger MSE values. Irrespective of the height-dependent feature of MSE values, the adjustable correction resulted in much smaller MSE values and so indeed improved the continuity of power spectra at gate boundaries for the atmospheric refractivity echoes. On the other hand, the left panel of Fig. 4b displays the RIM power spectra of the echoes with atmospheric refractivity and precipitation. As shown in the right panel of Fig. 4b, below 5 km the MSE values estimated from constant correction increased visibly, as compared with the case of pure atmospheric echoes shown in Fig. 4a. These relatively large MSE values were very likely attributed to the existence of precipitation echoes. With adjustable correction, however, the MSE values were reduced greatly again. Based on these examinations, effectiveness of the adjustable correction can be confirmed for both precipitation and atmospheric refractivity conditions.
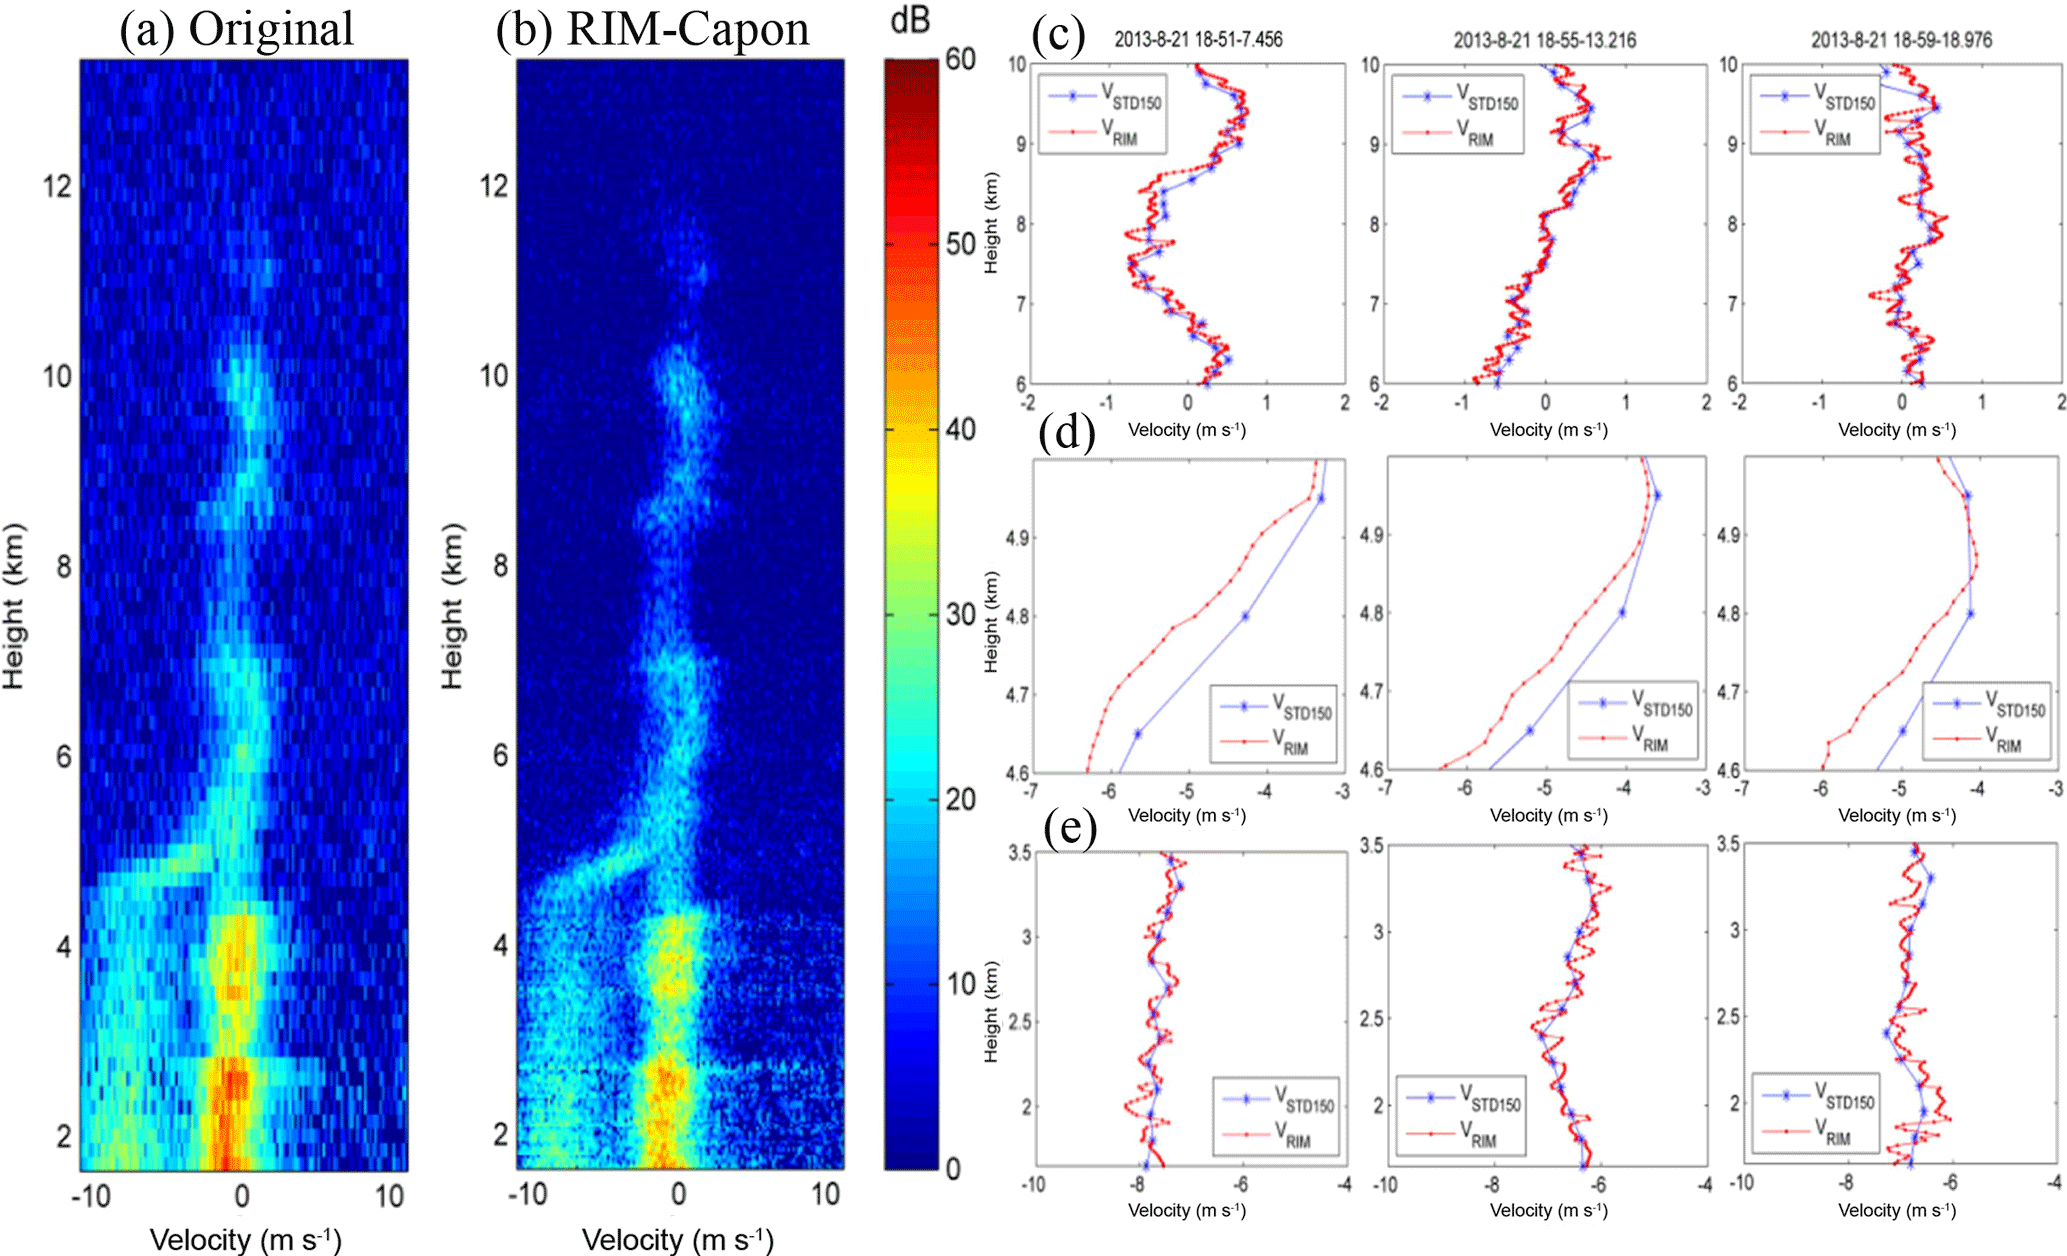
Figure 5(a) Conventional power spectra at the original resolution of 150 m. (b) Capon RIM-processed power spectra at a resolution of 15 m. (c) Height profiles of the Doppler velocities calculated from the 150 m resolution (VSTD150) data, and the 15 m resolution RIM (VRIM) data. Panels (d, e) are the same as in (c) but for the melting layer and precipitation, respectively.
4.3 Estimating the spectral parameters through RIM
To validate the time-signal inversion approach, we have executed examinations similar to those made by Chilson (2004). Figure 5 illustrates an example in which precipitation and atmospheric echoes coexisted. Shown in panel (a) is the power spectra with original range resolution of 150 m, and panel (b) is the Capon RIM-processed power spectra with a range step of 15 m. Panel (b) exhibits several structured atmospheric layers below 4.5 km and an oscillation of Doppler velocities between 6 and 10 km altitude. Moreover, a melting layer appeared in the range interval of 4.5 and 5 km. Doppler velocities of the atmospheric echoes, the melting layer, and the precipitation echoes below 3.5 km were computed and shown in panels (c), (d), and (e), respectively, where the height profiles of the Doppler velocities calculated from the 150 m range resolution (VSTD150) and the 15 m imaging step (VRIM) were compared. To further confirm the comparison results, we have examined more echoes with the same atmospheric conditions and two of them are shown in the right two columns. As seen in the cases of atmospheric echoes shown in panel (c), VRIM was in agreement with VSTD150, consistent with the study made by Chilson (2004). Similarly, VRIM and VSTD150 of the precipitation were consistent with each other, as observed in panel (e). In both atmospheric and precipitation situations, VRIM provided small-scale vertical variation of Doppler velocities. By contrast, the melting layers shown in panel (d) had a larger difference between VRIM and VSTD150, as compared with panels (c) and (e). The difference between VRIM and VSTD150 can be as large as tens of centimeters per second, which could be significant for the parameter of vertical velocity.
To realize how effective the RIM processing is, Chilson (2004) compared the echo powers and Doppler velocities calculated from the original and RIM-processed echoes and developed so-called conditional averaging (explained later) in echo power and Doppler velocity. We noted that Chilson (2004) conducted correction of RIM analysis only for range delay to investigate atmospheric echoes. In this study, both range delay and range-weighting function effect on the echoes were corrected, and both atmospheric and precipitation situations were examined.
Because the original range resolution of 150 m and the RIM-processed range step of 15 m do not match, the RIM sub-gates that are closest to the centers of the original range gates are selected for conditional averaging. Taking the precipitation echo region as an example, the Doppler velocities between −4 and −10 m s−1 are selected for the rain echoes; then conditional averaging of the RIM-estimated Doppler velocities (VRIM) for a specified value interval of the original Doppler velocities (VSTD150) is processed as follows. The values of VSTD150 are first divided into 30 equal sections in the velocity interval between −4 and −10 m s−1; then the selected VRIM values that fall within one of the sections are averaged together, resulting in an averaged value of VRIM for each of the velocity sections. This is the conditional average of VRIM, denoted as 〈VRIM∕VSTD150〉. As discussed by Chilson (2004) in terms of the power density function of random variables, the conditional averaging of VRIM is defined as
where ρ is the correlation coefficient of VRIM and VSTD150, and σVRIM and σVSTD150 are, respectively, the variances of VRIM and VSTD150. The slope of 〈VRIM∕VSTD150〉 versus VSTD150 can be expressed as, provided they are independent of ρ, σVRIM, σVSTD150:
Accordingly, the physical meaning of the slope of less than 1 suggests that the correlation coefficient of VRIM and VSTD150 be less than 1 or the variance of VRIM be lower than that of VSTD150, or both. The same scenario is also valid for the original and RIM-processed echo powers (e.g., the reflectivity discussed in Chilson, 2004).
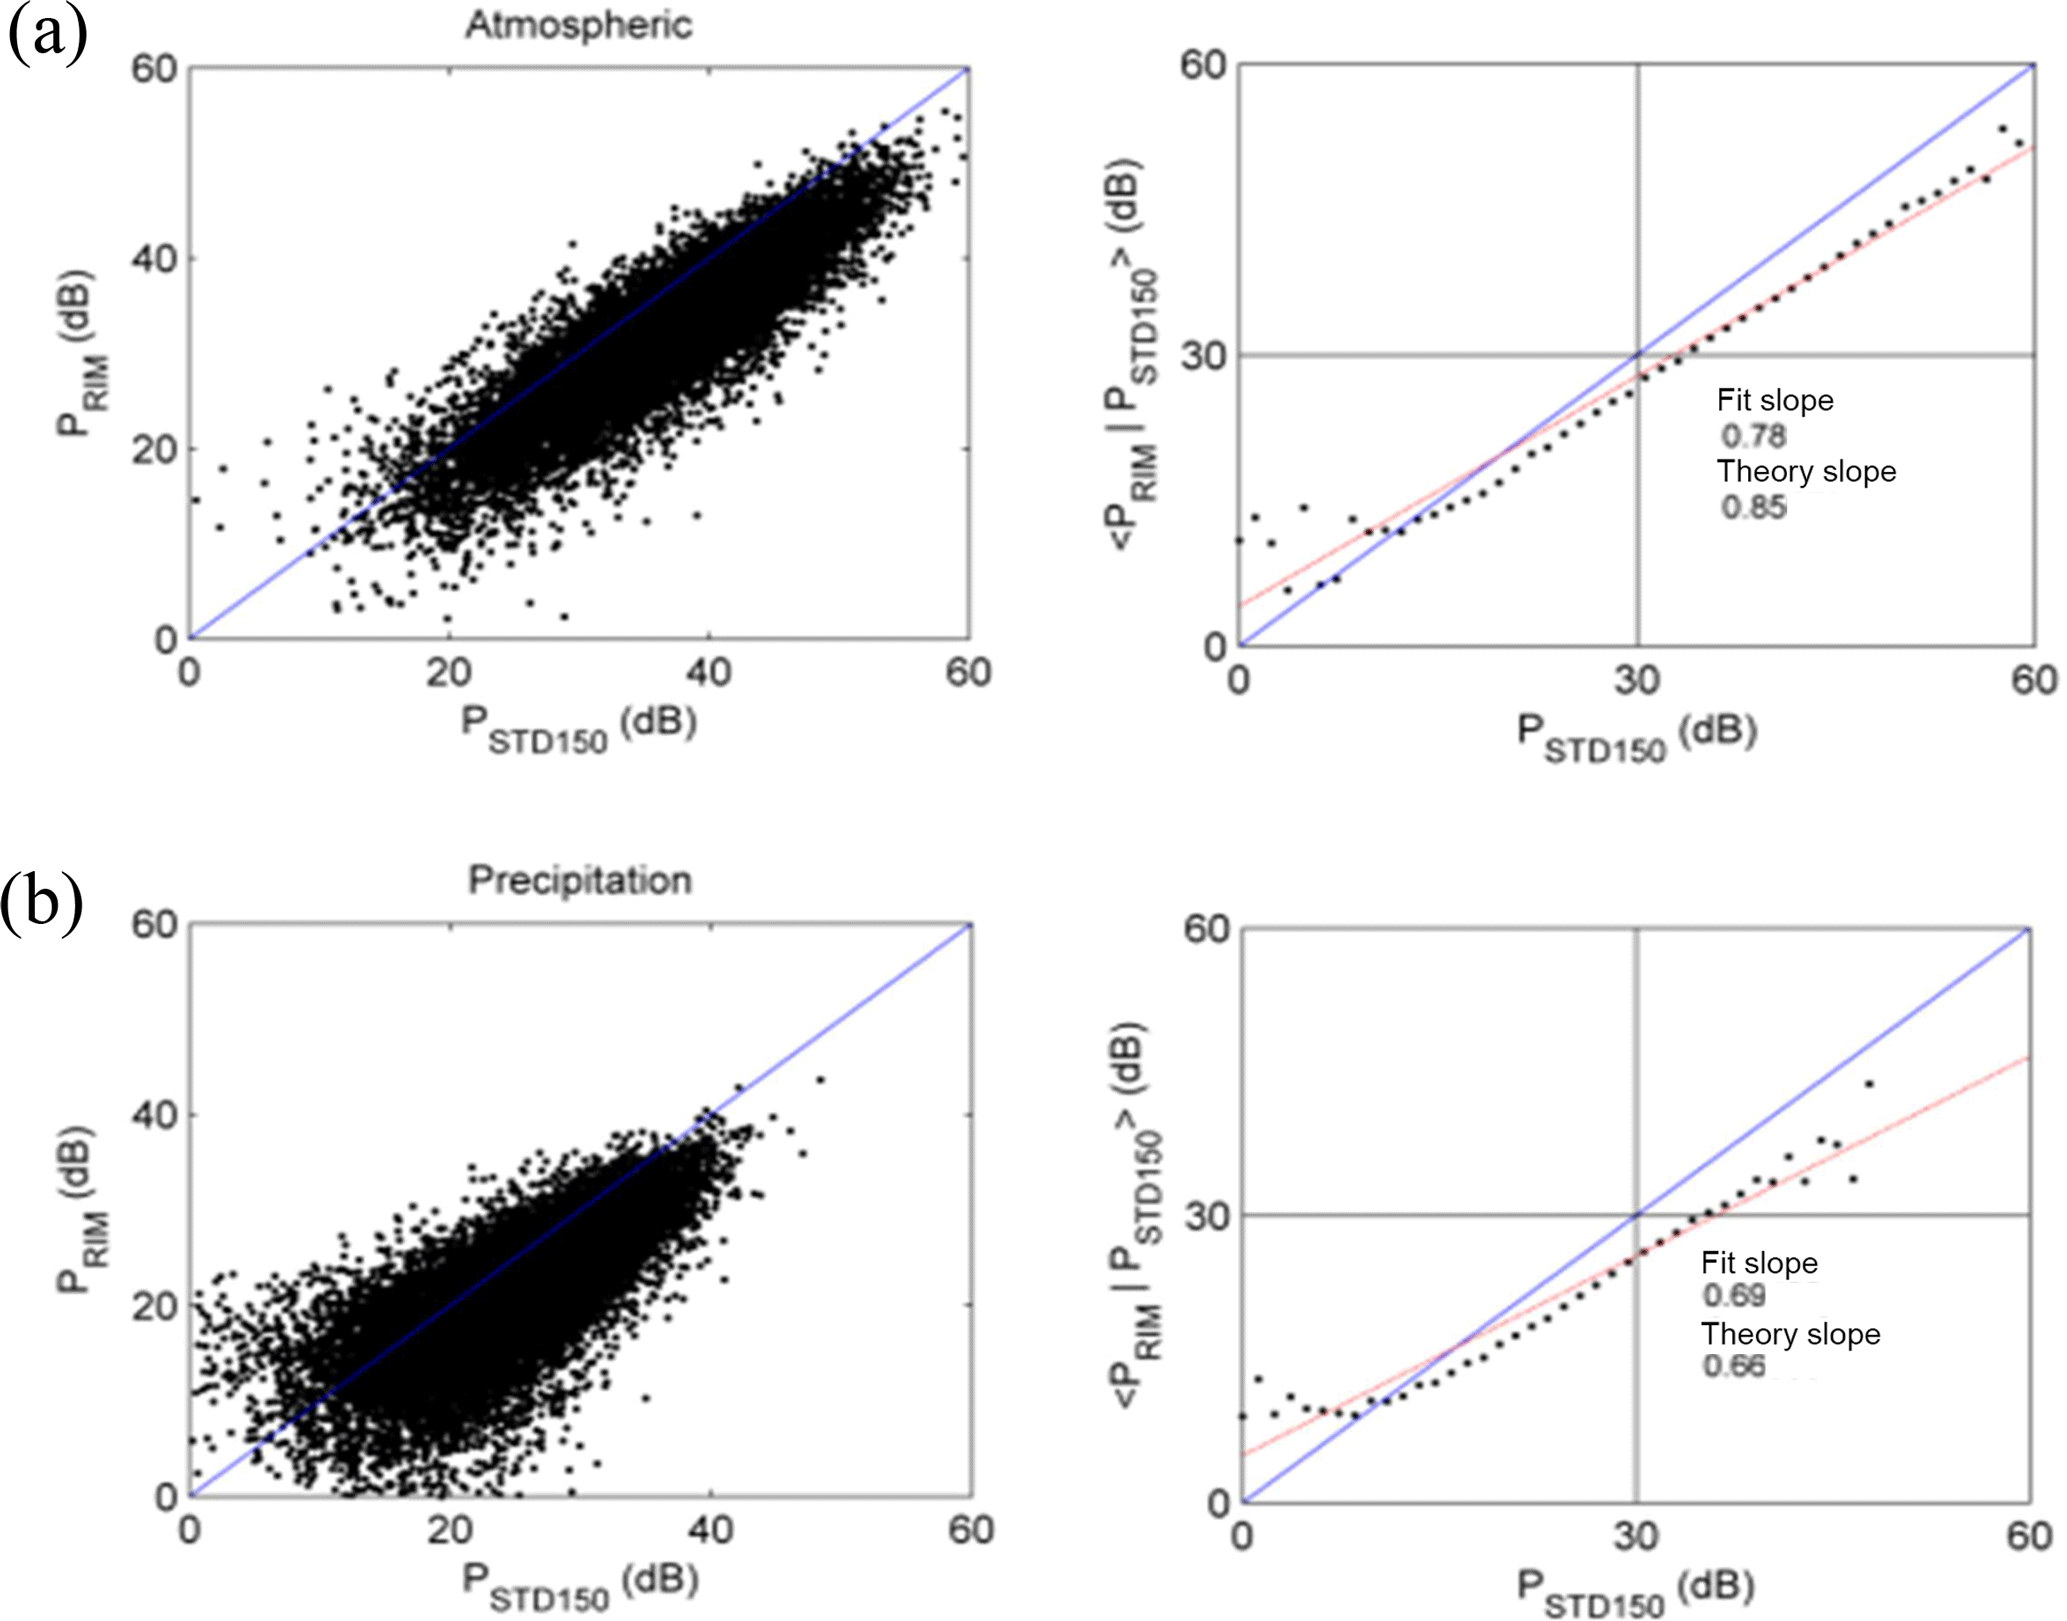
Figure 6(a) Results of the conditional averaging 〈PRIM∕PSTD150〉 for atmospheric echoes in the height range from 1650 to 3500 m a.g.l. (b) Same as (a) but for precipitation echoes. Data time and date: 18:48:40–19:17:20 UT, 21 August 2013 (red line is the fit slope).
We show the brightness and conditional averaging of the atmospheric refractivity and precipitation echoes in Fig. 6. The Chung-Li VHF radar data in the period between 18:48:40 and 19:17:20 UT, 21 August 2013, were examined. The precipitation echoes were defined as within −10 and −4 m s−1, and the atmospheric echoes were within −2 and 2 m s−1 in this case. Moreover, one should compare the effectiveness of the RIM processing on the spectral parameters of precipitation and atmospheric echoes, so the radar data in the height interval of 1650 and 3500 m, where both types of echoes coexisted and could be identified clearly, were examined. It should be mentioned, however, that conditional averaging can work at all heights.
The left panels of Fig. 6 show that PRIM and PSTD150 are linearly correlated, with a slope of approximately 1. The PRIM values tend to be systematically smaller than PSTD150 by about 3 dB (precipitation echoes) and 4 dB (atmospheric refractivity echoes) in average. This is reasonable because of suppression function of the Capon method employed in the RIM analysis. The slopes of the linear regression lines best fitted to conditional averaging were less than 1 for both atmospheric refractivity (0.78) and precipitation (0.69) echoes, as shown in the right panels of Fig. 6. We also calculated the correlation coefficient ρ, the variances σPRIM and σPSTD150 from the radar data, and put them into Eq. (8) to obtain the slopes of 〈PRIM∕PSTD150〉 versus PSTD150 for atmosphere and precipitation echoes (i.e., 0.85 and 0.66, respectively), which were very close to the fitting slopes. There was a tendency for the data points at lower values of PSTD150 to deviate to higher values of 〈PRIM∕PSTD150〉 for both atmosphere and precipitation echoes; this feature is similar to that reported by Chilson (2004), and can be ascribed to noise contamination and poor performance of the Capon method at low SNR.
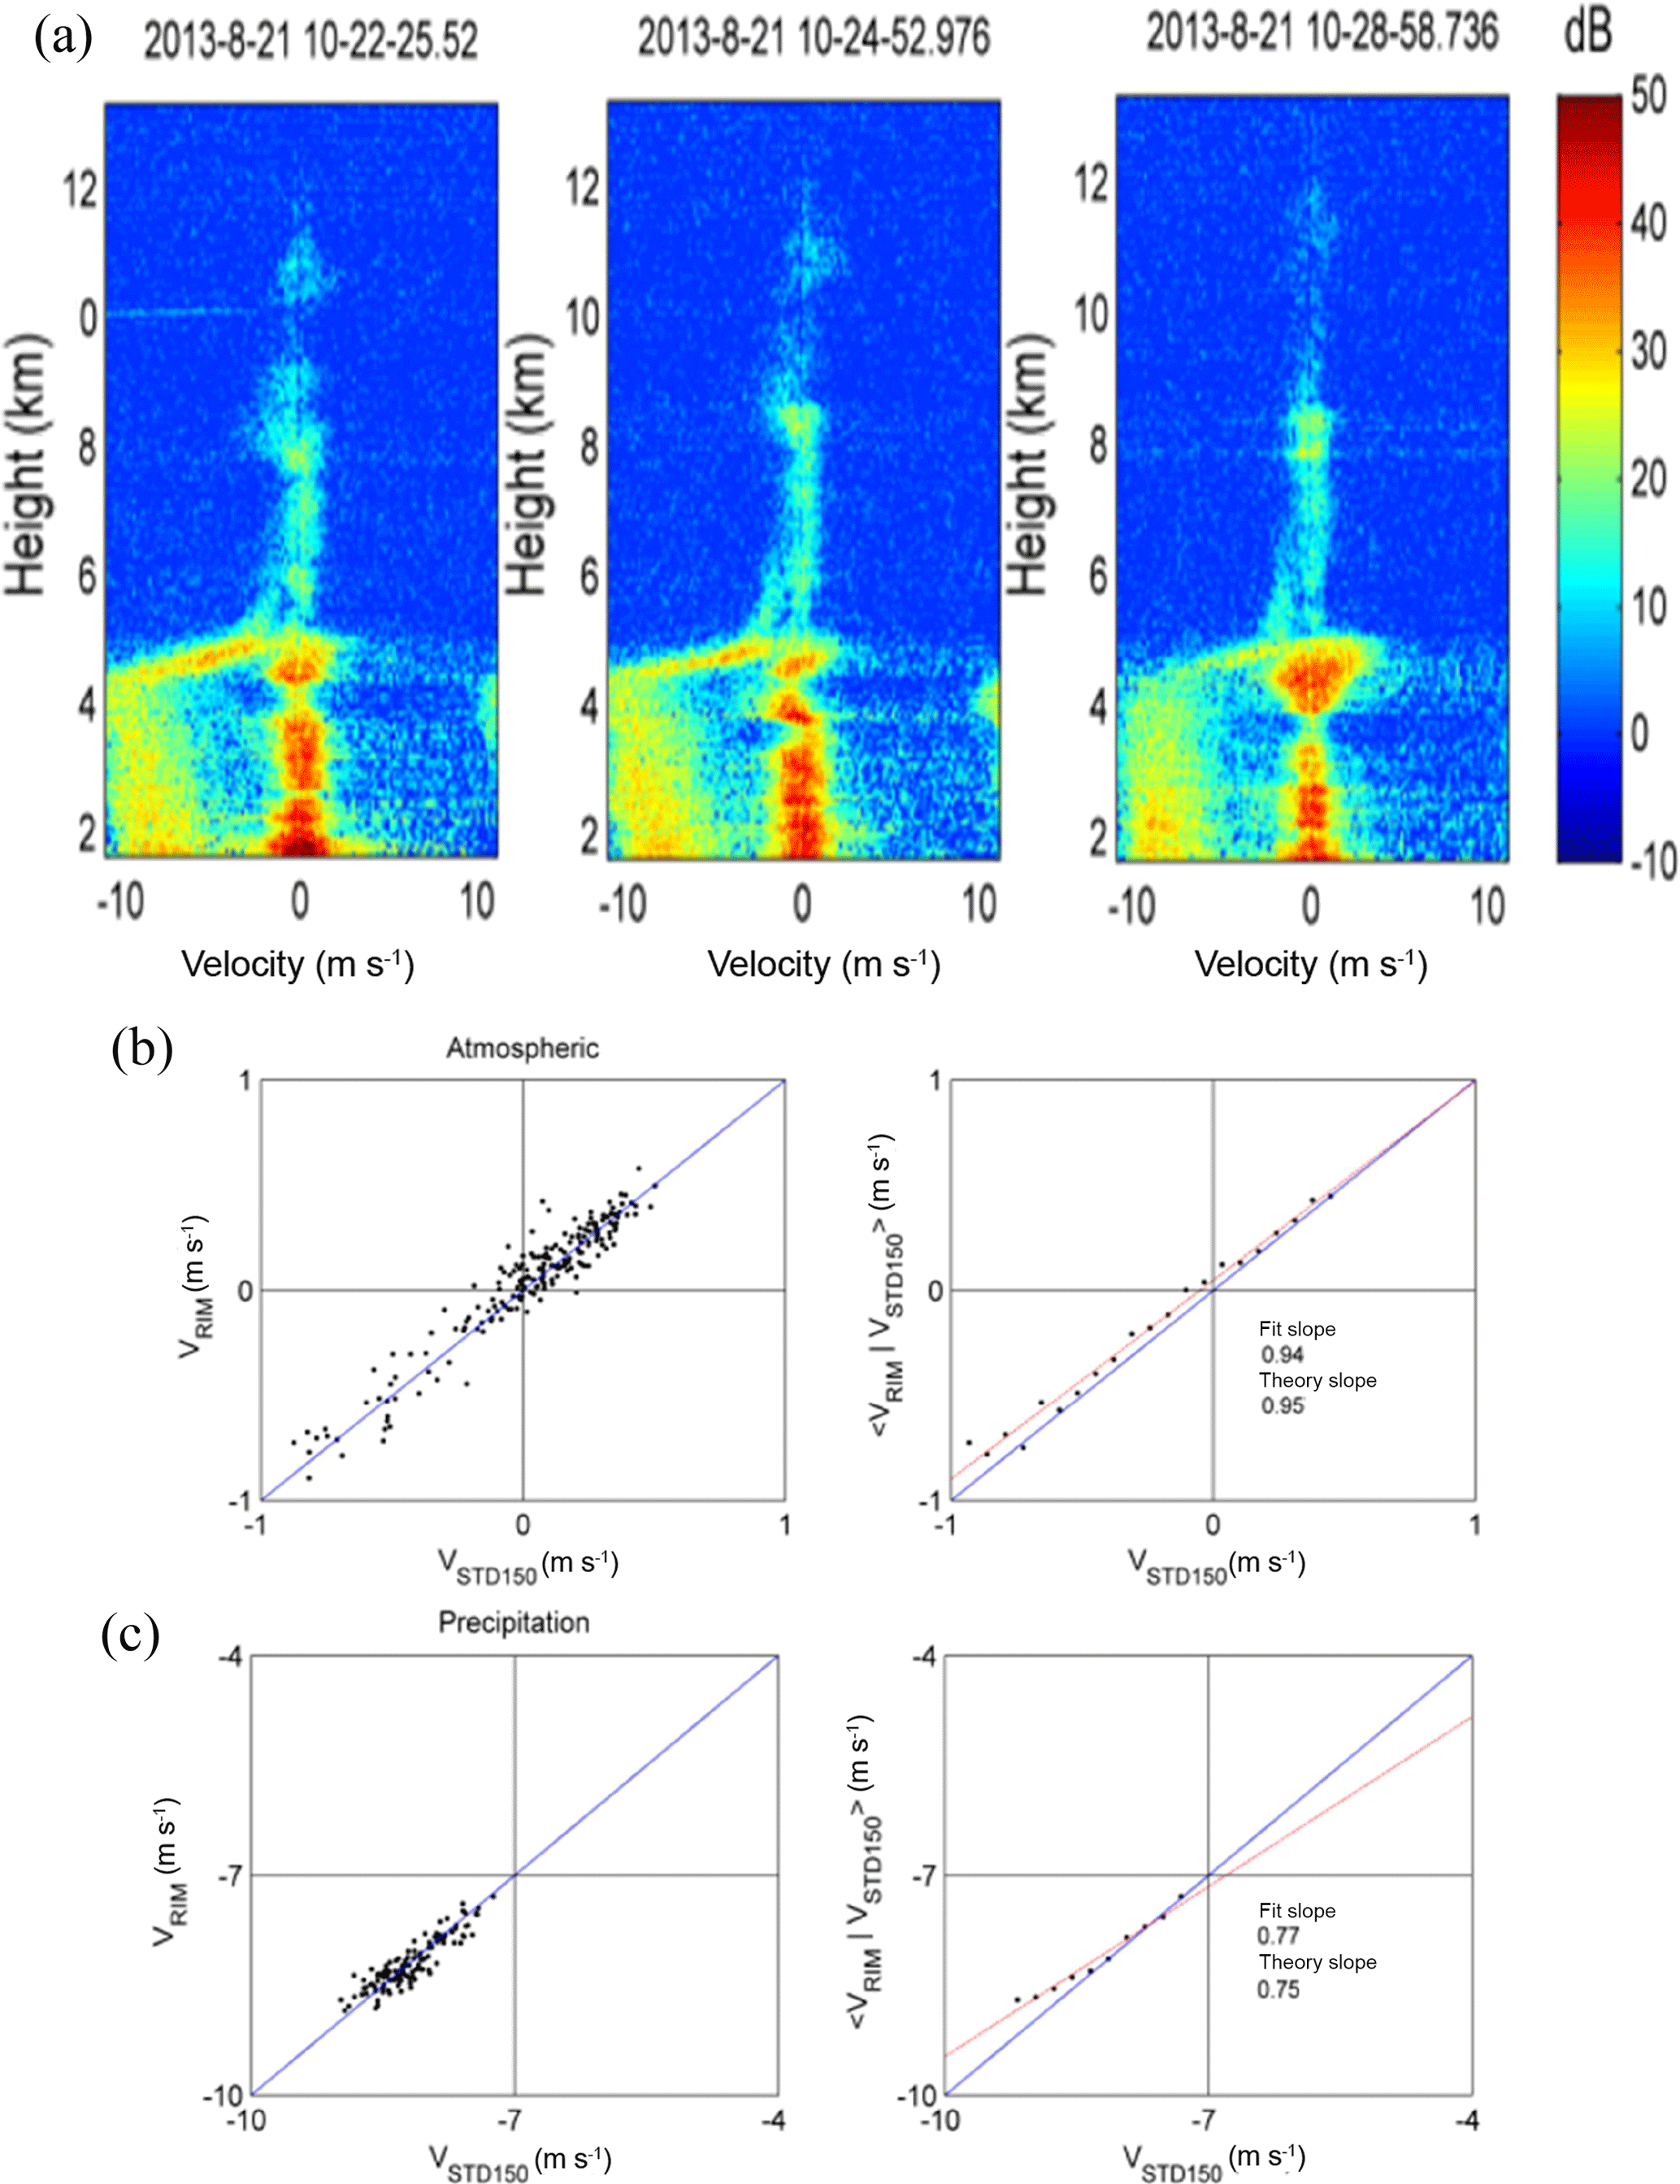
Figure 7(a) Capon RIM-processed power spectra during stratiform precipitation. Data time and date: 10:22:25–10:28:58 UT, 21 August 2013. Panels (b, c) are similar to those in Fig. 6a and b, but for Doppler velocity (red line is the fit slope).
After validating the processing of conditional averaging for the echo power, we further examined the Doppler velocities for atmosphere and various precipitation conditions. A case is shown in Fig. 7. The Doppler power spectra of the radar data collected between 10:22:25 and 10:28:58 UT on 21 August 2013 are presented in Fig. 7a. As shown, the atmospheric refractivity and precipitation echoes coexisted in this time interval. The atmospheric echoes were characterized by very weak mean vertical air motion with Doppler velocities in a range between −2 and 2 m s−1, and the precipitation displayed a distinctive feature of a bright band at around 4.5 km that separates the solid ice particle echoes and liquid rain drop echoes with different terminal velocities. The type of the precipitation in this environment is categorized as stratiform, which is very different from the convective precipitation characterized by strong updraft and absence of bright-band structure. Figure 7b and c display the scatter plots of VRIM versus VSTD150 (left panels) and 〈VRIM∕VSTD150〉 versus VSTD150 (right panels) for the atmospheric and precipitation echoes below 3.5 km, respectively. Below 3.5 km, the precipitation and atmospheric echoes coexisted and so we can examine the effectiveness of the RIM processing on both types of echoes simultaneously. As seen, VRIM and VSTD15 were generally in agreement with each other. The values of 〈VRIM∕VSTD150〉 and VSTD150 also followed a linear relationship and the fitting slopes, calculated from linear regression analysis, were slightly less than 1 (i.e., 0.94 and 0.77, respectively, for atmosphere and precipitation). We calculated again the correlation coefficient ρ, and the variances σVRIM and σVSTD150, from the radar data and obtained the values of 0.95 and 0.75 for the slopes of 〈VRIM∕VSTD150〉 versus VSTD150, respectively, for atmosphere and precipitation, which were very close to the fitting slopes. Note that the plot of 〈VRIM∕VSTD150〉 versus VSTD150 for the atmospheric echoes passed almost through the origin, indicating no offsets were introduced through the RIM processing. Moreover, the slope was less than 1, according to Eq. (8), implying that either the correlation coefficient of VRIM and VSTD150 was less than 1, or the variance of VRIM was lower than that of VSTD150, or both. The reduction in slope can be understood in terms of sampling volumes that have dissimilar range resolutions in the original and RIM-retrieved signals. As discussed by Chilson (2004), highly structured layers and rapidly changed velocity field along the range extent possibly lead to a decorrelation of the parameters derived from a larger (original) and a smaller (RIM-processed) sampling volumes. The power spectra shown in Fig. 7a indeed disclose some highly structured layers. Readers can also refer to Fig. 5 to find the height-dependent structure and vertical velocity in both atmosphere and precipitation echoes. In view of this, it is believed that the RIM processing has provided a higher-range resolution to detect distinct range-dependent structures in the atmosphere and Doppler velocity field.
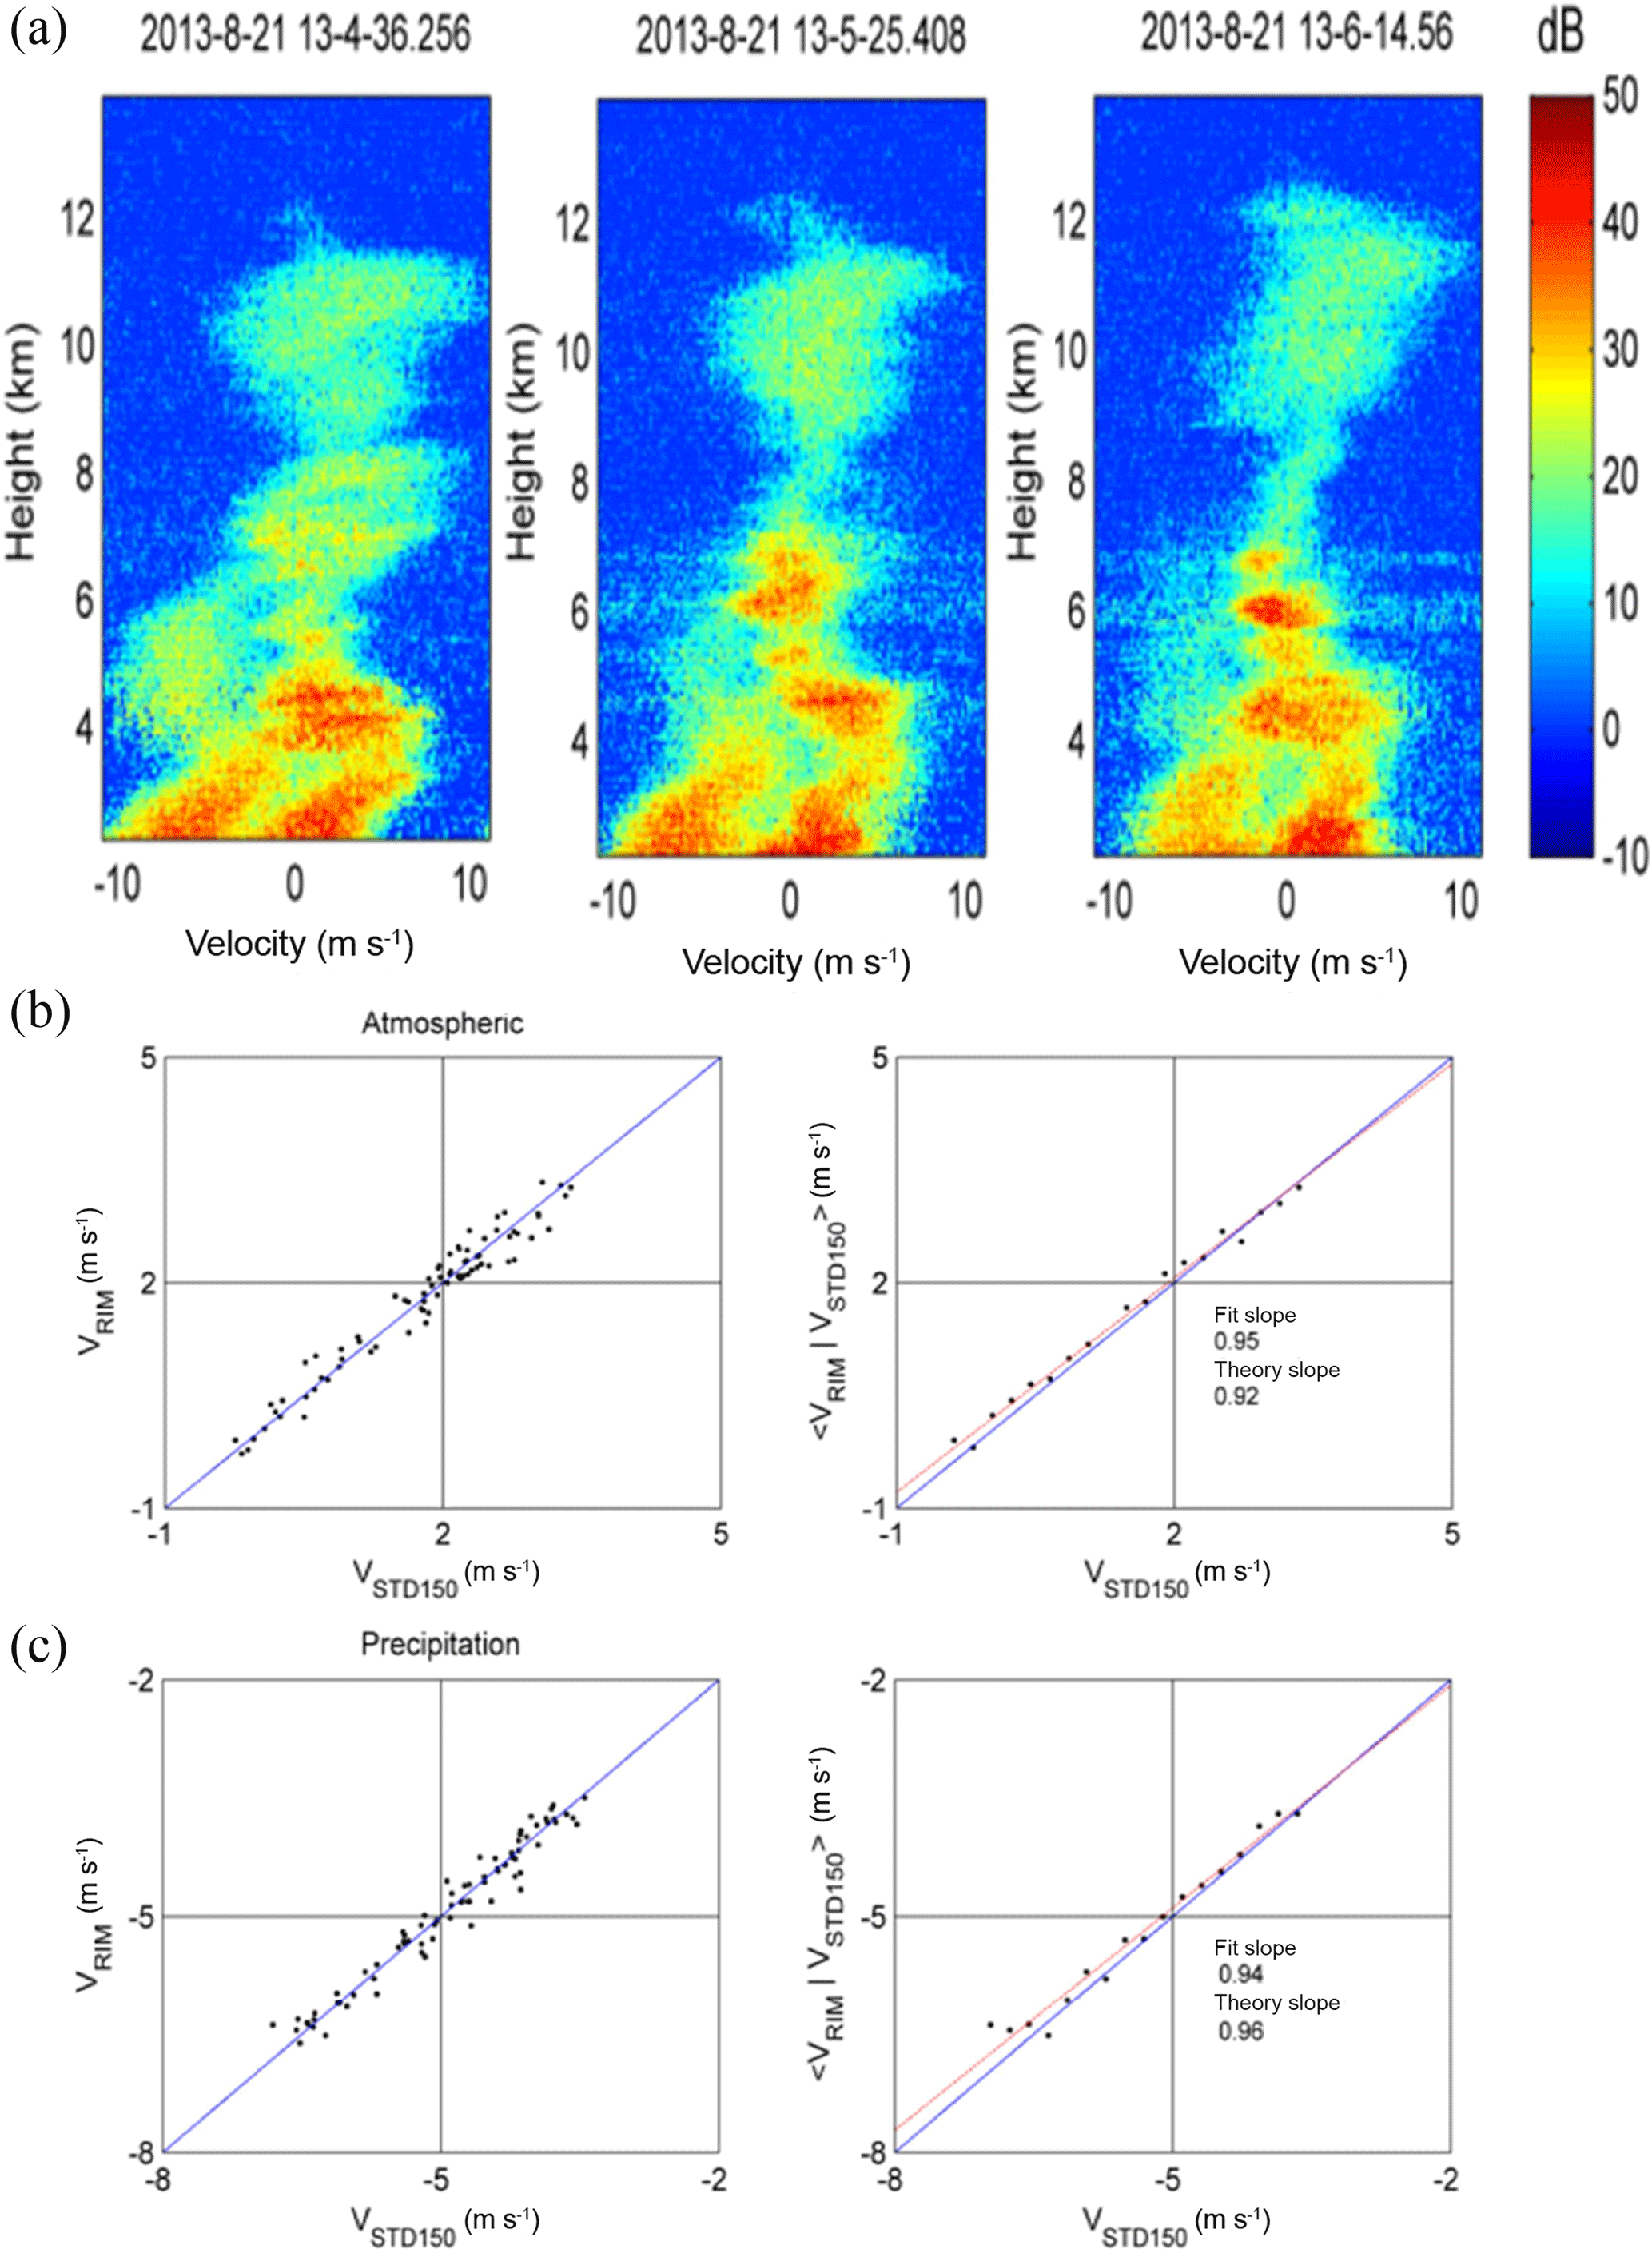
Figure 8Same as in Fig. 7, except in convective precipitation conditions. Data time and date: 13:04:36–13:06:14 UT, 21 August 2013 (red line is the fit slope).
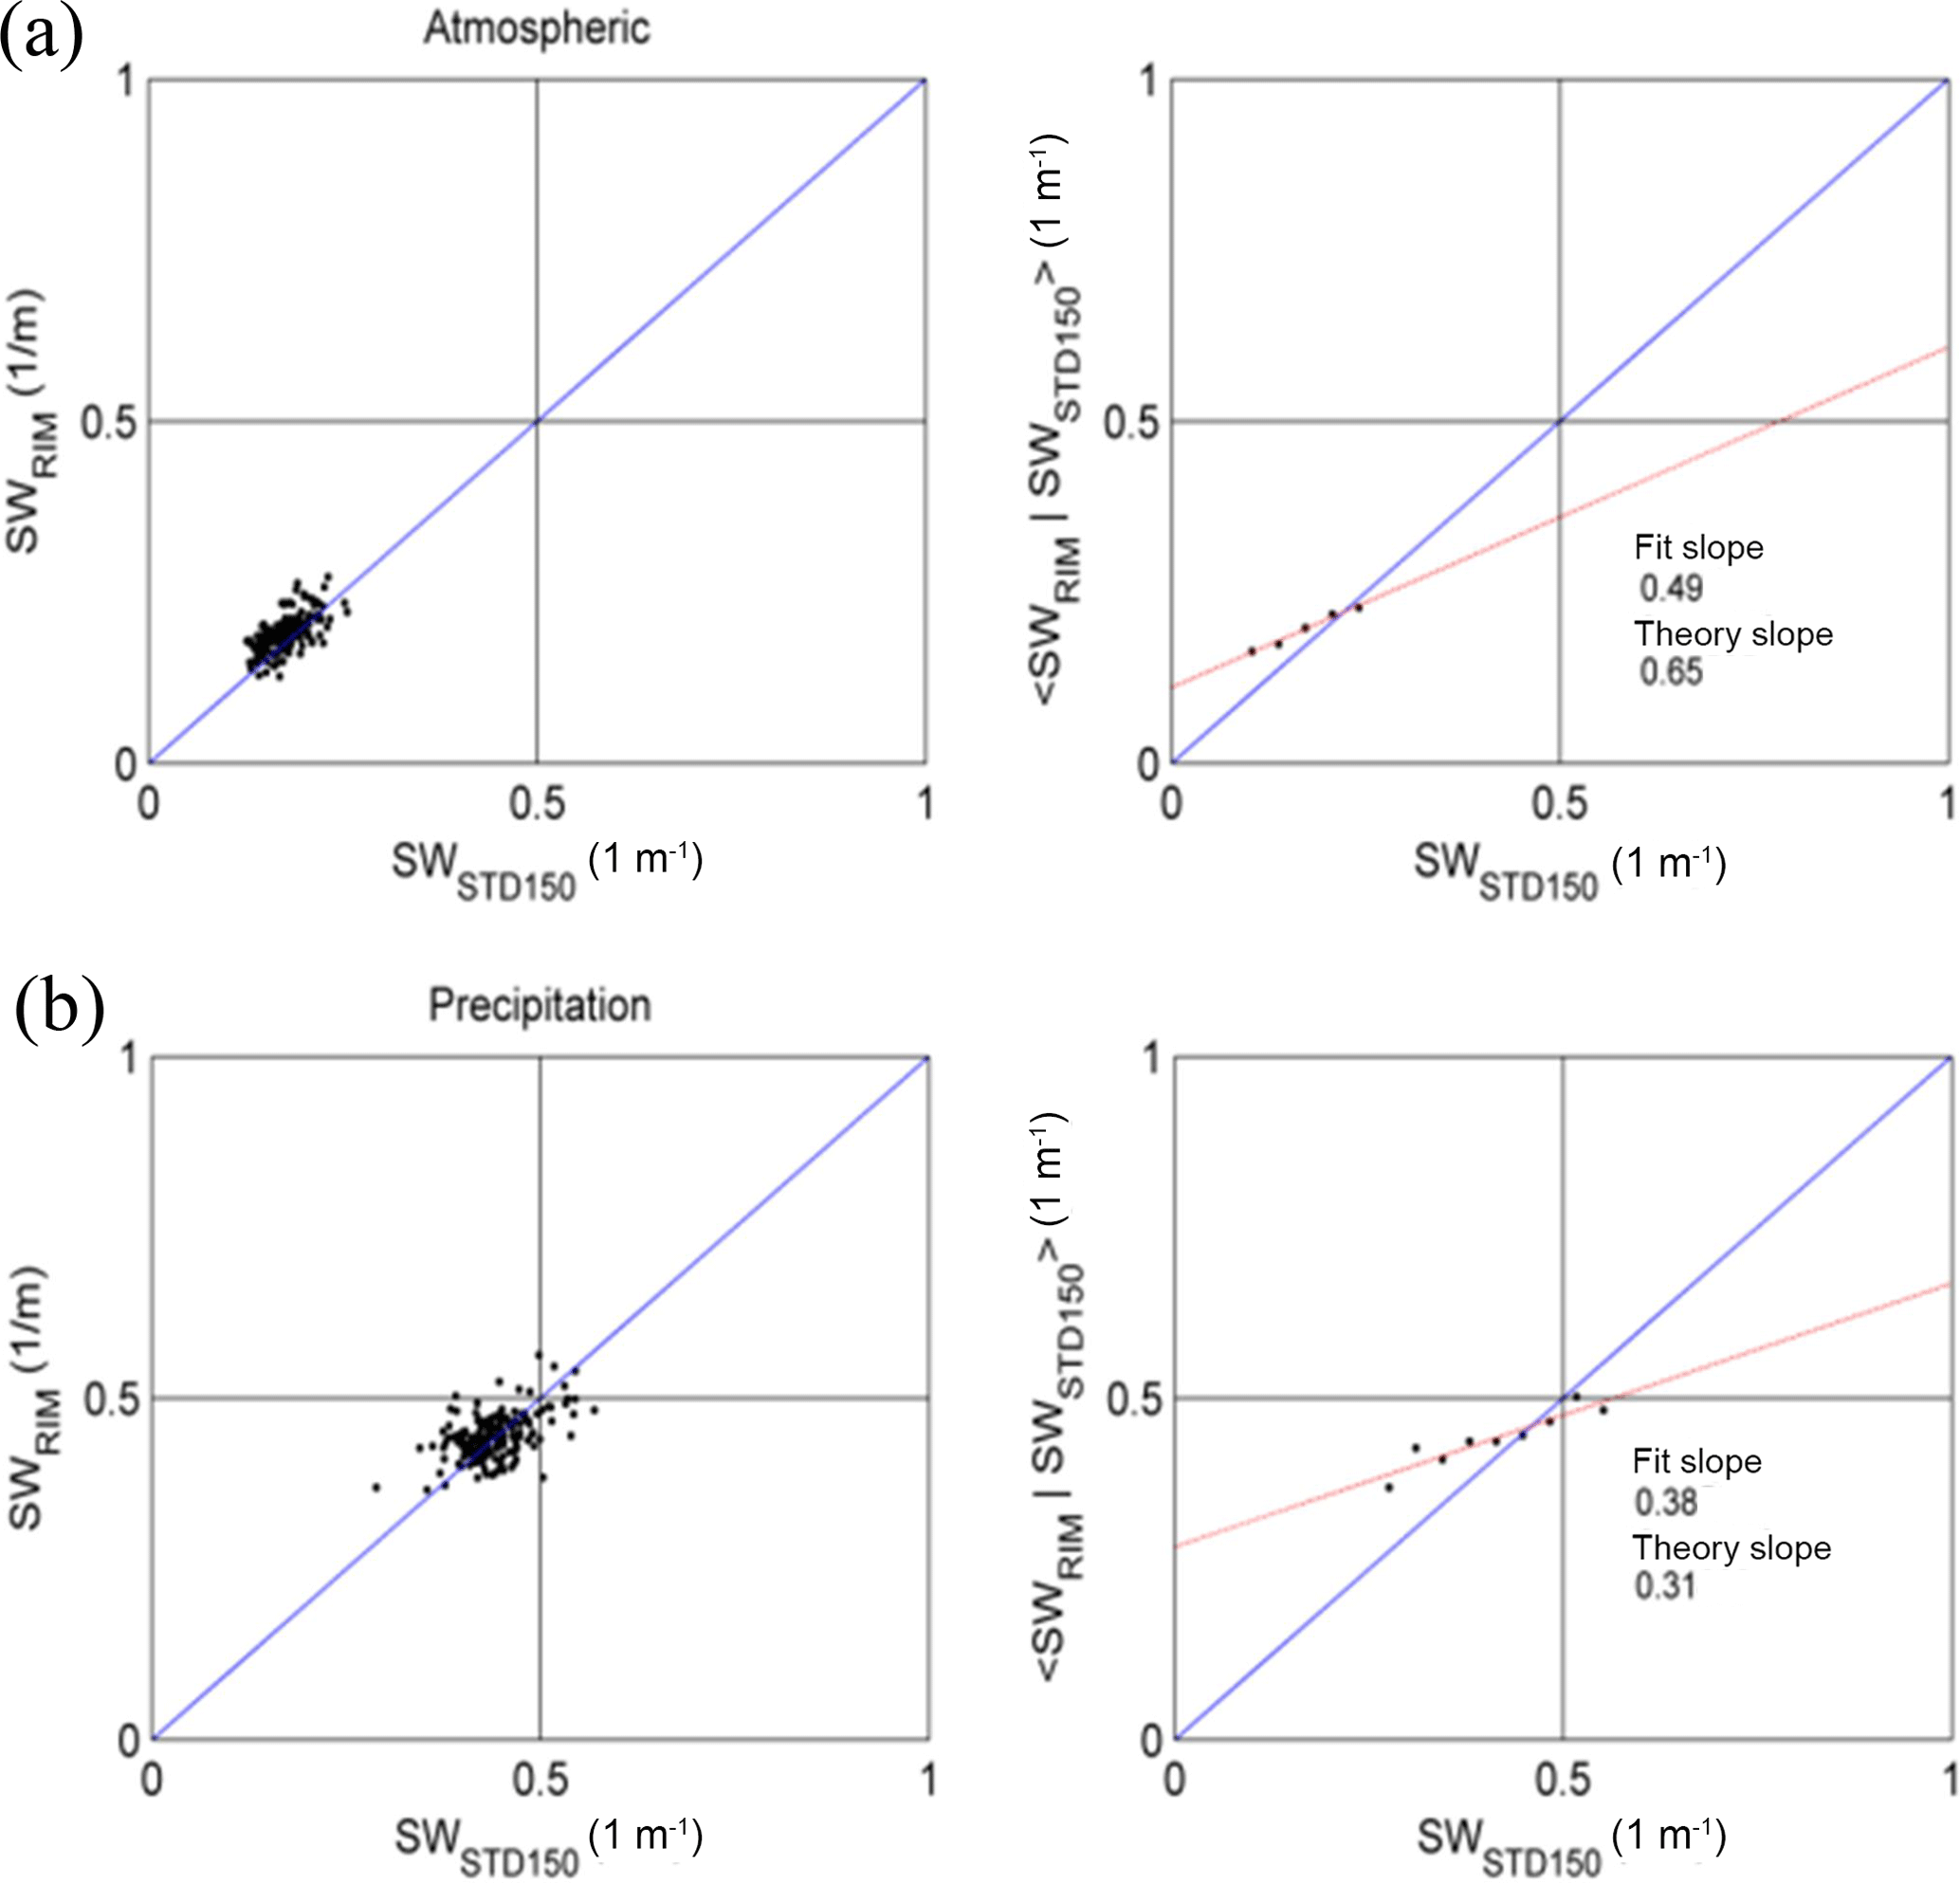
Figure 9Results of the conditional averaging like those in Fig. 7b and c, except that spectral widths are shown (red line is the fit slope).
Figure 8 exhibits the case of convective precipitation. As seen, prominent updraft with a maximum vertical velocity of about 5 m s−1 or greater was present in the atmospheric refractivity echoes throughout the height range 2–12 km, which varied much more significantly with height than those of stratiform conditions. Because it was slowed down by the ascending air motion, the altitudinal variation of falling speed of the precipitation particles followed that of the vertical air velocity. Note that there was an absence of bright-band structure in the power profile of precipitation echoes around the melting level at the height of about 4.5 km. Analogously with the case presented in Fig. 7, VRIM and VSTD150 were in agreement with each other, as illustrated in the left panels of Fig. 8b and c. For the atmospheric echoes, the fitted and estimated slopes, as given in the right panels of Fig. 8b, were very close to those in Fig. 7. However, the slopes given in the right panel of Fig. 8c, in particular, increased for the precipitation echoes, as compared with Fig. 7c. In the convective environment, the precipitation particles may sufficiently mix with the turbulent air, producing less-structured circumstances and giving a slope closer to 1 after conditional averaging. Inspecting the power spectra shown in Fig. 8a, the small-scale range-dependent structures were not visible below 4 km, which was different from the case shown in Fig. 7.
For a more complete investigation, we carried out the conditional averaging of spectral width, 〈SWRIM∕SWSTD150〉. Figures 9 and 10 show the respective results of the stratiform and convective precipitation. As before, the values of SWRIM were selected for those sub-gates corresponding to the center of the 150 m resolution range gates. Unsurprisingly, the relationship between SWRIM and SWSTD150 was generally linear for both types of precipitation. The slopes of 〈SWRIM∕SWSTD150〉 versus SWSTD150 were smaller than 1, which were consistent with the consequences offered by the parameters of Doppler velocity and echo power; that is, the RIM-processed power spectra can disclose smaller-scale structures. Worth noting is that the fitting slopes (0.49 and 0.38) and the theory slopes (0.65 and 0.31) in the right two panels of Fig. 9 were much lower than 1; by contrast, the fitting slopes (0.88 and 0.84) and theory slopes (0.96 and 0.88) given in Fig. 10 were closer to 1. This difference in slope highlights different characteristics of the structured atmosphere in stratiform and convective conditions, as compared with the results of echo power and Doppler velocity. The convective atmosphere can mix the precipitation particles and air greatly, which produces similar structures resolved from the original and RIM-processed echoes as well as broader and more vibrated spectral widths in both atmosphere and precipitation echoes, and finally results in a larger slope in conditional averaging.
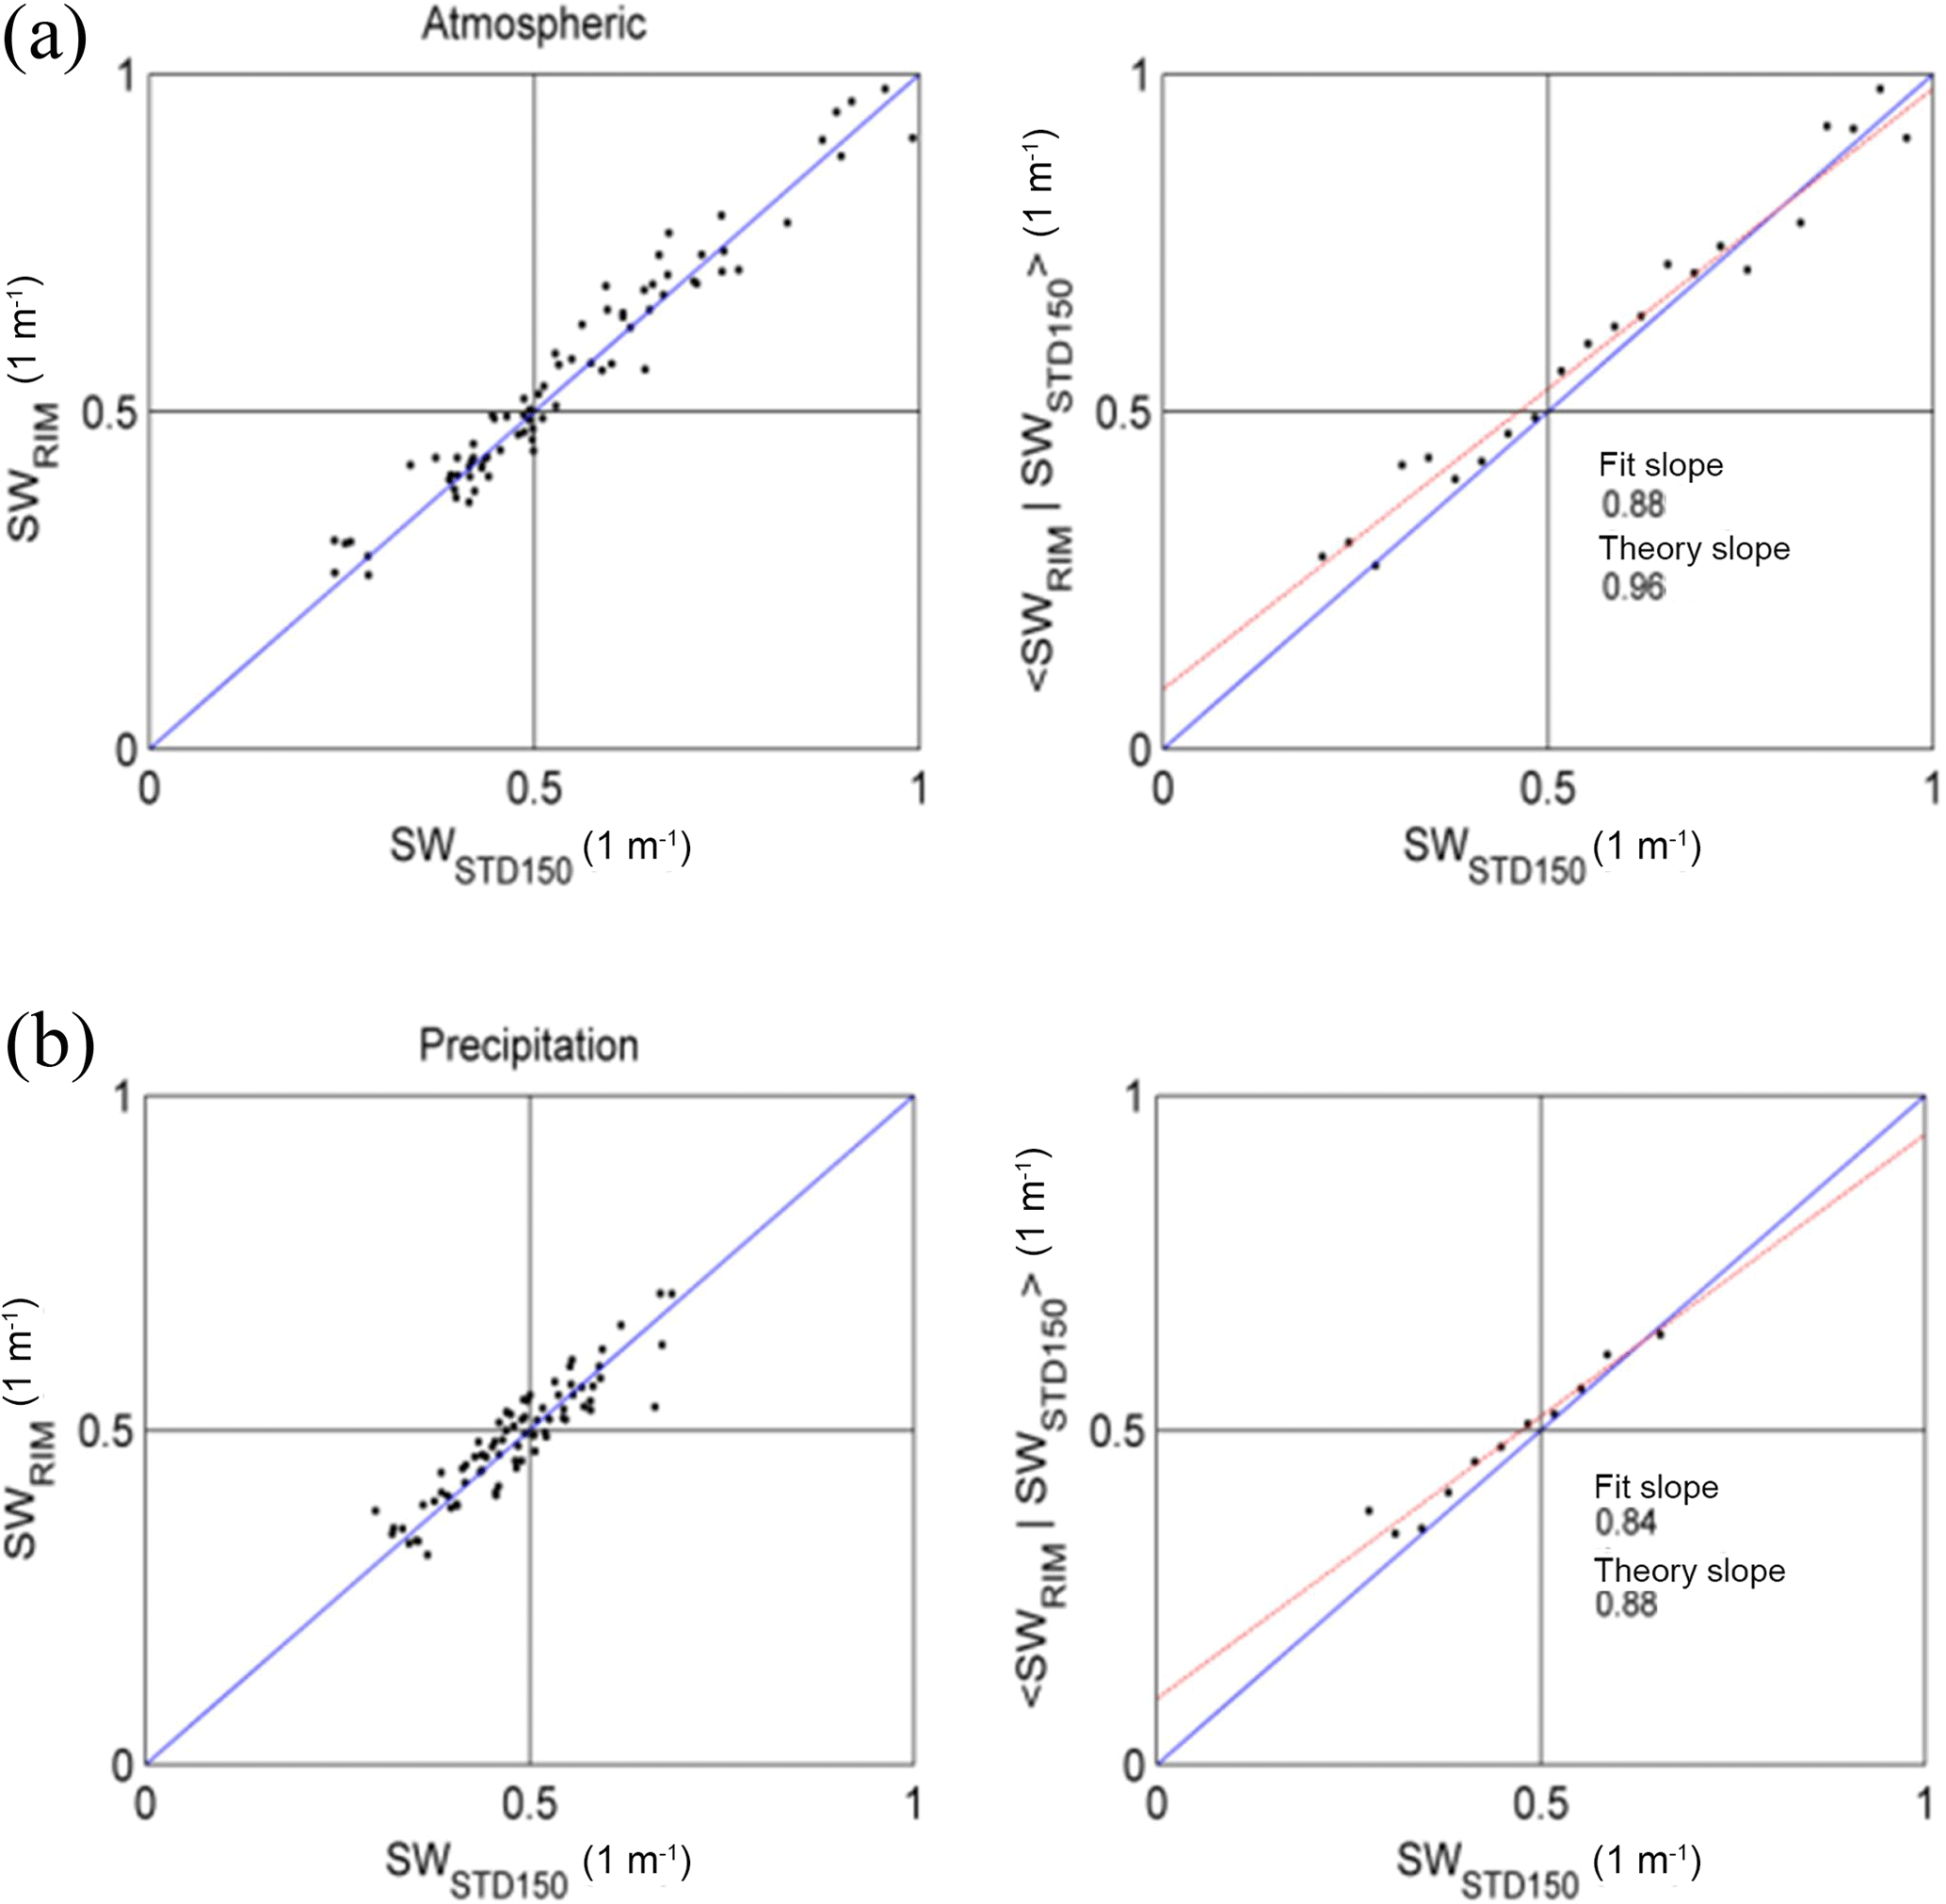
Figure 10Results of the conditional averaging like those in Fig. 8b and c, except that spectral widths are shown (red line is the fit slope).
This study demonstrated an extended application of the multi-frequency technique implemented in the Chung-Li VHF radar. The temporal signals at a higher-range resolution than the original range gate were retrieved by the Fourier and Capon methods. The retrieved temporal signals were examined in the Doppler frequency domain (e.g., power spectra) to identify the atmosphere and precipitation echoes in view of their different Doppler velocities. The Capon-processed results were utilized for this study because of the efficient and robust capabilities of the Capon method for atmospheric radar echoes. It is the first time that RIM has been applied to the spectral analysis (frequency domain) during precipitation.
To improve the range continuity of power spectra in the Doppler frequency domain, the calibrations of range delay and range-weighting function effect, which have been proven to be necessary for the time-domain analysis of RIM, have been made. Moreover, an adaptive correction of range delay and range-weighting function effect based on a point-by-point calibration procedure was demonstrated to be feasible for precipitation echoes. After such handling of radar data, the stratiform and convective precipitation types were examined for the first time with the RIM technique of the Chung-Li VHF radar. In this study, we found the melting layer occurring at the stratiform precipitation had a larger difference in Doppler velocities after RIM processing. In addition, we validated the Capon RIM capability not only for the atmosphere but also for the precipitation echoes; this was achieved by employing the conditional averaging for echo power, Doppler velocity, and spectral width. Results of the conditional averaging verified that the Capon RIM-processed power spectra can indicate finer vertical structures in both atmosphere and precipitation regions. Moreover, the atmosphere and precipitation particles could mix sufficiently in the convective conditions, resulting in less-structured and more turbulent circumstances that have wider spectral width and larger variation in velocity. The Capon RIM-processed power spectra and conditional averaging results have highlighted this scenario.
This study examined some distinctive radar data that showed that clear-air and precipitation echoes coexist and can be identified clearly. For simplicity, we separated the clear-air echoes from hydrometeor echoes by giving two fixed Doppler velocity bands. For large amounts of data in analysis, the methods of automatic separation proposed by other researchers mentioned in Sect. 1 should be effective to decrease the time cost. Furthermore, it is expected in the future that multi-frequency techniques can be combined with multi-receiver techniques to resolve the spatial distribution of precipitation in more detail. However, radar hardware and data-processing techniques must be made available for this objective.
Data can be made available from authors upon request.
The authors declare that they have no conflict of interest.
The Chung-Li VHF radar is maintained by the Graduate Institute of Space
Science, National Central University, Taiwan. We are grateful to Taiwan
Typhoon and Flood Research Institute for providing the precipitation data
from disdrometer. This research was supported by the Ministry of Science and
Technology of ROC (Taiwan), grants MOST104-2111-M-008-003.
Edited by: Sheila Kirkwood
Reviewed by: two
anonymous referees
Chen, J.-S. and Zecha, M.: Multiple-frequency range imaging using the OSWIN VHF radar: phase calibration and first results, Radio Sci., 44, RS1010, https://doi.org/10.1029/2008RS003916, 2009.
Chen, J.-S., Su, C.-L., Chu, Y.-H., Hassenpflug, G., and Zecha, M.: Extended application of a novel phase calibration method of multiple-frequency range imaging to the Chung–Li and MU VHF radars, J. Atmos. Ocean. Tech., 26, 2488–2500, 2009.
Chen, J.-S., Tsai, S.-C., Su, C.-L., and Chu, Y.-H.: Evaluation of multifrequency range imaging technique implemented on the Chung-Li VHF atmospheric radar, Atmos. Meas. Tech., 9, 2345–2355, https://doi.org/10.5194/amt-9-2345-2016, 2016a.
Chen, J.-S., Chu, Y.-H., Su, C.-L., Hashiguchi, H., and Li, Y.: Range imaging of E-region field-aligned irregularities by using a multifrequency technique: validation and initial results, IEEE T. Geosci. Remote Sens., 54, 3739–3749, https://doi.org/10.1109/TGRS.2016.2521702, 2016b.
Chilson, P. B.: The retrieval and validation of Doppler velocity estimates from range imaging, J. Atmos. Ocean. Tech., 21, 1033–1043, 2004.
Chilson, P. B., Ulbrich, C. W., and Larsen, M. F.: Observation of a tropical thunderstorm using a vertically pointing, dual-frequency, collinear beam Doppler radar, J. Atmos. Ocean. Tech., 10, 663–673, 1993.
Chilson, P. B., Palmer, R. D., Muschinski, A., Hooper, D. A., Schmidt, G., and Steinhagen, H.: SOMARE-99: A demonstrational field campaign for ultra-high resolution VHF atmospheric profiling using frequency diversity, Radio Sci., 36, 695–707, 2001.
Chilson, P. B., Yu, T.-Y., Strauch, R. G., Muschinski, A., and Palmer, R. D.: Implementation and validation of range imaging on a UHF radar wind profiler, J. Atmos. Ocean. Tech., 20, 987–996, 2003.
Chu, Y.-H. and Lin, C.-S.: The severe depletion of turbulent echo power in precipitation using the Chung-Li VHF Doppler radar, Radio Sci., 29, 1311–1320, 1994.
Chu, Y.-H., Chian, L.-P., and Liu, C.-H.: The investigations of the atmospheric precipitation by using Chung-Li VHF radar, Radio Sci., 26, 717–729, 1991.
Franke, S. J.: Pulse compression and frequency domain interferometry with a frequency-hopped MST radar, Radio Sci., 25, 565–574, 1990.
Fukao, S., Wakasugi, K., Sato, T., Tsuda, T., Kimura, I., Takeuchi, N., Matsuo, M., and Kato, S.: Simultaneous observation of precipitation atmosphere by VHF and C/Ku band Radars, Radio Sci., 20, 622–630, 1985.
Gan, T., Yamamoto, M. K., Hashiguchi, H., Okamoto, H., and Yamamoto, M.: Spectral parameters estimation in precipitation for 50 MHz band atmospheric radars, Radio Sci., 50, 789–803, 2015.
Garbanzo-Salas, M. and Hocking, W. K.: Spectral Analysis comparisons of Fourier-Theory-based methods and Minimum Variance (Capon) methods, J. Atmos. Sol.-Terr. Phy., 132, 92–100, 2015.
Larsen, M. F. and Röttger, J.: Observation of thunderstorm reflectivities and Doppler velocities measured at VHF and UHF, J. Atmos. Ocean. Tech., 4, 151–159, 1987.
Li, J. and Stoica, P.: An adaptive filtering approach to spectral estimation and SAR imaging, IEEE T. Signal Proces., 44, 1469–1484, 1996.
Luce, H., Yamamoto, M., Fukao, S., Hélal, D., and Crochet, M.: A frequency radar interferometric imaging (FII) technique based on high-resolution methods, J. Atmos. Sol.-Terr. Phy., 63, 221–234, 2001.
Luce, H., Hassenpflug, G., Yamamoto, M., and Fukao, S.: Comparisons of refractive index gradient and stability profiles measured by balloons and the MU radar at a high vertical resolution in the lower stratosphere, Ann. Geophys., 25, 47–57, https://doi.org/10.5194/angeo-25-47-2007, 2007.
Luce, H., Takai, T., Nakamura, N., Yamamoto, M., and Fukao, S.: Simultaneous observations of thin humidity gradients in the lower troposphere with a Raman Lidar and the very high-frequency middle- and upper-atmosphere radar, J. Atmos. Ocean. Tech., 27, 950–956, https://doi.org/10.1175/2010JTECHA1372.1, 2010.
Palmer, R. D., Gopalam, S., Yu, T.-Y., and Fukao, S.: Coherent radar imaging using Capon's method, Radio Sci., 33, 1585–1598, 1998.
Palmer, R. D., Yu, T.-Y., and Chilson, P. B.: Range imaging using frequency diversity, Radio Sci., 34, 1485–1496, https://doi.org/10.1029/1999RS900089, 1999.
Palmer, R. D., Cheong, B. L., Hoffman, M. W., Fraser, S. J., and López-Dekker, F. J.: Observations of the small-scale variability of precipitation using an imaging radar, J. Atmos. Ocean. Tech., 22, 1122–1137, https://doi.org/10.1175/JTECH1775.1, 2005.
Rao, T. N., Rao, D. N., and Raghavan, S.: Tropical precipitating systems observed with Indian MST radar, Radio Sci., 34, 1125–1139, 1999.
Su, C.-L., Chu, Y.-H., and Lo, I.-Y.: Negative correlation between terminal velocity and VHF radar reflectivity: observation and plausible explanation, Ann. Geophys., 27, 1631–1642, https://doi.org/10.5194/angeo-27-1631-2009, 2009.
Williams, C. R.: Vertical air motion retrieved from dual-frequency profiler observation, J. Atmos. Ocean. Tech., 29, 1471–1480, 2012.
Woodman, R. F.: Coherent radar imaging: signal processing and statistical properties, Radio Sci., 32, 2372–2391, 1997.
Woodman, R. F. and Guillen, A.: Radar observations of winds and turbulence in the stratosphere and mesosphere, J. Atmos. Sci., 31, 493–505, 1974.
Yu, T.-Y. and Palmer, R. D.: Atmospheric radar imaging using spatial and frequency diversity, Radio Sci., 36, 1493–1504, 2001.
Yu, T.-Y., Palmer, R. D., and Hysell, D. L.: A simulation study of coherent radar imaging, Radio Sci., 35, 1129–1141, 2000.
Yu, T.-Y., Furumoto, J., and Yamamoto, M.: Clutter suppression for high-resolution atmospheric observations using multiple receivers and multiple frequencies, Radio Sci., 45, RS4011, https://doi.org/10.1029/2009RS004330, 2010.