the Creative Commons Attribution 4.0 License.
the Creative Commons Attribution 4.0 License.
 | 23 Oct 2018
New and improved infrared absorption cross sections for trichlorofluoromethane (CFC-11)
Jeremy J. Harrison
Trichlorofluoromethane (CFC-11), a widely used refrigerant throughout much of the twentieth century and a very potent (stratospheric) ozone-depleting substance (ODS), is now banned under the Montreal Protocol. With a long atmospheric lifetime, it will only slowly degrade in the atmosphere, so monitoring its vertical concentration profile using infrared-sounding instruments, and thereby validating stratospheric loss rates in atmospheric models, is of great importance; this in turn requires high-quality laboratory spectroscopic data.
This work describes new high-resolution infrared absorption cross sections of trichlorofluoromethane/dry synthetic air over the spectral range 710–1290 cm−1, determined from spectra recorded using a high-resolution Fourier transform spectrometer (Bruker IFS 125HR) and a 26 cm pathlength cell. Spectra were recorded at resolutions between 0.01 and 0.03 cm−1 (calculated as 0.9/MOPD; MOPD: maximum optical path difference) over a range of temperatures and pressures (7.5–760 Torr and 192–293 K) appropriate for atmospheric conditions. This new cross-section dataset improves upon the one currently available in the HITRAN (HIgh-resolution TRANsmission) and GEISA (Gestion et Étude des Informations Spectroscopiques Atmosphériques) databases through an extension to the range of pressures and temperatures, improved signal-to-noise and wavenumber calibrations, the lack of channel fringing, the better consistency in integrated band intensities, and additionally the coverage of the weak combination band ν2+ν5.
- Article
(1065 KB) - Full-text XML
- BibTeX
- EndNote


Chlorofluorocarbons (CFCs) were first developed in the 1930s as safe, reliable, and non-toxic refrigerants for domestic use. Trichlorofluoromethane, known as CFC-11 or Freon-11, and dichlorodifluoromethane, known as CFC-12 or Freon-12, were the two most widely used CFCs in applications ranging from refrigerators and air conditioners to propellants in spray cans and blowing agents in foam production.
Ultimately, however, CFCs proved too good to be true. The explosion in their use led to a steady increase in their atmospheric abundances. While they are inert in the troposphere, it was this stability which enabled them to reach the stratosphere, where dissociation by ultraviolet radiation released chlorine atoms, which catalyse the destruction of stratospheric ozone (Solomon, 1999). The realisation of this impending environmental disaster prompted international action, and in 1987 the Montreal Protocol was ratified; this led to the phasing out of the worldwide production and use of CFCs. CFCs are still released into the atmosphere from “banks”, such as old refrigerators; however these are not regulated by the protocol (Harris et al., 2014). Banks are the major source of emissions for many ozone-depleting substances (ODSs), including CFC-11, which has a long atmospheric lifetime of 52 years (Harris et al., 2014).
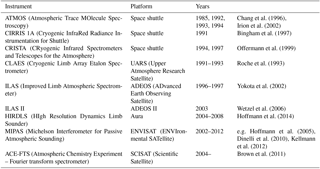
Table 1Summary of limb sounders past and present capable of measuring CFC-11.
At present, CFC-11 is the second-most-abundant CFC in the atmosphere and contributes the second-highest amount of chlorine to the stratosphere, behind CFC-12. In addition to its role in stratospheric ozone destruction – it has the highest ozone depletion potential (1.0) (Harris et al., 2014) of all the CFCs – CFC-11 is a particularly strong greenhouse gas: it has a 100-year global warming potential of 5160 (Harris et al., 2014).
As a key species in stratospheric ozone destruction, CFC-11 atmospheric concentrations are monitored in situ at the surface; e.g. the annual global mean mole fraction of CFC-11 measured by the AGAGE (Advanced Global Atmospheric Gases Experiment) network in 2012 was 235.5 ppt (Carpenter et al., 2014). However, in order to measure concentrations in the stratosphere where ozone destruction occurs, remote-sensing techniques are required. Table 1 contains a listing of limb sounders capable of measuring CFC-11, as described in the literature.
The infrared (IR) spectra for large molecules like trichlorofluoromethane are highly complex, consisting of very many closely spaced spectroscopic lines, making the task of generating line parameters from measurements an almost impossible one. For the purposes of atmospheric remote sensing, it is possible to use absorption cross sections in forward models instead of line parameters; however this requires laboratory measurements of air-broadened spectra over a range of temperatures and pressures. The accuracy of retrievals of CFC-11 abundances for the limb sounders in Table 1 is very much dependent on the quality of the underlying spectroscopy; ideally absorption cross-section datasets should cover a range of atmospherically relevant pressure–temperature (PT) combinations, with accurate wavenumber scales and band intensities, and properly resolved spectral features. This work presents new spectroscopic data, optimised for limb sounding instruments, which improve upon those currently available in the HITRAN (HIgh-resolution TRANsmission; Gordon et al., 2017) and GEISA (Gestion et Étude des Informations Spectroscopiques Atmosphériques; Jacquinet-Husson et al., 2016) databases.
2.1 Spectroscopic background
There are two stable isotopes of carbon and chlorine, and one of fluorine, resulting in eight stable isotopologues of trichlorofluoromethane, namely 12∕13C35Cl3F, , 12∕13C35Cl37Cl2F, and 12∕13C37Cl3F; these belong to the point groups C3v, Cs, Cs and C3v, respectively. Taking into account the natural abundances of 12C and 13C (∼ 99 % and ∼ 1 %, respectively), and 35Cl and 37Cl (∼76 % and ∼24 %, respectively), the most abundant isotopologues are therefore 12C35Cl3F, , and 12C35Cl37Cl2F, with abundances of 43 %, 41 %, and 13 %, respectively.
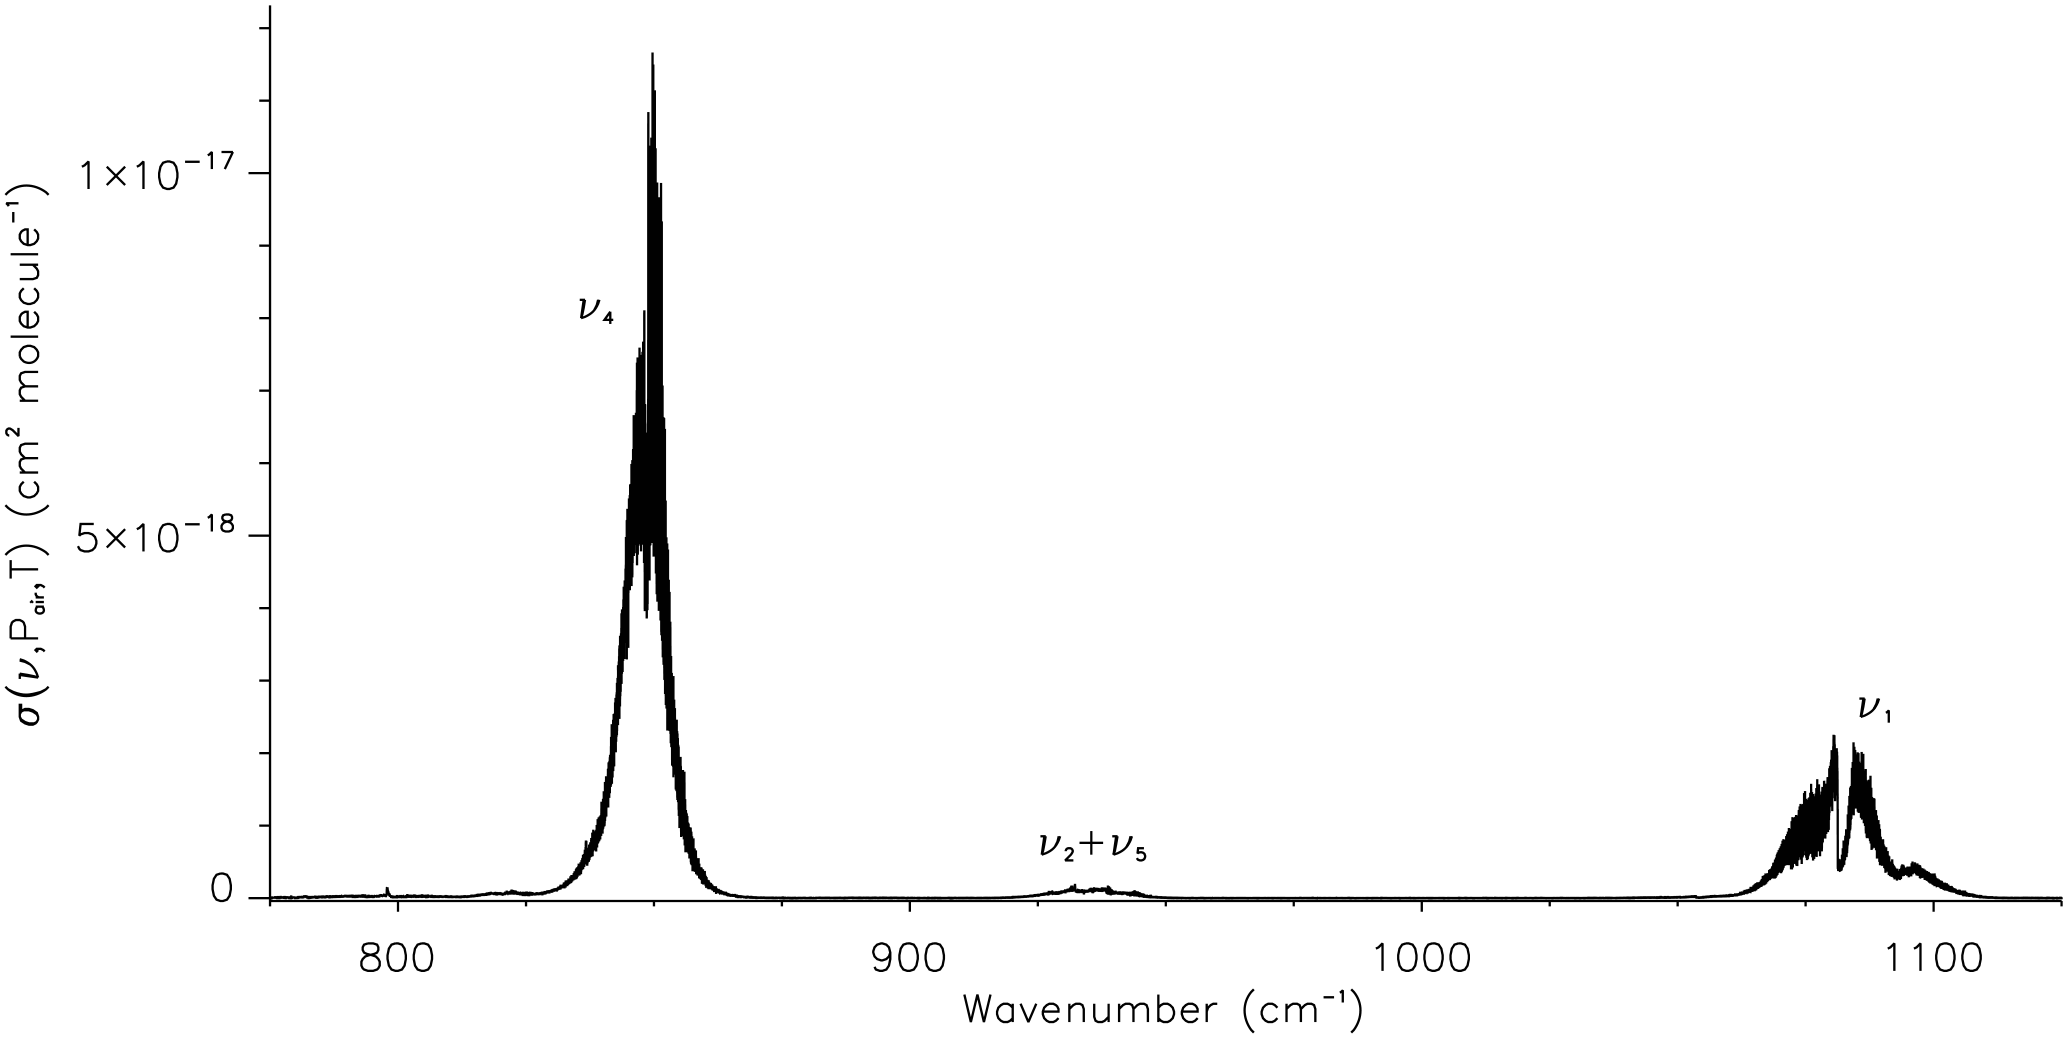
Figure 1The absorption cross section of trichlorofluoromethane/dry synthetic air at 191.7 K and 7.535 Torr (this work), with vibrational band assignments for the main band systems in the 710–1290 cm−1 spectral region.
As a non-linear molecule with five atoms, trichlorofluoromethane possesses nine normal vibrational modes; in the C3v point group there are three non-degenerate fundamentals of A1 symmetry (ν1, ν2, and ν3) and three doubly degenerate fundamentals of E symmetry (ν4, ν5, and ν6). For the Cs point group, the ν1, ν2, and ν3 modes possess A′ symmetry, with the doubly degenerate ν4, ν5, and ν6 modes each splitting into one A′ and one mode (Snels et al., 2001). Since the splittings in the ν4, ν5, and ν6 levels are small, it is normal to label these bands assuming C3v symmetry. The 710–1290 cm−1 spectral range covered in the present work contains two strong fundamental bands, ν1∼1081.28 cm−1 and ν4∼849.5 cm−1, and a weaker combination band, cm−1; reported frequencies are those for the most abundant isotopologue, 12C35Cl3F (von Lilienfeld et al., 2007; Snels et al., 2001). Isotopologues complicate the already dense CCl3F rotation–vibration spectrum; each has slightly different molecular parameters, with bands shifted by small amounts relative to each other. These main band systems are shown in Fig. 1 in the plot of the new absorption cross section at 191.7 K and 7.535 Torr. Details on the measurement conditions and derivation of this cross section are given in Sect. 3.
2.2 A brief history of trichlorofluoromethane absorption cross sections
High resolution (0.03 cm−1) absorption cross sections of pure trichlorofluoromethane at 296 K were first included in HITRAN as part of the 1986 compilation (Massie et al., 1985; Rothman et al., 1987). The HITRAN 1991/1992 compilation saw the first introduction of temperature-dependent cross sections (203–293 K) for CFC-11 (McDaniel et al., 1991; Rothman et al., 1992; Massie and Goldman, 1992); as before these were derived from measurements of pure CCl3F at 0.03 cm−1 resolution.
While the two previous HITRAN editions (1986 and 1991/1992) neglected pressure-broadening effects on the CCl3F spectra, cross sections for 33 distinct PT combinations (201–296 K and 40–760 Torr N2-broadened) over two wavenumber ranges, 810–880 and 1050–1120 cm−1, were introduced into HITRAN 1996 (Li and Varanasi, 1994; Rothman et al., 1998). Another 22 PT combinations covering lower pressures and temperatures over the same wavenumber ranges were added to HITRAN 2000 (provided by Varanasi, cited within Rothman et al., 2003), bringing the overall PT coverage to 190–296 K and 8–760 Torr. Out of these 55 PT combinations, four pairs possess both temperature and pressure within 1 K and 5 Torr, respectively. This dataset, henceforth referred to as the Varanasi dataset, has been used widely for remote-sensing applications since it was first introduced; it is still the dataset included in the most recent GEISA 2015 (Jacquinet-Husson et al., 2016) and HITRAN 2016 (Gordon et al., 2017) spectroscopic databases. Despite its widespread use, the Varanasi dataset has some deficiencies, which will be discussed in Sect. 4, alongside a comparison with the new spectroscopic data taken as part of the present work.
Table 2FTS parameters, sample conditions, and cell configuration for all measurements.
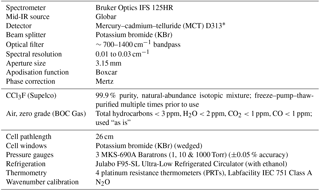
∗ Due to the non-linear response of MCT detectors to the detected radiation, all interferograms were Fourier-transformed using Bruker's OPUS software with a non-linearity correction applied.
3.1 Experimental
The experimental setup at the Molecular Spectroscopy Facility (MSF), Rutherford Appleton Laboratory (RAL), and the experimental procedures have been described previously for related measurements (e.g. Harrison et al., 2010; Harrison, 2015b, 2016); the reader is referred to one of these previous studies for more information. Instrumental parameters associated with the Fourier transform spectrometer (FTS) used for the measurements, sample details, and the cell configuration are summarised in Table 2. The sample pressures and temperatures for each air-broadened spectrum, along with their experimental uncertainties and associated spectral resolutions, are listed in Table 3.
Table 3Summary of the sample conditions for all measurements.
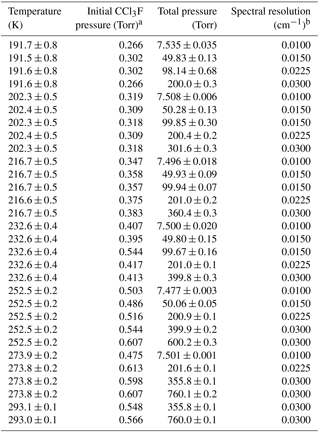
a MKS-690A Baratron readings are accurate to ±0.05 %. b Using the Bruker
definition of 0.9/MOPD.
3.2 Generation of absorption cross sections
The procedure used to generate absorption cross sections from measured spectra has been reported previously (e.g. Harrison et al., 2010; Harrison, 2015b, 2016), so the full details are not provided here. The wavenumber scale of the cross sections is calibrated against the positions of isolated N2O absorption lines taken from the HITRAN 2012 database (Rothman et al., 2013). The absorption cross sections, , in units of square centimetres per molecule and at wavenumber υ (cm−1), temperature T (K), and synthetic air pressure Pair are normalised according to
where the value on the right-hand side is the average integrated band intensity over the spectral range 710–1290 cm−1 for three 760 Torr N2-broadened trichlorofluoromethane spectra (at 278, 298, and 323 K) from the Pacific Northwest National Laboratory (PNNL) IR database (Sharpe et al., 2004). This intensity calibration procedure counters problems with trichlorofluoromethane adsorption in the vacuum line and on the cell walls, and furthermore assumes that the integrated intensity over each band system is independent of temperature. The reader is referred to Harrison et al. (2010) for a more complete explanation of the underlying assumption and references cited within Harrison (2015a, b, 2016) for details on previous successful uses of this approach.
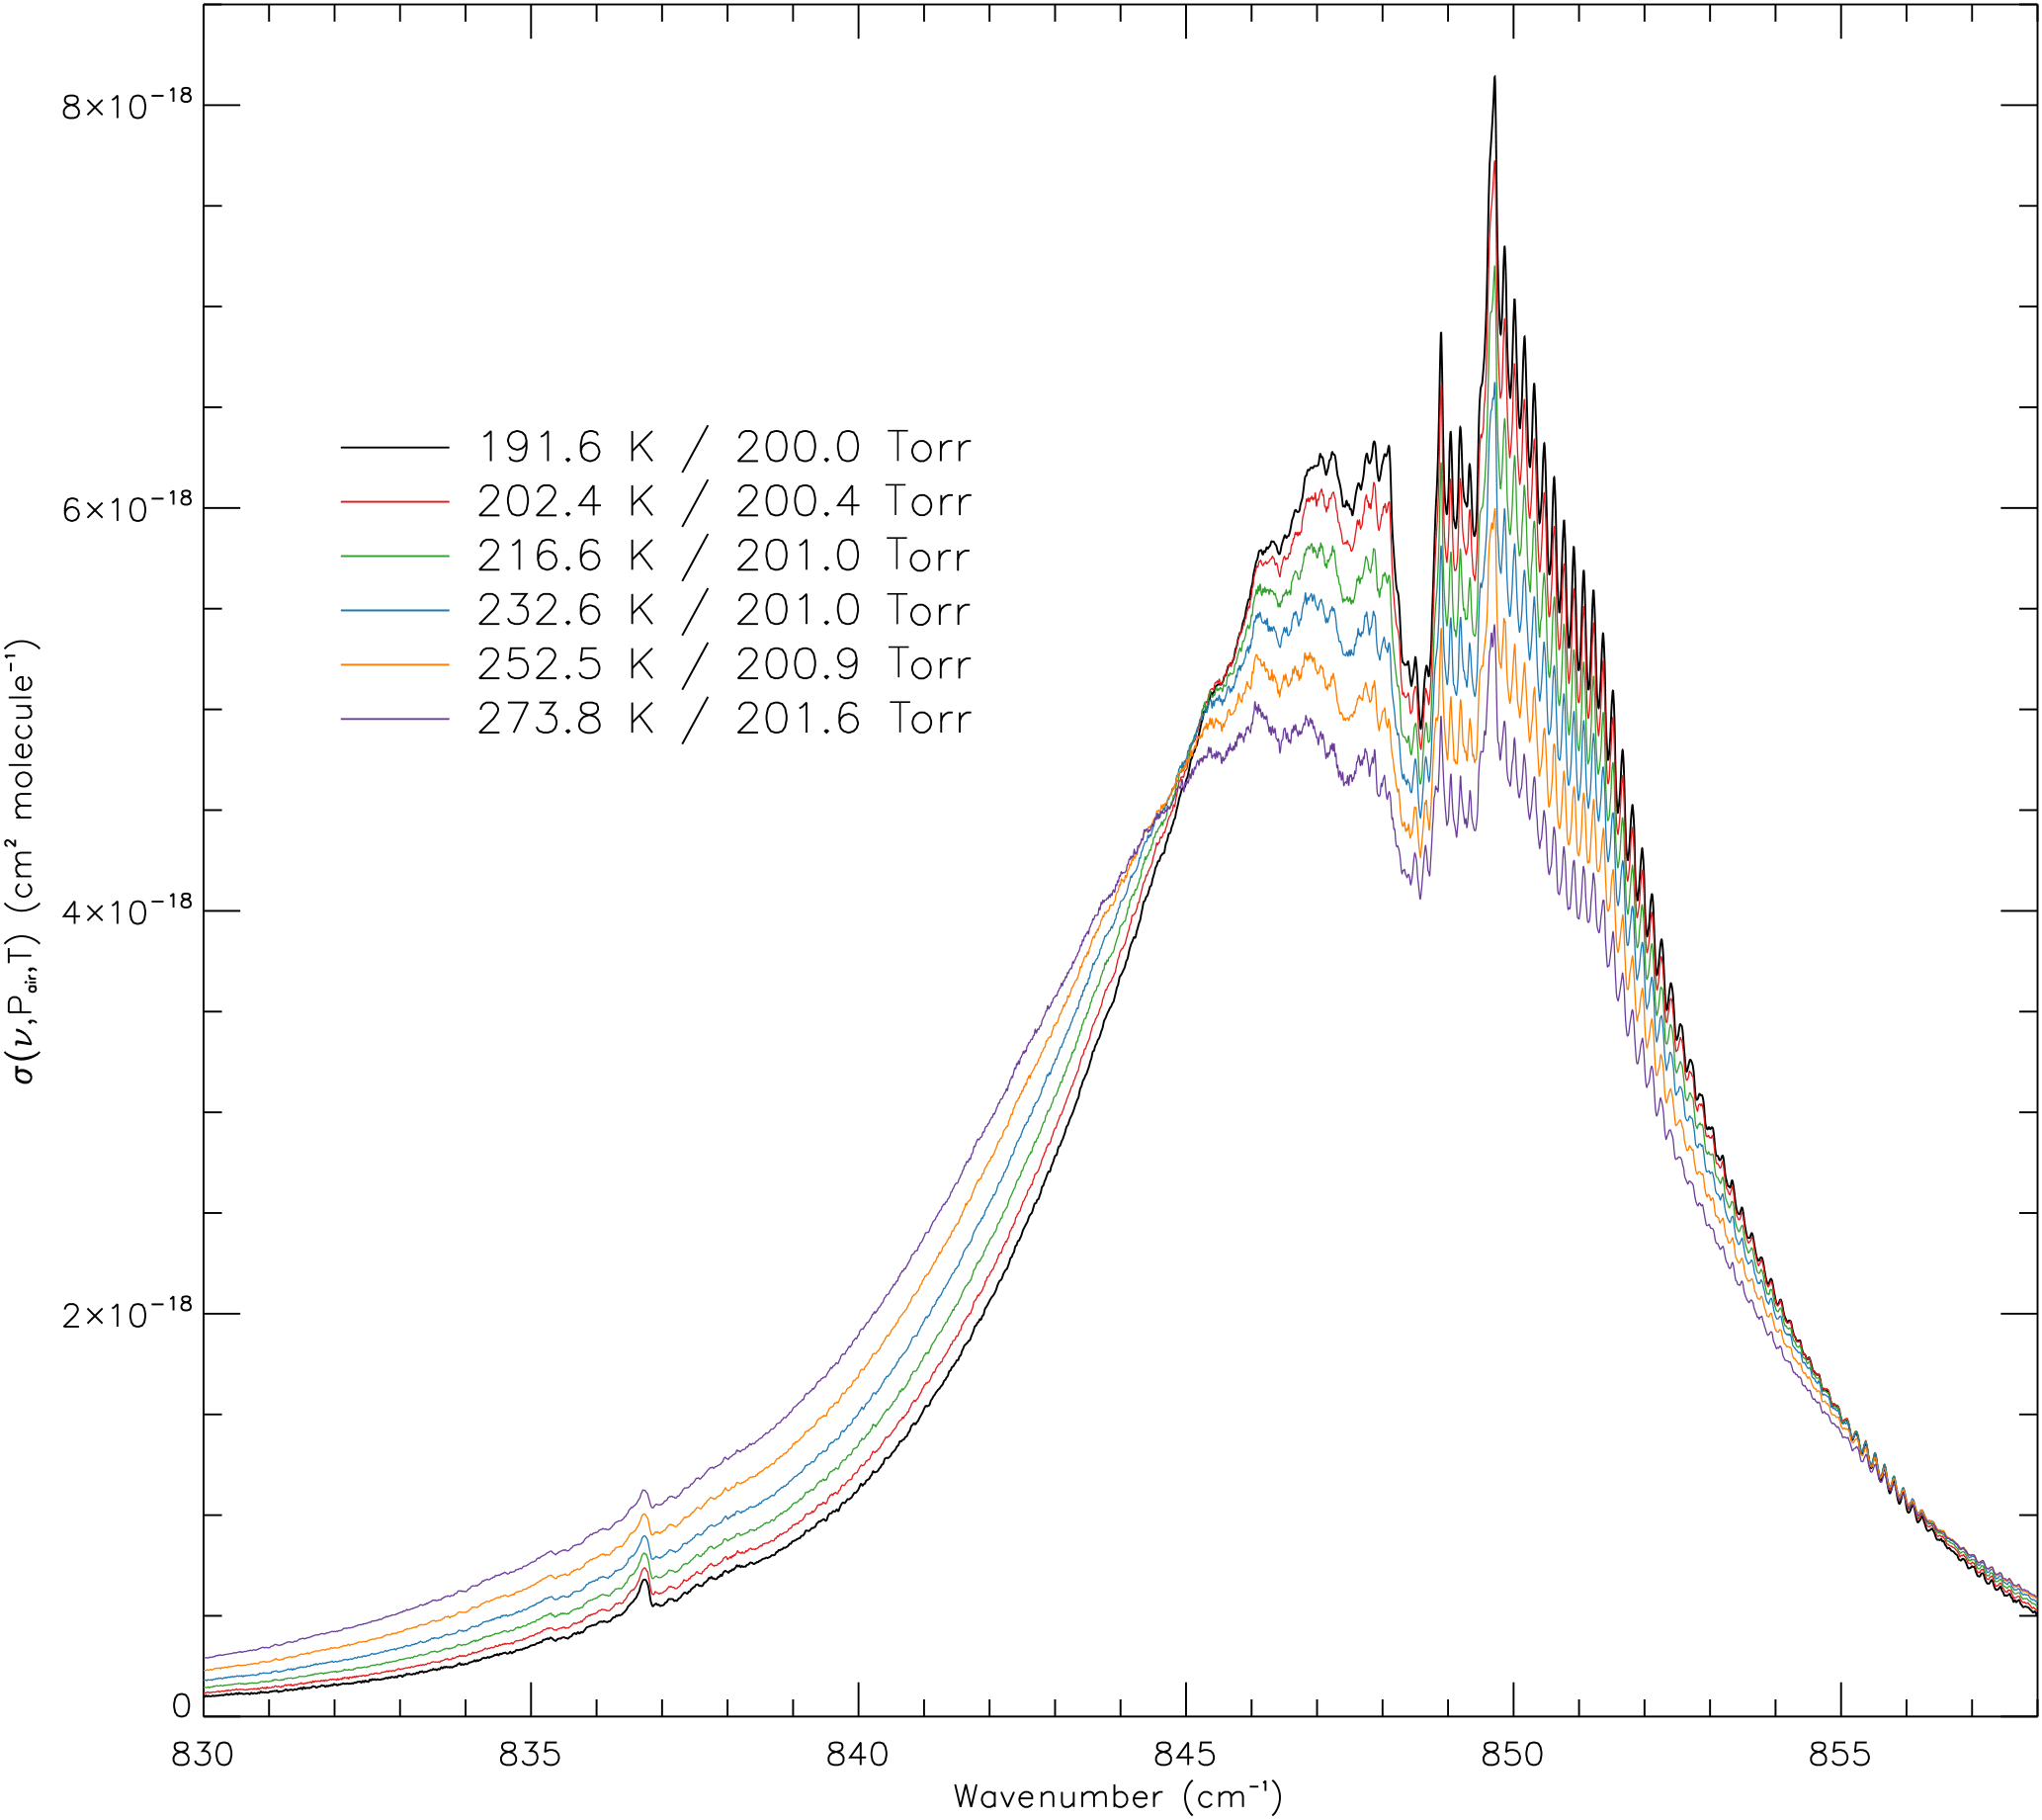
Figure 2The new absorption cross sections of trichlorofluoromethane/dry synthetic air at a total pressure of ∼200.0 Torr over a range of temperatures (191.6, 202.4, 216.6, 232.6, 252.5, and 273.8 K). The observed narrowing of the ν4 band as the temperature decreases is due to the decline in Boltzmann populations of the upper rovibrational levels of the ground state.
A selection of the derived absorption cross sections is presented in Fig. 2, showing the expected behaviour with temperature at a total pressure of ∼200 Torr; the wavenumber range covers the microwindow for the ACE-FTS v3.6 retrieval scheme.
3.3 Absorption cross-section uncertainties
The accuracy of the wavenumber scale for the new absorption cross sections is comparable to the accuracy of the N2O lines used in the calibration; according to the HITRAN error codes, this is between 0.001 and 0.0001 cm−1. The uncertainty in the intensity is dominated by systematic errors. A true measure of the random errors as a function of wavenumber would ideally require multiple concentration-pathlength burdens at each PT combination, but only one is available for each; however, as indicated in Sect. 4.4, these are small and make minimal contribution to the overall error budget. The maximum systematic uncertainties in the sample temperatures (μT) and total pressures (μP) are 0.4 % and 0.7 %, respectively (see Table 3). The photometric uncertainty (μphot), associated with the detection of radiation by the MCT detector and systematic error arising from the use of Bruker's non-linearity correction for mercury–cadmium–telluride (MCT) detectors, is estimated to be ∼2 %. The pathlength error (μpath) is estimated to be negligibly small, lower than 0.1 %. According to the PNNL metadata, the systematic error in the PNNL CCl3F spectra used for the intensity calibration is estimated to be less than 3 % (2σ). Equating the error, μPNNL, with the 1σ value, i.e. 1.5 %, and assuming that the systematic errors for all the quantities are uncorrelated, the overall systematic error in the dataset can be given by
Note that using PNNL spectra for intensity calibration effectively nullifies the errors in the trichlorofluoromethane partial pressures and cell pathlength, so these do not have to be included in Eq. (2). According to Eq. (2), the systematic error contribution, μsystematic, to the new cross sections is ∼3 % (1σ).
In this section the new dataset presented in this work is compared with the older Varanasi dataset, which has a stated uncertainty of 2 % (Li and Varanasi, 1994). The comparison focuses on their wavenumber scales, integrated band strengths, artefacts such as channel fringing, signal-to-noise ratios (SNRs), spectral resolution, and PT coverage. Given the various problems identified in sections below, the 2 % uncertainty is a significant underestimate. Overall, these new data will provide a more accurate basis for retrieving CFC-11 from atmospheric spectra recorded in the limb. In addition, the new dataset includes the weak combination band, ν2+ν5 (not present in the Varanasi measurements), which will help improve the retrievals of other species, in particular SF6.
4.1 Wavenumber scale
It is likely that the wavenumber scale for the Varanasi dataset was never calibrated; this has been observed in a number of recent studies for other halogenated species in which new datasets have been compared with older Varanasi datasets, e.g. HFC-134a (Harrison, 2015a), CFC-12 (Harrison, 2015b), and HCFC-22 (Harrison, 2016). As explained earlier, the absolute accuracy of the wavenumber scale for the new dataset lies between 0.001 and 0.0001 cm−1. In comparison, the ν4 band in the Varanasi cross sections is shifted too low in wavenumber; this shift varies between cross sections, e.g. by ∼0.002 cm−1 (a correction factor of ∼1.000002) for the 190 K, 7.5 Torr ν1 Varanasi measurement and by ∼0.007 cm−1 (a correction factor of ∼1.000007) for the 216.1 K, 100.0 Torr ν1 measurement.
4.2 Integrated band strengths
Integrated band strengths for the Varanasi cross sections have been calculated over the spectral ranges of the cross-section files, 810–880 and 1050–1120 cm−1, covering the ν4 and ν1 bands respectively, and compared with those for the new absorption cross sections calculated over the same ranges; plots of integrated band strength against temperature for each dataset, including the PNNL spectra, and wavenumber range can be found in Fig. 3. At each temperature the Varanasi integrated band strengths display a small spread in values, most notably for the ν4 band; however there is no evidence for any temperature dependence, backing up the assumption in Sect. 3.2 that the integrated intensity over each band system is independent of temperature. The small spread in values is likely due to inconsistencies in the baselines for the Varanasi cross sections, which are larger for the ν4 band. Additionally, according to the PNNL spectra and the new measurements, the ν4 cross section at 810 cm−1 is non-zero due to the presence of a weak hot band. Therefore, calculating integrated band strengths for the new dataset over the 810–880 cm−1 range creates a very small temperature dependence in the ν4 integrated band strengths. Unfortunately, the wavenumber ranges do not extend far enough to obtain an unambiguous measure of the baseline position for the Varanasi data, and the cross sections in the HITRAN and GEISA databases have had all negative cross-section values set to zero, which has the effect of adjusting the baseline positions by a small amount near the band wings.
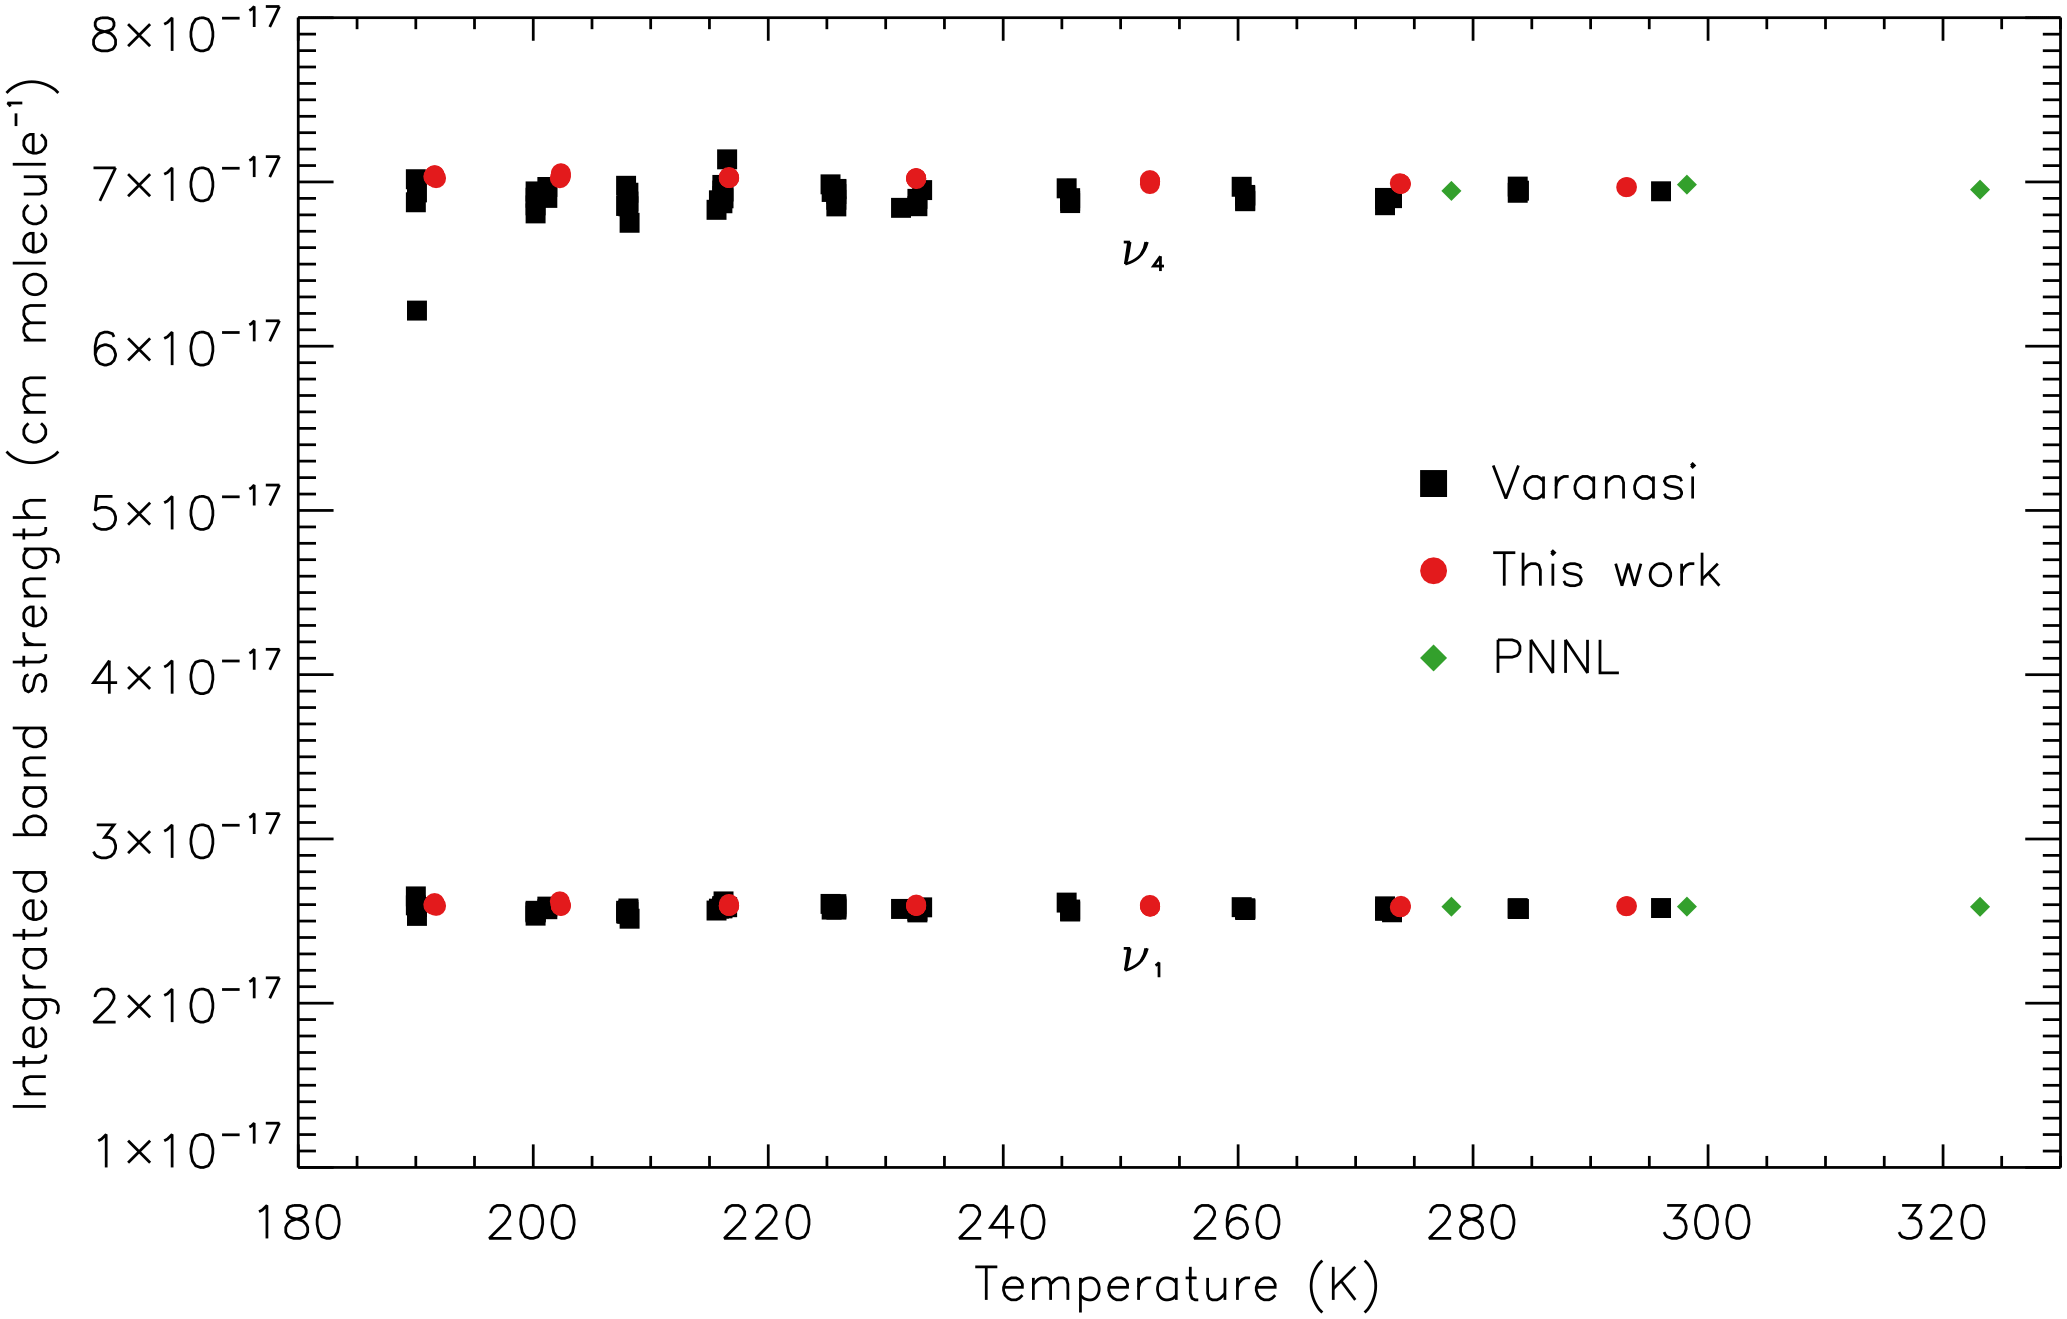
Figure 3Integrated band strength as a function of temperature for the new, Varanasi, and PNNL cross-section datasets over the wavenumber ranges 810–880 and 1050–1120 cm−1.
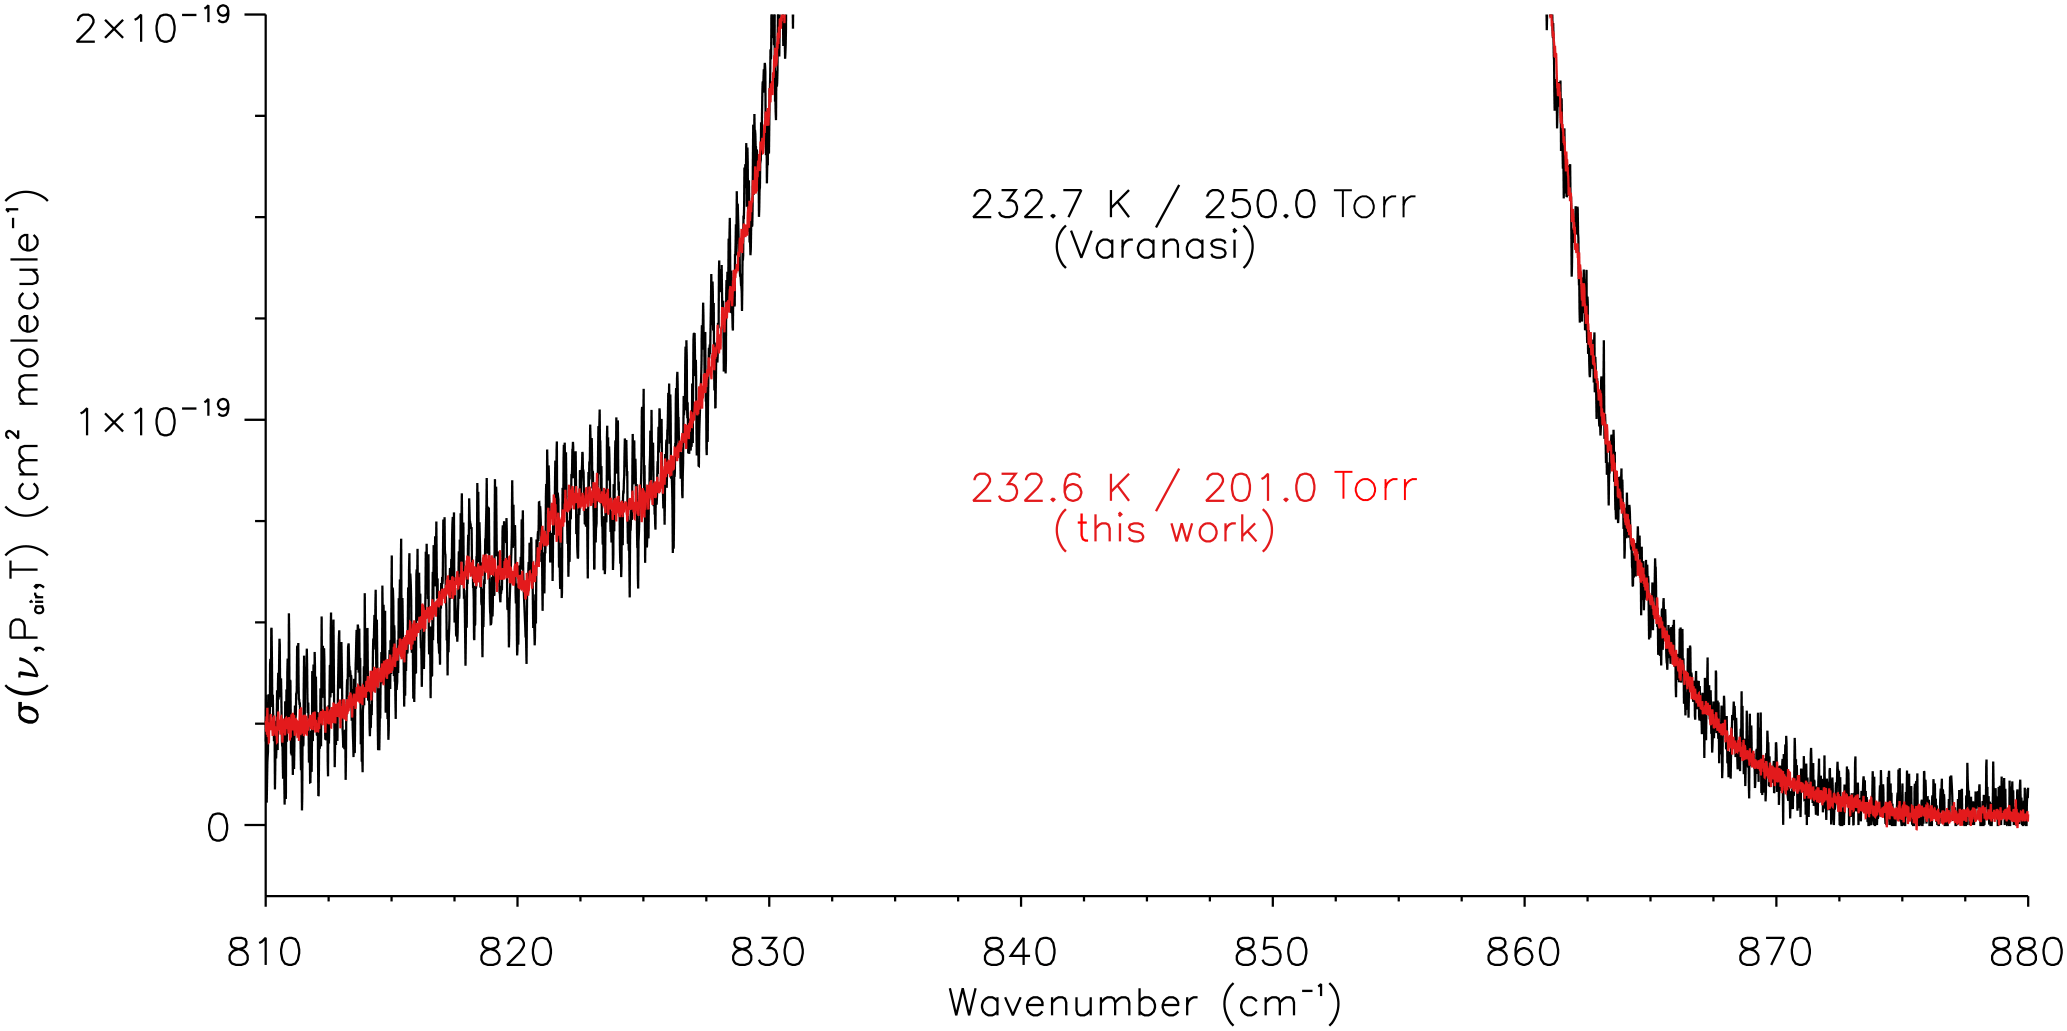
Figure 4The Varanasi absorption cross section of trichlorofluoromethane/dry synthetic air at 232.7 K and 250.0 Torr (black), with the new cross section at 232.6 K and 201.0 Torr overlaid (red; this work). Channel fringes in the Varanasi cross section are clearly visible.
4.3 Channel fringes
Most of the absorption cross sections in the Varanasi CFC-11 dataset contain noticeable channel fringes above the noise level (refer to Fig. 4 for an example of this); in transmittance these would equate to peak-to-peak amplitudes as high as ∼ 2–3 %. For the measurements described in the present work, wedged cell windows were used to avoid channel fringes by preventing reflections from components in the optical path of the spectrometer.

Figure 5The Varanasi absorption cross section of trichlorofluoromethane/dry synthetic air at 216.5 K and 7.50 Torr (black), with the new cross section at 216.7 K and 7.50 Torr overlaid (red; this work). Additional noise in the Varanasi cross section is clearly visible.
4.4 Signal-to-noise ratios (SNRs)
The SNRs of the transmittance spectra measured in the present work have been calculated using Bruker's OPUS software at ∼990 cm−1, where the transmittance is close to 1; the values range from 2600 to 4700 (rms), equivalent to percentage transmittances between 0.04 and 0.02 %. A direct comparison with the Varanasi dataset, however, is not possible without the original transmittance spectra or, at the very least, information on the experimental mixing ratios. Further complicating issues, the Varanasi cross sections are missing negative values near the baselines (refer to Sect. 4.2), and many have channel fringes superimposed. However, it is apparent from a direct inspection that the new cross sections have improved SNR, in some cases substantially so, such as shown in Fig. 5.
4.5 Spectral resolution
All spectra used to create the Varanasi cross-section dataset were recorded at either 0.01 (for sample mixtures of 75 Torr and below) or 0.03 cm−1 spectral resolution (defined as 0.9/MOPD; MOPD: maximum optical path difference). In the present work 0.01 cm−1 resolution was used for mixtures below 10 Torr, 0.03 cm−1 for 300 Torr and above, and 0.015 and 0.0225 cm−1 for intermediate pressures. The spectra recorded at 191.6 K, 98.14 Torr and 191.6 K, 200.0 Torr were mistakenly recorded at spectral resolutions of 0.0225 and 0.0300 cm−1, respectively, instead of the planned 0.015 and 0.0225 cm−1, respectively. However, careful inspection indicated that there was no under-resolving of spectral features for these two measurements. Overall, the dataset comparison indicates that the spectral resolutions chosen for the Varanasi measurements were suitable.
4.6 Pressure–temperature coverage
An absorption cross-section dataset used in remote sensing should cover all possible combinations of pressure and temperature appropriate for the region of the atmosphere being observed; in this case the focus is on the mid-troposphere (∼5 km) up to the stratosphere. Extrapolating beyond the temperatures and pressures represented within the dataset is generally unreliable, so forward-model calculations should at the very least use a four-point interpolation scheme. With this in mind, the P and T of the laboratory measurements were chosen to cover the range of P and T from ACE-FTS v3.0 data. The additional cross sections outside the range of the Varanasi P and T will ensure a better coverage for analysing atmospheric limb spectra. Figure 6 provides a graphical representation of the PT combinations for both datasets, illustrating the improved PT coverage (30 PT combinations in total) relative to the Varanasi dataset. The sampling density in PT space is lower than for the Varanasi dataset; however, due to the congestion and lack of any strong sharp features in the spectra, it is not anticipated that this will have any noticeable effect for remote-sensing applications.
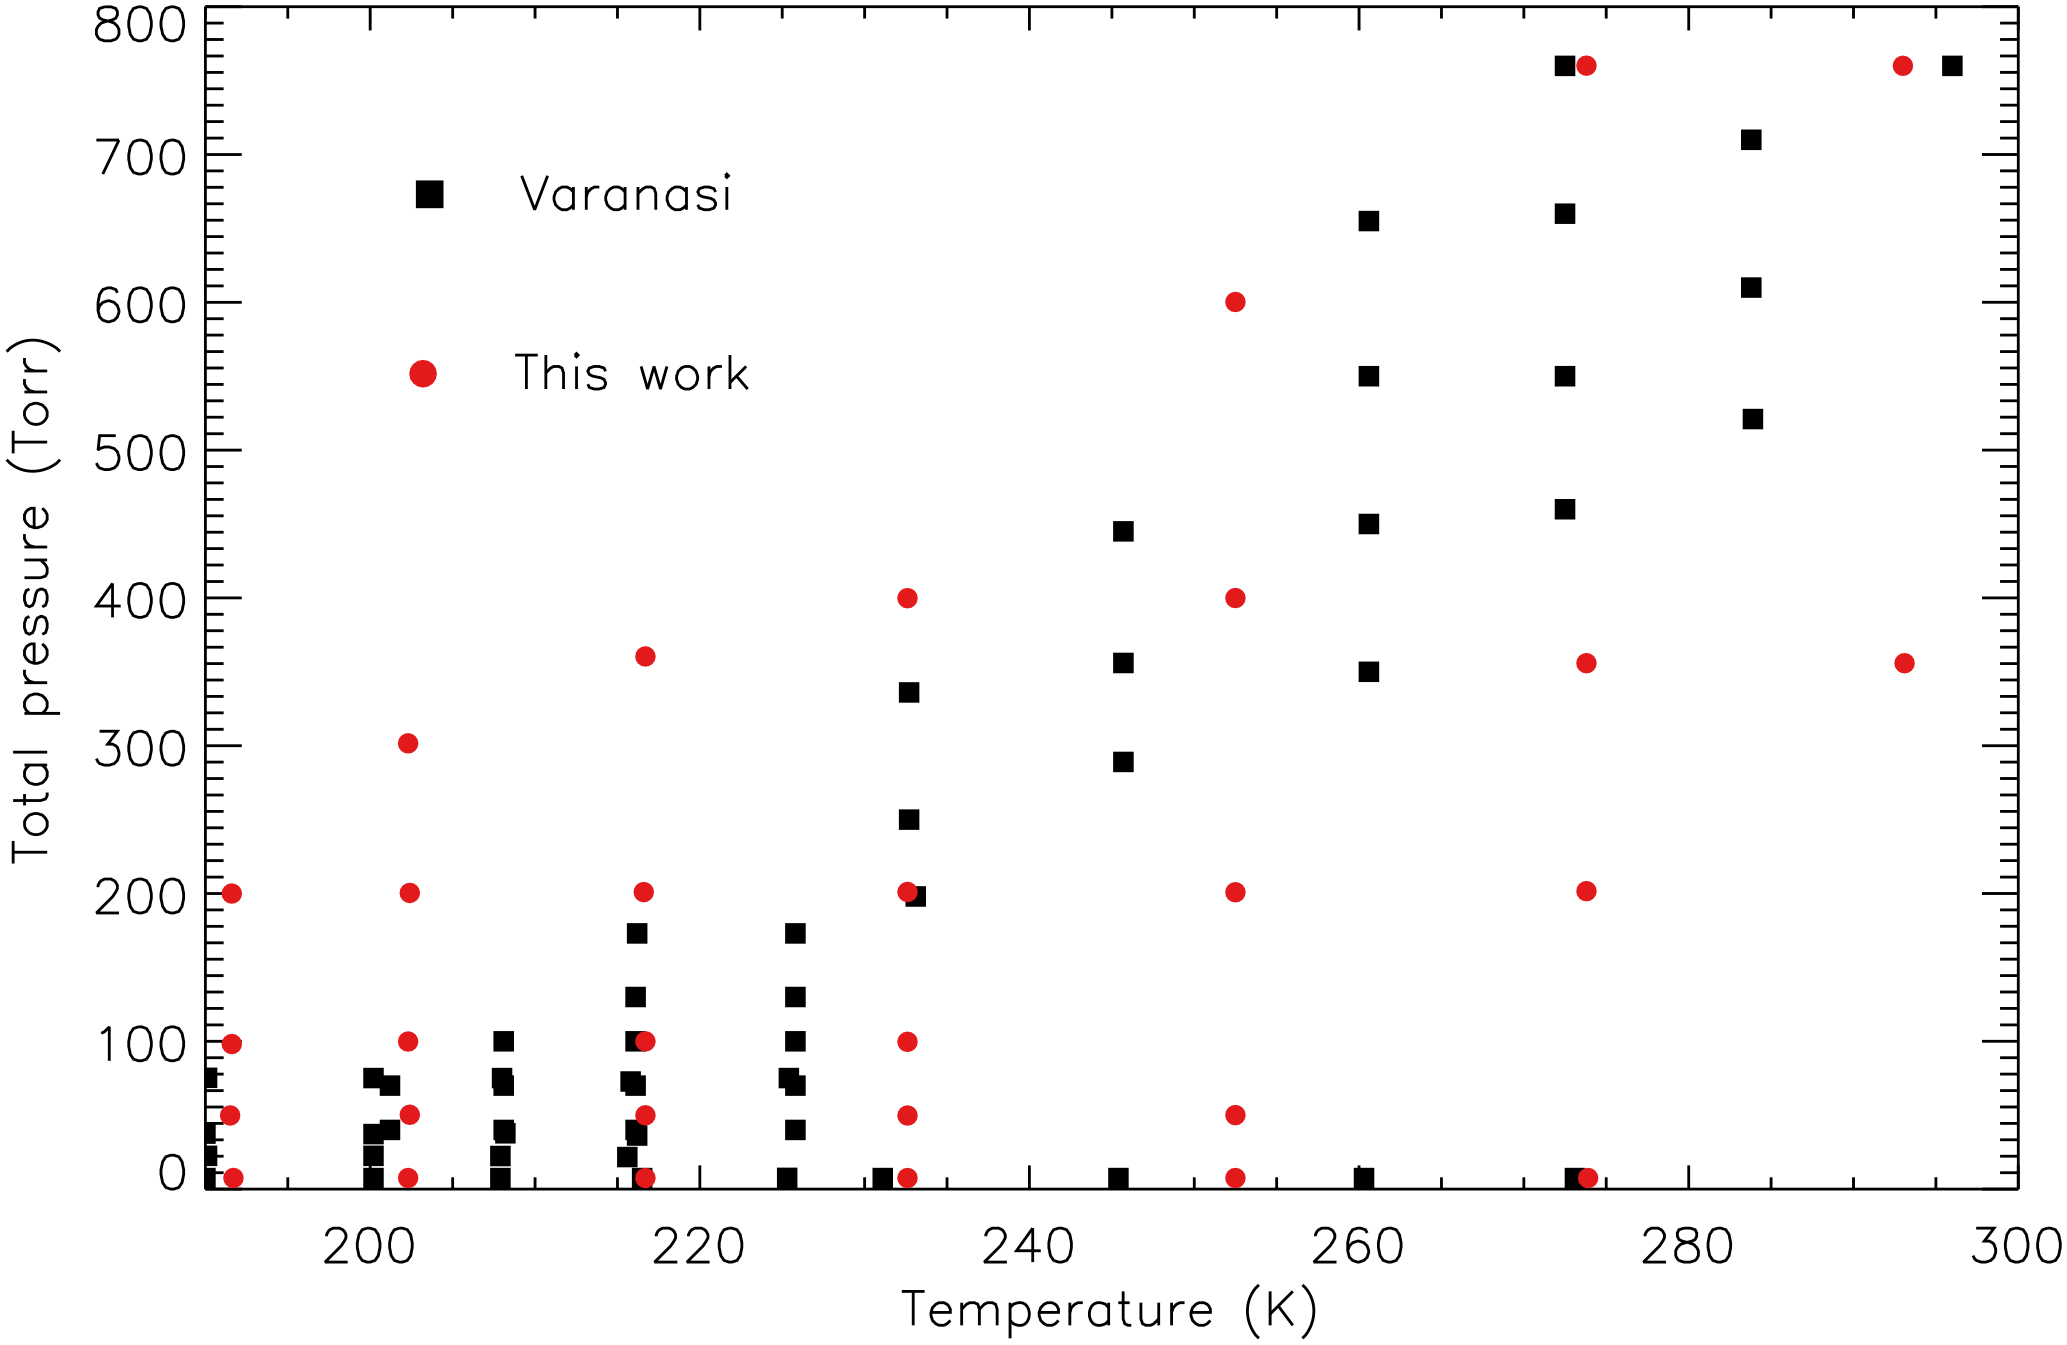
Figure 6A graphical representation of the PT coverage for both the new and Varanasi datasets.
New high-resolution IR absorption cross sections for air-broadened trichlorofluoromethane (CFC-11) have been determined over the spectral range 710–1290 cm−1, with an estimated systematic uncertainty of ∼3 %. Spectra were recorded at resolutions between 0.01 and 0.03 cm−1 (calculated as 0.9/MOPD) over a range of atmospherically relevant temperatures and pressures (7.5–760 Torr and 192–293 K). These new absorption cross sections improve upon those currently available in the HITRAN and GEISA databases. In particular, they cover a wider range of pressures and temperatures; they have a more accurately calibrated wavenumber scale; they have more consistent integrated band intensities; they do not display any channel fringing; they have improved SNR; and additionally they cover the weak combination band, ν2+ν5.
The new CFC-11 absorption cross-section dataset will be made available to the community via the HITRAN and GEISA databases but in the meantime is available electronically from the author.
The author declares that there is no conflict of interest.
The author wishes to thank the National Centre for Earth Observation (NCEO),
funded by the UK Natural Environment Research Council (NERC), for funding
this work, as well as R. Gary Williams and Robert A. McPheat for providing technical
support during the measurements.
Edited by: Gabriele Stiller
Reviewed by: Geoff Toon and one anonymous referee
Bingham, G. E., Zhou, D. K., Bartschi, B. Y., Anderson, G. P., Smith, D. R., Chetwynd, J. H., and Nadile, R. M.: Cryogenic Infrared Radiance Instrumentation for Shuttle (CIRRIS 1A) earth limb spectral measurements, calibration, and atmospheric O3, HNO3, CFC-12, and CFC-11 profile retrieval, J. Geophys. Res., 102, 3547–3558, 1997.
Brown, A. T., Chipperfield, M. P., Boone, C. D., Wilson, C., Walker, K. A., and Bernath, P. F.: Trends in atmospheric halogen containing gases since 2004, J. Quant. Spectrosc. Ra., 112, 2552–2566, 2011.
Carpenter, L. J., Reimann, S., Burkholder, J. B., Clerbaux, C., Hall, B. D., Hossaini, R., Laube, J. C., and Yvon-Lewis, S. A.: Ozone-Depleting Substances (ODSs) and Other Gases of Interest to the Montreal Protocol, chap. 1, in: Scientific Assessment of Ozone Depletion: 2014, Global Ozone Research and Monitoring Project – Report No. 55, World Meteorological Organization, Geneva, Switzerland, 2014.
Chang, A. Y., Salawitch, R. J., Michelsen, H. A., Gunson, M. R., Abrams, M. C., Zander, R., Rinsland, C. P., Elkins, J. W., Dutton, G. S., Volk, C. M., Webster, C. R., May, R. D., Fahey, D. W., Gao, R.-S., Loewenstein, M., Podolske, J. R., Stimpfle, R. M., Kohn, D. W., Proffitt, M. H., Margitan, J. J., Chan, K. R., Abbas, M. M., Goldman, A., Irion, F. W., Manney, G. L., Newchurch, M. J., and Stiller, G. P.: A comparison of measurements from ATMOS and instruments aboard the ER-2 aircraft: Halogenated gases, Geophys. Res. Lett., 23, 2393–2396, 1996.
Dinelli, B. M., Arnone, E., Brizzi, G., Carlotti, M., Castelli, E., Magnani, L., Papandrea, E., Prevedelli, M., and Ridolfi, M.: The MIPAS2D database of MIPAS/ENVISAT measurements retrieved with a multi-target 2-dimensional tomographic approach, Atmos. Meas. Tech., 3, 355–374, https://doi.org/10.5194/amt-3-355-2010, 2010.
Gordon, I. E., Rothman, L. S., Hill, C., Kochanov, R. V., Tan, Y., Bernath, P. F., Birk, M., Boudon, V., Campargue, A., Chance, K. V., Drouin, B. J., Flaud, J.-M., Gamache, R. R., Hodges, J. T., Jacquemart, D., Perevalov, V. I., Perrin, A., Shine, K. P., Smith, M.-A. H., Tennyson, J., Toon, G. C., Tran, H., Tyuterev, G., Barbe, A., Császár, A. G., Devi, V. M., Furtenbacher, T., Harrison, J. J., Hartmann, J.-M., Jolly, A., Johnson, T. J., Karman, T., Kleiner, I., Kyuberis, A. A., Loos, J., Lyulin, O. M., Massie, S. T., Mikhailenko, S. N., Moazzen-Ahmadi, N., Müller, H. S. P., Naumenko, O. V., Nikitin, A. V., Polyansky, O. L., Rey, M., Rotger, M., Sharpe, S. W., Sung, K., Starikova, E., Tashkun, S. A., Vander Auwera, J., Wagner, G., Wilzewski, J., Wcisło, P., Yu, S., and Zak, E. J.: The HITRAN2016 molecular spectroscopic database, J. Quant. Spectrosc. Ra., 203, 3–69, https://doi.org/10.1016/j.jqsrt.2017.06.038, 2017.
Harris, N. R. P., Wuebbles, D. J., Daniel, J. S., Hu, J., Kuijpers, L. J. M., Law, K. S., Prather, M. J., and Schofield, R.: Scenarios and information for policymakers, chap. 5, in: Scientific Assessment of Ozone Depletion: 2014, Global Ozone Research and Monitoring Project – Report No. 55, World Meteorological Organization, Geneva, Switzerland, 2014.
Harrison, J. J.: Infrared absorption cross sections for 1,1,1,2-tetrafluoroethane, J. Quant. Spectrosc. Ra., 151, 210–216, https://doi.org/10.1016/j.jqsrt.2014.09.023, 2015a.
Harrison, J. J.: New and improved infrared absorption cross sections for dichlorodifluoromethane (CFC-12), Atmos. Meas. Tech., 8, 3197–3207, https://doi.org/10.5194/amt-8-3197-2015, 2015b.
Harrison, J. J.: New and improved infrared absorption cross sections for chlorodifluoromethane (HCFC-22), Atmos. Meas. Tech., 9, 2593–2601, https://doi.org/10.5194/amt-9-2593-2016, 2016.
Harrison, J. J., Allen. N. D. C., and Bernath, P. F.: Infrared absorption cross sections for ethane (C2H6) in the 3 µm region, J. Quant. Spectrosc. Ra., 111, 357–363, https://doi.org/10.1016/j.jqsrt.2009.09.010, 2010.
Hoffmann, L., Spang, R., Kaufmann, M., and Riese, M.: Retrieval of CFC-11 and CFC-12 from Envisat MIPAS observations by means of rapid radiative transfer calculations, Adv. Space Res., 36, 915–921, https://doi.org/10.1016/j.asr.2005.03.112, 2005.
Hoffmann, L., Hoppe, C. M., Müller, R., Dutton, G. S., Gille, J. C., Griessbach, S., Jones, A., Meyer, C. I., Spang, R., Volk, C. M., and Walker, K. A.: Stratospheric lifetime ratio of CFC-11 and CFC-12 from satellite and model climatologies, Atmos. Chem. Phys., 14, 12479–12497, https://doi.org/10.5194/acp-14-12479-2014, 2014.
Irion, F. W., Gunson, M. R., Toon, G. C., Chang, A. Y., Eldering, A., Mahieu, E., Manney, G. L., Michelsen, H. A., Moyer, E. J., Newchurch, M. J., Osterman, G. B., Rinsland, C. P., Salawitch, R. J., Sen, B., Yung, Y. L., and Zander, R.: Atmospheric Trace Molecule Spectroscopy (ATMOS) Experiment Version 3 data retrievals, Appl. Optics, 41, 6968–6979, 2002.
Jacquinet-Husson, N., Armante, R., Scott, N.A., Chédin, A., Crépeau, L., Boutammine, C., Bouhdaoui, A., Crevoisier, C., Capelle, V., Boonne, C., Poulet-Crovisier, N., Barbe, A., Benner, D. C., Boudon, V., Brown, L. R., Buldyreva, J., Campargue, A., Coudert, L. H., Devi, V. M., Down, M. J., Drouin, B. J., Fayt, A., Fittschen, C., Flaud, J.-M., Gamache, R. R., Harrison, J. J., Hill, C., Hodnebrog, Ø., Hu, S.-M., Jacquemart, D., Jolly, A., Jiménez, E., Lavrentieva, N. N., Liu, A.-W., Lodi, L., Lyulin, O. M., Massie, S. T., Mikhailenko, S., Müller, H. S. P., Naumenko, O. V., Nikitin, A., Nielsen, C. J., Orphal, J., Perevalov, V. I., Perrin, A., Polovtseva, E., Predoi-Cross, A., Rotger, M., Ruth, A. A., Yu, S. S., Sung, K., Tashkun, S. A., Tennyson, J., Tyuterev, Vl. G., Vander Auwera, J., Voronin, B. A., and Makie, A.: The 2015 edition of the GEISA spectroscopic database, J. Mol. Spectrosc., 327, 31–72, https://doi.org/10.1016/j.jms.2016.06.007, 2016.
Kellmann, S., von Clarmann, T., Stiller, G. P., Eckert, E., Glatthor, N., Höpfner, M., Kiefer, M., Orphal, J., Funke, B., Grabowski, U., Linden, A., Dutton, G. S., and Elkins, J. W.: Global CFC-11 (CCl3F) and CFC-12 (CCl2F2) measurements with the Michelson Interferometer for Passive Atmospheric Sounding (MIPAS): retrieval, climatologies and trends, Atmos. Chem. Phys., 12, 11857–11875, https://doi.org/10.5194/acp-12-11857-2012, 2012.
Li, Z. and Varanasi, P.: Measurement of the absorption cross-sections of CFC-11 at conditions representing various model atmospheres, J. Quant. Spectrosc. Ra., 52, 137–144, 1994.
Massie, S. T. and Goldman, A.: Absorption parameters of very dense molecular spectra for the HITRAN compilation, J. Quant. Spectrosc. Ra., 48, 713–719, 1992.
Massie, S. T., Goldman, A., Murcray, D. G., and Gille, J. C.: Approximate absorption cross-sections of F12, F11, ClONO2, N2O5, HNO3, CCl4, CF4, F21, F113, F114, and HNO4, Appl. Optics, 24, 3426–3427, 1985.
McDaniel, A. H., Cantrell, C. A., Davidson, J. A., Shetter, R. E., and Calvert, J. G.: The Temperature Dependent, Infrared Absorption Cross-Sections for the Chlorofluorocarbons: CFC-11, CFC-12, CFC-13, CFC-14, CFC-22, CFC-113, CFC-114, and CFC-115, J. Atmos. Chem., 12, 211–227, 1991.
Offermann, D., Grossmann, K.-U., Barthol, P., Knieling, P., Riese, M., and Trant, R.: Cryogenic Infrared Spectrometers and Telescopes for the Atmosphere (CRISTA) experiment and middle atmosphere variability, J. Geophys. Res., 104, 16311–16325, https://doi.org/10.1029/1998JD100047, 1999.
Roche, A. E., Kumer, J. B., Mergenthaler, J. L., Ely, G. A., Uplinger, W. G., Potter, J. F., James, T. C., and Sterritt, L. W.: The cryogenic limb array etalon spectrometer (CLAES) on UARS: Experiment description and performance, J. Geophys. Res., 98, 10763–10775, https://doi.org/10.1029/93JD00800, 1993.
Rothman, L. S., Gamache, R. R., Goldman, A., Brown, L. R., Toth, R. A., Pickett, H. M., Poynter, R. L., Flaud, J.-M., Camy-Peyret, C., Barbe, A., Husson, N., Rinsland, C. P., and Smith, M. A. H.: The HITRAN database: 1986 edition, Appl. Optics, 26, 4058–4097, 1987.
Rothman, L. S., Gamache, R. R., Tipping, R. H., Rinsland, C. P., Smith, M. A. H., Benner D. C., Devi, V. M., Flaud, J.-M., Camy-Peyret, C., Perrin, A., Goldman, A., Massie, S. T., Brown, L. R., and Toth, R. A.: The HITRAN molecular database: Editions of 1991 and 1992, J. Quant. Spectrosc. Ra., 48, 469–507, 1992.
Rothman, L. S., Rinsland, C. P., Goldman, A., Massie, S. T., Edwards, D. P., Flaud, J.-M., Perrin, A., Camy-Peyret, C., Dana, V., Mandin, J.-Y., Schroeder, J., Mccann, A., Gamache, R. R., Wattson, R. B., Yoshino, K., Chance, K. V., Jucks, K. W., Brown, L. R., Nemtchinov, V., and Varanasi, P.: The HITRAN Molecular Spectroscopic Database and Hawks (HITRAN Atmospheric Workstation): 1996 Edition, J. Quant. Spectrosc. Ra., 60, 665–710, 1998.
Rothman, L. S., Barbe, A., Benner, D. C., Brown, L. R., Camy-Peyret, C., Carleer, M. R., Chance, K., Clerbaux, C., Dana, V., Devi, V. M., Fayt, A., Flaud, J.-M., Gamache, R. R., Goldman, A., Jacquemart, D., Jucks, K. W., Lafferty, W. J., Mandin, J.-Y., Massie, S. T., Nemtchinov, V., Newnham, D. A., Perrin, A., Rinsland, C. P., Schroeder, J., Smith, K. M., Smith, M. A. H., Tang, K., Toth, R. A., Vander Auwera, J., Varanasi, P., and Yoshino, K.: The HITRAN molecular spectroscopic database: Edition of 2000 including updates through 2001, J. Quant. Spectrosc. Ra., 82, 5–44, 2003.
Rothman, L. S., Gordon, I. E., Babikov, Y., Barbe, A., Benner, D. C., Bernath, P. F., Birk, M., Bizzocchi, L., Boudon, V., Brown, L. R., Campargue, A., Chance, K., Cohen, E. A., Coudert, L. H., Devi, V. M., Drouin, B. J., Fayt, A., Flaud, J.-M., Gamache, R. R., Harrison, J. J., Hartmann, J.-M., Hill, C., Hodges, J. T., Jacquemart, D., Jolly, A., Lamouroux, J., Le Roy, R. J., Li, G., Long, D. A., Lyulin, O. M., Mackie, C. J., Massie, S. T., Mikhailenko, S., Müller, H. S. P., Naumenko, O. V., Nikitin, A. V., Orphal, J., Perevalov, V., Perrin, A., Polovtseva, E. R., Richard, C., Smith, M. A. H., Starikova, E., Sung, K., Tashkun, S., Tennyson, J., Toon, G. C., Tyuterev, Vl. G., and Wagner, G.: The HITRAN2012 molecular spectroscopic database, J. Quant. Spectrosc. Ra., 130, 4–50, 2013.
Sharpe, S. W., Johnson, T. J., Sams, R. L., Chu, P. M., Rhoderick, G. C., and Johnson, P. A.: Gas-phase databases for quantitative infrared spectroscopy, Appl. Spectrosc., 58, 1452–1461, 2004.
Snels, M., D'Amico, G., Piccarreta, L., Hollenstein, H., and Quack, M.: Diode–Laser Jet Spectra and Analysis of the ν1 and ν4 Fundamentals of CCl3F, J. Mol. Spectrosc., 205, 102–109, 2001.
Solomon, S.: Stratospheric ozone depletion: A review of concepts and history, Rev. Geophys., 37, 275–316, 1999.
von Lilienfeld, O. A., Leonard, C., Handy, N. C., Carter, S., Willeke, M., and Quack, M.: Spectroscopic properties of trichlorofluoromethane CCl3F calculated by density functional theory, Phys. Chem. Chem. Phys., 9, 5027–5035, https://doi.org/10.1039/B704995A, 2007.
Wetzel, G., Oelhaf, H., Friedl-Vallon, F., Kleinert, A., Lengel, A., Maucher, G., Nordmeyer, H., Ruhnke, R., Nakajima, H., Sasano, Y., Sugita, T., and Yokota, T.: Intercomparison and validation of ILAS-II version 1.4 target parameters with MIPAS-B measurements, J. Geophys. Res., 111, D11S06, https://doi.org/10.1029/2005JD006287, 2006.
Yokota, T., Nakajima, H., Sugita, T., Tsubaki, H., Itou, Y., Kaji, M., Suzuki, M., Kanzawa, H., Park, J. H., and Sasano, Y.: Improved Limb Atmospheric Spectrometer (ILAS) data retrieval algorithm for Version 5.20 gas profile products, J. Geophys. Res., 107, 8216, https://doi.org/10.1029/2001JD000628, 2002.