the Creative Commons Attribution 4.0 License.
the Creative Commons Attribution 4.0 License.
 | 05 Dec 2018
The NCAS mobile dual-polarisation Doppler X-band weather radar (NXPol)
Lindsay Bennett
Alan Blyth
Chris Collier
David Dufton
James Groves
Daniel Walker
Chris Walden
John Bradford
Barbara Brooks
Freya I. Addison
John Nicol
Ben Pickering
In recent years, dual-polarisation Doppler X-band radars have become a widely used part of the atmospheric scientist's toolkit for examining cloud dynamics and microphysics and making quantitative precipitation estimates. This is especially true for research questions that require mobile radars. Here we describe the National Centre for Atmospheric Science (NCAS) mobile X-band dual-polarisation Doppler weather radar (NXPol) and the infrastructure used to deploy the radar and provide an overview of the technical specifications. It is the first radar of its kind in the UK. The NXPol is a Meteor 50DX manufactured by Selex-Gematronik (Selex ES GmbH), modified to operate with a larger 2.4 m diameter antenna that produces a 0.98∘ half-power beam width and without a radome. We provide an overview of the technical specifications of the NXPol with emphasis given to the description of the aspects of the infrastructure developed to deploy the radar as an autonomous observing facility in remote locations. To demonstrate the radar's capabilities, we also present examples of its use in three recent field campaigns and its ongoing observations at the NERC Facility for Atmospheric Radio Research (NFARR).
- Article
(15866 KB) - Full-text XML
- BibTeX
- EndNote


Polarimetric radars are powerful tools for meteorological studies. The diverse quantities observed by polarimetric radars can provide significant insights into the evolution of clouds and precipitation (e.g. Fabry, 2015). Thus, small and/or mobile dual-polarisation Doppler X-band radars have become popular tools for examining cloud microphysics and dynamics as well as making quantitative precipitation estimates (QPEs) in mobile applications (Wurman et al., 1997; Matrosov et al., 2005; Wang and Chandrasekar, 2010). Currently, a significant number of such radars exist in the operational and research sectors to address a broad range of scientific goals pertaining to atmospheric physics and hydrometeorology (Maki et al., 2005; Bluestein et al., 2007, 2014; Kato and Maki, 2009; Pazmany et al., 2013; Forget et al., 2016; Mishra et al., 2016; Antonini et al., 2017). Use of such radars notably includes recent field campaigns such as PECAN (Plains Elevated Convection At Night, Geerts et al., 2017), for which a variety of mobile radars (both X-band and C-band) from multiple institutions were used collaboratively to achieve complex goals successfully. In the United States, where mobile research radars are more numerous, large multi-institution observational campaigns, similar to PECAN, occur several times a decade (e.g. the second Verification of the Origins of Rotation in Tornadoes Experiment (VORTEX-2); Wurman et al., 2012). Mobile radars are also used as a teaching resource, for example, the University of Oklahoma SMART (Shared Mobile Atmospheric Research and Teaching) radar (Biggerstaff et al., 2005). Thus, it is difficult to understate the role of such instrumentation in hydrometeorology and atmospheric research.
Here we describe the National Centre for Atmospheric Science (NCAS) Mobile X-band dual-polarisation Doppler weather radar (NXPol) shown in Fig. 1 and the supporting infrastructure structure that has been developed to support the radar when on deployment. The NXPol is the first dual-polarisation mobile radar in the UK. The supporting infrastructure has been developed to create a robust facility that may be operated remotely with minimal staff. As such, the NXPol has developed into a semi-operational observing system facility that has the significant capabilities present in both traditional research radars used for intensive operational periods (IOPs) and radars operated as part of national networks. In addition to the technical description, examples of NXPol in three differing campaigns are shown, as well as an example of its ongoing use at the NERC Facility for Atmospheric Radar Research (NFARR) located at the Chilbolton Observatory. The NXPol is part of the pool of mobile instruments that make up the UK NCAS Atmospheric Measurement Facility (NCAS-AMF; https://www.ncas.ac.uk/index.php/en/about-amf, last access: 15 July 2018) so it is available for use by the community according to the procedures set out by NCAS-AMF.
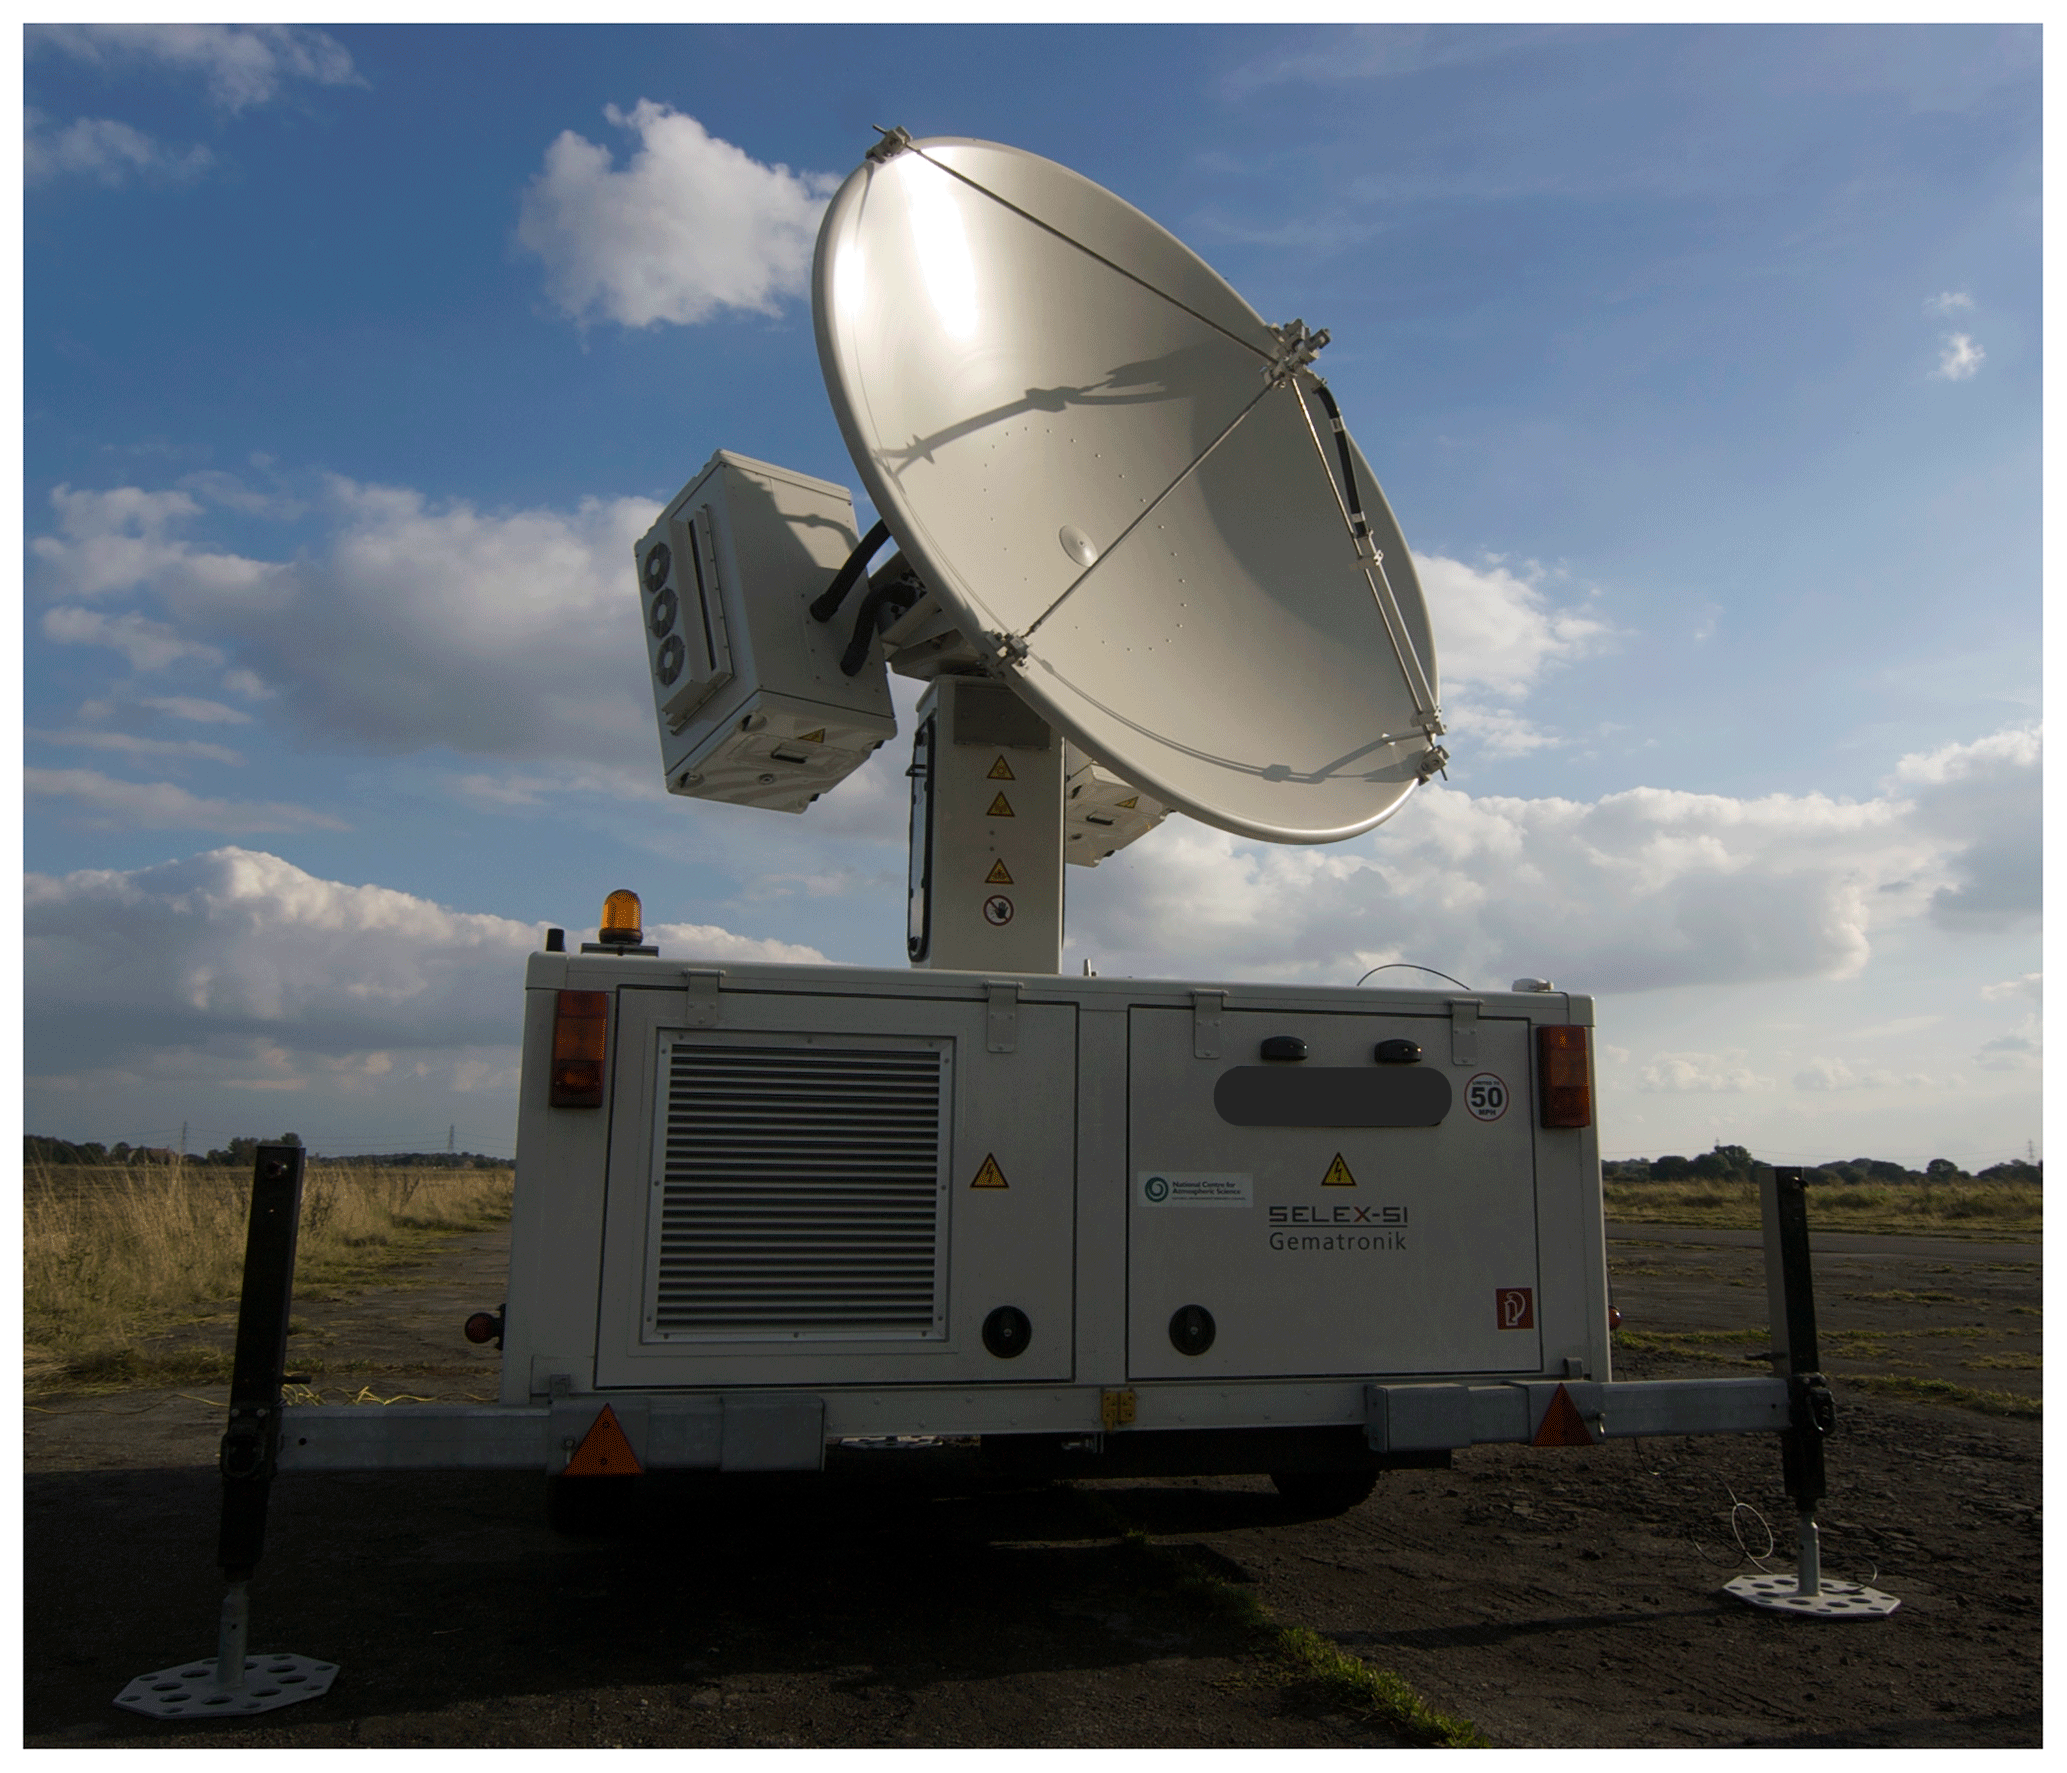
Figure 1Photograph of the NXPol collecting data at Burn Airfield near Selby, UK. Here the NXPol is deployed using only its trailer as a platform.
The NXPol is a modified mobile Meteor 50DX (Selex ES GmbH) X-band, dual-polarisation, Doppler weather radar. The radar is a magnetron-based system and operates at a nominal frequency of 9.375 GHz (∼3.2 cm). A detailed description of the development of this class of Selex radars is given by Borgmann et al. (2007). The radar is capable of measuring areal precipitation, radial winds and properties of cloud and precipitation particles. It can also detect non-meteorological echoes, including biota, at close range by scanning at slower speeds and optimising the transmitter and receiver. Similar radars (including the newer Meteor 60DX) are utilised by national weather services and research centres throughout the world. Table 1 provides a summary of the technical characteristics of the NXPol.
Like all standard mobile Meteor 50/60DX radars, NXPol is transportable. The radar is constructed on a wheeled platform that is approved for towing on roads in the European Union by a 4×4 vehicle and can also be lifted by a crane. This trailer includes a generator to provide necessary power and the communications infrastructure to operate and monitor the radar remotely for up to 24 h. This mobility makes NXPol a highly versatile tool for studying a diverse array of atmospheric phenomenon across the globe. The main difference between NXPol and the standard mobile Meteor 50/60DX is that the NXPol has been fitted with a larger 2.4 m diameter antenna that produces a 0.98∘ half-power beam width. The NXPol is operated without a radome, which is beneficial for eliminating radome attenuation effects, but extra care is required during transport, and long-distance shipping may need the antenna and external waveguides to be removed. The decision to fit NXPol with a larger antenna was made to support the ability to make higher resolution observations of convective clouds. In comparison, the standard mobile Meteor 50/60DX has a 1.8 m antenna that produces a 1.3∘ half-power beam width and is usually operated with a radome. In addition to its increased spatial resolution, NXPol is also advantageous for use in the observation of cloud evolution because of its rapid scanning capabilities of up to 36 .
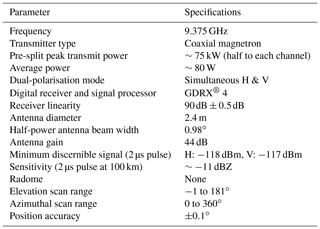
Table 2Parameter settings. Boldface indicates settings typically used for operations.

2.1 Operations
The NXPol can be operated via a remote computer (e.g. a laptop or server) that connects by wireless, ethernet or 3G to PCs on board the NXPol's trailer unit. The operational software allows the user to set up the radar for deployment and schedule the scanning sequence. Ravis® is the maintenance and calibration software used for system diagnostics and testing, as well as real-time data visualisation. Ravis® includes an automatic sun tracking tool for alignment of the system. Rainbow® 5 is the scan scheduling, data visualisation and analysis software, providing near real-time product and image generation. As shown in Table 2, the NXPol is highly configurable with regards to the pulse width, pulse repetition frequency (PRF) and scan pattern and can be tailored to address the specific scientific question being examined. Bold values in Table 2 indicate the typical parameter settings used in the examples shown in Sect. 3. Signal retrieval, analysis and data storage are performed by the GDRX® 4 digital receiver and signal processor.
Note that the NXPol operates only using the hybrid polarisation basis, also known as the simultaneous transmit and receive (STAR) mode (i.e. it splits the transmitted signal into two parts and simultaneously transmits and receives horizontal (H) and vertical (V) polarisations; Chandrasekar and Bharadwaj, 2009). This mode operates under the assumption that the cross-polarisation signals are weak in comparison to the co-polar signals and are therefore negligible (Wang and Chandrasekar, 2006). As the cross-polar signals are not measured, observations of the linear depolarisation ratio (LDR) are not available. The benefit of the STAR mode is that the NXPol has a much simpler and robust hardware design because it avoids switching between H and V polarisation on a pulse-to-pulse basis (Doviak et al., 2000; Bringi and Chandrasekar, 2001). STAR-mode operations also lead to less noisy measurements of differential reflectivity (ZDR) and other quantities while operating at rapid scan speeds.
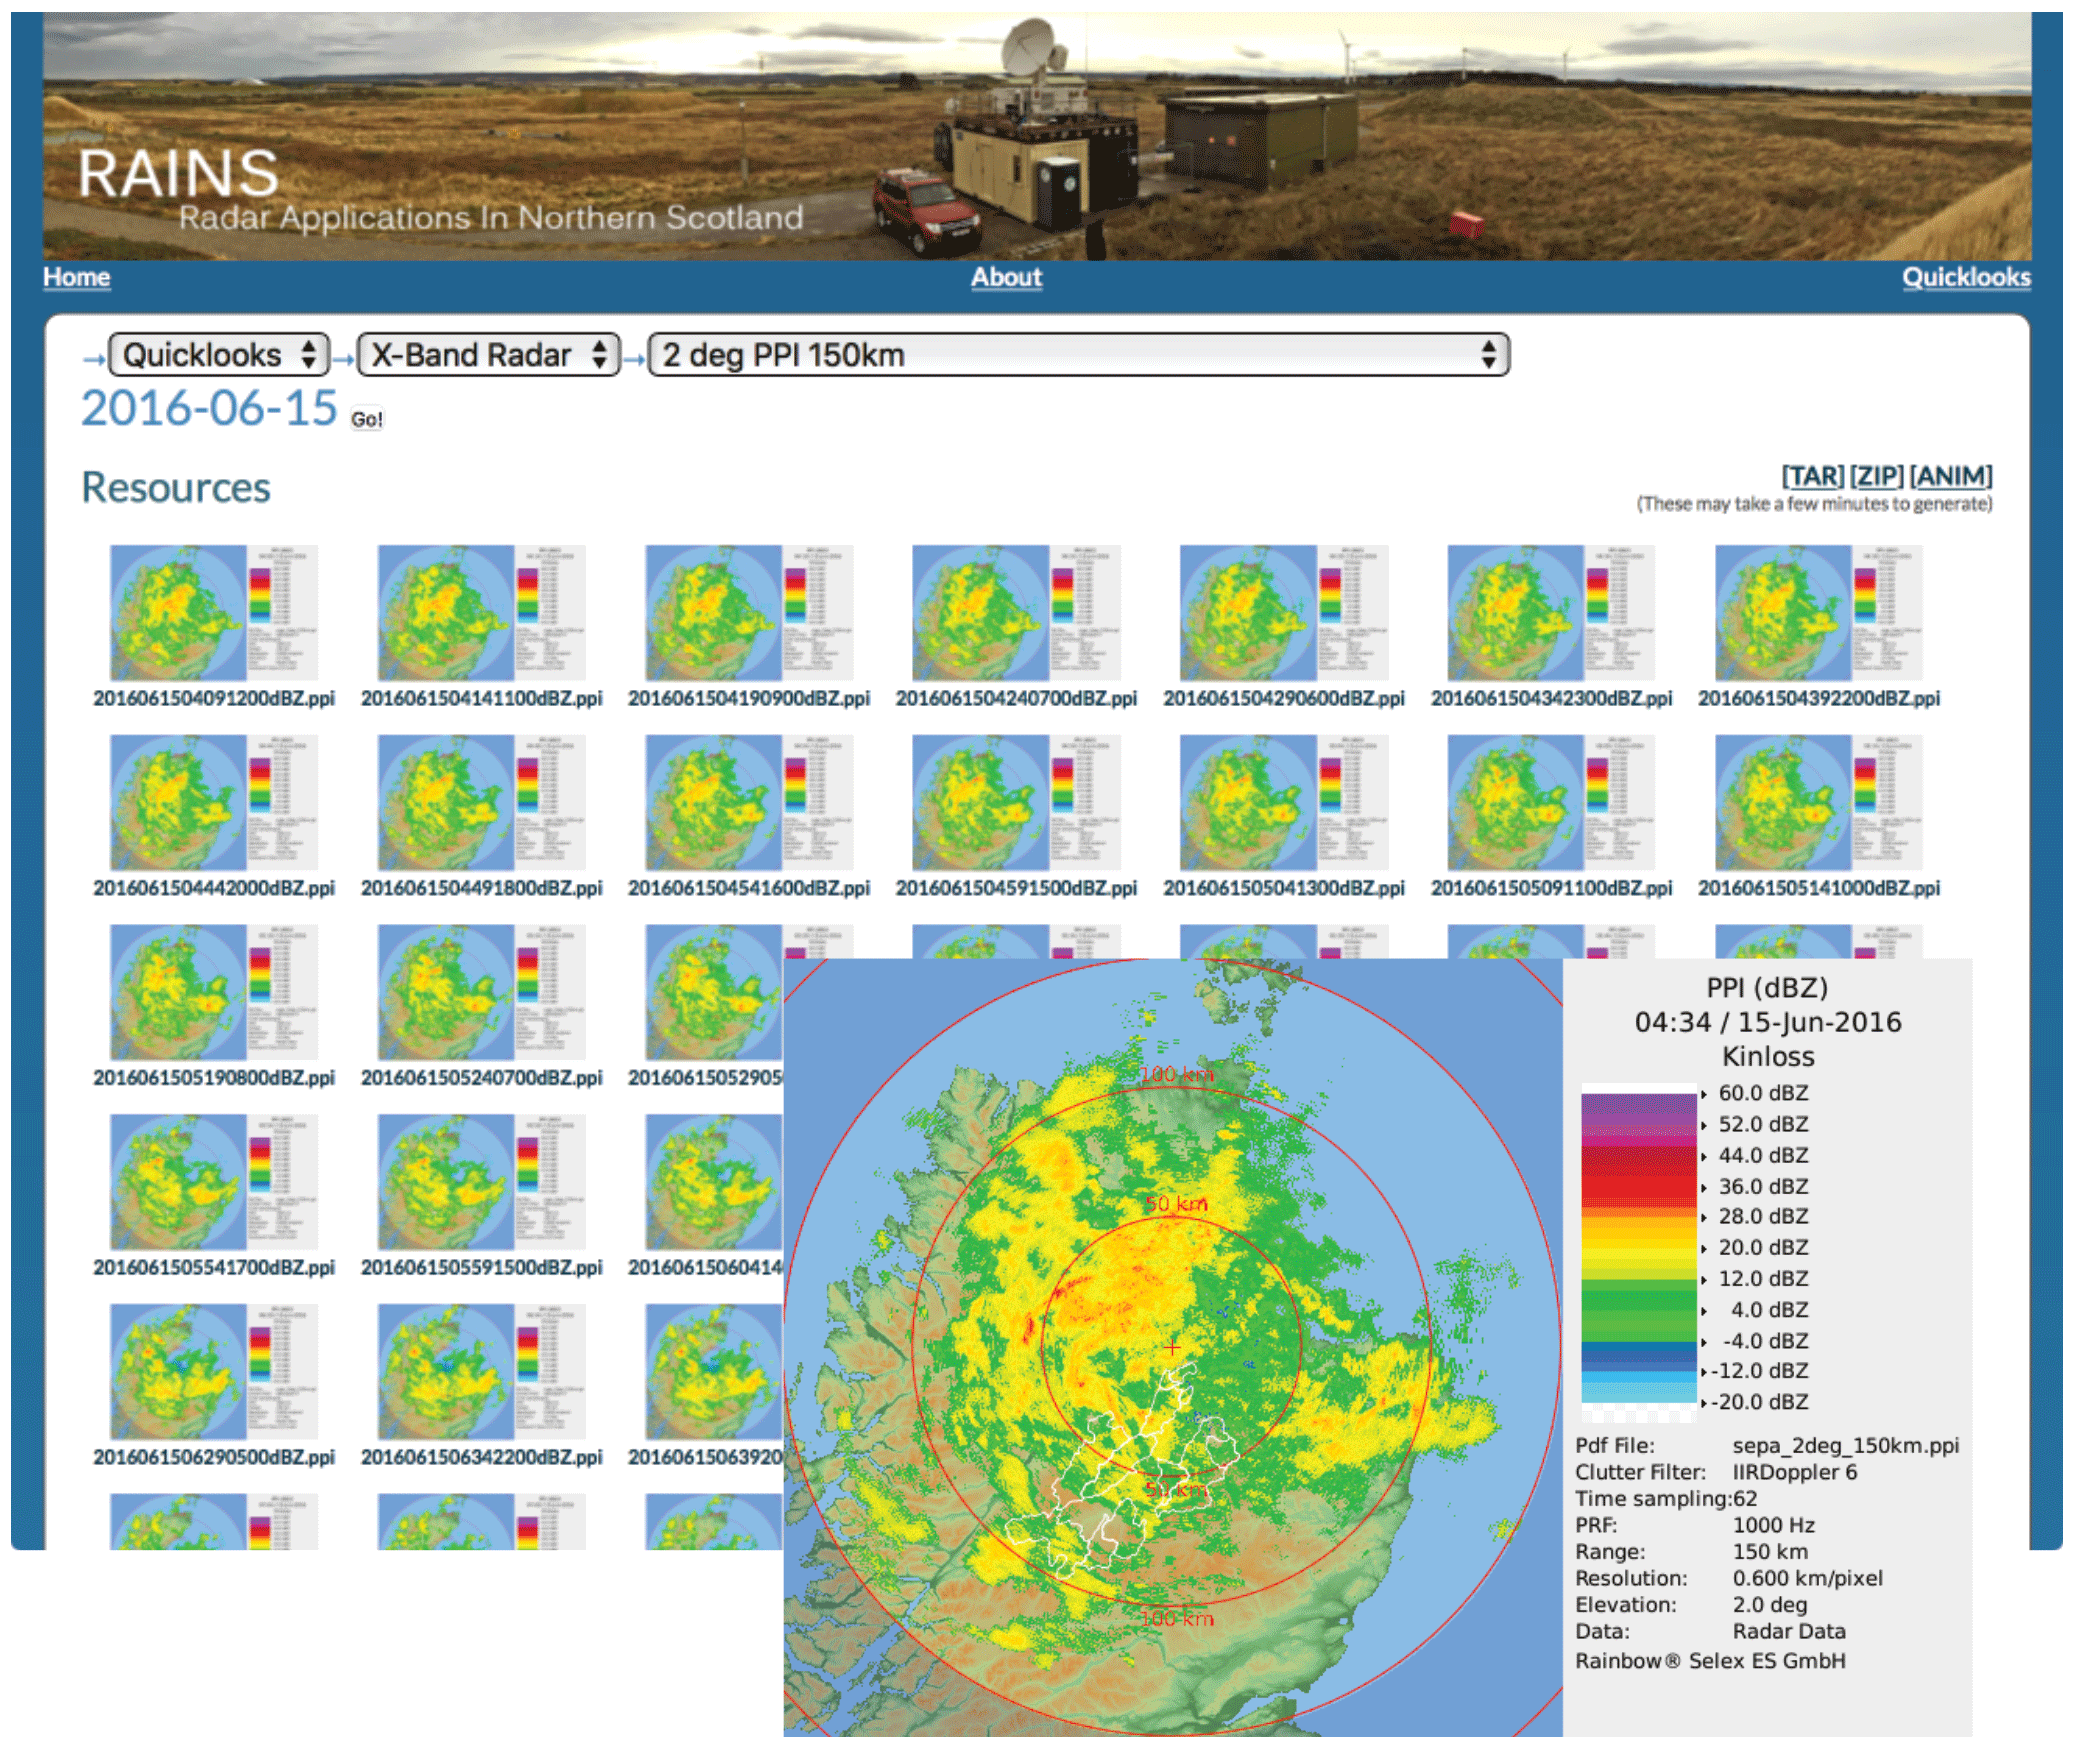
Figure 2Example of the data catalogue used to monitor the NXPol observations in near-real time during the RAINS project described in Sect. 3.3. The background shows a collection of a set of images from a single day, while the foreground highlights an example of a near-real-time image produced by Rainbow® 5.
The dual-polarisation capability of the NXPol allows for the retrieval of many additional geophysically related variables. This additional information helps to provide insight into the size and shape of precipitation and enhanced target identification, as well as the assessment of attenuation and propagation effects (Bringi and Chandrasekar, 2001; Kumjian, 2013a, b, c; Fabry, 2015). The NXPol's polarimetric ability also enables many alternative methods for quantitative precipitation estimation, which are demonstrated in Sect. 3 (Diederich et al., 2015a, b). In addition to the standard polarimetric variables provided by most operational dual-polarisation radars, NXPol also provides the of the degree of polarisation (DOP) of the backscattered signal. The DOP is a relatively unexplored variable with respect to atmospheric phenomena, but previous examinations have shown that it has similar properties as the co-polar correlation coefficient when classifying hydrometeors (Galletti et al., 2007; Galletti and Zrnić, 2012). Galletti and Zrnić (2012) note that the DOP is advantageous compared to the co-polar correlation coefficient for STAR-mode radars like the NXPol because it retains its physical meaning even when observing scatterers that are cross-polarising (i.e. with linear depolarisation ratios that are greater than 0).
During operations, scan strategies are tailored to the application but typically sample a volume out to a range of 150 km every 5 min. The typical volume includes ∼10 plan position indicator (PPI) scans between 0.5 and 30∘ of elevation and a calibration scan at 90∘. All data are recorded as moments in Selex's Rainbow® 5 format (a flavour of XML). This format is easily utilised by common open-source analysis software packages (Heistermann et al., 2015) such as the Lidar Radar Open Software Environment (LROSE) that is provided by the Earth Observing Laboratory within the US National Center for Atmospheric Research (NCAR) (Dixon et al., 2012, 2013), the Python Atmospheric Measurement Radiation (ARM) Climate Research Facility Radar Toolkit (PyART) (Helmus and Collis, 2016) and the Open Source Library for Weather Radar Data Processing (wradlib) (Heistermann et al., 2013). The NXPol has the capability of collecting raw IQ data for post-processing, but this is typically not done due to the size of the dataset.
Once a volume is collected, the raw data are backed up locally and transferred to a central NCAS data storage facility if internet capacity allows as described in Sect. 2.2. In addition to storing the data for later analysis, Rainbow® 5 generates several quick-look images in real time (tailored to the application of the radar). The quick-look images are transferred to a central server, where they are uploaded onto a web catalogue to disseminate the observations in near-real time and enable easy examination of past observations. Figure 2 depicts an example of a real-time image and corresponding catalogue page. Such near-real-time quick-look charts were crucial in the two field campaigns discussed later for changing scan patterns and directing aircraft. The quick-look images were also helpful to the NXPol's operators and forecasters at the Scottish Environmental Protection Agency and the UK's Met Office during the 6-month-long Radar Applications in Northern Scotland (RAINS) campaign in 2016 (Sect. 3.3) for assessing the impact that a radar in this location would have on observational quality in near-real-time conditions in comparison to existing observations.
2.2 Deployment set-up
The operational requirements dictated by the strategic and project-specific scientific goals of the NXPol have led to the development of bespoke infrastructure to support the radar during operations. The primary requirements for deploying the NXPol radar are visibility, security, power and internet access. Considering these options, the NXPol may be deployed using solely its integrated trailer (as in Fig. 1) or in conjunction with a platform structure as depicted in Fig. 3. The platform set-up is based on a similar scheme employed by Selex ES GmbH for the NXPol's deployment during the Single European Sky ATM (Air Traffic Management) Research (SESAR) campaign in 2015 at Braunschweig Airport near Hanover, Germany. The set-up has the major advantage of lifting the radar off the ground to provide greater visibility. It also makes security and public safety issues (see Sect. 2.3) less problematic.
The platform consists of a 20′ (6.058 m) standard shipping container and a 20′ office container set side by side along their long axis. To provide the necessary structural strength to support the weight of the NXPol, on top of each of the containers is a 20′ platform container (also known as a “flat rack”). Using standard shipping containers and platforms dramatically reduces engineering time and cost during deployments. Also, because of their global ubiquity, the elements needed to construct a similar platform can be sourced locally. This further reduces deployment costs. To provide safe access to the radar while it is on the platform, a staircase and railing are constructed from standard scaffolding materials as shown in Fig. 3. Also attached to the platform structure are the various pieces of hardware that support a long-term autonomous deployment of the NXPol, lightning protection, a satellite internet connection, security cameras and a local weather station.
In addition to providing a platform for the NXPol, the office unit provides space for the additional IT infrastructure needed for NXPol's autonomous operation (described below). The office also provides a base of operations for staff while on-site during remote fieldwork. The office is particularly useful during observational campaigns that involve the coordinated operation of the radar and an aircraft (such as the ICE-D campaign described in Sect. 3.2). During such campaigns, staff can monitor and direct the radar's observations in real time and communicate with the aircraft to help target the observations.
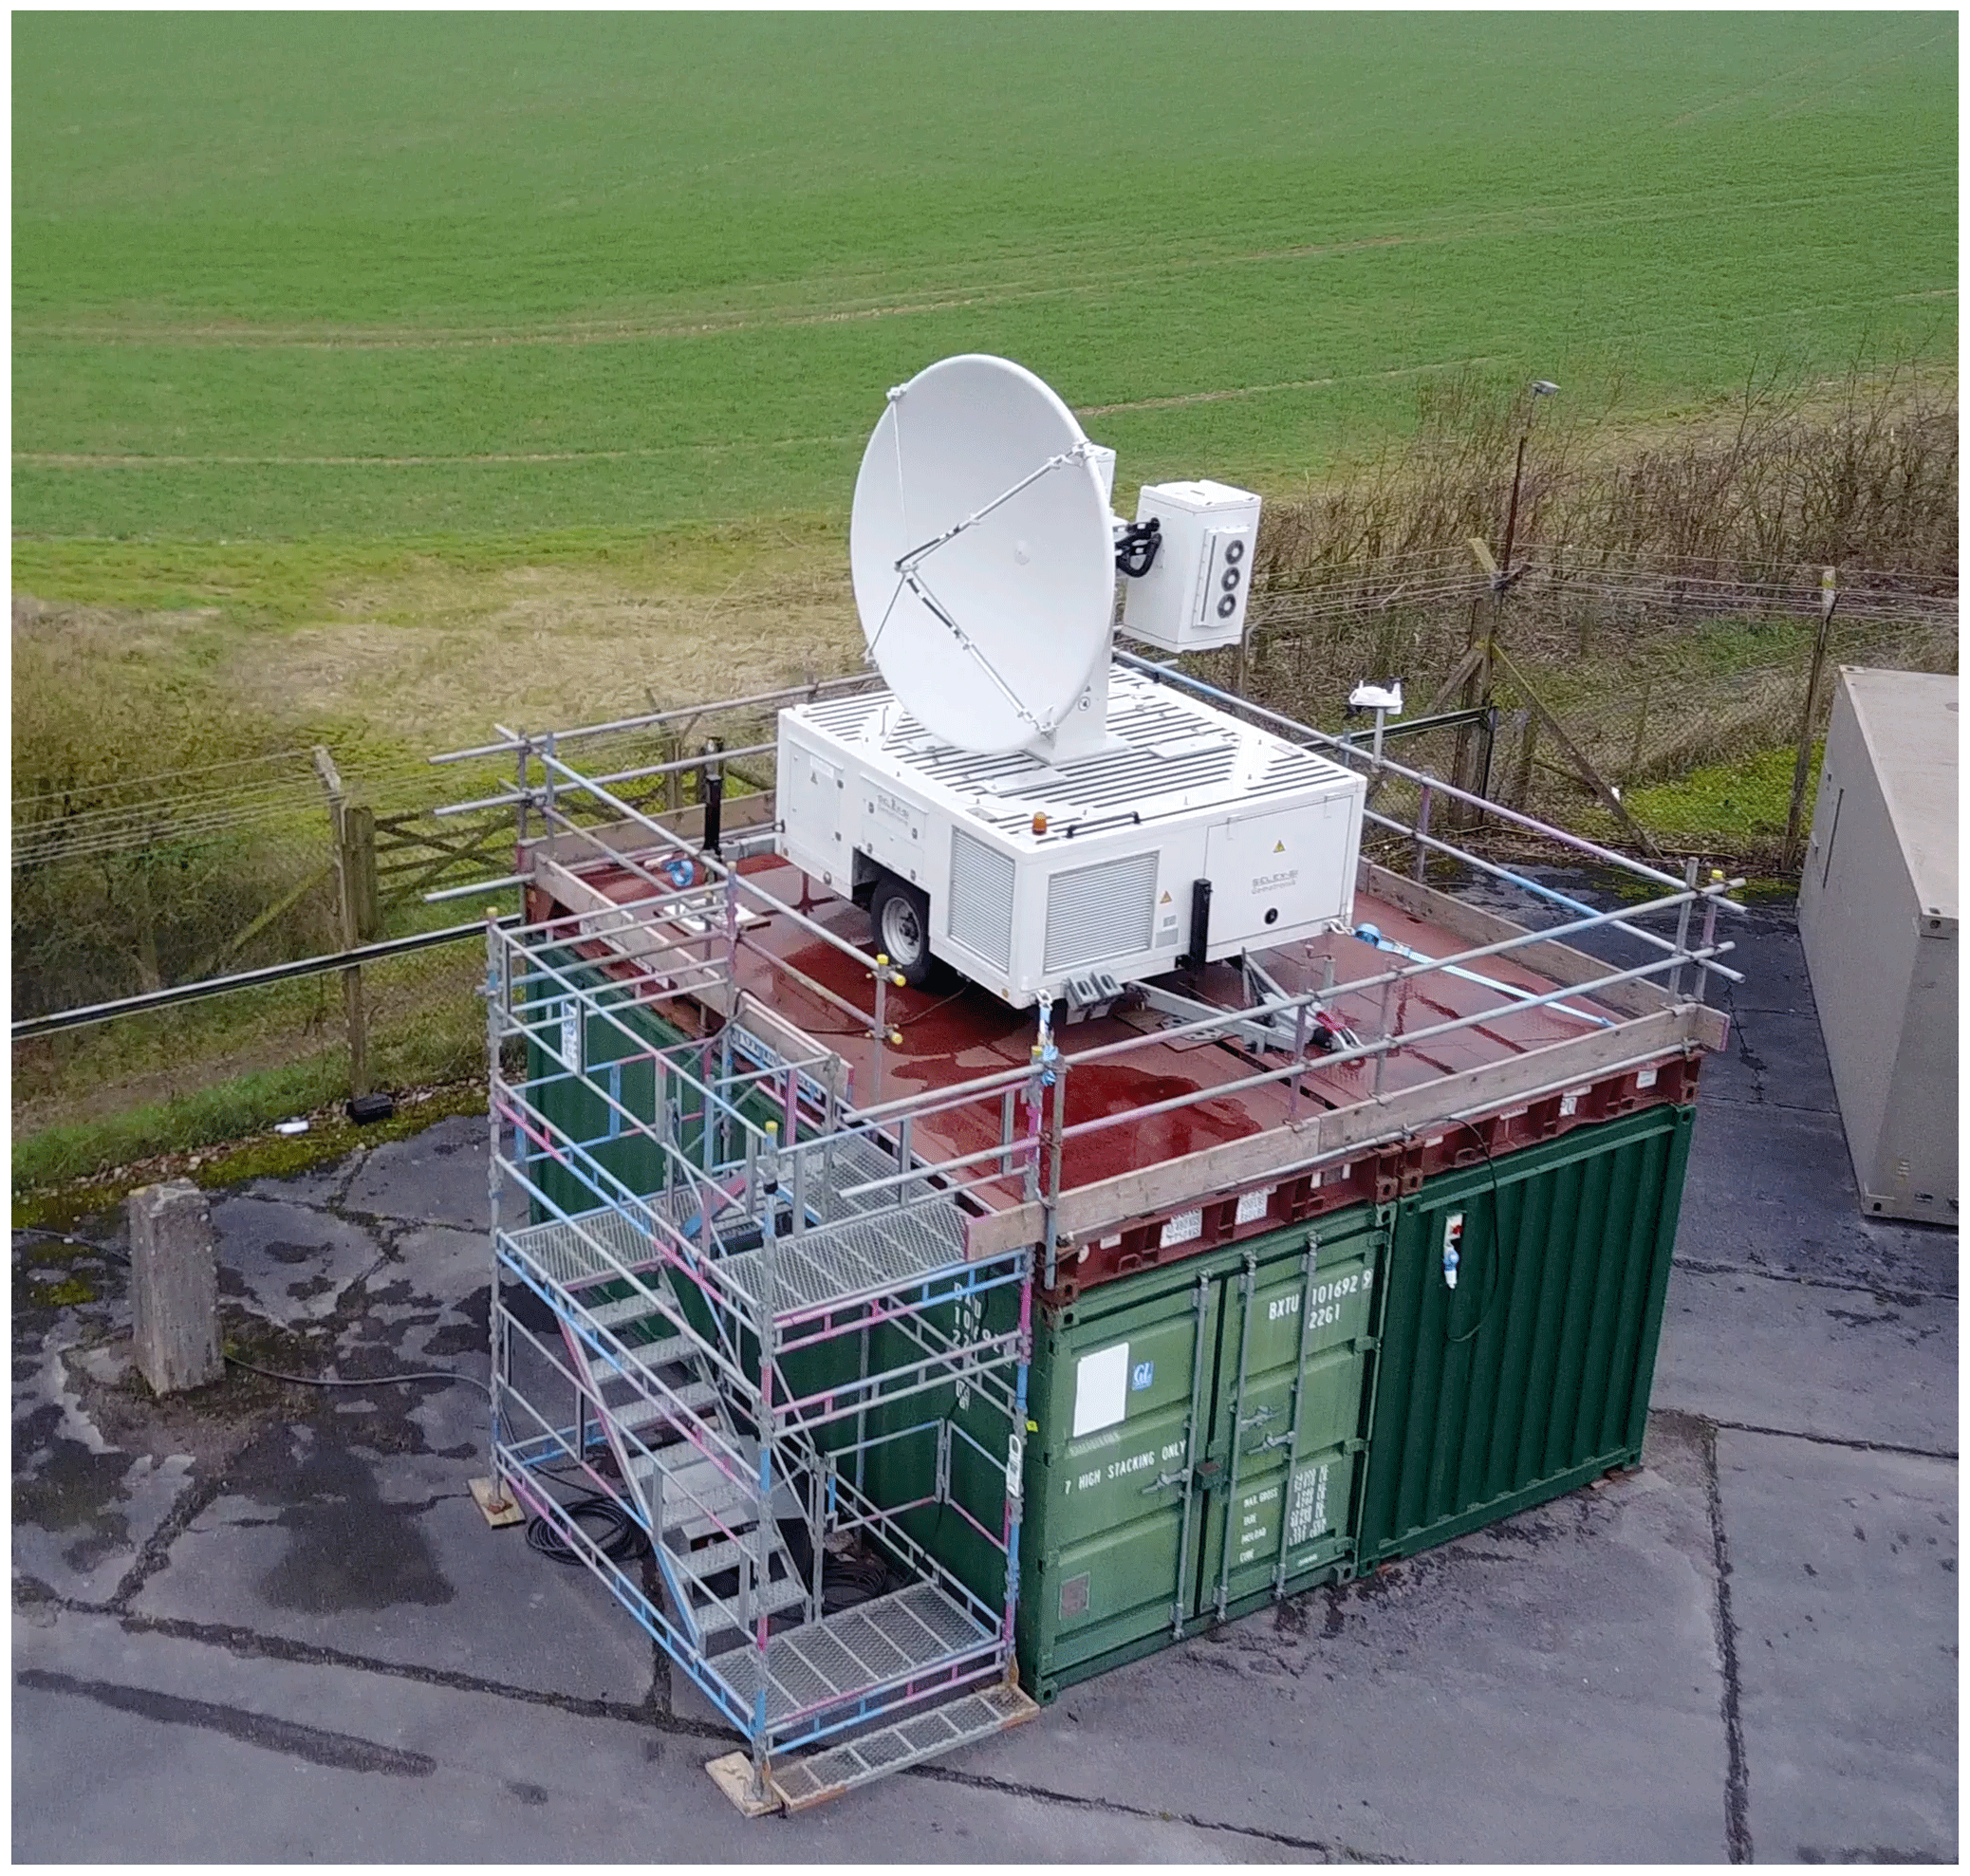
Figure 3NXPol deployed at Chilbolton Observatory, Hampshire, UK. Seen in the picture is the 20′ (6.058 m) shipping container, 20′ office container, two 20′ platform containers and scaffolding used to construct a platform for the radar.
There is also the need in the scientific community for the collection of statistically meaningful observations over a wide range of synoptic conditions. This requirement has necessitated the move to semi-permanent, continuous and autonomous operations that last for many months. The RAINS project and ongoing work at NFARR (where the NXPol will operate for several months at a time between campaign deployments) in particular demonstrate the need for this type of facility to support the radar in its long-term operations.
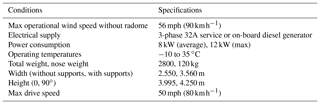
Table 3 summarises the operational requirements of the NXPol. Data and power availability vary depending on the deployment. Typically, when the NXPol is deployed for less than 24 h, the on-board generator supplied by an 80 L fuel tank provides all electricity. An on-board 3G mobile data connection or a satellite link provides internet connectivity. When the NXPol is deployed using the container platform, mains electricity is connected to the radar's electrical grid and the on-board generator acts as a backup power supply that is automatically started upon loss of mains power. Additionally, the 3G mobile data connection is supplemented with a local area network connection or a satellite internet connection. This allows for more robust autonomous and remote operation of the system.
Table 3Operational conditions and logistical requirements of the NXPol.
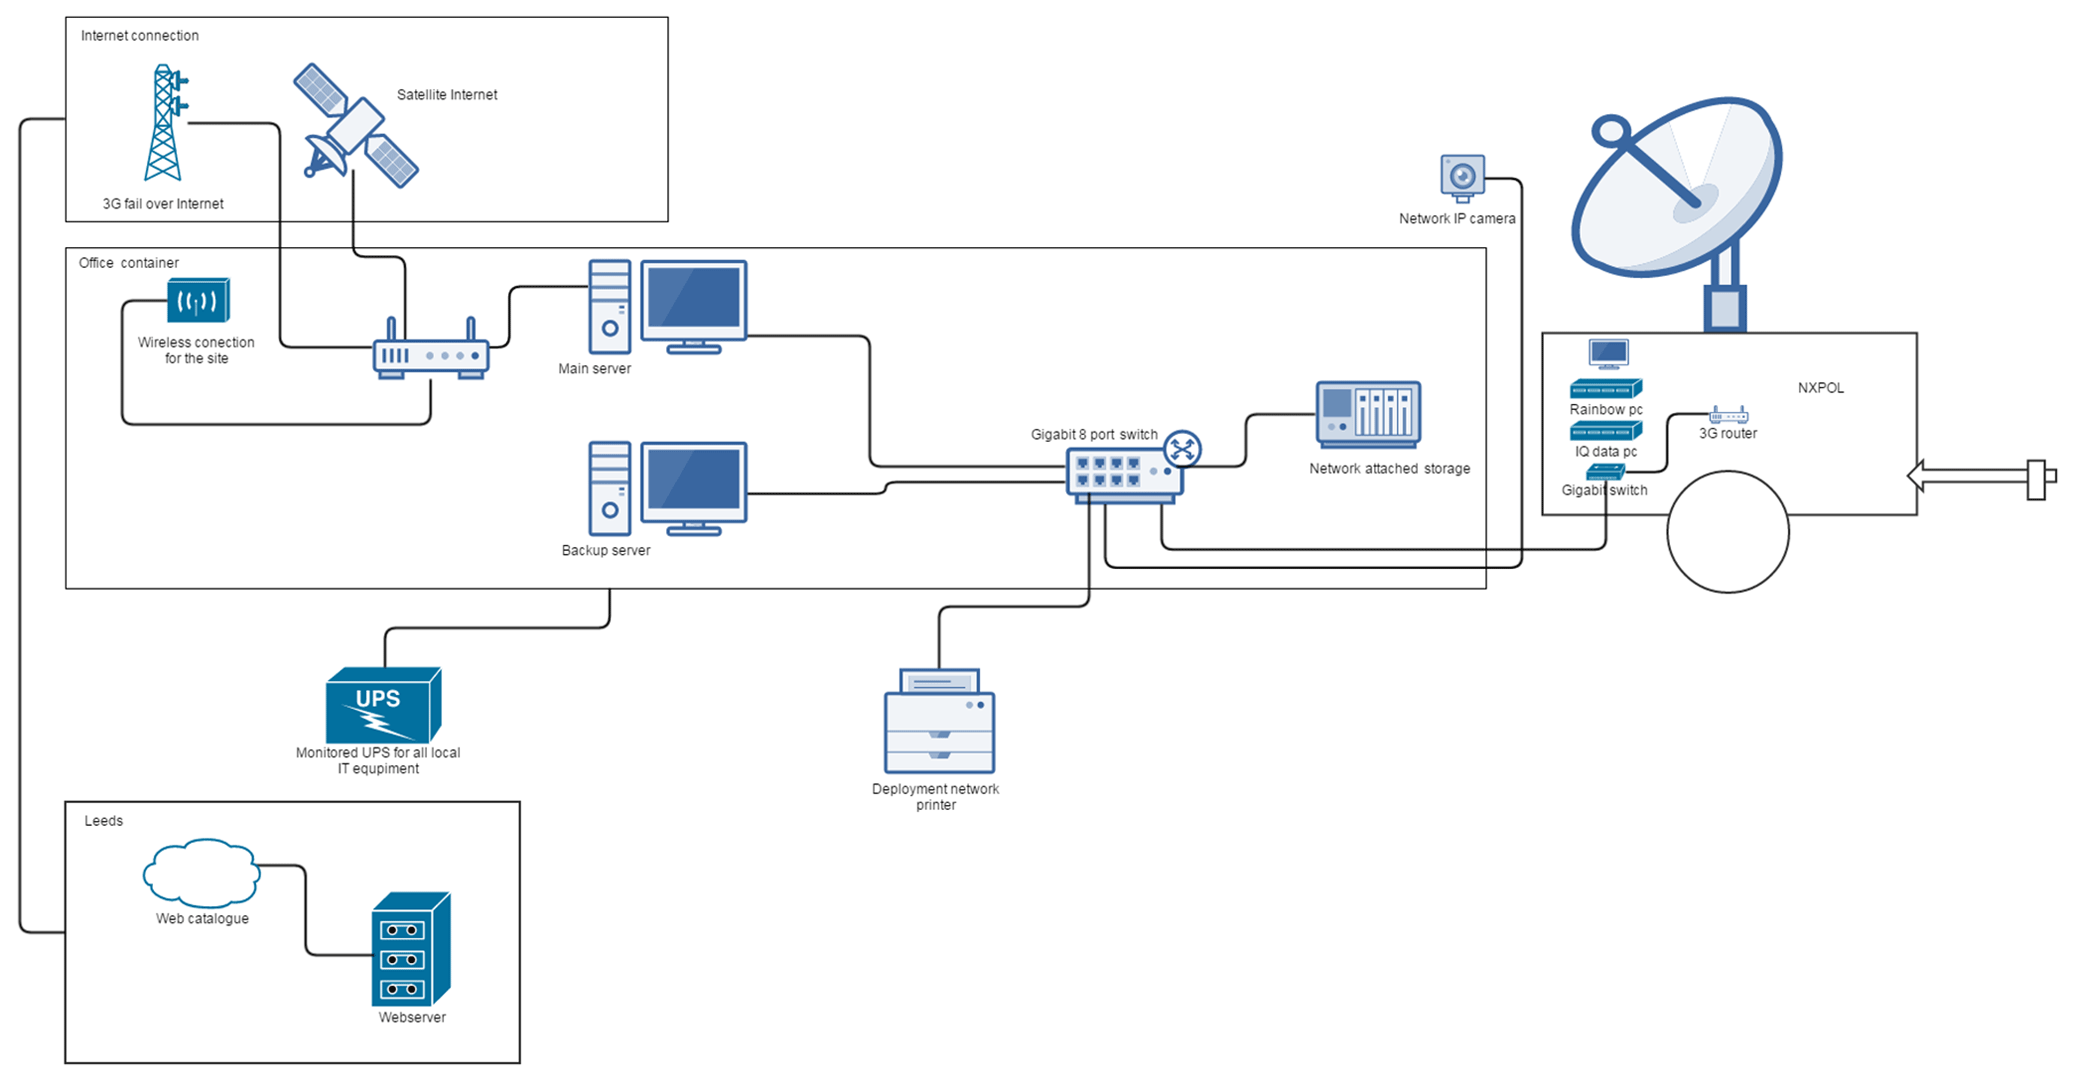
The IT infrastructure needed for the NXPol's autonomous operation includes a server that provides a gateway for communicating with the radar and data backup. Figure 4 summarises the IT strategy. In addition to communications, the infrastructure includes a local weather station to primarily monitor wind speeds, a video camera to monitor the radar's movement and an Uninterruptible Power Supply (UPS) for the server. Data production is on the order of between 5 and 9 Gb per day. During long-term remote operations the data can be backed up using a commercial satellite internet system if available, although it may be cost-prohibitive if there is not an unmetered period (typically in the early hours of the morning local time). The on-board 3G connection provides redundancy and/or remote control, if local signal strength permits, but it is not practical to back up bulk data via this route. If near-real-time remote raw data access is required, a suitable Internet connection is necessary. Quick-look charts as shown in Fig. 2 use considerably less data and are therefore logistically simpler, potentially allowing selective download of raw data over a lower bandwidth connection. Data are backed up locally to a network-attached storage (NAS) system in the office container in medium- to long-term deployments.

Figure 5Example of observations made by NXPol (located at the centre black dot) at 0.5∘ elevation on 3 August 2013 at 13:32 UTC showing (a) calibrated but unfiltered and uncorrected horizontal reflectivity (shown as to display the importance and impact of the data processing), (b) calibrated, filtered and corrected differential reflectivity, (c) specific horizontal attenuation (AH) and (d) rainfall rates derived using the Marshall–Palmer relation (R(Z)=aZb, with a=200 and b=1.6). The missing spokes of data in AH are caused by quality control settings in the processing routine that reject radials that do not meet certain thresholds. The sub-panel in (d) shows an expanded section of the line of intense rainfall (>120 mm h−1 in some pixels; please note the expanded colour bar to the top of the sub-panel) to the south-east of the radar. Range rings are drawn every 10 km.
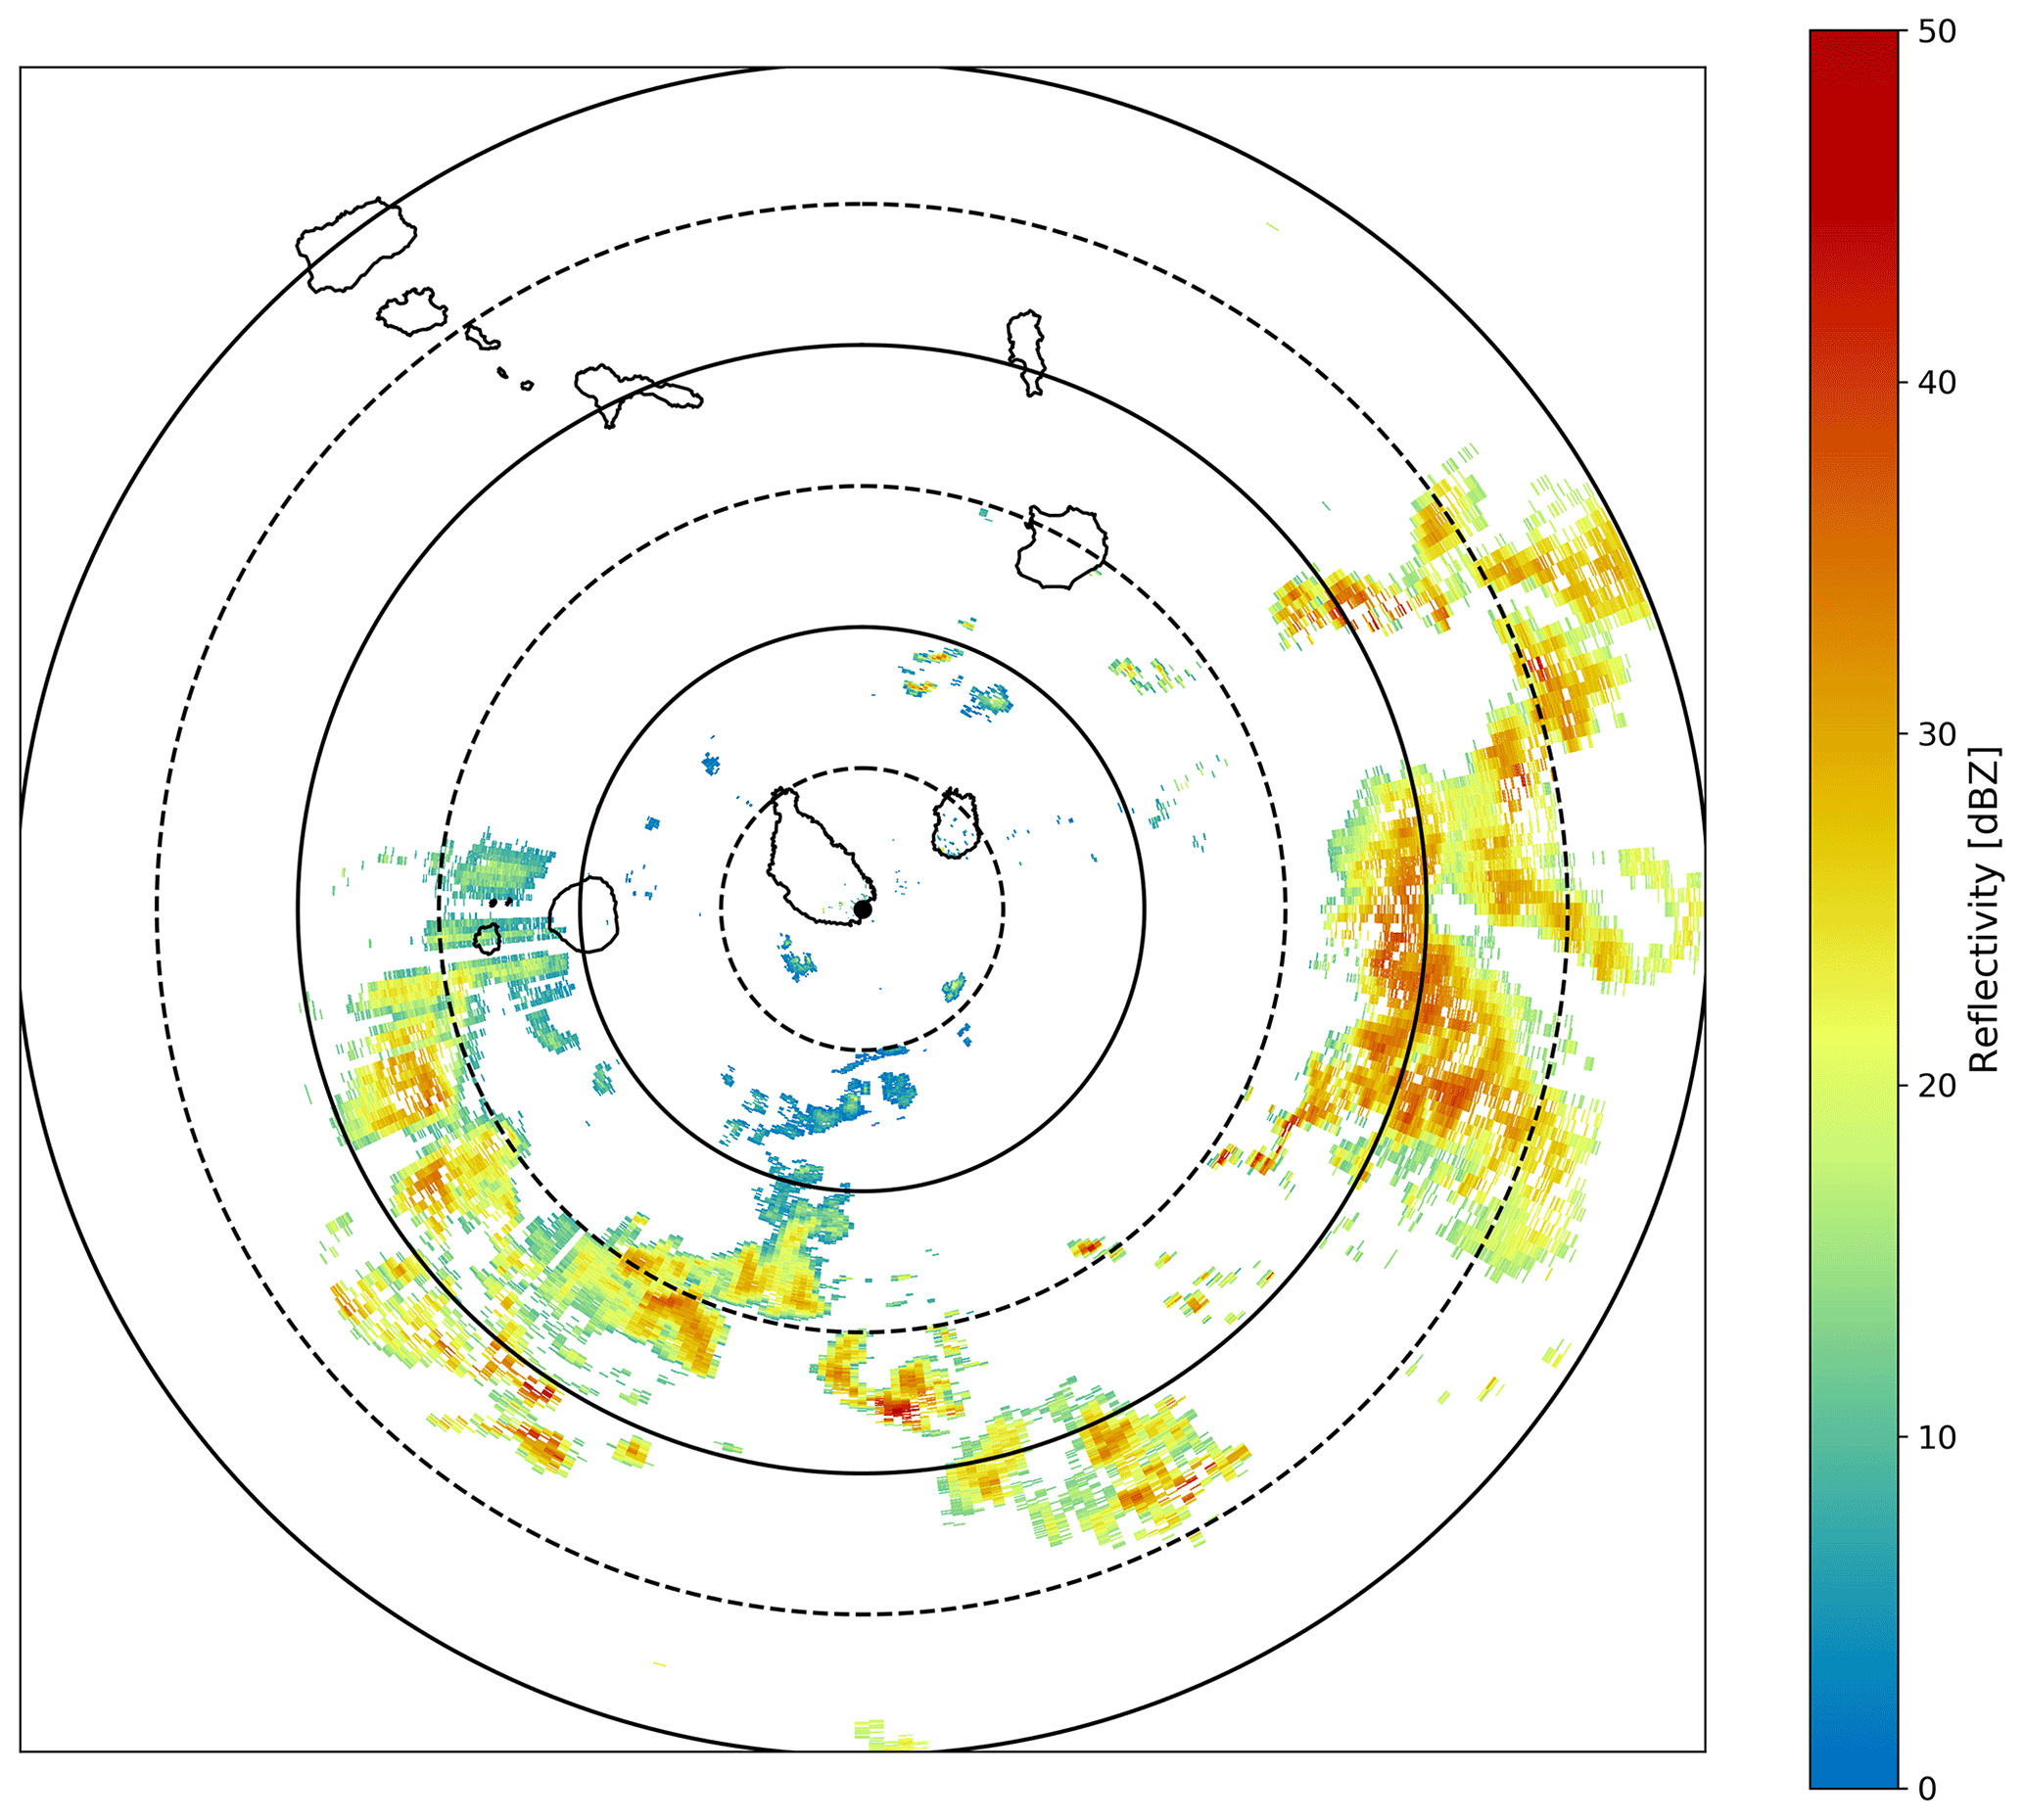
Figure 6Example of a surveillance-mode PPI observed by NXPol at 20:19 UTC on 23 August 2015 while on the ICE-D deployment in Praia, Cabo Verde. Range rings are drawn every 50 km. The range ring drawn furthest from NXPol is at 300 km. The thick black outlines are the islands of Cabo Verde.
2.3 Safety
An important consideration when deploying the NXPol radar is the protection of both operators and the public from exposure to transmissions. The location of the deployment site is determined in conjunction with the required safety distance specified by a radiation exposure assessment. The International Commission on Non-Ionizing Radiation Protection (INCIRP) specifies that the maximum continuous exposure to radiation at frequencies between 2 and 300 GHz should not exceed 10 W m−2 in areas where the general population has access and 50 W m−2 for occupational exposure, averaged over a period of 6 min (Ahlbom et al., 1998). When deployed on the ground, a safety barrier must be constructed or measures put in place to prevent access within the distance which the exposure threshold would be exceeded as determined by the radiation assessment (e.g. if the radar dish stops scanning). When NXPol is situated on a platform and is scanning and operating as scheduled, there is no risk to people (including those with implanted medical devices) on the ground 15 m from the radar and, hence, this is another benefit of this method of deployment. If the radar is unmanned on the platform, then access must be restricted to the distance at which public exposure limits (10 W m−2) are reached in the event the NXPol malfunctions and stops scanning but continues to transmit.
The second major safety consideration is the operation of the system in high winds. Without a radome the maximum operational wind speed is 25 m s−1 (56 mph). The weather station continuously monitors the wind speed and notifies operators via text and email alerts when a set threshold (typically below the 25 m s−1 (56 mph) maximum limit to allow for gusts) is exceeded. Operators closely monitor the conditions during forecasted events and, in the case of significant winds, interrupt the scan schedule to move the antenna into the vertical position (which provides the least wind resistance) and activate the locking stow pin to prevent movement. In addition to winds, NXPol's temperature must be monitored carefully to avoid operations below −10 and above 35 ∘C as there is no radome to provide a conditioned environment for the transmitter and receiver equipment boxes located behind the antenna. This operational range also limits the regions where the NXPol may be deployed.
Below, four examples of the use of NXPol are given. Descriptions are provided to highlight the utilisation of the radar to achieve the scientific aims of each project.
3.1 COPE
NXPol was utilised for the first time in the COnvective Precipitation Experiment (COPE) held in the vicinity of Davidstow, Cornwall, during July and August 2013. Three aircraft, including the Facility for Airborne Atmospheric Measurement (FAAM) BAe-146 aircraft, and other ground-based instruments were also deployed; see Leon at al. (2016). The principal aim of the project was to understand the physical processes involved in the production of heavy convective precipitation that could result in flash flooding. Ultimately, predictions of heavy precipitation and potential flash floods by numerical weather prediction (NWP) models will be improved as a result of the new knowledge and understanding of physical processes. Several flash flooding events have previously occurred in the region, the most notable in recent years being the Boscastle flood of 2004 (Golding et al., 2005). The role of the radar was to determine (a) the altitude of the first echoes, (b) the rate of development of the reflectivity echoes, (c) the spatial and temporal distribution of the main echoes, (d) the particle types from dual-polarisation parameters (e.g. warm rain or graupel) and (e) the maximum intensity of the precipitation.
NXPol collected data during 16 IOPs covering a variety of synoptic and microphysical conditions including heavy precipitation from shallow clouds (warm rain only) and several cases of deep convection along semi-organised convective lines with similarities to the Boscastle event. An example of the convective clouds that formed along a convergence line (at 20 km range between S and SE) and observed elsewhere on 3 August 2013 is shown in Fig. 5. Note that Fig. 5 and all following figures were created using software developed in NCAS that is based on the PyART software suite (Helmus and Colis, 2016). The rainfall rates (Fig. 5d) were derived from the unfiltered and uncorrected calibrated horizontal reflectivity (ZH; Fig. 5a) by first applying a second trip filter and a fuzzy logic clutter filter as described by Dufton and Collier (2015). In addition to these corrections, a correction for partial beam blocking and attenuation (AH) has also been applied. From this corrected ZH, rainfall rate was retrieved using the Marshall–Palmer relation (R(Z)=aZb, with a=200 and b=1.6 as is used by the UK Met Office) to derive rain rate for their operational network of C-band radars (Marshall and Palmer, 1948). For access to the observations made with the NXPol during COPE, please see the Centre for Environmental Data Analysis (CEDA) archive for the campaign at http://data.ceda.ac.uk/badc/microscope/data/ncas-mobile-xband-radar/version-2/, last access: 15 July 2018 (Blyth et al., 2015).
3.2 ICE-D
NXPol was deployed at Praia, Cabo Verde (14∘55′ N 23∘31′ W), during July and August 2015 in the UK's Ice in Clouds Experiment-Dust (ICE-D). The goal of ICE-D was to determine how desert dust affects primary nucleation of ice particles in convective and layer clouds and the subsequent development of precipitation and glaciation of the clouds. In addition to NXPol, the FAAM BAe-146 research aircraft and the University of Manchester ground-based aerosol laboratory were deployed. All data from this campaign may be found on CEDA at http://catalogue.ceda.ac.uk/uuid/55b5d76a7edb42e39933c1edc37f7b90, last access: 15 July 2018.
The main objective of NXPol was to provide the spatial and temporal distribution of the clouds, to identify suitable cloud regions for the aircraft to sample and to provide coordinated observations of the development of precipitation within about 100 km of the island. Two modes of data collection were implemented dependent on the synoptic conditions and location of cloud development. In “surveillance mode”, NXPol was configured to maximise its observable range. In this mode, observations were made out to 300 km at several low elevations. An example surveillance-mode PPI observed on 23 August 2015 is given in Fig. 6. Use of the radar in this mode was found to be invaluable for near-term mission planning and directing the use of the FAAM once it was airborne. For suitable clouds at closer range, NXPol operated in “data-collection mode”, providing higher spatial and temporal resolution observations; volumes of 12 elevations from 0.5 up to 12∘ were collected out to a range of 150 km similar to COPE.
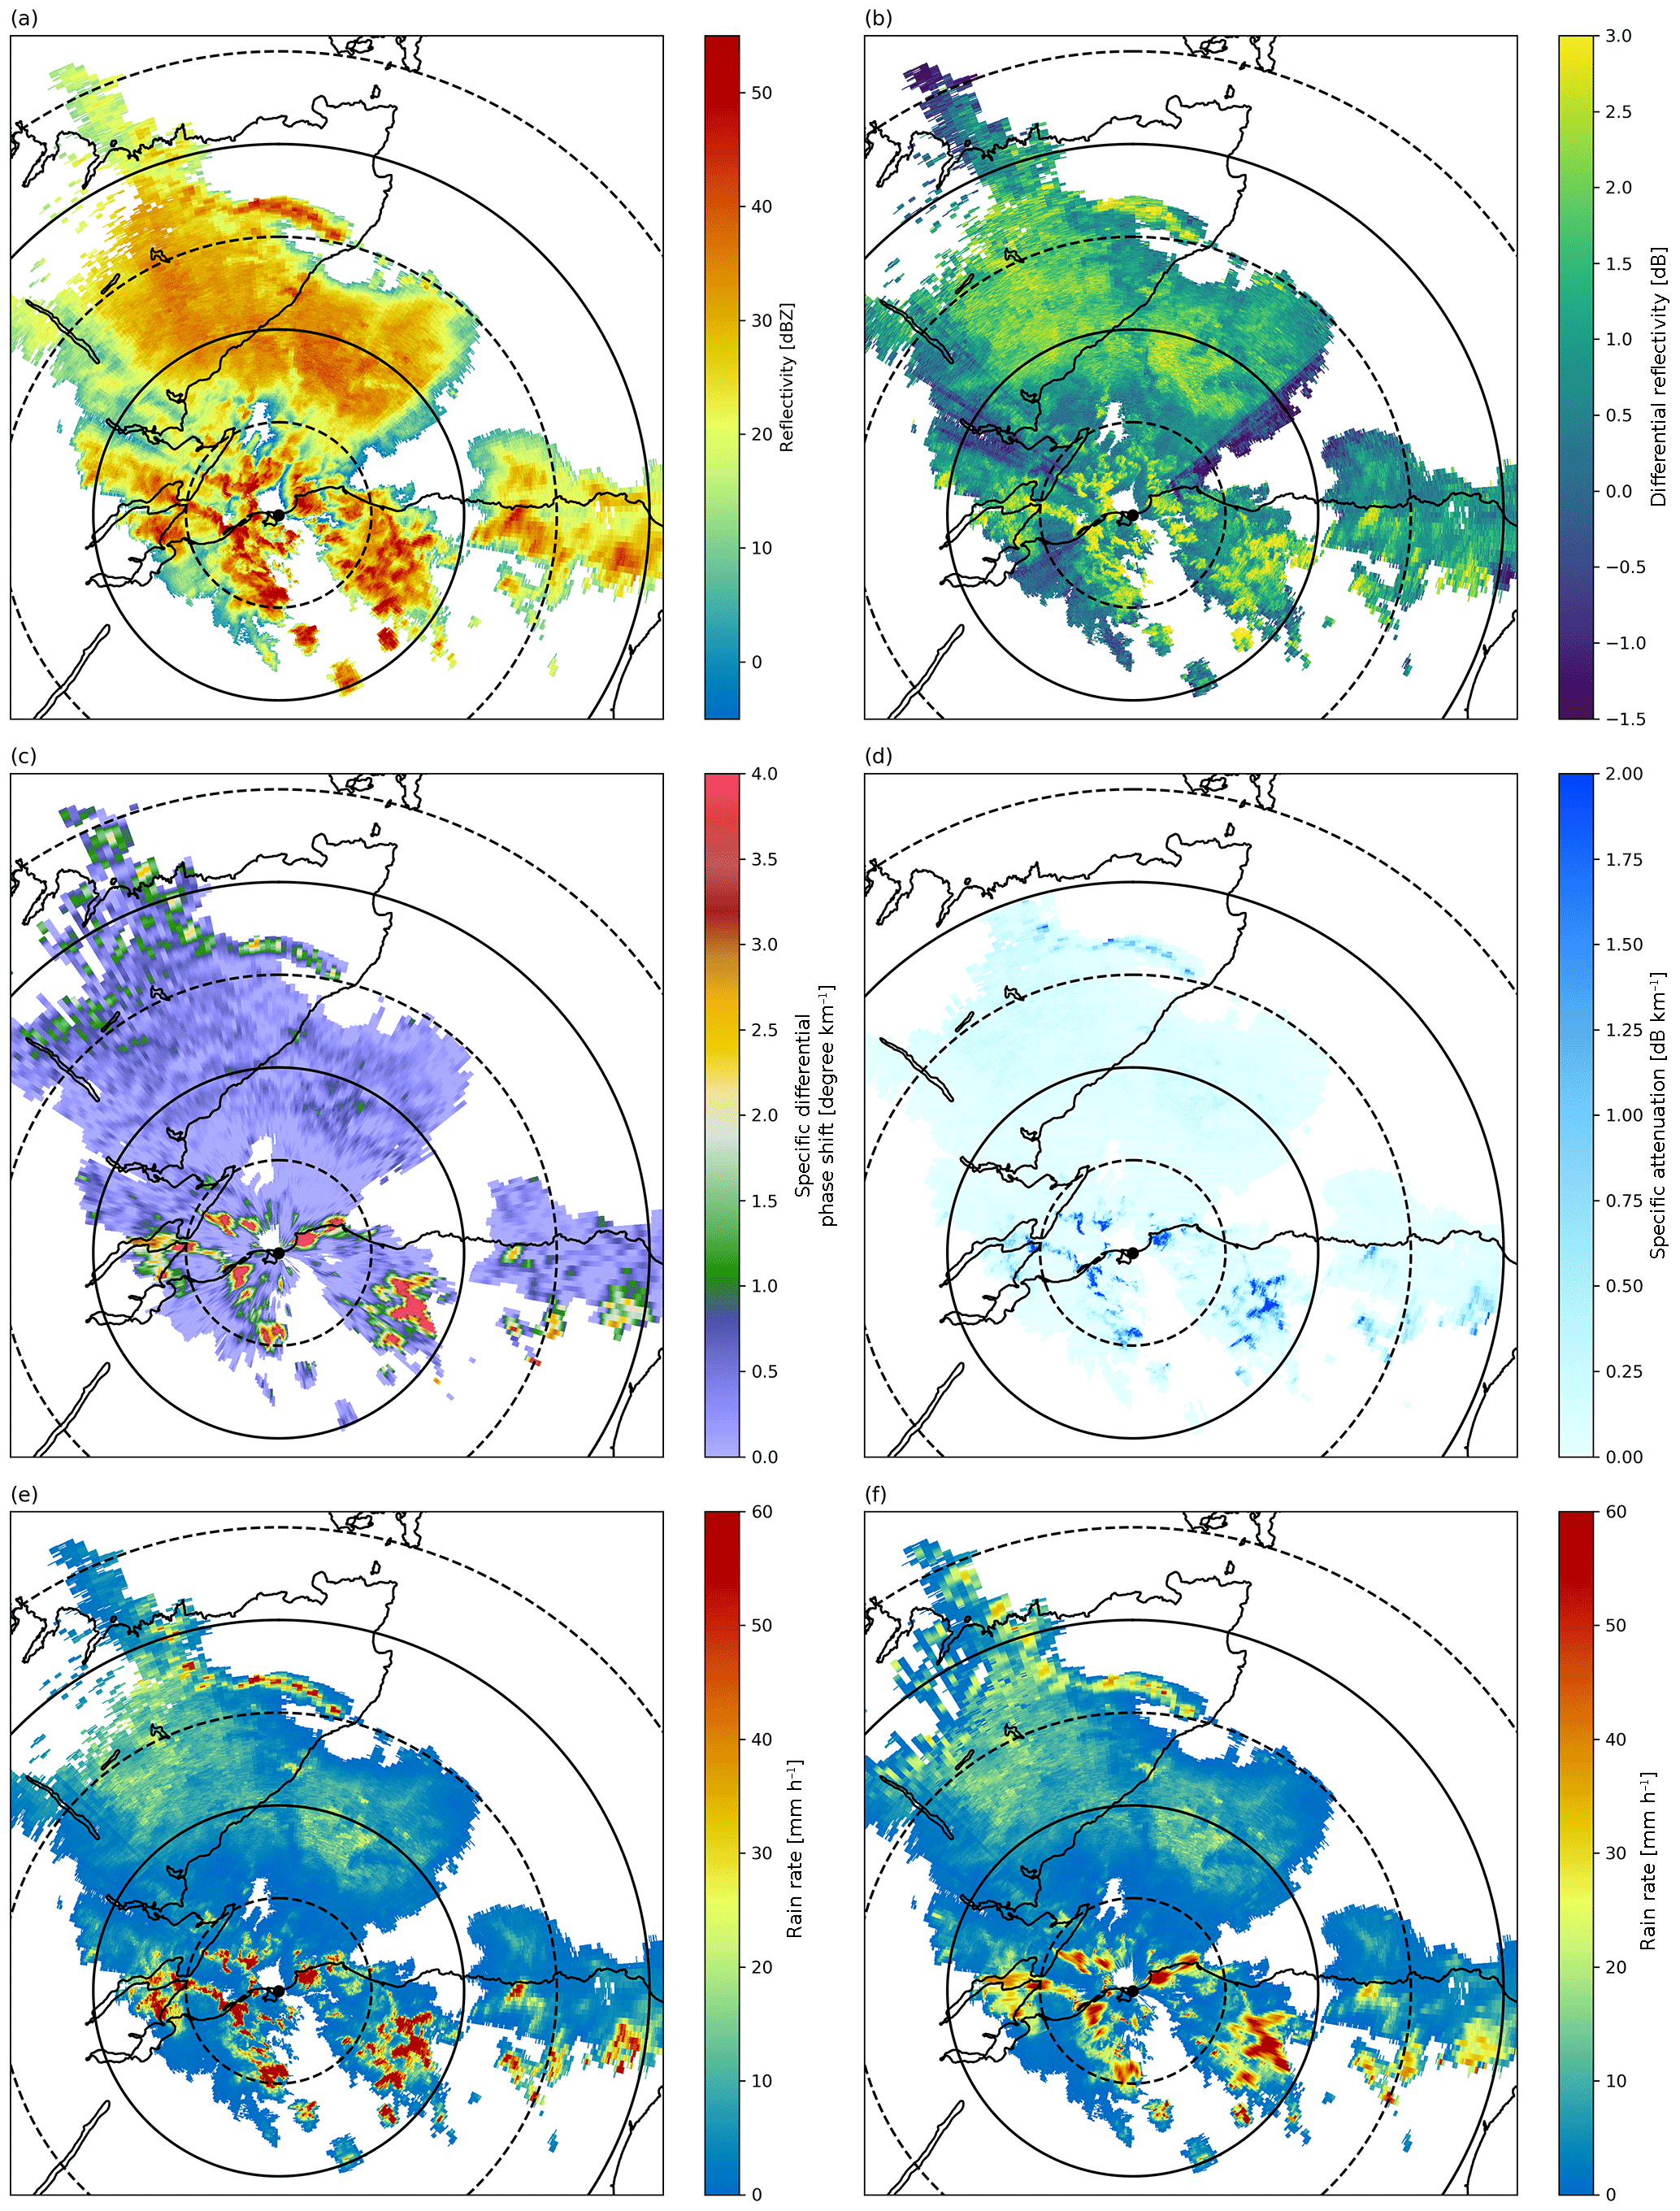
Figure 7Observations and derived rainfall rates from the RAINS campaign on 20 July 2016 at 04:09 UTC at 1.5∘ elevation: NXPol is located at the black dot and range rings are drawn every 25 km. (a) Calibrated, corrected and filtered ZH classified as precipitation echoes; (b), (c) and (d) calibrated, corrected and filtered ZDR, KDP, and AH, (e) rainfall rate calculated using the Marshall–Palmer relation (R(Z)=aZb, with a=200 and b=1.6) and (f) rainfall rates calculated using R(ZH,KDP).

Figure 8Coincident RHIs of ZH (a, b) and ZDR (c, d) from the NXPol (a, c) and CAMRa (b, d) on 12 January 2017 at 13:36 UTC.
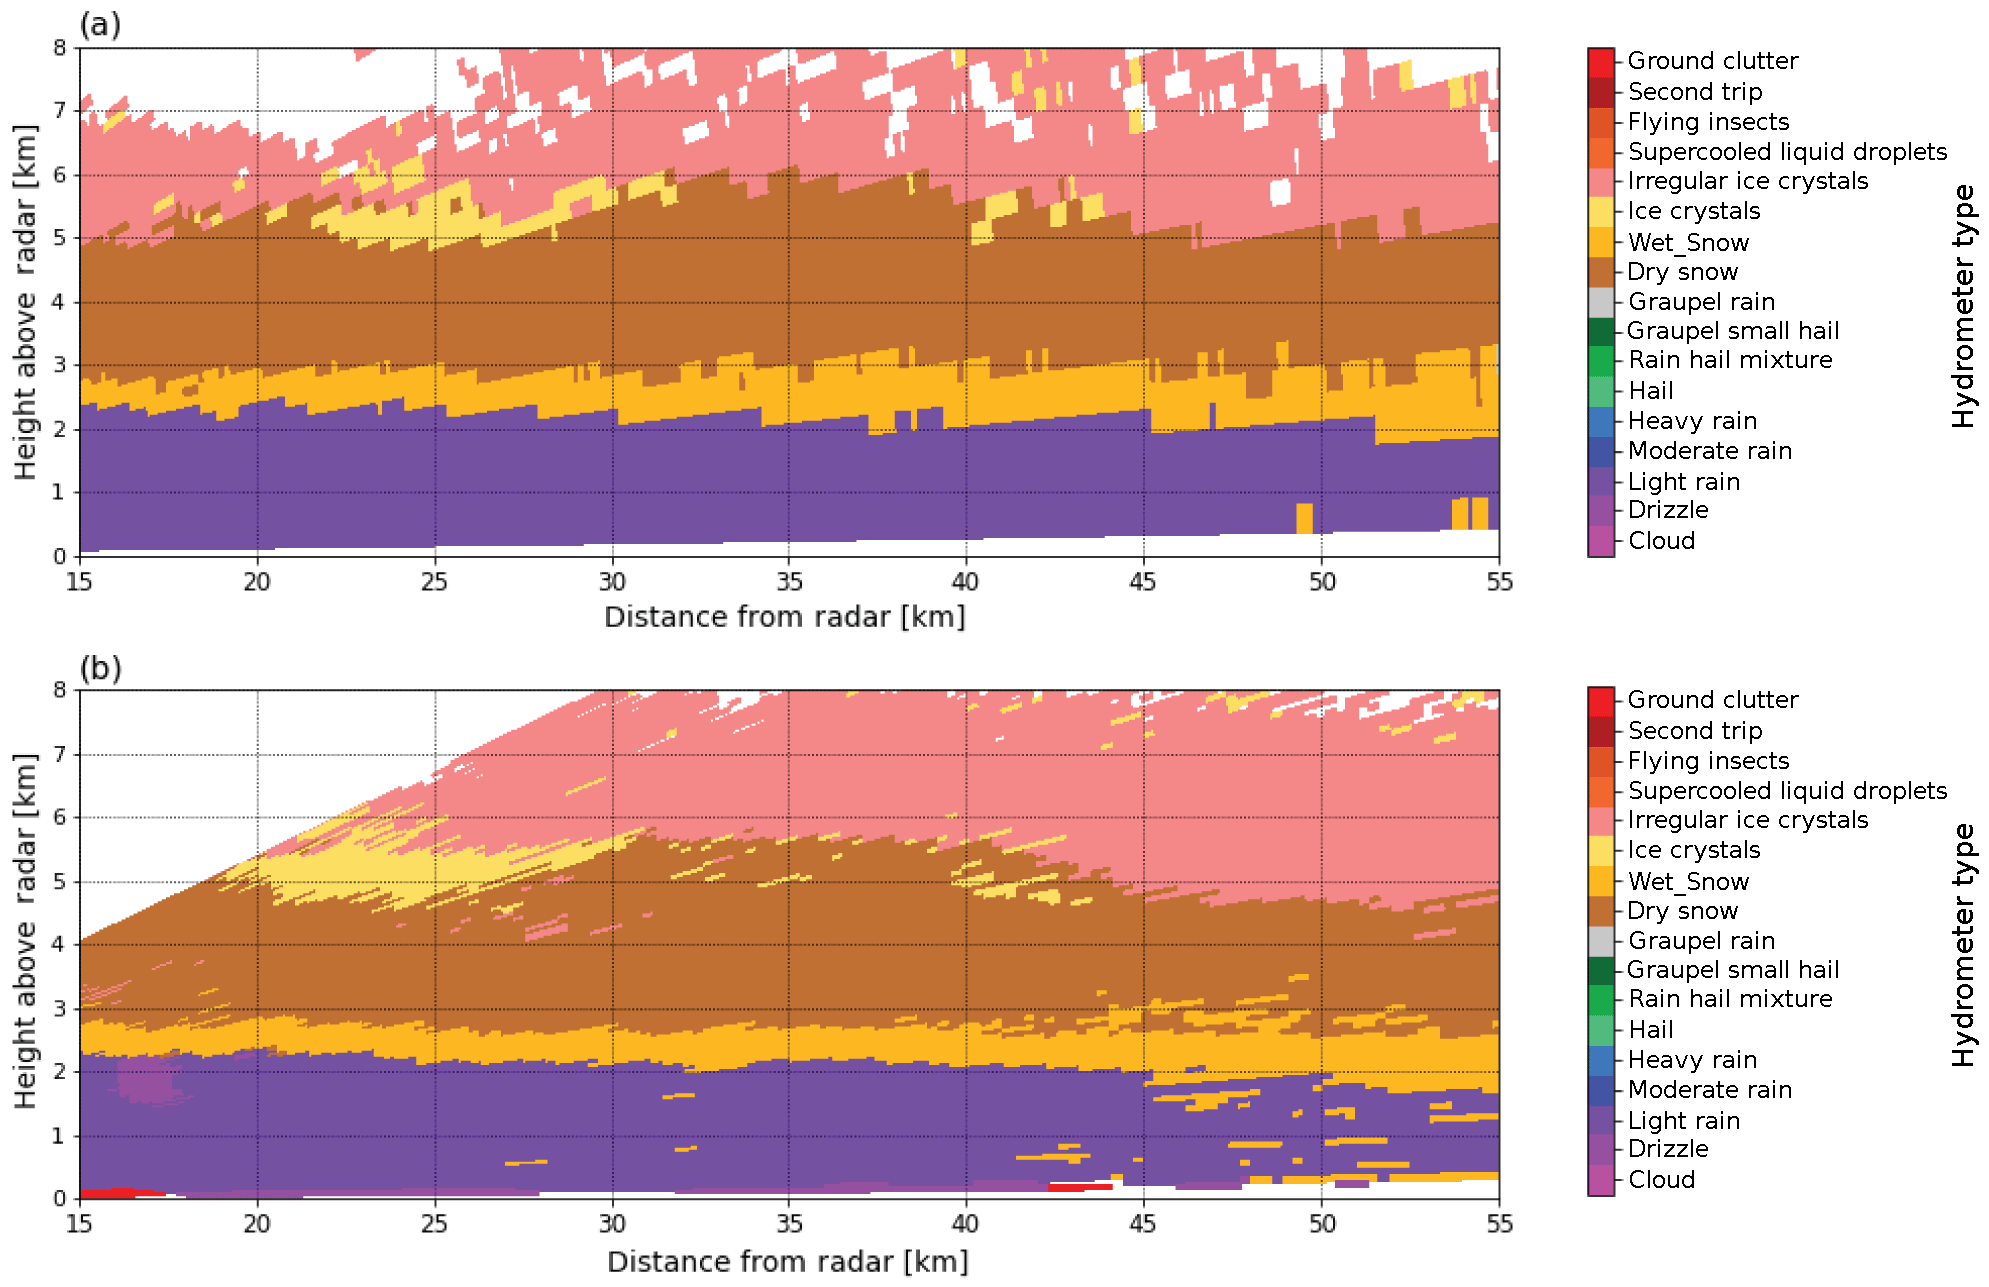
Figure 9Coincident RHIs from the NXPol (a) and CAMRa (b) on 17 May 2017 at 12:24 UTC with the HCA applied to both.
3.3 Radar Applications In Northern Scotland (RAINS)
COPE and ICE-D are examples of the use of the NXPol for traditional IOP-based operations. This section highlights the use of the NXPol for semi-permanent operations. Previous studies have shown the value of operating a mobile polarimetric X-band radar in coastal regions to fill gaps in the coverage of national operational radar networks (Matrosov et al., 2005). Matrosov et al. (2005) found that the NOAA X-band radar (9.34 Hz, 30 kW peak power) was effective in covering an area up to 40–50 km in radius offshore adjacent to a region that is prone to flooding during wintertime landfalling Pacific storms. More recently, the Collaborative Adaptive Sensing of the Atmosphere (CASA) Engineering Research Center's X-band dual-polarisation radar network has shown the utility of short-range radars at making high-resolution observations of rainfall that are close to the ground over a variety of conditions (Wang and Chandrasekar, 2010).
During the RAINS campaign, the NXPol was installed at Army Base 39 Engineer Regiment, Kinloss, north-east Scotland from January 2016 to August 2016. This deployment was a joint project between NCAS, the Scottish Environment Protection Agency (SEPA), the University of Leeds and the UK Met Office, with the goal of examining the value of additional and higher resolution radar observations in this region for creating more accurate QPEs and flood forecasts. Beyond just improving radar coverage in northern Scotland, the data collected from the NXPol are also being used to examine the specific improvements in QPEs that dual-polarisation observations can provide hydrological models in this region, which is characterised by low melting levels (i.e. low bright bands) and mountainous terrain. In Fig. 7 we show an example of two differing QPEs during a typical precipitation event during the deployment. The observations and the two rainfall rate retrievals are shown here to highlight the potential differences in rainfall rate methods that are being explored as part of RAINS. In particular we highlight the difference between the rainfall rate calculated using the Marshall–Palmer relation (R(Z)=aZb, with a=200 and b=1.6), which is used by the UK Met Office, and rainfall rates calculated using the R(ZH,KDP). The R(ZH,KDP) is described in Diederich et al. (2015b) and here we use a=16.9 and b=0.801. The entire RAINS dataset may be requested from the author as it is still undergoing primary analysis with SEPA and has not been released publically. Once this analysis has been concluded the dataset will be available on CEDA.
As part of the work in RAINS, a set of software tools was created to convert NXPol data into the Met Office NIMROD format using a combination of gridding software (Py-ART or LROSE) and bespoke scripts developed by NCAS. Many UK agencies (i.e. the Environment Agency and SEPA) use this format in their modelling and analysis tools such as HyRAD, developed by the UK's Centre for Ecology and Hydrology (CEH). These scripts may be requested from the authors.
In between major field deployments, the NXPol makes continuous observations at NFARR, located near Chilbolton in Hampshire, UK. This enables NXPol to work in coordination with the other state-of-the-art radar facilities located at the observatory to make novel observations of high-impact wintertime storms and summertime convective events using an array of ground-based remote sensing and in situ observations. The goal of this work is to improve flood forecasting in the UK by using these novel observations to drive the development of physical parameterisations in high-resolution numerical weather prediction models.
Most significantly, this work includes NXPol making coincidental range-height indicator (RHI) scans of frontal events with the Chilbolton Advanced Meteorological Radar (CAMRa), which is the largest steerable meteorological radar in the world. CAMRa operates at S-band (∼3 GHz), and its 25 m antenna creates a beam width of only 0.25∘ (Goddard et al., 1994). This results in the ability to make high-resolution observations at far ranges (i.e. at 100 km from the dish, the resolution of a 0.25∘ beam is 0.4 km). Like the NXPol, CAMRa has dual-polarisation and Doppler capabilities. For a full description of CAMRa, please see Goddard et al. (1994). An example of coincidental observations from CAMRa and the NXPol on 12 January 2017 at 13:36 UTC is shown in Fig. 8. Currently, observations from both radars may be requested from the authors as they are still undergoing primary analysis. The datasets will also become public on CEDA by 2020 after the 2-year embargo period for this campaign is over.
As part of the ongoing research with NXPol, the use of hydrometeor classification algorithms (HCAs, also referred to as particle identification or PID) to explore cloud microphysics is being pursued. Such an HCA has been initially implemented for the NXPol using the framework provided by LROSE (Dixon et al., 2012). The HCA is a fuzzy logic approach, and the membership functions are based largely on the work of Dolan and Rutledge (2009) and Thompson et al. (2014). An example result of the HCA applied to NXPol and CAMRa observations from 17 May 2017 at 12:24 UTC is shown in Fig. 9. The NXPol's HCA results are part of ongoing research and have not yet been fully validated. As such, Fig. 9 is shown only to demonstrate the type of ongoing investigations enabled by the NXPol's observations. Nevertheless, the comparison shows good qualitative agreement between the algorithms applied to the two radars. Future work will include validation with in situ observations made with FAAM. We hope that the use of multiple frequencies will help constrain and reduce uncertainty associated with scattering parameters within the retrieval.
Here we have summarised the key technical characteristics of the NXPol and the infrastructure used to deploy the system autonomously at remote locations. We have also shown examples of its successful use in four differing scientific campaigns. As is shown in the examples, the NXPol is a highly capable and flexible instrument for use in examining the microphysics of clouds and producing QPEs. As described in Sect. 4, in between bespoke deployments to remote locations, the NXPol will be located at NFARR to make continuous observations in conjunction with other instruments at this site. The NCAS and Leeds University Radar Group welcomes any collaborations that utilise the NXPol and its observations.
For further information on the use of the NXPol including instrument access policies, data format, NXPol-specific analysis software and availability, please see the NXPol instrument home page at https://www.ncas.ac.uk/index.php/en/about-amf/263-amf-main-category/amf-x-band-radar/1098-x-band-radar-overview, last access: 15 July 2018.
Observations made by NXPol during COPE ICE-D may be accessed via CEDA in Bennett (2018a, b). We strongly encourage anyone using these data to be in contact with the authors.
Observations made during RAINS are currently undergoing further analysis and are therefore unavailable via a public repository. Please contact the authors if you wish to have access to this data. Once the data analysis is completed (hopefully by early 2019) the data will be deposited on the CEDA catalogue where anyone may find it by searching for RAINS and NXPol.
Observations from the CAMRa's NXPol's ongoing work at NFARR do not yet have a DOI or reference as these datasets are still being collected. If you are interested in using these data, please contact the authors. Once data collection is complete, and the observations have been calibrated, the data will be publically available on CEDA alongside all the observations above.
The authors declare that they have no conflict of interest.
Numerous people have provided assistance in the development and deployment
of the NXPol since its purchase in 2012. We thank them for their
contributions and support in this effort. In particular, we thank Selex ES
GmbH for their excellent support and Mike Dixon of NCAR's Earth Observing
Laboratory for his continued help in adapting LROSE to the needs of the
NXPol. The lead author would like to acknowledge the “Shut Up and Write”
group in the School of Earth and Environment at the University of Leeds.
Without the weekly space, time, and support this group offers, this
paper would not have been written.
Edited by: Mark Kulie
Reviewed by: Scott Collis and one anonymous referee
Ahlbom, A., Bergqvist, U., Bernhardt, J. H., Cesarini, J. P., Court, L. A., Grandolfo, M., Hietanen, M., McKinlay, A. F., Repacholi, M. H., Sliney, D. H., Stolwijk, J. A. J., Swicord, M. L., Szabo, L. D., Taki, M., Tenforde, T. S., Jammet, H. P., and Matthes, R.: Guidelines for limiting exposure to time-varying electric, magnetic, and electromagnetic fields (up to 300 GHz), Health Phys., 74, 494–521, 1998.
Antonini, A., Melani, S., Corongiu, M., Romanelli, S., Mazza, A., Ortolani, A., and Gozzini, B.: On the Implementation of a Regional X-Band Weather Radar Network, Atmosphere, 8, 25–20, https://doi.org/10.3390/atmos8020025, 2017.
Bennett, L.: MICROSCOPE: NCAS mobile X-band radar scan data from Davidstow Airfield – Version 2, Centre for Environmental Data Analysis, https://doi.org/10.5285/c9cab04a8b00486e8c20d9ec68931593, 2018a.
Bennett, L.: ICE-D: NCAS mobile X-band radar scan data from the Praia International Airport, Santiago, Cape Verde, Version 1, Centre for Environmental Data Analysis, https://doi.org/10.5285/55b5d76a7edb42e39933c1edc37f7b90, 2018b.
Biggerstaff, M. I., Wicker, L. J., Guynes, J., Ziegler, C., Straka, J. M., Rasmussen, E. N., Doggett, A., Carey, L. D., Schroeder, J. L., and Weiss, C.: The shared mobile atmospheric research and teaching radar: A collaboration to enhance research and teaching, B. Am. Meteorol. Soc., 86, 1263–1274. https://doi.org/10.1175/BAMS-86-9-1263, 2005.
Bluestein, H. B., French, M. M., Tanamachi, R. L., Frasier, S., Hardwick, K., Junyent, F., and Pazmany, A. L.: Close-Range Observations of Tornadoes in Supercells Made with a Dual-Polarization, X-Band, Mobile Doppler Radar, Mon. Weather Rev., 135, 1522–1543, https://doi.org/10.1175/MWR3349.1, 2007.
Bluestein, H. B., Rauber, R. M., Burgess, D. W., Albrecht, B., Ellis, S. M., Richardson, Y. P., Jorgensen, D. P., Frasier, S. J., Chilson, P., Palmer, R. D., Yuter, S. E., Lee, W.-C., Dowell, D. C., Smith, P. L., Markowski, P. M., Friedrich, K., and Weckwerth, T. M.: Radar in Atmospheric Sciences and Related Research: Current Systems, Emerging Technology, and Future Needs, B. Am. Meteorol. Soc., 95, 1850–1861, https://doi.org/10.1175/bams-d-13-00079.1, 2014.
Blyth, A. M., Bennett, L. J., and Collier, C. G.: High-resolution observations of precipitation from cumulonimbus clouds, Met. Apps, 22, 75–89, https://doi.org/10.1002/met.1492, 2015.
Borgmann, J., Hannesen, R., Göltz, P., and Gekat, F.: Development and Application of a Polarimetric X-Band Radar for Mobile and Stationary Applications, 33rd Conference on Radar Meteorology, American Meteorological Society, Cairns, Queensland, Australia, 2007.
Bringi, V. N. and Chandrasekar, V.: Polarimetric Doppler Weather Radar, Cambridge University Press, Cambridge, 2001.
Chandrasekar, V. and Bharadwaj, N.: Orthogonal Channel Coding for Simultaneous Co- and Cross-Polarization Measurements, J. Atmos. Ocean. Tech., 26, 45–56, https://doi.org/10.1175/2008JTECHA1101.1, 2009.
Diederich, M., Ryzhkov, A., Simmer, C., Zhang, P., and Trömel, S.: Use of Specific Attenuation for Rainfall Measurement at X-Band Radar Wavelengths. Part I: Radar Calibration and Partial Beam Blockage Estimation, J. Hydrometeor., 16, 487–502, https://doi.org/10.1175/JHM-D-14-0066.1, 2015a.
Diederich, M., Ryzhkov, A., Simmer, C., Zhang, P., and Trömel, S.: Use of Specific Attenuation for Rainfall Measurement at X-Band Radar Wavelengths. Part II: Rainfall Estimates and Comparison with Rain Gauges, J. Hydrometeor., 16, 503–516, https://doi.org/10.1175/JHM-D-14-0067.1, 2015b.
Dixon, M., Lee, W.-C., Daniels, M., Martin, C., Cohn, S., and Brown, B.: Community Software Tools for the Radars, Lidars and Profilers of the NSF Lower Atmosphere Observing Facilities, available at: https://www.eol.ucar.edu/system/files/RadarSoftwareRequestForComment.20120918.pdf (last access: 4 February 2018), 2012.
Dixon, M., Lee, W.-C., Rilling, B., and Burghart, C.: CfRadial data file format: Proposed CF-compliant netCDF format for moments data for RADAR and LIDAR in radial coordinates. NCAR, 66 pp., available at: http://www.eol.ucar.edu/system/files/CfRadialDoc.v1.3.20130701.pdf (last access: 4 February 2018), 2013.
Dolan, B. and Rutledge, S. A.: A Theory-Based Hydrometeor Identification Algorithm for X-Band Polarimetric Radars, J. Atmos. Ocean. Tech., 26, 2071–2088, https://doi.org/10.1175/2009JTECHA1208.1, 2009.
Doviak, R. J., Bringi, V., Ryzhkov, A., Zahrai, A., and Zrnić, D.: Considerations for Polarimetric Upgrades to Operational WSR-88D Radars, J. Atmos. Ocean. Tech., 17, 257–278, https://doi.org/10.1175/1520-0426(2000)017<0257:cfputo>2.0.co;2, 2000.
Dufton, D. R. L. and Collier, C. G.: Fuzzy logic filtering of radar reflectivity to remove non-meteorological echoes using dual polarization radar moments, Atmos. Meas. Tech., 8, 3985–4000, https://doi.org/10.5194/amt-8-3985-2015, 2015.
Fabry, F.: Radar Meteorology: Principles and Practice, Cambridge University Press, Cambridge, UK, 2015.
Forget, P., Saillard, M., Guérin, C. A., Testud, J., and Le Bouar, E.: On the Use of X-Band Weather Radar for Wind Field Retrieval in Coastal Zone, J. Atmos. Ocean. Tech., 33, 899–917, https://doi.org/10.1175/JTECH-D-15-0206.1, 2016.
Galletti, M. and Zrnić, D. S.: Degree of Polarization at Simultaneous Transmit: Theoretical Aspects, IEEE Geosci. Remote S., 9, 383–387, https://doi.org/10.1109/LGRS.2011.2170150, 2012.
Galletti, M., Chandra, M., and Borner, T.: Degree of polarization for weather radars, IEEE International Geoscience and Remote Sensing Symposium, Barcelona, Spain, 2007.
Geerts, B., Parsons, D., Ziegler, C. L., Weckwerth, T. M., Biggerstaff, M. I., Clark, R. D., Coniglio, M. C., Demoz, B. B., Ferrare, R. A., Gallus Jr., W. A., Haghi, K., Hanesiak, J. M., Klein, P. M., Knupp, K. R., Kosiba, K., McFarquhar, G. M., Moore, J. A., Nehrir, A. R., Parker, M. D., Pinto, J. O., Rauber, R. M., Schumacher, R. S., Turner, D. D., Wang, Q., Wang, X., Wang, Z., and Wurman, J.: The 2015 Plains Elevated Convection at Night Field Project, B. Am. Meteorol. Soc., 98, 767–786, doi:10.1175/BAMS-D-15-00257.1, 2017.
Goddard, J. W. F., Eastment, J. D., and Thurai, M.: The Chilbolton Advanced Meteorological Radar: a tool for multidisciplinary atmospheric research, Electron. Commun. Eng., 6, 77–86, https://doi.org/10.1049/ecej:19940205, 1994.
Golding, B., Clark, P., and May, B.: The Boscastle flood: Meteorological analysis of the conditions leading to flooding on 16 August 2004, Weather, 60, 230–235, https://doi.org/10.1256/wea.71.05, 2005.
Heistermann, M., Jacobi, S., and Pfaff, T.: Technical Note: An open source library for processing weather radar data (wradlib), Hydrol. Earth Syst. Sci., 17, 863–871, https://doi.org/10.5194/hess-17-863-2013, 2013.
Heistermann, M., Collis, S., Dixon, M. J., Giangrande, S., Helmus, J. J., Kelley, B., Koistinen, J., Michelson, D. B., Peura, M., Pfaff, T., and Wolff, D. B.: The Emergence of Open-Source Software for the Weather Radar Community, B. Am. Meteorol. Soc., 96, 117–128, https://doi.org/10.1175/BAMS-D-13-00240.1, 2015.
Helmus, J. J. and Collis, S. M.: The Python ARM Radar Toolkit (Py-ART), a Library for Working with Weather Radar Data in the Python Programming Language, Journal of Open Research Software, 4, p.e25, https://doi.org/10.5334/jors.119, 2016.
Kato, A. and Maki, M.: Localized Heavy Rainfall Near Zoshigaya, Tokyo, Japan on 5 August 2008 Observed by X-band Polarimetric Radar–Preliminary Analysis, SOLA, 5, 089–092, https://doi.org/10.2151/sola.2009-023, 2009..
Kumjian, M.: Principles and applications of dual-polarization weather radar. Part I: Description of the polarimetric radar variables, J. Operational Meteor., 1, 226–242, https://doi.org/10.15191/nwajom.2013.0119, 2013a.
Kumjian, M.: Principles and applications of dual-polarization weather radar. Part II: Warm- and cold-season applications, J. Operational Meteor., 1, 243–264, https://doi.org/10.15191/nwajom.2013.0120, 2013b.
Kumjian, M.: Principles and applications of dual-polarization weather radar. Part III: Artifacts, J. Operational Meteor., 1, 265–274, https://doi.org/10.15191/nwajom.2013.0121, 2013c.
Leon, D. C., French, J. R., Lasher-Trapp, S., Blyth, A. M., Abel, S. J., Ballard, S., Barrett, A., Bennett, L. J., Bower, K., Brooks, B., Brown, P., Charlton-Perez, C., Choularton, T., Clark, P., Collier, C., Crosier, J., Cui, Z., Dey, S., Dufton, D., Eagle, C., Flynn, M. J., Gallagher, M., Halliwell, C., Hanley, K., Hawkness-Smith, L., Huang, Y., Kelly, G., Kitchen, M., Korolev, A., Lean, H., Liu, Z., Marsham, J., Moser, D., Nicol, J., Norton, E. G., Plummer, D., Price, J., Ricketts, H., Roberts, N., Rosenberg, P. D., Simonin, D., Taylor, J. W., Warren, R., Williams, P. I., and Young, G.: The Convective Precipitation Experiment (COPE): Investigating the Origins of Heavy Precipitation in the Southwestern United Kingdom, B. Am. Meteorol. Soc., 97, 1003–1020, https://doi.org/10.1175/BAMS-D-14-00157.1, 2016.
Maki, M., Iwanami, K., Misumi, R., Park, S.-G., Moriwaki, H., Maruyama, K.-I., Watabe, I., Lee, D.-I., Jang, M., Kim, H.-K., Bringi, V. N., and Uyeda, H.: Semi-operational rainfall observations with X-band multi-parameter radar, edited by: Seed, A. and Austin, G., Atmos. Sci. Lett., 6, 12–18, https://doi.org/10.1002/asl.84, 2005.
Marshall, J. S. and Palmer, W.: The Distribution of Raindrops with Size, J. Meteorol., 5, 165–166, 1948.
Matrosov, S. Y., Kingsmill, D. E., Martner, B. E., and Ralph, F. M.: The utility of X-band polarimetric radar for quantitative estimates of rainfall parameters, J. Hydrometeor., 6, 248–262, 2005.
Mishra, K. V., Krajewski, W. F., Goska, R., Ceynar, D., Seo, B.-C., Kruger, A., Niemeier, J. J., Galvez, M. B., Thurai, M., Bringi, V. N., Tolstoy, L., Kucera, P. A., Petersen, W. A., Grazioli, J., and Pazmany, A. L.: Deployment and Performance Analyses of High-Resolution Iowa XPOL Radar System during the NASA IFloodS Campaign, J. Hydrometeor, 17, 455–479, https://doi.org/10.1175/JHM-D-15-0029.1, 2016.
Pazmany, A. L., Mead, J. B., Bluestein, H. B., Snyder, J. C., and Houser, J. B.: A mobile rapid-scanning X-band polarimetric (RaXPol) doppler radar system, J. Atmos. Ocean. Tech., 30, 1398–1413, https://doi.org/10.1175/JTECH-D-12-00166.1, 2013.
Thompson, E. J., Rutledge, S. A., Dolan, B., Chandrasekar, V., and Cheong, B. L.: A Dual-Polarization Radar Hydrometeor Classification Algorithm for Winter Precipitation, J. Atmos. Ocean. Tech., 31, 1457–1481, https://doi.org/10.1175/JTECH-D-13-00119.1, 2014.
Wang, Y. and Chandrasekar, V.: Polarization isolation requirements for linear dual-polarization weather Radar in simultaneous transmission mode of operation, IEEE T. Geosci. Remote, 44, 2019–2028, https://doi.org/10.1109/tgrs.2006.872138, 2006.
Wang, Y. and Chandrasekar, V.: Quantitative Precipitation Estimation in the CASA X-band Dual-Polarization Radar Network, J. Atmos. Ocean. Tech., 27, 1665–1676, https://doi.org/10.1175/2010JTECHA1419.1, 2010.
Wurman, J., Straka, J., Rasmussen, E., Randall, M., and Zahrai, A.: Design and deployment of a portable, pencil-beam, pulsed, 3-cm Doppler radar, J. Atmos. Ocean. Tech., 14, 1502–1512, https://doi.org/10.1175/1520-0426(1997)014<1502:DADOAP>2.0.CO;2, 1997.
Wurman, J., Dowell, D., Richardson, Y., Markowski, P., Rasmussen, E., Burgess, D., Wicker, L., and Bluestein, H. B.: The Second Verification of the Origins of Rotation in Tornadoes Experiment: VORTEX2, B. Am. Meteorol. Soc., 93, 1147–1170, https://doi.org/10.1175/BAMS-D-11-00010.1, 2012.