the Creative Commons Attribution 4.0 License.
the Creative Commons Attribution 4.0 License.
 | 20 Dec 2018
Aerosol optical properties derived from POLDER-3/PARASOL (2005–2013) over the western Mediterranean Sea – Part 1: Quality assessment with AERONET and in situ airborne observations
Paola Formenti
Lydie Mbemba Kabuiku
Isabelle Chiapello
Fabrice Ducos
François Dulac
Didier Tanré
The western Mediterranean atmosphere is impacted by a variety of aerosol sources, producing a complex and variable mixture of natural and anthropogenic particles, with different chemical and physical properties. Satellite sensors provide a useful global coverage of aerosol parameters but through indirect measurements that require careful validation. Here we present the results of a long-term regional scale analysis of the full dataset (March 2005 and October 2013) of POLDER-3/PARASOL ocean operational retrievals of the total, fine, and coarse aerosol optical depth (AOD, AODF, and AODC), Ångström exponent (AE), and the spherical or non-spherical partition of coarse-mode AOD (AODCS and AODCNS), respectively. The evaluation is performed using data from 17 coastal and insular ground-based AERONET sites on one side, and airborne vertical profiles of aerosol extinction and number size distribution obtained by the SAFIRE ATR-42 aircraft operated in the area during summer 2012 and 2013 on the other side. This study provides the first regional evaluation of uncertainties of the POLDER-3 products, and highlights their quality. The POLDER-3 Ångström exponent, representing AOD spectral dependence in link with the aerosol particle size distribution, is biased towards small values. This bias, however, does not prevent using AE for classifying the regional aerosol laden air masses. AODF corresponds to particles smaller than 0.6–0.8 µm in diameter and appears suitable to monitor the aerosol submicron fraction from space. We also provide an original validation of POLDER-3 AODC and its spherical or non-spherical partition, which shows agreement within 25 % with AERONET shape retrievals when the aerosol coarse fraction dominates.
- Article
(9253 KB) - Full-text XML
-
Supplement
(699 KB) - BibTeX
- EndNote


Aerosols include a large variety of particles (mineral dust, sea salt, soot carbon and organic species, sulfates, nitrates, etc.) emitted by natural and anthropogenic sources and different mechanisms (combustion, wind erosion, gas-to-particle conversion, etc.). Aerosols have a short lifetime in the troposphere (Boucher, 2015) but they are key to many atmospheric processes, as the redistribution of solar and thermal radiation by scattering and absorption, cloud formation and precipitation, and air quality degradation, which in turn are relevant in shaping the Earth climate and liveability (Pope III et al., 2002; Akimoto, 2003; Pope III and Dockery, 2006; Monks et al., 2009; Boucher et al., 2013).
Despite its importance, the global aerosol radiative effect is far from being certain, as both aerosol spatial distribution and optical properties are affected by large unknowns (Boucher et al., 2013; Myhre et al., 2013). Furthermore, the apportionment of aerosols to anthropogenic and natural sources is critical to the evaluation of the perturbative forcing of human activities on the Earth radiative budget and ultimately the climate (Myhre et al., 2013; Shindell et al., 2013; Kim et al., 2014; Pan et al., 2015). In this general context, the Mediterranean basin is a region of great interest. Submitted to demographic pressure and experiencing bad air quality (Monks et al., 2009; Kovats et al., 2014), the Mediterranean is a high emission and transport region of all kinds of anthropogenic and natural aerosols (e.g. Moulin et al., 1998; Lelieveld et al., 2002; Pace et al., 2005, 2006; Querol et al., 2009; Pey et al., 2013; Becagli et al., 2017), as well as one of the most vulnerable areas to climate change (Giorgi, 2006), with severe future warming leading to a reduction in precipitation and soil moisture, and henceforth a significant water stress towards the end of the century (Giorgi and Lionello, 2008; García-Ruiz et al., 2011; Christensen et al., 2013) and likely positive feedbacks on the aerosol load.
Through the years, the Mediterranean aerosols have been investigated through a number of dedicated local and regional scale experiments (e.g. Söderman and Dulac, 1998; Formenti et al., 2002; Lelieveld et al., 2002; Zerefos et al., 2002; Dulac and Chazette, 2003; Cros et al., 2004; Putaud et al., 2004; Mallet et al., 2016), surface monitoring stations and networks (e.g. Bergametti et al., 1989; Migon et al., 1993; Mihalopoulos et al., 1997; Meloni et al., 2007; di Sarra et al., 2008; Pérez et al., 2008; Querol et al., 2009; Kalivitis et al., 2011; Mallet et al., 2013; Pappalardo et al., 2014; Lyamani et al., 2015) and satellite observations (e.g. Dulac et al., 1992; Moulin et al., 1998; Barnaba and Gobbi, 2004; Antoine and Nobileau, 2006; Papadimas et al., 2008; Gkikas et al., 2009, 2016). More recently, the regional-scale Chemistry-Aerosol Mediterranean Experiment (ChArMEx, http://charmex.lsce.ipsl.fr/, last access: 26 July 2018) within the international Mediterranean Integrated STudies at Regional And Local Scales (MISTRALS, http://www.mistrals-home.org, last access: 26 July 2018) program has significantly added to the existing body of knowledge by providing new ground-based, airborne and balloon-borne observations over the western part of the basin (Mallet et al., 2016; see also this special issue).
ChArMEx has also provided a new momentum in the analysis of regional ground-based and satellite aerosol observations of long and short periods (e.g. Mallet et al., 2013; Nabat et al., 2013; Lyamani et al., 2015; Gkikas et al., 2016; Granados-Muñoz et al., 2016; Sicard et al., 2016). Satellite data are highly valuable for providing information on the regional and global aerosol spatial and temporal distribution and optical properties which are inputs for climate models. Most multi-spectral imagery instruments (e.g. MODIS, SEAWIFS, AVHHR, SEVIRI) retrieve the aerosol optical depth (AOD), representing the column-integrated optically active content of atmospheric aerosols, and also proportional to the net change in the clear sky outgoing radiative flux at the top of the atmosphere (Boucher, 2015). AOD is an essential parameter to establish the climatology of the distribution and effects of atmospheric aerosols and it is often used for model evaluation (e.g. Chin et al., 2002; Huneeus et al., 2011; Nabat et al., 2013). In this respect, advanced space-borne retrievals deriving the AOD as a function of particle size and shape, and possibly of wavelength, are most useful in evaluating the origin and the radiative effect of aerosols of different nature.
In this paper, we present a first comprehensive quality-assessment study of the advanced dataset provided by the operational ocean retrieval algorithm of the third multi-spectral, multi-directional and polarised POLDER-3 (POLarization and Directionality of the Earth's Reflectances) radiometer on PARASOL (Polarization & Anisotropy of Reflectances for Atmospheric Sciences coupled with Observations from a Lidar) satellite (Herman et al., 2005; Tanré et al., 2011) over the western Mediterranean basin. POLDER-3 operated from March 2005 to October 2013 and provided the total, fine and coarse mode aerosol optical depth (AOD, AODF and AODC) at the wavelength of 865 nm, the spectral dependence of the AOD between 670 and 865 nm (Ångström exponent, AE), and the partition of spherical and non-spherical AODC (AODCS and AODCNS, respectively). This paper extends previous evaluations of AOD and AODF (Goloub et al., 1999; Fan et al., 2008; Bréon et al., 2011) with a focus on the western Mediterranean basin, and provides the first estimate of the significance of the coarse mode spherical and non-spherical components (AODC, AODCS and AODCNS).
This study is based on comparisons with co-localised observations from the sun and sky photometers of coastal and insular stations of the Aerosol Robotic Network (AERONET; Holben et al., 1998), and with the in situ measurements of vertical profiles of aerosol extinction and size distribution which were performed by the French ATR-42 environmental research aircraft of the Service des Avions Français Instrumentés pour la Recherche en Environnement (SAFIRE, http://www.safire.fr/fr/, last access: 26 July 2018) during two ChArMEx intensive campaigns (Di Biagio et al., 2016; Denjean et al., 2016; Mallet et al., 2016). In particular, the use of the size distribution vertical profiles measured in situ allows us to calculate the aerosol optical depth over different size ranges, and perform the evaluation of AODF and AODC.
The analysis presented in this paper is essential to geophysical analyses of observations by POLDER-3 of the spatial and temporal variability of the aerosol load over the western Mediterranean basin. The investigation of temporal trends over the 8-year operating period will be presented in a follow-up dedicated paper (Part 2 of the present paper, Chiapello et al., 2018).
2.1 POLDER-3 and PARASOL
The third radiometer POLDER-3 on PARASOL, operational from March 2005 to October 2013, was part of the A-Train constellation operated on a sun-synchronous orbit at 705 km, crossing the Equator at 13:30 (local time) (Tanré et al., 2011). In December 2009, it left the A-Train, and continued the observations at 3.9 km below, and at 9.5 km below in 2011. This changed its hour of passage, which was 16:00 local time at the end of the operational period.
POLDER-3/PARASOL used a 274 pixels × 242 pixels CCD detector array, each pixel covering 5.3 km ×6.2 km at nadir. The size of the POLDER-3 images was 2100 km ×1600 km, allowing the achievement of global coverage within 2 days. The western Mediterranean area could be covered in less than 5 min along its north-to-south axis. The spatial resolution of POLDER-derived (Level-2) aerosol parameters is about 18.5 km ×18.5 km (corresponding to 3 pixels × 3 pixels of the Level-1 grid; http://www.icare.univ-lille1.fr/parasol/products).
The instrument measured Earth radiance at 9 wavelengths from 443 to 1020 nm, three of which with polarisation (490, 670, 865 nm), and at up to 16 different angles (±51∘ along, ±43∘ across track). Cloud screening according to Bréon and Colzy (1999) was applied to minimise possible cloud contamination of aerosol products.
In this paper, we used the latest algorithm update (collection 3) performed in 2014 of the operational clear-sky ocean retrieval algorithm (Deuzé et al., 1999, 2000; Herman et al., 2005). This latest version includes calibration improvements and uses the total and polarised radiances at 670 and 865 nm. For each clear sky pixel, the algorithm recalculates the observed polarised radiances at several observational angles from a look up table (LUT) built on aerosol microphysical models. These are constructed as follows: (i) aerosol are non-absorbing, that is, the imaginary part mi of their complex refractive index () is zero. Only the real part mr is attributed, and considered as invariant with wavelength between 670 and 865 nm; (ii) the aerosol number size distribution is bimodal and lognormal with a fine mode with an effective diameter (Deff) smaller than 1.0 µm and a coarse mode with Deff larger than 1.0 µm. The coarse mode includes a non-spherical fraction based on the spheroidal model from Dubovik et al. (2006). Collection 3 increases the number of modes with respect to the previous versions reported by Herman et al. (2005) and Tanré et al. (2011), and allows spheroidal Deff to take two values (2.96 or 4.92 µm). The summary of LUT parameters are presented in the supplementary material (Table S1 in the Supplement).
The calculations of the multi-spectral, multi-angle polarised radiances are done using a Mie model for homogeneous spherical particles or the spheroidal optical model developed by Dubovik et al. (2006). A quality flag index (0 indicating the lowest and 1 the highest quality) is attributed to each pixel depending on the quality of radiance simulation.
In this paper, we target the following POLDER-3 oceanic (i.e. over ocean surfaces) aerosol products, in which AODs are at 865 nm:
-
The total aerosol optical depth (AOD), and the Ångström exponent (AE) representing the spectral dependence of AOD, and calculated as
-
The aerosol optical depth due to the fine particle mode (AODF) all obtained for clear-sky pixels.
In addition, for favourable viewing geometries (scattering angles between 90 and 160∘), we have enough information to consider that the coarse mode is a mixing of spherical and non-spherical particles. We assume that the fraction of non-spherical particles (fCNS) of the coarse mode (AODC) can be equal to 5 discrete values (0, 0.25, 0.50, 0.75, 1.0). Then, the AODCNS (respectively AODCS) is derived from
AODC can also be calculated as AOD–AODF. A maximum difference of ±0.002 due to rounding errors was found for days when both methods are applicable.
Only the POLDER-3 aerosol products from pixels with a quality flag index ≥0.5 have been considered in the following discussion.
2.2 AERONET
AERONET is a global network of ground-based multi-spectral sun and sky photometers (Holben et al., 1998, 2001) dedicated to real-time monitoring of aerosol properties and widely used as ground-based reference for validation of aerosol satellite retrievals (e.g. Goloub et al., 1999; Bréon et al., 2011). It uses standardised sun and sky photometers (CIMEL CE-318, Cimel Electronique, Paris) measuring solar extinction and sky radiances (at times with polarisation) in the almucantar plane at wavelengths between 340 and 1020 nm (most commonly 440, 675, 870, and 1020 nm) that allow the derivation of a number of aerosol optical and microphysical parameters (Dubovik and King, 2000; Dubovik et al., 2006).
AOD and AE are obtained about every 15 min from the measurement of the direct sun extinction and are reported as the average of a triplet of acquisitions lasting approximately 30 s. We consider here AERONET AOD at 870 nm and the AE value obtained between 870 and 675 nm. For freshly calibrated and well maintained instruments, the accuracy in AOD is of the order of 0.01–0.02 regardless of the AOD value (Holben et al., 1998). The aerosol optical depth in the fine and coarse mode (AODF and AODC, respectively) are recalculated from the column-integrated particle volume size distribution retrieved between 0.1 and 30 µm in diameter by the inversion algorithm described in Dubovik and King (2000) and Dubovik et al. (2006). The fine and coarse modes of the retrieved volume size distribution are defined as the modes below and above a threshold diameter (Dcut-off) corresponding to the minimum in the particle size distribution. The Dcut-off value is not fixed but can vary between 0.44 and 0.99 µm. AODF and AODC values are estimated by recalculating the extinction due to the fine and coarse modes of the aerosols. The latest AERONET retrieval scheme considers an aerosol mixture of polydisperse, randomly oriented homogeneous spheroids with a fixed distribution of aspect ratios (Mishchenko et al., 1997) and provides fraction (in percentage) of non-spherical or spherical particles, i.e. fNS∕fS (Dubovik et al., 2006). For clear sky, there are about 10 measurements per day of this fraction in the early morning or late afternoon (solar zenith angle ≥50∘).
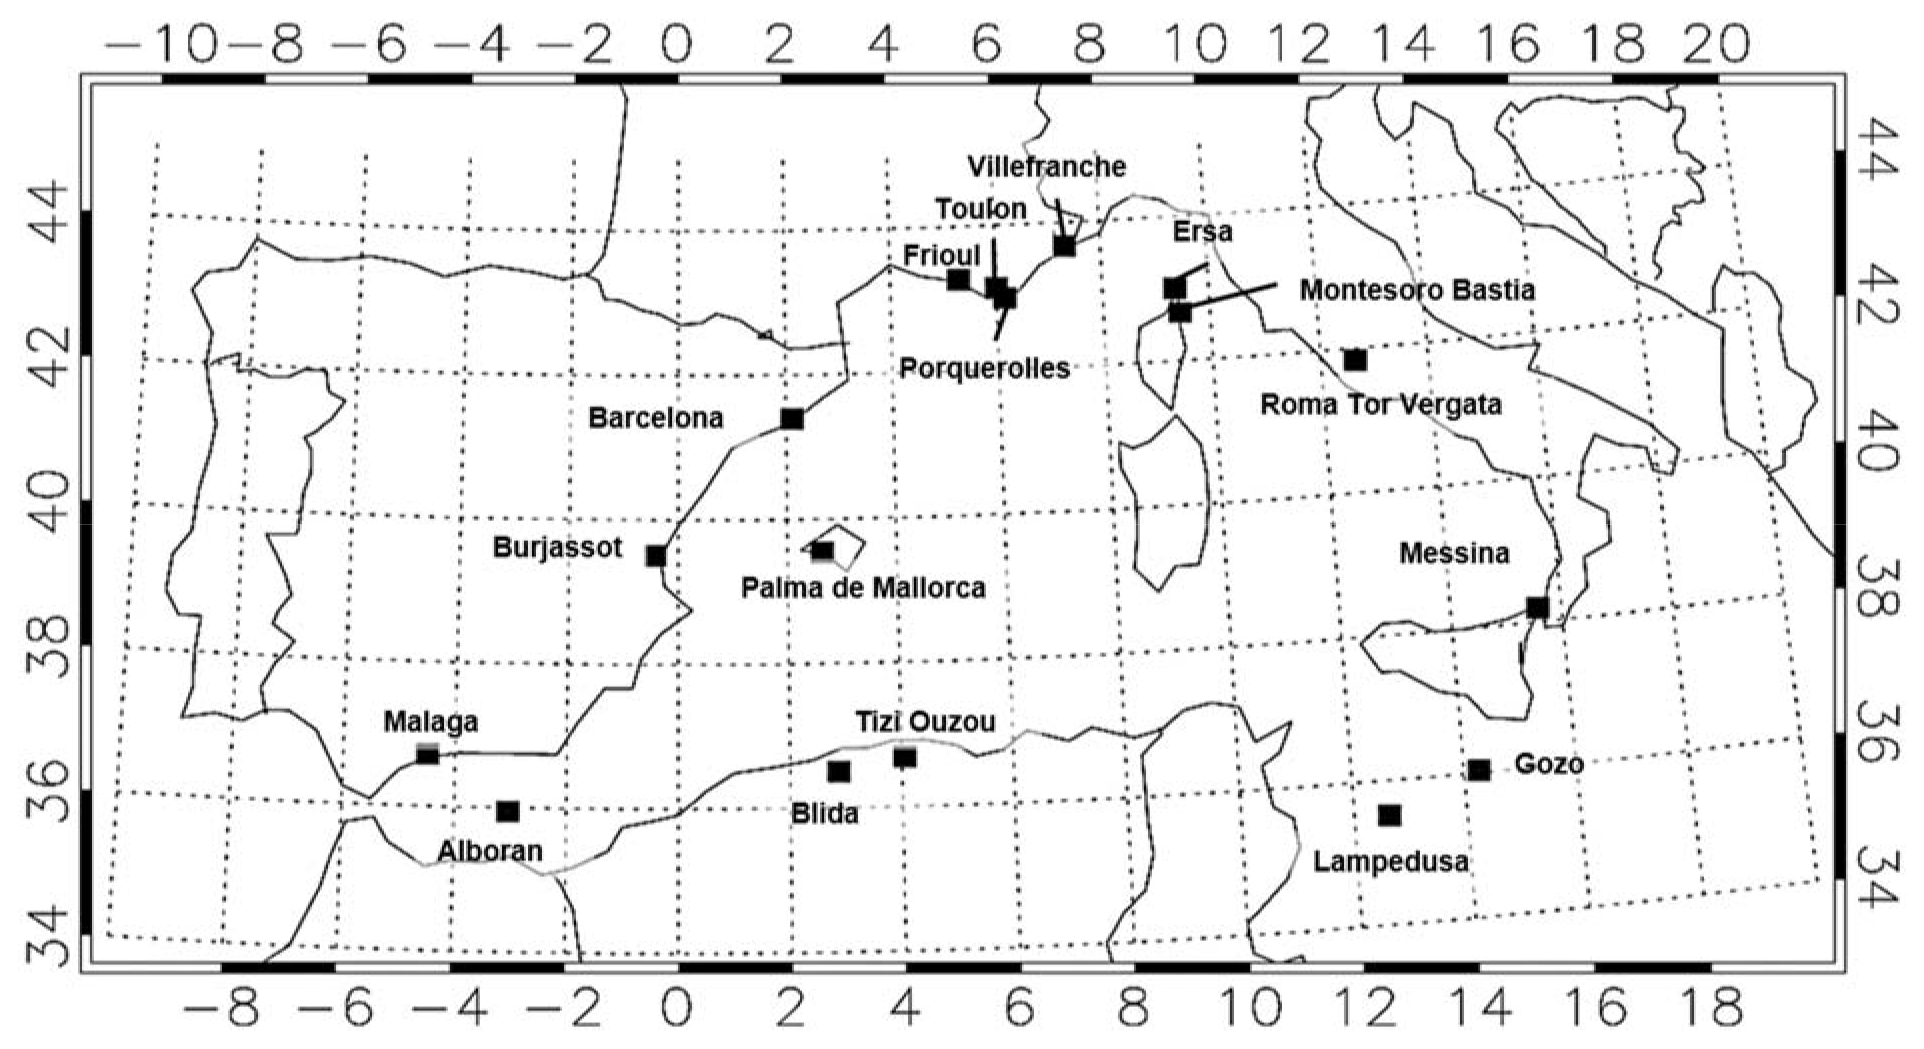
Figure 1Map of the locations of the 17 AERONET ground-based stations considered in this work.
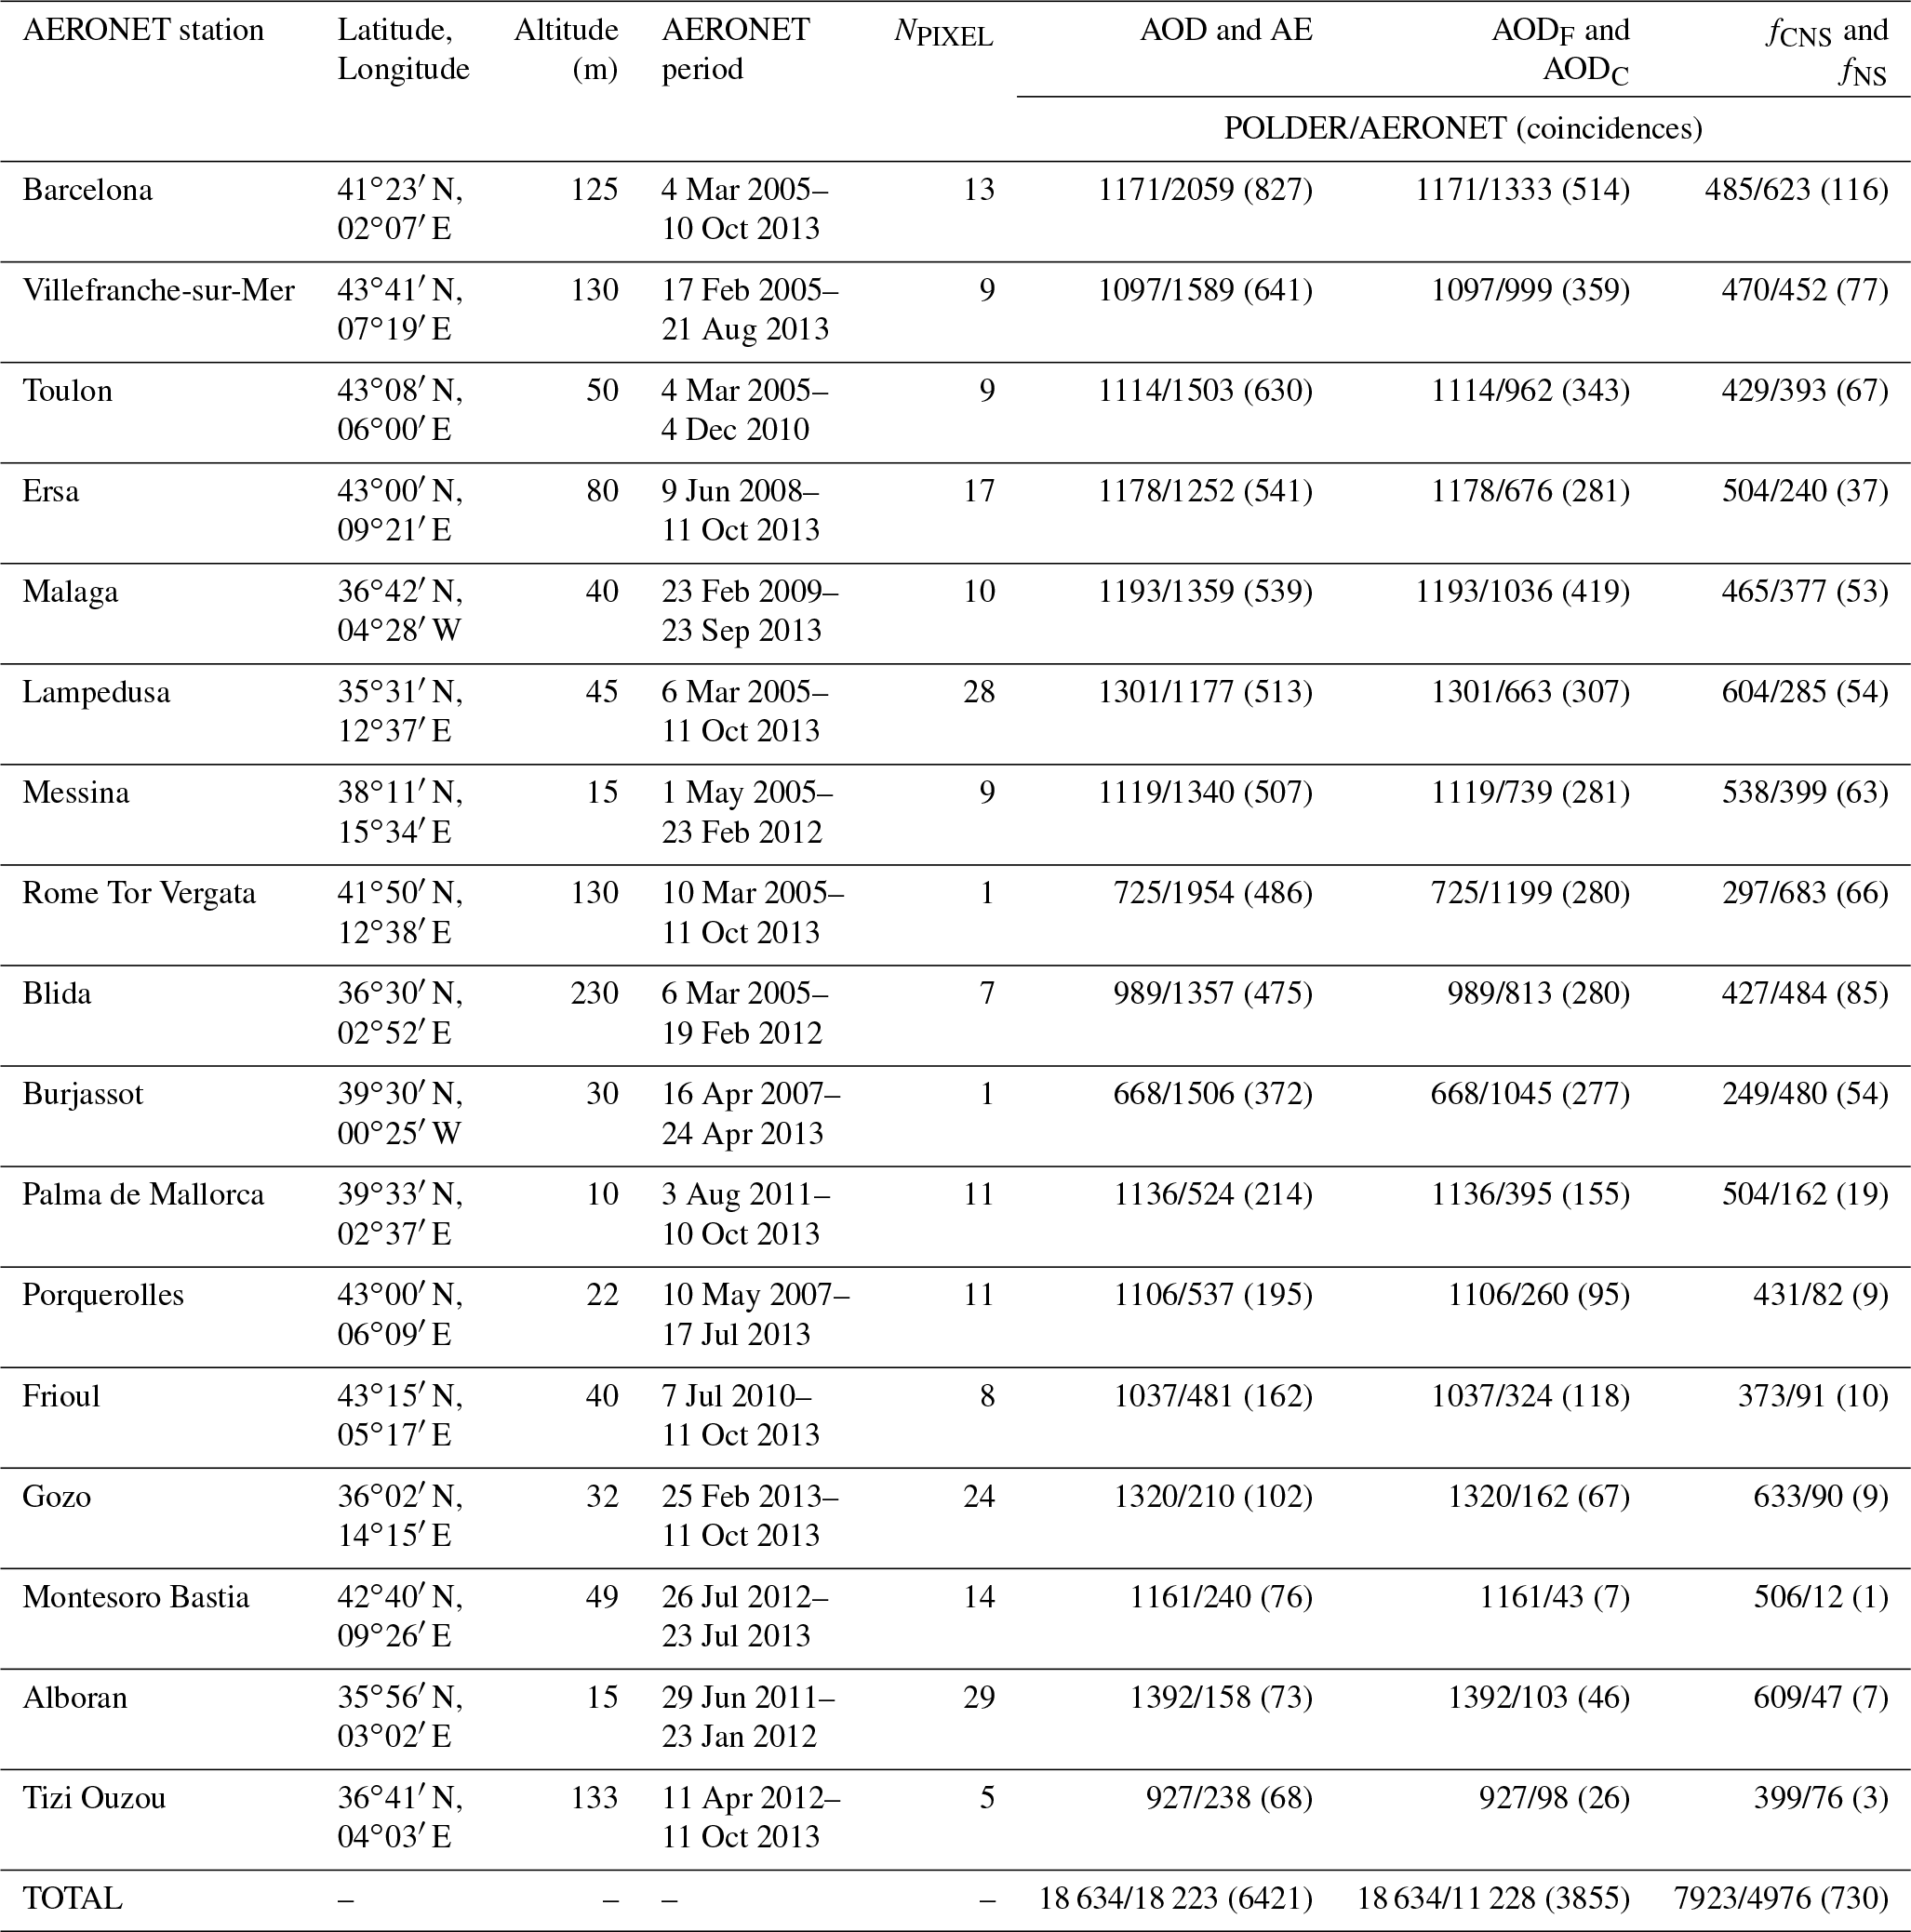
We used AERONET V2 Level-2 quality assured aerosol products. The 17 coastal AERONET stations, shown in Fig. 1, were selected in this study, (see also Table 1 for their respective geographical coordinates and covered periods). Their regional distribution covers the entire western Mediterranean basin, including southern Europe (e.g. near the coastal stations of Barcelona, Toulon, Villefranche-sur-Mer), North Africa (Blida), and island locations in the northern (Ersa), central (Palma de Mallorca), and southern (Lampedusa and Alboran) basin, therefore capturing the diversity of the aerosol population, resulting from the different sources contributing to the Mediterranean aerosol (desert dust, marine, urban, and industrial pollution, and biomass burning). The dataset also includes the ground-based super-sites of Ersa and Lampedusa of the ChArMEx project (Mallet et al., 2016). Considering the 17 stations altogether, more than 18 000 daily observations of AOD are available in total in both POLDER-3 and AERONET datasets, among which 6421 are concurrent (see Sect. 3.2 below) and thus available for comparison. We did not consider a rather limited number (<100) of daily observations obtained from manual sun-photometers on-board ships in our area (Fig. 1) and periods of interest for tentative matching with POLDER, which are also available from the Maritime Aerosol Network component of AERONET (Smirnov et al., 2011).
Table 1List of AERONET stations available in the western Mediterranean region retained for this study. The number of ocean POLDER pixel within 0.5∘ from the position of the station is indicated (NPIXEL). The number of observations by POLDER-3 and AERONET between March 2005 to October 2013, and the number of coincident days (within brackets) are also reported.
2.3 ChArMEx airborne measurements
The airborne measurements relevant to this paper were performed on-board the French ATR-42 environmental research aircraft of SAFIRE during two of the intensive observational periods of the ChArMEx project:
-
The Transport and Air Quality (TRAQA) campaign, dedicated to the study of air pollutant transport from Europe to the Mediterranean, their evolution, and their impact on regional air quality (Di Biagio et al., 2015, 2016; Nabat et al., 2015a; Rea et al., 2015);
-
The Aerosol Direct Radiative Forcing on the Mediterranean (ADRIMED) campaign was dedicated to the characterisation of aerosol optical properties in the Mediterranean and their direct radiative effect in clear sky conditions (Denjean et al., 2016; Mallet et al., 2016).
During TRAQA, the ATR-42, based at the Francazal airport near Toulouse, France (43∘36′ N, 1∘26′ E), conducted 17 flights from 20 June to 13 July 2012, encountering weather conditions favouring the transport of pollution aerosols from continental Europe, and particularly from the Rhone valley, the Gulf of Genoa, and Barcelona, giving raise to AOD values in the range of 0.2–0.6 at 550 nm over the northwestern Mediterranean. From 17 to 23 June, and then on 29 June, two episodes of desert dust transport were observed in the free troposphere, increasing the AOD up to 1.4 on 29 June (Di Biagio et al., 2015, 2016). During ADRIMED, the ATR-42, based in Cagliari, Italy (39∘15′ N, 9∘03′ E), flew 16 scientific flights between 14 June and 4 July 2013 (Denjean et al., 2016; Mallet et al., 2016). Several episodes of desert dust transport from southern Algeria and Morocco and northern Algeria and Tunisia were observed over the western and central Mediterranean, particularly off the Balearic Islands and above Lampedusa island offshore of Tunisia (Denjean et al., 2016). The total optical depth at 550 nm remained moderate, in the order of 0.2–0.4 even during dust events (Mallet et al., 2016).
2.3.1 Airborne instrumentation measuring aerosol optical properties
PLASMA photometer
PLASMA (Photomètre Léger Aéroporté pour la Surveillance des Masses d'Air), developed by LOA (Laboratoire d'Optique Atmospherique, Lille), is a multi-spectral sun-photometer which measures the direct sun radiance and retrieves the AOD at 15 wavelengths between 343 and 2250 nm, including 869 nm (Karol et al., 2013). The estimated uncertainty ranges between 0.005 and 0.01 (Karol et al., 2013). PLASMA was operated during the ADRIMED campaign only, when it was mounted on the roof of the ATR42, allowing the retrieval of a vertical profile of both the spectral AOD and the aerosol particle size distribution (Torres et al., 2017).
CAPS-PMex
The Cavity Attenuated Phase Shift in situ instrument (CAPS-PMex, Aerodyne Research Inc.) measures the extinction coefficient σext at 532 nm with an estimated relative uncertainty of ±3.2 % (Kebabian et al., 2007; Massoli et al., 2010; Petzold et al., 2013). The operating principle is based on the modulation of the frequency and the phase changes of the light emitted by a LED source due to aerosols, after correction of the Rayleigh scattering by the molecules present in the air mass. As described in Denjean et al. (2016), the instrument was available during the ADRIMED campaign only, when it was located inside the cabin behind the Communautary Aerosol Inlet (CAI), and operated at 0.85 L min−1 with a temporal resolution of 1 s. In this paper, the extinction coefficient σext is expressed in Mm−1 (1 Mm−1 m−1).
Nephelometer
The scattering coefficient σscat at 450, 550 and 700 nm was measured by a spectral integrating nephelometer (model 3563, TSI Inc.) described extensively by Anderson et al. (1996) and Anderson and Ogren (1998). During both TRAQA and ADRIMED, the instrument was operated at 30 L min−1 with a temporal resolution of 1–2 s downstream of the AVIRAD inlet also on-board the ATR-42 (Di Biagio et al., 2015, 2016; Denjean et al., 2016). The AVIRAD inlet estimated size cut-off, corresponding to the diameter at which particles are collected with a 50 % efficiency, is 12 µm in optical diameter.
The instrument uses a halogen lamp as a light source and three photomultipliers preceded by spectral filters. Due to the geometry of its sensing volume, the nephelometer measures the scattering coefficient (σscat) between 7 and 170∘ and the backscattering coefficient (σbscat) between 90 and 170∘. The scattering Ångström exponent (AEscat) representing the scattering spectral dependence can be calculated as
The relative uncertainty in σscat due to calibration, counting statistics, and non-idealities of detector surfaces, is estimated to be ±1 %–2 % for submicron aerosols and ±8 %–15 % for supermicron aerosols (Müller et al., 2009). Usually added to these values is the error related to the geometric truncation of the measured angular range of the scattering phase function due to the sensing volume (Anderson and Ogren, 1998). This truncation induces an underestimation of σscat and σbscat, which depends on the angular distribution of the scattered light, and thus on particle size. Anderson and Ogren (1998) have shown that the uncertainty induced by the underestimation of σscat can be parameterised by the scattering spectral dependence for submicron aerosols. This parameterisation is not possible for aerosols of larger particle size (diameter greater than 1 µm), because the Ångström exponent tends to zero, whereas the underestimation is important (50 %–60 %) because of the increase of the forward scattering. In this case, the correction is performed by optical calculation if the particle size distribution and refractive index are known (Müller et al., 2009; Formenti et al., 2011). As for σext, in this paper σscat is expressed in Mm−1
2.3.2 Aerosol particle size distribution
Because of its extent, the aerosol particle size distribution is measured in situ by the combination of several instruments, often based on different physical principles (Wendisch and Brenguier, 2013). In our work, we used a combination of different optical counters operating on the fine and coarse modes of the aerosols:
-
Passive cavity aerosol spectrometer probe (PCASP, Droplet Measurement Technologies, Boulder, Colorado, USA). This was operated at 632.8 nm with a temporal resolution of 1 s. The PCASP measures light scattering between 35 and 135∘ to derive the particle number size distribution over 31 channels between 0.1 and 3.0 µm in diameter (Liu et al., 1992; Reid et al., 1999). The PCASP was operated on a wing pod of the ATR-42 during the TRAQA campaign only.
-
Ultra high sensitivity aerosol spectrometer (UHSAS, Droplet Measurement Technologies, Boulder, Colorado) This was operated at 1054 nm with a temporal resolution of 1 s. The UHSAS measures light scattering between 22 and 158∘ to derive the particle number size distribution over 99 size channels between 0.04 and 1.0 µm in diameter (Cai et al., 2008). The UHSAS replaced the PCASP under the aircraft wing during the ADRIMED campaign.
-
Sky-Grimm counter (1.129 model, Grimm Aerosol Technik; Grimm and Eatough, 2009) This was operated at 632.8 nm with a temporal resolution of 6 s. The instrument integrates light scattering between 30 and 150∘ to derive the particle number size distribution over 32 channels between 0.25 and 30 µm in diameter (Grimm and Eatough, 2009). The instrument was available during both TRAQA and ADRIMED, operated inside the aircraft cabin and behind the AVIRAD inlet. Due to a flow problem, measurements during TRAQA are restricted to the portions of the flights when the ATR-42 remained below 350 m above sea level.
3.1 Matching POLDER-3 and in situ aircraft measurements
In situ aircraft measurements provided direct and indirect observations for validation. Direct observations of the total AOD were obtained by the reading of the PLASMA sun-photometer for those portions of the flights when the ATR-42 flew at its lowest altitude and by integrating the vertical profile of the extinction coefficient σext measured by the CAPS-PMex instrument between the minimum and the maximum heights (zmin and zmax) of the ATR-42 during profile ascents or descents.
Indirect validation of the size-dependent optical depth (AOD, AODF, and AODC) was performed by optical calculation from the number size distribution measured by the combination of the PCASP, UHSAS and Grimm optical counters as
The suffix x in Eq. (4) indicates the size domain of the aerosol optical depth (total, fine, or coarse) considered in the calculations.
Equation (4) allows one to estimate the aerosol optical depth over a variable size domain, whose boundaries ( and Dmax) can be adjusted to represent the fine and the coarse modes, as well as the total particle size distribution.
The iterative procedure used for the calculation is presented in Fig. S1 in the Supplement. All calculations used the optical Mie theory for homogeneous spherical particles (Mie, 1908). The initial step of the procedure consisted in estimating the aerosol number size distribution, input of Eq. (4), from the measurements of the PCASP, UHSAS, and Grimm optical counters operated on board the ATR-42 during TRAQA and ADRIMED. This required the following two actions, described in detail in the Supplement.
-
The conversion of the nominal “optical equivalent spherical diameter” (DEO) characteristic of each particle counter to a “geometric equivalent spherical diameter” (DEG). The operating principle of the particle optical counters is based on the angular dependence of the light scattering intensity to the particle size (Wendisch and Brenguier, 2013). The proportionality factor between angular light scattering and particle size depends on the particle complex refractive index. At calibration, the optical particle counters provide an “optical equivalent spherical diameter” (DEO), corresponding to the diameter of standard material, generally spherical latex beads, of which the refractive index () is usually different from the real aerosol refractive index measured in the atmosphere. It is therefore necessary to convert the measured DEO value into a so-called “geometric equivalent spherical diameter” (DEG) value taking into account the actual refractive index of ambient particles.
-
The combination of measurements over different size ranges. Since no optical counter completely covers the full size range of atmospheric aerosol particles, measurements of the PCASP, UHSAS and Grimm were combined by examining their agreement on their size overlap domains. When successful, the particle number size distribution obtained by the combination was normalised to the total particle number and fitted using a multi-mode lognormal distribution to eliminate discontinuities and extend the representation beyond the lower and upper operating size ranges of the optical counters.
The capability of the derived number size distributions to represent the aerosol extinction coefficient, henceforth to estimate aerosol optical depth, was assessed by comparing the calculated extinction and scattering coefficients σext and σscat to the measurements of the CAPS-PMex and the nephelometer at 450, 532, 550, and 700 nm. The scattering coefficient σscat was calculated by integrating the scattering phase function between 7 and 170∘, corresponding to the aperture of the sensing volume of the nephelometer.
All optical calculations performed in this paper assumed the spectral complex refractive index m, representing the aerosol composition, as independent of size. An initial dataset per aerosol type was chosen (Table S2). The calculations were iterated by varying the initial values of the complex refractive indices until both (1) the adjusted value for the calculation of the extended size distributions and (2) the comparison between calculations and measurements of the extinction and scattering coefficients agreed within errors. Results of these comparisons are presented in the Supplement.
3.2 Constitution of the dataset
This section describes the choices of temporal and spatial coincidences adopted for the comparisons between POLDER-3, AERONET and in situ data.
3.2.1 Coincidence with AERONET
As described in previous evaluation studies of aerosol products derived from satellites (e.g. Bréon et al., 2011), two approaches can be considered in order to compare coincident ground-based photometer and satellite aerosol data. One option is to select only the closest (in time) photometer measurement and the closest (in distance) satellite pixel from the photometer site. Another method consists of performing averaging within a certain time window for photometer data, and a spatial average of the satellite data within a given distance from the photometer site. Bréon et al. (2011) have shown that these two approaches give very comparable results for POLDER-3 aerosol products over oceans. In this study we adopted the second approach, considering the POLDER-3 aerosol products from pixels within ±0.5∘ around the AERONET sites. For AERONET AOD and AE, the averaging temporal window was set to ±1 h around the time of the POLDER-3 passage. For AERONET AODF, AODC, and shape retrieval, this temporal window produces an insufficient number of data, for springs and summers in the period 2005–2011, due to the temporal time shift of the POLDER-3 passage towards the afternoon. For these two variables, the averaging temporal window was extended to the whole afternoon (that is, all data points later than 12:00 UTC) in order to allow for a significant dataset for comparison.
Table 1 reports the number of available observational days for POLDER-3 and AERONET aerosol parameters at each station in the period March 2005–October 2013, as well as the number of coincident days obtained between POLDER-3 and AERONET. The stations are ranged regarding the number of coincident days obtained for AOD and AE, this number representing the upper limit of the number of common POLDER-3/AERONET observations days available. Including all 17 stations, 18634 occurrences of comparable POLDER-3 and AERONET observations are available for AOD, AE, AODF and AODC, and 7923 occurrences for AODCS and AODCNS, due to specific constraints on geometric conditions in the POLDER-3 algorithm necessary to derive shape-related parameters (non sphericity). Per site, the number of clear sky observational days for POLDER-3-derived AOD, AE, AODF and AODC varies from 668 to 1392. Part of this variability also depends on the percent of sea pixels in the area around the sites, which is lower for coastal (e.g. Burjassot or Rome) than insular stations (e.g. Alboran, Lampedusa or Gozo). Between 1 pixel in the case of inland stations of Rome and Burjassot, and up to 29 pixels in the case of the small remote island of Alboran were considered. Overall, the number of available AERONET observation days is important both for AOD and AE (18 223), and AODF and AODC (11 228). The number of days with AERONET-derived fNS was less significant (4976 data points), due to additional constrains in the inversion necessary to derive this parameter.
The number of available AERONET observations per site varied from 158 to 2059 for AOD and AE, and from 43 to 1333 for AODF and AODC, mainly due to partial functioning of the instruments or maintenance of the sites. At some stations, measurements started years after the beginning of POLDER-3 mission (e.g. 2011 for Alboran, 2013 for Gozo). Finally, the number of POLDER-3/AERONET coincident days available for analysis is 6421 for AOD and AE, 3855 for AODF and AODC, and 730 for the percentage of spherical coarse particles (fNS).
3.2.2 Coincidence with airborne observations
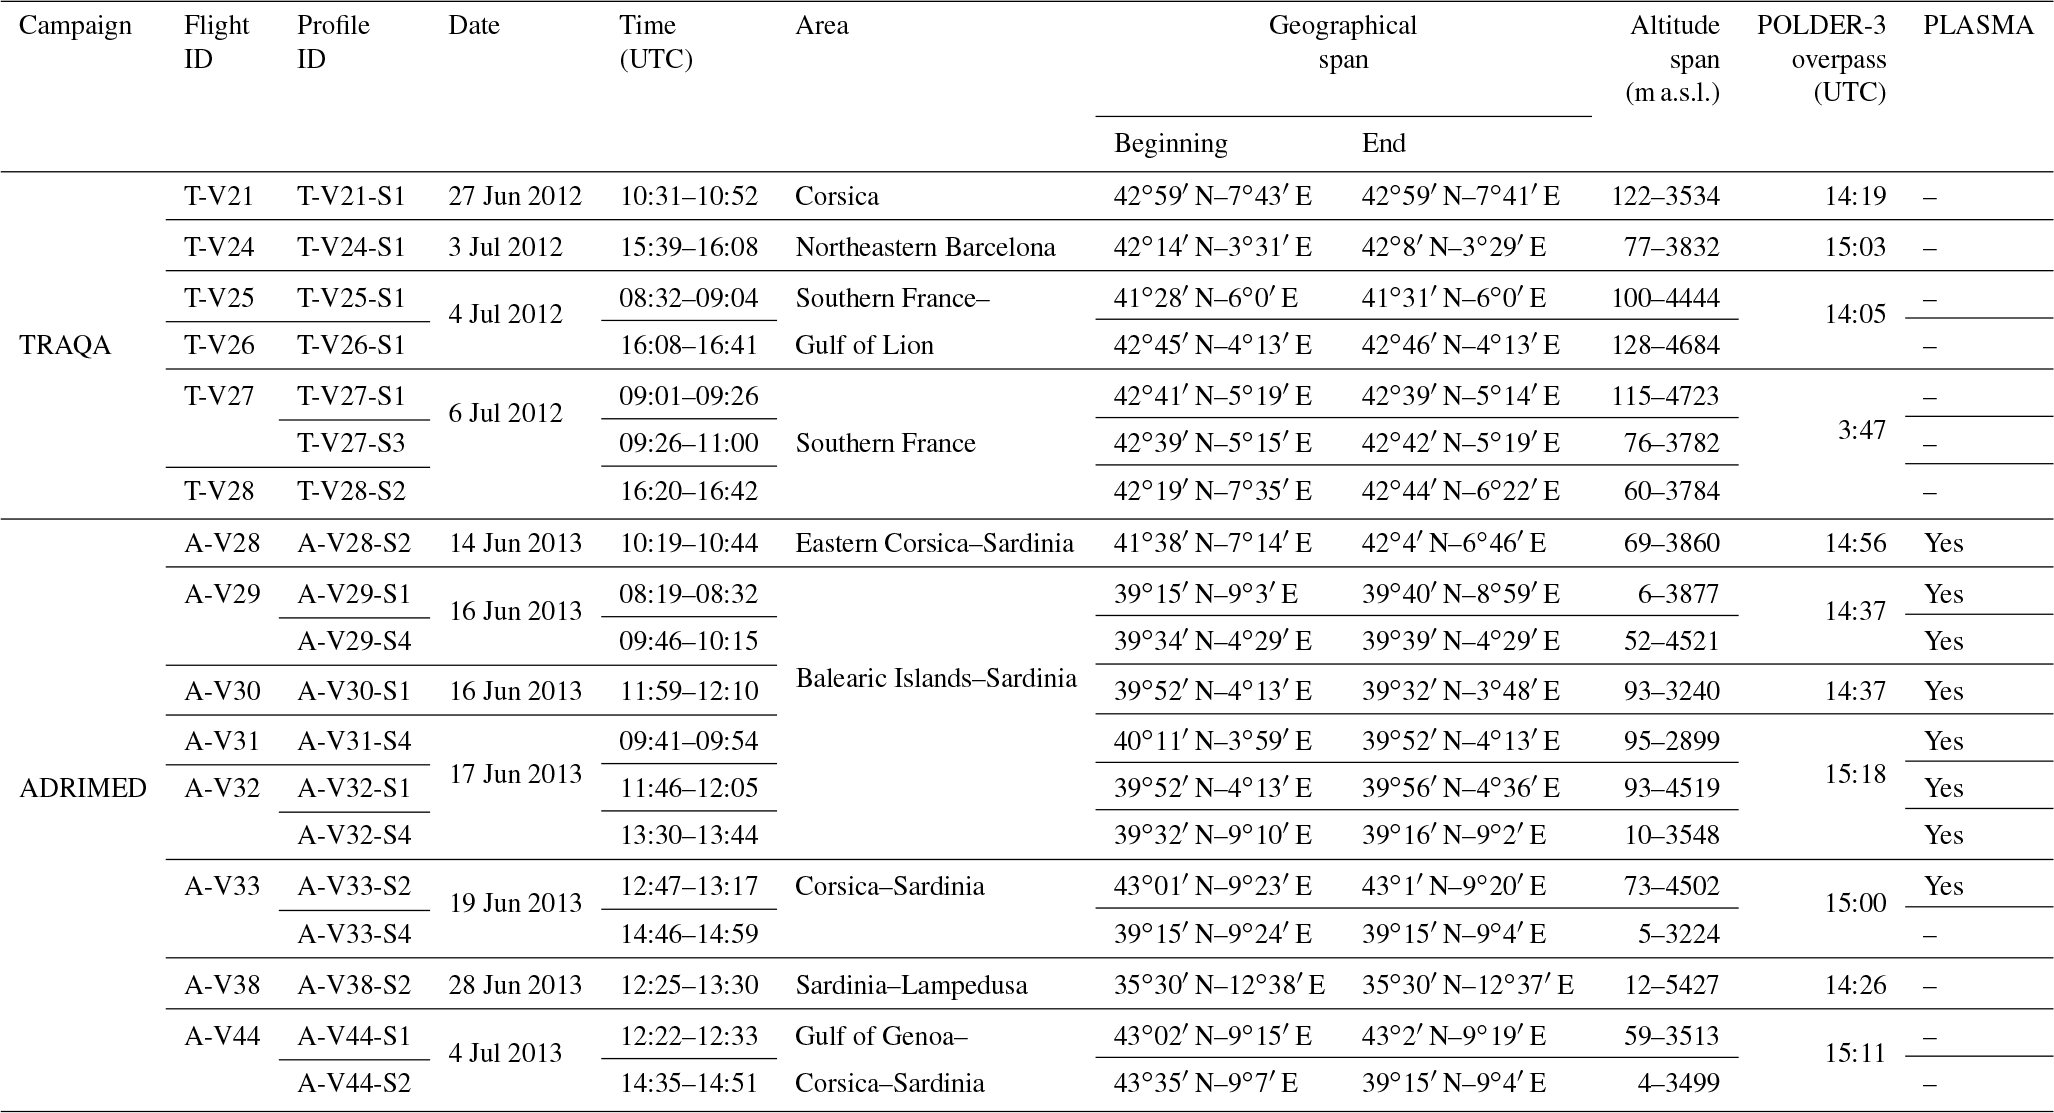
The comparison between POLDER-3 and airborne measurements was conducted for profile ascents or descents of the ATR-42 close in time with POLDER-3 overpasses. Flight tracks and profiles locations are shown in Fig. 2, whereas additional details (dates, geographical coordinates, altitude span and duration) are given in Table 2. Data from the PLASMA sun-photometer, operated only during ADRIMED, were available only on 8 profiles (also indicated in Table 2) for which the minimum flight altitude was as close as possible to the surface. The dataset was limited to ATR-42 profiles extending as much as possible over the column. To evaluate whether the aircraft profile sampled entirely or only partially the aerosol layers, we compared the AOD measured by PLASMA to that obtained by integrating the extinction profile of the CAPS-PMex instrument (not shown). By examining the AERONET time series, we also excluded episodes when the AOD had significantly varied in time between the POLDER-3 overpass and the aircraft profile. This mostly happened for cases when the aerosol optical depth exceeded 0.2 due to the transport of mineral dust (flights T-V22 and T-V23 during TRAQA and V31-S3 and V42-S2 during ADRIMED). The profiles discarded for comparison with POLDER-3 were used for the validation of the optical calculations presented in Sect. 4 (not shown in Table 2 nor Fig. 2).
Table 2List of vertical profiles made by the SAFIRE ATR-42 during the TRAQA and ADRIMED campaigns in coincidence with the passage of POLDER-3. For each profile the following is indicated: the flight number, the name of the profile, the date, the time period of the profile, the area covered by the flight, the geographical coordinates, the minimum and maximum altitude of the flight, and the hour of POLDER-3 overpass in UTC.
Prior to analysis, all in situ airborne data were synchronised and then averaged to 30 s to reduce the noise due to the native resolution of the measurements (1 to 6 s). POLDER-3 data were averaged over pixels within ±0.5∘ around the lowest altitude of each profile. In order to analyse the aerosol vertical stratification, we examined the magnitude of the scattering coefficient σscat at 550 nm as a function of altitude and its spectral behaviour, represented by the scattering Ångström exponent (AEscat) measured by the airborne nephelometer. As in previous similar studies (Pace et al., 2006; Formenti et al., 2011; Di Biagio et al., 2015, 2016; Denjean et al., 2016), the aerosol layers were classified into four categories (clear or background maritime, desert dust, pollution, and mixture), following the criteria reported in Table 3. The mixture category, indicating mixing between desert dust and pollution, as observed by Denjean et al. (2016), was further detailed to distinguish dust-dominated layers (AEscat between 0.5 and 0.75) and pollution-dominated layers (AEscat between 0.75 and 1).
Table 3Criteria for classification of aerosol layers encountered on the vertical profiles of TRAQA and ADRIMED, based on nephelometer measurements of the scattering coefficient (σscat) at 550 nm and on its spectral dependence (AEscat) between 450 and 700 nm.
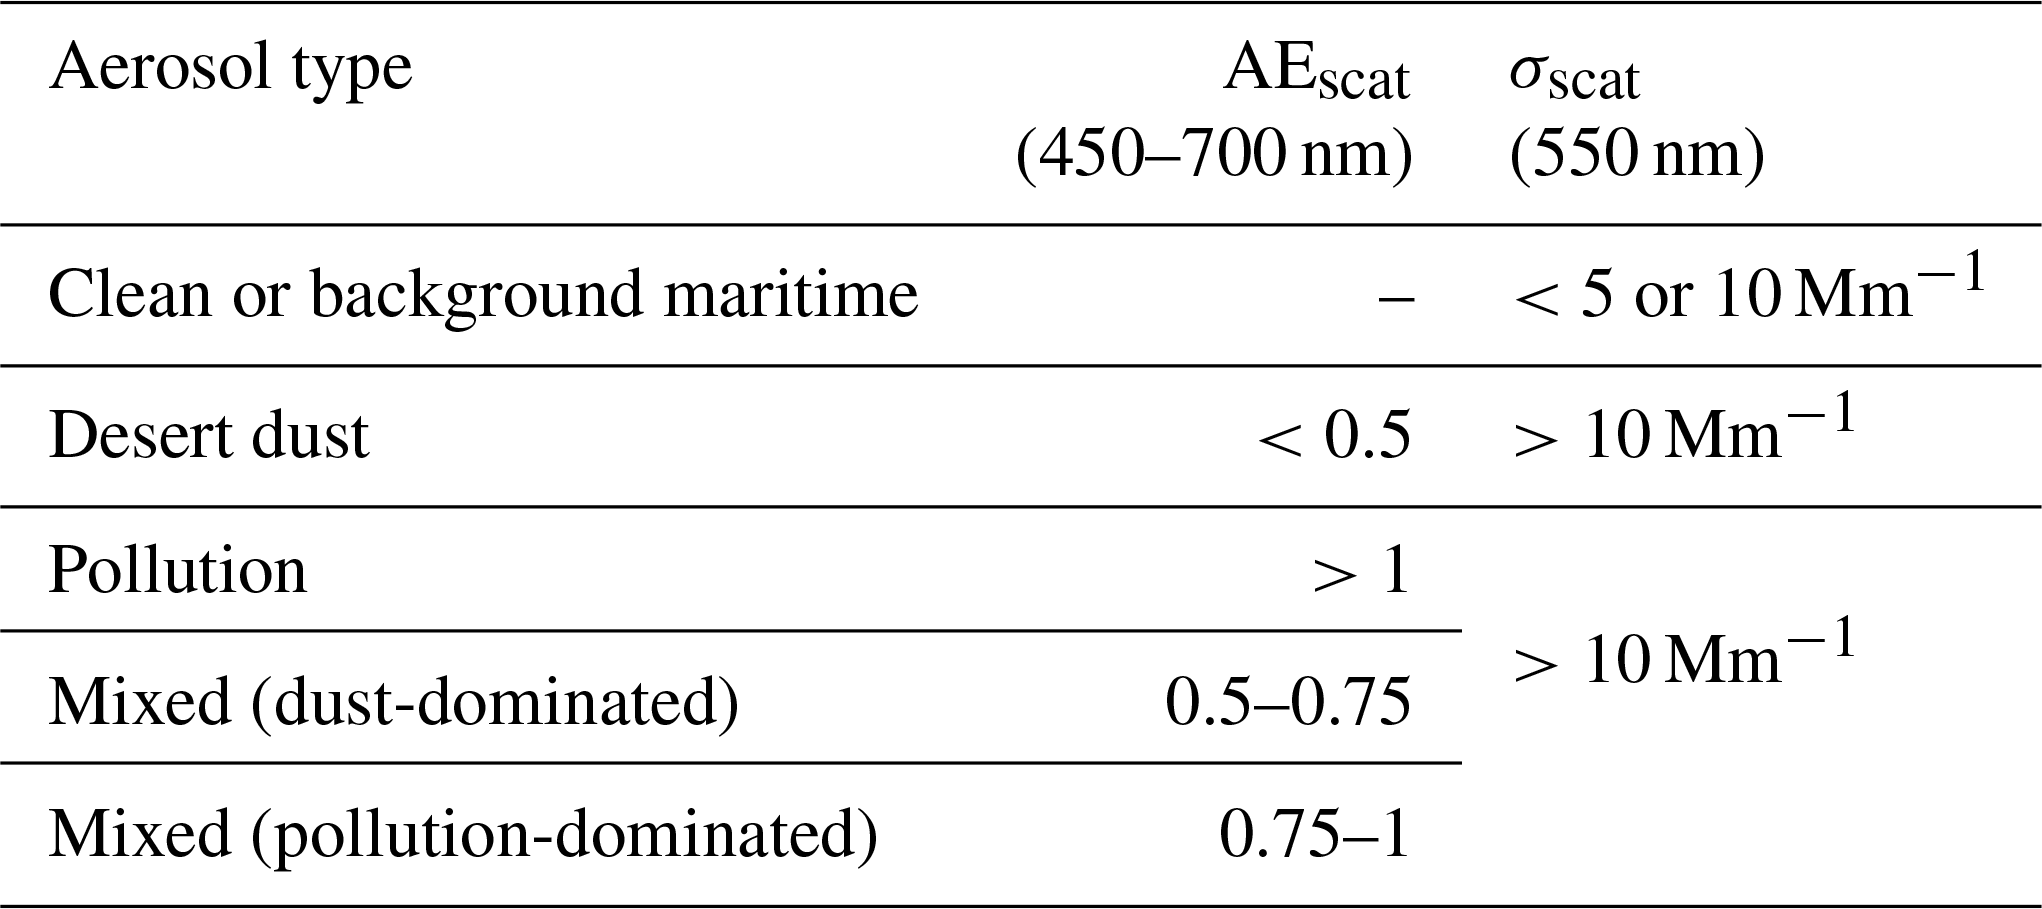

Figure 2Flight tracks of the ATR-42 aircraft (coloured lines) during the TRAQA and ADRIMED campaigns. Only flights relevant to this study are presented. The location of the profiles are coincidental at their lowermost altitude, with a POLDER-3 overpass shown by a circle. During the TRAQA campaigns, 7 profiles were retained for comparison on 6 flights. During the ADRIMED campaign, 12 profiles occurring during 9 flights were retained. In this second case, symbols are not always visible due to overlapping.
3.3 Statistical indicators
The agreement between the POLDER-3, AERONET and airborne datasets was quantified by several evaluation metrics, including the number of matchups (N), the linear correlation coefficient (R), the slope (S) and intercept (I) of the linear regression, the root mean square error (RMSE), and the bias (B), representing their mean difference.
where x and y are generic datasets, and n the number of pairs of compared values.
Additional metrics are provided by the “fraction of accurate retrievals” (Gfrac) defined by Bréon et al. (2011). This quantity is defined as
and quantifies the fraction of POLDER-3 data points for which the absolute difference (Δ) between reference and evaluated data is lower than the estimated error (EE).
In accordance to Bréon et al. (2011), EE was calculated as
and applied to all the AOD advanced products. Because Gfrac is only appropriate for large datasets whose number of data points exceeds 100 (Bréon et al., 2011), it was calculated only for comparisons with AERONET data.
4.1 Evaluation of the total aerosol optical depth
Figure 3 shows the results of comparison of the AOD retrieved by POLDER-3 between 2005 and 2013 with respect to the 6421 observations at the 17 AERONET stations and those on the vertical profiles of the ChArMEx campaigns (PLASMA sun-photometer and calculations from the in situ size distributions).
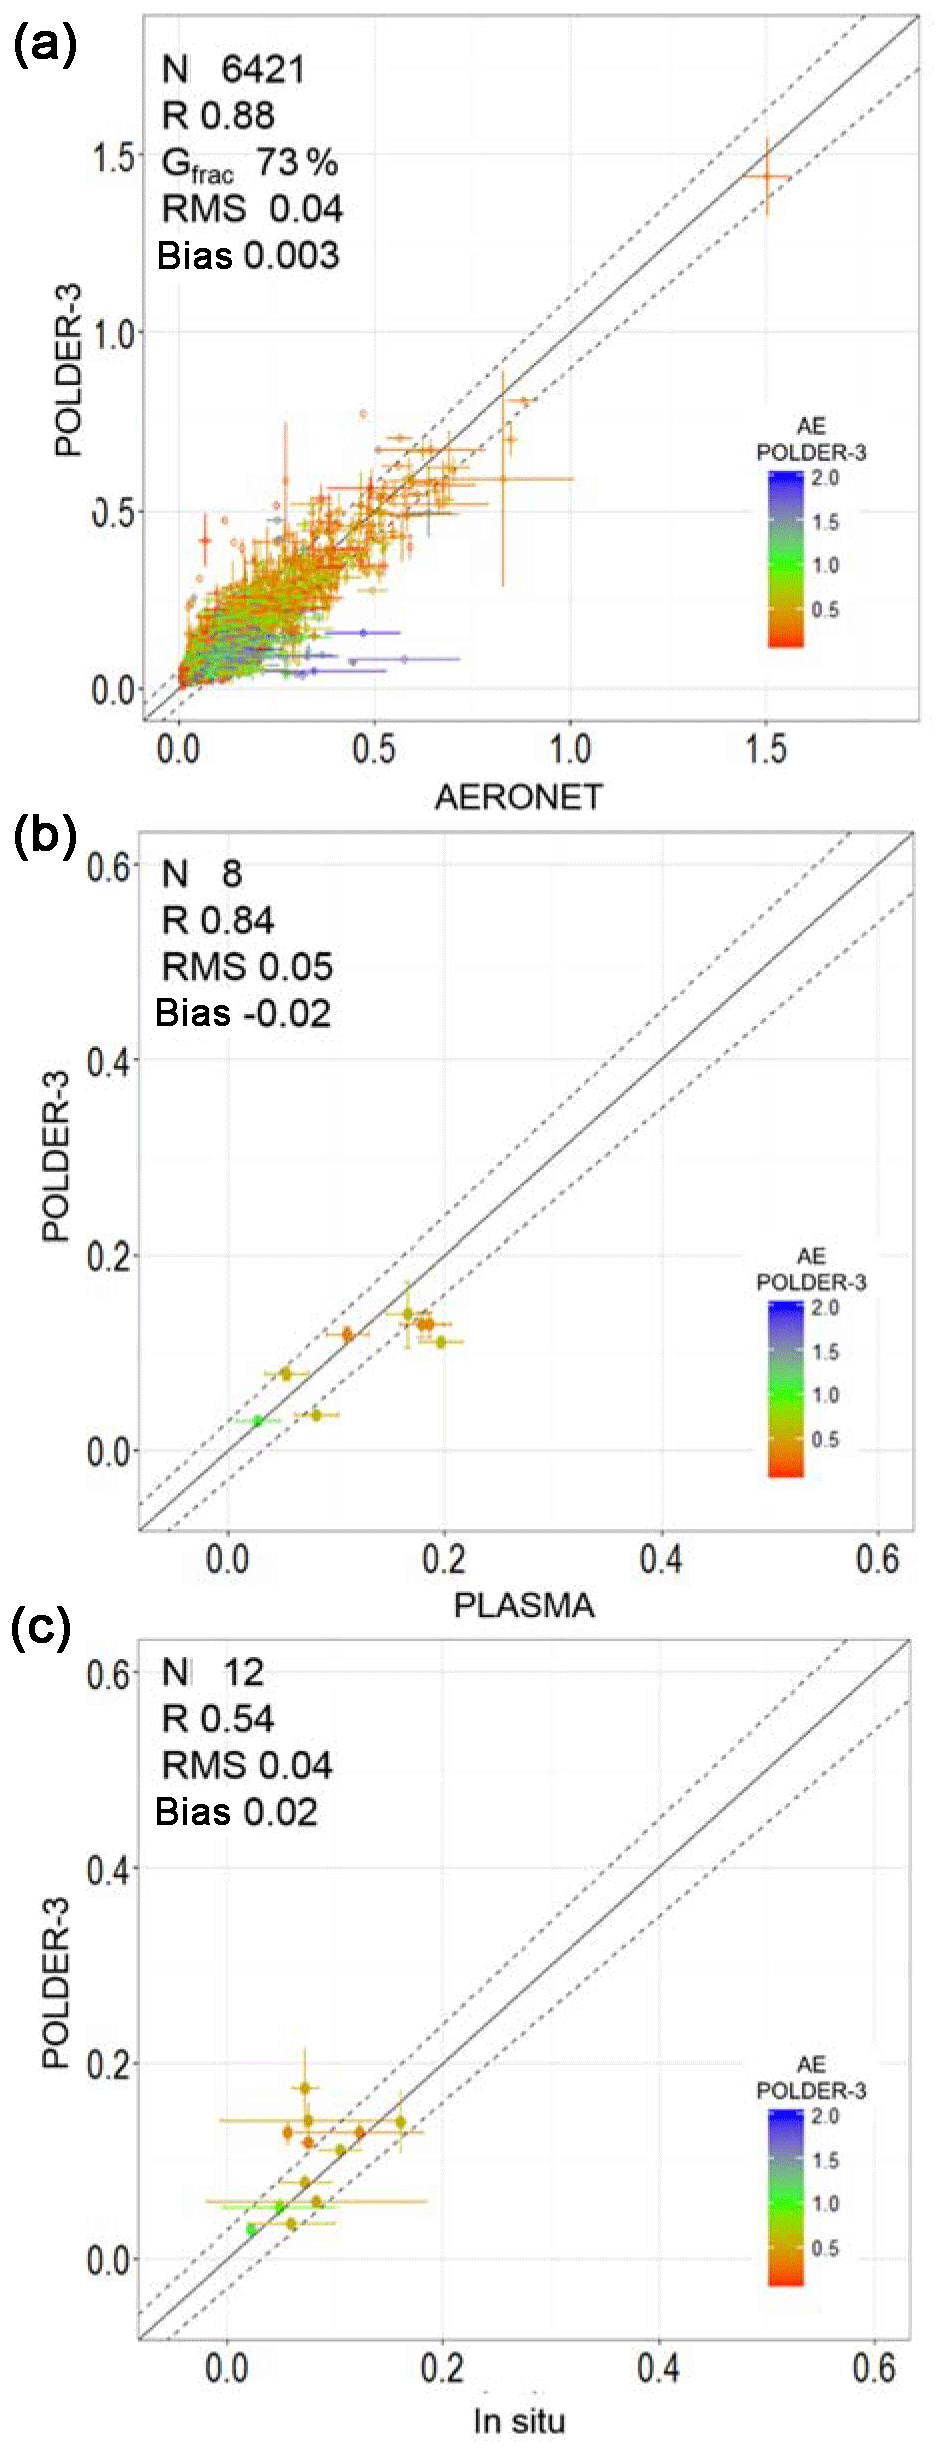
Figure 3Scatter plots of daily AOD retrieved by POLDER-3 at 865 nm with respect to (a) coincident and co-located values from the 17 ground-based AERONET sites at 870 nm; (b) airborne PLASMA sun-photometer operated at 865 nm during ADRIMED; and (c) results of the optical calculations at 865 nm according to Fig. 1 from airborne measurements during TRAQA and ADRIMED. The solid line is the bisector. The dashed lines represent the limits indicated by the Gfrac parameter. The characteristics of the linear correlation (number of points N, correlation coefficient R, Gfrac, RMSE, and bias) are also reported.
The comparison with AERONET shows a good correlation (regression coefficient R=0.88, Gfrac=73 %), with a statistically low dispersion and bias (RMSE =0.04, B=0.003). In total, 27 percent of the observations do not meet the criteria of the Gfrac parameter. Cases outside the Gfrac boundary were characterised by large standard deviations, either because the spatial distribution of AOD was heterogeneous in the area of the pixels surrounding the AERONET sites, or because it varied significantly on the time window of ±1 h around the POLDER-3 overpass. In our dataset, the highest value of AOD retrieved by POLDER-3 was 1.4 (±0.1) during a desert dust transport event over Lampedusa observed on 25 April 2011. This is the only event coincident with an AERONET measurement (1.50±0.06) with POLDER-3 AOD >1.
Figure 3 also shows the comparison with the PLASMA observations and with the calculations initiated by the measured airborne number size distributions.
On those, the AOD did not exceed 0.2, whereas AE ranged from 0.31±0.07 to 1.09±0.08, indicating that these cases are representative of aerosols of different origins. The comparison was also very satisfactory and confirmed the more extensive results from the comparison with AERONET-derived AODs. POLDER-3 provides higher values of AOD for mineral dust (lowest AE values) compared to those calculated from in situ aerosol measurements, which could reflect an underestimate of the coarse mode distribution from the in situ aircraft measurements. On the other hand, POLDER-3 tends to underestimate AOD with respect to PLASMA at low AE values, resulting in a negative bias of the correlation (). In both cases, RMSE remained low and below 0.05.
4.2 Evaluation of fine and coarse aerosol optical depth
4.2.1 Comparison with AERONET observations
Figure 4 shows the comparison between POLDER-3 and AERONET for AODF and AODC. AODF remained below 0.25, smaller than AODC, which reached 0.8. The correlation coefficient for AODC (R=0.81) is closer to the correlation coefficient for AOD (0.88) than that for AODF (0.63). The agreement between POLDER-3 and AERONET is confirmed by the Gfrac values of 74 % for AODC and 88 % for AODF, the low statistical bias (−0.007 for AODF and 0.01 for AODC), and the moderate dispersion (RMSE values between 0.02 for AODF and 0.04 for AODC). The weaker correlation and the dispersion observed for AODF can be attributed to the difficulty in retrieving low values of optical depth. Additionally, Tanré et al. (2011) pointed out that differences could arise by the definitions of the cut-off diameter (Dcut-off) used in the POLDER-3 and AERONET retrievals to estimate AODF. In the AERONET retrievals, AODF is calculated from the fine mode of the particle size distribution defined for a value of Dcut-off forced between 0.44 and 0.99 µm. In the POLDER3 algorithm, AODF is calculated from the full particle size distribution of the retrieved fine mode, without cut-off. However, because of its use of polarisation, POLDER-3 is the most sensitive to particles smaller than 0.6–0.8 µm in diameter (Tanré et al., 2011 and references therein).
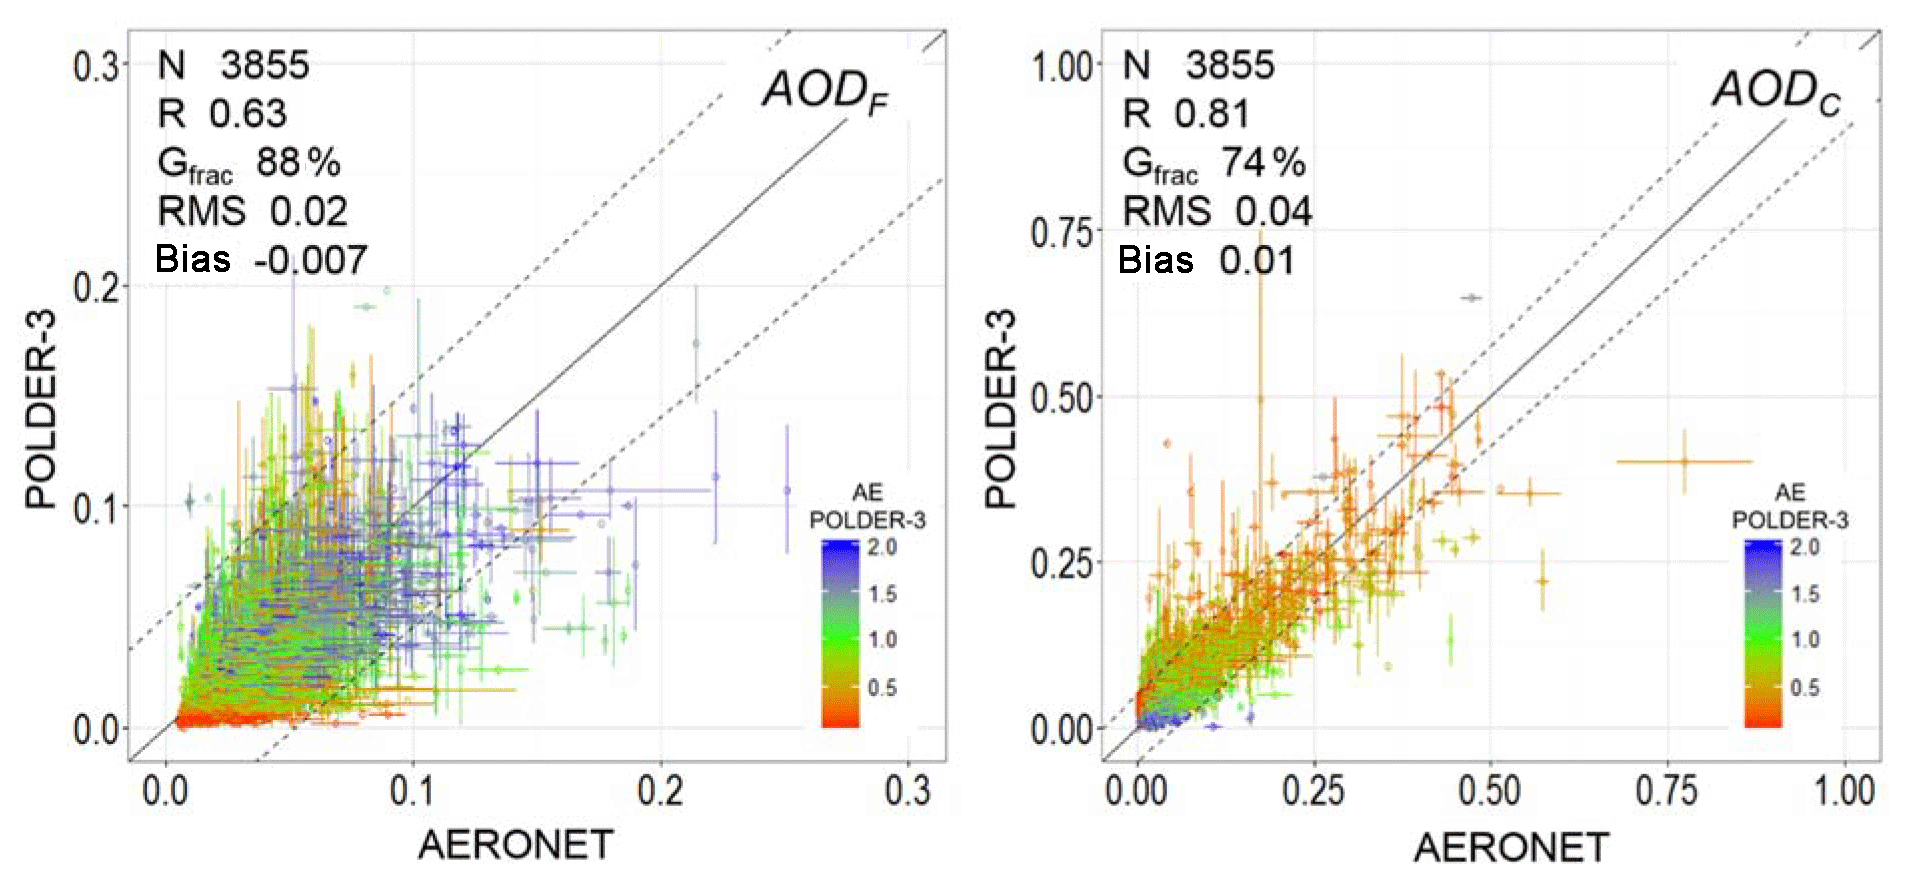
Figure 4Scatter plots of daily AODF and AODC retrieved by POLDER-3 at 865 nm as a function of coincident AERONET values at 870 nm for the 17 sites of the western Mediterranean Sea. The solid line is the bisector. The dashed lines represent the limits indicated by the Gfrac parameter. The characteristics of the linear correlation (number of points N, correlation coefficient R, Gfrac, RMSE, and bias) are also reported. Note that, as discussed in Sect. 2.1 and 2.2, the definitions of AODF and AODC by POLDER-3 and AERONET are not the same.
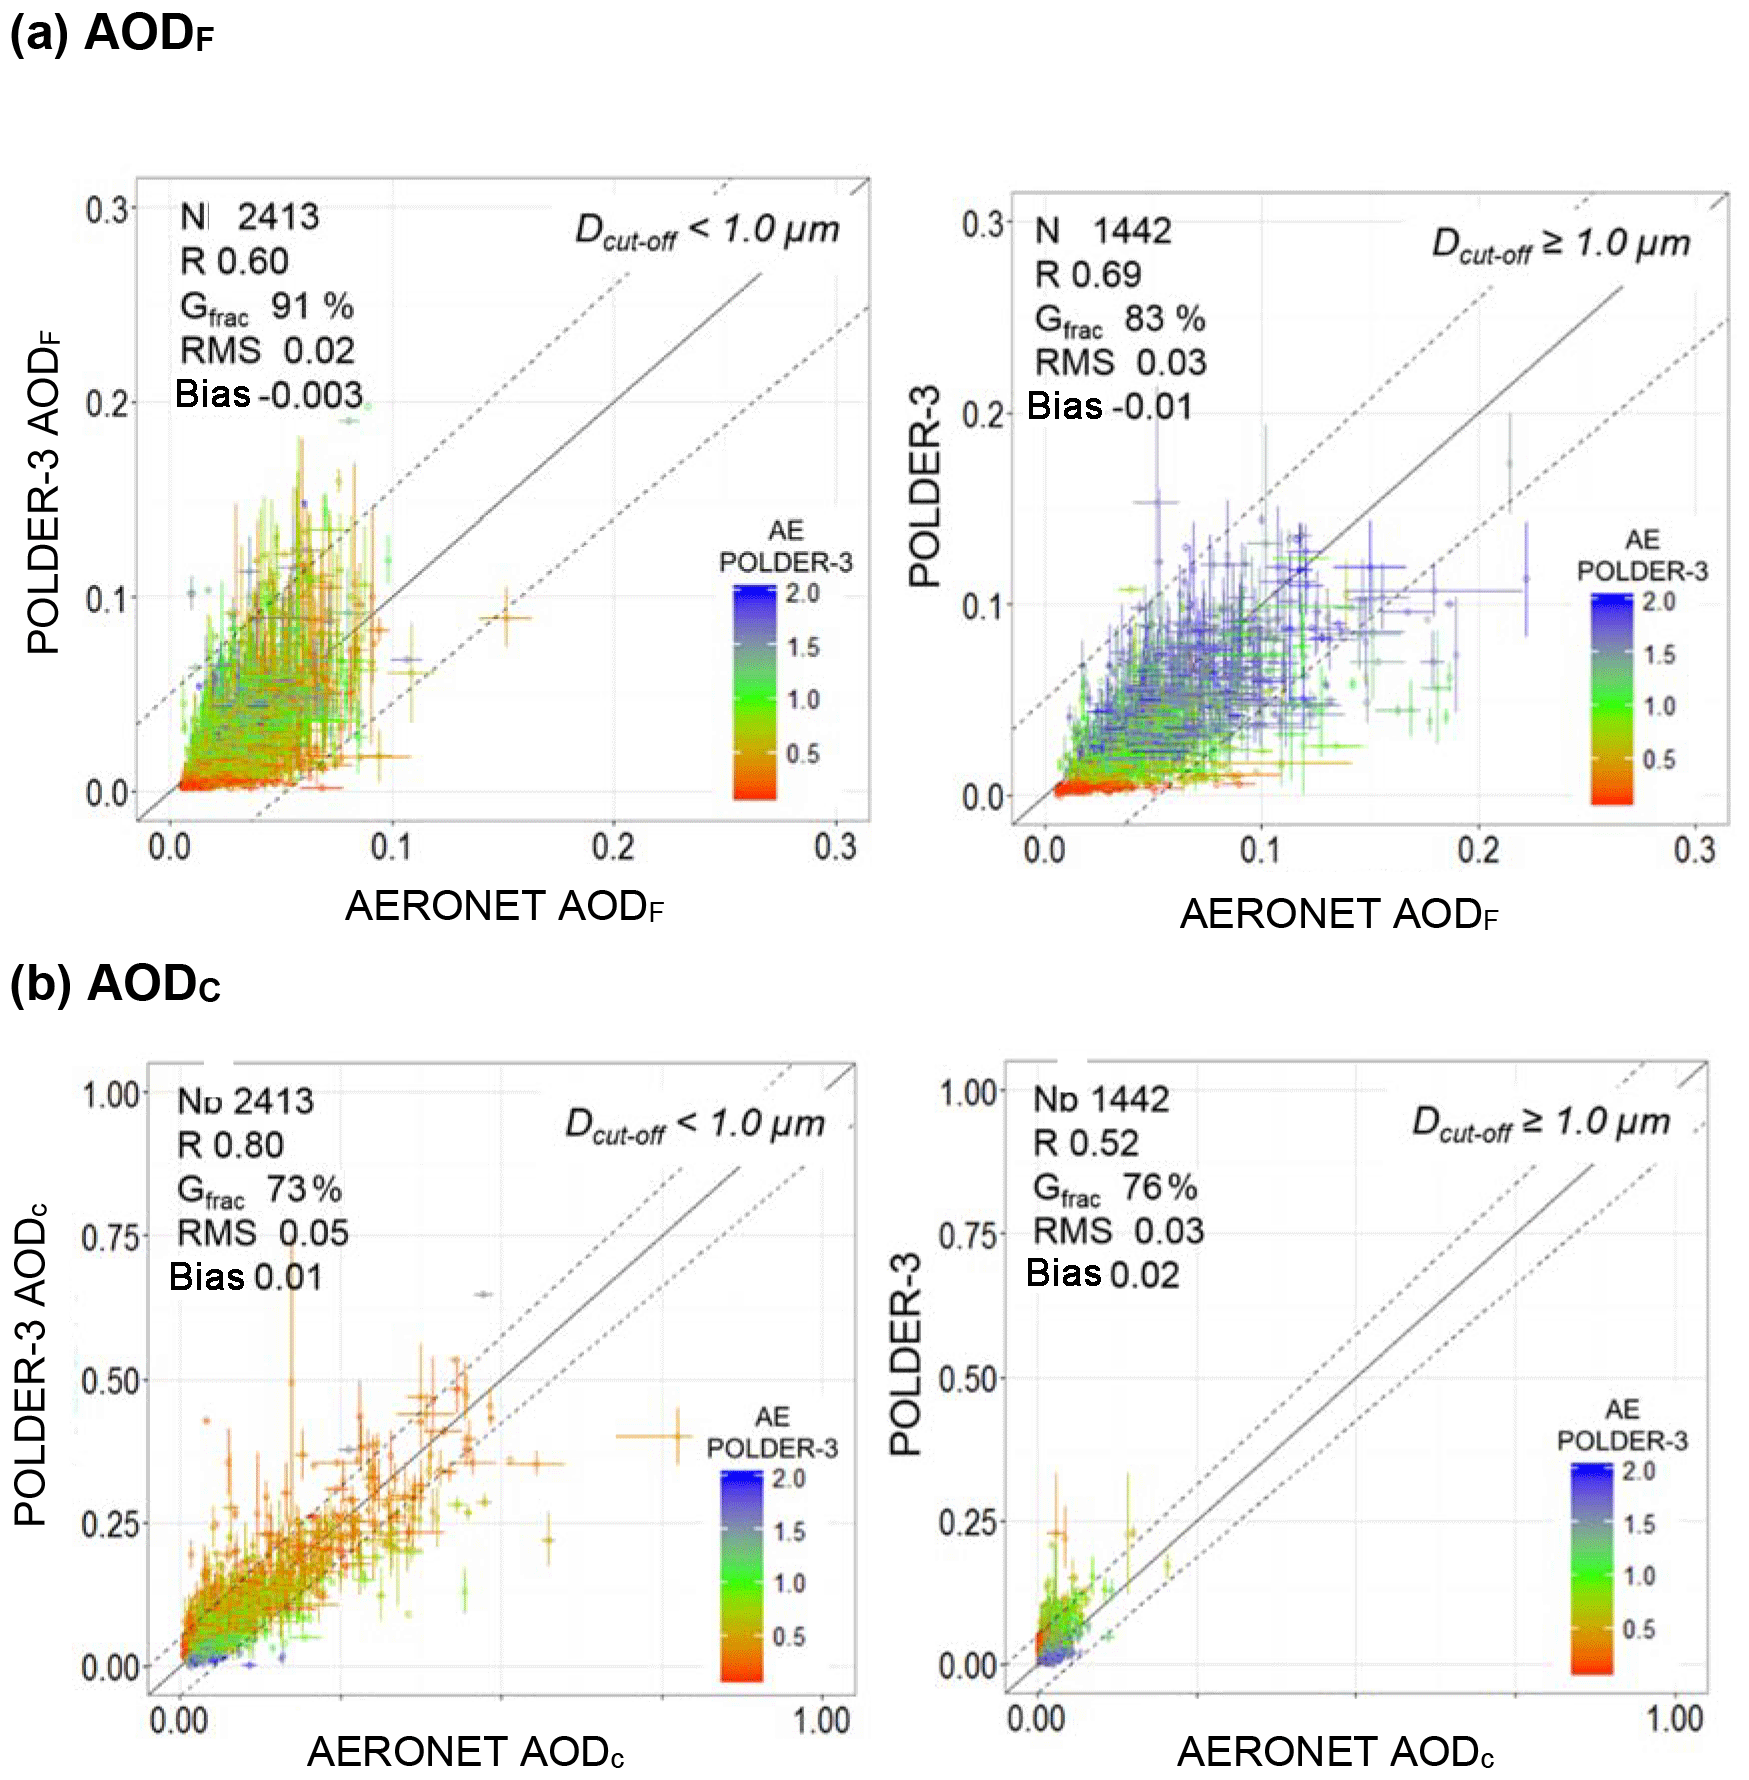
Figure 5Scatter plots of daily AODF (a) and AODC (b) retrieved by POLDER-3 at 865 nm as function of coincident AERONET values at 870 nm at the 17 sites of the western Mediterranean Sea. The AERONET AODF and AODC are calculated from the fine and coarse modes of the retrieved volume size distribution defined as below and above a threshold diameter (Dcut-off) corresponding to the minimum of the size distribution. The Dcut-off is not fixed but can vary between 0.44 and 0.99 µm. The figure presents cases corresponding to AERONET retrievals yielding a separation of the fine and coarse modes of the volume distribution at Dcut-off<1.0 µm (left) and days with AERONET Dcut-off≥1.0 µm (right). The solid line is the bisector. The dashed lines represent the limits indicated by the Gfrac parameter. The characteristics of the linear correlation (number of points N, correlation coefficient R, Gfrac, RMSE, and bias) are also reported.
In Fig. 5, we explore the relevance of this difference in the comparison of AODF and AODC by further separating days when AERONET Dcut-off<1.0 µm and days when Dcut-off≥1.0 µm. The threshold value of 1.0 µm corresponds to the Deff of all the fine modes in the POLDER-3 LUT. Cases with Dcut-off<1.0 µm were more numerous (2413 days), and showed a better agreement (, Gfrac=91 %, RMSE =0.02, R=0.60). Data corresponding to Dcut-off≥1.0 µm were less numerous (1442 days). Whereas the correlation improved slightly (R=0.69 vs. R=0.60), the dispersion increased (, RMSE =0.03) due to the appearance of points for which AERONET AODF almost doubled that of POLDER-3. Colouring the data points by AE showed that the data points with Dcut-off below 1.0 µm mostly corresponded to aerosols with a weak-to-moderate spectral dependence (low AE), whereas cases with Dcut-off above 1.0 µm mostly (but not exclusively) corresponded to aerosols with a moderate-to-strong spectral dependence (high AE).
The size cut-off definition also affects the comparison for AODC. For Dcut-off<1.0 µm, AODC values were high and the correlation was significant. Conversely, AODC remained low (0.2) when Dcut-off≥1.0 µm. This is consistent with the fact that the contribution of AODC to AOD decreases as the Dcut-off increases (Fig. S2). Figure 5 shows that discriminating data on the basis of Dcut-off results in attributing AODF and AODC to different aerosol types.
4.2.2 Comparison with airborne measurements
To further understand the previous comparisons, POLDER3 AODF and AODC were recalculated from the measured number size distributions (Eq. 4) by varying the lower limit of the size integration between 0.4 and 1.0 µm in diameter with a step of 0.2. Results are shown in Fig. 6. As expected, the comparison for AODF is very sensitive to the size range. The best agreement between the retrieved and the calculated AODF is obtained for Dcut-off between 0.6 and 0.8 µm, both showing high correlation coefficient R and low RMSE. Conversely, the AODC comparison is almost independent of the value of Dcut-off but more affected by the upper limit of the size range in Eq. (4).
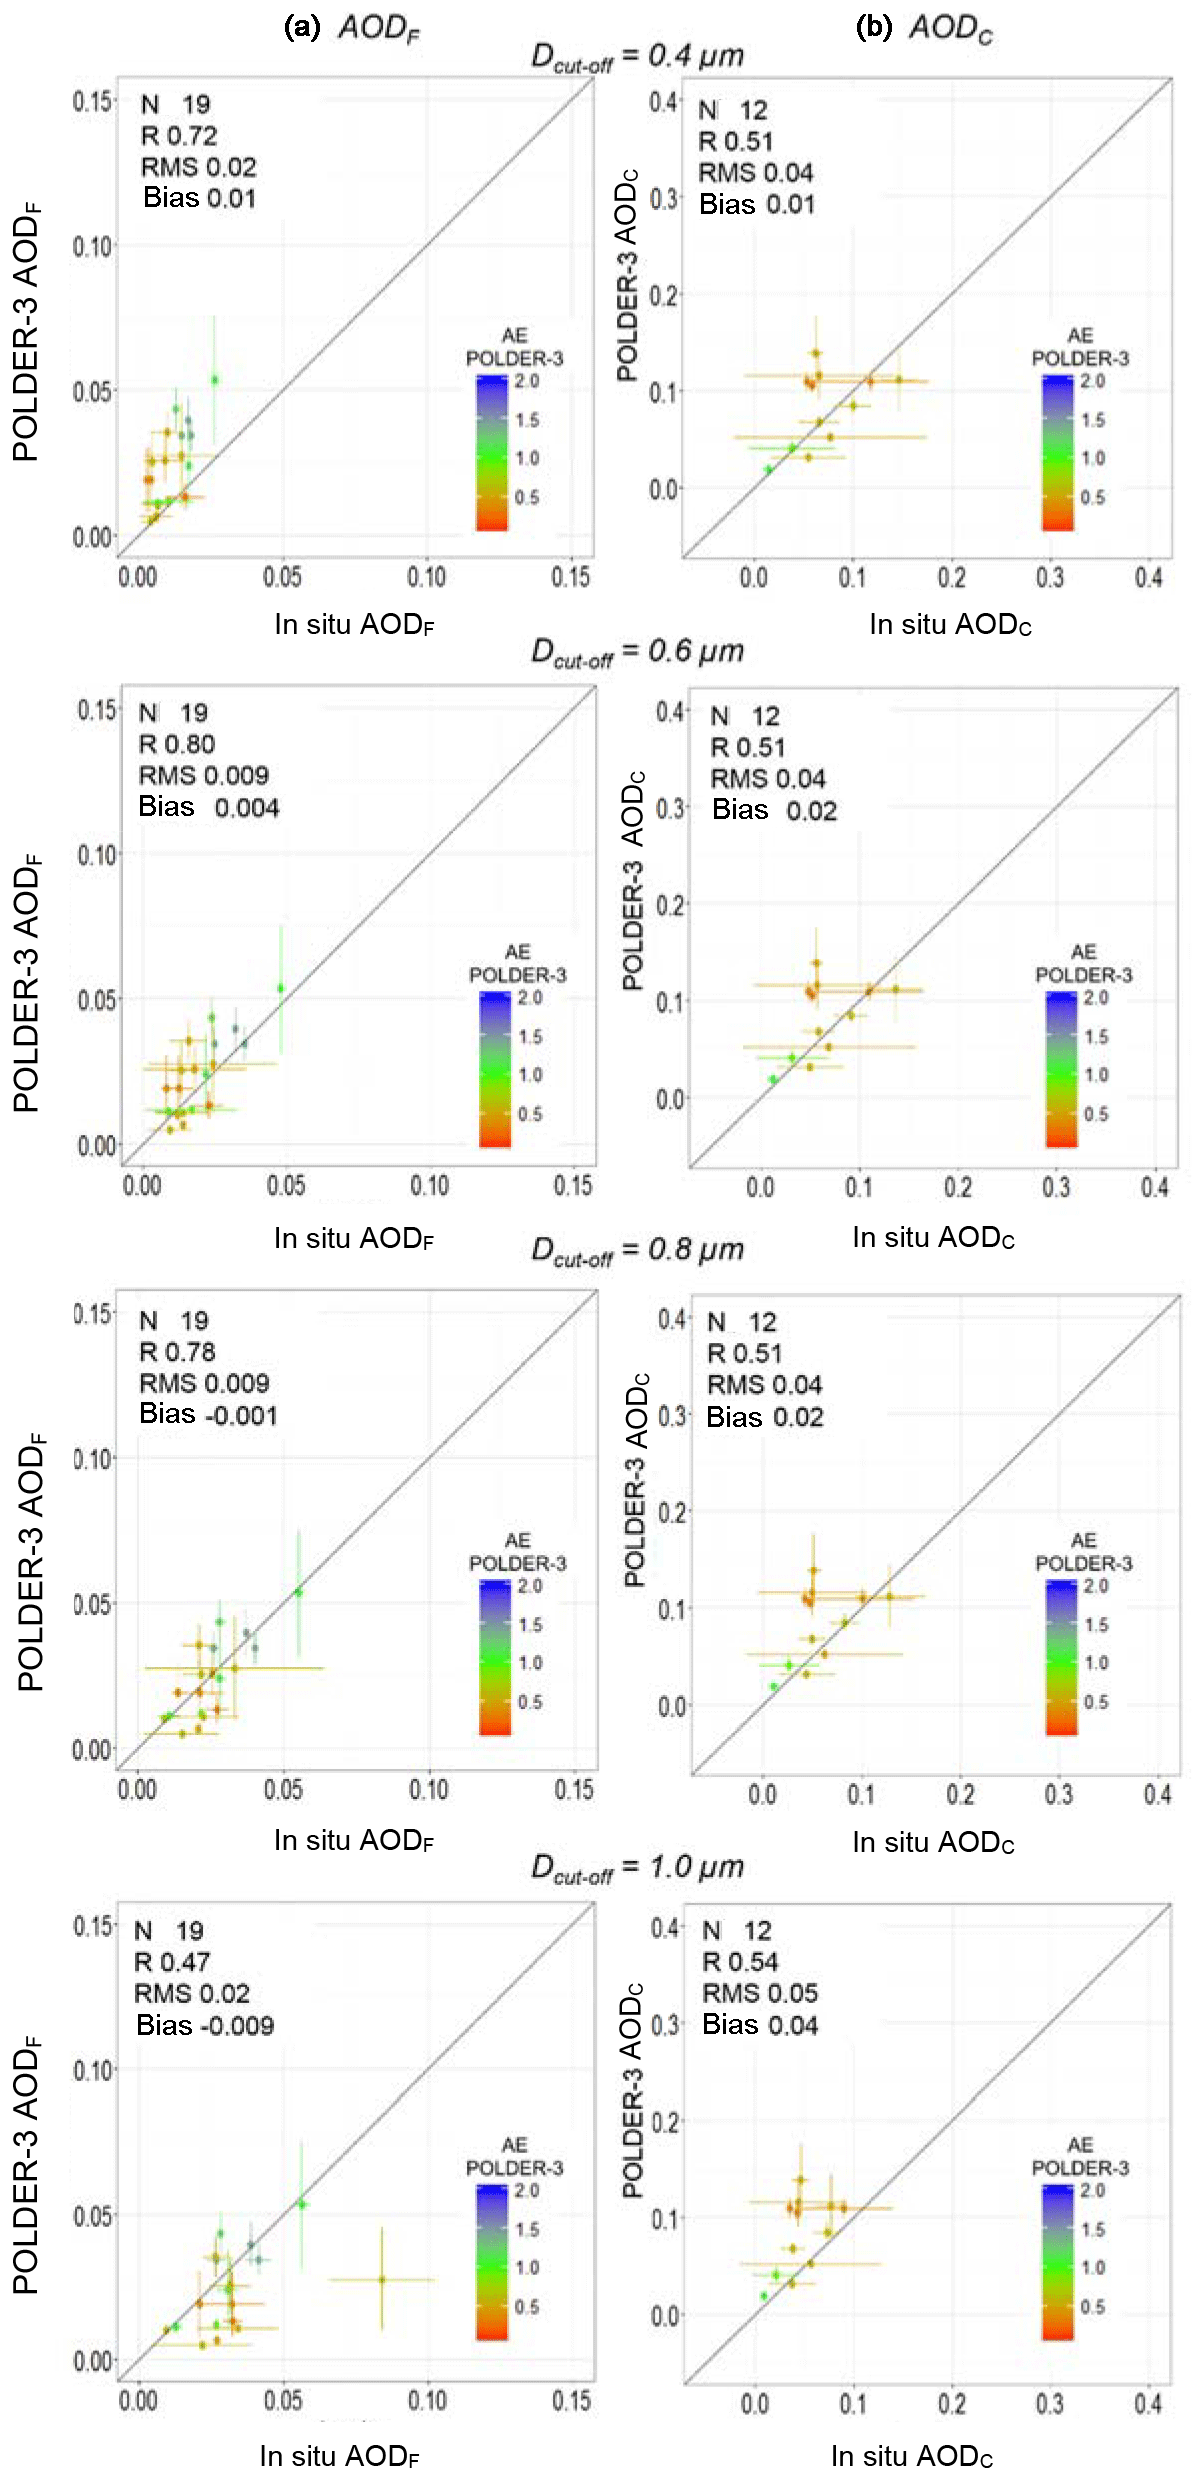
Figure 6Scatter plots of AODF (a) and AODC (b) retrieved by POLDER-3 at 865 nm and compared to values obtained by optical calculations from airborne measurements of the number size distribution. Panels, from top to bottom, represent the results of the calculations when varying the cut-off diameter between 0.4 and 1.0 µm. Characteristics of the linear correlation are also reported (number of points N, correlation coefficient R, RMSE, and bias). Error bars of in situ measurements were calculated from the optical calculation and the instrumental uncertainties. The solid line is the bisector.
4.3 Evaluation of the Ångström exponent
Figure 7 shows the comparison of AE retrieved by POLDER-3 with values obtained by AERONET, PLASMA and the optical calculations. The comparison with AERONET was restricted to days when the POLDER-3 AOD exceeds 0.1 (2031 out of the 6421 data points), in order to take into account only those values with relative uncertainties within 50 %. The comparison showed a significant spread and a moderate correlation coefficient (R=0.70). However, POLDER-3 tends to underestimate values of AE larger than 1 with respect to AERONET, and overestimate values smaller than 0.5, yielding a significant bias (−0.11). The values obtained by POLDER-3 compare well with the airborne observations of PLASMA (R=0.84), but less well to the optical calculations (R=0.42). In both cases, the bias is positive (0.1 with PLASMA and 0.2 with in situ AE). This fact, observed previously by Goloub et al. (1999) and Tanré et al. (2011), can be explained by considering that the values of AE are calculated from the retrieved AOD at 865 and 670 nm (Eq. 1), which, in the ocean retrieval algorithm of POLDER, is obtained by the fit of measured radiances. The current aerosol models in the LUT (modal diameters and real part of the refractive index) provide AE values in the range −0.18 to 3.3. However, the extreme values are obtained only if the size distribution allows the matching of the observed radiances and consists of a single mode of non-spherical coarse particle (modal diameter of 0.9 µm for ) or a single mode of fine spherical particles (modal diameter of 0.08 µm for AE=3.3). Figure 8 compares the scatter plots of AE and AOD obtained for the coincident POLDER-3 and AERONET datasets. The tendency of POLDER-3 to underestimate AE shows up clearly by the absence of values of AE larger than 2.5, which, conversely, are retrieved by AERONET. On the other end of the spectrum, values down to −0.5 are found in the AERONET dataset when POLDER-3 hardly retrieves negative values. Both POLDER-3 and AERONET show a trend with the largest AOD values at lower AE values. However, high AOD values (>0.9) are found with POLDER but not AERONET, and are all except one associated to relatively low AE (<1). Because the cloud screening of AERONET is relatively robust thanks to triplet measurements (Smirnov et al., 2000), these outliers may result from undetected cloud contamination in the POLDER algorithm.
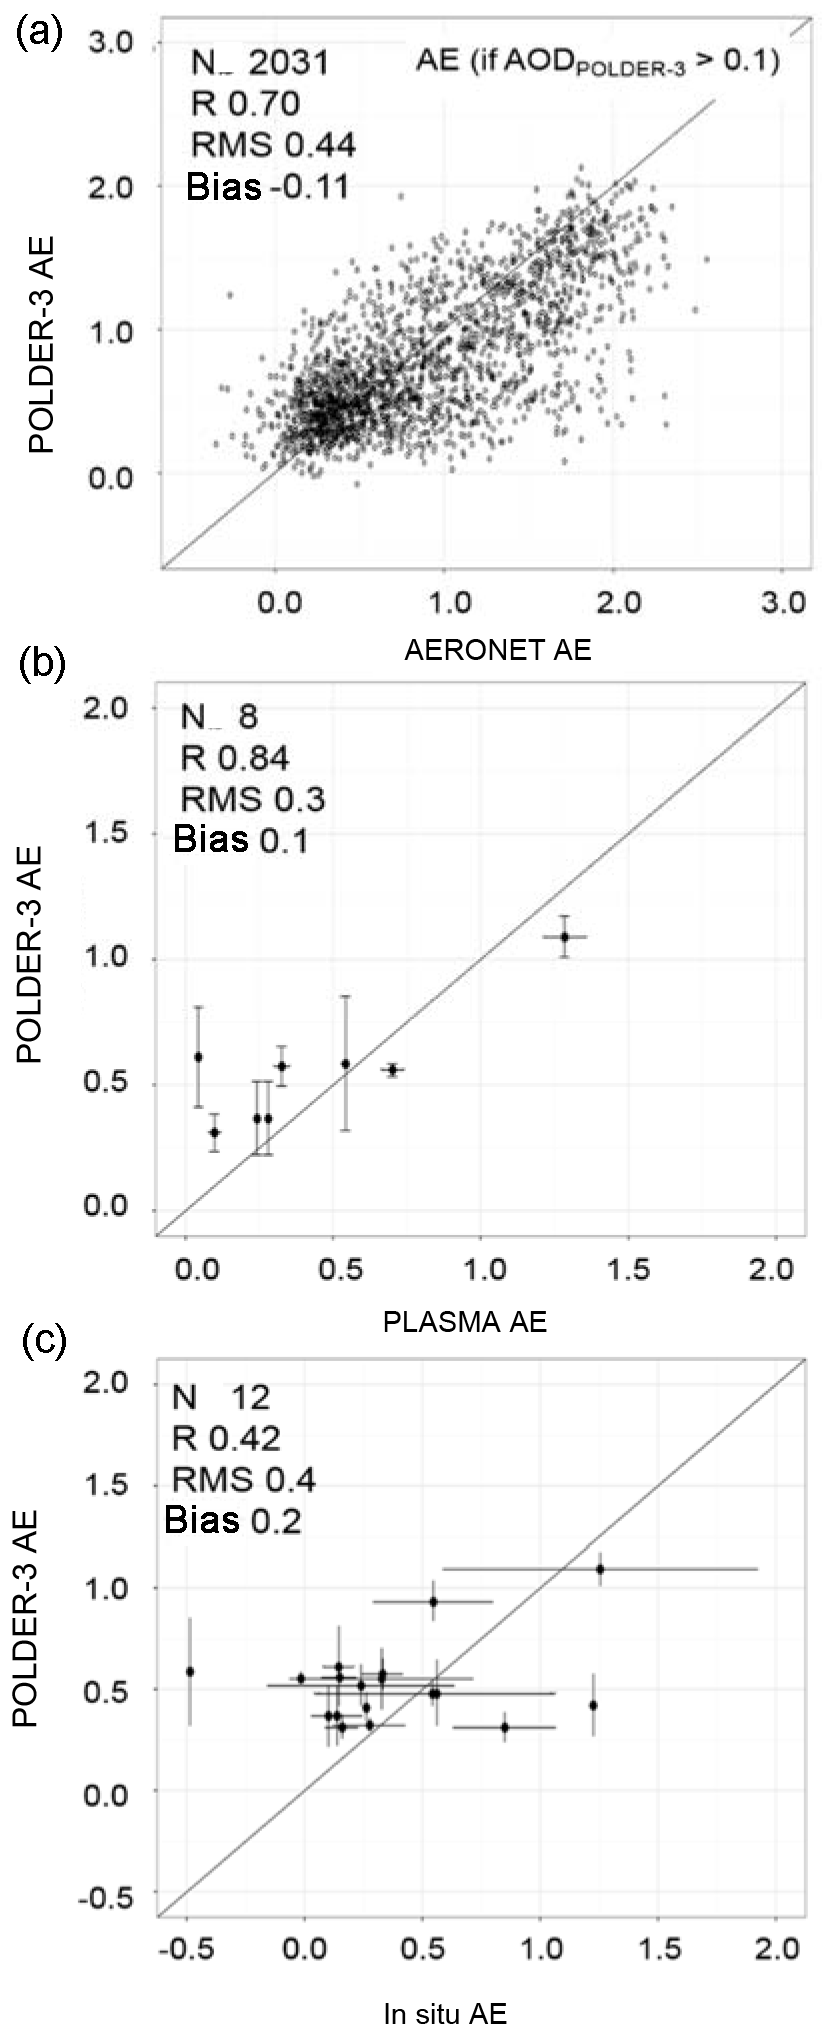
Figure 7Scatter plots of the Ångström exponent (AE) retrieved by POLDER-3 between 865 and 670 nm with respect to coincident and collocated values from (a) the 17 ground-based AERONET sites between 870 and 675 nm; (b) airborne PLASMA sun-photometer operated at 870 and 675 nm during ADRIMED; (c) optical calculations at 865 and 670 nm from number size distributions measured in situ during TRAQA and ADRIMED. Only AERONET values corresponding to POLDER-3 AOD larger than 0.1 are considered. To facilitate the reading, the standard deviations of the AERONET values are not represented. Characteristics of the linear correlations are also reported (number of points N, correlation coefficient R, RMSE, and bias).
4.4 Evaluation of aerosol sphericity
When the geometrical conditions of observations are favourable, the coarse mode optical depth (AODC) retrieved by POLDER-3 is quantified and apportioned into a spherical and a non-spherical fraction (AODCS and AODCNS, respectively). These products are potentially very useful in discriminating the mineral dust contribution, dominated by non-spherical coarse particles (e.g. Dubovik et al., 2002; Chou et al., 2008), when marine aerosols can be considered as spherical at relative humidities characteristics of coastal and open-sea sites (Sayer et al., 2012a, b).
As a prerequisite, we investigated the comparison between POLDER-derived fCNS and fNS estimated by AERONET. As a reminder, fCNS is the percent fraction of non- sphericity in the coarse mode; that is, while fNS is the percent of non-sphericity of the total AOD. In the operational ocean algorithm, fCNS can only take discrete values equal to 0, 0.25, 0.50, 0.75, and 1. The averaging process produces intermediate values when there is local variability between the pixels around a given AERONET station
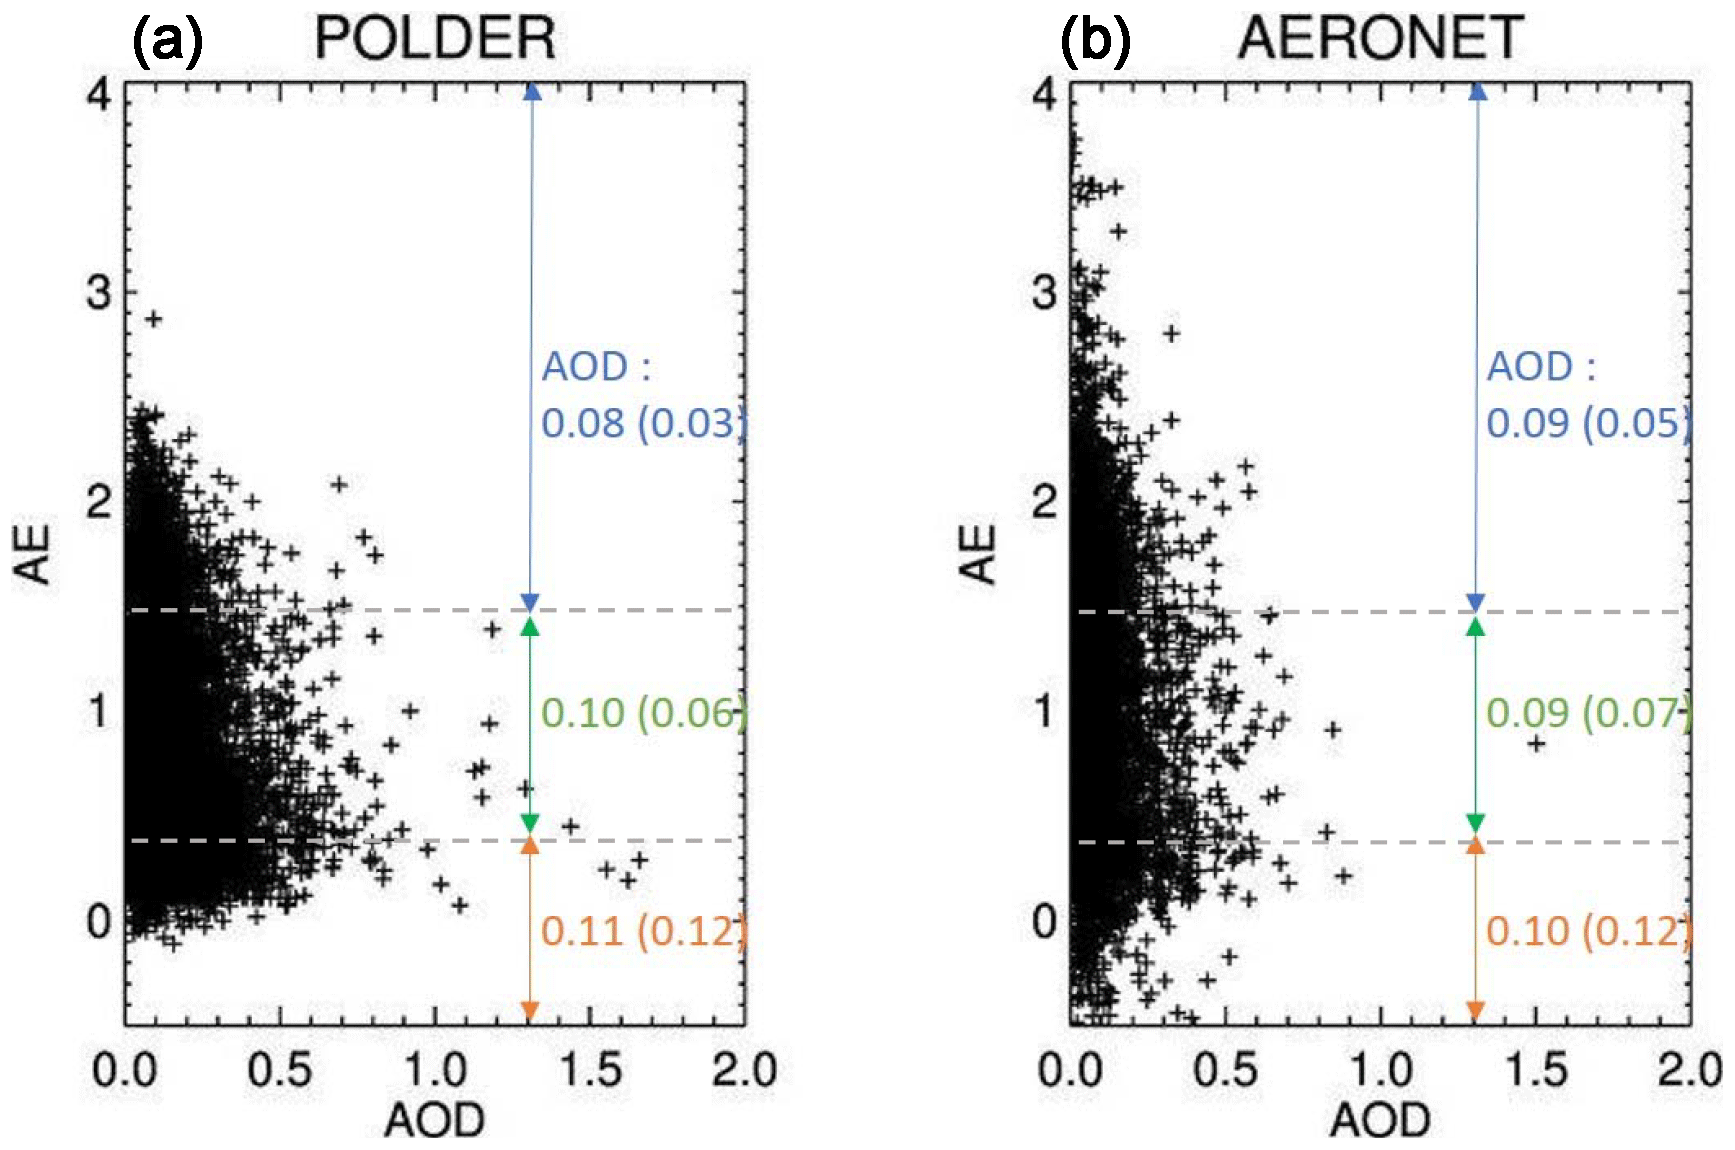
Figure 8Scatter plot of AE vs. AOD retrieved by POLDER-3 (a) and AERONET (b) on coincidental days (N=6421) for the 17 stations of the western Mediterranean Sea. Mean and standard deviations (in brackets) of AOD obtained by classifying the air masses into pollution (blue, AE≥1.5), mixed (green, ) and desert dust (orange, AE≤0.5) according to Pace et al. (2006) are shown.
In general, the POLDER-3 fCNS and the AERONET fNS are poorly correlated. The correlation coefficient R is 0.29 for the coincident data points of all the 17 stations (N=730, Table 1). At individual coastal and insular stations (Lampedusa and Malaga), notably impacted by mineral dust, the correlation between POLDER-3 fCNS and AERONET fNS is more significant (R=0.73 for N=54 and R=0.59 for N=53, respectively). This is also seen when restricting the dataset of Ersa and Lampedusa to the summers of 2012 and 2013 (R=0.55 at Ersa, N=11; R=0.70 at Lampedusa, N=10).
The robustness of the comparison can be increased by further constraining the dataset to POLDER-3 and AERONET AOD values larger than 0.10 and limiting the comparison to AERONET data for which AODC is at least 30 % of the total AOD. By applying these thresholds (Fig. 9a), the correlation between fCNS and fNS is R=0.56 (N=274 for the 17 stations). Overall, 80 % of the POLDER-3 fCNS agrees within 25 % with the AERONET values. The largest differences occur when AERONET retrieves fNS values lower than 50 %. In this case, only 40 % of the POLDER-3 fCNS are in the ±25 % agreement interval with AERONET. Conversely, for AERONET fNS>50 %, 88 % of the POLDER-3 fCNS agree within ±25 % with the AERONET estimate of fNS. Figure 10 shows that a relatively good agreement is obtained by comparing broad classes 25 % wide, providing confidence to the classification of non-sphericity by POLDER-3.
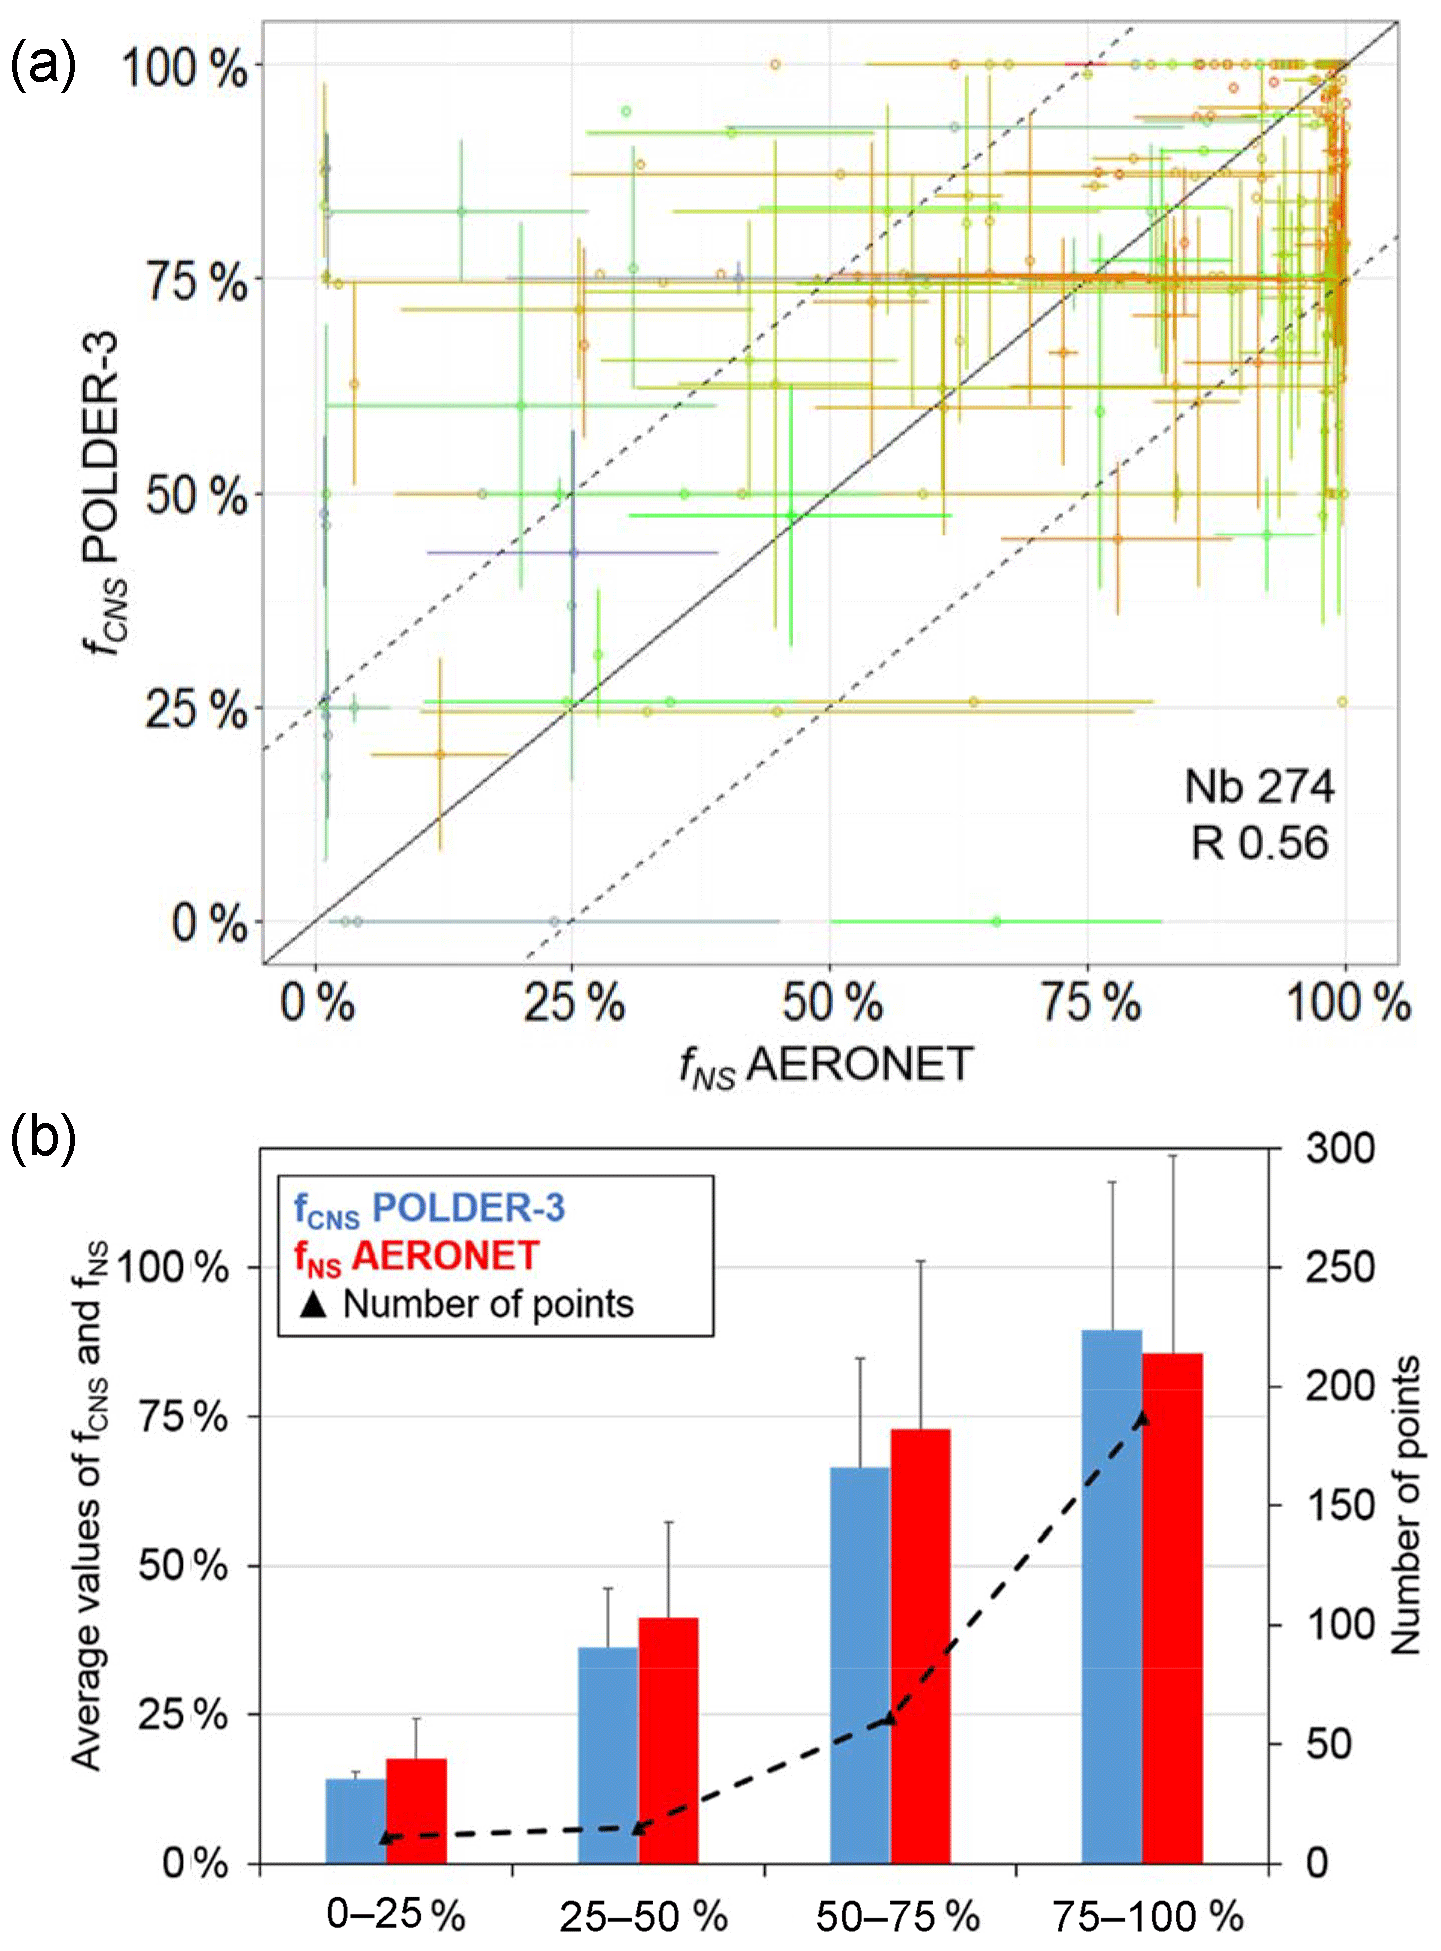
Figure 9(a) Scatter plot of the fraction of coarse mode optical depth due to non-spherical particles (fCNS) retrieved by POLDER-3 and that of total optical depth (fNS) estimated by AERONET. Values are expressed in percent. As the AERONET fNS depends on the total aerosol optical depth, only data points for which the measured AOD exceeded 0.10 and the AODC represented more than 30 % of the total AOD are represented. The solid line is the bisector. Dashed lines represent the interval of ±25 % of agreement between POLDER-3 fCNS and AERONET fNS. (b) Mean and standard deviations of coarse mode optical depth due to non-spherical particles measured by POLDER-3 (fCNS, blue) and that of total optical depth estimated by AERONET (fNS, red) are classified into four classes: spherical (fCNS ≤ 25 %); predominant spherical (25 % %); predominant non-spherical (50 % %); non-spherical (75 % %). Values are expressed in percentages. Only AERONET data points for which the AOD>0.10 and are represented. The black triangles represent the number of points in each class (the dashed curve is represented for increased readability).
Finally, Fig. 10 shows the implication on those results on the evaluation of the POLDER-3 AODCNS and AERONET AODNS. With the previous thresholds (POLDER 3 and AERONET AOD values larger than 0.10 and AERONET AODC/AOD larger than 30 %), the correlation obtained between coincident POLDER-3 AODCNS and AERONET AODNS at 865 nm is significant (R=0.87).
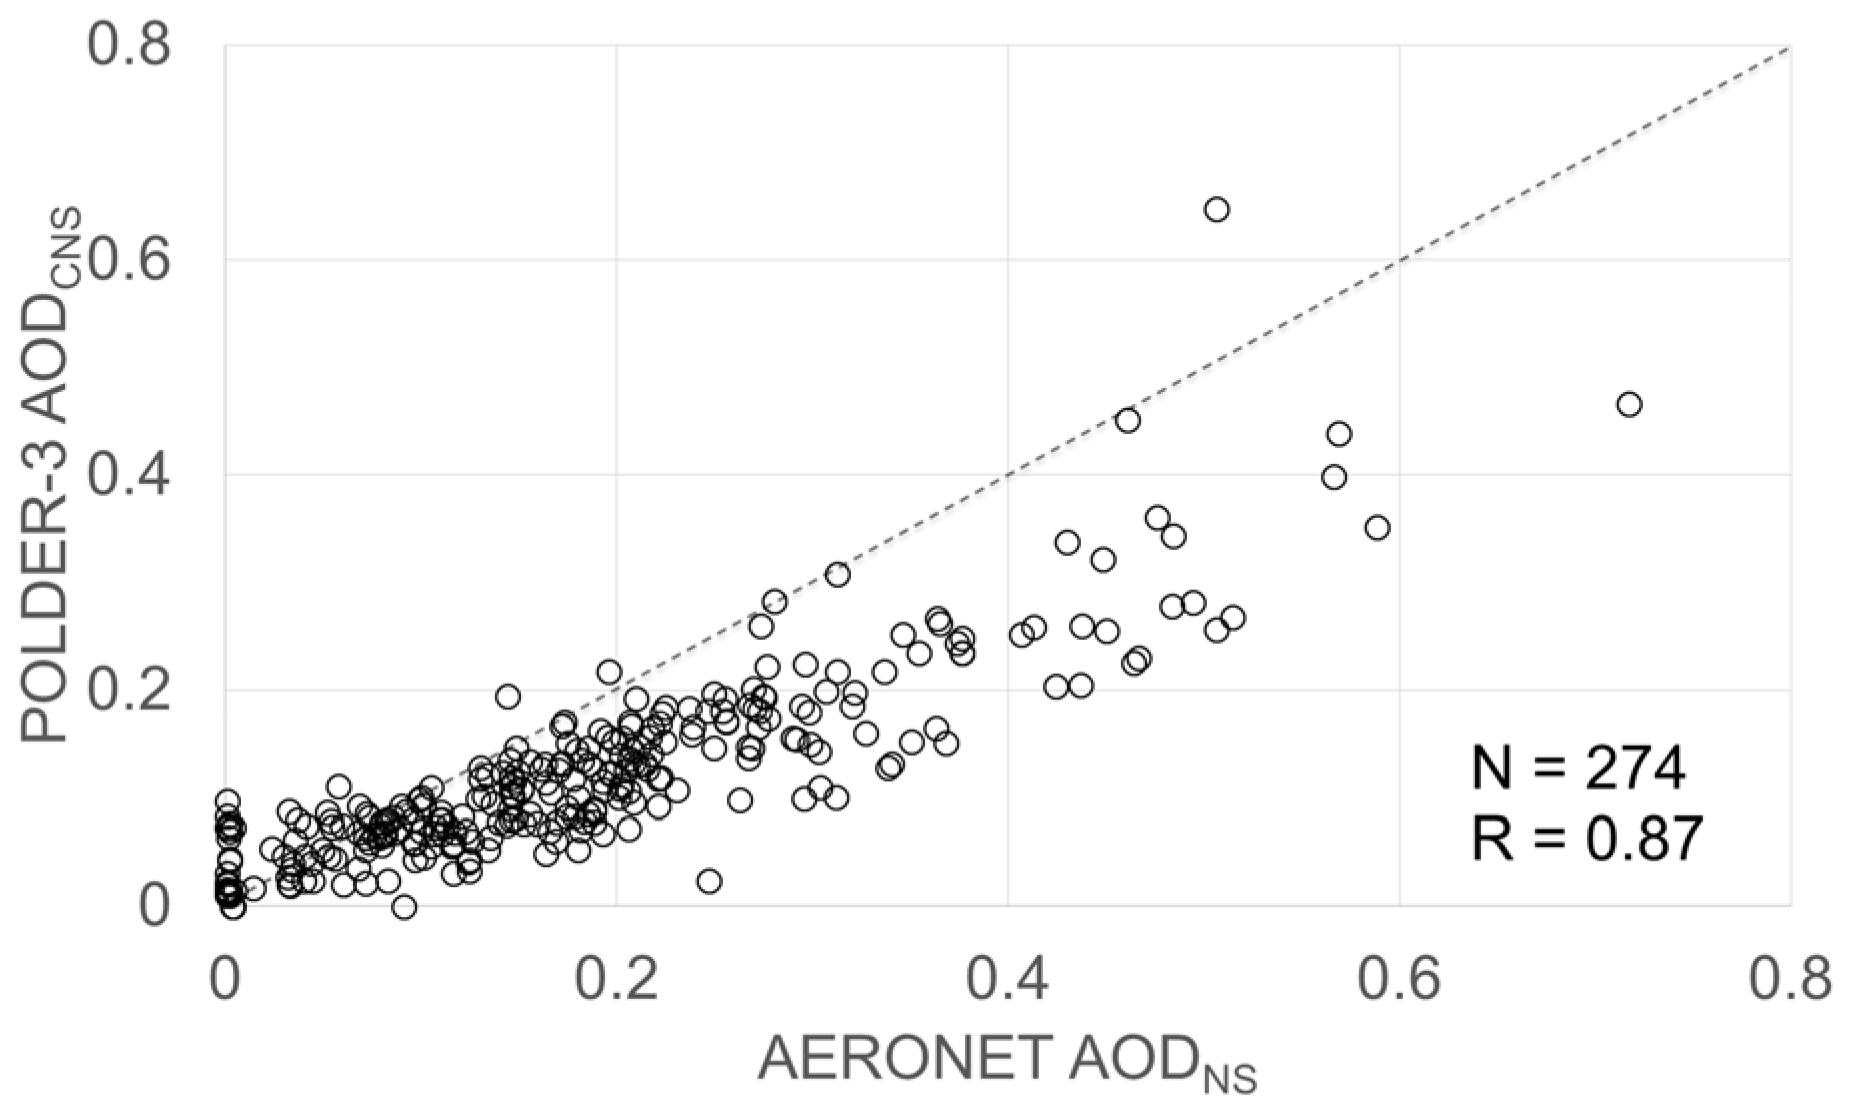
Figure 10Scatter plot of the POLDER-3 coarse non-spherical AOD (AODCNS) as a function of AERONET non-spherical AOD (AODNS) at 865 nm for the same dataset. The number of points and the regression coefficient R are shown. The dashed line represents the 1 : 1 line.
The two datasets are very consistent. However, the POLDER-3 AODCNS is almost systematically lower than the AERONET AODNS, regardless of the percent that it represents with respect to the AOD (not shown). The physical reasons behind this evident discrepancy are beyond the scope of this paper and we recommend addressing them in future research.
5.1 Evaluation of uncertainties on the advanced POLDER-3 oceanic aerosol products
In this paper we provide a first comprehensive evaluation of the advanced POLDER-3 aerosol products over ocean by the latest operational algorithm, based on ground-based remote sensing (AERONET) but also airborne remote sensing and in situ observations (TRAQA and ADRIMED campaigns) over the western Mediterranean sea. Table 4 summarises it by presenting the absolute errors (Δ) derived from the RMSE (representing the precision) and the bias (B) as a measure of accuracy. For consistency with previous similar analyses and as an acknowledgment of the large size of the dataset, only the RMSE and bias of the linear regressions with the AERONET data have been reported. The uncertainties in AODCS and AODCNS were calculated as the square-root of the quadratic sum of the errors in AODC and fCNS.
Our estimate of ΔAOD indicates that, for the western Mediterranean basin, the accuracy and the precision of the POLDER-3 are better than those derived by the error analysis of Tanré et al. (2011), also reported in Table 4, based on a global comparison with AERONET of the POLDER-1 instrument. It is noteworthy that the POLDER-1 retrieval algorithm was using a single mode spherical particle size distribution (Goloub et al., 1999) instead of the current two modes allowing, in addition, an aspherical component. Furthermore, from our regional evaluation of the whole latest collection 3 of the POLDER-3 dataset, Gfrac value for AOD (73 %) is much better than that reported by Bréon et al. (2011) (Gfrac=45 %), based on previous collection of POLDER-3 retrievals at a global scale. Evaluation of the fine and coarse aerosol optical depth
Table 4Summary of evaluated uncertainties on POLDER-3 advanced products AOD, AE, AODF, AODC, and fCNS, and comparison to previous evaluations. N/A stands for not attributed.

* Tanré et al. (2011) and references therein.
Table 4 reports the uncertainties in AODF and AODC based on estimates RMSE and bias. It is of note that the precision in AODC is apparently lower than in AODF (higher RMSE), despite the correlation being far better for the former than for the latter. We have shown that the direct comparison between POLDER-3 and AERONET should take into account the differences in the definition of the fine size fraction in the respective retrieval algorithms. The AERONET AODF is recalculated from the fine mode of the volume size distribution retrieved from the measured total radiance, and defined as the mode below an upper limit diameter (Dcut-off) varying between 0.88 and 1.98 µm. Conversely, our comparison with airborne measurements indicates that AODF retrieved by POLDER-3 corresponds to a fine mode extending to values of Dcut-off between 0.6 and 0.8 µm. This is expected as POLDER-3 uses polarised radiances that are highly sensitive to fine particles, in agreement with previous regional validations of POLDER AODF over land (Kacenelenbogen et al., 2006; Fan et al., 2008; Wang et al., 2015). Our comparison with in situ data shows that the POLDER-3 AODC is less sensitive to the Dcut-off value (Fig. 6), but mostly to the extent of the coarse mode towards the largest particles.
It should also be noted that the values of AODF might be biased low at 865 nm, which will result in a lower RMSE and correlation as compared to the coarse mode (see Figs. 4 and 5). This might minimise the effects of the lack of aerosol absorption in the POLDER algorithm, which could affect the retrieval of pollution and dust aerosols at shorter wavelengths where absorption is more significant.
5.2 Regional aerosol distribution
The ability of POLDER-3 in representing the spatial distribution of aerosols in the Mediterranean region is demonstrated in Fig. 11, showing the retrieved products averaged over the operating period. These regional maps highlight a north–south gradient for AOD and AODCNS, with, on average, the highest values in the southernmost part of the western Mediterranean region, especially over the southern Ionian Sea off the coast of Libya, as previously reported by former satellite AOD products (e.g. Moulin et al., 1998; Antoine and Nobileau, 2006). The distribution of POLDER-3 AE indicates high values along the European coasts (especially over the Adriatic Sea), and low along the North African coasts indicative of the dominance of desert dust in the south and anthropogenic aerosol in the north of the basin. AODF and AODCS maps show moderate spatial variability over the basin, associated to averaged values (AODF of 0.033, AODCS of 0.021) 2 to 3 times lower than those retrieved by POLDER-3 for AODCNS (0.065). Despite these low spatial patterns, it is noticeable that AODF values tend to increase in the eastern part of our region of study, suggesting the complexity of various aerosol types influences over the Mediterranean Sea.
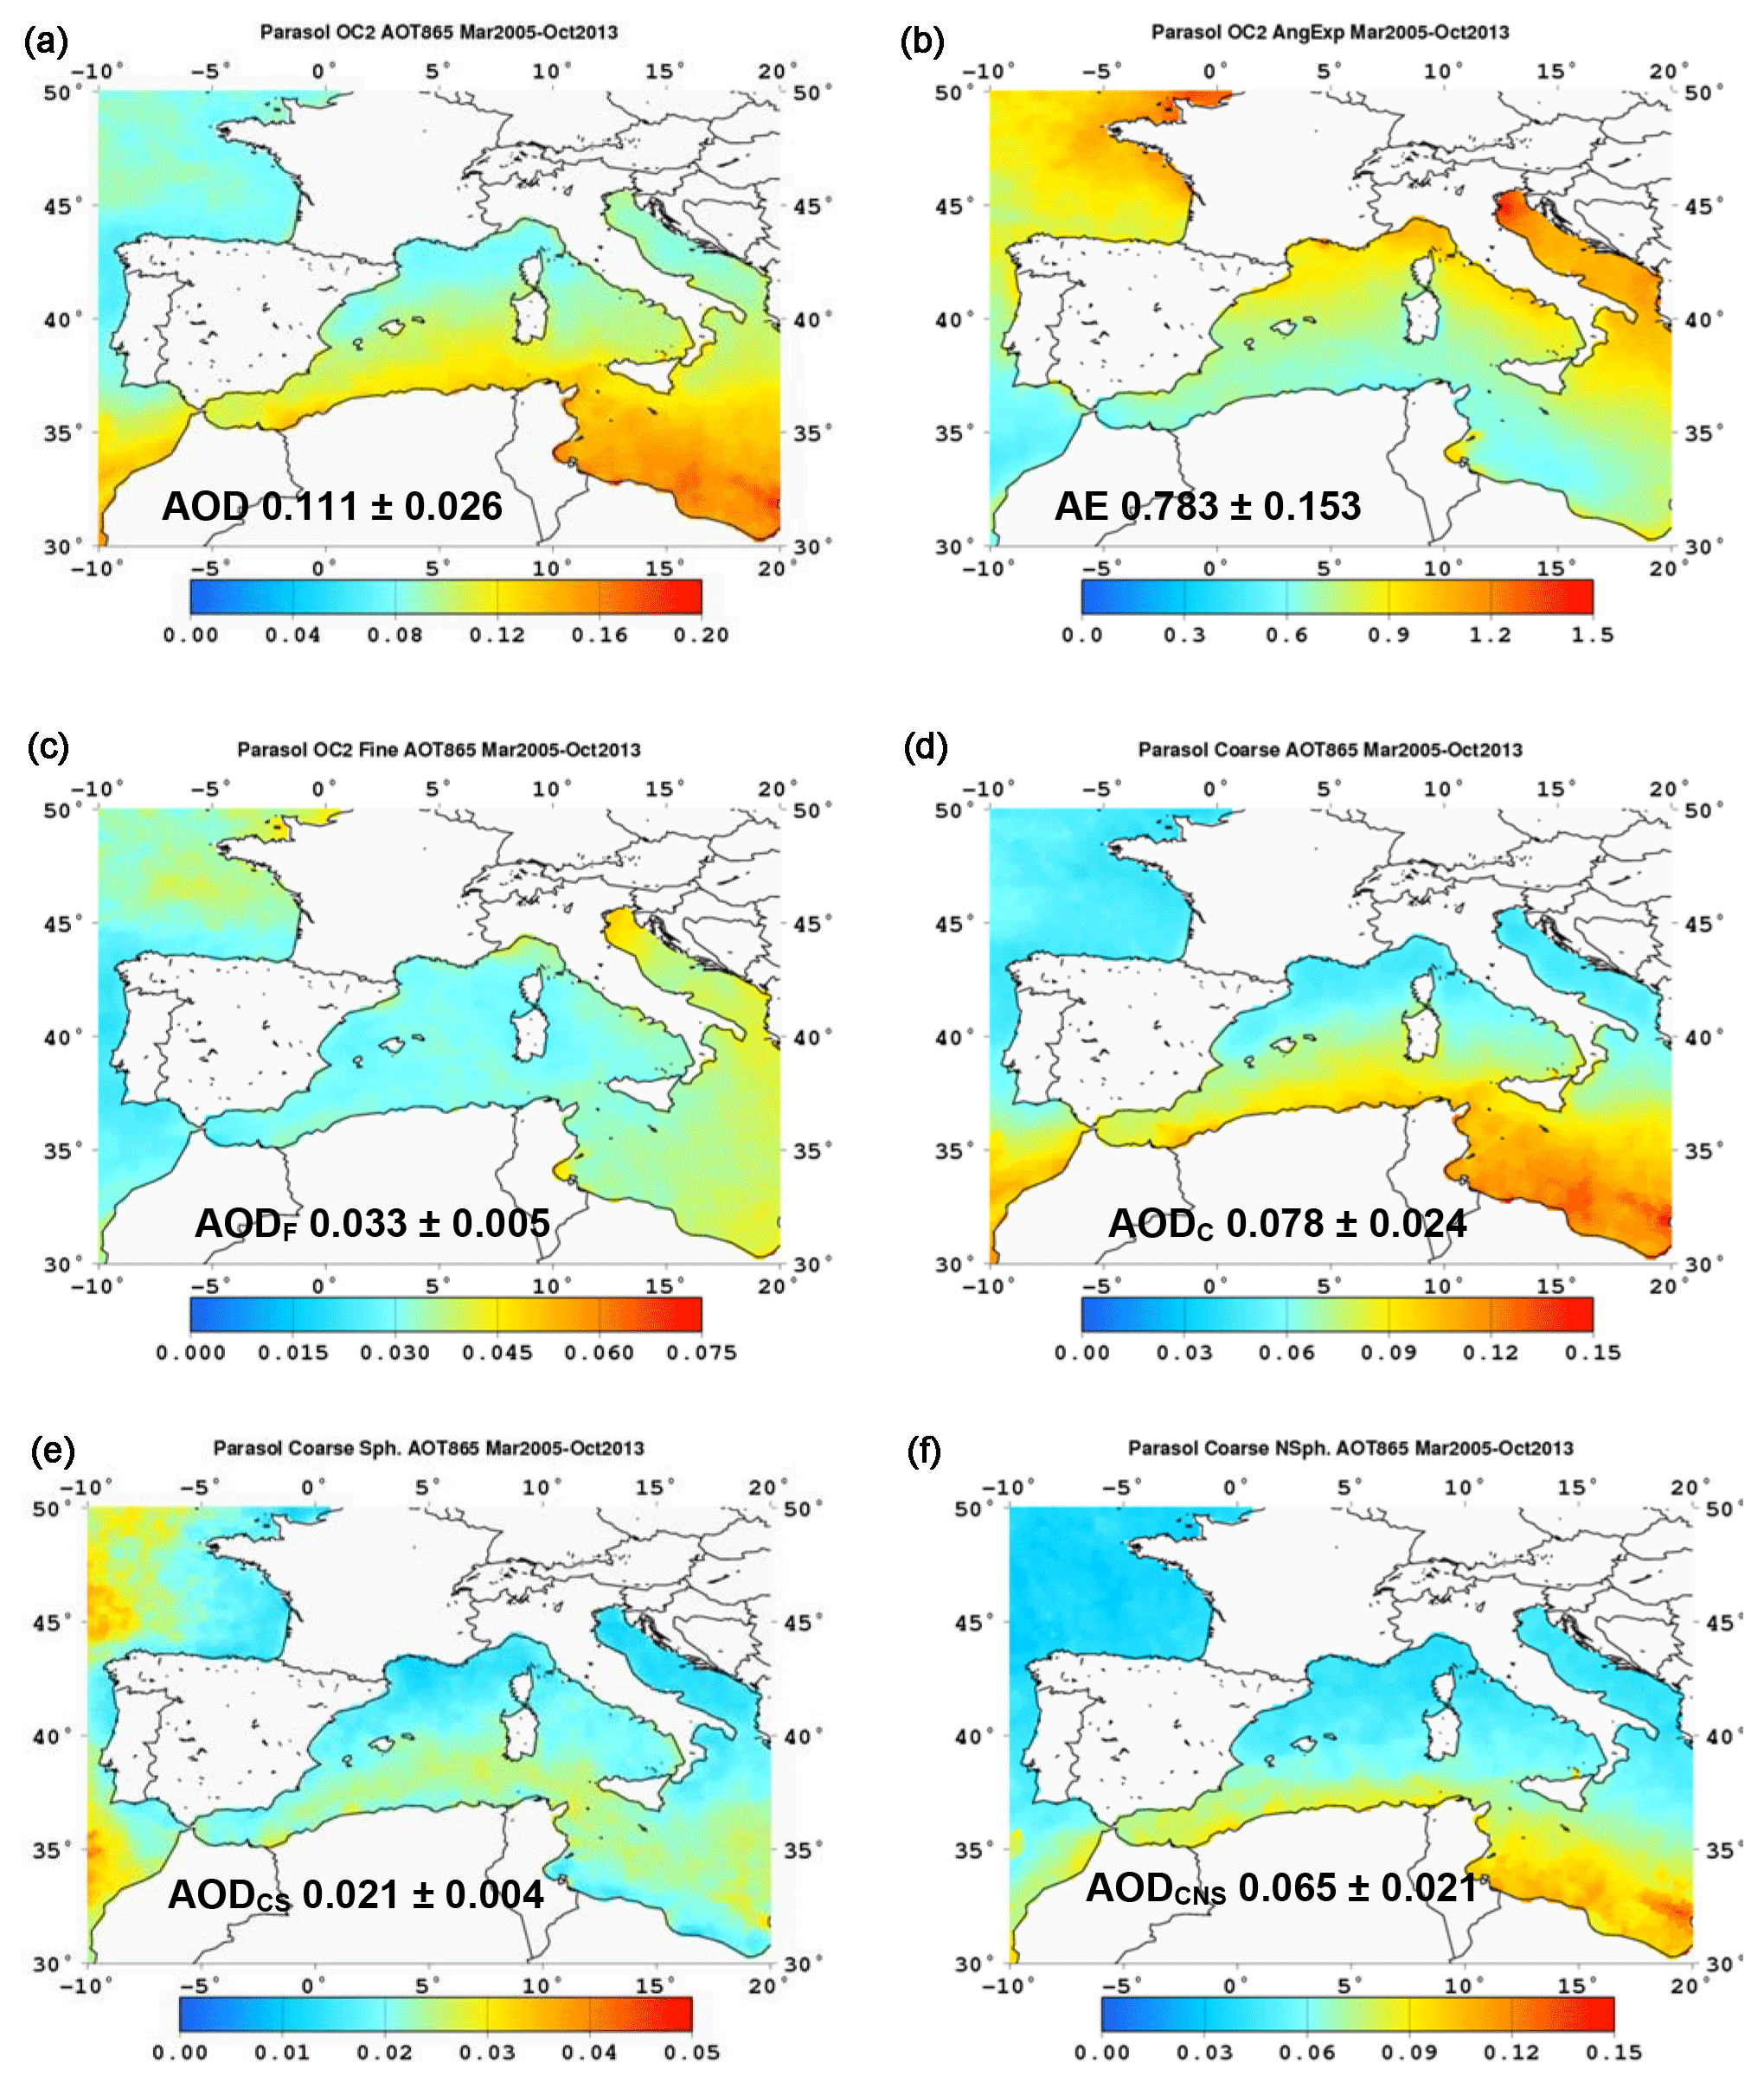
Figure 11Regional maps for AOD, AE, AODF, AODC, AODCS, and AODCNS (from left to right and top to bottom) retrieved by POLDER-3 for the period March 2005–October 2013. Mean and standard deviations over the whole marine area of the window are also shown.
The detailed investigation of the aerosol climatology and regional distribution of the aerosol optical depth of the fine and coarse mode aerosol, including spherical and non-spherical components, retrieved by POLDER-3 over the western Mediterranean Sea, will be presented in the second part of this paper. This analysis, including the investigation of temporal trends over the 8-year operating period, will provide important support to the ongoing aerosol research in the region.
The western Mediterranean aerosol is a complex mixture with a significant temporal and spatial variability at small scales (Pace et al., 2005, 2006; Di Iorio et al., 2009; Mallet et al., 2016 and references therein), and significant impact on present and future regional climate (Nabat et al., 2014, 2015a, b, 2016). High-resolved long-time series of space-borne observations of aerosol optical depth on different size classes and for differing particle shapes, such as provided by POLDER-3, are essential in exploring those evolutions, directly, but also indirectly, as a term of comparison for climate and transport models (Nabat et al., 2014). In the past, quantitative remote sensing of the aerosol optical depth has proven most useful in establishing decadal climatology of the transport of mineral dust over the basin, highlighting its seasonal variability, geographic distribution and sources, link to large-scale atmospheric dynamics (Dulac et al., 1992; Moulin et al., 1997a, b, 1998; Antoine and Nobileau, 2006; Papadimas et al., 2008).
The quality of the observations is surely key to those surveys, and has motivated the comparative analysis of the advanced POLDER-3 oceanic aerosol products during the whole period of operation (March 2005 to October 2013) presented in this paper, with regards to co-located and coincident ground-based measurements by AERONET, and airborne vertical profiles of aerosol optical depth and size distribution during the TRAQA and ADRIMED campaigns of the ChArMEx project.
The results presented in this paper indicate that overall the operational oceanic algorithm of POLDER-3 provides with a very good evaluation of the various components of the aerosol optical depth at the regional scale of the western Mediterranean. Our results confirm previous validations (Goloub et al., 1999; Kacenelenbogen et al., 2006; Fan et al., 2008; Bréon et al., 2011; Tanré et al., 2011), and provide a first evaluation of the uncertainties on the fine and coarse fractions of the aerosol optical depth, and the partitioning of the coarse mode AOD into its spherical and non-spherical components. We highlighted some differences with respect to AERONET and the in situ data, for example in the evaluation of the Ångström exponent and the non-spherical coarse fraction of the AOD. The physical reasons behind those differences remain unresolved. They might require re-examining the basic assumptions of the LUT or the observational constraints, which is beyond the scope of this paper, but which we recommend addressing in future research.
Our results advance the classification of Mediterranean aerosols, and in particular the investigation of the anthropogenic fraction, which is relevant to climate change. As a matter of fact, our results indicate that the fine-fraction AOD at 865 nm is contributed by the aerosol accumulation mode below 0.6–0.8 µm in diameter. On the basis of this result, we recommend that any further comparison to AERONET should be restricted to values corresponding to Dcut-off<0.8 µm. This suggests that AODF measured by POLDER-3 could be used for predicting the submicron column concentrations for air quality studies, and for evaluating the radiative effect of fine aerosols.
POLDER-3 data extraction was performed with the program PARASOLASCII (http://loa-www.univ-lille1.fr/~ducos/public/parasolascii/, last access: 6 December 2018). This version is made available from the AERIS Data and Service Center (http://www.icare.univ-lille1.fr/parasol/overview/, last access: 6 December 2018). Technical details are described at http://www.icare.univ-lille1.fr/projects_data/parasol/docs/Parasol_Level-2_format_latest.pdf, last access: 6 December 2018. The definition of the flag index is detailed on page 18 (parameter: quality of the fit).
The AERONET version 2.0 aerosol products at the Level-2 quality (cloud screened and quality assured with up-to-date calibration) were obtained from the official website at https://aeronet.gsfc.nasa.gov/, last access: 6 December 2018.
The SAFIRE ATR-42 aircraft data are available at the Mistrals/ChArMex database maintained by the AERIS Data and Service Center (http://mistrals.sedoo.fr/ChArMEx/, last access: 6 December 2018).
Single-particle Mie scattering calculations were performed with the Mie_single.pro routine under IDL available at http://eodg.atm.ox.ac.uk/MIE/mie_single.html, last access: 6 December 2018.
The supplement related to this article is available online at: https://doi.org/10.5194/amt-11-6761-2018-supplement.
PF and IC designed the data analysis. LMK, PF, and IC carried out the data analysis with significant contributions from FD and DT. PF and FrD contributed to the design and the performance of the airborne experiments and the ChArMex project. FaD provided processed and/or quality-controlled POLDER-3/PARASOL data and maps in Fig. 11. PF, LMK and IC wrote the manuscript with comments from all co-authors.
The authors declare that they have no conflict of interest.
This article is part of the special issue “CHemistry and AeRosols Mediterranean EXperiments (ChArMEx) (ACP/AMT inter-journal SI)”. It is not associated with a conference.
This work is part of the ChArMEx project, supported by CNRS-INSU, ADEME,
Météo-France, and CEA in the framework of the multidisciplinary
program MISTRALS (Mediterranean Integrated Studies aT Regional And Local
Scales; http://mistrals-home.org/). It has also been supported by the
French National Research Agency (ANR) through the ADRIMED program (contract
ANR-11-BS56-0006) and by the French National Program of Spatial Teledetection
(PNTS, http://www.insu.cnrs.fr/pnts, project no. PNTS-2015-03). TRAQA
was also supported by the ADEME/PRIMEQUAL programme. Lydie Mbemba Kabuiku was supported by the French
Environment and Energy Management Agency (ADEME) and National Center of Space
Studies (CNES). Airborne data were obtained using the ATR-42 atmospheric
research aircraft managed by SAFIRE, which is a joint facility of the French
national centre for scientific research (CNRS), Météo-France, and
CNES. Jean-Luc Attié (CNRM), François Ravetta (LATMOS) and Marc
Mallet (LA, CNRM) are acknowledged for coordinating the TRAQA and ADRIMED
projects. The ChArMEx project manager Eric Hamonou (LSCE) is acknowledged for
his help in organizing the campaigns. The AERIS national data infrastructure
provided access to the POLDER-3 data used in this study. Teams from AERONET
and its French component PHOTONS are acknowledged for calibrating the
sun-photometer network and producing long-term time series of quality-assured
aerosol product time series used in this study. We thank the AERONET
principal investigators Lucas Alados Arboledas (Alboràn), Sara Basart and
José Maria Baldasano (Barcelona), Brent N. Holben (Blida), Jose A.
Martínez-Lozano (Burjassot), Marc Mallet (Ersa and Montesoro Bastia),
Philippe Goloub (Ersa), J. Piazzola (Frioul and Porquerolles), R. Ellul
(Gozo), Daniela Meloni (Lampedusa), Francisco José Olmo Reye (Malaga),
Stefano Pignatti (Messina), Juan Ramon Moreta Gonzalez (Palma de Mallorca),
Gian Paolo Gobbi (Rome), Soltane Ameur (Tizi Ouzou), Serge Despiau (Toulon)
and David Antoine (Villefranche-sur-Mer) and their staff for establishing and
maintaining the 17 sites used in this investigation. Claudia Di Biagio (LISA)
and Cyrielle Denjean (CNRM) are acknowledged for help with data analysis and
aircraft measurements. The participation of Sylvain Triquet, Cécile
Gaimoz, Pascal Zapf and Noël Grand (LISA) to the aircraft experiments is
also acknowledged. Guillaume Siour (LISA) is acknowledged for his help with
figure production.
Edited by: Andrew Sayer
Reviewed by: two anonymous referees
Akimoto, H.: Global air quality and pollution, Science, 302, 1716–1719, https://doi.org/10.1126/science.1092666, 2003.
Anderson, T. L. and Ogren, J. A.: Determining Aerosol Radiative Properties Using the TSI 3563 Integrating Nephelometer, Aerosol Sci. Tech., 29, 57–69, https://doi.org/10.1080/02786829808965551, 1998.
Anderson, T. L., Covert, D. S., Marshall, S. F., Laucks, M. L., Charlson, R. J., Waggoner, A. P., Ogren, J. A., Caldow, R., Holm, R. L., Quant, F. R., Sem, G. J., Wiedensohler, A., Ahlquist, N. A., and Bates, T. S.: Performance characteristics of a high-sensitivity, three-wavelength, total scatter/backscatter nephelometer, J. Atmos. Ocean. Tech., 13, 967–986, https://doi.org/10.1175/1520-0426(1996)013<0967:PCOAHS>2.0.CO;2, 1996.
Antoine, D. and Nobileau, D.: Recent increase of Saharan dust transport over the Mediterranean Sea, as revealed from ocean color satellite (SeaWiFS) observations, J. Geophys. Res., 111, D12214, https://doi.org/10.1029/2005JD006795, 2006.
Barnaba, F. and Gobbi, G. P.: Aerosol seasonal variability over the Mediterranean region and relative impact of maritime, continental and Saharan dust particles over the basin from MODIS data in the year 2001, Atmos. Chem. Phys., 4, 2367–2391, https://doi.org/10.5194/acp-4-2367-2004, 2004.
Becagli, S., Anello, F., Bommarito, C., Cassola, F., Calzolai, G., Di Iorio, T., di Sarra, A., Gómez-Amo, J.-L., Lucarelli, F., Marconi, M., Meloni, D., Monteleone, F., Nava, S., Pace, G., Severi, M., Sferlazzo, D. M., Traversi, R., and Udisti, R.: Constraining the ship contribution to the aerosol of the central Mediterranean, Atmos. Chem. Phys., 17, 2067–2084, https://doi.org/10.5194/acp-17-2067-2017, 2017.
Bergametti, G., Dutot, A.-L., Buat-Ménard, P., Losno, R., and Remoudaki, E.: Seasonal variability of the elemental composition of atmospheric aerosol particles over the northwestern Mediterranean, Tellus B, 41, 353–361, https://doi.org/10.1111/j.1600-0889.1989.tb00314.x, 1989.
Boucher, O.: Atmospheric aerosols Properties and Climate Impacts, Springer Netherlands, 311 pp., 2015.
Boucher, O., Randall, D., Artaxo, P., Bretherton, C., Feingold, G., Forster, P., Kerminen, V.-M., Kondo, Y., Liao, H., Lohmann, U., Rasch, P., Satheesh, S. K., Sherwood, S., Stevens, B., and Zhang, X. Y.: Clouds and Aerosols, in: Climate Change 2013 – The Physical Science Basis, edited by: Intergovernmental Panel on Climate Change, Cambridge University Press, Cambridge, 571–658, 2013.
Bréon, F.-M. and Colzy, S.: Cloud detection from the spaceborne POLDER instrument and validation against surface synoptic observations, J. Appl. Meteorol., 38, 777–785, https://doi.org/10.1175/1520-0450(1999)038<0777:CDFTSP>2.0.CO;2, 1999.
Bréon, F. M., Vermeulen, A., and Descloitres, J.: An evaluation of satellite aerosol products against sunphotometer measurements, Remote Sens. Environ., 115, 3102–3111, https://doi.org/10.1016/j.rse.2011.06.017, 2011.
Cai, Y., Montague, D. C., Mooiweer-Bryan, W., and Deshler, T.: Performance characteristics of the ultra high sensitivity aerosol spectrometer for particles between 55 and 800 nm: Laboratory and field studies, J. Aerosol Sci., 39, 759–769, https://doi.org/10.1016/j.jaerosci.2008.04.007, 2008.
Chiapello, I., Formenti, P., Mbemba Kabuiku, L., Ducos, F., Mallet, M., Nabat, P., Dulac, F., and Tanre, D.: Aerosol optical properties derived from POLDER-3/PARASOL (2005–2013) over the Western Mediterranean sea – Part 2: Regional analysis of spatial distribution and temporal variability, Atmos. Chem. Phys., in preparation, 2018.
Chin, M., Ginoux, P., Kinne, S., Torres, O., Holben, B. N., Duncan, D. N., Martin, R. V., Logan, J. A., Higurashi, H., and Nakajima, T.: Tropospheric aerosol optical thickness from the GOCART model and comparisons with satellite and Sun photometer measurements, J. Atmos. Sci., 59, 451–483, https://doi.org/10.1175/1520-0469(2002)059<0461:TAOTFT>2.0.CO;2, 2002.
Chou, C., Formenti, P., Maille, M., Ausset, P., Helas, G., Harrison, M., and Osborne, S.: Size distribution, shape, and composition of mineral dust aerosols collected during the African Monsoon Multidisciplinary Analysis Special Observation Period 0: Dust and Biomass-Burning Experiment field campaign in Niger, January 2006, J. Geophys. Res., 113, D00C10, https://doi.org/10.1029/2008JD009897, 2008.
Christensen, J. H., Kumar, K. K., Aldria, E., An, S.-I., Cavalcanti, I. F. a., Castro, M. De, Dong, W., Goswami, P., Hall, A., Kanyanga, J. K., Kitoh, A., Kossin, J., Lau, N.-C., Renwick, J., Stephenson, D. B., Xie, S.-P., and Zhou, T.: Climate Phenomena and their Relevance for Future Regional Climate Change, in: Climate Change 2013 – The Physical Science Basis, edited by: Intergovernmental Panel on Climate Change, Cambridge University Press, Cambridge, 1217–1308, 2013.
Cros, B., Durand, P., Cachier, H., Drobinski, P., Fréjafon, E., Kottmeier, C., Perros, P. E., Peuch, V. H., Ponche, J. L., Robin, D., Saïd, F., Toupance, G., and Wortham, H.: The ESCOMPTE program: An overview, Atmos. Res., 69, 241–279, https://doi.org/10.1016/j.atmosres.2003.05.001, 2004.
Denjean, C., Cassola, F., Mazzino, A., Triquet, S., Chevaillier, S., Grand, N., Bourrianne, T., Momboisse, G., Sellegri, K., Schwarzenbock, A., Freney, E., Mallet, M., and Formenti, P.: Size distribution and optical properties of mineral dust aerosols transported in the western Mediterranean, Atmos. Chem. Phys., 16, 1081–1104, https://doi.org/10.5194/acp-16-1081-2016, 2016.
Deuzé, J. L., Herman, M., Goloub, P., Tanré, D., and Marchand, A.: Characterization of aerosols over ocean from POLDER/ADEOS-1, Geophys. Res. Lett., 26, 1421, https://doi.org/10.1029/1999GL900168, 1999.
Deuzé, J. L., Goloub, P., Herman, M., Marchand, A., Perry, G., Susana, S., and Tanré, D.: Estimate of the aerosol properties over the ocean with POLDER, J. Geophys. Res., 105, 15329–15346, https://doi.org/10.1029/2000JD900148, 2000.
Di Biagio, C., Doppler, L., Gaimoz, C., Grand, N., Ancellet, G., Raut, J.-C., Beekmann, M., Borbon, A., Sartelet, K., Attié, J.-L., Ravetta, F., and Formenti, P.: Continental pollution in the western Mediterranean basin: vertical profiles of aerosol and trace gases measured over the sea during TRAQA 2012 and SAFMED 2013, Atmos. Chem. Phys., 15, 9611–9630, https://doi.org/10.5194/acp-15-9611-2015, 2015.
Di Biagio, C., Formenti, P., Doppler, L., Gaimoz, C., Grand, N., Ancellet, G., Attié, J.-L., Bucci, S., Dubuisson, P., Fierli, F., Mallet, M., and Ravetta, F.: Continental pollution in the Western Mediterranean basin: large variability of the aerosol single scattering albedo and influence on the direct shortwave radiative effect, Atmos. Chem. Phys., 16, 10591–10607, https://doi.org/10.5194/acp-16-10591-2016, 2016.
Di Iorio, T., di Sarra, A., Sferlazzo, D. M., Cacciani, M., Meloni, D., Monteleone, F., Fuà, D., and Fiocco, G.: Seasonal evolution of the tropospheric aerosol vertical profile in the central Mediterranean and role of desert dust, J. Geophys. Res., 114, D02201, https://doi.org/10.1029/2008jd010593, 2009.
Di Sarra, A., Pace, G., Meloni, D., De Silvestri, L., Piacentino, S., and Monteleone, F.: Surface shortwave radiative forcing of different aerosol types in the central Mediterranean, Geophys. Res. Lett., 35, L02714, https://doi.org/10.1029/2007GL032395, 2008.
Dubovik, O. and King, M. D.: A flexible inversion algorithm for retrieval of aerosol optical properties from Sun and sky radiance measurements, J. Geophys. Res., 105, 20673–20696, https://doi.org/10.1029/2000JD900282, 2000.
Dubovik, O., Holben, B., Eck, T. F., Smirnov, A., Kaufman, Y. J., King, M. D., Tanré, D., and Slutsker, I.: Variability of Absorption and Optical Properties of Key Aerosol Types Observed in Worldwide Locations, J. Atmos. Sci., 59, 590–608, https://doi.org/10.1175/1520-0469(2002)059<0590:VOAAOP>2.0.CO;2, 2002.
Dubovik, O., Sinyuk, A., Lapyonok, T., Holben, B. N., Mishchenko, M., Yang, P., Eck, T. F., Volten, H., Muñoz, O., Veihelmann, B., van der Zande, W. J., Leon, J.-F., Sorokin, M., and Slutsker, I.: Application of spheroid models to account for aerosol particle nonsphericity in remote sensing of desert dust, J. Geophys. Res., 111, D11208, https://doi.org/10.1029/2005JD006619, 2006.
Dulac, F. and Chazette, P.: Airborne study of a multi-layer aerosol structure in the eastern Mediterranean observed with the airborne polarized lidar ALEX during a STAAARTE campaign (7 June 1997), Atmos. Chem. Phys., 3, 1817–1831, https://doi.org/10.5194/acp-3-1817-2003, 2003.
Dulac, F., Tanré, D., Bergametti, G., Buat-Ménard, P., Desbois, M., and Sutton, D.: Assessment of the African airborne dust mass over the western Mediterranean Sea using Meteosat data, J. Geophys. Res., 97, 2489, https://doi.org/10.1029/91JD02427, 1992.
Fan, X., Goloub, P., Deuzé, J. L., Chen, H., Zhang, W., Tanré, D., and Li, Z.: Evaluation of PARASOL aerosol retrieval over North East Asia, Remote Sens. Environ., 112, 697–707, https://doi.org/10.1016/j.rse.2007.06.010, 2008.
Formenti, P., Boucher, O., Reiner, T., Sprung, D., Andreae, M. O., Wendisch, M., Wex, H., Kindred, D., Tzortziou, M., Vasaras, A., and Zerefos, C.: STAAARTE-MED 1998 summer airborne measurements over the Aegean Sea 2. Aerosol scattering and absorption, and radiative calculations, J. Geophys. Res., 107, 4451, https://doi.org/10.1029/2001JD001536, 2002.
Formenti, P., Rajot, J. L., Desboeufs, K., Saïd, F., Grand, N., Chevaillier, S., and Schmechtig, C.: Airborne observations of mineral dust over western Africa in the summer Monsoon season: spatial and vertical variability of physico-chemical and optical properties, Atmos. Chem. Phys., 11, 6387–6410, https://doi.org/10.5194/acp-11-6387-2011, 2011.
García-Ruiz, J. M., López-Moreno, J. I., Vicente-Serrano, S. M., Lasanta–Martínez, T., and Beguería, S.: Mediterranean water resources in a global change scenario, Earth-Sci. Rev., 105, 121–139, https://doi.org/10.1016/j.earscirev.2011.01.006, 2011.
Giorgi, F.: Climate change hot-spots, Geophys. Res. Lett., 33, L08707, https://doi.org/10.1029/2006GL025734, 2006.
Giorgi, F. and Lionello, P.: Climate change projections for the Mediterranean region, Global Planet. Change, 63, 90–104, https://doi.org/10.1016/j.gloplacha.2007.09.005, 2008.
Gkikas, A., Hatzianastassiou, N., and Mihalopoulos, N.: Aerosol events in the broader Mediterranean basin based on 7-year (2000–2007) MODIS C005 data, Ann. Geophys., 27, 3509–3522, https://doi.org/10.5194/angeo-27-3509-2009, 2009.
Gkikas, A., Basart, S., Hatzianastassiou, N., Marinou, E., Amiridis, V., Kazadzis, S., Pey, J., Querol, X., Jorba, O., Gassó, S., and Baldasano, J. M.: Mediterranean intense desert dust outbreaks and their vertical structure based on remote sensing data, Atmos. Chem. Phys., 16, 8609–8642, https://doi.org/10.5194/acp-16-8609-2016, 2016.
Goloub, P., Tanré, D., Deuzé, J. L., Herman, M., Marchand, A., and Bréon, F.-M.: Validation of the first algorithm applied for deriving the aerosol properties over the ocean using the POLDER/ADEOS measurements, IEEE T. Geosci. Remote, 37, 1586–1596, https://doi.org/10.1109/36.763270, 1999.
Granados-Muñoz, M. J., Navas-Guzmán, F., Guerrero-Rascado, J. L., Bravo-Aranda, J. A., Binietoglou, I., Pereira, S. N., Basart, S., Baldasano, J. M., Belegante, L., Chaikovsky, A., Comerón, A., D'Amico, G., Dubovik, O., Ilic, L., Kokkalis, P., Muñoz-Porcar, C., Nickovic, S., Nicolae, D., Olmo, F. J., Papayannis, A., Pappalardo, G., Rodríguez, A., Schepanski, K., Sicard, M., Vukovic, A., Wandinger, U., Dulac, F., and Alados-Arboledas, L.: Profiling of aerosol microphysical properties at several EARLINET/AERONET sites during the July 2012 ChArMEx/EMEP campaign, Atmos. Chem. Phys., 16, 7043–7066, https://doi.org/10.5194/acp-16-7043-2016, 2016.
Grimm, H. and Eatough, D. J.: Aerosol measurement: the use of optical light scattering for the determination of particulate size distribution, and particulate mass, including the semi-volatile fraction, J. Air Waste Manage., 59, 101–107, https://doi.org/10.3155/1047-3289.59.1.101, 2009.
Herman, M., Deuzé, J. L., Marchand, A., Roger, B., and Lallart, P.: Aerosol remote sensing from POLDER/ADEOS over the ocean: Improved retrieval using a nonspherical particle model, J. Geophys. Res., 110, D10S02, https://doi.org/10.1029/2004JD004798, 2005.
Holben, B. N., Eck, T. F., Slutsker, I., Tanré, D., Buis, J. P., Setzer, A., Vermote, E., Reagan, J. A., Kaufman, Y. J., Nakajima, T., Lavenu, F., Jankowiak, I., and Smirnov, A.: AERONET – A federated instrument network and data archive for aerosol characterization, Remote Sens. Environ., 66, 1–16, https://doi.org/10.1016/S0034-4257(98)00031-5, 1998.
Holben, B. N., Tanré, D., Smirnov, A., Eck, T. F., Slutsker, I., Abuhassan, N., Newcomb, W. W., Schafer, J. S., Chatenet, B., Lavenu, F., Kaufman, Y. J., Castle, J. Vande, Setzer, A., Markham, B., Clark, D., Frouin, R., Halthore, R., Karneli, A., O'Neill, N. T., Pietras, C., Pinker, R. T., Voss, K., and Zibordi, G.: An emerging ground-based aerosol climatology: Aerosol optical depth from AERONET, J. Geophys. Res., 106, 12067–12097, https://doi.org/10.1029/2001JD900014, 2001.
Huneeus, N., Schulz, M., Balkanski, Y., Griesfeller, J., Prospero, J., Kinne, S., Bauer, S., Boucher, O., Chin, M., Dentener, F., Diehl, T., Easter, R., Fillmore, D., Ghan, S., Ginoux, P., Grini, A., Horowitz, L., Koch, D., Krol, M. C., Landing, W., Liu, X., Mahowald, N., Miller, R., Morcrette, J.-J., Myhre, G., Penner, J., Perlwitz, J., Stier, P., Takemura, T., and Zender, C. S.: Global dust model intercomparison in AeroCom phase I, Atmos. Chem. Phys., 11, 7781–7816, https://doi.org/10.5194/acp-11-7781-2011, 2011.
Kacenelenbogen, M., Léon, J.-F., Chiapello, I., and Tanré, D.: Characterization of aerosol pollution events in France using ground-based and POLDER-2 satellite data, Atmos. Chem. Phys., 6, 4843–4849, https://doi.org/10.5194/acp-6-4843-2006, 2006.
Kalivitis, N., Bougiatioti, A., Kouvarakis, G., and Mihalopoulos, N.: Long term measurements of atmospheric aerosol optical properties in the Eastern Mediterranean, Atmos. Res., 102, 351–357, https://doi.org/10.1016/j.atmosres.2011.08.013, 2011.
Karol, Y., Tanré, D., Goloub, P., Vervaerde, C., Balois, J. Y., Blarel, L., Podvin, T., Mortier, A., and Chaikovsky, A.: Airborne sun photometer PLASMA: concept, measurements, comparison of aerosol extinction vertical profile with lidar, Atmos. Meas. Tech., 6, 2383–2389, https://doi.org/10.5194/amt-6-2383-2013, 2013.
Kebabian, P. L., Robinson, W. A., and Freedman, A.: Optical extinction monitor using cw cavity enhanced detection, Rev. Sci. Instrum., 78, 063102, https://doi.org/10.1063/1.2744223, 2007.
Kim, D., Chin, M., Yu, H., Diehl, T., Tan, Q., Kahn, R. A., Tsigaridis, K., Bauer, S. E., Takemura, T., Pozzoli, L., Bellouin, N., Schulz, M., Peyridieu, S., Chédin, A., and Koffi, B.: Sources, sinks, and transatlantic transport of North African dust aerosol: A multimodel analysis and comparison with remote sensing data, J. Geophys. Res.-Atmos., 119, 6259–6277, https://doi.org/10.1002/2013JD021099, 2014.
Kovats, R. S., Valentini, R., Bouwer, L. M., Georgopoulou, E., Jacob, D., Martin, E., Rounsevell, M., and Soussana, J.-F.: Europe, in: Climate Change 2014: Impacts, Adaptation, and Vulnerability. Part B: Regional Aspects, Contribution of Working Group II to Fifth Assessment Report of the Intergovernmental Panel on Climate Change, edited by: Barros, V. R., Field, C. B., Dokken, D. J., Mastrandrea, M. D., Mach, K. J., Bilir, T. E., Chatterjee, M., Ebi, K. L., Estrada, Y. O., Genova, R. C., Girma, B., Kissel, E. S., Levy, A. N., MacCracken, S., Mastrandrea, P. R., and White, L. L., Cambridge University Press, Cambridge University Press, Cambridge, United Kingdom and New York, NY, USA, 1267–1326, 2014.
Lelieveld, J., Berresheim, H., Borrmann, S., Crutzen, P. J., Dentener, F. J., Fischer, H., Feichter, J., Flatau, P. J., Heland, J., Holzinger, R., Korrmann, R., Lawrence, M. G., Levin, Z., Markowicz, K. M., Mihalopoulos, N., Minikin, a, Ramanathan, V., De Reus, M., Roelofs, G. J., Scheeren, H. a, Sciare, J., Schlager, H., Schultz, M., Siegmund, P., Steil, B., Stephanou, E. G., Stier, P., Traub, M., Warneke, C., Williams, J., and Ziereis, H.: Global air pollution crossroads over the Mediterranean, Science, 298, 794–799, https://doi.org/10.1126/science.1075457, 2002.
Liu, P. S. K., Leaitch, W. R., Strapp, J. W., and Wasey, M. A.: Response of Particle Measuring Systems Airborne ASASP and PCASP to NaCl and Latex Particles, Aerosol Sci. Tech., 16, 83–95, https://doi.org/10.1080/02786829208959539, 1992.
Lyamani, H., Valenzuela, A., Perez-Ramirez, D., Toledano, C., Granados-Muñoz, M. J., Olmo, F. J., and Alados-Arboledas, L.: Aerosol properties over the western Mediterranean basin: temporal and spatial variability, Atmos. Chem. Phys., 15, 2473–2486, https://doi.org/10.5194/acp-15-2473-2015, 2015.
Mallet, M., Dubovik, O., Nabat, P., Dulac, F., Kahn, R., Sciare, J., Paronis, D., and Léon, J. F.: Absorption properties of Mediterranean aerosols obtained from multi-year ground-based remote sensing observations, Atmos. Chem. Phys., 13, 9195-9210, https://doi.org/10.5194/acp-13-9195-2013, 2013
Mallet, M., Dulac, F., Formenti, P., Nabat, P., Sciare, J., Roberts, G., Pelon, J., Ancellet, G., Tanré, D., Parol, F., Denjean, C., Brogniez, G., di Sarra, A., Alados-Arboledas, L., Arndt, J., Auriol, F., Blarel, L., Bourrianne, T., Chazette, P., Chevaillier, S., Claeys, M., D'Anna, B., Derimian, Y., Desboeufs, K., Di Iorio, T., Doussin, J.-F., Durand, P., Féron, A., Freney, E., Gaimoz, C., Goloub, P., Gómez-Amo, J. L., Granados-Muñoz, M. J., Grand, N., Hamonou, E., Jankowiak, I., Jeannot, M., Léon, J.-F., Maillé, M., Mailler, S., Meloni, D., Menut, L., Momboisse, G., Nicolas, J., Podvin, T., Pont, V., Rea, G., Renard, J.-B., Roblou, L., Schepanski, K., Schwarzenboeck, A., Sellegri, K., Sicard, M., Solmon, F., Somot, S., Torres, B., Totems, J., Triquet, S., Verdier, N., Verwaerde, C., Waquet, F., Wenger, J., and Zapf, P.: Overview of the Chemistry-Aerosol Mediterranean Experiment/Aerosol Direct Radiative Forcing on the Mediterranean Climate (ChArMEx/ADRIMED) summer 2013 campaign, Atmos. Chem. Phys., 16, 455–504, https://doi.org/10.5194/acp-16-455-2016, 2016.
Massoli, P., Kebabian, P. L., Onasch, T. B., Hills, F. B., and Freedman, A.: Aerosol light extinction measurements by Cavity Attenuated Phase Shift (CAPS) spectroscopy: Laboratory validation and field deployment of a compact aerosol particle extinction monitor, Aerosol Sci. Tech., 44, 428–435, https://doi.org/10.1080/02786821003716599, 2010.
Meloni, D., di Sarra, A., Biavati, G., Deuisi, J.J., Montelelone, F., Pace, G., Piacentino, S., and Sferlazzo, D. M.: Seasonal behavior of Saharan dust events at the Mediterranean island of Lampedusa in the period 1999–2005, Atmos. Environ., 41, 3041–3056, https://doi.org/10.1016/j.atmosenv.2006.12.001, 2007.
Mie, G.: Beiträge zur Optik trüber Medien, speziell kolloidaler Metallösungen, Ann. Phys., 330, 377–445, https://doi.org/10.1002/andp.19083300302, 1908.
Migon, C., Alleman, L., Leblond, N., and Nicolas, E.: Evolution of atmospheric lead over the northwestern Mediterranean between 1986 and 1992, Atmos. Environ. A-Gen., 27, 2161–2167, https://doi.org/10.1016/0960-1686(93)90045-Z, 1993.
Mihalopoulos, N., Stephanou, E., Kanakidou, M., Pilitsidis, S., and Bousquet, P.: Tropospheric aerosol ionic composition in the Eastern Mediterranean region, Tellus B, 49, 314–326, https://doi.org/10.1034/j.1600-0889.49.issue3.7.x, 1997.
Mishchenko, M. I., Travis, L. D., Kahn, R. A., and West, R. A.: Modeling phase function for dustlike tropospheric aerosols using a shape mixture of randomly oriented polydisperse spheroids, J. Geophys. Res., 102, 16831–16847, https://doi.org/10.1029/96JD02110, 1997.
Monks, P. S., Granier, C., Fuzzi, S., Stohl, A., Williams, M. L., Akimoto, H., Amann, M., Baklanov, A., Baltensperger, U., Bey, I., Blake, N., Blake, R. S., Carslaw, K., Cooper, O. R., Dentener, F., Fowler, D., Fragkou, E., Frost, G. J., Generoso, S., Ginoux, P., Grewe, V., Guenther, A., Hansson, H. C., Henne, S., Hjorth, J., Hofzumahaus, A., Huntrieser, H., Isaksen, I. S. A., Jenkin, M. E., Kaiser, J., Kanakidou, M., Klimont, Z., Kulmala, M., Laj, P., Lawrence, M. G., Lee, J. D., Liousse, C., Maione, M., McFiggans, G., Metzger, A., Mieville, A., Moussiopoulos, N., Orlando, J. J., O'Dowd, C. D., Palmer, P. I., Parrish, D. D., Petzold, A., Platt, U., Pöschl, U., Prévôt, A. S. H., Reeves, C. E., Reimann, S., Rudich, Y., Sellegri, K., Steinbrecher, R., Simpson, D., ten Brink, H., Theloke, J., van der Werf, G. R., Vautard, R., Vestreng, V., Vlachokostas, C., and von Glasow, R.: Atmospheric composition change – global and regional air quality, Atmos. Environ., 43, 5268–5350, https://doi.org/10.1016/j.atmosenv.2009.08.021, 2009.
Moulin, C., Guillard, F., Dulac, F., and Lambert, C. E.: Long-term daily monitoring of Saharan dust load over ocean using Meteosat ISCCP-B2 data: 1. Methodology and preliminary results for 1983–1994 in the Mediterranean, J. Geophys. Res., 102, 16947, https://doi.org/10.1029/96JD02620, 1997a.
Moulin, C., Lambert, C. E., Dulac, F., and Dayan, U.: Control of atmospheric export of dust from North Africa by the North Atlantic Oscillation, Nature, 387, 691–694, 1997b.
Moulin, C., Lambert, C. E., Dayan, U., Masson, V., Ramonet, M., Bousquet, P., Legrand, M., Balkanski, Y. J., Guelle, W., Marticorena, B., Bergametti, G., and Dulac, F.: Satellite climatology of African dust transport in the Mediterranean atmosphere, J. Geophys. Res., 103, 13137, https://doi.org/10.1029/98JD00171, 1998.
Müller, T., Nowak, A., Wiedensohler, A., Sheridan, P., Laborde, M., Covert, D. S., Marinoni, A., Imre, K., Henzing, B., Roger, J.-C., Martins dos Santos, S., Wilhelm, R., Wang, Y.-Q., and de Leeuw, G.: Angular illumination and truncation of three different integrating nephelometers: Implications for empirical, size-based orrections, Aerosol Sci. Tech., 43, 581–586, https://doi.org/10.1080/02786820902798484, 2009.
Myhre, G., Shindell, D., Bréon, F.-M., Collins, W., Fuglestvedt, J., Huang, J., Koch, D., Lamarque, J.-F., Lee, D. Mendoza, B., Nakajima, T., Robock, A., Stephens, G., Takemura, T., and Zhang, H.: Anthropogenic and natural radiative forcing, in: Climate Change 2013: The Physical Science Basis. Contribution of Working Group I to the Fifth Assessment Report of the Intergovernmental Panel on Climate Change, edited by: Stocker, T. F., Qin, D., Plattner, G.-K., Tignor, M., Allen, S. K., Doschung, J., Nauels, A., Xia, Y., Bex, V. and Midgley, P. M., Cambridge University Press, 659–740, https://doi.org/10.1017/CBO9781107415324.018, 2013.
Nabat, P., Somot, S., Mallet, M., Chiapello, I., Morcrette, J. J., Solmon, F., Szopa, S., Dulac, F., Collins, W., Ghan, S., Horowitz, L. W., Lamarque, J. F., Lee, Y. H., Naik, V., Nagashima, T., Shindell, D., and Skeie, R.: A 4-D climatology (1979–2009) of the monthly tropospheric aerosol optical depth distribution over the Mediterranean region from a comparative evaluation and blending of remote sensing and model products, Atmos. Meas. Tech., 6, 1287–1314, https://doi.org/10.5194/amt-6-1287-2013, 2013.
Nabat, P., Somot, S., Mallet, M., Sanchez-Lorenzo, A., and Wild, M.: Contribution of anthropogenic sulfate aerosols to the changing Euro-Mediterranean climate since 1980, Geophys. Res. Lett., 41, 5605–5611, https://doi.org/10.1002/2014GL060798, 2014.
Nabat, P., Somot, S., Mallet, M., Michou, M., Sevault, F., Driouech, F., Meloni, D., di Sarra, A., Di Biagio, C., Formenti, P., Sicard, M., Léon, J.-F., and Bouin, M.-N.: Dust aerosol radiative effects during summer 2012 simulated with a coupled regional aerosol–atmosphere–ocean model over the Mediterranean, Atmos. Chem. Phys., 15, 3303–3326, https://doi.org/10.5194/acp-15-3303-2015, 2015a.
Nabat P., Somot, S., Mallet, M., Sevault, F., Chiacchio, M., and Wild, M.: Direct and semi-direct aerosol radiative effect on the Mediterranean climate variability using a coupled regional climate system model, Clim. Dynam., 44, 1127–1155, https://doi.org/10.1007/s00382-014-2205-6, 2015b.
Nabat, P., Kiki, Somot, S., Mallet, M., and Michou, M.: Impact of aerosols in regional climate projections over the Mediterranean area, in: Air Pollution Modeling and its Application XXIV, edited by: Steyn, D. G. and Chaumerliac, N., Springer, Cham, 73–78, https://doi.org/10.1007/978-3-319-24478-5_12, 2016.
Pace, G., Meloni, D., and di Sarra, A.: Forest fire aerosol over the Mediterranean basin during summer 2003, J. Geophys. Res., 110, D21202, https://doi.org/10.1029/2005jd005986, 2005.
Pace, G., di Sarra, A., Meloni, D., Piacentino, S., and Chamard, P.: Aerosol optical properties at Lampedusa (Central Mediterranean). 1. Influence of transport and identification of different aerosol types, Atmos. Chem. Phys., 6, 697–713, https://doi.org/10.5194/acp-6-697-2006, 2006.
Pan, X., Chin, M., Gautam, R., Bian, H., Kim, D., Colarco, P. R., Diehl, T. L., Takemura, T., Pozzoli, L., Tsigaridis, K., Bauer, S., and Bellouin, N.: A multi-model evaluation of aerosols over South Asia: common problems and possible causes, Atmos. Chem. Phys., 15, 5903–5928, https://doi.org/10.5194/acp-15-5903-2015, 2015.
Papadimas, C. D., Hatzianastassiou, N., Mihalopoulos, N., Querol, X., and Vardavas, I.: Spatial and temporal variability in aerosol properties over the Mediterranean basin based on 6-year (2000–2006) MODIS data, J. Geophys. Res., 113, D11205, https://doi.org/10.1029/2007JD009189, 2008.
Pappalardo, G., Amodeo, A., Apituley, A., Comeron, A., Freudenthaler, V., Linné, H., Ansmann, A., Bösenberg, J., D'Amico, G., Mattis, I., Mona, L., Wandinger, U., Amiridis, V., Alados-Arboledas, L., Nicolae, D., and Wiegner, M.: EARLINET: towards an advanced sustainable European aerosol lidar network, Atmos. Meas. Tech., 7, 2389–2409, https://doi.org/10.5194/amt-7-2389-2014, 2014.
Pérez, N., Pey, J., Castillo, S., Viana, M., Alastuey, A., and Querol, X.: Interpretation of the variability of levels of regional background aerosols in the Western Mediterranean, Sci. Total Environ., 407, 527–540, https://doi.org/10.1016/j.scitotenv.2008.09.006, 2008.
Petzold, A., Onasch, T., Kebabian, P., and Freedman, A.: Intercomparison of a Cavity Attenuated Phase Shift-based extinction monitor (CAPS PMex) with an integrating nephelometer and a filter-based absorption monitor, Atmos. Meas. Tech., 6, 1141–1151, https://doi.org/10.5194/amt-6-1141-2013, 2013.
Pey, J., Querol, X., Alastuey, A., Forastiere, F., and Stafoggia, M.: African dust outbreaks over the Mediterranean Basin during 2001–2011: PM10 concentrations, phenomenology and trends, and its relation with synoptic and mesoscale meteorology, Atmos. Chem. Phys., 13, 1395–1410, https://doi.org/10.5194/acp-13-1395-2013, 2013.
Pope III, C. A., Burnett, R. T., Thun, M. J., Calle, E. E., Krewski, D., Ito, K., and Thurston, G. D.: Lung Cancer, Cardiopulmonary Mortality, and Long-term Exposure to Fine Particulate Air Pollution, JAMA, 287, 1132–1141, https://doi.org/10.1001/jama.287.9.1132, 2002.
Pope III, C. A. and Dockery, D. W.: Health Effects of Fine Particulate Air Pollution: Lines that Connect, J. Air Waste Manage., 56, 709–742, https://doi.org/10.1080/10473289.2006.10464485, 2006.
Putaud, J.-P., Van Dingenen, R., Dell'Acqua, A., Raes, F., Matta, E., Decesari, S., Facchini, M. C., and Fuzzi, S.: Size-segregated aerosol mass closure and chemical composition in Monte Cimone (I) during MINATROC, Atmos. Chem. Phys., 4, 889–902, https://doi.org/10.5194/acp-4-889-2004, 2004.
Querol, X., Alastuey, A., Pey, J., Cusack, M., Pérez, N., Mihalopoulos, N., Theodosi, C., Gerasopoulos, E., Kubilay, N., and Koçak, M.: Variability in regional background aerosols within the Mediterranean, Atmos. Chem. Phys., 9, 4575–4591, https://doi.org/10.5194/acp-9-4575-2009, 2009.
Rea, G., Turquety, S., Menut, L., Briant, R., Mailler, S., and Siour, G.: Source contributions to 2012 summertime aerosols in the Euro-Mediterranean region, Atmos. Chem. Phys., 15, 8013–8036, https://doi.org/10.5194/acp-15-8013-2015, 2015.
Reid, J. S., Eck, T. F., Christopher, S. A., Hobbs, P. V., and Holben, B.: Use of the Ångstrom exponent to estimate the variability of optical and physical properties of aging smoke particles in Brazil, J. Geophys. Res., 104, 27473–27489, https://doi.org/10.1029/1999JD900833, 1999.
Sayer, A. M., Smirnov, A., Hsu, N. C., Munchak, L. A., and Holben, B. N.: Estimating marine aerosol particle volume and number from Maritime Aerosol Network data, Atmos. Chem. Phys., 12, 8889–8909, https://doi.org/10.5194/acp-12-8889-2012, 2012a.
Sayer, A. M., Hsu, N. C., Bettenhausen, C., Ahmad, Z., Holben, B. N., Smirnov, A., Thomas, G. E., and Zhang, J.: SeaWiFS Ocean Aerosol Retrieval (SOAR): Algorithm, validation, and comparison with other data sets, J. Geophys. Res., 117, D03206, https://doi.org/10.1029/2011JD016599, 2012b.
Shindell, D. T., Lamarque, J.-F., Schulz, M., Flanner, M., Jiao, C., Chin, M., Young, P. J., Lee, Y. H., Rotstayn, L., Mahowald, N., Milly, G., Faluvegi, G., Balkanski, Y., Collins, W. J., Conley, A. J., Dalsoren, S., Easter, R., Ghan, S., Horowitz, L., Liu, X., Myhre, G., Nagashima, T., Naik, V., Rumbold, S. T., Skeie, R., Sudo, K., Szopa, S., Takemura, T., Voulgarakis, A., Yoon, J.-H., and Lo, F.: Radiative forcing in the ACCMIP historical and future climate simulations, Atmos. Chem. Phys., 13, 2939–2974, https://doi.org/10.5194/acp-13-2939-2013, 2013.
Sicard, M., Barragan, R., Muñoz-Porcar, C., Comerón, A., Mallet, M., Dulac, F., Pelon, J., Alados Arboledas, L., Amodeo, A., Boselli, A., Bravo-Aranda, J. A., D'amico, G., Granados Muñoz, M. J., Leto, G., Guerrero Rascado, J. L., Madonna, F., Mona, L., Pappalardo, G., Perrone, M. R., Burlizzi, P., Rocadenbosch, F., Rodríguez-Gómez, A., Scollo, S., Spinelli, N., Titos, G., Wang, X., and Zanmar Sanchez, R.: Contribution of EARLINET/ACTRIS to the summer 2013 Special Observing Period of the ChArMEx project: monitoring of a Saharan dust event over the western and central Mediterranean, Int. J. Remote Sens., 37, 4698–4711, https://doi.org/10.1080/01431161.2016.1222102, 2016.
Smirnov, A., Holben, B. N., Eck, T. F., Dubovik, O., and Slutsker, I.: Cloud-screening and quality control algorithms for the AERONET database, Remote Sens. Environ., 73, 337–349, https://doi.org/10.1016/S0034-4257(00)00109-7, 2000.
Smirnov, A., Holben, B. N., Giles, D. M., Slutsker, I., O'Neill, N. T., Eck, T. F., Macke, A., Croot, P., Courcoux, Y., Sakerin, S. M., Smyth, T. J., Zielinski, T., Zibordi, G., Goes, J. I., Harvey, M. J., Quinn, P. K., Nelson, N. B., Radionov, V. F., Duarte, C. M., Losno, R., Sciare, J., Voss, K. J., Kinne, S., Nalli, N. R., Joseph, E., Krishna Moorthy, K., Covert, D. S., Gulev, S. K., Milinevsky, G., Larouche, P., Belanger, S., Horne, E., Chin, M., Remer, L. A., Kahn, R. A., Reid, J. S., Schulz, M., Heald, C. L., Zhang, J., Lapina, K., Kleidman, R. G., Griesfeller, J., Gaitley, B. J., Tan, Q., and Diehl, T. L.: Maritime aerosol network as a component of AERONET – first results and comparison with global aerosol models and satellite retrievals, Atmos. Meas. Tech., 4, 583–597, https://doi.org/10.5194/amt-4-583-2011, 2011.
Söderman, D. and Dulac, F.: Monitoring and prediction of the atmospheric transport and deposition of desert dust in the Mediterranean region, World Meteorological Organization Publication WMO TD864, Geneva, 177–182, 1998.
Tanré, D., Bréon, F. M., Deuzé, J. L., Dubovik, O., Ducos, F., François, P., Goloub, P., Herman, M., Lifermann, A., and Waquet, F.: Remote sensing of aerosols by using polarized, directional and spectral measurements within the A-Train: the PARASOL mission, Atmos. Meas. Tech., 4, 1383–1395, https://doi.org/10.5194/amt-4-1383-2011, 2011.
Torres, B., Dubovik, O., Fuertes, D., Schuster, G., Cachorro, V. E., Lapyonok, T., Goloub, P., Blarel, L., Barreto, A., Mallet, M., Toledano, C., and Tanré, D.: Advanced characterisation of aerosol size properties from measurements of spectral optical depth using the GRASP algorithm, Atmos. Meas. Tech., 10, 3743–3781, https://doi.org/10.5194/amt-10-3743-2017, 2017.
Wang, J., Zhu, C., and Zhu, Y.: Estimating the POLDER sensitivity to aerosol size using PARASOL observations, Remote Sens. Lett., 6, 88–96, https://doi.org/10.1080/2150704X.2015.1007247, 2015.
Wendisch, M. and Brenguier, J.-L.: Airborne Measurements for Environmental Research, Wiley-VCH, New York, 2013.
Zerefos, C. S., Kourtidis, K. A., Melas, D., Balis, D., Zanis, P., Katsaros, L., Mantis, H. T., Repapis, C., Isaksen, I., Sundet, J., Herman, J., Bhartia, P. K., and Calpini, B.: Photochemical Activity and Solar Ultraviolet Radiation (PAUR) modulation factors: An overview of the project, J. Geophys. Res., 107, 8134, https://doi.org/10.1029/2000JD000134, 2002.