the Creative Commons Attribution 4.0 License.
the Creative Commons Attribution 4.0 License.
 | 09 Feb 2018
A simulated observation database to assess the impact of the IASI-NG hyperspectral infrared sounder
Javier Andrey-Andrés
Vincent Guidard
Raymond Armante
Pascal Brunel
Cyril Crevoisier
Bernard Tournier
The highly accurate measurements of the hyperspectral Infrared Atmospheric Sounding Interferometer (IASI) are used in numerical weather prediction (NWP), atmospheric chemistry and climate monitoring. As the second generation of the European Polar System (EPS-SG) is being developed, a new generation of IASI instruments has been designed to fly on board the MetOp-SG constellation: IASI New Generation (IASI-NG). In order to prepare the arrival of this new instrument, and to evaluate its impact on NWP and atmospheric chemistry applications, a set of IASI and IASI-NG simulated data was built and made available to the public to set a common framework for future impact studies. This paper describes the information available in this database and the procedure followed to run the IASI and IASI-NG simulations. These simulated data were evaluated by comparing IASI-NG to IASI observations. The result is also presented here. Additionally, preliminary impact studies of the benefit of IASI-NG compared to IASI on the retrieval of temperature and humidity in a NWP framework are also shown in the present work. With a channel dataset located in the same wave numbers for both instruments, we showed an improvement of the temperature retrievals throughout the atmosphere, with a maximum in the troposphere with IASI-NG and a lower benefit for the tropospheric humidity.
- Article
(7855 KB) - Full-text XML
- BibTeX
- EndNote


A huge quantity of improvements have taken place in the first decade of the 21st century with the launch of new infrared (IR) sounders such as the Atmospheric Infrared Sounder (AIRS) in 2002 (Aumann et al., 2003), the Infrared Atmospheric Sounding Interferometer (IASI) in 2006 (Cayla, 2001; Chalon et al., 2001) and the Cross-track Infrared Sounder (CrIS) in 2011 (Glumb et al., 2003). These instruments have drastically raised the amount of information available for meteorological purposes compared to the precedent HIRS (High-resolution Infrared Radiation Sounder) infrared sounder, launched in the late 1970s, which offers 19 IR and 1 visible channels as compared with the thousands of channels available in this new generation of instruments.
The first of these advanced infrared sounders, AIRS, was launched on board the research satellite Aqua in May 2002. Even if there was only one single copy, this instrument paved the way for the exploitation of the following hyperspectral sounders such as IASI and CrIS. It is a grating spectrometer providing 2378 channels with approximately 1 cm−1 spectral range resolution covering the range from 3 to 15 µm. For reasons of computational cost as well as the fact that much of the information is redundant, this huge amount of channels cannot be assimilated in numerical weather prediction (NWP) models. Hence, further studies were carried out to select appropriate channels (Rodgers, 1996; Susskind et al., 2003). Despite its experimental conception, AIRS was soon assimilated by operational meteorological models. First attempts at using AIRS radiances led to an improvement around 0.5–1 % in the NWP index used by the Met Office to quantify the accuracy of NWP models (Collard et al., 2003). Although this improvement was relatively small, it was encouraging as it was obtained assuming a conservative approach, i.e. with the assimilation of AIRS data only for clear-sky fields of views over sea and with a rather limited number of channels (at most 86 channels). Further studies found that the addition of AIRS data to the observation system improved long-range forecasts (Le Marshall et al., 2006). The study by Fourrié and Thépaut (2003) showed through different experiments that the AIRS near-real-time channel selection seems very reasonable for NWP applications despite the overall slightly smaller information content vs. optimally derived channel selections and that it appears to be robust.
IASI is the second advanced infrared sounder launched in the last decade (2006). IASI is an infrared Fourier transform interferometer and is the first instrument of this type to fly as a part of the MetOp operational satellite series. IASI registers the IR spectrum between 3.6 and 15.5 µm, providing 8461 channels with a spectral apodised resolution of 0.5 cm−1 at a spectral sampling of 0.25 cm−1. As in the case of AIRS, preliminary studies showed that a subset of channels was preferred for an assimilation because of the computing costs and of the existence of correlated information between contiguous channels (Rabier et al., 2002). Preliminary studies about the assimilation of IASI data in the ECMWF (European Centre for Medium-range Weather Forecast) model found a mainly positive impact for IASI assimilation and a better quality of the measurements in the 15 µm CO2 band compared to AIRS (Collard and McNally, 2009).
The first Met Office tests on the assimilation of IASI radiances showed a positive impact for the global model forecast (Hilton et al., 2009). Data from infrared sounders (HIRS, AIRS) and microwave instruments (AMSU-A and MHS) were already assimilated. The impact is mainly obtained for geopotential height, mean surface level pressure and wind forecast depending on the verification areas. Guidard et al. (2011) studied the impact of IASI assimilation in both global and regional Météo-France models. They showed a quite good impact on the forecast skills for large-scale variables such as tropospheric temperature, wind fields and 500 hPa geopotential height both in the global ARPEGE (Action Petite Echelle Grande Echelle) model (Courtier et al., 1991) and the AROME (Actions of Research to Operations at Mesoscale) regional model (Seity et al., 2011). Precipitation forecasts were also improved in AROME. Hilton et al. (2012), in a review of the main IASI results after 5 years of IASI being in operation, remark that the impact scores in global models have been particularly impressive even though IASI is assimilated into an analysis system that is already very well characterised with around 10 microwave and five additional infrared sounders, in addition to conventional in situ measurements.
Although the first objective of atmospheric sounders was to get the temperature and humidity profiles for meteorological applications, this new generation of instruments made possible invaluable advances in the field of atmospheric chemistry. Thus, many advances were made in the measurement of trace gases and aerosols (Clerbaux et al., 2009, and references therein) which are key parameters for environmental and climate variables. IASI evidenced a potentially good impact of O3 and CO on air quality forecasts and carries on the long-term chemical records started with other instruments such as the Tropospheric Emission Spectrometer (TES), the Interferometric Monitor for Greenhouse Gases instrument (IMG), the Global Ozone Monitoring Experiment (GOME-2) and Measurement of Pollution in the Troposphere (MOPITT) (Dufour et al., 2012; Hilton et al., 2012). Furthermore, some reactive species thought to be undetectable from space such as ammonia have also been measured, thanks to the excellent IASI signal-to-noise ratio (Clarisse et al., 2009). Other major atmospheric events like volcano eruptions, desert dust intrusions, fires or pollution events can be monitored using IR sounder data (Karagulian et al., 2010; Klüser et al., 2013; Capelle et al., 2014; Clerbaux et al., 2009; George et al., 2009).
This effort to provide more effective and accurate instruments is ongoing with a new generation of sounders, such as IASI New Generation (IASI-NG; Bermudo et al., 2014; Crevoisier et al., 2014) on board the MetOp Second Generation (MetOp-SG) and IRS (Infrared Sounder) on board the MeteoSat Third Generation satellites, which will be launched in 2020. The former of these two instruments covers the same spectral range as IASI with a noise reduction of at least a factor of 2 and a twice-as-high spectral resolution. IRS will fly on a geostationary satellite providing IR spectrum measurements over Europe every 30 min.
Observing simulated system experiments (OSSEs) are commonly conducted to assess the impact of future observing system on the description of the state of the atmosphere for meteorological purposes (Atlas, 1997; Masutani et al., 2010) or air quality (Timmermans et al., 2015). During these experiments, the full observation database is built from a realistic description of the state of the atmosphere, the Nature Run. The content of the database is fed into NWP models or chemistry algorithms, whose results are evaluated against a reference set. OSSEs are very useful to estimate future observing system impact but at a high computation cost because OSSEs typically mimic state-of-the-art data assimilation systems.
In this work we built a database of IASI/IASI-NG radiances to evaluate the impact of IASI-NG data with respect to IASI data using two radiative transfer (RT) models: 4A (Automatised Atmospheric Absorption Atlas; Scott and Chedin, 1981; Tournier et al., 1995; Chaumat et al., 2012) and RTTOV (Radiative Transfer for TOVS, TIROS (Television Infrared Observational Satellite) Operational Vertical Sounder; Matricardi et al., 2004; Hocking et al., 2015). Having two sets of simulations enables one to carry out observation impact experiments using a different RT model than the one linked to the simulation algorithm; i.e. if the user employs RTTOV in the retrieval algorithm, the 4A simulation dataset could be used. This use of a different RT for the retrieval adds a more realistic error to the radiance data. To illustrate the potential of this database, it is then employed to evaluate the impact of IASI-NG with respect to IASI on the retrieval of the temperature and humidity profiles.
First, we present here a common database of IASI and IASI-NG simulations to assess the expected benefits of the latter instrument. This database will serve as a common base for future impact studies on the impact of IASI-NG. A preliminary impact study in a one-dimensional variational analysis (1D-Var) retrieval context is presented in the later sections of this work. An exhaustive description of the atmospheric state has been built in the middle of four different dates for each year's season to serve as a basis for future evaluation of IASI-NG impact. This paper is organised as follows: Sect. 2 describes in detail the IASI-NG sounder and the main differences with the IASI sounder. Sections 3 and 4 depict the procedure devised to build the simulated observation database, and the main results of the information are included in the latter. Section 5 deals with the methodology used for the evaluation of using IASI-NG for the retrieval of temperature and water vapour profiles. Finally, the summary and conclusions are provided in Sect. 6.
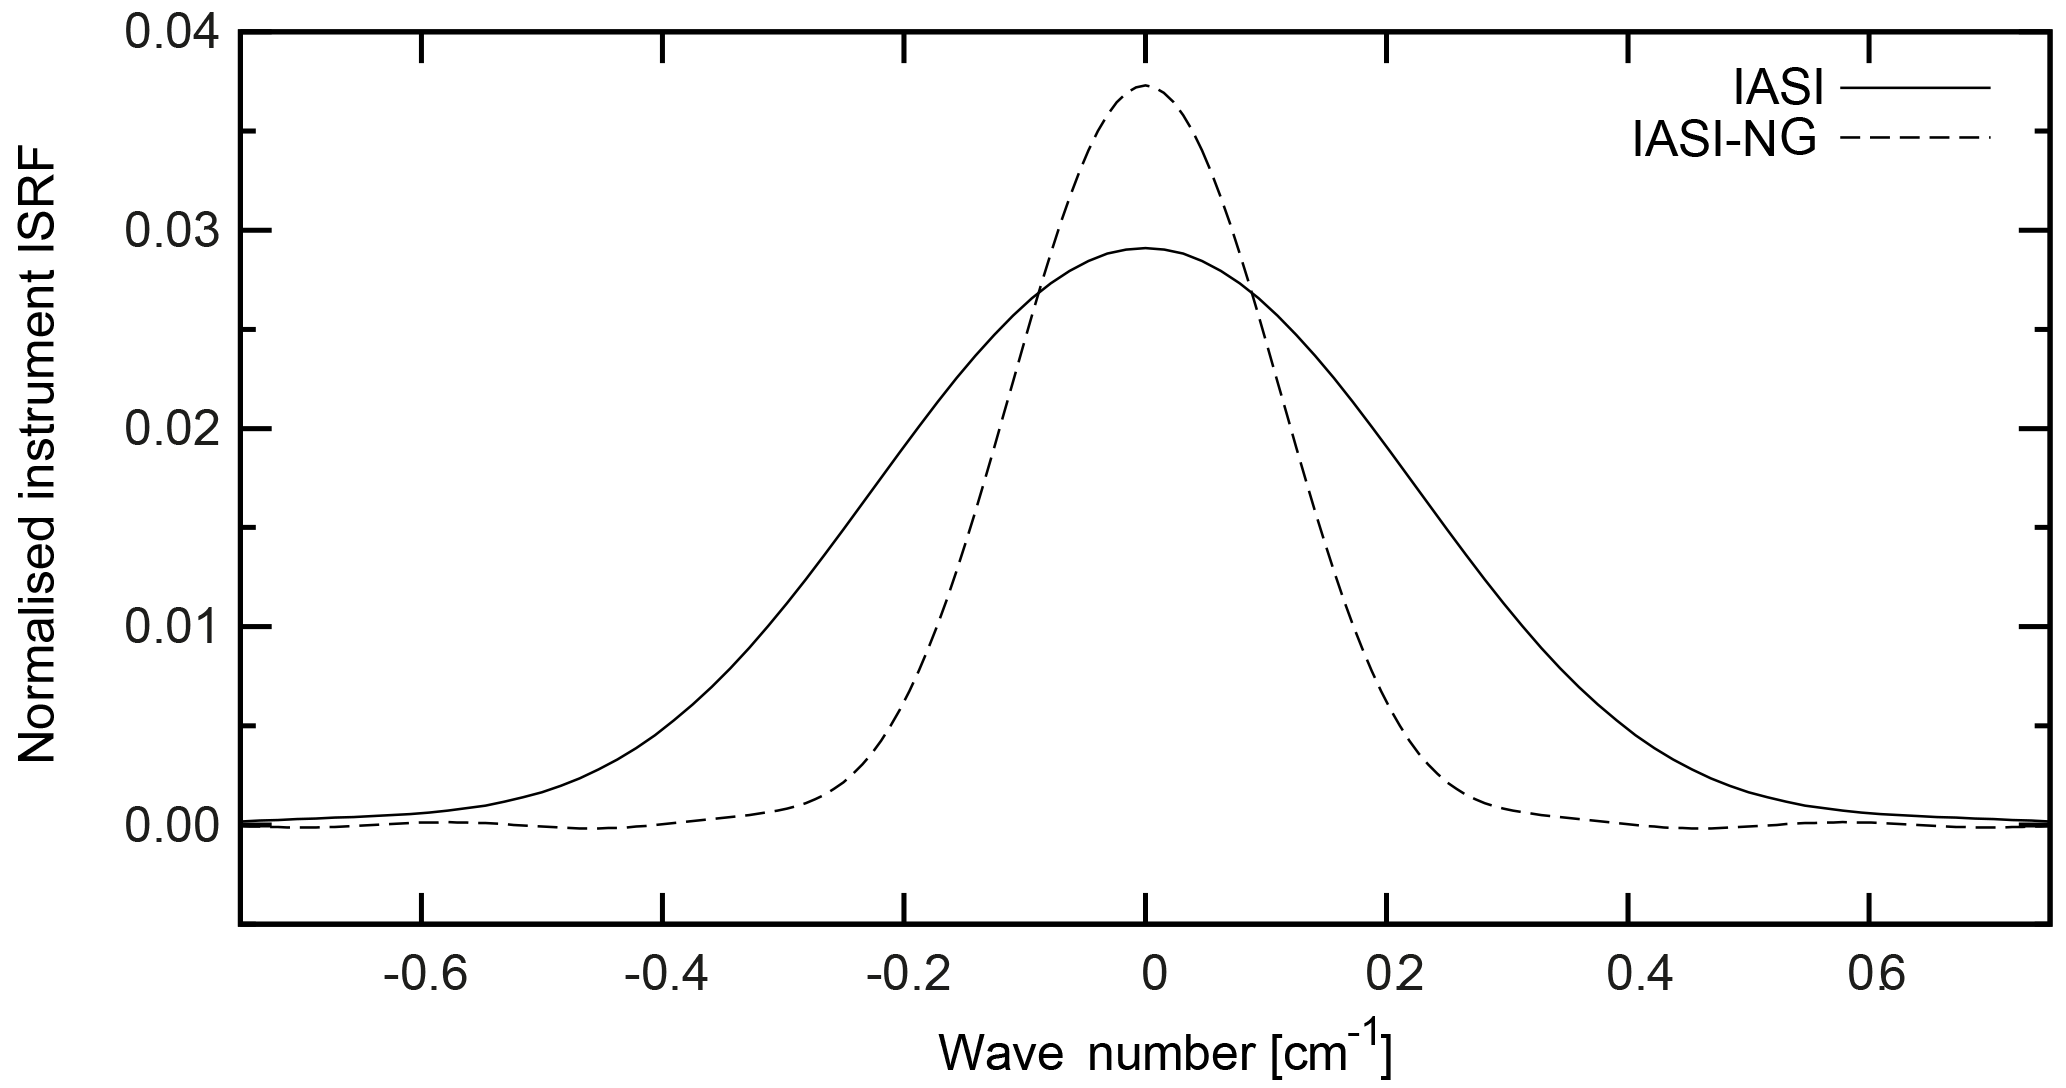
Figure 2IASI and IASI-NG instrument spectral response functions (ISRFs). IASI-NG spectral resolution is double that of IASI thanks to the optical path increment providing thinner instrument ISRFs.
IASI (Cayla, 2001; Simeoni et al., 1997) is a space-borne interferometer able to characterise the Earth infrared spectra in the range from 645 to 2760 cm−1 (15.5 to 3.63 µm) with a spectral resolution of 0.5 cm−1, a spectral sampling of 0.25 cm−1 and 8461 channels divided in three different bands:
-
band 1, from channel 1 to 1997 (645.00 to 1144.00 cm−1, 15.50 to 8.74 µm), used for temperature, surface properties, clouds, carbon dioxide and ozone retrievals;
-
band 2, from channel 1998 to 5116 (1144.25 to 1923.75 cm−1, 8.74 to 5.20 µm), used for the retrieval of water vapour, methane and nitrous oxide;
-
band 3, from channel 5117 to 8461 (1924.00 to 2460.00 cm−1, 5.20 to 3.62 µm), sensitive to temperature, surface properties, carbon monoxide, carbon dioxide and nitrous oxide. It is not used at Météo-France because of its larger noise compared to the two other bands.
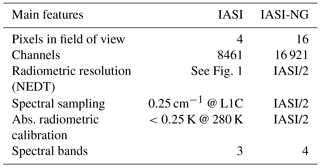
The pixel size at nadir is 12 km, being acquired by four pixels per field of view. Each scan line is compounded by 30 views. The measurement accuracy is expected to be better than 1 K for temperature retrievals and 10 % below 500 hPa for relative humidity retrievals with a vertical resolution finer than 1 km (Diebel et al., 1996). Currently, two IASIs are in flight on board the MetOp-A and MetOp-B satellites, launched in 2006 and 2012 respectively. A third IASI will be launched in 2018 on board the MetOp-C satellite. In total, the IASI programme is expected to provide a minimum of 15 years of data with good radiometric and spectral stability.
IASI-NG, the next generation of the IASI instrument, will be on board EUMETSAT MetOp Second Generation satellites (MetOp-SG). The first of MetOp SG satellites is expected to be launched in 2021 and will have an overpassing frequency of twice a day at mid-latitudes like IASI. To achieve global coverage, the instrument will perform 14 views per line along the satellite track. This corresponds to 2×7 mirror positions covering a swath of about 2×1000 km (Bermudo et al., 2014) along the satellite track. Each instrument single field of view of composed by an array of 4×4 pixels with a size of 12 km at nadir. The surface covered by each view corresponds to a square of 100 km of side length.
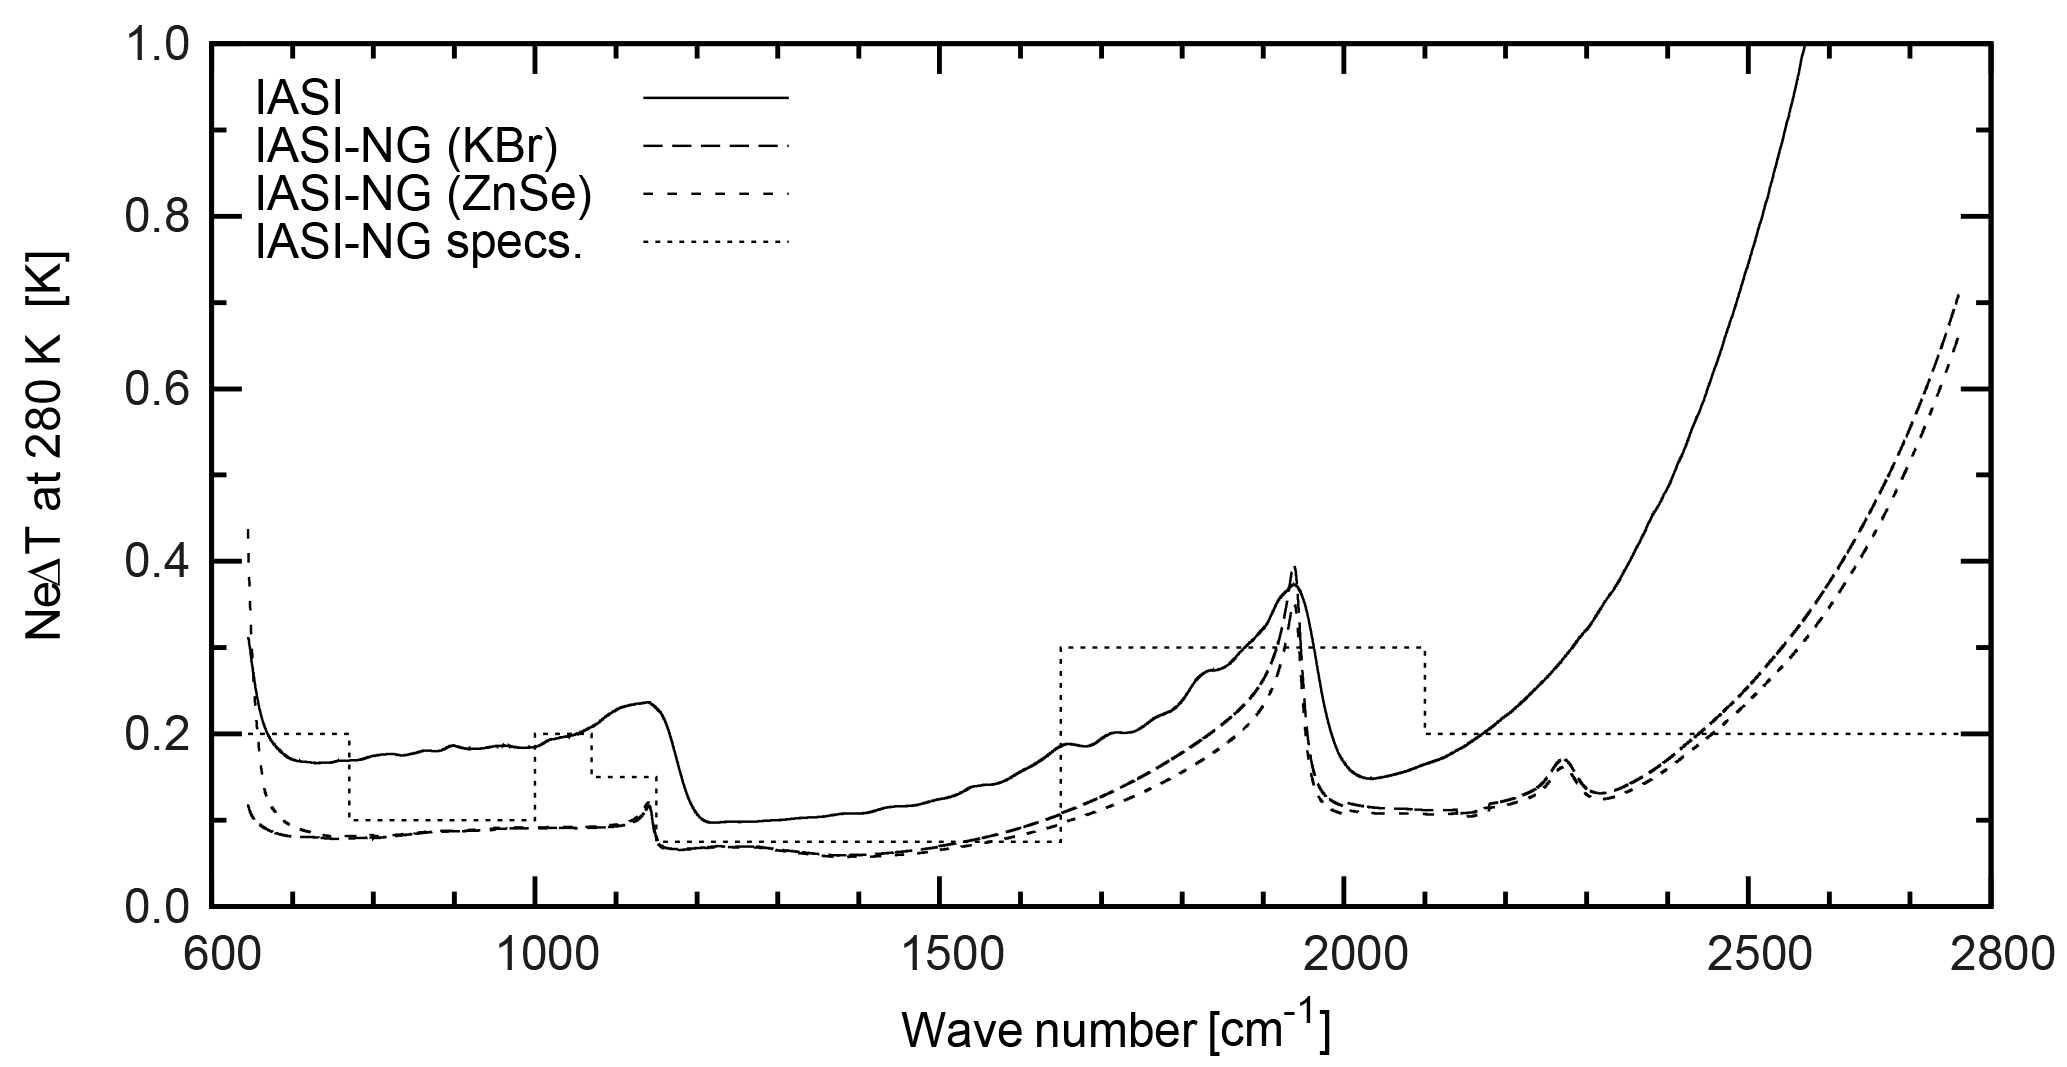
The IASI-NG instrument concept is based on a Mertz interferometer allowing to assess the self-apodisation issue by a field effect compensation. The field effect compensation allows correcting the differences in the optical path of the different rays that build the interferogram and requires introducing additional optical elements (Baker, 1980). In the case of the Mertz interferometer this correction of the optical path is performed by two prisms with an appropriate refractive index. One of the requirement of IASI-NG is to have a noise at least divided by a factor of 2 compared to the IASI one. The IASI-NG noise is related to the optical properties of the prism material. At the current instrument development stage, two different materials are considered, viz. KBr and ZnSe. The former of the two materials has been chosen because of its better spectral response, especially at the beginning of the measured spectral range. The noises of IASI and IASI-NG considering both materials are shown in Fig. 1. Although the KBr noise signature is slightly higher than that of ZnSe, the latter material does not meet the requirements at the beginning of the first band, with expected noise values 50 % higher than IASI-NG specifications. For the time being, ZnSe material has been discarded for the final instrument configuration. Future studies using the database presented in this work may help to decide which of the two materials should be used for the final instrument. The IASI-NG noise reduction is achieved by using twice the integration time of IASI, and the increment of the instrument spectral resolution is accomplished thanks to the 8 cm optical path of IASI-NG, twice the 4 cm IASI optical path.
IASI-NG will have an additional band compared to IASI passing from three to four bands. IASI band 3 will be divided into two different bands, whereas the limits for the first two bands are quite similar to IASI ones. The limits for the four IASI-NG bands are as follows: B1 from 645 to 1150 cm−1, B2 from 1150 to 1950 cm−1, B3 from 1950 to 2300 cm−1 and B4 from 2300 to 2760 cm−1.
Table 1 compares the main features of IASI and IASI-NG instruments. The consequences of this path increment on the instrument response function (ISRF) are shown in Fig. 2, where the IASI-NG ISRF width is approximately half that of IASI. Consequently, for IASI-NG, the spectral sampling is made each 0.125 cm−1 instead of 0.25 cm−1 for IASI. IASI-NG will have 16 921 channels from 645 to 2760 cm−1.
To build the database consisted, first of all, in getting the most accurate description possible of the state of the atmosphere, so that data could be used for the simulations of both IASI and IASI-NG measurements. Four different dates were chosen for the year 2013. To cover the maximum of possible meteorological variability, each date falls in the middle of each season: 4 February (North Hemisphere winter), 6 May (NH spring), 6 August (NH summer) and 4 November (NH autumn). These four periods of 24 h begin at 21:00 UTC on the previous day. Even though the dataset represents more than 5 million IASI observation points (5 242 448) over the globe, it is likely that these four days do not cover all the possible meteorological situations. However it offers the possibility to have different atmospheric profiles covering the whole Earth, with daytime/night-time and sea/land conditions.
Once these data were compiled and formatted, they were used to feed two RT models to simulate measurements.
An OpenMP parallel version of the 4A–OP 2012-1-1 model (Scott and Chedin, 1981; Tournier et al., 1995; Chaumat et al., 2012; http://ara.abct.lmd.polytechnique.fr/) and the RTTOV model (Matricardi et al., 2004; Hocking et al., 2015) were chosen as RT models. Once the instrument data were simulated, a random Gaussian noise using CNES specifications (Fig. 1) for each instrument and IASI-NG configuration was added to the simulated data. These values are valid at 280 K, and they were converted at the appropriate scene temperature for each wave number and each profiles. Two different noises were used for the IASI-NG simulations according to the two prism materials currently under consideration. Moreover, no correlation between channels was taken into account.
3.1 Input data
As mentioned above, the most accurate description of the atmosphere is required to feed the RT models. In order to achieve this goal, the vertical profiles from a selection of atmospheric constituents in the different IR absorption bands measured by both instruments were extracted for each date from global analyses provided by the Monitoring Atmospheric Composition and Climate (MACC) project of the Copernicus programme1. The extracted vertical profiles were the profiles of temperature, specific humidity, O3, CO and SO2. They were provided in 60 fixed pressure levels from 1013.25 to 0.2 hPa. For consistency's sake, the surface elevation, surface temperature and pressure were also obtained from this source.
The CO2 and CH4 three-dimensional global fields used for observation-to-profile interpolation rely on the global tracer transport model LMDZ (Hourdin et al., 2006), driven by the wind analyses from the European Centre for Medium-Range Weather Forecasts and using optimised surface fluxes following the configuration used by Chevallier et al. (2011). For CO2 fields, the model has a horizontal resolution of 3.75∘ in longitude and 1.9∘ in latitude with 39 vertical layers, from close to the surface up to 8.6 hPa. For CH4 fields, the horizontal resolution is 3.75∘ in longitude and 2.5∘ in latitude with 19 levels, from the surface up to 295 hPa.
A bilinear interpolation weighted by the inverse of the square distance was used to match the corresponding profiles and the surface values associated with each one of the IASI observations. The position and time of these IASI observations were extracted from the Météo-France operational archive. In addition to the latitude, longitude, date and time values of the IASI observations, the following parameters were also extracted from this archive: IASI azimuth and zenith angles, solar azimuth and zenith angles, cloud cover from the Advanced Very High Resolution Radiometer (AVHRR) on board MetOp, land–sea mask values from the Météo-France global model ARPEGE and IASI measurements for a subset of 314 channels selected by Collard (2007) and monitored operationally at Météo-France in 2013.
3.2 Radiative transfer models
4A is an optimised line-by-line (LBL) radiative transfer model (Scott and Chedin, 1981; Tournier et al., 1995; Chaumat et al., 2012) used as a reference RT model for the CNES/EUMETSAT IASI Level 1 Cal/Val activities and operational processing. Using the OpenMP technology, a parallel-spectrum processing capability was added to the model in order to reduce the required computing time per spectrum. Rather than using the onerous full LBL models like LBLRTM (Line-by-Line Radiative Transfer Model; Clough et al., 2005) or STRANSAC (Scott, 1974), less expensive but not-as-accurate optimised LBL models have been developed. For typical instruments like IASI and IASI-NG, precision is better than the instrumental noise. 4A allows a fast computation of the transmittance of a discrete atmosphere along the vertical at a very high spectral resolution as well as the Jacobians (Cheruy et al., 1995) (with respect to temperature, mixing ratios and surface temperature and emissivity) for a user-defined observation level. The model relies on comprehensive atlases of monochromatic optical thickness for up to 50 atmospheric molecular species and 43 pressure levels. The atlases were created using the line-by-line and layer-by-layer model STRANSAC in its latest version at the release date with spectroscopy information from the GEISA (Gestion et Etudes des Informations Spectroscopiques Atmosphériques, French for “Management and Study of Spectroscopic Information”) 2011 spectral line data catalogue (Jacquinet-Husson et al., 1999, 2003, 2011; Jacquinet-Husson, 2008). The 4A model also includes up-to-date continua of N2, O2 and H2O. 4A uses surface emissivity values supplied by Snyder et al. (1998).
RTTOV (Matricardi et al., 2004; Hocking et al., 2015) is a fast RT model for passive visible, IR and microwave (MW) satellite-borne sensors and is used in various applications. Radiance data assimilation make use of RTTOV at Météo-France, the Met Office and ECMWF for example. Simulated satellite imagery is used by forecasters to compare the forecast outputs with the satellite radiances for nowcasting. Moreover, atmospheric retrieval can be obtained through the use of the 1D-Var provided by the EUMETSAT NWP Satellite Application Facility. Fast RT models can reproduce LBL radiances with a good accuracy and computational efficiency that fulfils NWP requirements of near-real-time monitoring and satellite radiance assimilation. This kind of models use computationally efficient parametrisations that allow them to simulate radiances at a fraction of the cost required by a LBL model.
RTTOV version 11.3 was used in this study. The latter takes as input vertical profiles of pressure, temperature, water vapour and optionally other trace gases, and scattering particle parameters along with associated surface parameters. The outputs are top-of-atmosphere (TOA) radiances, brightness temperatures (BTs) and the Jacobians for the selected instrument channels. To carry out the fast computation of optical depths, RTTOV uses linear regressions to compute optical depths on a fixed set of pressure levels. The coefficients for these linear regressions are pre-computed and stored in coefficient files which are specific to each instrument.
Most RTTOV coefficient files are based on a fixed set of 54 levels, from 1050.0 to 0.005 hPa, but coefficients have also been generated on a set of 101 levels, from 1100.0 to 0.005 hPa, for some instruments, more explicitly the IR hyperspectral sounders AIRS, IASI, CRIS, IASI-NG and IRS. RTTOV can accept input profiles on an arbitrary set of pressure levels. A vertical internal interpolator maps the input profile onto the coefficient levels and, again, the computed optical depths back onto the input levels (Hocking, 2014). In the latest version of the software, RTTOV 11.3, additional options have been added to improve consistency of the input vertical profile units (Hocking et al., 2015).
3.3 Configuration of the simulations
The information contained in the IASI observation database has been used to prepare the most realistic possible atmospheric state according to the input of each RT model. Regarding the atmospheric chemistry, a total of 16 vertical atmospheric constituent profiles were ingested by 4A for the simulations: H2O; CO2; O3; N2O; CO; CH4; SO2; HNO3; OCS; CH3D; N2; and the CFCs 11, 12 and 14. For H2O, CO2, O3, CO, CH4, and SO2 species, the vertical profiles were taken from the above database. For the other species, a standard profile provided by 4A was used. All the profiles were linearly interpolated onto the 43 4A levels (43L). The reduction in the number of levels was carried out as no significant gain in accuracy was observed when using 60 levels, whereas the computing time is almost doubled in a single computer (evaluation against IASI observations not shown). RTTOV simulations were run over 60 levels with the latest coefficient files. The version 11 of RTTOV could only be supplied with six atmospheric constituents as inputs (compared with the 43 species possible with 4A), and only five vertical profiles of atmospheric constituents were provided to the model: H2O, CO2, O3, CO, and CH4. The sixth possible atmospheric species, albeit not used in our case, is N2O.
4A simulations have used surface emissivity values from internal tables over sea and sea ice. RTTOV uses the Infrared Surface Emissivity Model (ISEM; Sherlock and Saunders, 1999) for sea surface emissivities. Land surface emissivities were taken for 4A from the University of Wisconsin (UW) IR atlas of emissivities (Seemann et al., 2008) for the year 2013. RTTOV simulations also used the UW atlas of emissivities but for the year 2007. Since RTTOV uses precomputed atlas values to speed up the calculations, it was not possible to use the 2013 atlases. As negligible differences are expected in the UW atlas emissivity values between the years 2007 and 2013, the RTTOV precalculated emissivity files have been used. Table 2 summarises the main differences between both RT runs.
The IASI viewing geometry was used for the simulations of both instruments despite the different scanning geometry of IASI-NG because scan geometry was not yet clearly defined at the time the dataset was built.
Although the AVHRR cloud cover values corresponding to each IASI pixel and cloud vertical profiles have been included in the database, we have chosen not to consider cloudy conditions because of computational cost of these kinds of simulations and also due to the large uncertainties in cloud radiative properties modelling.
Once the simulations were carried out, a random Gaussian noise was added to the simulations using the standard noise equivalent temperature difference (NEDT) at 280 K provided by the CNES (Fig. 1). Two different noises were considered for IASI-NG depending on the prism material (KBr or ZnSe), which produced two IASI-NG simulation datasets.
4.1 Information contained in the database
A total of 5 242 047 IASI observations were compiled for the four selected dates. From this total, 3 463 432 observations correspond to sea pixels, 185 916 were from coastal regions and 1 591 529 were from over land. An overview of the distribution of the observation according to different latitude bands and AVHRR cloud mask values is given in Table 3. Five latitude belts have been considered: the North Pole, the mid-latitudes of the Northern Hemisphere, the tropics, the mid-latitudes of the Southern Hemisphere and the South Pole. For the AVHRR cloud mask, there is no value for some observations. The Northern Hemisphere presents more clear observations compared to the South. In total, clear cases represent 15.0 % of the total number of simulations. The no-flag, partly cloudy and cloudy simulations are respectively 1.6, 39.0 and 44.4 % of the 5 242 047 total simulations.
Snyder et al. (1998)Table 2Summary of the main differences between 4A and RTTOV radiative transfer (RT) model run configurations.
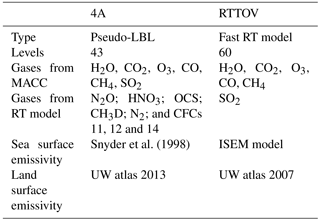
Table 3Geographical distribution of 5 242 047 IASI simulations (performed on four days in 2013) according to latitude bands with the corresponding AVHRR cloud mask value (“No flag” states that the cloud mask value is missing).
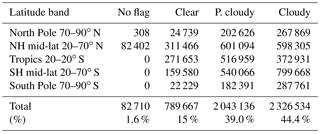
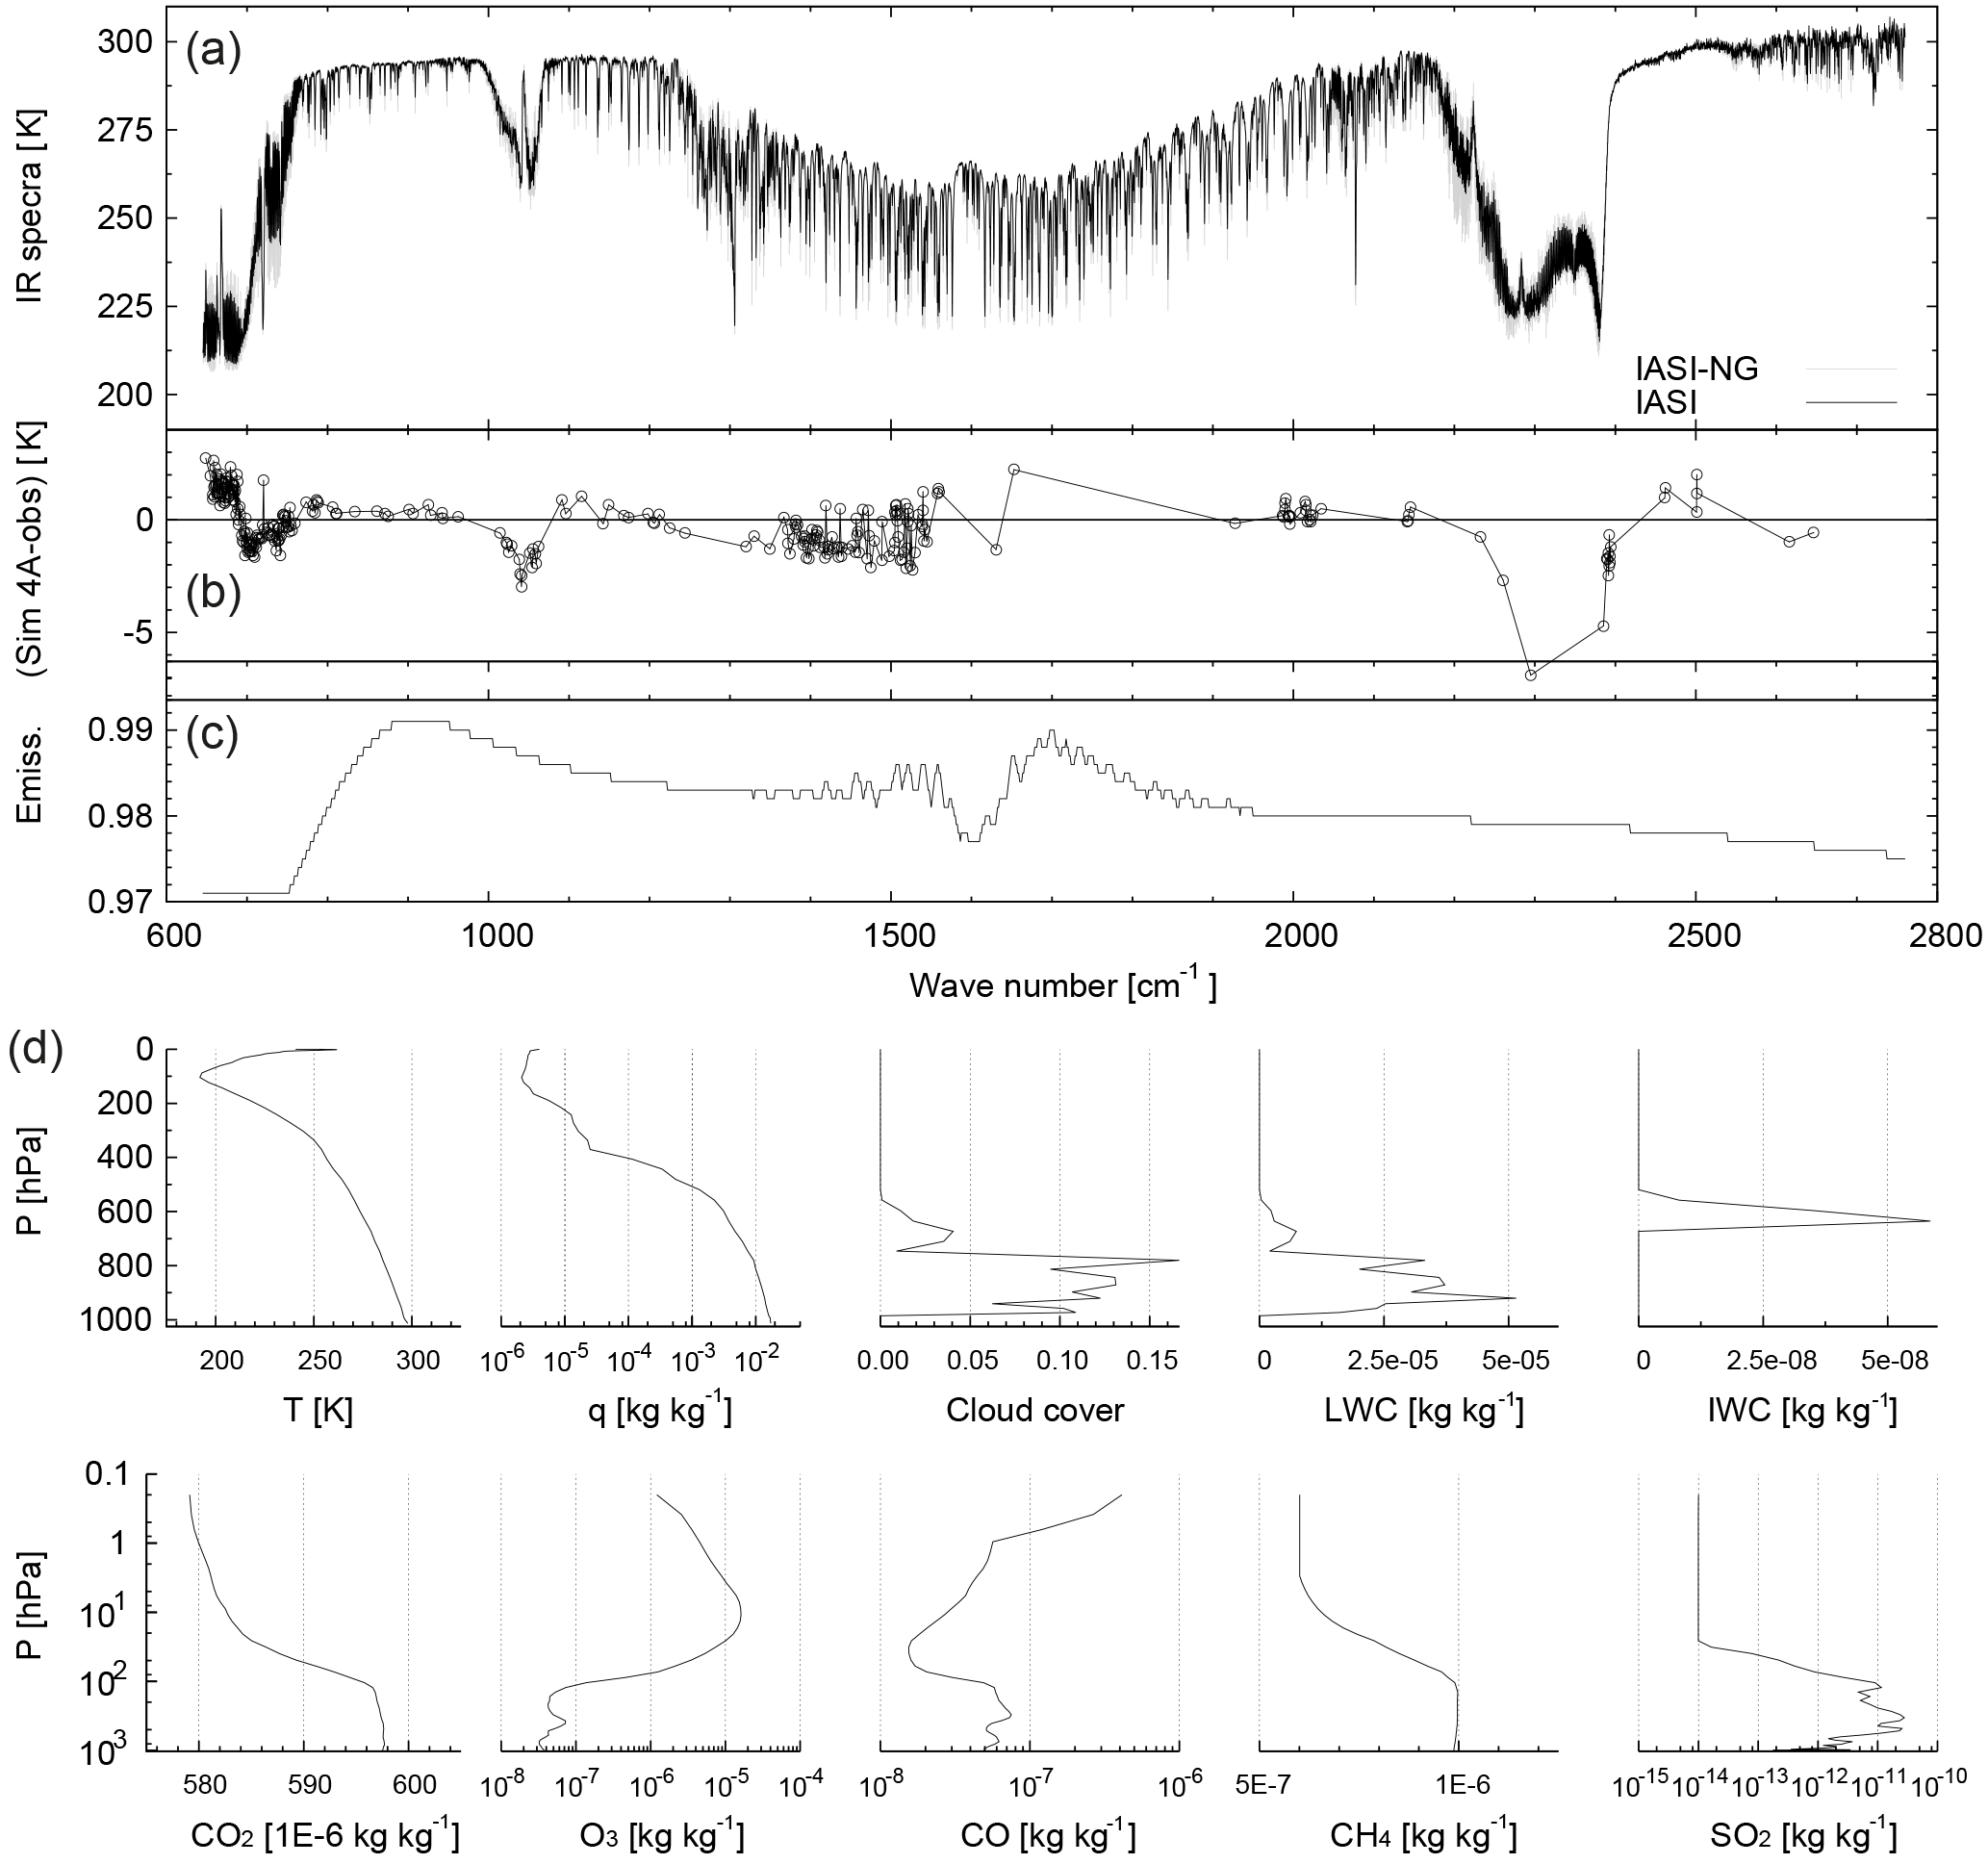
Figure 3Example of the information for a single simulation corresponding to 3 February 2013 at 21:13:46: the IASI and IASI-NG simulations (a), the differences between the 4A IASI simulations and the IASI observations (b) and the surface emissivity spectrum (c). The bottom panel (d) displays the vertical profiles of temperature, specific humidity, cloud cover and hydrometeor contents (ice water content (IWC), liquid water content (LWC)) and atmospheric trace gases.
Table 4Additional parameters associated with the observations shown in Fig. 3.
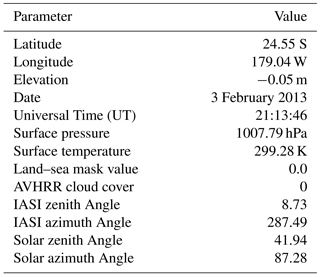
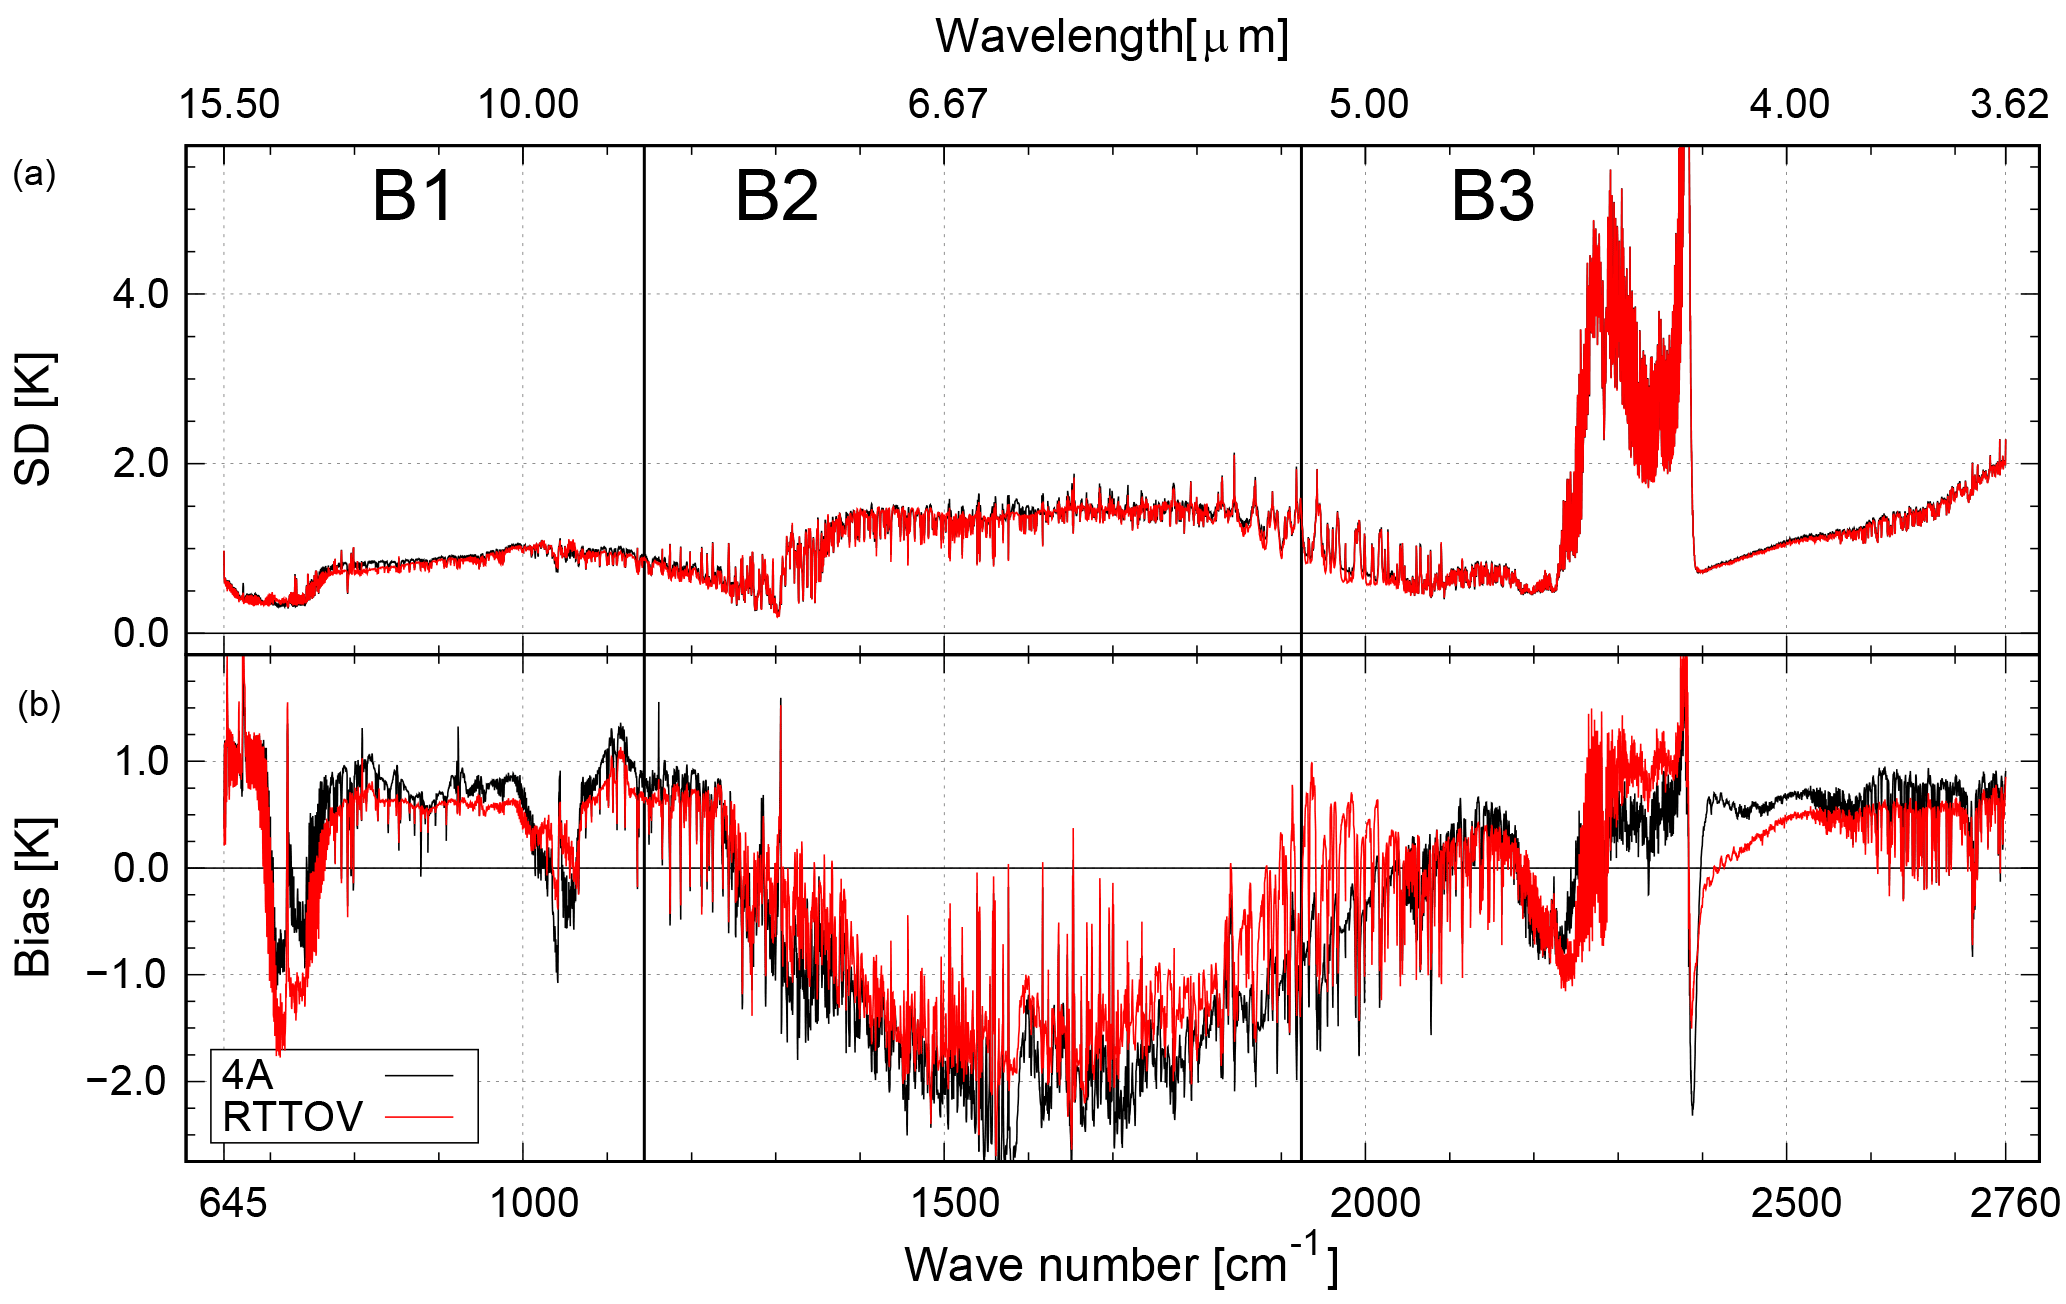
Figure 4Statistics of IASI brightness temperature differences between model simulations (4A and RTTOV) and observations in terms of SD (a) and bias (b). The observations were sampled during night-time over clear-sky ocean surfaces for a single orbit (6 August 2013). The sample size is 2877. B1, B2 and B3 correspond to the three IASI bands.
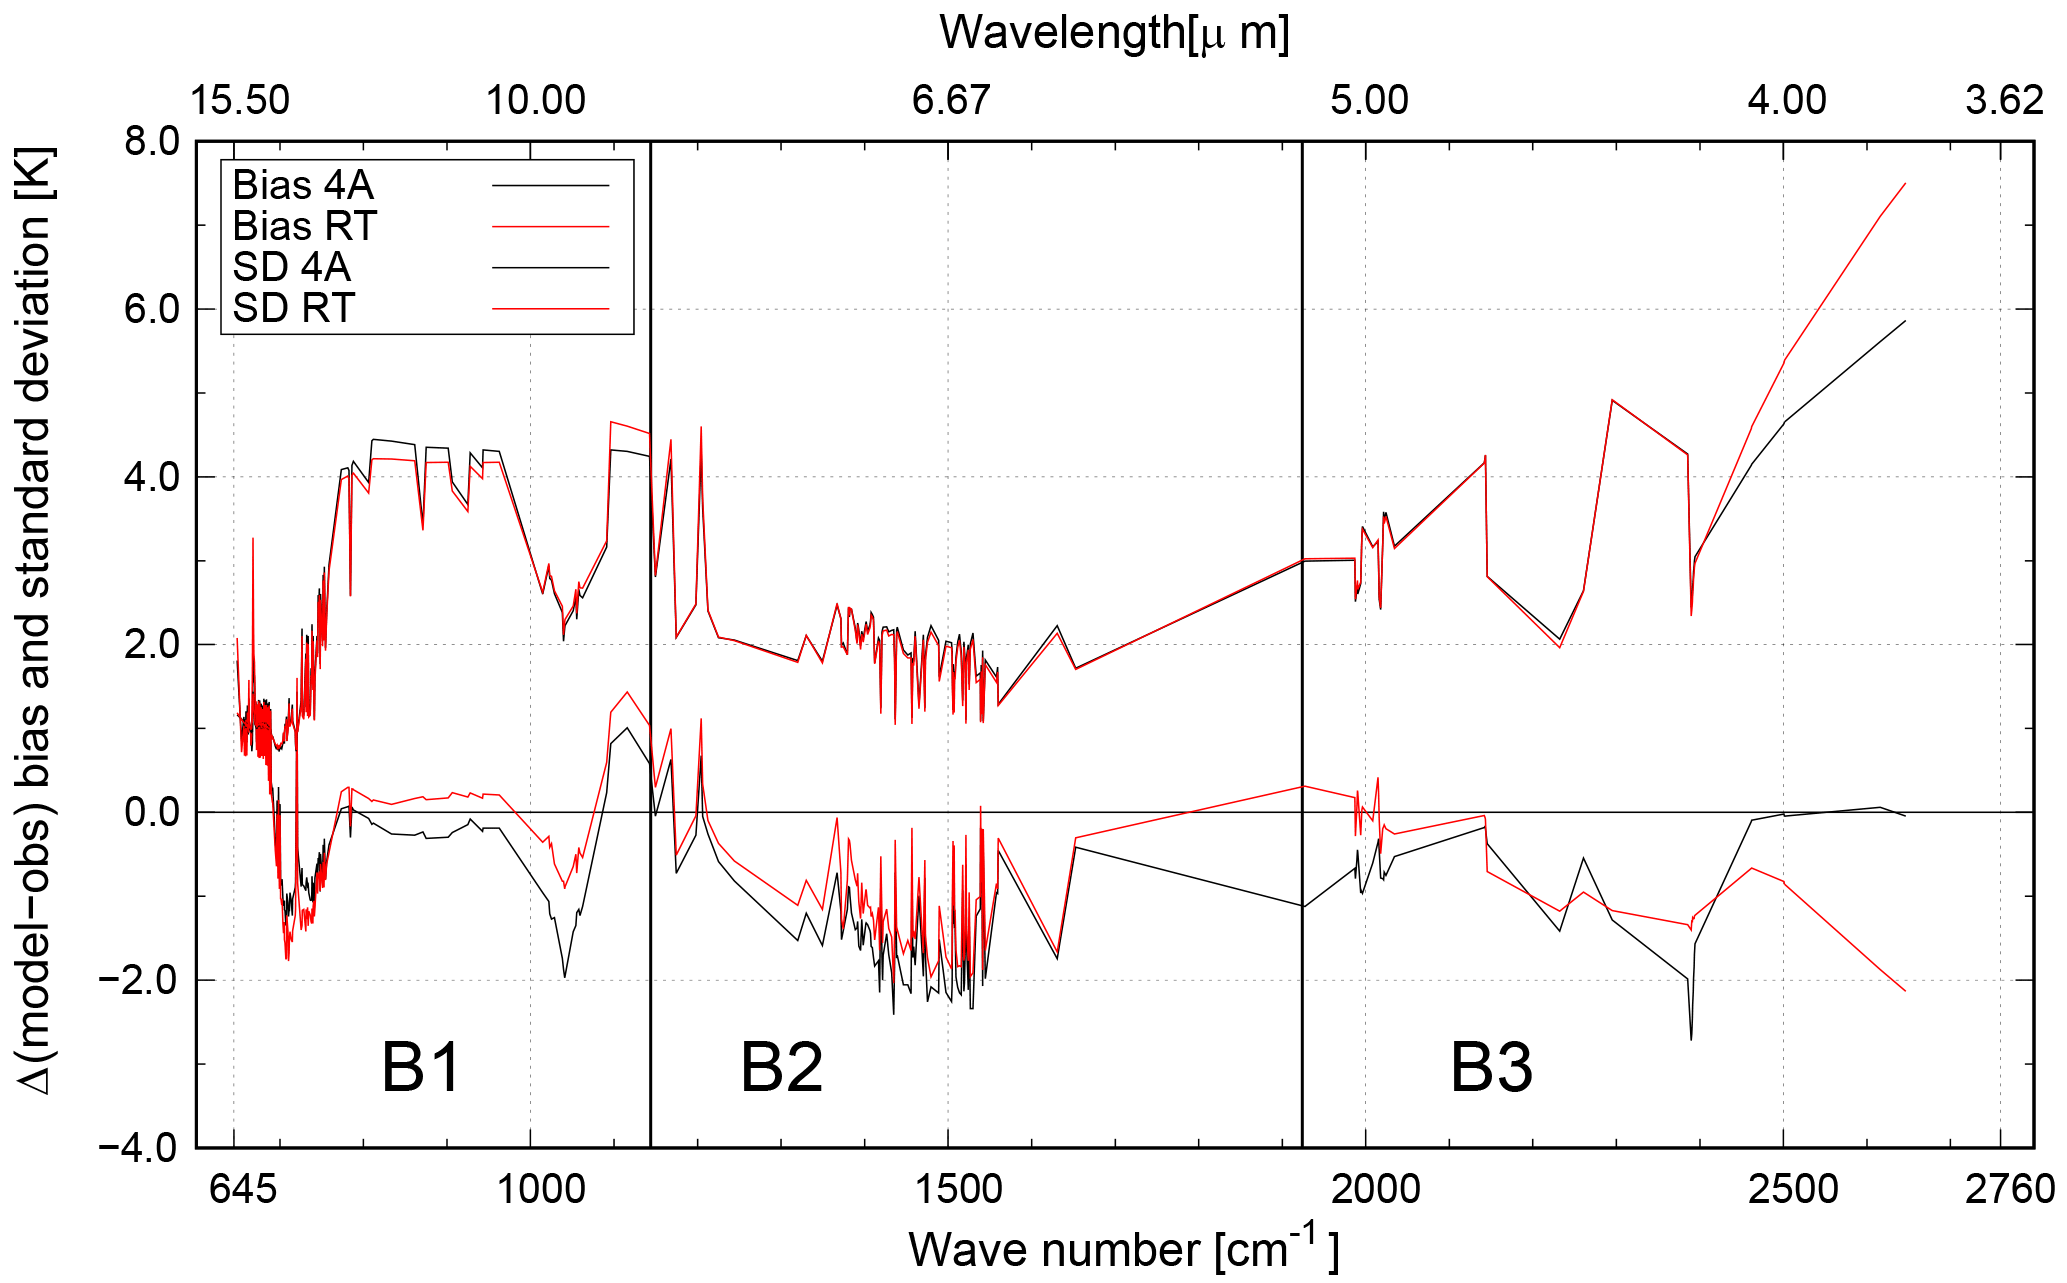
Figure 5Bias (straight lines) and SD (dashed lines) of differences between model simulations and observations in 314 channels for the 789 573 IASI observations taken under clear-sky conditions according to the AVHRR cloud flag during daytime and night-time and above all surface types. B1, B2 and B3 correspond to the three IASI bands.
Figure 3 presents the information available in the database associated with an IASI observation taken out in the South Pacific (179.0∘ W, 24.55∘ S) on 3 February 2013 at 21:13:46 UT. The simulated brightness temperatures presented in this figure come from the 4A RT model dataset. Figure 3a compares the results from full IASI (black) and IASI-NG (grey) spectrum simulations. IASI-NG presents a higher variability of the spectrum than IASI because of its higher spectral resolution. As a result, it is expected that new atmospheric constituents can be detected by IASI-NG and that those already detected, such as water vapour isotopologues, will be better characterised (Wiegele et al., 2014).
The differences between the IASI 4A simulated spectrum and the corresponding observation for the 314 available channels in the Météo-France archive range from −3 to 3 K, except for the region between 2280 and 2400 cm−1, where they increase to around 7 K (Fig. 3b). Those bands associated with the input vertical profiles present larger differences than the regions corresponding to surface properties. The region between 2280 and 2400 cm−1 is strongly affected by the so-called ghost effect (Lezeaux, 2007; Bormann et al., 2010). This effect was caused by the IASI compensation device but vanished when the device was turned off on 7 October 2015 (Maraldi et al., 2015b). Finally the third horizontal panel presents the sea surface emissivity from the 4A model. In this case, the surface emissivity varies between 0.971 and 0.991.
The first row of Fig. 3d presents the values of temperature and cloud properties extracted from the MACC project. The vertical profiles of the different atmospheric constituents used for the simulation are shown in Fig. 3e. The additional information concerning this IASI observation can be found in Table 4: latitude, longitude, terrain elevation, date, time, surface pressure and temperature, ARPEGE land–sea mask, AVHRR cloud cover, instrument zenith and azimuthal angles, and solar zenith and azimuthal angles.
4.2 Evaluation of simulations results
A first evaluation of the simulations was made using the IASI MetOp-A full-spectrum brightness temperatures from the orbit beginning 6 August 2013 at 20:35:59 considering only clear-sky observations over sea, including sea ice during night-time. Hence, 2877 out of the 91.800 IASI measurements carried out in each IASI orbit were retained.
The mean values (biases) present differences, which are displayed in Fig. 4. In the first band, the RTTOV bias is lower than the 4A one excluding the CO2 band, between 665 and 675 cm−1 and from 700 to 745 cm−1. It should be noted that RTTOV uses a set of predefined CO2 to generate the coefficient file, which dates from 2013 and varies between 300 and 500 ppmv (parts per million by volume). Since that date, the global CO2 concentration has increased by 2.5 % approximately, making this RTTOV profile training set possibly obsolete. 4A computes optical depths directly using the input vertical profiles, allowing for more accurate values for them than using a set of predefined lookup tables. The fact that RTTOV presents a lower bias than 4A in the rest of the band arises from not having considered the same sea surface model. As mentioned before, 4A uses constant emissivity values from Snyder et al. (1998), while in RTTOV the sea surface emissivity is computed by the ISEM model, which takes into account the skin temperature and the instrument viewing angle (Hong et al., 2010).
Whatever the spectral bands, differences could be due to the spectroscopic parameters used. The spectroscopy used by 4A came from the 2009 version of the GEISA database, and the spectroscopy used by RTTOV came from HITRAN 2012. In the second IASI band, RTTOV bias values are equal or lower to those of 4A. These differences arise most of the time from the different representation of the water vapour continuum at the stage of the simulations.
In band 3, the RTTOV bias and SDs are closer to zero at the beginning of the band but present larger values than 4A in the emission CO2 spectral window from around 2220 to 2380 cm−1. In the solar region, above 2400 cm−1, the 4A bias remains constant around 0.7–0.8 K, whereas RTTOV present lower bias values. The origin of these differences could come from (i) the different sea surface emissivity values used by the two models, (ii) the N2 continuum or (iii) line mixing effects around 4.3 µm.
The up to 10 K peak observed in the SD curves of both models at 2390 cm−1 from Fig. 4 is mainly caused by the so-called ghost effect (Bormann et al., 2010). It is generally acknowledged that this effect emanates from a perturbation in the response of the instrument which is mainly caused by micro-vibrations of the interferometer separator blade, in turn induced by the instrument compensation device (Maraldi et al., 2015a). As it has been found that IASI reconstructed radiances from a principal component compression do not exhibit this artefact (Hultberg, 2010), an additional comparison between the simulated spectra and reconstructed radiances was carried out (Figure not shown). Although a difference of 10 K in the SD was found for IASI channel 6942, the value decreases to 2.0 K with reconstructed radiances. This confirms that the peak of 10 K in the SD comes from the verification observation and not from the RT model.
In order to evaluate both model simulations over a longer period (the four selected days in 2013), simulations were compared against a subset of 314 channels of IASI observations stored in the Météo-France archive. Only 789 573 clear-sky observations over both land and sea from the 5 242 047 total observations, i.e. around 15 % of the recovered IASI observations, were cloud-free observations according to the AVHRR cloud cover. The average and SD of these differences for both 4A and RTTOV simulated datasets are shown in Fig. 5.
The SDs of 4A and RTTOV simulations against observation differences are similar all over the measured spectrum. There are only three slight differences: for surface channels in the range between 750 and 950 cm−1, RTTOV presents a slightly lower values compared to 4A: around 0.11 K on average, a reduction of about 3.2 % with respect to 4A. However, in the region between 1020 and 1225 cm−1, the SDs of RTTOV differences are on average 3.5 % higher than with 4A (around 0.1 K). The third area, where differences between RTTOV and 4A are noticed, is in the solar part of the spectrum, above 2400 cm−1. These larger SDs for RTTOV come from the fact that, contrary to 4A, the solar contribution is ignored.
Regarding the differences in biases, RTTOV exhibits values closer to zero than 4A, excluding the CO2 band between 700 and 800 cm cm−1, the surface-sensitive region between 1100 and 1200 cm−1 and the three channels above 2400 cm−1, probably due to the differences in the UW atlas surface emissivity values used. As was discussed previously, emissivity values corresponding to the year 2007 were used for RTTOV simulations instead those of the year 2013.
4.3 Differences between IASI and IASI-NG simulated spectra
A comparison between IASI and IASI-NG radiance simulations is shown in Fig. 6, from 730 to 740 cm−1, belonging to the 15 µm CO2 absorption band. A single IASI observation from 6 August 2013 and acquired at 20:38:00 has been used in order to calculate the Earth IR spectrum with 4A at a resolution of 0.001 cm−1. The result is shown Fig. 6b. Figure 6a presents the CO2 absorption lines as extracted from the GEISA database (Jacquinet-Husson et al., 2011). The position of these absorption lines corresponds with the sharp peaks observed in the 4A spectrum calculation of Fig. 6b.
The simulation of the IASI and IASI-NG spectrum by RTTOV and 4A models is shown in Fig. 6c and d respectively. The values of the corresponding IASI measurements are also drawn, with dots, in Fig. 6c. The simulations of the IASI and IASI-NG spectrum from both models are very close, almost undistinguishable in this spectral range. Additionally, the differences between the measurement and the IASI simulations are very small, showing the quality of the two models in this spectral window. IASI-NG signal presents a higher variability, giving values going from 231.5 to 266.5 K, compared with the the IASI range of 239.2 to 262.4 K. This higher variability will increase the low-concentration limit of trace gas detection of IASI-NG compared to IASI.
To illustrate the potential gain brought by IASI-NG, a short study using 1D-Var retrievals and a small subset of clear-sky observations over sea is proposed in this section. Indeed these conditions represent an easier way to deal with infrared observations even if in the future the IASI-NG data will be used with different assumptions (e.g. assimilation over land and/or for cloudy sky). In this section, retrieval experiments are performed using the 1D-Var code (version 1.0) provided by the EUMETSAT NWP Satellite Application Facility (Weston, 2014). This 1D-Var system was interfaced with the RTTOV model version 11. A subset of 1681 4A simulations was extracted from the global database presented in previous sections. This subset retained only one simulation over sea under clear-sky observations according to the AVHRR cloud mask flag for each date evenly distributed over latitudes and longitudes. Observations above sea ice surface, mainly at the South Pole, were excluded from the dataset. These 1681 simulations were classified by latitude bands (Fig. 7), resulting in 522 observations for tropical latitudes (20∘ S to 20∘ N), 1068 for mid-latitudes (66.5∘ S to −20∘ S and 20∘ N to 66.5∘ N) and 91 for polar latitudes (90∘ S to 66.5∘ S and 66.5∘ N to 90∘ N). These 4A simulations will be considered as the truth in this retrieval study.
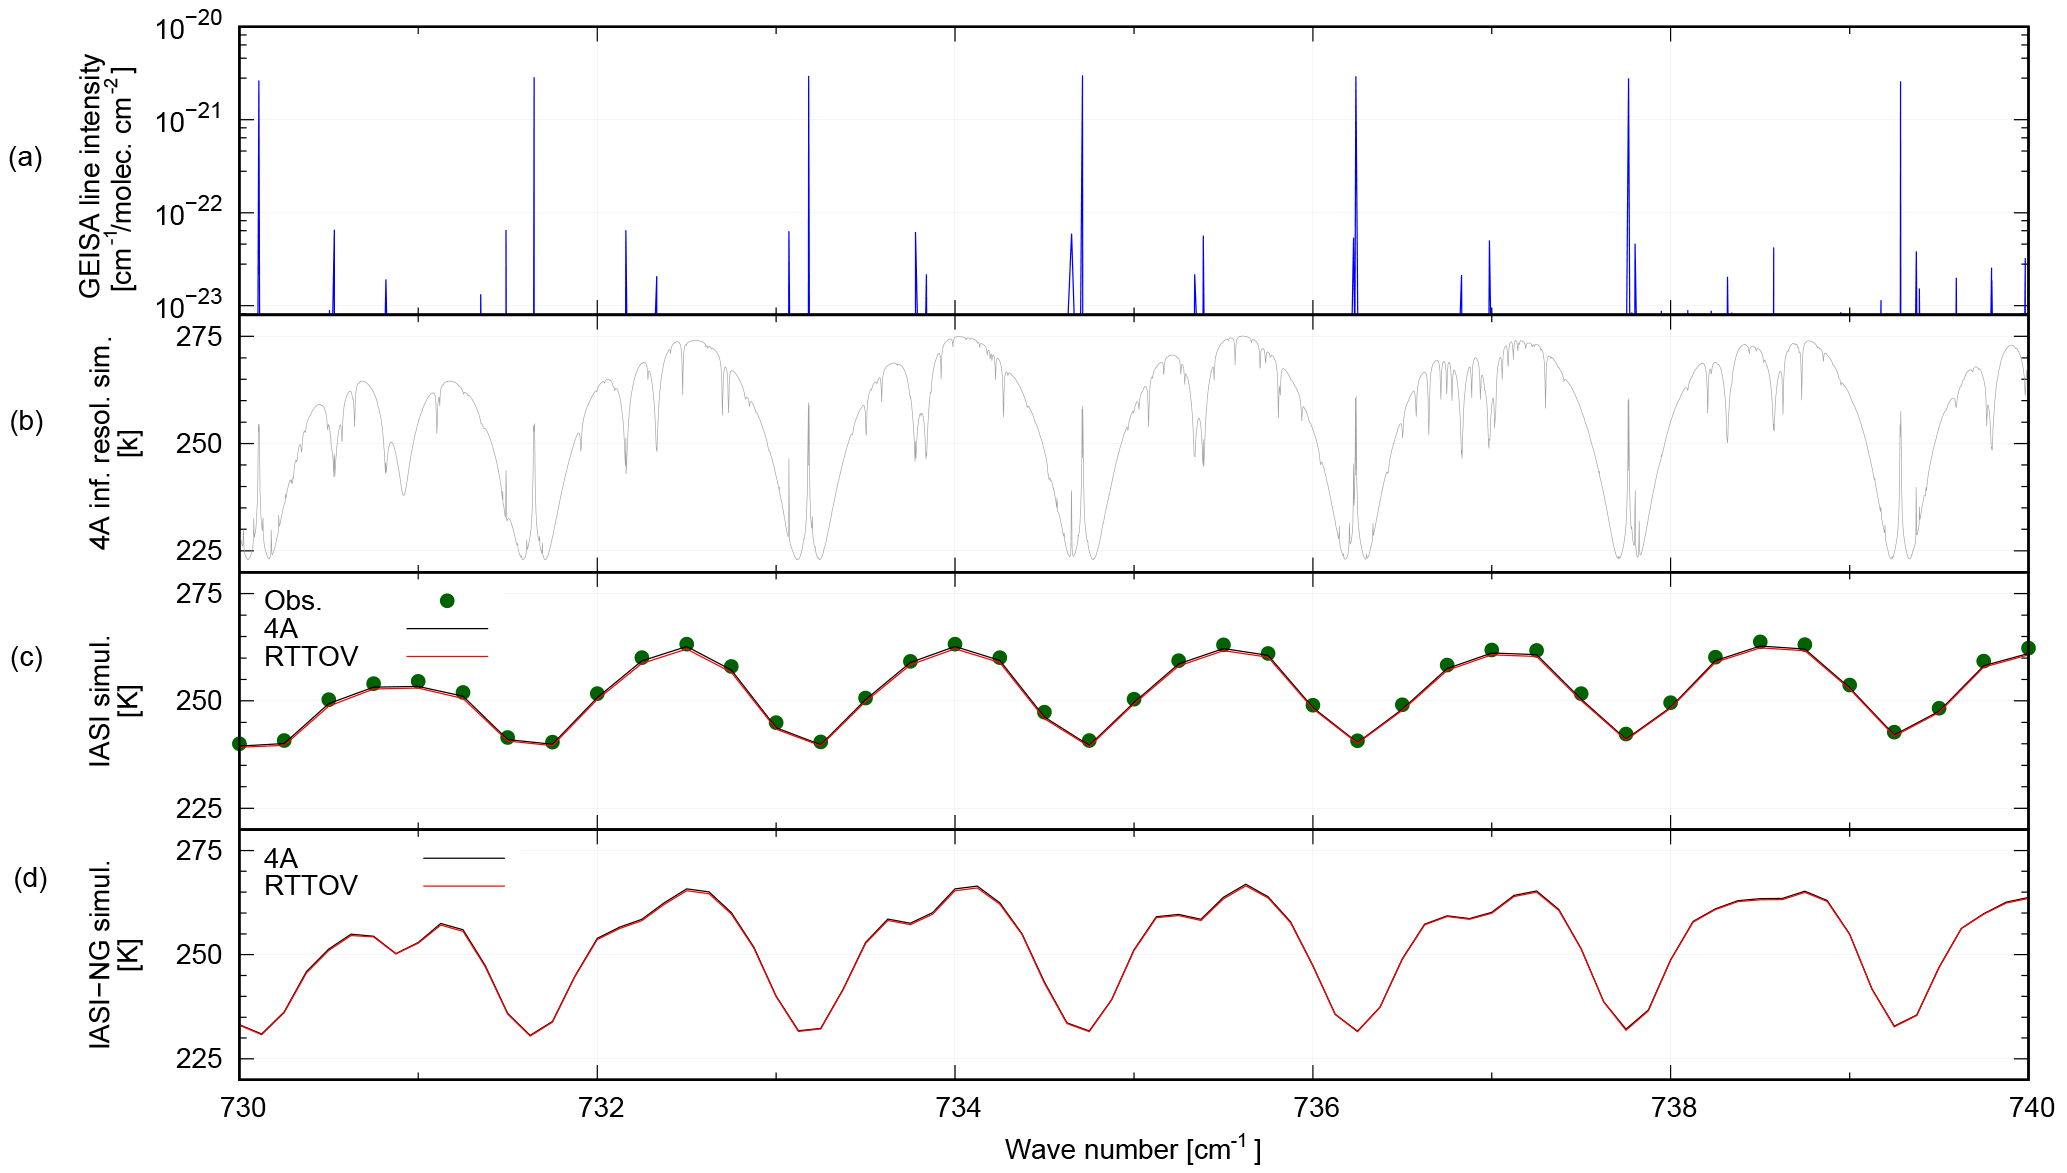
Figure 6Comparison of IASI/IASI-NG brightness temperature simulations in the 730–740 cm−1 CO2 absorption window against the Earth IR spectrum computed by 4A using a spectral resolution of 0.001 cm−1 for one atmospheric description included in the simulation dataset. (a) presents the CO2 absorption lines as obtained from the GEISA database; (b) shows the 4A spectrum calculation. (c) and (d) present the simulations of IASI and IASI-NG spectra respectively. IASI observations are also included in the IASI simulations panel (green dots).
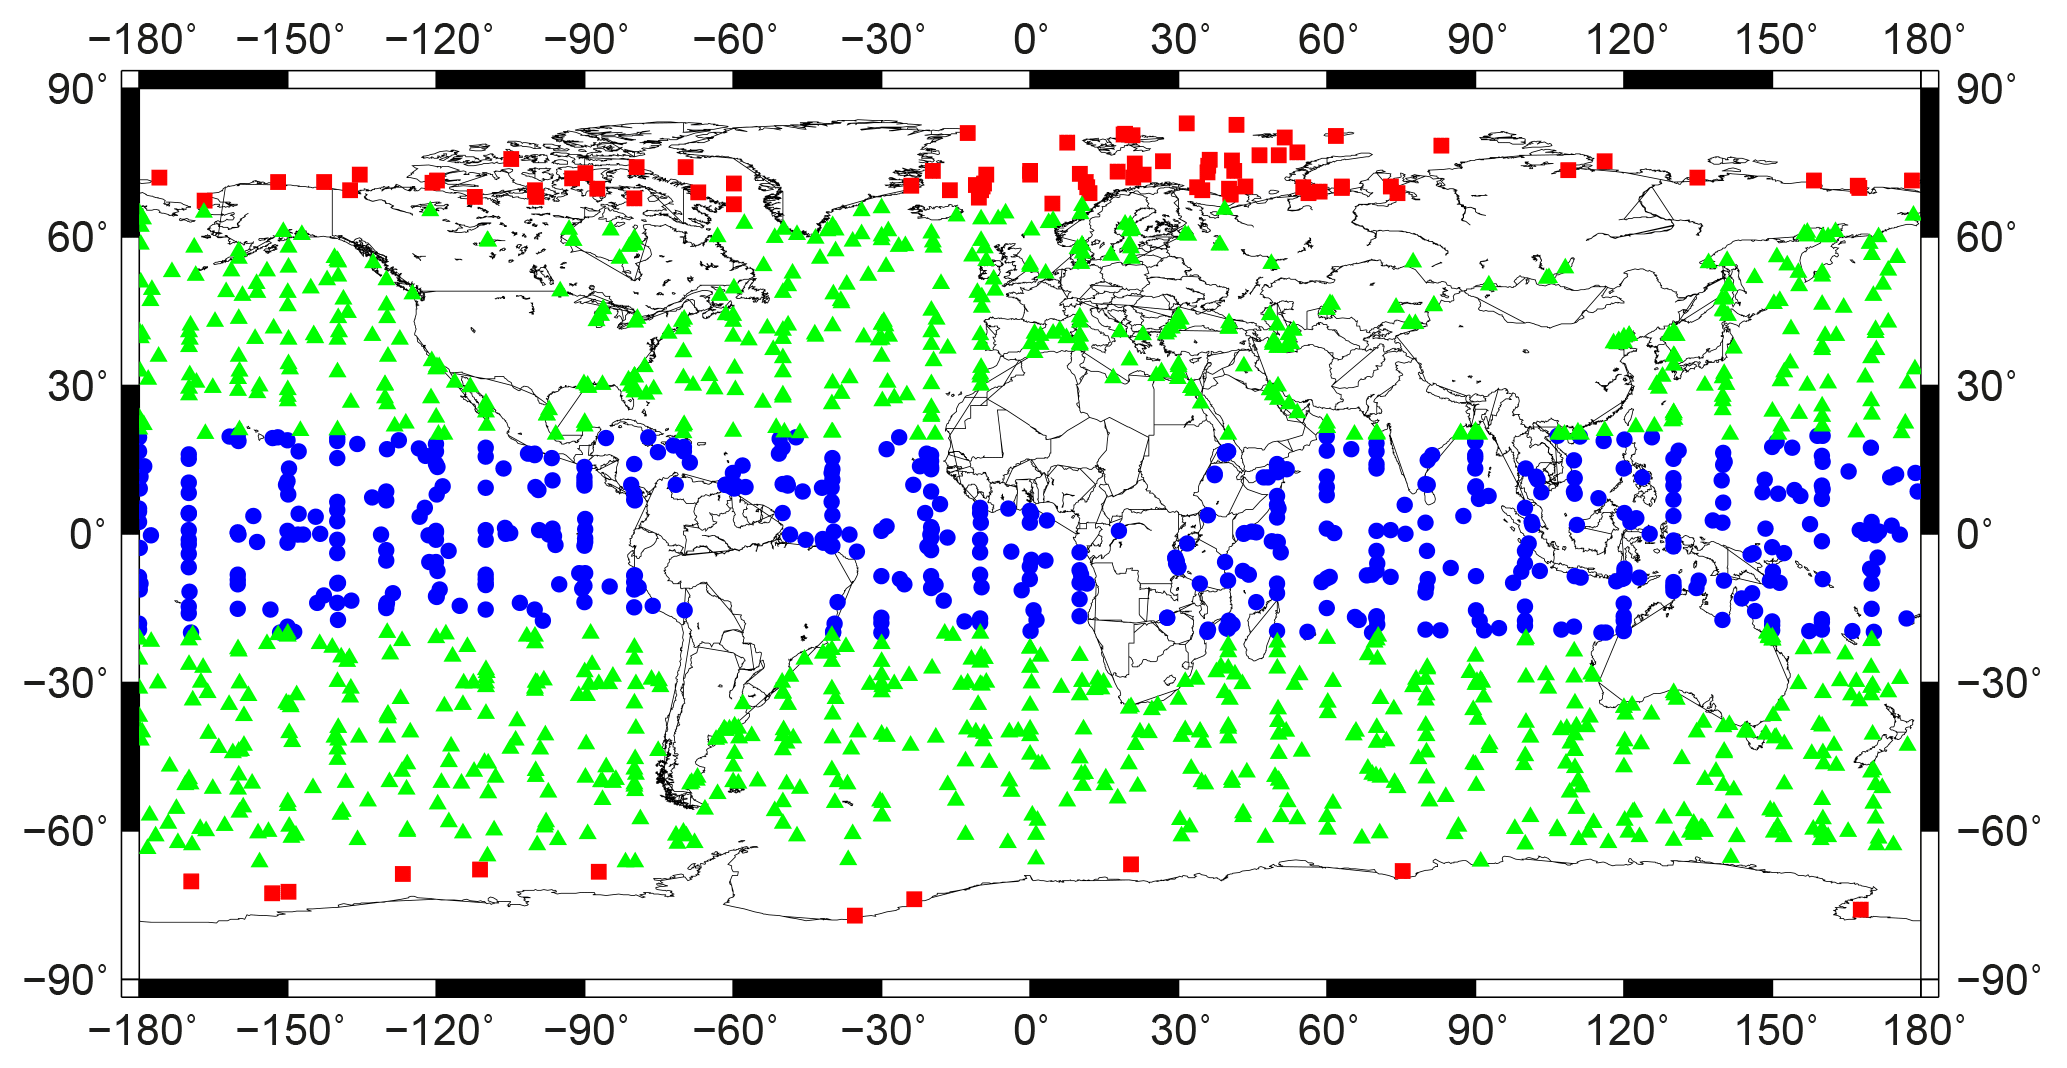
Figure 7Localisations of the 1681 simulations considered for running 1D-Var inversions by latitude bands: 91 for polar latitude as red squares, 1068 for mid-latitudes as green triangles and 522 for tropical latitudes as blue dots.
Table 5List of the 123 IASI channels used for the profile retrievals.
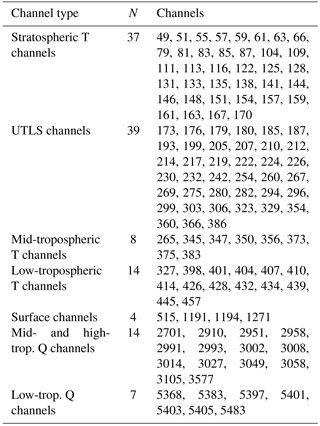
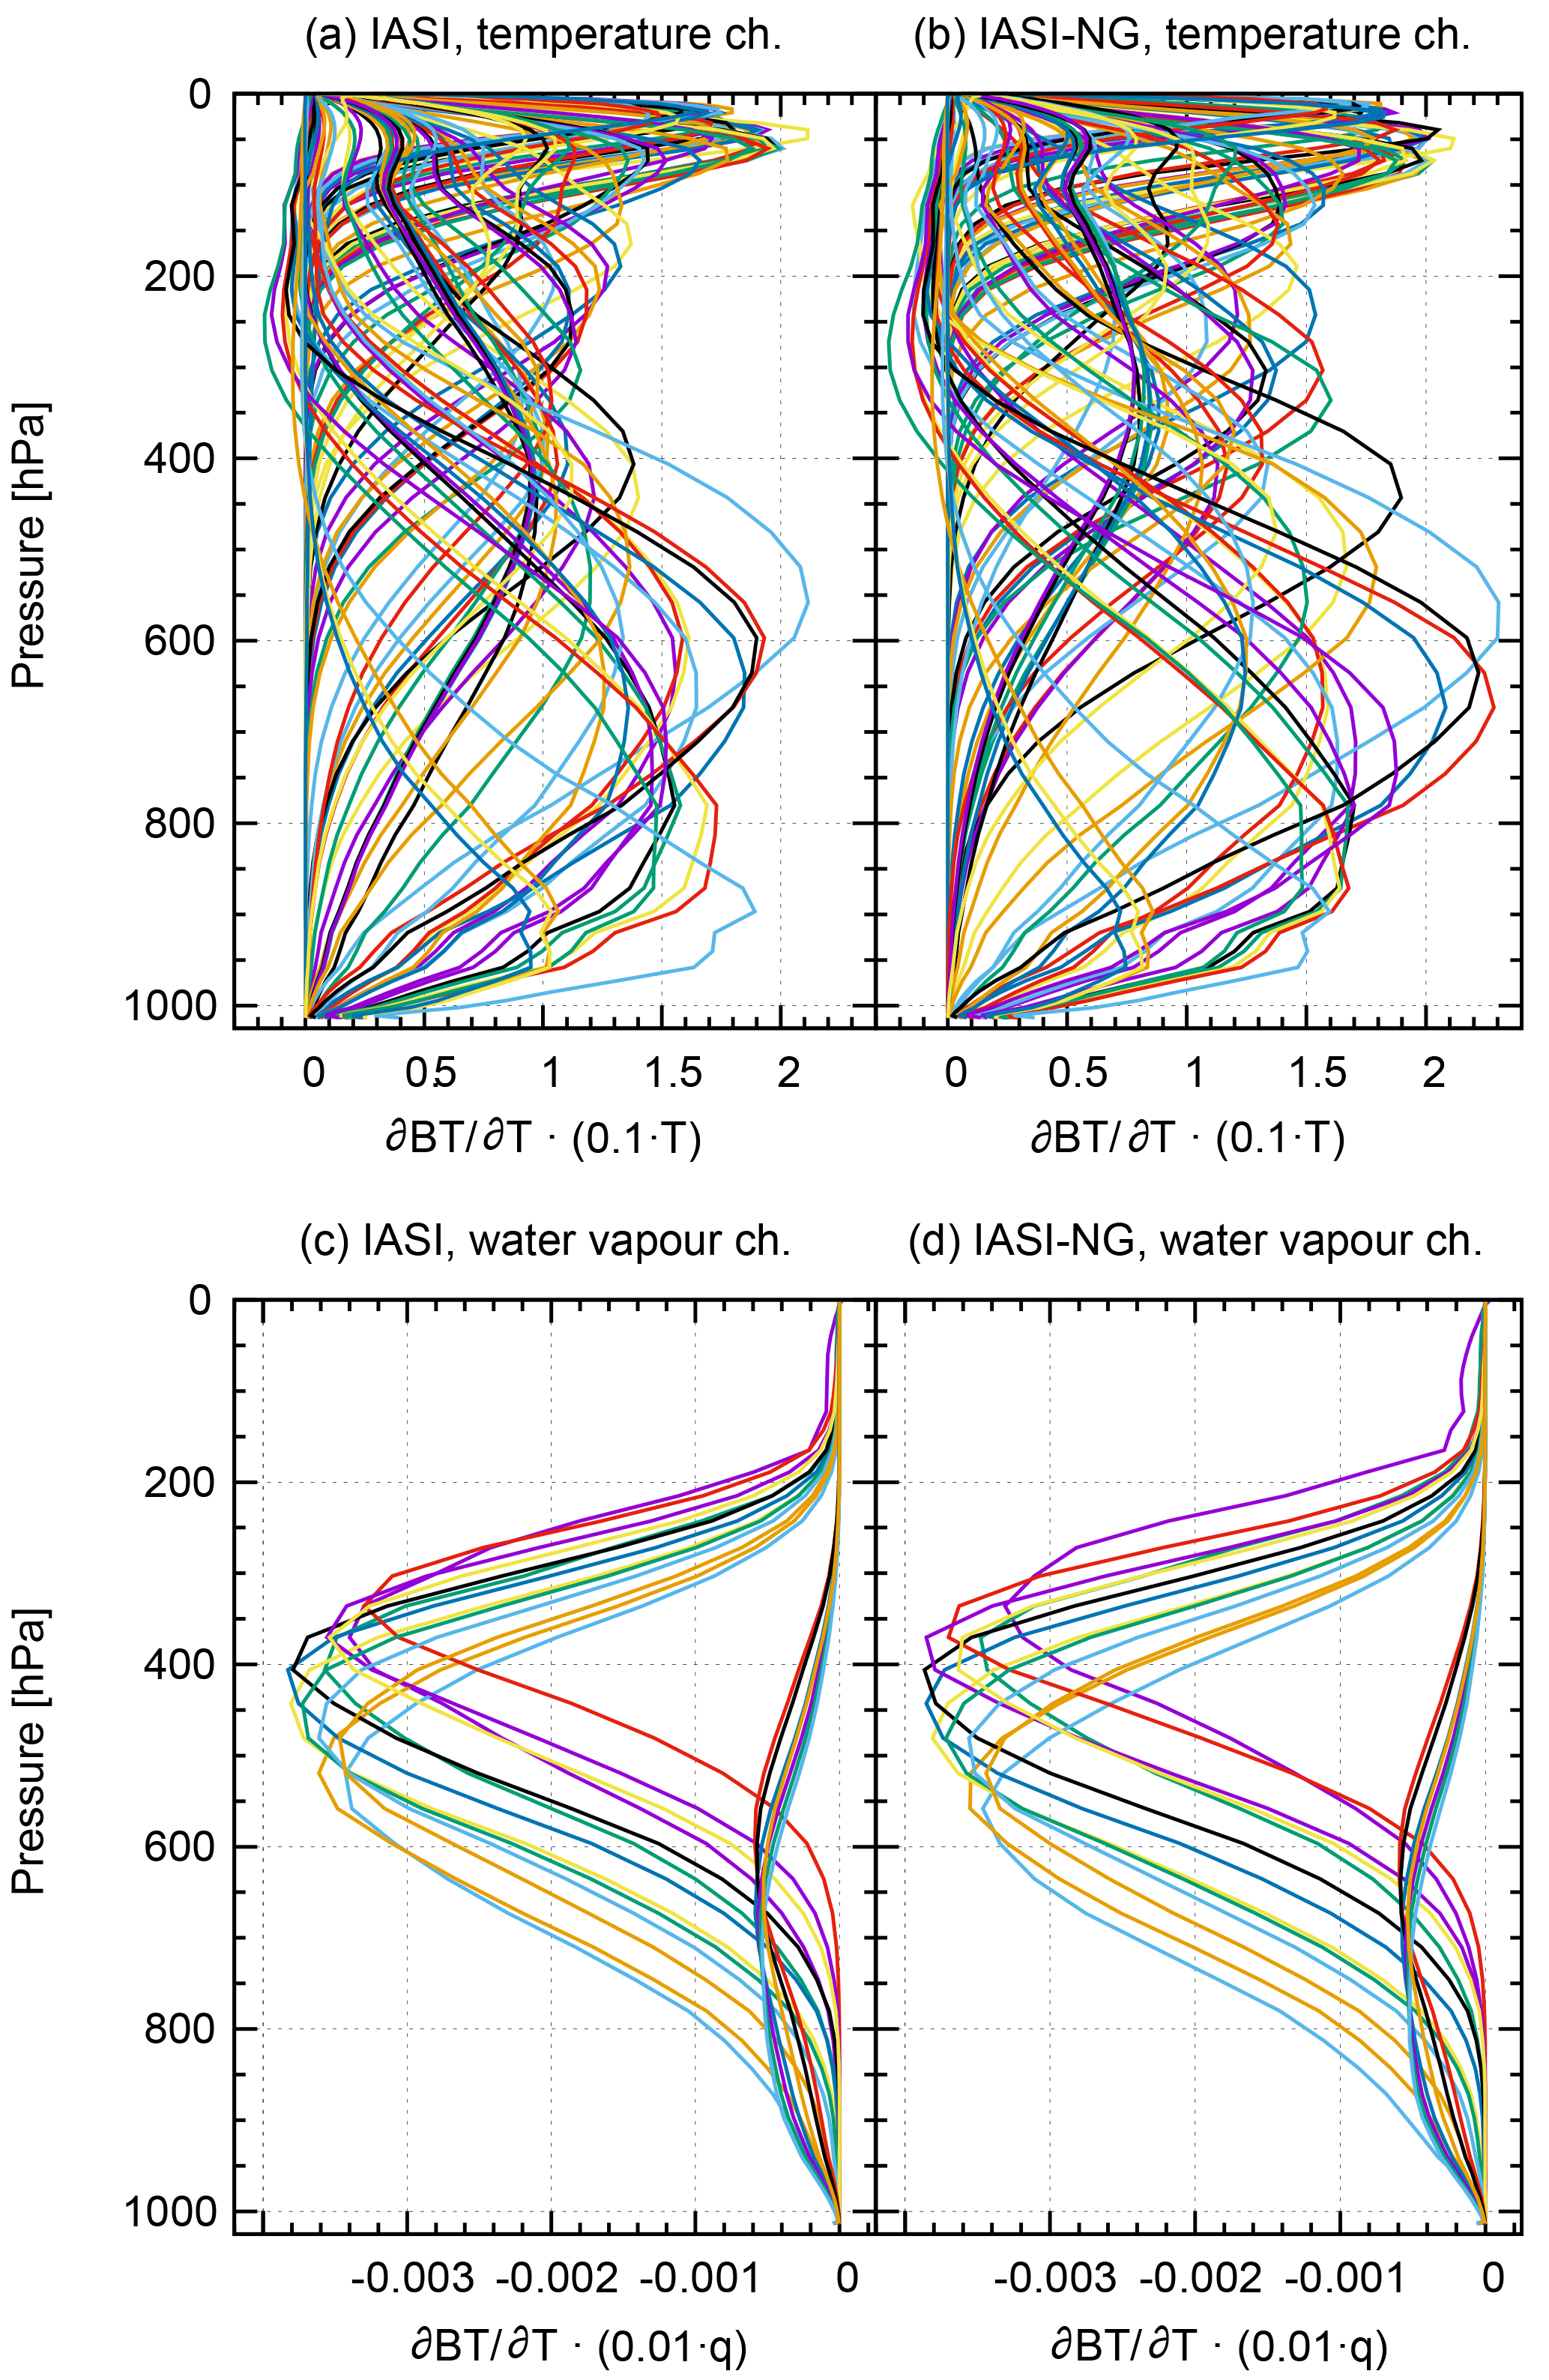
Figure 8Temperature (a, b) and humidity (c, d) averaged Jacobians from the considered 1681 simulations computed for the 123 IASI (a, c) and IASI-NG (b, d) channels. The various colours correspond to the different channels to show their individual contribution.
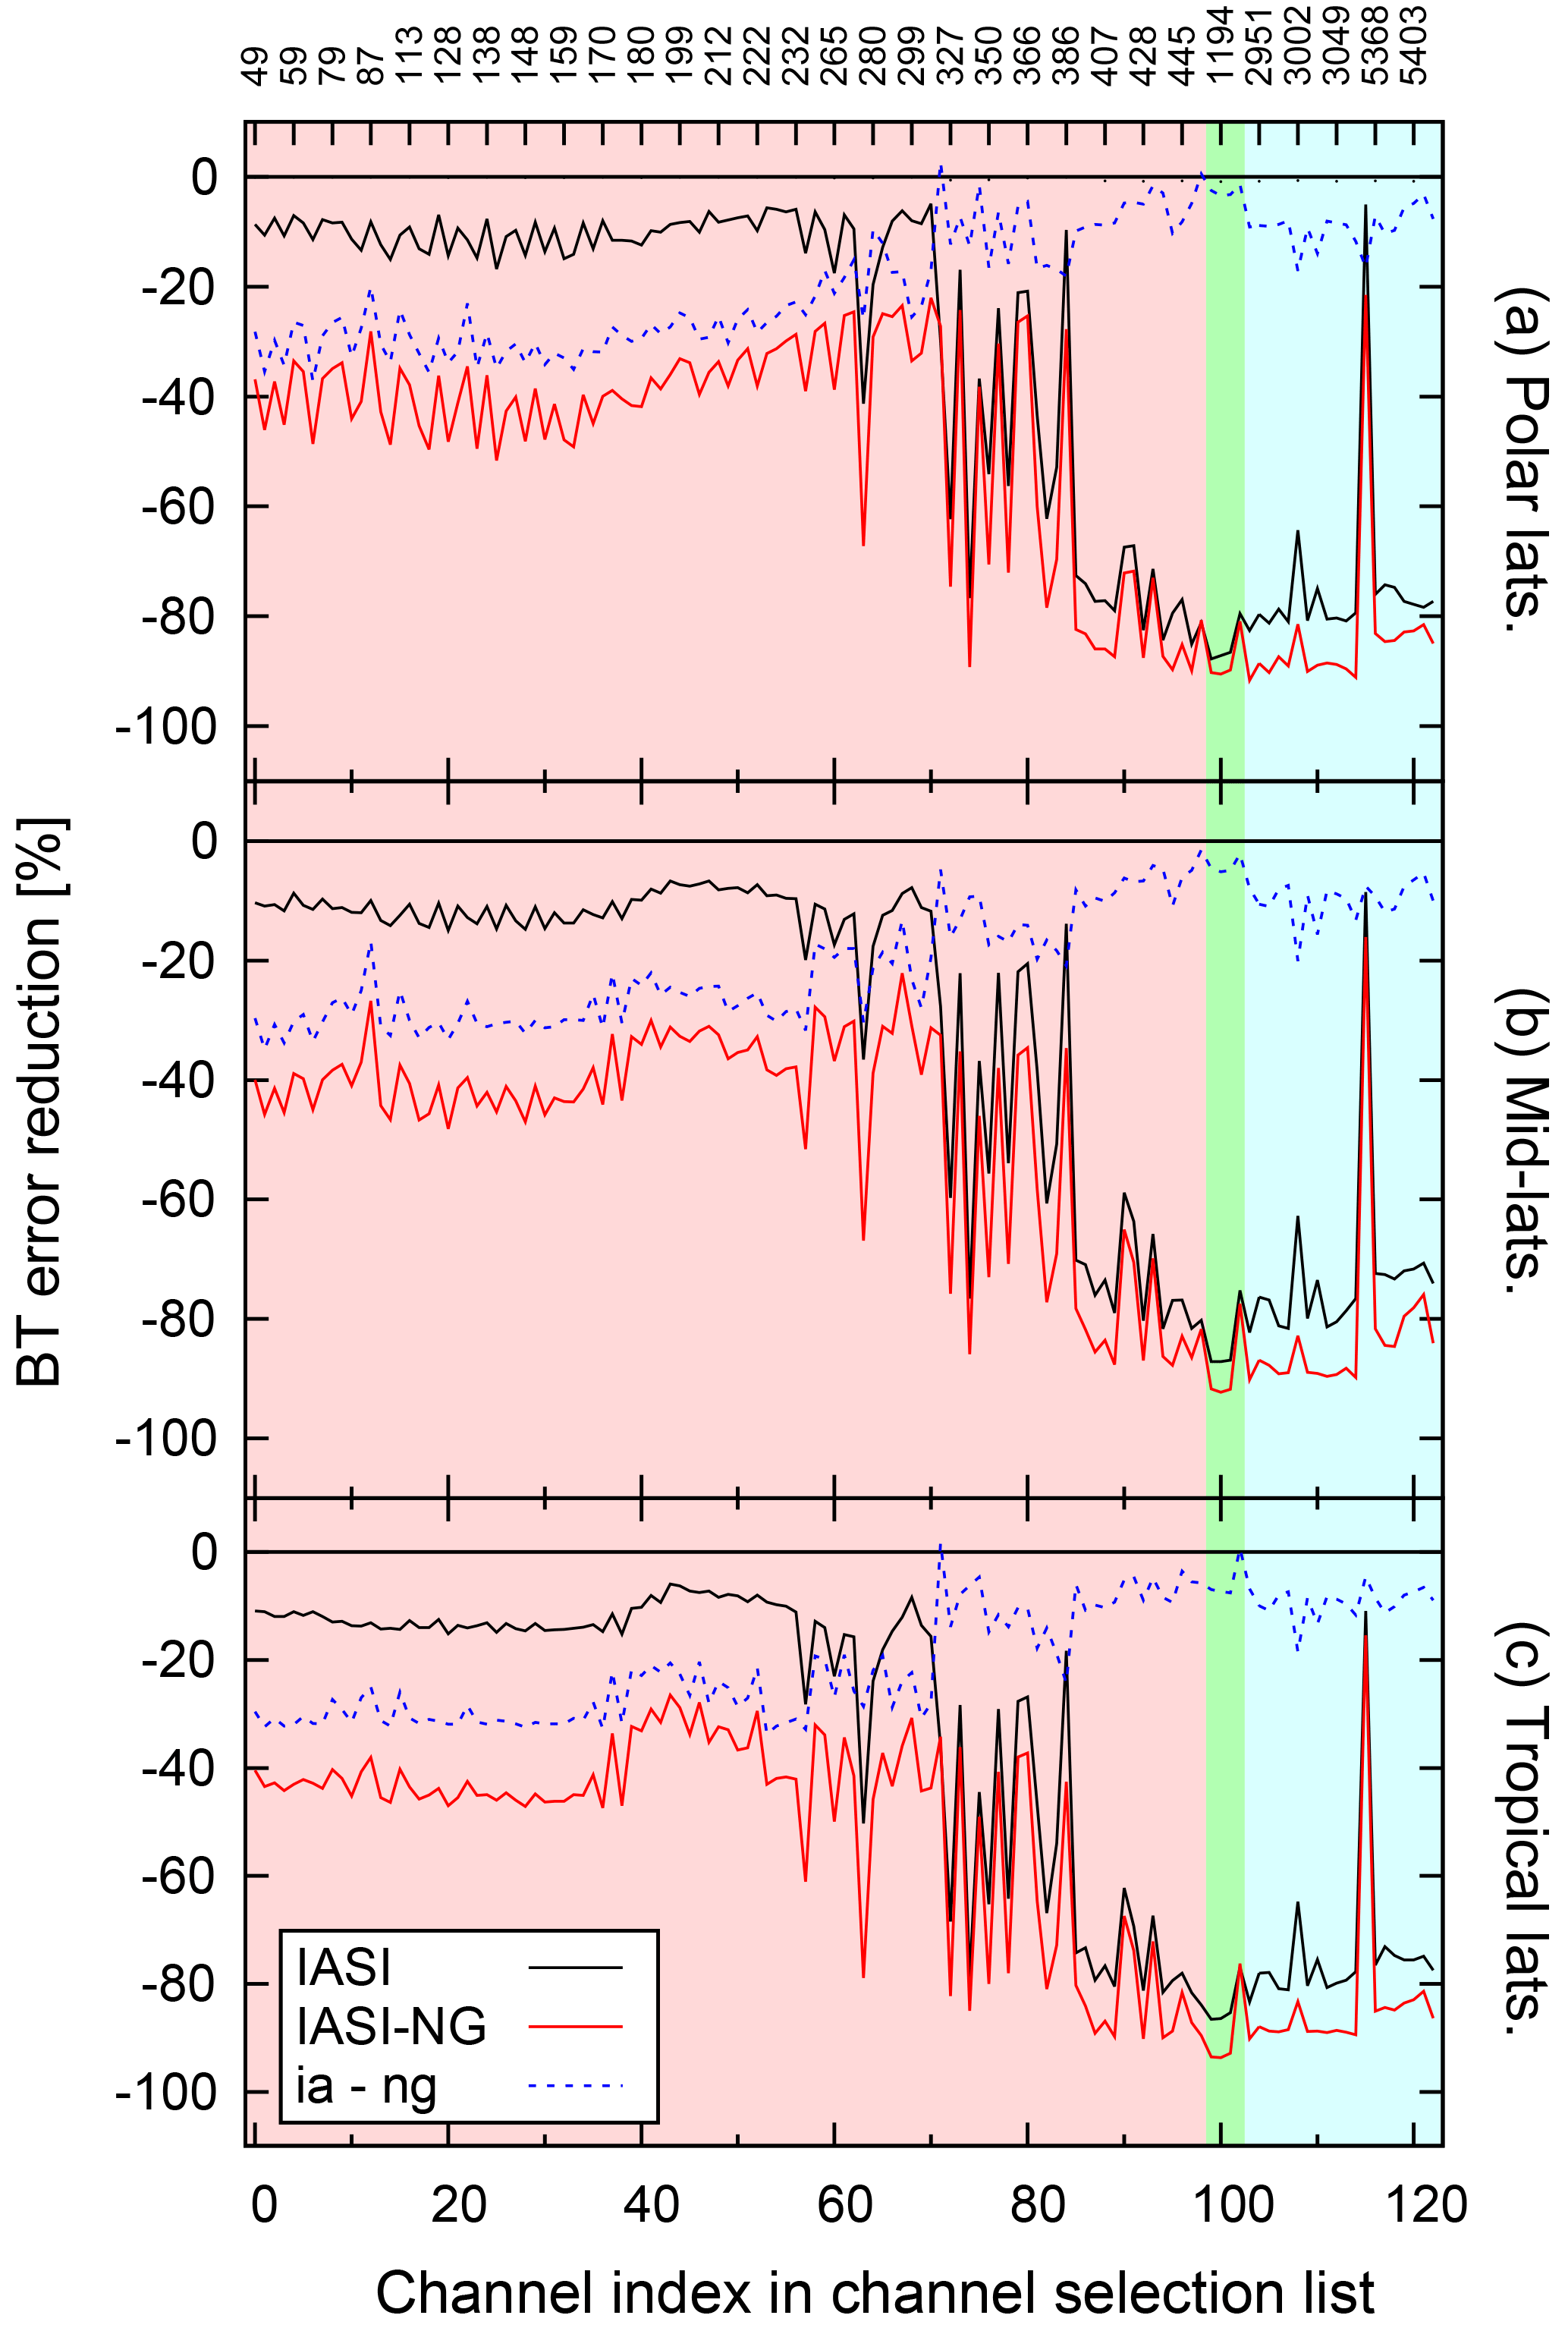
Figure 9Error reduction (σreduction) in percentage for IASI observations in brightness temperature units for polar regions (a), mid-latitudes (b) and tropics (c). Black and red curves present the error reductions for IASI and IASI-NG respectively, whereas the blue line represents the differences between the two instruments. Coloured boxes correspond to the sensitivity of the channels (red: temperature; green: window; blue: water vapour).
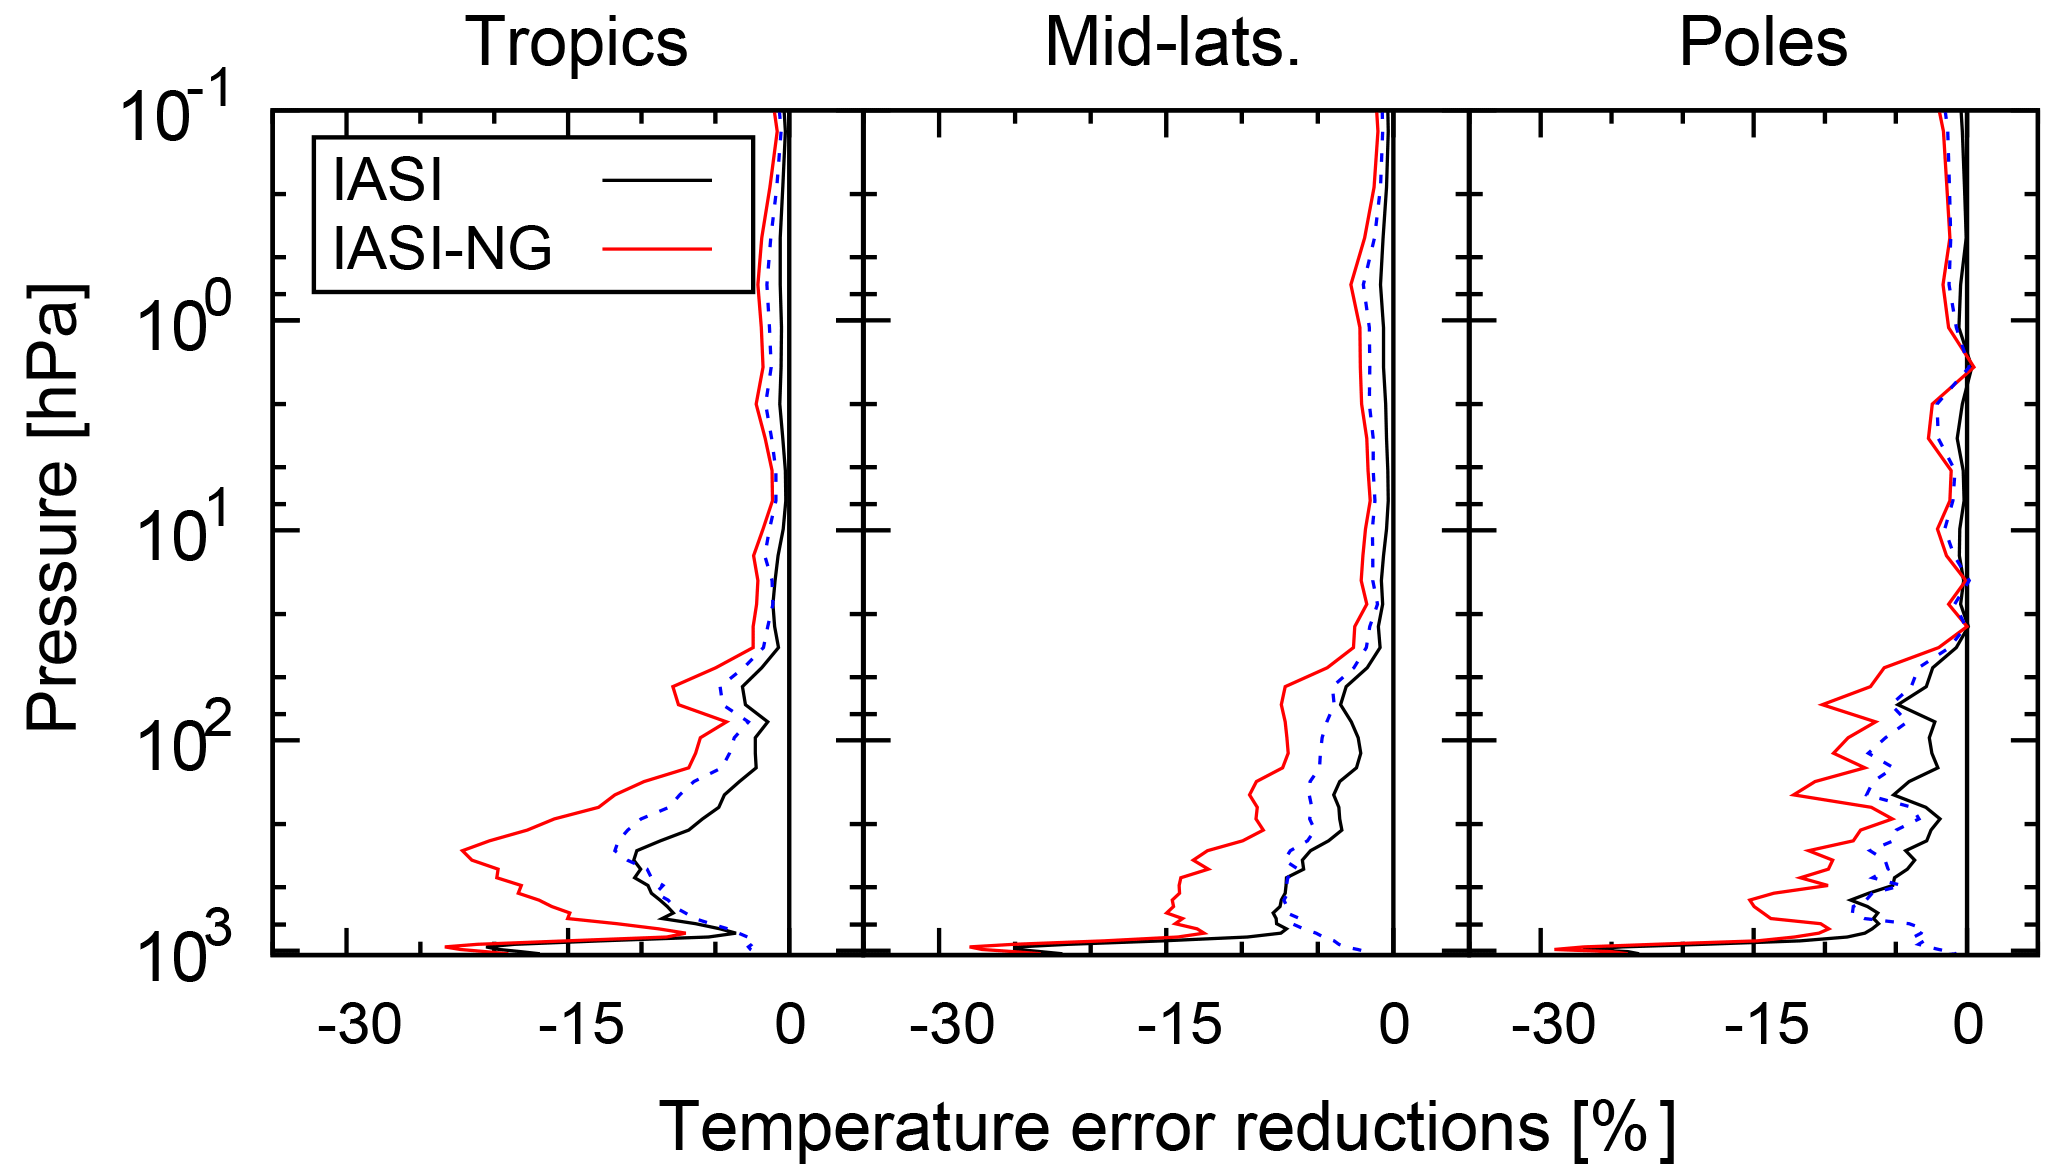
Figure 10Error reduction (σreduction) in percentage with respect to the atmospheric pressure for temperature with the assimilation of the 123 channels for IASI (black line) and IASI-NG (red line) with respect to regional areas (tropics, mid-latitudes and polar regions). The blue dashed line corresponds to the error reduction difference between IASI-NG and IASI assimilation.
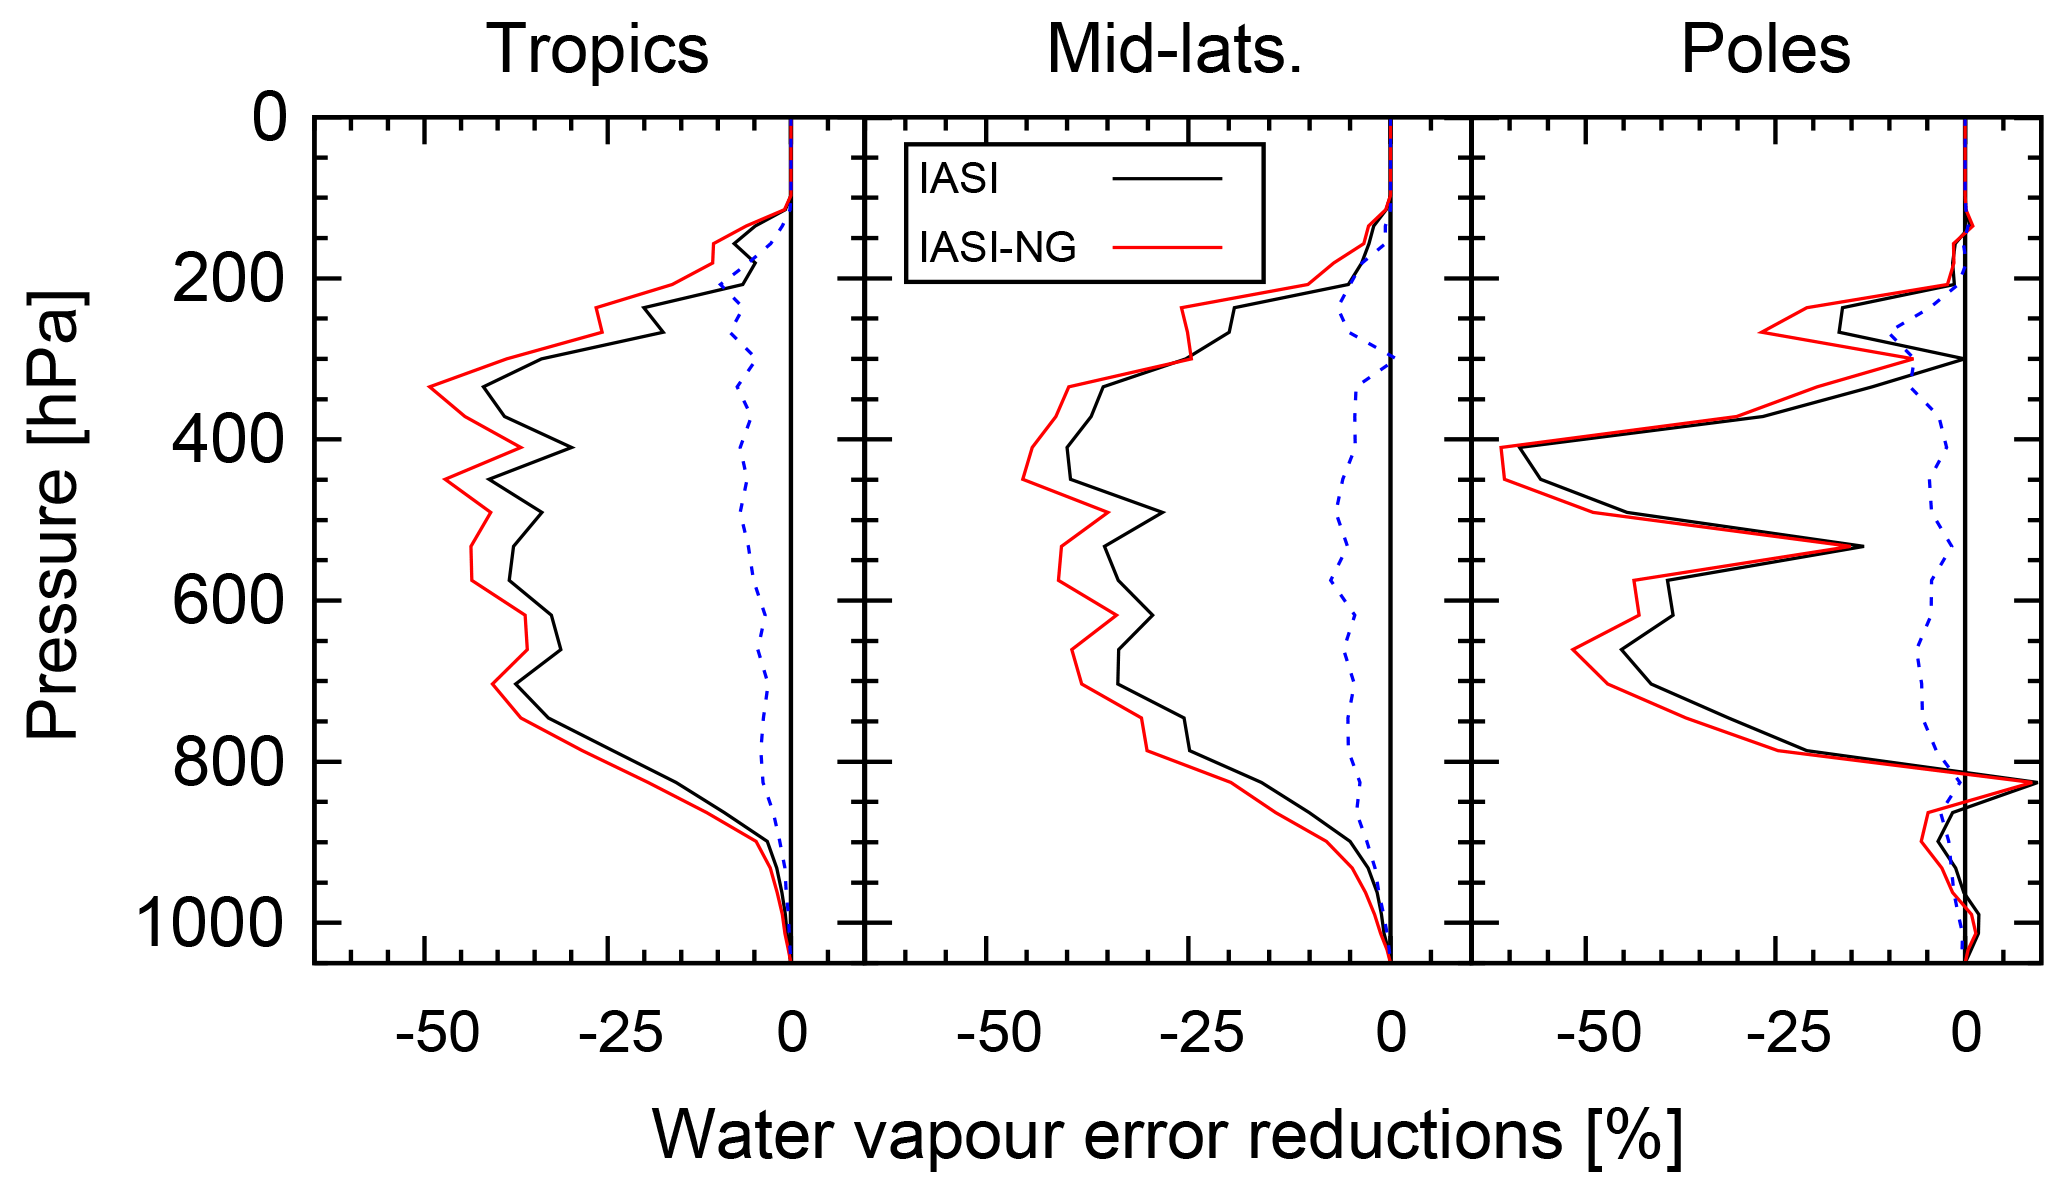
Figure 11Error reduction (σreduction) in percentage for water vapour with the assimilation of the 123 channels for IASI (black line) and IASI-NG (red line) with respect to regional areas (tropics, mid-latitudes and polar regions). The blue dashed line corresponds to the difference of error reduction between IASI-NG and IASI assimilation.
5.1 1D-Var framework
The background error covariance B matrix provided by the package assumes a priori information of a very high quality, i.e. an error on temperature retrievals of 0.5 K when IASI is supposed to be able to improve temperature retrieval errors below 1 K. To be consistent with the IASI specifications, the B matrix errors have been multiplied by 2. Background profiles were obtained from the true atmospheric state perturbed by a noise corresponding to the B matrix. For the observation error-covariance R matrix, a diagonal matrix formed by the Météo-France operationally specified IASI errors was used. As the IASI-NG noise is assumed to be close to half the IASI noise, the values of the associated observation error R matrix were divided by 4. This operational R matrix overestimates mostly the errors for water vapour channels as the inter-channel correlations in their errors were not taken into account.
We have chosen the current operational channel selection of the ARPEGE model, consisting of 123 IASI channels out of the total 8461. For IASI-NG, the channel selection included the 123 channels corresponding to the same wave numbers as those of the IASI channel selection (see Table 5 for further details). This channel selection covers the whole atmosphere for temperature profile and only the troposphere for the humidity (Fig. 8) even though the Jacobian peaks differ slightly between both instruments. These Jacobians have been obtained with RTTOV and correspond to Jacobians of both sounders averaged over the 1681 simulations. Humidity Jacobians depend on the water vapour profile, presenting higher values for higher humidity concentration (not shown). In the tropics, the humidity Jacobian peaks at higher altitudes in the atmosphere than in polar regions because of this dependency on the water vapour concentration.
A bias correction was applied to each latitude-band experiment. The values of this correction were obtained after a first run of the 1D-Var retrieval. The average difference between the first guess and the simulated brightness temperatures were removed from the observations to eliminate this bias for the second 1D-Var run.
To analyse the retrievals from the 1D-Var runs, the SD of the observation minus background and observation minus retrieval differences were computed for the brightness temperatures. For temperature and humidity vertical profiles, the SD computed were those of the truth–background and truth–retrieval differences. The analysis of the results consisted in comparing the ratio of SDs of the differences vs. the retrievals compared to the differences vs. the background:
Negative values of σreduction mean a reduction on the retrieval's SD – hence, a positive impact – whereas positive values of this index correspond to a negative impact or an increase in the retrievals SD.
5.2 Results
Figure 9 presents the values of the σreduction index for the observations for the three latitude bands. High-stratospheric channels present an improvement in the error reduction of a 0.3 value, while the differences for tropospheric-peaking channels are better only by 0.1 on average. This difference is caused by the strong overestimations of the instrument noise for humidity channels because of the strong intercorrelation for these channels.
Similar plots to Fig. 9 are presented in Figs. 10 and 11 but for the error reduction in temperature and humidity profiles respectively. We found a difference of up to 10 % in the reductions of temperature profile error for the tropical band around 400 hPa. Mid-latitude and polar latitude bands present lower error reduction differences, around 5 % in the troposphere, with a flatter shape on average. The different shape of the polar-latitude error reduction profile could have its origin in the lower number of profiles used (91 at polar latitudes, compared to 1068 at mid-latitudes). The error reductions in the stratosphere are lower than those observed in the troposphere, but IASI-NG still has higher error reductions than IASI. Apart from the first kilometres of the atmosphere, IASI-NG displays an error reduction twice as high as that given by IASI up to an atmospheric pressure of around 750 hPa. The worst performance of both instruments in the first atmospheric layers is related to the lack of sensitivity of IASI channels at these levels to the first atmospheric layers in the selection used in the Météo-France operational system combined with a possible lack of contrast with the surface. A new channel selection for IASI-NG shall be carried out including channels able to improve this lack of sensitivity and taking into account the IASI-NG bands 3 and 4 thanks to the IASI-NG noise reduction compared to IASI. The retrieval capability of IASI-NG at the low atmospheric levels shall also be studied with respect to the surface contrast.
The humidity error reduction profiles provided by both instruments present higher values than those found for the temperature error reduction profiles, where, in the best case, a 24 % error reduction was reached. The IASI-NG error reduction profile presents higher error reduction values, of around 5 %, from around 850 hPa to the tropopause compared to IASI. As was observed for temperature profiles, the error reductions in the low troposphere are smaller than those found for mid-troposphere or the upper atmospheric layers. These smaller error reductions are due to the lack of sensitivity of IASI channels to this atmospheric region combined with a weak background error in the humidity associated with these levels compared to those of the other regions, preventing observations from which to add more information in the 1D-Var.
A similar experiment to the IASI/IASI-NG experiment has been carried out to compare the performances of the two IASI-NG prism materials. Although a better error reduction was found for brightness temperature stratospheric channels, no impact was noticed in temperature or humidity profile retrievals. It should be noted that the channel selection used for this experiment was equivalent to the IASI one, just taking the channels corresponding to the same wave numbers. In order to investigate the differences between both materials, a new channel selection, adapted to IASI-NG characteristics, shall be performed.
A database of IASI and IASI-NG simulations has been devised. The two sets of simulations for IASI-NG correspond to the two materials under consideration for the IASI-NG prism. The database is presented in two versions according to the radiative transfer model that has been used. The information available in the database has the following structure:
-
coordinates: longitude, latitude, terrain elevation, date and time;
-
observation parameters: surface pressure and temperature, IASI zenith and azimuth angles, solar zenith and azimuth angles, land–sea mask value, cloud cover value from AVHRR, 4A emissivity index, surface emissivity from UW atlas and RTTOV surface type;
-
vertical profiles: temperature, humidity, carbon dioxide, ozone, carbon monoxide, methane and sulfur dioxide;
-
cloud information: vertical profiles of cloud cover, ice water content, liquid water content, rain water content and snow water content;
-
simulations: radiances of IASI (in 8461 channels), 16921 channels for IASI-NG A (KBr) and IASI-NG B (ZnSe);
-
real observations: 314 IASI brightness temperatures.
Two kinds of validations have been presented: the first one consists of the evaluation of the IASI simulations, and the second one is an evaluation of the gain brought by IASI-NG with respect to the IASI one with a 1D-Var experiment. For one single orbit, all clear cases over sea and during night-time, the RTTOV and 4A simulations have been compared to the measured IASI 8461 channels. Similar results were found for the two models. On the one hand, by using the sea surface emissivity ISEM model, RTTOV has slightly better results than 4A. On the other hand, land surface emissivities from 4A are better because of using UW emissivities for 2013 instead of 2007 like RTTOV. RTTOV appears to better represent the water continuum, providing a lower bias value in IASI band 2. By simply considering the noise reduction of IASI-NG, the improvement on brightness temperature error reduction mainly varies between 5 and 15 % compared to IASI.
With a small subset of atmospheric profiles from the database and an 1D-Var framework, the impact of the current IASI channel selection has been evaluated for IASI and IASI-NG configurations over sea and for clear-sky conditions. With channels located in the same wave numbers, retrieval experiments showed an improvement of the temperature retrievals throughout the atmosphere with a maximum in the troposphere. The improvement is lower for the humidity in the troposphere. This improvement may reach 10 % in the tropics at 400 hPa and is about 5 % at mid-latitudes and in polar regions. The improvement obtained for tropospheric humidity is of the same order (5 %). A reduced sensitivity in the low troposphere is confirmed for IASI. This result agrees with the study by Sellitto et al. (2013), who produced tropospheric ozone pseudo-observations based on these noise configurations. They showed a clear improvement of low-tropospheric ozone pseudo-observations compared to the IASI ones and the potential to separate lower- from upper-tropospheric ozone information. Additional work is thus required to check if IASI-NG will be able to better probe the atmosphere at these levels. For this purpose, a new channel selection needs to be defined, which will be undertaken in a following study. These encouraging results of the IASI-NG impact provided by this study should be confirmed with a more comprehensive atmospheric dataset and a closer context of NWP operations. IASI-NG is dedicated to multiple applications such as NWP, atmospheric chemistry and air quality. The potential of multi-spectral synergy between instruments from the second-generation European Polar System (EPS-SG) for improved sensitivity to ozone in the lowest part of the troposphere should be studied further as proposed by Costantino et al. (2017).
A high-level Fortran 90 library has been developed to access the information contained in the simulation dataset files. The library and its documentation can be downloaded from the web page of the EUMETSAT/CNES IASI Sounding Science Working Group at http://iasi.cnes.fr/en/IASI/isswg.htm.
A total of 96 hourly files for the two simulation dataset are available at the web page of the EUMETSAT/CNES IASI Sounding Science Working Group at http://iasi.cnes.fr/en/IASI/isswg.htm.
The authors declare that they have no conflict of interest.
The authors would like to acknowledge the CNES for funding this work in the frame of the IASI-NG programme. Jean Maziejewski and Jean-Francois Mahfouf are warmly thanked for their careful review of a previous version of the paper. Two anonymous reviewers and Pasquale Sellitto are also acknowledged for their fruitful comments on the manuscript.
Edited by: Helen Worden
Reviewed by: two anonymous referees
Atlas, R.: Atmospheric observation and experiments to assess their usefulness in data assimilation, J. Meteorol. Soc. Jpn., 75, 111–130, https://doi.org/10.2151/jmsj1965.75.1B_111, 1997. a
Aumann, H. H., Chahine, M. T., Gautier, C., Goldberg, M. D., Kalnay, E., McMillin, L. M., Revercomb, H., Rosenkranz, P. W., Smith, W. L., Staelin, D. H., Strow, L. L., and Susskind, J.: AIRS/AMSU/HSB on the Aqua mission: design, science objectives, data products, and processing systems, IEEE T. Geosci. Remote, 41, 253–264, https://doi.org/10.1109/TGRS.2002.808356, 2003. a
Baker, D. J.: Large field-of-view interferometers for environmental sensing, Opt. Eng., 19, 194515–194515, 1980. a
Bermudo, F., Rousseau, S., Pequignot, E., and Bernard, F.: IASI-NG program: a new generation of Infrared Atmospheric Sounding Interferometer, in: Geoscience and Remote Sensing Symposium (IGARSS), 2014 IEEE International, Quebec City, QC, 1373–1376, https://doi.org/10.1109/IGARSS.2014.6946690, 2014. a, b
Bormann, N., Cameron, J. R., and McNally, A. P.: Of Chessboards and Ghosts–Signatures of micro-vibrations from IASI monitoring in NWP?, in: International TOVS Conference, The 17th International TOVS Study Conference (ITSC-17), 14–20 April 2010, Monterey, United States, Abstract number 717, available at: https://cimss.ssec.wisc.edu/itwg/itsc/itsc17/papers/bormann_niels-717.pdf (last access: 7 February 2018), 2010. a, b
Capelle, V., Chédin, A., Siméon, M., Tsamalis, C., Pierangelo, C., Pondrom, M., Crevoisier, C., Crepeau, L., and Scott, N. A.: Evaluation of IASI-derived dust aerosol characteristics over the tropical belt, Atmos. Chem. Phys., 14, 9343–9362, https://doi.org/10.5194/acp-14-9343-2014, 2014. a
Cayla, F.: L'interfèromètre IASI, un nouveau sondeur satellitaire à haute rèsolution, Meteorol. Ser. 8, 32, 23–39, 2001. a, b
Chalon, G., Cayla, F., and Diebel, D.: IASI – An advanced sounder for operational meteorology, in: IAF, International Astronautical Congress, 52nd, Toulouse, France, 2001. a
Chaumat, L., Standfuss, C., Tournier, B., Bernard, E., Armante, R., and Scott, N. A.: 4A/OP Reference Documentation, Tech. Rep. NOV-3049-NT-1178-v4.3, NOVELTIS, LMD/CNRS, CNES, 2012. a, b, c
Cheruy, F., Scott, N., Armante, R., Tournier, B., and Chedin, A.: Contribution to the development of radiative transfer models for high spectral resolution observations in the infrared, J. Quant. Spectrosc. Ra., 53, 597–611, 1995. a
Chevallier, F., Deutscher, N. M., Conway, T. J., Ciais, P., Ciattaglia, L., Dohe, S., Fröhlich, M., Gomez-Pelaez, A. J., Griffith, D., Hase, F., Haszpra, L., Krummel, P., Kyrö, E., Labuschagne, C., Langenfelds, R., Machida, T., Maignan, F., Matsueda, H., Morino, I., Notholt, J., Ramonet, M., Sawa, Y., Schmidt, M., Sherlock, V., Steele, P., Strong, K., Sussmann, R., Wennberg, P., Wofsy, S., Worthy, D., Wunch, D., and Zimnoch, M.: Global CO2 fluxes inferred from surface air-sample measurements and from TCCON retrievals of the CO2 total column, Geophys. Res. Lett., 38, https://doi.org/10.1029/2011GL049899, 2011. a
Clarisse, L., Clerbaux, C., Dentener, F., Hurtmans, D., and Coheur, P.-F.: Global ammonia distribution derived from infrared satellite observations, Nat. Geosci., 2, 479–483, 2009. a
Clerbaux, C., Boynard, A., Clarisse, L., George, M., Hadji-Lazaro, J., Herbin, H., Hurtmans, D., Pommier, M., Razavi, A., Turquety, S., Wespes, C., and Coheur, P.-F.: Monitoring of atmospheric composition using the thermal infrared IASI/MetOp sounder, Atmos. Chem. Phys., 9, 6041–6054, https://doi.org/10.5194/acp-9-6041-2009, 2009. a, b
Clough, S., Shephard, M., Mlawer, E., Delamere, J., Iacono, M., Cady-Pereira, K., Boukabara, S., and Brown, P.: Atmospheric radiative transfer modeling: a summary of the AER codes, J. Quant. Spectrosc. Ra., 91, 233–244, 2005. a
Collard, A.: Selection of IASI channels for use in numerical weather prediction, Q. J. Roy. Meteor. Soc., 133, 1977–1991, 2007. a
Collard, A., Saunders, R., Cameron, J., Harris, B., Takeuchi, Y., and Horrocks, L.: Assimilation of data from AIRS for improved numerical weather prediction, in: Proc. of the 13th International TOVS Study Conference, 29 Octobre–4 Novembre 2003, Sainte Adele, Canada, 99–106, 2003. a
Collard, A. D. and McNally, A. P.: The assimilation of Infrared Atmospheric Sounding Interferometer radiances at ECMWF, Q. J. Roy. Meteor. Soc., 135, 1044–1058, https://doi.org/10.1002/qj.410, 2009. a
Costantino, L., Cuesta, J., Emili, E., Coman, A., Foret, G., Dufour, G., Eremenko, M., Chailleux, Y., Beekmann, M., and Flaud, J.-M.: Potential of multispectral synergism for observing ozone pollution by combining IASI-NG and UVNS measurements from the EPS-SG satellite, Atmos. Meas. Tech., 10, 1281–1298, https://doi.org/10.5194/amt-10-1281-2017, 2017. a
Courtier, P., Freydier, C., Geleyn, J., Rabier, F., and Rochas, M.: The arpege project at meteo-france, in: ECMWF Seminar Proceedings, ECMWF, Reading, UK, 2, 193–231, 1991. a
Crevoisier, C., Clerbaux, C., Guidard, V., Phulpin, T., Armante, R., Barret, B., Camy-Peyret, C., Chaboureau, J.-P., Coheur, P.-F., Crépeau, L., Dufour, G., Labonnote, L., Lavanant, L., Hadji-Lazaro, J., Herbin, H., Jacquinet-Husson, N., Payan, S., Péquignot, E., Pierangelo, C., Sellitto, P., and Stubenrauch, C.: Towards IASI-New Generation (IASI-NG): impact of improved spectral resolution and radiometric noise on the retrieval of thermodynamic, chemistry and climate variables, Atmos. Meas. Tech., 7, 4367–4385, https://doi.org/10.5194/amt-7-4367-2014, 2014. a
Diebel, D., Cayla, F., and Phulpin, T.: IASI mission rationale and requirements, Tech. rep., CNES/EUMETSAT, 1996. a
Dufour, G., Eremenko, M., Griesfeller, A., Barret, B., LeFlochmoën, E., Clerbaux, C., Hadji-Lazaro, J., Coheur, P.-F., and Hurtmans, D.: Validation of three different scientific ozone products retrieved from IASI spectra using ozonesondes, Atmos. Meas. Tech., 5, 611–630, https://doi.org/10.5194/amt-5-611-2012, 2012. a
Fourrié, N., and Thépaut, J.-n.: Evaluation of the AIRS near-real-time channel selection for application to numerical weather prediction, Q. J. Roy. Meteor. Soc., 129, 2425–2439, https://doi.org/10.1256/qj.02.210, 2003. a
George, M., Clerbaux, C., Hurtmans, D., Turquety, S., Coheur, P.-F., Pommier, M., Hadji-Lazaro, J., Edwards, D. P., Worden, H., Luo, M., Rinsland, C., and McMillan, W.: Carbon monoxide distributions from the IASI/METOP mission: evaluation with other space-borne remote sensors, Atmos. Chem. Phys., 9, 8317–8330, https://doi.org/10.5194/acp-9-8317-2009, 2009. a
Glumb, R. J., Williams, F. L., Funk, N., Chateauneuf, F., Roney, A., and Allard, R.: Cross-track Infrared Sounder (CrIS) development status, 5152, 1–8, https://doi.org/10.1117/12.508544, 2003. a
Guidard, V., Fourrié, N., Brousseau, P., and Rabier, F.: Impact of IASI assimilation at global and convective scales and challenges for the assimilation of cloudy scenes, Q. J. Roy. Meteor. Soc., 137, 1975–1987, https://doi.org/10.1002/qj.928, 2011. a
Hilton, F., Atkinson, N. C., English, S. J., and Eyre, J. R.: Assimilation of IASI at the Met Office and assessment of its impact through observing system experiments, Q. J. Roy. Meteor. Soc., 135, 495–505, https://doi.org/10.1002/qj.379, 2009. a
Hilton, F., Armante, R. August, T., Barnet, C., Bouchard, A., Camy-Peyret, C., Clarisse, L., Clerbaux, C., Coheur, P. F., Collard, A., Crevoisier, C., Dufour, G., Edwards, D., Faijan, F., Fourrié, N., Gambacorta, A., Gauguin, S., Guidard, V., Hurtmans, D., Illingworth, S., Jacquinet-Husson, N., Kerzenmacher, T., Klaes, D., Lavanant, L., Masiello, G., Matricardi, M., McNally, A. P., Newman, S., Pavelin, E., Péquignot, E., Phulpin, T., Remedios, J., Schlüssel, P., Serio, C., Strow, L., Taylor, J., Tobin, D., Upenski, A., and Zhou, D.: Hyperspectral Earth observation from IASII: five years of accomplishments, B. Am. Meteorol. Soc., 93, 347–370, 2012. a, b
Hocking, J.: Interpolation methods in the RTTOV radiative transfer model, Tech. rep., Forecasting Research Technical report, 2014. a
Hocking, J., Rayer, P., Rundle, D., Saunders, R., Matricardi, M., Geer, A., Brunel, P., and Vidot, J.: RTTOV v11 users guide, Tech. rep., NWP SAF, 2015. a, b, c, d
Hong, S., Shin, I., and Ou, M.-L.: Comparison of the infrared surface emissivity model (ISEM) with a physical emissivity model, J. Atmos. Ocean. Tech., 27, 345–352, 2010. a
Hourdin, F., Musat, I., Bony, S., Braconnot, P., Codron, F., Dufresne, J.-L., Fairhead, L., Filiberti, M.-A., Friedlingstein, P., Grandpeix, J.-Y., Krinner, G., Phu LeVan, P., Li, Z.-X., and Lott, F.: The LMDZ4 general circulation model: climate performance and sensitivity to parametrized physics with emphasis on tropical convection, Clim. Dynam., 27, 787–813, 2006. a
Hultberg, T.: EPS Product Validation Report: IASI L1 PCC PPF, Tech. Rep. EUM/OPS-EPS/REP/10/0148, EUMETSAT, 2010. a
Jacquinet-Husson, N.: The GEISA spectroscopic database: current and future archive for Earth and planetary atmosphere studies, J. Quant. Spectrosc. Ra., 109, 1043–1059, 2008. a
Jacquinet-Husson, N., Ari'e, E., Ballard, J., Barbe, A., Bjoraker, G., Bonnet, B., Brown, L. R., Camy-Peyret, C., Champion, J. P., Ch'edin, A., Chursin, A., Clerbaux, C., Duxbury, G., Flaud, J.-M., Fourri'e, N., Fayt, A., Graner, G., Gamache, R., Goldman, A., Golovko, V. I., Guelachvili, G., Hartman, J. M., Hilico J. C., Hillman, J., Lefevre, G., Lellouch, E., Mikaïlenko, S. N., Naumenko, O. V., Nemtchinov, V., Newnham, D. A., Nikitin, A., Orphal, J., Perrin, A., Reuter D. C., Rinsland, C. P., Rosenmann, L. S., Scott, N. A., Selby, J., Sinitsa, L. N., Sirota, J. M., Smith, A. M., Smith, K. M., Tyuterev, Vi. G., Tipping, R. H., Urban, S., Varanasi, P., and Weber, M.: The 1997 spectroscopic GEISA databank, J. Quant. Spectrosc. Ra., 62, 205–254, 1999. a
Jacquinet-Husson, N., Scott, N., Chédin, A., and Chursin, A.: The GEISA spectroscopic database system revisited for IASI direct radiative transfer modelling, Atmos. Oceanic Opt, 16, 256–261, 2003. a
Jacquinet-Husson, N., Crepeau, L., Armante, R., Boutammine, C., Chedin, A. D., Scott, N. A., Crevoisier, C., Capelle, V., Boone, C., Poulet-Crovisier, N., Barbe, A., Campargue, A., Benner, D. Chris, Benilan, Y., Bezard, B., Boudon, V., Brown, L.R, Coudert, L.H., Coustenis, A., Dana, V., Devi, V. M., Fally, S., Fayt, A., Flaud, J.-M., Goldman, A., Herman, M., Harris, G.J., Jacquemart, D., Jolly, A., Kleiner, I., Kleinbohl, A., Kwabia-Tchana, F., Lavrentieva, N., Lacome, N., Xu, Li-Hong, Lyulin, O.M., Mandin, J.-Y., Maki, A., Mikhailenko, S., Miller, C.E., Mishina, T., Moazzen-Ahmadi, N., Muller, H. S. P., Nikitin, A., Orphal, J., Perevalov, V., Perrin, A., Petkie,D.T., Predoi-Cross, A., Rinsland, C. P., Remedios, J.J., Rotger, M., Smith, M. A. H., Sung, K., Tashkun, S., Tennyson, J., Toth, R. A., Vandaele, A.-C., and Vander-Auwera, J.: The 2009 edition of the GEISA spectroscopic database, J. Quant. Spectrosc. Ra., 112, 2395–2445, 2011. a, b
Karagulian, F., Clarisse, L., Clerbaux, C., Prata, A. J., Hurtmans, D., and Coheur, P.-F.: Detection of volcanic SO2, ash, and H2SO4 using the Infrared Atmospheric Sounding Interferometer (IASI), J. Geophys. Res.-Atmos., 115, https://doi.org/10.1029/2009JD012786, 2010. a
Klüser, L., Erbertseder, T., and Meyer-Arnek, J.: Observation of volcanic ash from Puyehue–Cordón Caulle with IASI, Atmos. Meas. Tech., 6, 35–46, https://doi.org/10.5194/amt-6-35-2013, 2013. a
Le Marshall, J., Jung, J., Zapotocny, T., Derber, J., Treadon, R., Lord, S., Goldberg, M., and Wolf, W.: The application of AIRS radiances in numerical weather prediction, Aust. Meteorol. Mag., 55, 213–217, 2006. a
Lezeaux, O.: Characterisation of the ghost from IASI MetOp measurements, Tech. rep., NOVELTIS, 2007. a
Maraldi, C., Jacquette, E., Jouglet, D., and Meunier, F.: IASI quarterly performance report from 2014/12/01 to 2015/02/28, Tech. rep., CNES, 2015a. a
Maraldi, C., Jacquette, E., Jouglet, D., and Sylvander, S.: IASI quarterly performance report from 2015/09/01 to 2015/11/30, Tech. rep., CNES, 2015b. a
Masutani, M., Woollen, J. S., Lord, S. J., Emmitt, G. D., Kleespies, T. J., Wood, S. A., Greco, S., Sun, H., Terry, J., Kapoor, V., Treadon, R., and Campana, K. A.: Observing system simulation experiments at the national centers for environmental prediction, J. Geophys. Res.-Atmos., 115, D07101, https://doi.org/10.1029/2009JD012528, 2010. a
Matricardi, M., Chevallier, F., Kelly, G., and Thépaut, J.-N.: An improved general fast radiative transfer model for the assimilation of radiance observations, Q. J. Roy. Meteor. Soc., 130, 153–173, 2004. a, b, c
Rabier, F., Fourrié, N., Chafäi, D., and Prunet, P.: Channel selection methods for infrared atmospheric sounding interferometer radiances, Q. J. Roy. Meteor. Soc., 128, 1011–1027, 2002. a
Rodgers, C. D.: Information content and optimization of high-spectral-resolution measurements, in: SPIE's 1996 International Symposium on Optical Science, Engineering, and Instrumentation, 136–147, International Society for Optics and Photonics, Proc. SPIE, 2830, https://doi.org/10.1117/12.256110, 1996. a
Scott, N.: A direct method of computation of the transmission function of an inhomogeneous gaseous medium I: description of the method, J. Quant. Spectrosc. Ra., 14, 691–704, 1974. a
Scott, N. and Chedin, A.: A fast line-by-line method for atmospheric absorption computations: the automatized atmospheric absorption atlas, J. Appl. Meteorol., 20, 802–812, 1981. a, b, c
Seemann, S. W., Borbas, E. E., Knuteson, R. O., Stephenson, G. R., and Huang, H.-L.: Development of a global infrared land surface emissivity database for application to clear sky sounding retrievals from multispectral satellite radiance measurements, J. Appl. Meteorol. Clim., 47, 108–123, 2008. a
Seity, Y., Brousseau, P., Malardel, S., Hello, G., Bénard, P., Bouttier, F., Lac, C., and Masson, V.: The AROME-France convective scale operational model, Mon. Weather Rev., 139, 976–991, 2011. a
Sellitto, P., Dufour, G., Eremenko, M., Cuesta, J., Dauphin, P., Forêt, G., Gaubert, B., Beekmann, M., Peuch, V.-H., and Flaud, J.-M.: Analysis of the potential of one possible instrumental configuration of the next generation of IASI instruments to monitor lower tropospheric ozone, Atmos. Meas. Tech., 6, 621–635, https://doi.org/10.5194/amt-6-621-2013, 2013. a
Sherlock, V. and Saunders, R.: ISEM-6: Infrared surface emissivity model for RTTOV-6, Tech. rep., NWP-SAF, 1999. a
Simeoni, D., Singer, C., and Chalon, G.: Infrared atmospheric sounding interferometer, Acta Astron., 40, 113–117, 1997. a
Snyder, W. C., Wan, Z., Zhang, Y., and Feng, Y.-Z.: Classification-based emissivity for land surface temperature measurement from space, Int. J. Remote Sens., 19, 2753–2774, 1998. a, b, c
Susskind, J., Barnet, C. D., and Blaisdell, J. M.: Retrieval of atmospheric and surface parameters from AIRS/AMSU/HSB data in the presence of clouds, IEEE T. Geosci. Remote, 41, 390–409, 2003. a
Timmermans, R., Lahoz, W., Attié, J.-L., Peuch, V.-H., Curier, R., Edwards, D., Eskes, H., and Builtjes, P.: Observing system simulation experiments for air quality, Atmos. Environ., 115, 199–213, https://doi.org/10.1016/j.atmosenv.2015.05.032, 2015. a
Tournier, B., Armante, R., and Scott, N.: STRANSAC-93 et 4A-93: Developpement et validation des nouvelles versions des codes de transfert radiatif pour application au projet IASI, Tech. Rep. 201, LMD/CNRS, Ecole Polytechnique, 1995. a, b, c
Weston, P.: NWPSAF 1D-Var GUI User Guide, Tech. rep., EUMETSAT, 2014. a
Wiegele, A., Schneider, M., Hase, F., Barthlott, S., García, O. E., Sepúlveda, E., González, Y., Blumenstock, T., Raffalski, U., Gisi, M., and Kohlhepp, R.: The MUSICA MetOp/IASI H2O and δD products: characterisation and long-term comparison to NDACC/FTIR data, Atmos. Meas. Tech., 7, 2719–2732, https://doi.org/10.5194/amt-7-2719-2014, 2014. a