the Creative Commons Attribution 4.0 License.
the Creative Commons Attribution 4.0 License.
 | 25 Feb 2019
Cloud geometry from oxygen-A-band observations through an aircraft side window
Tobias Zinner
Ulrich Schwarz
Tobias Kölling
Florian Ewald
Evelyn Jäkel
Bernhard Mayer
Manfred Wendisch
During the ACRIDICON-CHUVA (Aerosol, Cloud, Precipitation, and Radiation Interactions and Dynamics of Convective Cloud Systems–Cloud Processes of the Main Precipitation Systems in Brazil: A Contribution to Cloud Resolving Modeling and to the GPM (Global Precipitation Measurement)) aircraft campaign in September 2014 over the Amazon, among other topics, aerosol effects on the development of cloud microphysical profiles during the burning season were studied. Hyperspectral remote sensing with the imaging spectrometer specMACS provided cloud microphysical information for sun-illuminated cloud sides. In order to derive profiles of phase or effective radius from cloud side observations, vertical location information is indispensable. For this purpose, spectral measurements of cloud-side-reflected radiation in the oxygen A absorption band collected by specMACS were used to determine absorption path length between cloud sides and the instrument aboard the aircraft. From these data, horizontal distance and eventually vertical height were derived.
It is shown that, depending on aircraft altitude and sensor viewing direction, an unambiguous relationship of absorption and distance exists and can be used to retrieve cloud geometrical parameters. A comparison to distance and height information from stereo image analysis (using data of an independent camera) demonstrates the efficiency of the approach. Uncertainty estimates due to method, instrument and environmental factors are provided. The main sources of uncertainty are unknown in cloud absorption path contributions due to complex 3-D geometry or unknown microphysical properties, variable surface albedo and aerosol distribution. A systematic difference of 3.8 km between the stereo and spectral method is found which can be attributed to 3-D geometry effects not considered in the method's simplified cloud model. If this offset is considered, typical differences found are 1.6 km for distance and 230 m for vertical position at a typical distance around 20 km between sensor and convective cloud elements of typically 1–10 km horizontal and vertical extent.
- Article
(2732 KB) - Full-text XML
- BibTeX
- EndNote


Information on the location and extent of clouds is central for any assessment of the role of clouds in the atmosphere. Knowledge of cloud vertical or lateral extent does not only allow for a first-order estimate of the total water content, but also allows their contribution to the radiation balance of the climate system to be estimated. In contrast to active remote sensing techniques providing an immanent distance measurement, passive remote sensing techniques need additional information sources in order to assign a location to the observed values. For satellite techniques, this is often achieved through the use of observations in the thermal spectral range for the vertical. Based on the assumption that a cloud emits thermal radiation as a black body emitter, the observed brightness temperature is interpreted as cloud top temperature, which can be converted to a height if the temperature profile is known (e.g. Smith and Platt, 1978). More complex thermal techniques also relax the black body assumption to derive cloud heights for semi-transparent cloud layers from two or more thermal channels' observation differences (split window techniques, CO2 slicing; e.g. Chahine, 1974; Menzel et al., 2008).
In addition to simple vertical cloud extent, other aspects of cloud geometry strongly affect the passive remote sensing of cloud microphysical properties through illumination effects, e.g. shadows or bright cloud slopes (Varnai and Marshak, 2002; Zinner et al., 2006; Varnai and Marshak, 2007; Vant-Hull et al., 2007; Liang and Di Girolamo, 2013; Grosvenor and Wood, 2014). Especially at a higher spatial resolution, effects caused by geometry variation are of important influence (Zinner et al., 2006; Zinner and Mayer, 2006).
A method based on high-resolution cloud reflectivity measurements in the solar spectral range is the so-called cloud side remote sensing approach, proposed by Martins et al. (2011) and Zinner et al. (2008) for the retrieval of cloud microphysical properties (particle size and phase) along the vertical profile of convective clouds. For this approach, Ewald et al. (2019) show that cloud surface orientation can explain most of the observable variation of cloud reflectivity due to 3-D radiative transfer. If cloud surface orientation were known, it could be considered for an important improvement of all passive cloud remote sensing methods. For cloud side observations, this is also demonstrated in Ewald et al. (2015) using a scanning cloud radar to reconstruct cloud geometry.
For the cloud side retrieval of convective microphysics profiles, a localization of each observation to a vertical position is obviously indispensable (e.g. for thermodynamic phase in Jäkel et al., 2017 or effective radius in Ewald et al., 2019). Originally Martins et al. (2011) suggested using a thermal cloud side imager to obtain the necessary information. Cloud-radar-aided localization as in Ewald et al. (2015) is also possible within its sensitivity limitations. Both methods depend on additional measurements and instrumentation with its own limitations and sensitivities; e.g. thermal imagery is affected by molecular absorption (especially water vapour), specifically when used at a slanted view through the dense lower atmosphere. The necessary matching of multi-sensor observations introduces additional uncertainties.
During the German–Brazilian ACRIDICON-CHUVA (Aerosol, Cloud, Precipitation, and Radiation Interactions and Dynamics of Convective Cloud Systems–Cloud Processes of the Main Precipitation Systems in Brazil: A Contribution to Cloud Resolving Modeling and to the GPM (Global Precipitation Measurement)) aircraft campaign in Brazil in 2014 (Wendisch et al., 2016), cloud side observations of solar reflectivity were collected with the imaging cloud spectrometer specMACS (Ewald et al., 2016). Spectral radiance between 420 and 2500 nm was measured through a side window of the German research aircraft HALO (High Altitude LOng range Gulfstream G550; Krautstrunk and Giez, 2012; see Fig. 1). Instead of using thermal imagery or active measurements of distance, we will present the derivation of cloud distance based on the available spectral imager specMACS data itself. Oxygen-A-absorption-band measurements in the short-wave infrared around 760 nm provide distance information derived from the atmospheric absorption path. This way all data generated are provided in the same instrument-specific coordinate system (time and space) and can be easily combined to provide products, e.g. the typical profile of particle size along the cloud side.
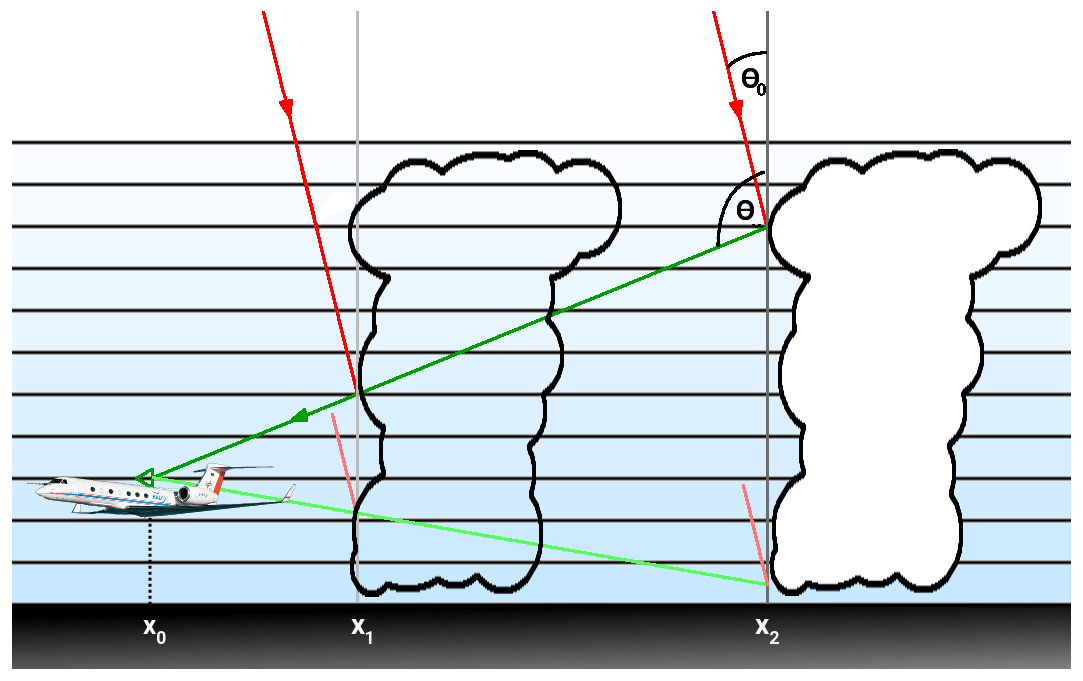
Figure 1Illumination and observation geometry for cloud side remote sensing. A sensor mounted on an aircraft at height z observes a cloud side at distance xi−x0. Solar radiation enters the atmosphere at a solar zenith angle θ0 to the cloud, where it gets scattered and reaches the sensor at sensor zenith angle θ. Depending on cloud distance, radiation within the oxygen absorption band gets absorbed on this path according to the path length and increasing atmospheric density with decreasing height. This 2-D illustration shows a situation with the solar illumination in line with the sensor viewing direction (relative sensor azimuth 0∘). In this study, relative sensor azimuth ±45∘, solar zenith ∘ and sensor zenith angles 40∘ (below the horizon) ∘ (above horizon) will be considered.
The derivation of distance from the absorption along the light path of reflected light in the oxygen A band was originally proposed by Yamamoto and Wark (1961) for satellite application. Wu (1985), Fischer and Grassl (1991) and Fischer et al. (1991) discussed the theory behind the approach in detail. Recently Yang et al. (2013) nicely summarized different approaches to the retrieval of cloud height and cloud thickness at the same time through a combination of measurements of the DSCOVR EPIC sensors in the oxygen A and B bands. Merlin et al. (2016) suggest deriving both parameters from a combination of oxygen-A-band measurements at different angles. Depending on cloud type and the choice of spectral information used, an accuracy between 50 m and a few hundred metres is found. We adapt the method to cloud sides and near-horizontal light paths between the sensor and clouds for the specMACS sensor. In contrast to other approaches, as e.g. a stereo image analysis, this method is not limited to a few features of high contrast, but provides distance over large continuous parts of the available data.
Nevertheless, data from a manual stereo distance analysis by Jäkel et al. (2017) for a number of ACRIDICON-CHUVA cloud cases are used for comparison to the absorption-path-derived distance. Stereo techniques were first applied to clouds from operational geostationary and polar-orbiting satellites (Hasler, 1981; Muller et al., 2007). For high spatial resolution ground-based stereo-camera systems, Seiz et al. (2007) and Beekmans et al. (2016) estimate typical distance biases on the order of a few hundred metres or a few percent of the distance. As opposed to the usual use of two pictures synchronously taken from two fixed cameras, Jäkel et al. (2017) used consecutive pictures from one and the same camera onboard the moving HALO aircraft.
Distance determination for the ACRIDICON-CHUVA cloud side observations is presented in the following. A detailed analysis of uncertainty is conducted for the oxygen-A-band method applied to our sensor set-up and an uncertainty estimate product is provided as part of the method. Geometrical heights obtained this way are compared to stereo analysis results.
2.1 Measurements and modelling of spectral radiance
Through a side window of the German HALO (High Altitude LOng range) aircraft, reflected sunlight around the oxygen A band was measured by the imaging cloud spectrometer specMACS during the ACRIDICON-CHUVA campaign (Fig. 1). It has a spectral resolution of 2.5–4 nm below 1000 nm and 7.5–12 nm above 1000 nm wavelength. Data were collected at a spectral sampling of 1.6 nm and a spectral bandwidth of 2.8 nm (full width half maximum, FWHM) in the region of the oxygen A band (Ewald et al., 2016). Ewald et al. (2016) characterized spectral channel positions as well as the spectral filter function width in detail.
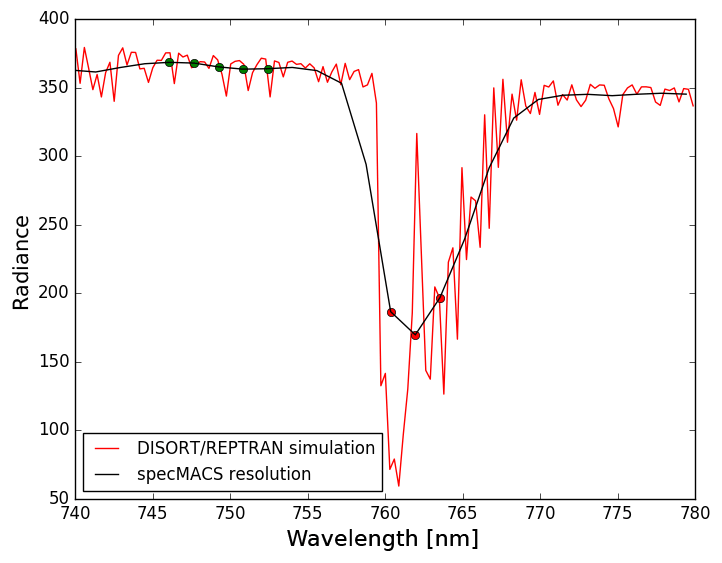
Figure 2DISORT simulation of the oxygen A band using an REPTRAN medium resolution (0.2 nm, red line) and reduced to specMACS spectral response (black line, sampling 1.6 nm, FWHM =2.8 nm). Coloured dots label specMACS channels used in this work.
Figure 2 shows the spectral shape of the oxygen A band in specMACS sampling together with a simulation at higher resolution. These simulated spectra, as well as all radiative transfer calculations necessary for the set-up of the method, were done using the libRadtran package (Mayer and Kylling, 2005; Emde et al., 2016). The measurement set-up shown in Fig. 1 with a sideward viewing sensor, near-horizontal absorption paths and nearly vertical convective cloud sides can not be represented in a 1-D plane-parallel standard set-up. Thus, the 3-D radiative transfer model MYSTIC (Monte Carlo code for the physically correct tracing of photons in the atmosphere; Mayer et al., 2009) was applied. Spectral gas absorption was considered using the REPresentative wavelength radiative TRANsfer method (REPTRAN) by Gasteiger et al. (2014). REPTRAN is based on line-by-line calculations. Radiances are approximated as a weighted mean at representative wavelengths. As mentioned above, Fig. 2 shows the spectral region of the oxygen A band at different spectral resolutions. The REPTRAN medium resolution (about 0.2 nm in this spectral range) was found to provide sufficient accuracy compared to higher spectral resolution and will be used in the following. At this resolution part of the detail of the absorption band is still visible. Details like the two absorption minima at 761 and 763 nm are not resolved at specMACS resolution (black line in Fig. 2). Still a number of channels can be used to provide a valid measurement of absorption band depth. Five specMACS channels between 745 and 754 nm (green dots) will be used as reference measurement not affected by oxygen absorption and three channels inside the absorption band between 759 and 765 as a measure of absorption (red dots).
2.2 Retrieval
After the solar radiation is reflected by clouds, the absorption path through the atmosphere mainly depends on the distance and the observation zenith angle θ. While θ0, θ and the general oxygen distribution in the atmosphere are known, cloud distance can be derived from the absorption signal within some limitations. Fischer and Grassl (1991) propose a cloud height derivation based on a spectral measurement around the oxygen A band with a resolution on the order of 1 nm, but also demonstrate that lower spectral resolution of several nanometres could be sufficient. Technically, they use the relation of cloud distance and a radiance ratio composed from one measurement next to the oxygen absorption region and one within the absorption band. In the following we describe our implementation of this approach and the expected sources of error and uncertainty.
2.2.1 Sensitivities
The impact of a range of sources of uncertainty is investigated using radiative transfer simulations in the following. Fischer and Grassl (1991) already emphasized the importance of a knowledge of the spatial distribution of scattering coefficient or cloud optical thickness. Both influence the in-cloud photon absorption path and thus the cloud reflectance within the absorption band. We plan to derive distance only for optically thick clouds and thus expect to be in a saturation regime for reflected radiances which would minimize errors due to unknown optical thickness. The unknown 3-D distribution of the scattering coefficient (related to cloud microphysics) still could strongly affect the method – the influence of liquid water content (LWC), cloud particle size and cloud extent is tested. Neglected detail of the aerosol distribution could have similar effects. Surface albedo and pressure profile variations are tested as well as the impact of the spectral calibration accuracy of the spectrometer used.
Figure 1 shows the set-up for the 3-D Monte Carlo simulations in this section. The horizontal cloud extent in the following is Δx=2 km, cloud liquid water content is at a homogeneous 0.5 g m−3 and effective radius at constant 10 µm. Example oxygen-A-band spectra are shown in Fig. 3. The dependence of the absorption band depth on distance (Fig. 3a) will be utilized to retrieve cloud distance – and together with observation zenith angle θ – will provide cloud vertical position. In the following, “distance” is always the horizontal distance between the sensor and cloud (as opposed to the line-of-sight distance).
All spectra in Fig. 3 are normalized to the minimum value in the 762 nm channel in order to visualize the band depth. As introduced above, the absorption signal is reduced to a radiance ratio similar to Wu (1985) and Fischer and Grassl (1991). Following their considerations and the fact that specMACS lacks spectral resolution compared to more specialized sensors, we average all three channels available within the oxygen band (red dots) and five channels next to it (green dots). We define the oxygen-A-absorption-band ratio as follows:
The larger the absorption, the smaller the ratio is. Figure 3 gives the values of RO2A related to the absorption band depths shown.
Although spectral position and spectral filter functions have been characterized by Ewald et al. (2016), some remaining uncertainty has to be assigned to this calibration: an accuracy of the spectral position of about 0.1 nm and an uncertainty of the spectral width of 0.2 nm can be assumed (Ewald et al., 2016). As a test of the impact, a variation of bandwidth of ±0.2 nm is applied. It yields small differences of around 1 % in the observed radiance ratio, as shown in Fig. 3b.
Absorption path length depends on sensor zenith angle θ, as it controls the total absorber amount to be passed after scattering by the cloud in combination with the observer height (Fig. 3c). Changes of solar zenith angle and relative azimuth angles have a much smaller effect on the path length (Fig. 3d, e). Using aircraft orientation data, these parameters can be characterized with sufficient accuracy.
Other characteristics of atmosphere and surface situation are not as accessible. Higher surface pressure would lead to an increase of oxygen absorption and a decrease in RO2A at a given height. It is obvious in Fig. 3f that this influence is small for the observed range of surface pressure during the ACRIDICON-CHUVA campaign (995–1015 hPa). Surface albedo can also influence the absorption band depth due to multiple scattering between surface and atmosphere. Longer absorption paths are generated for larger surface albedo (Fig. 3g). Aerosol concentration along the path influences the path length in a similar way: the higher the aerosol content, the longer the path due to multiple scattering, and the smaller the RO2A (Fig. 3h).
The spatial distribution of scatterers in clouds influences the in-cloud path lengths. Wu (1985) and Fischer and Grassl (1991) point out that the spatial distribution of the scattering coefficient as well as the optical thickness of the cloud layer are critical for their retrievals of cloud height for a wide range of optical thick and thin clouds. In the case of cloud side remote sensing of convective cloud microphysics, the task is simplified. The object of interest is a dense vertical cloud with a horizontal spatial extent of the order of kilometres. A liquid water content of 0.5 g m−3 (typical for ACRIDICON-CHUVA; Wendisch et al., 2016) and an extent of just 1000 m already leads to large (horizontal) optical thickness values on the order of 50 and above. Wu (1985) shows that these circumstances minimize uncertainties. Figures 3i, j and k show the effect of varying characteristics of the cloud on the absorption band depth: LWC, particle size and horizontal extent are varied. Cloud extent does not cause any important uncertainty; the influence of droplet size is also small. Unknown LWC leads to a larger potential uncertainty, especially for low water content.
Figure 3m demonstrates the effect of a deviation of the general cloud geometry from the idealized “cloud wall”. Absorption band results are simulated for a large spherical cloud here. A cloud sphere with diameter of 2 km is placed at fixed 10 km horizontal distance. In order to vary the angle of the cloud surface relative to the horizon without changes of sensor elevation angle or distance, its vertical and horizontal position is changed (vertically and with respect to distance to sphere centre). θcloud=90∘ is comparable to the reflected radiance from a vertical cloud surface as shown in the other displays before. The surface tilts away from the vertical towards the cloud top until it reaches a horizontal surface with θcloud=0∘. The more horizontal the cloud surface is, the more likely short photon paths between sun, cloud and sensor become. A retrieval based on the assumption of vertical cloud sides would provide a negative distance bias. An important consequence of this last test is the limitation of the method developed in the next section to cloud sides. Cloud top areas as well as horizontal cloud formations, like stratocumulus decks, should be excluded. It can be expected that an average deviation from the assumption of vertical cloud sides will lead to a systematic effect.

Figure 3Sensitivity of the oxygen A absorption band at specMACS resolution to different parameters. MYSTIC Monte Carlo radiative transfer simulations for a cloud wall set-up (for a–k) or a “cloud sphere” (m). The basic situation is characterized by solar zenith angle θ0=30∘, observation zenith angle θ=75∘ (15∘ elevation below the horizon), relative sensor azimuth angle between solar and observation azimuth 0∘, sensor altitude zs=6 km, distance to cloud Δx=10 km, horizontal cloud extent Δx=2 km, cloud liquid water content 0.5 g m−3, effective radius 10 µm, no aerosol, albedo a=0 and tropical standard atmosphere with 1000 hPa surface pressure (Anderson et al., 1986). Starting from this set-up, single parameters are varied: distance to cloud (a), specMACS spectral bandwidth (b), observation zenith angle (c), relative solar azimuth angle (d), solar zenith angle (e), surface pressure (f), surface albedo (g), aerosol optical thickness (h), cloud liquid water content (i), cloud effective radius (j), horizontal extent (k) and cloud surface angle relative to observation (m). The five specMACS spectral channels next to the absorption band labelled with green points and the three within the absorption line are used in the retrieval.
2.2.2 Lookup table
The retrieval of sensor–cloud distance will be realized through forward simulations describing the relation of absorption ratio RO2A and distance. As mentioned before, the geometry of the observation situation requires 3-D radiative transfer simulations. As these are very time-consuming, strong constraints apply to the affordable computational effort. This leads to the simplification of convective cloud geometry to vertical cloud walls. Consideration of different or more typical cloud side inclination would be possible in principal – e.g. a cloud surface slightly tilting away from the vertical. However, already at this stage, the derivation method is based on extensive time-consuming 3-D radiative transfer simulation. Unfortunately the implementation of tilted cloud slopes into an orthogonal simulation grid would increase the computational effort to the point of futility because calculations on a much finer spatial grid would become necessary.
The horizontal distance and the observation geometry (sensor height, sensor zenith angle, solar zenith angle) define the dimensions of a lookup table. All other sensitivities will be neglected and have to be considered as a source of uncertainty to be quantified: either because parameters can not be constrained at all (LWC, reff, cloud horizontal extent, local aerosol and albedo situation) or uncertainties introduced are so much smaller than those mentioned above that the expensive extension of the lookup table with another free parameter seems unnecessary (surface pressure, solar azimuth angle). A detailed uncertainty analysis is provided later.
To generate a lookup table, forward simulations are set up for the selected environmental parameters listed in Table 1. Observation zenith angle θ is discretized in steps of 2∘ between 41∘ (below the horizon) and 99∘ (above horizon), cloud distances at 17 values of increasing distance between 0.5 and 60 km and flight altitudes in steps of 1 km between 2 and 11 km. The cloud for these simulations has the dimensions Δx=2 km (in viewing azimuth direction), Δy=∞ (perpendicular to viewing azimuth angle) and Δz=12 km (between surface and 12 km height).
For combinations of these parameters, reflected radiances are simulated using libRadtran/MYSTIC with the REPTRAN medium. Eight simulated specMACS channels (as labelled in Fig. 3) contribute to the ratio RO2A as defined in Eq. (1).

Figure 4MYSTIC Monte Carlo simulations for a cloud wall geometry. Example of the lookup table forward simulations showing the dependence of cloud distance and reflected radiance ratio RO2A for θ0=30∘, zs=6 km (thin black lines). Varying sensor zenith angle θ is shown in colour (horizon at 90∘). For each θ value and each solar zenith angle θ0 a polynomial fit to Monte Carlo results is obtained and used to derive distance in the retrieval: (broken coloured lines). Shown are results for all θ between 41∘ (below the horizon) and 99∘ (above horizon) for which the cloud wall between the surface and 12 km height is visible at the respective distance.
Figure 4 shows a subset of these forward simulations (, zs=6 km). For increasing distance to the cloud and for several sensor zenith angles θ, the ratio RO2A is displayed. For a given sensor height the cloud wall is only visible under certain observation zenith angles up to a certain distance; e.g. for θ=73∘ (17∘ below the horizon, blue colour) the cloud is visible only up to about 16 km. Only the surface is visible at the same viewing direction for greater distances. For a sensor zenith angle above horizon (θ>90∘) only the sky is visible for large distances.
The 3-D radiative transfer simulations used to create the results are subject to Monte Carlo noise, observable as deviations of the black line connecting Monte Carlo results. The model provides exact results within the uncertainty allowed by the photon statistics of the model. Here the standard deviation of reflectivity results is 1.5 %. A reduction of this intrinsic uncertainty would be possible through an increase of the simulated number of photons N. As uncertainty decreases according to , the required increase in computational time would be prohibitively large. Already for this accuracy, simulation of 20 000 combinations (4 different solar zenith angles, 10 different sensor heights, 17 distances, and 30 sensor zenith angles) consumes more than 1 week of computation time on a large cluster machine. Substantial improvement, e.g. reduction to 0.15 %, would require an increase of this time by a factor of 100. Instead, we limit the impact of the noise by using a third-order polynomial fit on the Monte Carlo simulations.
Figure 4 shows these individual fits as dashed coloured lines. Furthermore this reduction of the individual results to a set of polynomial functions , one for each sun and sensor geometry, allows for an effective retrieval using these functions to derive distance . Although the impact of Monte Carlo uncertainty is much reduced through the fitting, it still results in a contribution to the uncertainty to be considered.
With given values of solar zenith angle θ0, sensor zenith angle θ and flight altitude this set of polynomial functions provides a distance retrieval for each RO2A measurement. Distance can be retrieved for situations with solar zenith angle between 3 and about 60∘. The allowed relative azimuth between sun and sensor view is limited to 45∘. Distance derivation for larger azimuth differences is strongly affected by 3-D effects (e.g. shadows). By filtering out cloud tops, which are always more or less horizontal, the impact of non-vertical cloud surfaces will be minimized.
2.2.3 Uncertainty budget
Table 1 summarizes observed ranges for several environmental parameters during ACRIDICON-CHUVA. As these are either not known or not represented in the forward simulations, they lead to uncertainty for the retrieval based on the oxygen-A-band ratio RO2A(=R for simplicity in the following). Using these parameter ranges together with sensitivity tests as shown in Fig. 3, uncertainties for the ratio are derived. A maximum spread for RO2A can be derived from the observed values, e.g. for pressure . In specific observation situations, even more extreme local values could be present. Assuming that Rmin and Rmax at least limit the range including 95 % of all possible values in a Gaussian error distribution, we can simplify our error estimation. A standard deviation value might then be defined as
describing the uncertainty in a specific observation situation due to environmental parameters. If it is further assumed that all uncertainties in Table 1 are independent, we can use error propagation and take the square root of the total of all squared contributions to find an overall uncertainty estimate for the ratio RO2A of about σR=2.8 %.
Table 1Summary of uncertainties due to environmental parameters during ACRIDICON-CHUVA not fully resolved through forward simulations. Each parameter is given as well as its observed range of values (wherever available), the values considered in the lookup table of forward simulations and the estimate of the remaining uncertainty based on sensitivity tests as shown in Fig. 3. An estimation of related relative standard deviation σR derived from the difference provided by the observed values listed is given.
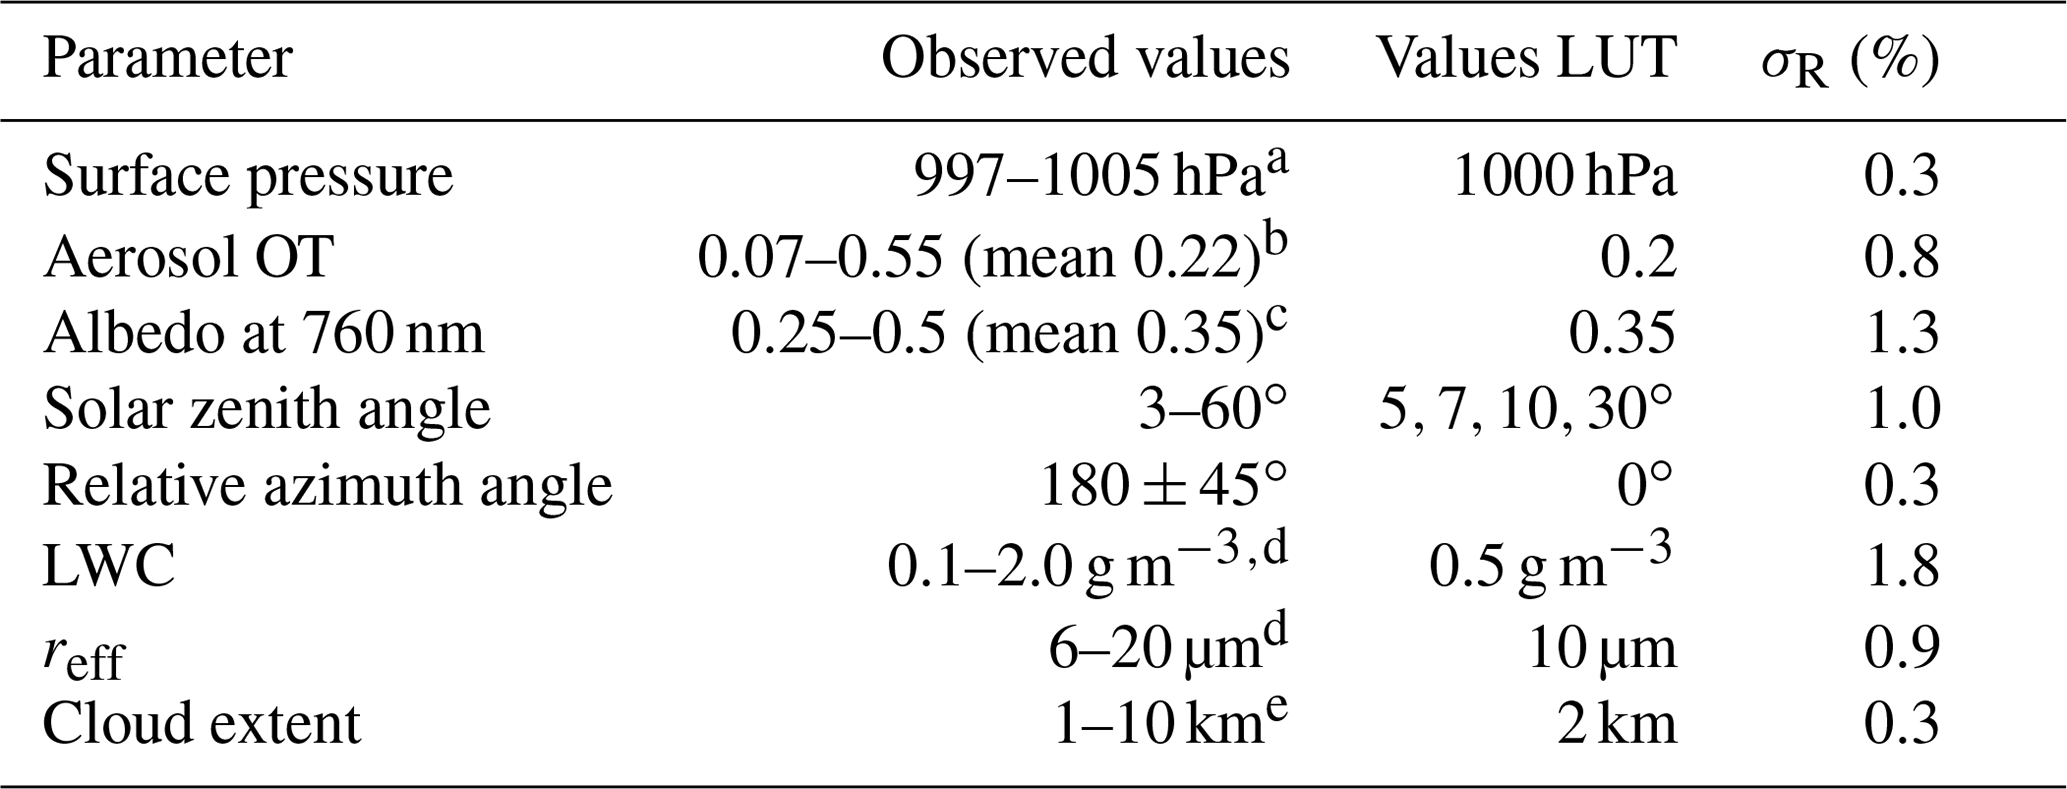
a Data from radiosonde data for Manaus Airport. b AERONET
aerosol optical
thickness (OT) at 675 nm for stations Manaus EMBRAPA, Rio Branca,
Ji Parana and
Alta
Floresta (mean over all stations). c MODIS 16-day albedo product.
d Taken from
in situ measurements during the campaign. e Typical values.
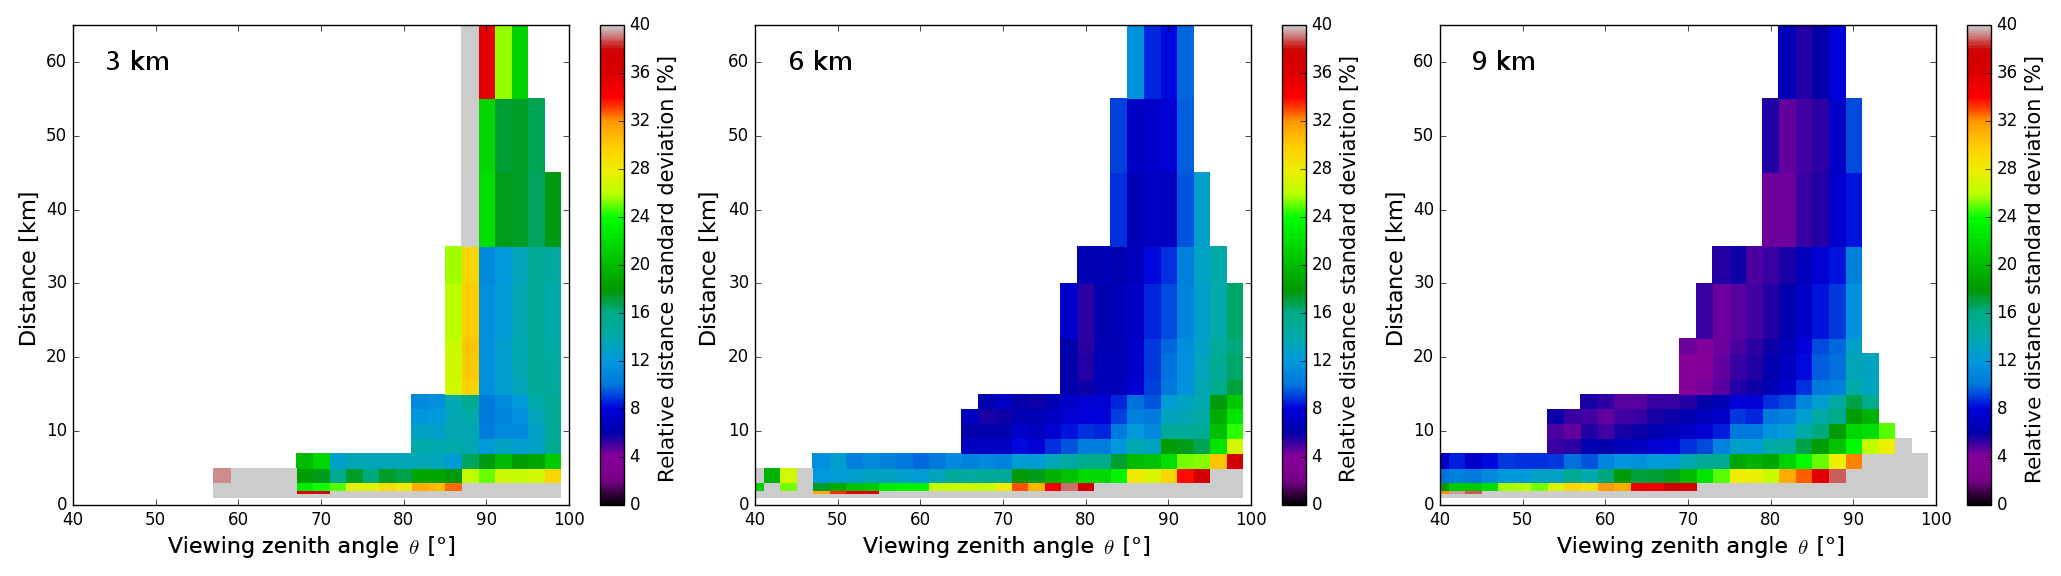
Figure 5Calculated standard deviation of oxygen-A-band-derived distances due to uncertainty of Monte Carlo simulation, sensor calibration, environmental parameters and their discretization in the lookup table of forward simulations (compare Table 1) depending on cloud distance and observation zenith angle for three of the tabulated observation altitudes.
These environmental uncertainties are combined with the Monte Carlo uncertainties mentioned and sensor calibration accuracy (spectral and radiometric) to provide a total error budget. For three different observation altitudes, Fig. 5 shows an example of the resulting uncertainty budget for derived distance from all sources apart from 3-D effects (which are limited by suited filtering of the observation scenes). The shape of these maps with respect to distance and elevation angle is caused by the general cloud and observer geometry. At low altitudes most cloud sides can be observed looking upward, while for high altitudes they are observed looking downward. Relative uncertainties of distance become large (>15 %) for distances smaller than 5 km and for viewing zenith angles close to or above the horizon at 90∘. The reasons are the unknown cloud parameters and albedo: if the sought distance signal on absorption is weak, either due to small cloud distance or due to a shortage of absorbing oxygen (e.g. more horizontal compared to more downward looking observation geometries), the impact of these unknown boundary conditions is stronger. Effects of aerosol situation, Monte Carlo statistics and sensor accuracy are much smaller. Only at low altitudes does the higher aerosol content in these layers have a larger impact.
Uncertainties of more than 10 % might be too large for most applications of distance measurement. This is also true for the application to cloud side remote sensing intended here (Jäkel et al., 2017; Ewald et al., 2019). The geometrical set-up of our application, the vertical localization of cloud microphysical observations from a flying aircraft, fortunately improves the situation: a relative uncertainty of 10 % in horizontal distance maps onto the same relative uncertainty in altitude difference using the observation elevation angle. However, the distance affected this way is only the altitude difference between the point on the cloud and the observer, i.e. the flight altitude. For a cloud altitude of 7500 m and a flight altitude of 5000 m, a relative uncertainty of 10 % in distance translates into an altitude uncertainty of only 250 m, or 3 %. In the next step height retrieval and the connected uncertainty budget will be systematically compared to independent measurements of height.
In order to check the validity of distance and height measurements derived from the oxygen A band, we compare these data from the specMACS imager to completely independent stereo cloud distance estimates from a 2-D camera system. specMACS observes in a push broom geometry to the side, while stereo-matching depends on the tracking of the same image features for a different angular position on 2-D pictures. The camera used for the latter is a GoPro Hero (manufactured by GoPro, Inc., USA, HD3+3660-023 Full-HD, hereafter GoPro), which was fixed to a side window next to the specMACS sensor during ACRIDICON-CHUVA. It collected RGB images of 1920×1080 pixels size with a total field of view of about 90∘ × 60∘ at a frame rate of 30 Hz. The cloud sides observed by specMACS were visible in the 2-D imagery due to GoPro's much wider field of view along- and across-track. In order to compare results for cloud distance from both systems, an accurate temporal and geometrical matching of the data sets is necessary. Automation of this matching is tedious, in particular because mounting and time registration of the GoPro camera changed between flights. Therefore Jäkel et al. (2017) did a manual stereo analysis for several cloud cases during the ACRIDICON-CHUVA flights. They matched time and space coordinates of both systems for selected traceable cloud side features and derived distances and heights for their remote measurements of cloud phase. In the following, results of their stereo derivation for 500 stereo points over 27 cloud cases and the automatic oxygen-A-absorption-based cloud height maps are compared.
For high spatial resolution ground-based stereo-camera systems and the distance between the observer and cloud of 4–10 km, Seiz et al. (2007), Öktem et al. (2014) and Beekmans et al. (2016) estimate typical distance biases on the order of a few hundred metres or a few percent of the distance, with larger errors for larger distances. Jäkel et al. (2017) estimate their accuracy to be around 200–300 m. Reasons for these accuracy limitations are, e.g. incomplete or variable camera orientation information (e.g. for the Jäkel et al., 2017 analysis), uncertainties in camera distortion characterization, camera angular resolution limitations, limited aircraft orientation accuracy or wind drift.
With these values and our analysis shown in Fig. 5, it seems likely that oxygen A retrievals produce similar values for clouds up to 10 km distance. For more distant clouds (and especially for distances above horizon and for strong 3-D effects) the uncertainty of oxygen-A-band retrieval uncertainties is larger than these values. However, for distances above 10 km, stereo method uncertainties most likely increase too, as camera projection uncertainties in these methods lead to distance-dependent uncertainty contributions. Figure 6 shows a comparison of oxygen-A-band-derived distances and stereo derivations from Jäkel et al. (2017) for an example case. A systematic comparison to several hundred stereo-derived positions is shown in Fig. 7.
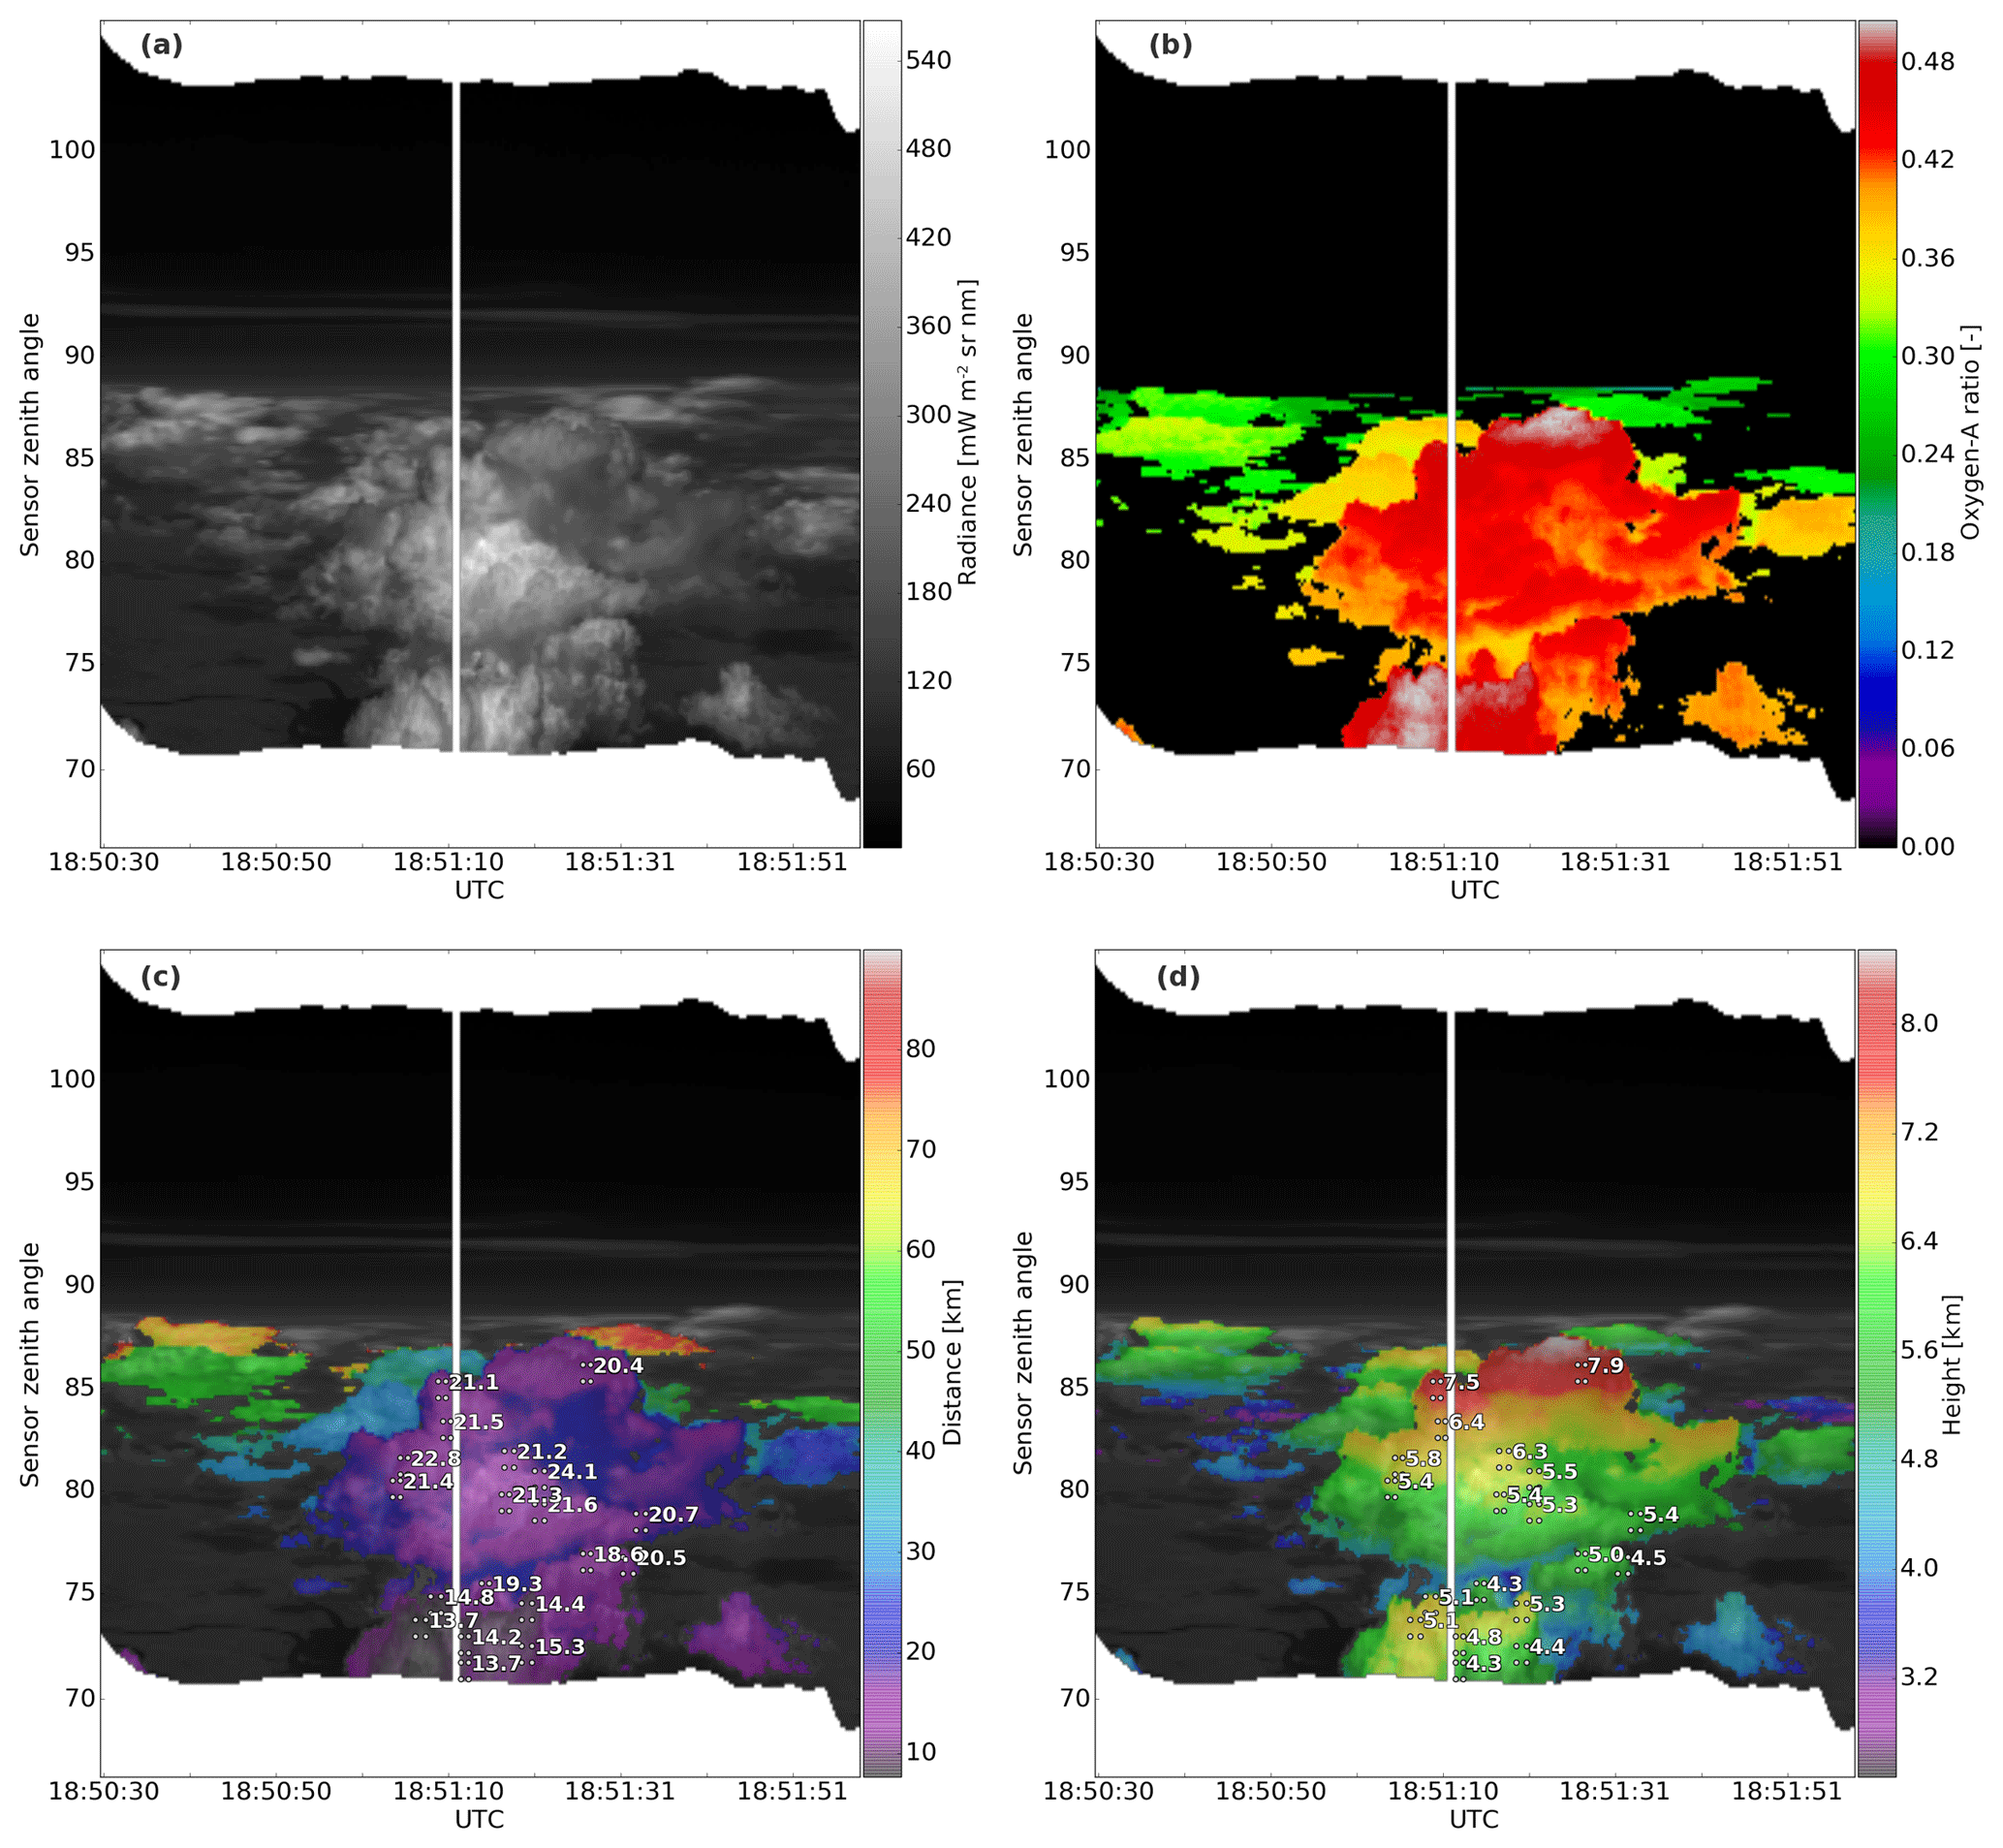
Figure 6specMACS data from ACRIDICON-CHUVA flight AC18 on 28 September 2014 (flight altitude 9.1 km). (a) Visible radiance image at 750 nm wavelength, (b) oxygen-A-absorption-band ratio , (c) distance derived from RO2A and (d) height derived from RO2A. In (c) and (d) values from stereo analysis of distance and height from Jäkel et al. (2017) are included; points label regions of oxygen-A-band-derived values compared to the given stereo-derived values in Fig. 7.
One minute of specMACS data at 745.5 nm wavelength from ACRIDICON-CHUVA flight AC18 on 28 September 2014 around 18:51 UTC at an altitude of 9.1 km is shown in Fig. 6a. Data were collected by specMACS along the time axis with a 32∘ spatial field of view across-track (dark current calibration at around 18:51:10 UTC). The sensor is looking sideward centred at 5∘ below the horizon with respect to the aircraft orientation (here 85∘ sensor zenith angle). The solar zenith angle was 37.5∘ and the relative azimuth angle 177∘. This means that the sun was almost exactly behind the observing sensor. Figure 6b shows the oxygen-A-band ratio RO2A for this case. Obviously the measured ratio is strongly dependent on distance. While nearby clouds at low sensor zenith angle show large values, corresponding to short absorption path lengths, distant clouds towards the horizon show much smaller RO2A values due to much larger absorption path lengths. Cloud tops have the tendency to display shorter absorption paths and larger ratios due to 3-D effects. In a similar way flat horizontal surfaces display shorter absorption paths than vertical parts of cloud. A likely reason is the 3-D cloud surface orientation effect as demonstrated in Fig. 3m. Shadows are rare at this solar illumination and they are only cast on the lower cloud parts (e.g. central cloud element at 75∘ sensor zenith angle). If present, they display relatively long absorption paths and smaller ratios than the rest of the cloud because these parts are only illuminated by indirect, scattered light. Using the method described in Sect. 2.2, values of RO2A can now be attributed to distances depending on observation zenith angle. Then distances are translated into vertical height values using the flight altitude (here 9.1 km) and observation zenith angle (Fig. 6d).
Distances from the Jäkel et al. (2017) paper are also shown in Fig. 6. A total of 19 stereo points derived from GoPro imagery could be identified (by eye) in the data. The distance and height from Jäkel et al. (2017) are shown in kilometres, together with an area of oxygen-A-band data to which they are compared (represented by four corner points). Values are compared for these areas instead of exact positions, as the accuracy of a matching of points in one observation geometry (GoPro, 2-D angular imagery) to a very different geometry (specMACS, one angular and one time dimension) is limited. Area size is selected to represent about 200 m × 200 m at 10 km distance to the cloud side. The 19 stereo values in Fig. 6c range from 13.7 to 24.1 km. The related oxygen-A-band distances are somewhat lower between 10 and 20 km distance. For the reasons mentioned earlier, the difference between the derived cloud heights from stereo and oxygen-A-band data in Fig. 6d is less striking.
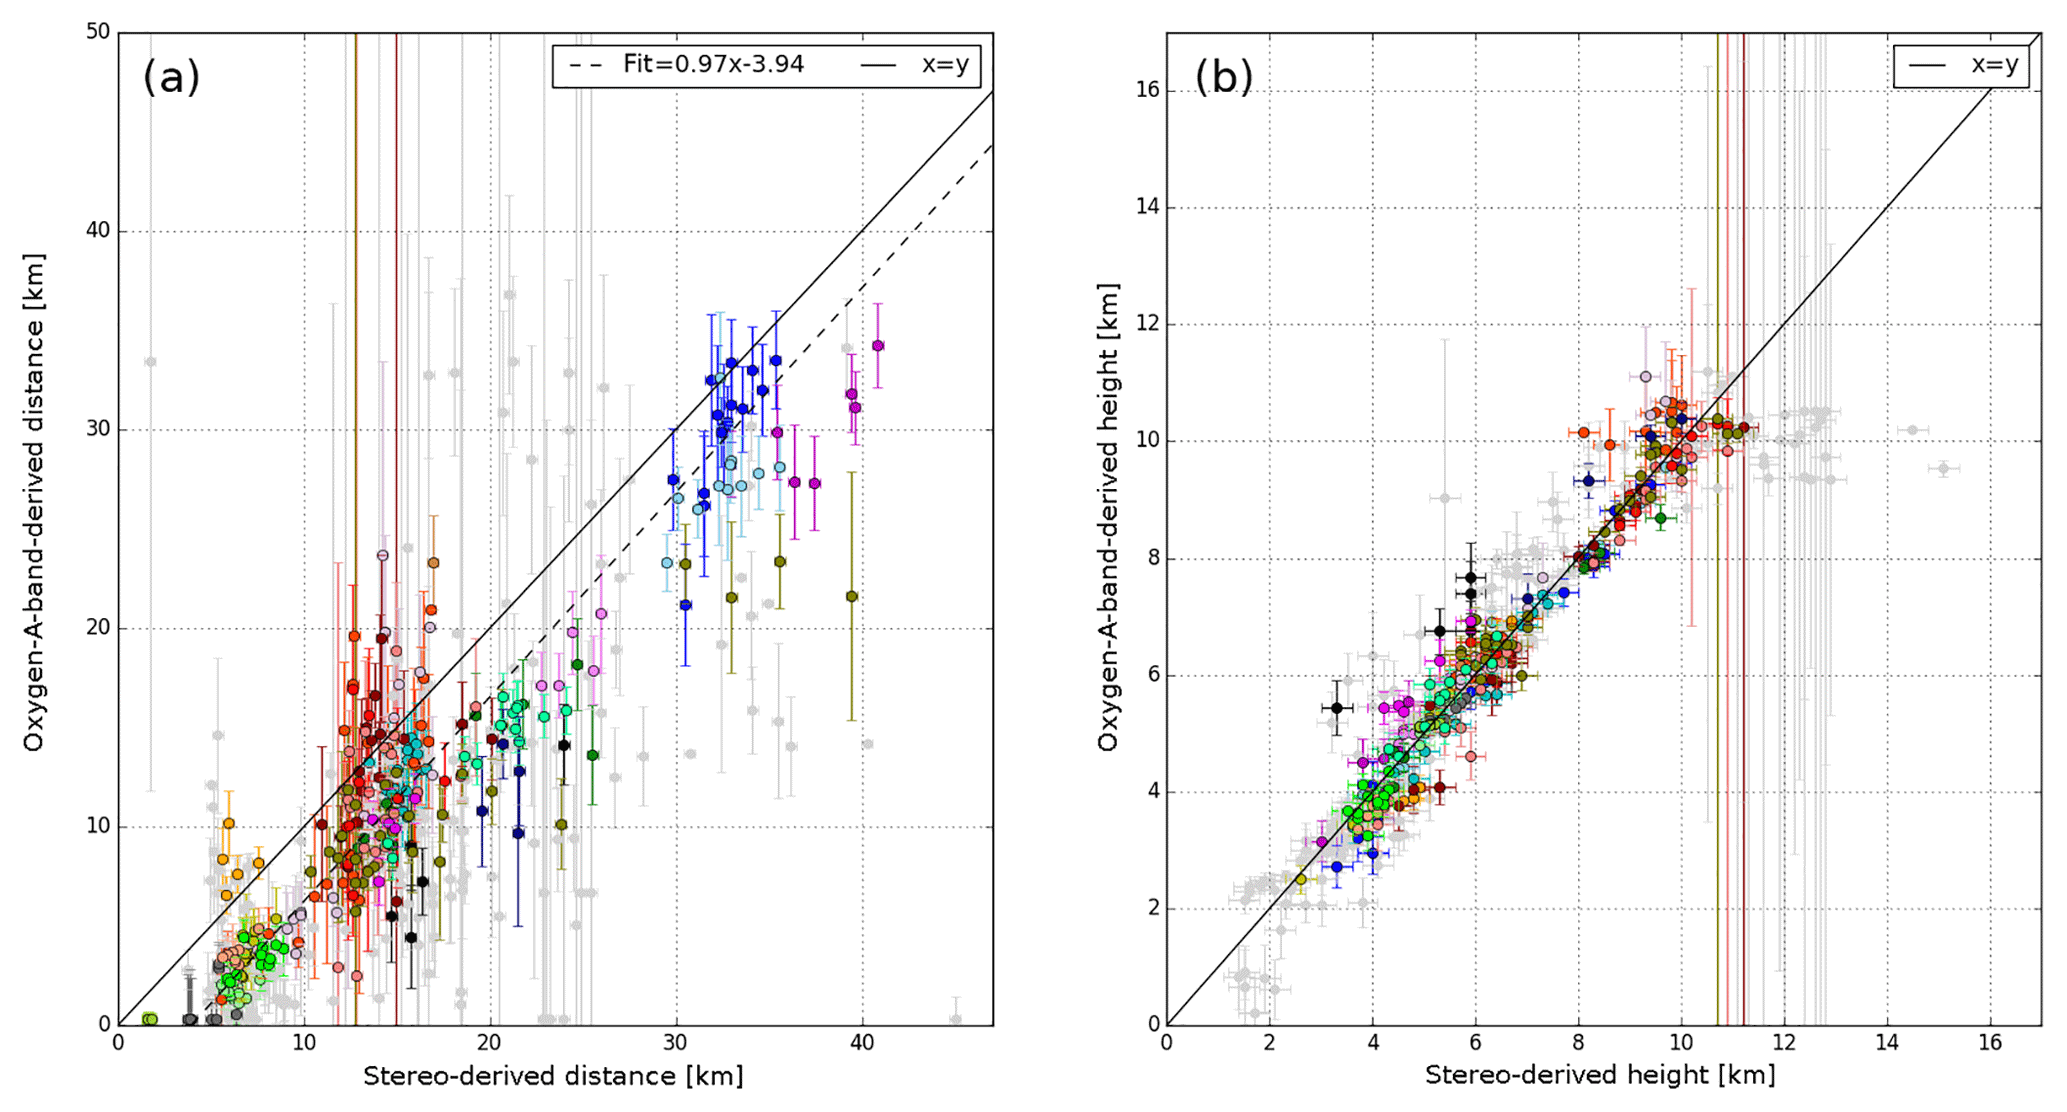
Figure 7Systematic comparison of specMACS oxygen-A-band-derived cloud distance and height to GoPro stereo-derived distance and height from Jäkel et al. (2017) for 519 points and 27 cloud situations (27 different colours). Turquoise points represent the values from Fig. 6. Panel (a) shows distance values (233 points filtered out, 286 used in quantitative analysis). Error bars for stereo values are ±300 m, and error bars on oxygen-A-band-derived distances show the error budget provided by retrieval (cf. Fig. 5 and Sect. 2.2.3) combined with the variation within oxygen-A-band sections (cf. Fig. 6). Panel (b) shows height values for both methods after a 3.7 km distance offset correction was applied to all points. Black lines show the 1:1 line, and the broken black line in (a) is a result of a linear polynomial fit through 286 points.
The systematic analysis in Fig. 7a reveals that the tendency to underestimate stereo distances is typical for many cases. From 27 cloud scenes, 519 stereo points were identified within specMACS data. A total of 233 of these are not considered for quantitative comparison (grey points, removed manually) because they are located very close to cloud tops (e.g. the top two points in Fig. 6), they are located at angles more than 15∘ below the horizon (four lowest points in Fig. 6), cloud geometry observed was a horizontal cloud deck and not a cloud side or they are located in cloud shadows. The 286 coloured points in Fig. 7a remain for analysis. Data points from the above example show up in a bright turquoise colour close to the centre of the figure; 27 different colours stand for the 27 cloud scenes analysed.
The group of points filtered out is not only responsible for most of the larger deviations, but also shows the large error estimates provided directly by the oxygen-A-band retrieval. Evidently we filtered the correct points, difficult to retrieve for different reasons, before quantitative analysis. The remaining points line up along the 1:1 line with a noticeable offset for a majority of the points. The oxygen-A-band method seems to underestimate distance. If a linear polynomial fit is applied to all remaining points, an almost perfectly parallel line with a slope parameter of 0.97 and an offset of 3.76 km is found. These parameters do not strongly depend on the point filtering applied.
After careful analysis of other possible sources, we conclude that this offset of about 3.8 km towards shorter distances in the oxygen-A-band method is mainly caused by the strength of the typical 3-D effects not considered in the retrieval. Order of magnitude and sign of the effect is consistent with the sensitivity tests using a cloud sphere in Fig. 3m. A constant offset would be a consequence of systematically shortened absorption paths due to the dominating geometry in the observed cloud scene. As a consequence, for the cloud height derivation in these ACRIDICON-CHUVA flights, a simple distance offset correction of 3.8 km to all distances derived from oxygen-A-band data seems reasonable. This approach will not produce bias-free results for each individual scene as cloud geometry and viewing perspective vary between scenes. Figure 7a shows groups of coloured points (different cloud scenes) with different offsets. Still for these a partial bias will remain, mostly on the order of 1–2 km. For other cloud types the approach would have to be adapted (e.g. more horizontal cloud layers) or a different observer perspective would have to be used (e.g. ground based). Without auxiliary means of distance determination, this “calibration” step could be achieved from a small set of 3-D forward radiative transfer simulation results for synthetic cloud cases, e.g. from cloud resolving modelling. This possibility and our conclusions regarding the role of 3-D effects are illustrated in the Conclusions and discussion section.
If this offset is applied, 60 % of all 286 oxygen-A-band-derived values coincide with stereo values within the error bars shown. A perfect consideration of all error sources in these error bars should have resulted in a share of 68 % of all values agreeing within ± 1 standard deviation. This substantiates a basically correct consideration of all important error sources influencing accuracy of the retrievals and of the mapping of GoPro positions on specMACS data.
As a last step of this method, distance has to be translated into cloud height using the flight altitude and the sensor zenith angle. As pointed out before, differences are diminished during this step due to the fact that only the vertical difference between cloud and flight altitude is affected by the uncertainties. This becomes obvious in Fig. 7b. After offset correction, the comparisons points closely line up along the 1:1 line. 86 % of all height value comparisons coincide within the uncertainty expectations, which implies that real uncertainties for the cloud height might even be smaller than the error budget predicted. The remaining standard deviation assuming a Gaussian distribution for the difference between stereo-derived and oxygen-A-band-derived distances is 490 m. The number is strongly influenced by a few large non-Gaussian outliers. The median absolute difference value, the typical difference of a single point, is 11 % (1.6 km) for distance and 4 % (230 m) for height.
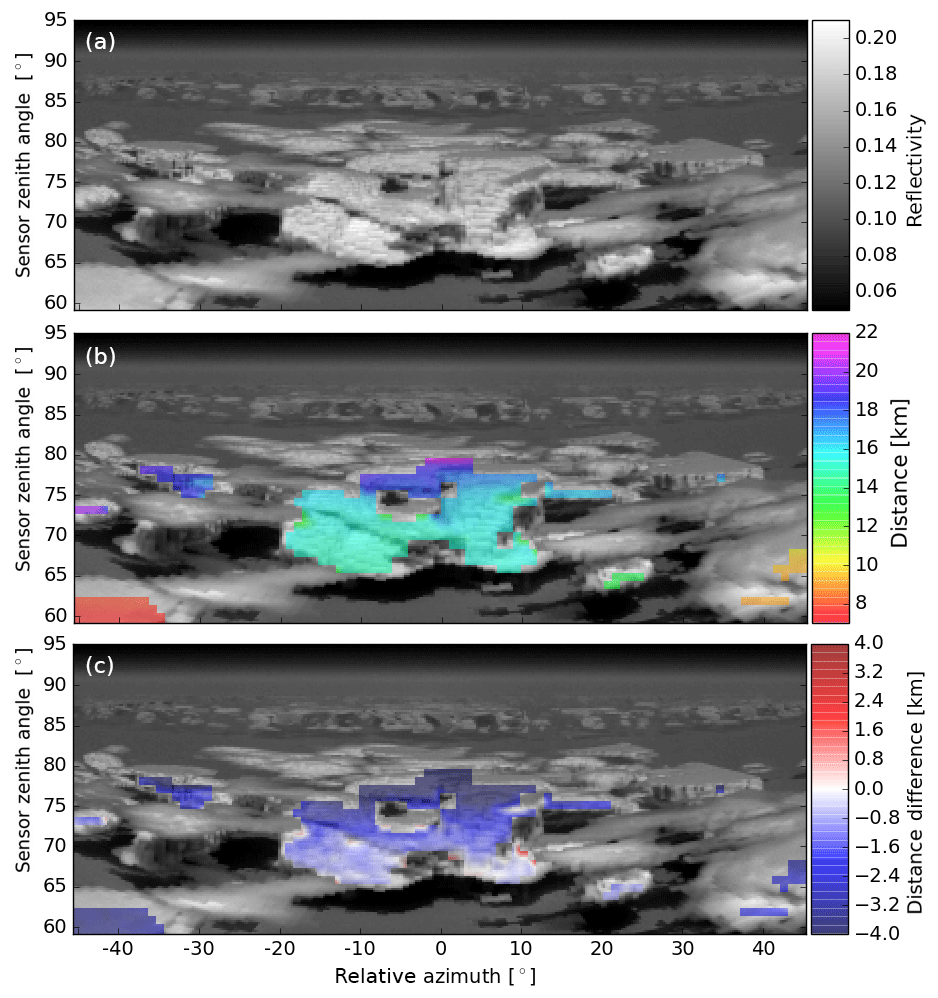
Figure 8Demonstration of the 3-D impact on retrieval using an arbitrary cloud scene. (a) Based on ICON-LEM modelled cloud data, the reflectivity for an observer at 7500 m height with the sun at θ0=30∘ and the sun behind the observer (“from the south”) and with a field of view between sensor zenith angles 60 and 95∘ and a relative sensor azimuth angle between −45 and +45∘ (“to the north”) is simulated using the 3-D radiative transfer model MYSTIC. Panel (b) shows the true distance between the observer and cloud for all cloud areas bright enough (reflectivity >0.15) for elements of 1∘ × 1∘. Panel (c) shows the difference between these distances and the result of the presented oxygen-A-band-derived values.
The instrumentation of the ACRIDICON-CHUVA HALO campaign lacked a method to provide cloud localization important for the application of cloud remote sensing data. Thus, a method was presented to derive cloud distance and vertical position of cloud elements from sideward viewing observations in the oxygen A band using data from the specMACS imaging spectrometer. A distance derivation from cloud-side-reflected radiance was presented. Using this method, a straightforward possibility is provided to assign a position in space to all products derived from the same sensor. The first main goal is the provision of a height value to generate cloud particle size or phase profiles averaged over whole convective clouds or cloud ensembles, and a second goal the provision of a cloud surface orientation to be used to reduce the impact of 3-D radiative effects on microphysics retrievals (see Jäkel et al., 2017; Ewald et al., 2019).
Uncertainties of the method have been characterized by radiative transfer experiments. The validity of the derived distance and height values and of their error budget calculations have been corroborated by comparison to a substantial number of stereo-derived values from Jäkel et al. (2017). We find an average offset between both data sets of 3.8 km. If this offset is corrected, typical observed differences lie in the range expected from the error budget. Observed differences from the stereo-derived values are somewhat larger, which could be due to uncertainties in the stereo deviation itself.
For the large offset we simply use as a correction factor, we consider 3-D cloud geometry itself to be the most likely reason: cloud side geometry is not considered completely correct in the retrieval method due to computational limitations. The starting point of the derivation method is the simplification of cloud geometry into vertical cloud walls. A cloud side tilted away from the vertical towards the horizontal decreases the typical in-cloud oxygen absorption path contributions compared to a vertical cloud. This is especially noticeable approaching (horizontal) cloud tops, but is true to some extent for most real, not perfectly vertical, cloud sides. On average over all cloud situations and distances, the value of the reduction of the absorption path for the observed convective cloud fields with respect to the simulated absorption path is surprisingly constant around 3.8 km. Other candidates for the observed offset are albedo or aerosol mismatches with respect to the lookup table values (Table 1). However our sensitivity tests which lead to the uncertainty bars shown in Fig. 7 point to impacts below 10 % uncertainty for most data points. The stability and size of the effect over a large number of flight situations and cloud geometries and the consistency with the expectation that non-vertical cloud surfaces would have just this effect point to the 3-D geometry as the reason for this result. Nonetheless, variation between cloud scenes (different colours) could also be due to albedo or aerosol variations. The method presented uses a constant offset for compensation. For the given ACRIDICON-CHUVA cases' typical observation perspectives and hence the dominant cloud surface orientation observed, this is found through comparison to stereo values. In the future, this limitation might be overcome by a method using “vertical cloud wall” results as presented as first guess, allowing for a first approximate derivation of cloud surface orientation and using forward simulations for varying cloud tilt to iteratively improve results. The computational effort necessary for such an approach exceeds the resources available for this study. Alternatively, a simple calibration of the method as presented could also be reached using a small set of selected 3-D simulations. A small number of a few hundred test results (as in our comparison to stereo points) at a low Monte Carlo accuracy – a high noise level – would be sufficient to characterize a single typical offset value. It could be provided at a limited computation effort.
In Fig. 8 an example of the 3-D cloud geometry impact on the method is shown for a synthetic cloud observation. For this demonstration an available mid-latitude cumulus case was used. Of course this scene can not be expected to be fully comparable to the tropical cumulus congestus cases during the ACRIDICON-CHUVA campaign. Still it illustrates this possibility and at the same time displays the impact of 3-D cloud geometry at the observed order of magnitude once more. The case is taken from an ICON-LEM (ICOsyhedral Nonhydrostatic large eddy model) run for Germany with a spatial resolution of 165 m × 165 m × 165 m with a two-moment microphysics model package (Heinze et al., 2017). True cloud distances shown in Fig. 8b range between 8 and about 20 km. The application of the oxygen-A-band retrieval to these simulations results in deviations of a few hundred metres to a few kilometres from the true distance. As already seen in the comparison of stereo and oxygen-A-band values, for the synthetic test the deviation is negative almost everywhere too (distance derived from the oxygen A band is too small). For this case the mean deviation over the whole scene is 2.1 km. As all parameters in this synthetic test case are fixed to the values used in the lookup table of the method, the only remaining candidate source of deviation is the specific 3-D geometry of this cloud case. Here the central part of the cloud field systematically tilts away from the vertical, with values close to the vertical at the cloud lower edge and almost horizontal cloud top for the top line of analysed pixels.
In the future, consideration of such cloud surface orientation which caused systematic differences could be possible by including additional forward solutions for arbitrarily tilted cloud surfaces using the lookup table, with the help of far more extensive 3-D radiative transfer simulations and iterative approaches. The overall accuracy of oxygen-A-band-derived heights apart from this cloud geometry impact is comparable to the accuracy of a stereo-image-based approach for the application to aircraft observations. A clear advantage of the presented absorption method is that it is not limited to individual features of high image contrast (as the stereo method), but provides distance over large continuous areas (apart from cloud tops and shadows). It provides the cloud heights on the sensor coordinate grid, which facilitates evaluation of other information on the same grid.
Eventually a full integration of the stereo and absorption approach into one method might be a beneficial approach, as advantages of both methods could be combined. At cloud tops and horizontal edges where the oxygen absorption is strongly affected by 3-D cloud geometry effects, stereo methods can most easily provide information as image contrast is high. In cloud regions where geometry variation is small, it is impossible to identify points of high contrast for the stereo method, but oxygen absorption still provides reliable information.
The actual specific goals of the presented retrieval are the provision of vertical location for the determination of particle size and phase profiles of convective cloud fields from spectral cloud side remote sensing and the provision of cloud surface orientation for improved microphysics retrievals (Jäkel et al., 2017; Ewald et al., 2019). To this end, oxygen-A-band-based derivation of this height information proved to be a straightforward approach based on the same spectral data set.
All data sets used in this publication are provided upon request.
US developed and first tested the approach and sensitivities in a Master's thesis. Based on his work, TZ developed the presented method, carried out the presented radiative transfer simulations and data evaluation and wrote the manuscript. TK developed the software, providing easy access to specMACS data, and facilitated the automated evaluation of specMACS data. FE and TK were in charge of the measurements during the ACRIDICON-CHUVA campaign. EJ carried out the stereo analysis of the scenes used for the comparison of the two methods and revised the manuscript with a focus on stereo methods. EJ, TK, FE, BM and MW contributed to the final paper.
The authors declare that they have no conflict of interest.
This article is part of the special issue “The ACRIDICON-CHUVA campaign to study deep convective clouds and precipitation over Amazonia using the new German HALO research aircraft (ACP/AMT inter-journal SI)”. It is not associated with a conference.
The ACRIDICON-CHUVA campaign was supported by the Max Planck Society (MPG),
the German Science Foundation (DFG Priority Program SPP 1294), the German
Aerospace Center (DLR), the FAPESP (Sao Paulo Research Foundation) grants
2009/15235-8 and 2013/05014-0 and a wide range of other institutional
partners. It was carried out in collaboration with the USA–Brazilian
atmosphere research project GoAmazon2014/5, including numerous institutional
partners. We would like to thank Instituto Nacional de Pesquisas da Amazonia
(INPA) for the local logistic help prior to, during and after the campaign.
Thanks are also given to the Brazilian Space Agency (AEB: Agencia Espacial
Brasileira), responsible for the program of cooperation (CNPq license 00254/2013-9 of the
Brazilian National Council for Scientific and Technological Development). The
entire ACRIDICON-CHUVA project team is gratefully acknowledged for
collaboration and support. We thank Fabian Jakub for providing the ICON-LEM data used in the discussion section.
Florian Ewald was supported by the German Research Foundation (DFG) under
grant number MA 2548/9-1. Tobias Kölling was supported by the German
Research Foundation (DFG) under grant number Zi
1132/3-1.
Edited by: Alexander Kokhanovsky
Reviewed by: three anonymous referees
Anderson, G., Clough, S., Kneizys, F., Chetwynd, J., and Shettle, E.: AFGL atmospheric constituent profiles, Tech. Rep. AFGL-TR-86-0110, AirForce Geophys. Lab., 1986. a
Beekmans, C., Schneider, J., Läbe, T., Lennefer, M., Stachniss, C., and Simmer, C.: Cloud photogrammetry with dense stereo for fisheye cameras, Atmos. Chem. Phys., 16, 14231–14248, https://doi.org/10.5194/acp-16-14231-2016, 2016. a, b
Chahine, M. T.: Remote Sounding of Cloudy Atmospheres. I. The Single Cloud Layer, J. Atmos. Sci., 31, 233–243, https://doi.org/10.1175/1520-0469(1974)031<0233:RSOCAI>2.0.CO;2, 1974. a
Emde, C., Buras-Schnell, R., Kylling, A., Mayer, B., Gasteiger, J., Hamann, U., Kylling, J., Richter, B., Pause, C., Dowling, T., and Bugliaro, L.: The libRadtran software package for radiative transfer calculations (version 2.0.1), Geosci. Model Dev., 9, 1647–1672, https://doi.org/10.5194/gmd-9-1647-2016, 2016. a
Ewald, F., Winkler, C., and Zinner, T.: Reconstruction of cloud geometry using a scanning cloud radar, Atmos. Meas. Tech., 8, 2491–2508, https://doi.org/10.5194/amt-8-2491-2015, 2015. a, b
Ewald, F., Kölling, T., Baumgartner, A., Zinner, T., and Mayer, B.: Design and characterization of specMACS, a multipurpose hyperspectral cloud and sky imager, Atmos. Meas. Tech., 9, 2015–2042, https://doi.org/10.5194/amt-9-2015-2016, 2016. a, b, c, d, e
Ewald, F., Zinner, T., Kölling, T., and Mayer, B.: Remote sensing of cloud droplet radius profiles using solar reflectance from cloud sides – Part 1: Retrieval development and characterization, Atmos. Meas. Tech., 12, 1183–1206, https://doi.org/10.5194/amt-12-1183-2019, 2019. a, b, c, d, e
Fischer, J. and Grassl, H.: Detection of Cloud-Top Height from Backscattered Radiances within the Oxygen A Band. Part 1: Theoretical Study, J. Appl. Meteorol., 30, 1245–1259, https://doi.org/10.1175/1520-0450(1991)030<1245:DOCTHF>2.0.CO;2, 1991. a, b, c, d, e
Fischer, J., Cordes, W., Schmitz-Peiffer, A., Renger, W., and Mörl, P.: Detection of Cloud-Top Height from Backscattered Radiances within the Oxygen A Band. Part 2: Measurements, J. Appl. Meteorol., 30, 1260–1267, https://doi.org/10.1175/1520-0450(1991)030<1260:DOCTHF>2.0.CO;2, 1991. a
Gasteiger, J., Emde, C., Mayer, B., Buras, R., Buehler, S., and Lemke, O.: Representative wavelengths absorption parameterization applied to satellite channels and spectral bands, J. Quant. Spectrosc. Ra., 148, 99–115, https://doi.org/10.1016/j.jqsrt.2014.06.024, 2014. a
Grosvenor, D. P. and Wood, R.: The effect of solar zenith angle on MODIS cloud optical and microphysical retrievals within marine liquid water clouds, Atmos. Chem. Phys., 14, 7291–7321, https://doi.org/10.5194/acp-14-7291-2014, 2014. a
Hasler, A. F.: Stereographic Observations from Geosynchronous Satellites: An Important New Tool for the Atmospheric Sciences, B. Am. Meteorol. Soc., 62, 194–212, https://doi.org/10.1175/1520-0477(1981)062<0194:SOFGSA>2.0.CO;2, 1981. a
Heinze, R., Dipankar, A., Henken, C. C., Moseley, C., Sourdeval, O., Trömel, S., Xie, X., Adamidis, P., Ament, F., Baars, H., Barthlott, C., Behrendt, A., Blahak, U., Bley, S., Brdar, S., Brueck, M., Crewell, S., Deneke, H., Di Girolamo, P., Evaristo, R., Fischer, J., Frank, C., Friederichs, P., Göcke, T., Gorges, K., Hande, L., Hanke, M., Hansen, A., Hege, H.-C., Hoose, C., Jahns, T., Kalthoff, N., Klocke, D., Kneifel, S., Knippertz, P., Kuhn, A., van Laar, T., Macke, A., Maurer, V., Mayer, B., Meyer, C. I., Muppa, S. K., Neggers, R. A. J., Orlandi, E., Pantillon, F., Pospichal, B., Röber, N., Scheck, L., Seifert, A., Seifert, P., Senf, F., Siligam, P., Simmer, C., Steinke, S., Stevens, B., Wapler, K., Weniger, M., Wulfmeyer, V., Zängl, G., Zhang, D., and Quaas, J.: Large-eddy simulations over Germany using ICON: a comprehensive evaluation, Q. J. Roy. Meteor. Soc., 143, 69–100, https://doi.org/10.1002/qj.2947, 2017. a
Jäkel, E., Wendisch, M., Krisna, T. C., Ewald, F., Kölling, T., Jurkat, T., Voigt, C., Cecchini, M. A., Machado, L. A. T., Afchine, A., Costa, A., Krämer, M., Andreae, M. O., Pöschl, U., Rosenfeld, D., and Yuan, T.: Vertical distribution of the particle phase in tropical deep convective clouds as derived from cloud-side reflected solar radiation measurements, Atmos. Chem. Phys., 17, 9049–9066, https://doi.org/10.5194/acp-17-9049-2017, 2017. a, b, c, d, e, f, g, h, i, j, k, l, m, n, o
Krautstrunk, M. and Giez, A.: The Transition From FALCON to HALO Era Airborne Atmospheric Research, in: Atmospheric Physics, edited by: Schumann, U., Springer, Berlin, Heidelberg, 2012. a, b
Liang, L. and Di Girolamo, L.: A global analysis on the view-angle dependence of plane-parallel oceanic liquid water cloud optical thickness using data synergy from MISR and MODIS, J. Geophys. Res., 118, 2389–2403, 2013. a
Martins, J. V., Marshak, A., Remer, L. A., Rosenfeld, D., Kaufman, Y. J., Fernandez-Borda, R., Koren, I., Correia, A. L., Zubko, V., and Artaxo, P.: Remote sensing the vertical profile of cloud droplet effective radius, thermodynamic phase, and temperature, Atmos. Chem. Phys., 11, 9485–9501, https://doi.org/10.5194/acp-11-9485-2011, 2011. a, b
Mayer, B. and Kylling, A.: Technical note: The libRadtran software package for radiative transfer calculations – description and examples of use, Atmos. Chem. Phys., 5, 1855–1877, https://doi.org/10.5194/acp-5-1855-2005, 2005. a
Mayer, B., Faure, F., Bugliaro, L., Zinner, T., and Buras, R.: Realistic simulations of EarthCare observations, in: Proceedings of the 2nd ESA EarthCARE Workshop, Kyoto, Japan, 10–12 June 2009. a
Menzel, W. P., Frey, R. A., Zhang, H., Wylie, D. P., Moeller, C. C., Holz, R. E., Maddux, B., Baum, B. A., Strabala, K. I., and Gumley, L. E.: MODIS Global Cloud-Top Pressure and Amount Estimation: Algorithm Description and Results, J. Appl. Meteorol. Clim., 47, 1175–1198, https://doi.org/10.1175/2007JAMC1705.1, 2008. a
Merlin, G., Riedi, J., Labonnote, L. C., Cornet, C., Davis, A. B., Dubuisson, P., Desmons, M., Ferlay, N., and Parol, F.: Cloud information content analysis of multi-angular measurements in the oxygen A-band: application to 3MI and MSPI, Atmos. Meas. Tech., 9, 4977–4995, https://doi.org/10.5194/amt-9-4977-2016, 2016. a
Muller, J.-P., Denis, M.-A., Dundas, R., Mitchell, K. L. M., Naud, C. M., and Mannstein, H.: Stereo cloud-top height and amount retrieval from ATSR2, Int. J. Remote Sens., 28, 1921–1938, 2007. a
Öktem, R., Prabhat, Lee, J., Thomas, A., Zuidema, P., and Romps, D. M.: Stereophotogrammetry of Oceanic Clouds, J. Atmos. Ocean. Tech., 31, 1482–1501, 2014. a
Seiz, G., Shields, J., Feister, U., Baltsavias, E., and Grün, A.: Cloud mapping with ground-based photogrammetric cameras, International J. Remote Sens., 28, 2001–2032, 2007. a, b
Smith, W. L. and Platt, C. M. R.: Comparison of Satellite-Deduced Cloud Heights with Indications from Radiosonde and Ground-Based Laser Measurements, J. Appl. Meteorol., 17, 1796–1802, https://doi.org/10.1175/1520-0450(1978)017<1796:COSDCH>2.0.CO;2, 1978. a
Vant-Hull, B., Marshak, A., Remer, L. A., and Li, Z.: The effects of scattering angle and cumulus cloud geometry on satellite retrievals of cloud droplet effective radius, IEEE T. Geosci. Remote, 45, 1039–1045, 2007. a
Varnai, T. and Marshak, A.: Observations of three-dimensional radiative effects that influence MODIS cloud optical thickness retrievals, J. Atmos. Sci., 59, 1607–1618, 2002. a
Varnai, T. and Marshak, A.: View angle dependence of cloud optical thicknesses retrieved by Moderate Resolution Imaging Spectroradiometer (MODIS), J. Geophys. Res., 112, D06203, https://doi.org/10.1029/2005JD006912, 2007. a
Wendisch, M., Pöschl, U., Andreae, M. O., Machado, L. A. T., Albrecht, R., Schlager, H., Rosenfeld, D., Martin, S. T., Abdelmonem, A., Afchine, A., Araùjo, A. C., Artaxo, P., Aufmhoff, H., Barbosa, H. M. J., Borrmann, S., Braga, R., Buchholz, B., Cecchini, M. A., Costa, A., Curtius, J., Dollner, M., Dorf, M., Dreiling, V., Ebert, V., Ehrlich, A., Ewald, F., Fisch, G., Fix, A., Frank, F., Fütterer, D., Heckl, C., Heidelberg, F., Hüneke, T., Jäkel, E., Järvinen, E., Jurkat, T., Kanter, S., Kästner, U., Kenntner, M., Kesselmeier, J., Klimach, T., Knecht, M., Kohl, R., Kölling, T., Krämer, M., Krüger, M., Krisna, T. C., Lavric, J. V., Longo, K., Mahnke, C., Manzi, A. O., Mayer, B., Mertes, S., Minikin, A., Molleker, S., Münch, S., Nillius, B., Pfeilsticker, K., Pöhlker, C., Roiger, A., Rose, D., Rosenow, D., Sauer, D., Schnaiter, M., Schneider, J., Schulz, C., de Souza, R. A. F., Spanu, A., Stock, P., Vila, D., Voigt, C., Walser, A., Walter, D., Weigel, R., Weinzierl, B., Werner, F., Yamasoe, M. A., Ziereis, H., Zinner, T., and Zöger, M.: ACRIDICON–CHUVA Campaign: Studying Tropical Deep Convective Clouds and Precipitation over Amazonia Using the New German Research Aircraft HALO, B. Am. Meteorol. Soc., 97, 1885–1908, https://doi.org/10.1175/BAMS-D-14-00255.1, 2016. a, b
Wu, M.-L. C.: Remote Sensing of Cloud-Top Pressure Using Reflected Solar Radiation in the Oxygen A-Band, J. Clim. Appl. Meteorol., 24, 539–546, https://doi.org/10.1175/1520-0450(1985)024<0539:RSOCTP>2.0.CO;2, 1985. a, b, c, d
Yamamoto, G. and Wark, D. Q.: Discussion of the letter by R. A. Hanel, Determination of cloud altitude from a satellite, J. Geophys. Res., 66, 3596–3596, https://doi.org/10.1029/JZ066i010p03596, 1961. a
Yang, Y., Marshak, A., Mao, J., Lyapustin, A., and Herman, J.: A method of retrieving cloud top height and cloud geometrical thickness with oxygen A and B bands for the Deep Space Climate Observatory (DSCOVR) mission: Radiative transfer simulations, J. Quant. Spectrosc. Ra., 122, 141–149, https://doi.org/10.1016/j.jqsrt.2012.09.017, 2013. a
Zinner, T. and Mayer, B.: Remote sensing of stratocumulus clouds: Uncertainties and biases due to inhomogeneity, J. Geophys. Res., 111, D14209, https://doi.org/10.1029/2005JD006955, 2006. a
Zinner, T., Mayer, B., and Schröder, M.: Determination of three-dimensional cloud structures from high-resolution radiance data, J. Geophys. Res., 111, D08204, https://doi.org/10.1029/2005JD006062, 2006. a, b
Zinner, T., Marshak, A., Lang, S., Martins, J. V., and Mayer, B.: Remote sensing of cloud sides of deep convection: towards a three-dimensional retrieval of cloud particle size profiles, Atmos. Chem. Phys., 8, 4741–4757, https://doi.org/10.5194/acp-8-4741-2008, 2008. a