the Creative Commons Attribution 4.0 License.
the Creative Commons Attribution 4.0 License.
 | 27 Feb 2019
A broadband cavity-enhanced spectrometer for atmospheric trace gas measurements and Rayleigh scattering cross sections in the cyan region (470–540 nm)
Nick Jordan
Connie Z. Ye
Satyaki Ghosh
Rebecca A. Washenfelder
Steven S. Brown
An incoherent broadband cavity-enhanced absorption spectroscopy (IBBCEAS) instrument for quantification of atmospheric trace gases that absorb in the cyan region of the electromagnetic spectrum (470 to 540 nm), including NO2 and I2, is described. The instrument uses a light-emitting diode coupled to a 1 m optical cavity consisting of a pair of mirrors in stable resonator configuration. Transmitted light is monitored using a grating spectrometer and charge-coupled device array detector. The average mirror reflectivity was determined from the N2∕He and Ar∕He ratios of scattering coefficients and was ∼99.98 % at its maximum, yielding an effective optical path length of 6.3 km. Cross sections of N2, O2, air, Ar, CO2, and CH4 scattering and of O4 absorption were measured and agree with literature values within the measurement uncertainty. Trace gas mixing ratios were retrieved using the spectral fitting software DOASIS (DOAS intelligent system) from 480 to 535 nm. Under laboratory conditions, the 60 s, 1σ measurement precisions were ±124 and ±44 pptv for NO2 and I2, respectively. The IBBCEAS instrument sampled ambient air in Ucluelet, BC, Canada, in July 2015. IBBCEAS retrievals agreed with independent measurements of NO2 by blue diode laser cavity ring-down spectroscopy (r2=0.975), but ambient I2 concentrations were below the detection limit.
- Article
(5632 KB) - Full-text XML
-
Supplement
(2303 KB) - BibTeX
- EndNote


Cavity-enhanced absorption spectroscopy (CEAS) has emerged in recent years as a sensitive technique for direct measurement of atmospheric trace gases (Fiedler et al., 2003; Gherman et al., 2008; Vaughan et al., 2008; Washenfelder et al., 2008; Schuster et al., 2009; Thalman and Volkamer, 2010; Hoch et al., 2014) and of aerosol optical extinction (Thalman and Volkamer, 2010; Bluvshtein et al., 2012; Washenfelder et al., 2013). Similar to other cavity-enhanced techniques (Gagliardi and Loock, 2014), CEAS owes its high sensitivity to highly reflective mirrors (reflectivity, R > 99.9 %), which yield long effective absorption path lengths. In CEAS, light generated from a high-intensity broadband light source (e.g., a Xe arc lamp) is transmitted through an optical cavity set-up in a stable resonator configuration. The output spectrum is integrated yielding extinction spectra from which mixing ratios are retrieved using known absorption spectra and knowledge of the mirror reflectivity and effective optical absorption path (Meinen et al., 2010). To date, CEAS instruments have been used to quantify mixing ratios of many atmospherically important trace gases, including nitrogen dioxide (NO2) (Langridge et al., 2008; Gherman et al., 2008; Triki et al., 2008; Thalman and Volkamer, 2010; Wu et al., 2014; Min et al., 2016; Varma et al., 2009), the nitrate radical (NO3) (Langridge et al., 2008; Schuster et al., 2009; Venables et al., 2006; Varma et al., 2009), iodine (I2) (Ball et al., 2010; Dixneuf et al., 2009; Bahrini et al., 2018), the iodine oxides IO and OIO (Vaughan et al., 2008), glyoxal (HCOHCO) (Washenfelder et al., 2008; Thalman and Volkamer, 2010; Coburn et al., 2014; Min et al., 2016), methyl glyoxal (CH3COCHO) (Thalman and Volkamer, 2010; Thalman et al., 2015; Min et al., 2016), molecular bromine (Br2), bromine monoxide (BrO) (Chen and Venables, 2011; Hoch et al., 2014), formaldehyde (Washenfelder et al., 2016), and nitrous acid (HONO) (Gherman et al., 2008; Wu et al., 2014; Min et al., 2016).
The accuracy of retrievals depends on knowledge of relevant absorption and scattering (i.e., Rayleigh) cross sections (which both contribute to the optical extinction) and of the mirror reflectivity. Because of its high sensitivity, CEAS in turn has been utilized to measure these parameters. For example, Axson et al. (2011) and Kahan et al. (2012) recently reported the absorption cross sections of O3 and H2O2, and Thalman and Volkamer (2010) reported scattering cross sections of N2, O2, Ar, and air for several wavelength intervals (345–390, 435–490, 515–545, 560–600, and 600–700 nm).
In spite of the large number of CEAS instruments that have been constructed, the mid-visible region has received relatively little attention to date, other than the pioneering study by Vaughan et al. (2008), even though the absorption maxima of several key atmospheric traces gases, such as NO2 and the iodine species I2, IO, and OIO, are located in this wavelength interval (Fig. 1). The study of iodine chemistry has been of considerable interest due to the potential effects on the formation of new particles and atmospheric oxidizing capacity through, for example, catalytic destruction of O3, altering the partitioning of NOx () and HOx (), or the activation of chlorine and bromine from sea salt aerosol in the marine and polar boundary layer, near salt lakes and volcanoes, and in the stratosphere (Saiz-Lopez et al., 2012). Prior laboratory measurements by Vaughan et al. (2008 used a 150 W Xenon arc lamp; such light sources tend to flicker, i.e., exhibit intensity fluctuations, which add noise to the absorption spectrum. For this and other reasons (such as compactness and heat generation), light-emitting diodes (LEDs) are now commonly used to generate broadband radiation (Washenfelder et al., 2008; Min et al., 2016).
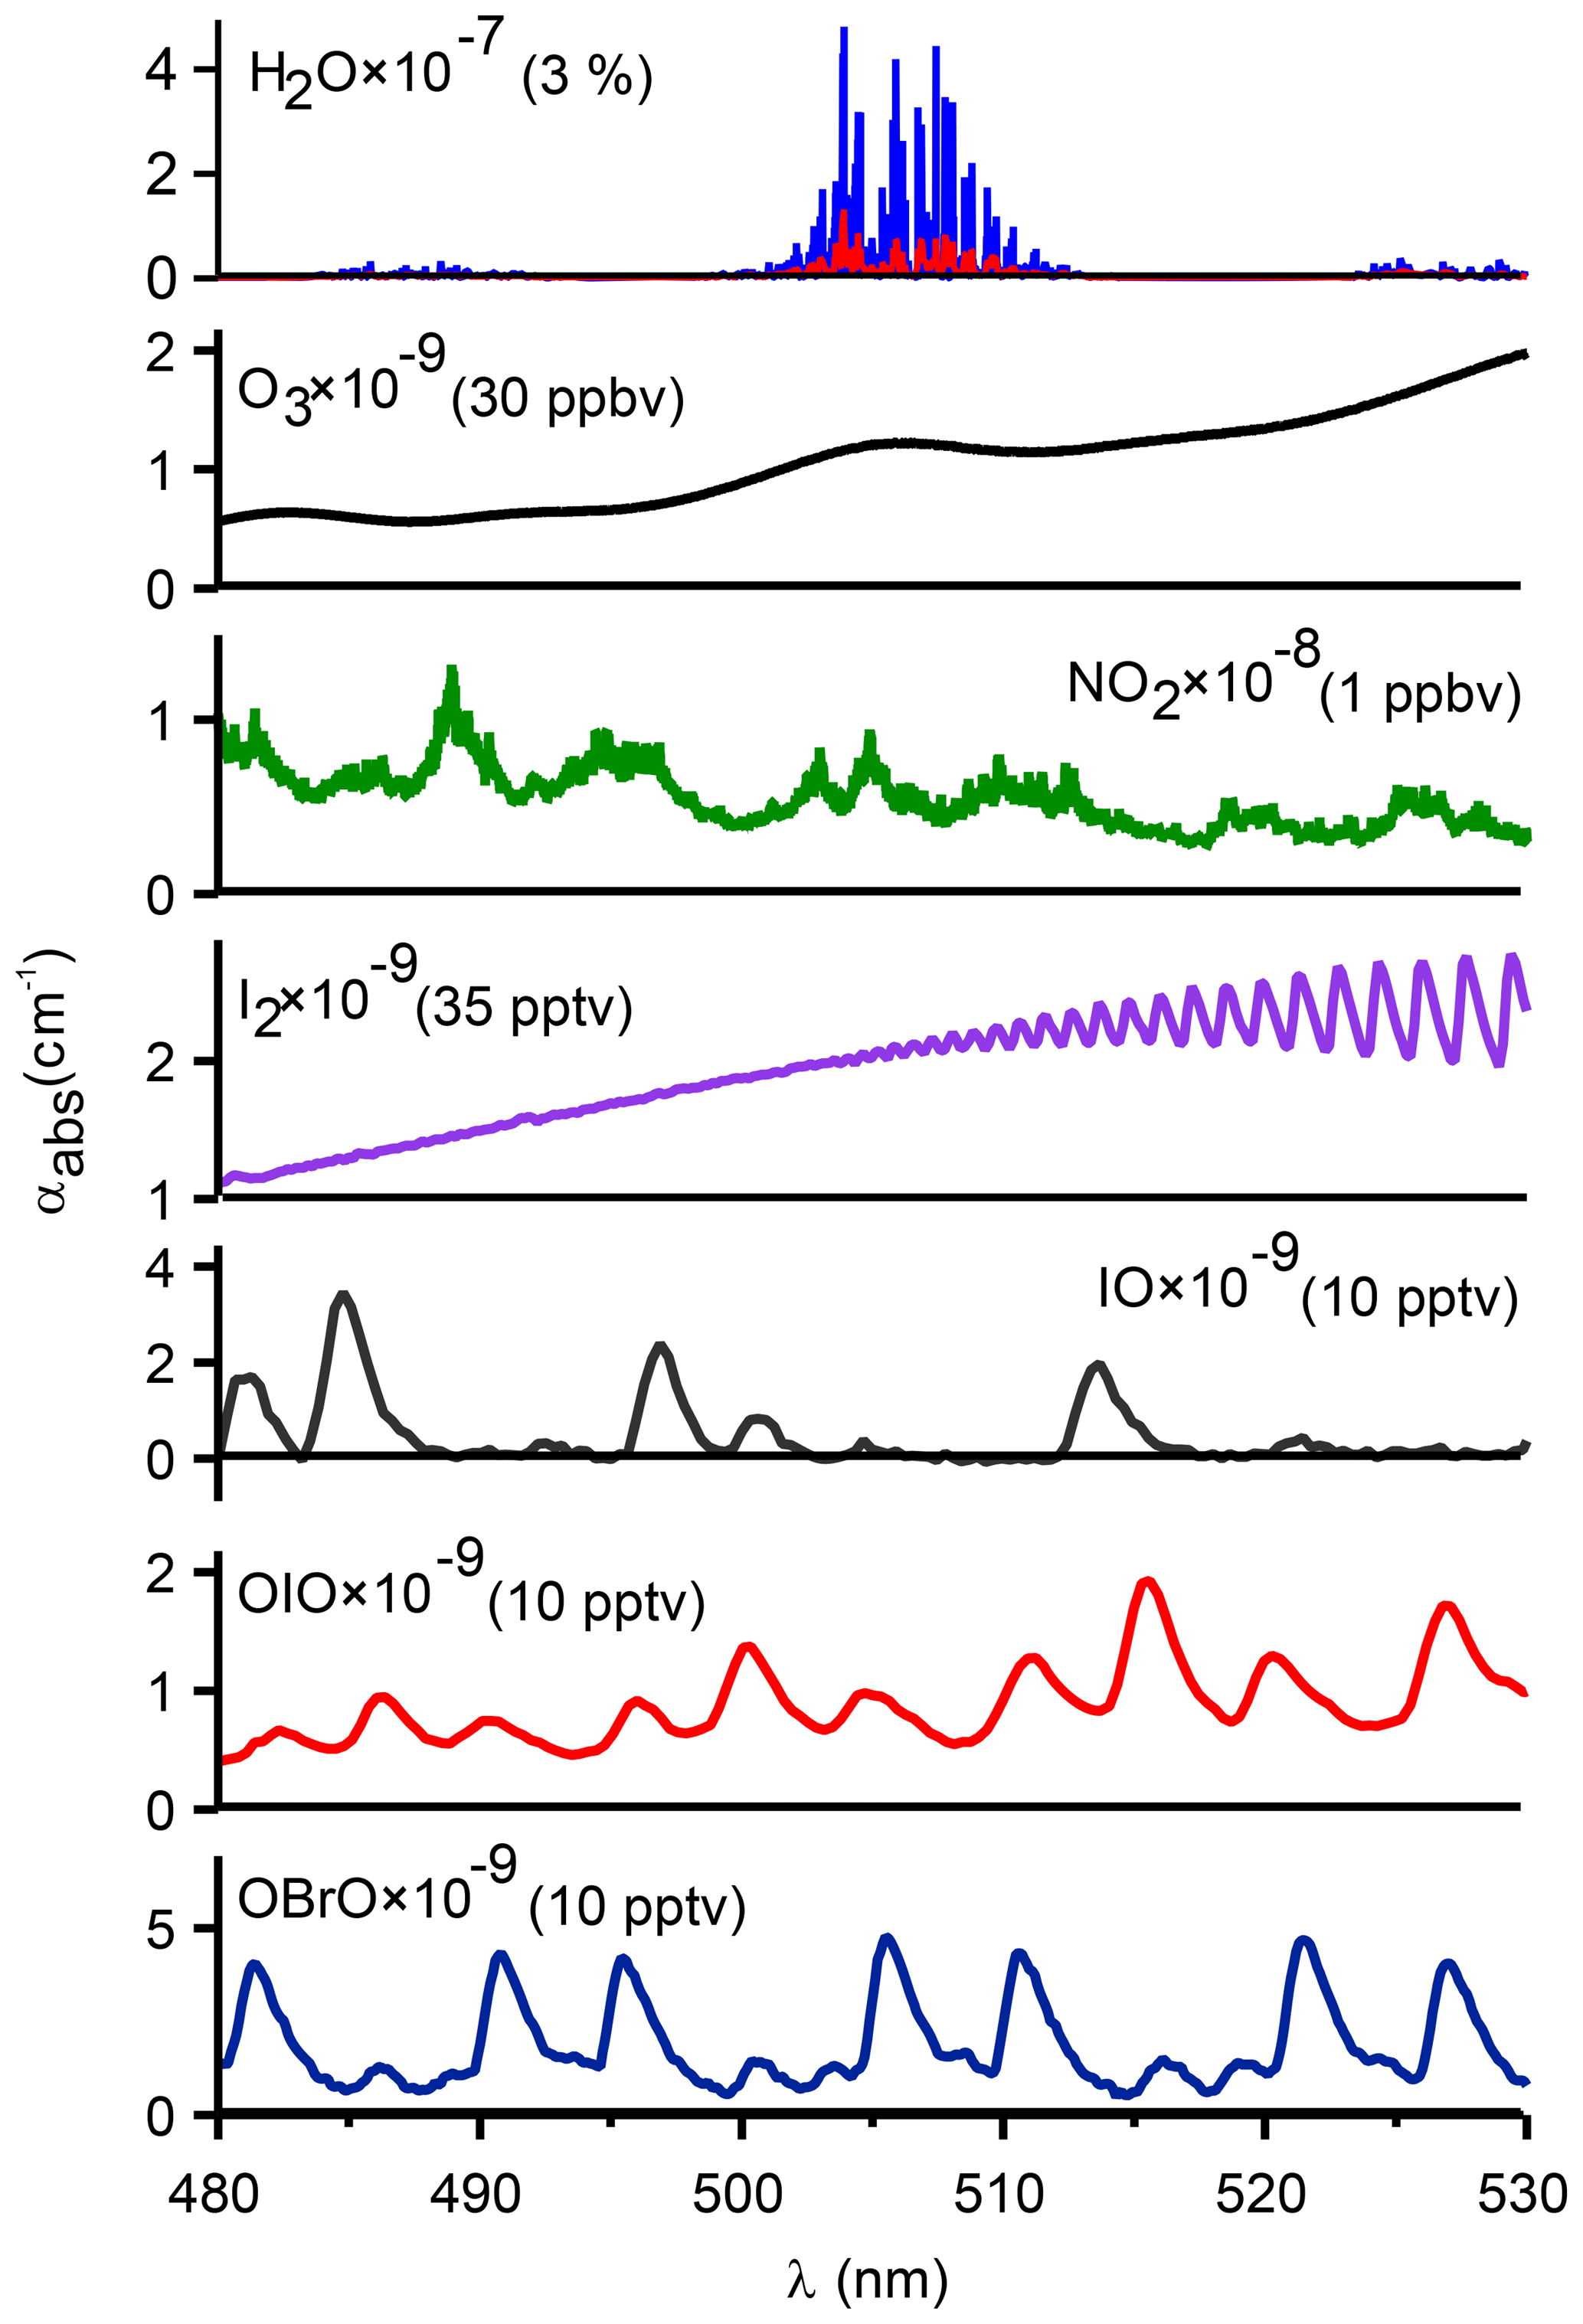
Figure 1Absorption coefficients for atmospheric absorbers in the cyan region at typical tropospheric mixing ratios (stated in brackets after each species). Absorption cross sections were obtained from Keller-Rudek et al. (2013) and are based on the following: H2O (Coheur et al., 2002), O3 (Burkholder and Talukdar, 1994), NO2 (Voigt et al., 2002), I2 (Spietz et al., 2006), IO and OIO (Spietz et al., 2005), and OBrO (Knight et al., 2000). The literature cross sections for H2O (shown in blue) were convolved with the resolution of the IBBCEAS (shown in red). The absorption cross section of O4 is shown in Fig. S4 in the Supplement.
In this paper, we describe an LED-powered incoherent broadband cavity-enhanced absorption spectroscopy (IBBCEAS) instrument operated in the cyan region of the electromagnetic spectrum. We report laboratory measurements of scattering cross sections for N2, O2, Ar, CO2, CH4, and air from 480 to 535 nm and demonstrate detection of NO2 and I2 in laboratory-generated air. The IBBCEAS instrument was operated during the Ozone-depleting Reactions in a Coastal Atmosphere (ORCA) field campaign, conducted on 8–31 July 2015 at the Amphitrite Point Observatory (APO) in Ucluelet on the west coast of Vancouver Island, British Columbia, Canada (Tokarek et al., 2017). Kelp forests are present along this coastline (Watson and Estes, 2011), which are expected to emit I2 (Dixneuf et al., 2009; Nitschke et al., 2011, 2015). Mixing ratios of NO2 retrieved from the cyan IBBCEAS data are compared to those measured by a co-located blue diode laser cavity ring-down spectrometer. The potential of the instrument for quantification of iodine species in laboratory and field experiments is assessed.
2.1 Cavity-enhanced spectroscopy
The principle of broadband trace gas measurements by IBBCEAS has been described elsewhere (Fiedler et al., 2003; Washenfelder et al., 2008). Briefly, broadband radiation is continuously injected and trapped between a set of highly reflective mirrors, forming a stable resonant cavity. The integrated cavity output intensity represents the combined extinction by the mirrors and the intra-cavity medium. The absorption coefficient, αabs(λ), is given in terms of the transmission signal through the cavity (Washenfelder et al., 2008) by Eq. (1):
Here, RL (see Sect. 3.3) is the ratio of the cell length (d≈102 cm) divided by the length occupied by the sample (d0≈82 cm; Sect. 3.3), R(λ) is the average wavelength-dependent mirror reflectivity, d is the distance between the two reflective surfaces (i.e. the cavity length), αRay(λ) is the sum of all Rayleigh scattering sample constituents, I0(λ) is the intensity spectrum in the absence of absorbers in the cavity cell, and I(λ) is the intensity spectrum measured in the presence of absorbers. When measurements are carried out in variable pressure environments (e.g., aircraft altitude change), an additional term (ΔαRay(λ)) is added to Eq. (1) to account for pressure fluctuations (Min et al., 2016). If multiple absorbers are present in the cavity, the absorption coefficient becomes the sum of all species expressed as in Eq. (2) (Washenfelder et al., 2008).
Here, is the wavelength-, temperature-, and pressure-dependent absorption cross section, and Ni is the number density of the ith absorbing gas.
2.2 Determination of Rayleigh scattering cross sections
Cavity-enhanced spectroscopic techniques allow accurate and precise measurements of Rayleigh scattering cross sections of pure gases over broad wavelength regions (Naus and Ubachs, 2000; Sneep and Ubachs, 2005; Axson et al., 2011; Kahan et al., 2012; Thalman et al., 2014). If the mirror reflectivity R(λ) is known, the scattering cross section of any gas can be determined by measuring its extinction and that of a reference gas (Thalman et al., 2014), e.g., for CO2 and using He as a reference,
Here, αRay(λ) is the optical extinction (in cm−1) caused by the intra-cavity scattering medium. The scattering cross sections are then calculated through division by the number density of the gas (Ngas); i.e.,
Scattering cross sections can be predicted if the refractive index, n, of a gas is known (Naus and Ubachs, 2000; Sneep and Ubachs, 2005), hereafter referred to as an “n-based” cross section, σn:
Here, ν is the frequency in wavenumbers (cm−1), n(ν) is the frequency-dependent refractive index of the gas, and Fk is the King depolarization ratio, which describes the effect of molecular anisotropy (King, 1923).
3.1 Description of the IBBCEAS instrument
The IBBCEAS instrument consists of an LED light source, collimating optics, a high finesse optical cavity, focusing optics, specialized fibre bundle, and a spectrograph equipped with a charge-coupled device (CCD) camera (Fig. 2).
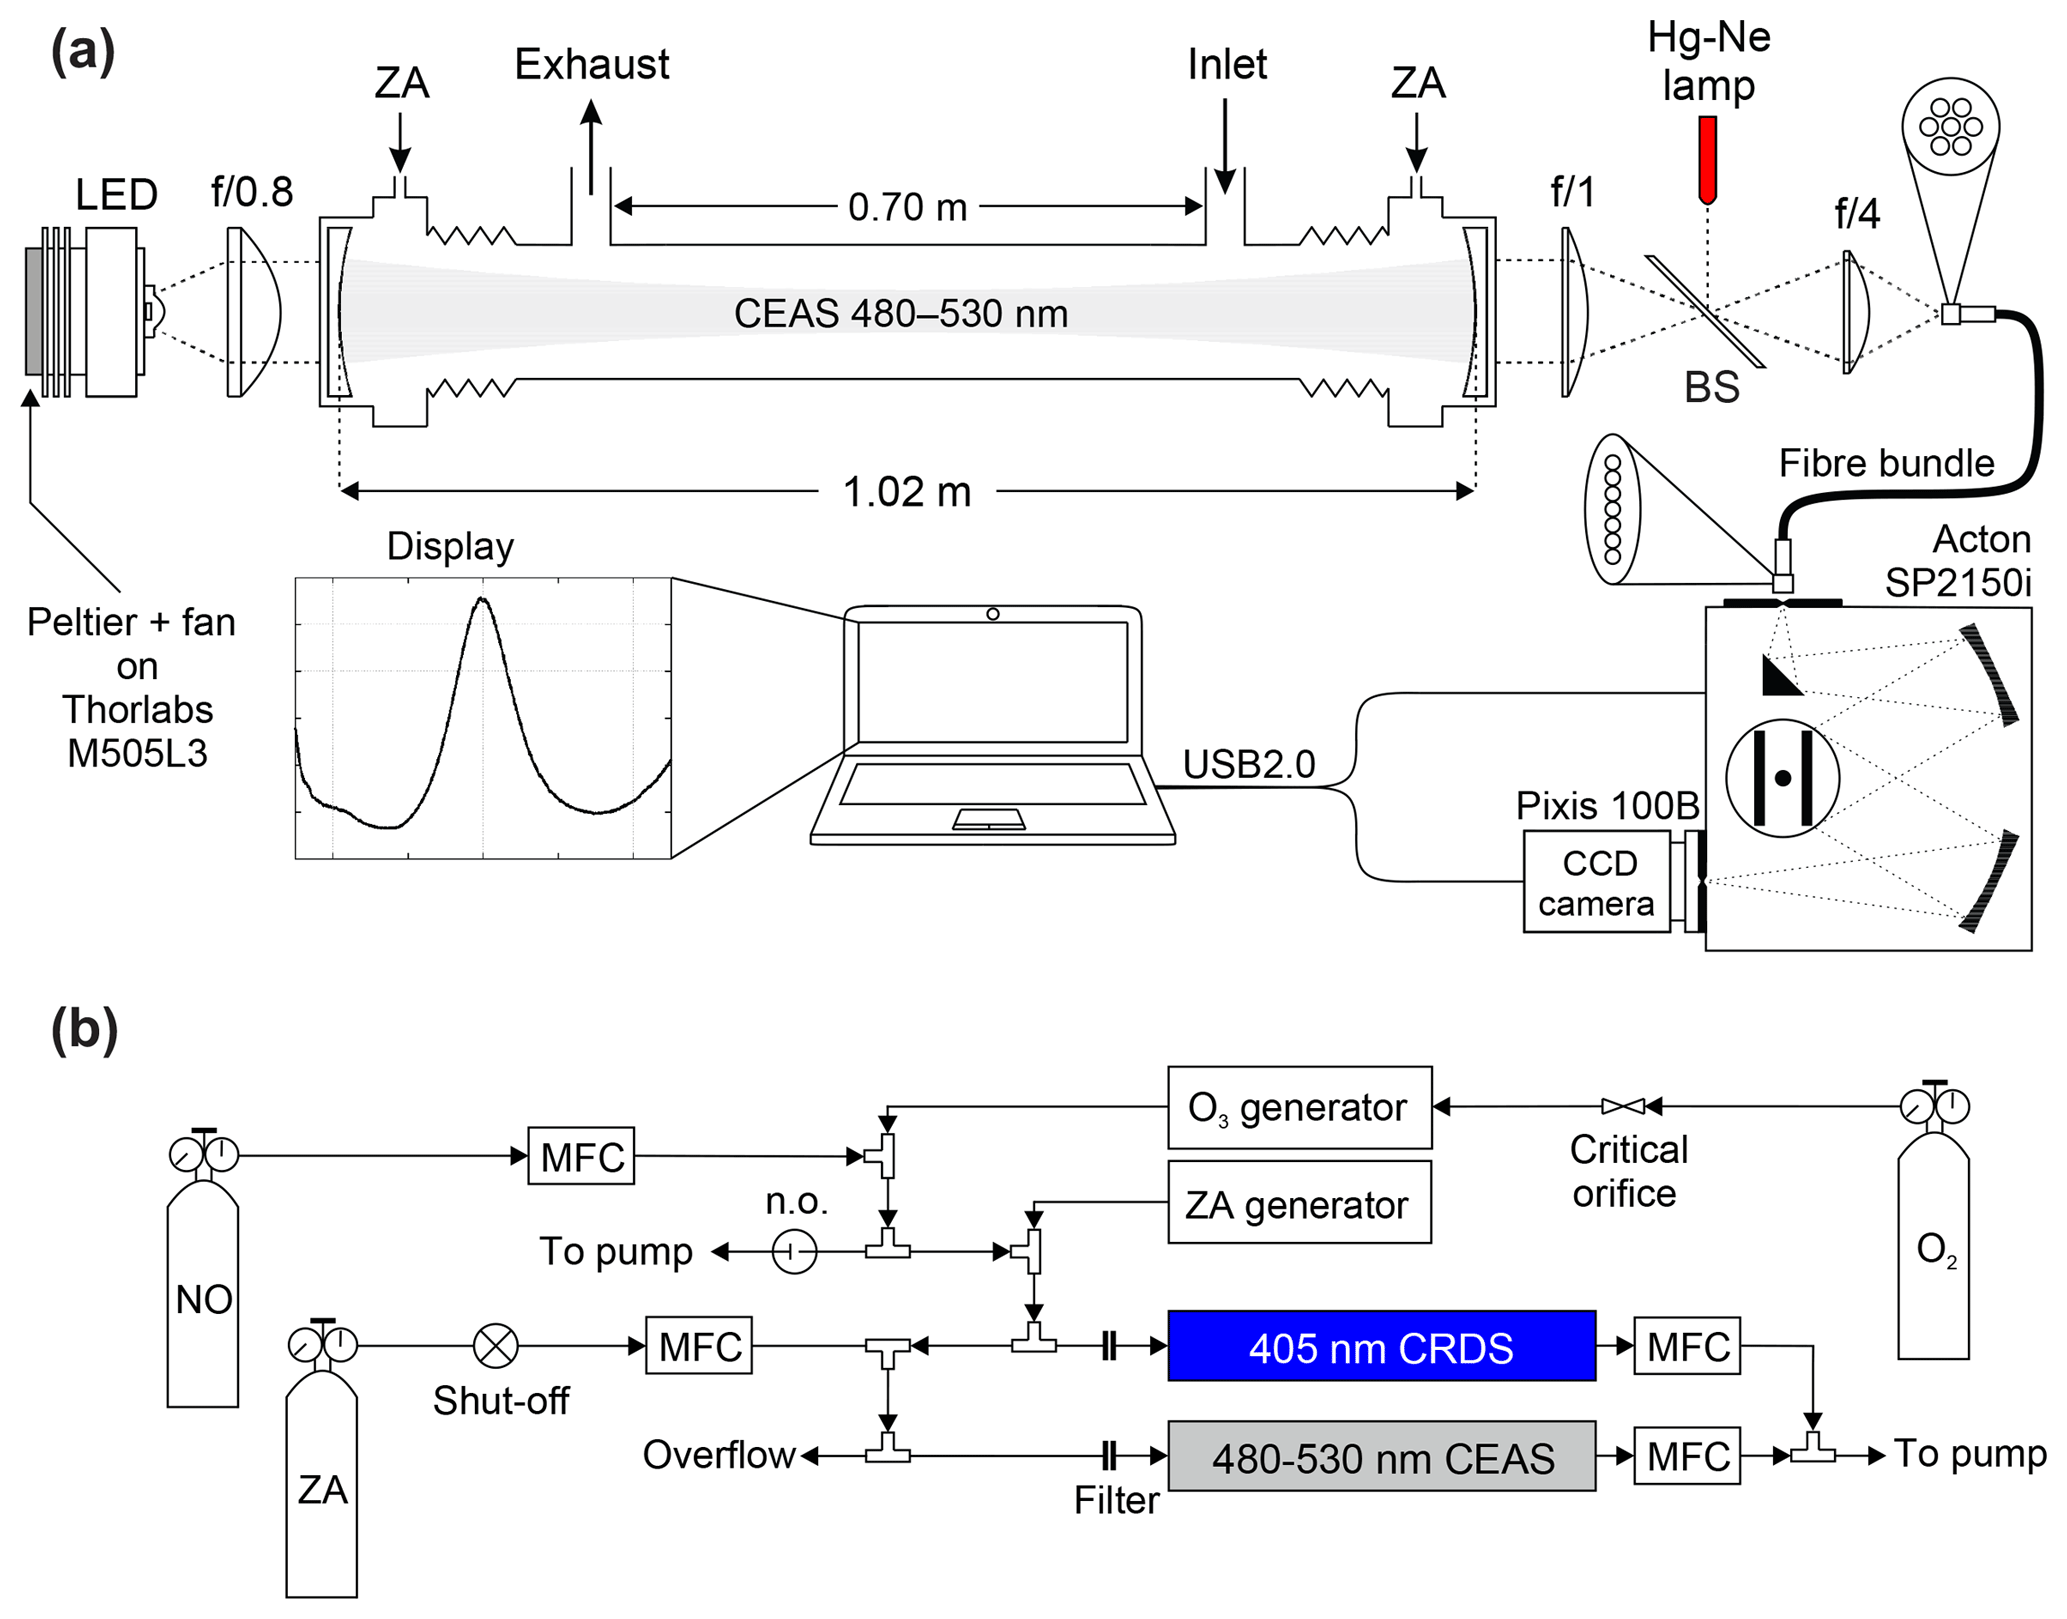
Figure 2(a) Set-up of the cyan IBBCEAS (not to scale). (b) Set-up of NO2 calibration gas delivery for instrument characterization experiments. Abbreviations: LED – light emitting diode, BS – quartz beam splitter, CCD – charge-coupled device, ZA – zero air, USB – universal serial bus, and MFC – mass flow controller.
The optical cavity consists of two dielectric-coated, plano-concave fused silica substrate mirrors (Advanced Thin Films, Boulder, CO, USA) with maximum reflectivity from 460 to 550 nm, 2.54 cm in diameter, 0.635 cm thickness, and 1 m radius of curvature. To span a broad wavelength range, the mirrors were coated with two highly reflective substrates, resulting in a double maximum in their reflectivity. The mirrors were mounted on both ends of a 102 cm long cell with a gas sampling region of ∼73 cm and housed in a custom-built mount equipped with purge gas ports. A flow of 50 sccm (standard cubic centimetres per minute) of ultrapure air (zero grade, Praxair) set using 50 µm critical orifices (Lenox Laser, Glen Arm, MD, USA) and a gas regulator back pressure of 138 kPa was directed to each mirror to protect the optical surfaces from contamination. The mirror mounts were attached to adjustable kinematic mounts (Newport U200-A, Irvine, CA, USA), each equipped with three set screws for mirror alignment. The gas sampling region was enclosed using 1.9 cm outer diameter (o.d.) and 1.59 cm inner diameter (i.d.) fluorinated ethylene propylene (FEP) Teflon™ tubing (Saint Gobain Plastics, Chemfluor series). The Teflon™ tube was held in place by a custom enclosure constructed from aluminium. Gases entered and exited the sampling region through 1.9 cm o.d. perfluoroalkoxy alkane (PFA) Teflon™ fittings (Entegris Fluid Handling, Billerica, MA, USA).
The LED (Thorlabs M505L3, Newton, NJ, USA; 400 mW nominal output power) output was collimated into the cavity by a single f/0.8 aspheric condenser lens (Thorlabs ACL2520U-A). The cavity output was collected and focused by a 2.5 cm diameter f/1 lens through a non-polarizing quartz beam splitter (Thorlabs BS025) onto a 0.5 cm (diameter) f/4 fibre adapter that couples the radiation into a 2 m long 0.22 numerical aperture (NA) fibre bundle (Thorlabs BFL200HS02). The beam splitter has 90 % transmission efficiency in the plane parallel to the cavity and 10 % in the orthogonal plane and was used to direct the emission lines of a Hg(Ne) spectral calibration lamp (Newport Oriel 6032) towards the detector for calibration of the spectrometer wavelength scale and line width. The fibre bundle consists of seven 200 µm optical fibres arranged with circular and linear configurations on the input and output, respectively. The fibre bundle output was oriented linearly along the spectrograph entrance slit to optimize coupling of the cavity output, similar to Min et al. (2016) and Washenfelder et al. (2016), and illuminated the full vertical dimension of the CCD. Spectra were acquired by a 150 cm focal length f/4 dual grating Czerny–Turner spectrograph (Princeton Instruments Acton SP2156, Trenton, NJ, USA), which back-illuminates a 16 bit 1340 pixel × 100 pixel CCD array (Princeton Instruments, PIXIS 100B), mounted at the focal plane of the spectrograph and Peltier-cooled to −80 ∘C to reduce thermal noise. The spectrograph was configured with a 1200 groove mm−1 grating blazed at 500 nm. This configuration along with the grating positioned at 500 nm central wavelength yielded spectral coverage from 446.9 to 563.2 nm, spanning a total of 1340 discrete wavelength points. The Acton SP2156 spectrograph shipped with a mechanical shutter, which was removed in lieu of software control of the integration time via Labview™ (National Instruments, Austin, TX, USA).
A fixed entrance slit width of 50 µm yielded approximately Gaussian profiles of the atomic Hg emission lines with a full-width at half maximum (FWHM) of (0.330±0.003) nm at 540.06 nm. Other spectral lines (e.g., 520.39 nm) showed slightly lower resolution of roughly (0.360±0.016) nm (Fig. S1). An integration time of 5–6 s saturated the CCD pixels 80 %–90 % of their well depth near 500 nm.
All mechanical and optical components were mounted on an optical breadboard (Thorlabs MB2448) bolted onto aluminium structural rails (80∕20, Columbia City, IN, USA). The net weight of the instrument including the breadboard and railing is < 90 kg, and the overall power consumption is below 300 W.
The IBBCEAS instrument samples air through a 47 mm diameter, circular, permeable polytetrafluoroethylene (PTFE) Teflon™ membrane filter with 1 µm pore size (Pall Teflon™ Series, Port Washington, NY, USA), housed in a PFA Teflon™ filter holder (Cole-Parmer R-06621-40), and through 0.635 cm o.d. and 0.476 cm FEP Teflon™ tubing. The sample flow was set using a mass flow controller (MFC; MKS Instruments 100 B series, 15 slpm (standard litres per minute) capacity, Andover, MA, USA) connected to a diaphragm pump (KNF Neuberger UNO26.1.2ATP, Trenton, NJ, USA). The sample flow was in the range 1.5–2.5 slpm, resulting in a sample residence time of 5.9–3.5 s. The gas temperature was measured using a K-type thermocouple (Omega, Laval, QC, Canada) attached to the aluminium sample cell enclosure. Pressure was measured using a pressure transducer (MKS Baratron capacitance manometer 722B) mounted on the exhaust portion of the IBBCEAS between the gas sample cell and the MFC.
The light source is a small footprint (1 mm × 1 mm) broadband LED (M505L3, Thorlabs) mounted on the end of a heat sink supplied by the manufacturer. We modified this assembly by mounting a Peltier module (CUI Inc. CP30238, Tualatin, Oregon, USA) between the LED and the heat sink for temperature control using a proportional–integral–derivative (PID) controller (Omega CNi3253) to 30.0±0.1 ∘C. If not stabilized, the LED output red-shifted ∼0.1 nm ∘C−1 temperature change. The LED was operated just below the maximum current of 1000 mA (3.3 W of electrical power).
The LED output spectrum was characterized by an asymmetric shape, an emission maximum at 507.5 nm, and a peak width of 22.5 nm FWHM, and was a good match with the mirror reflectivity curve (Fig. 3).
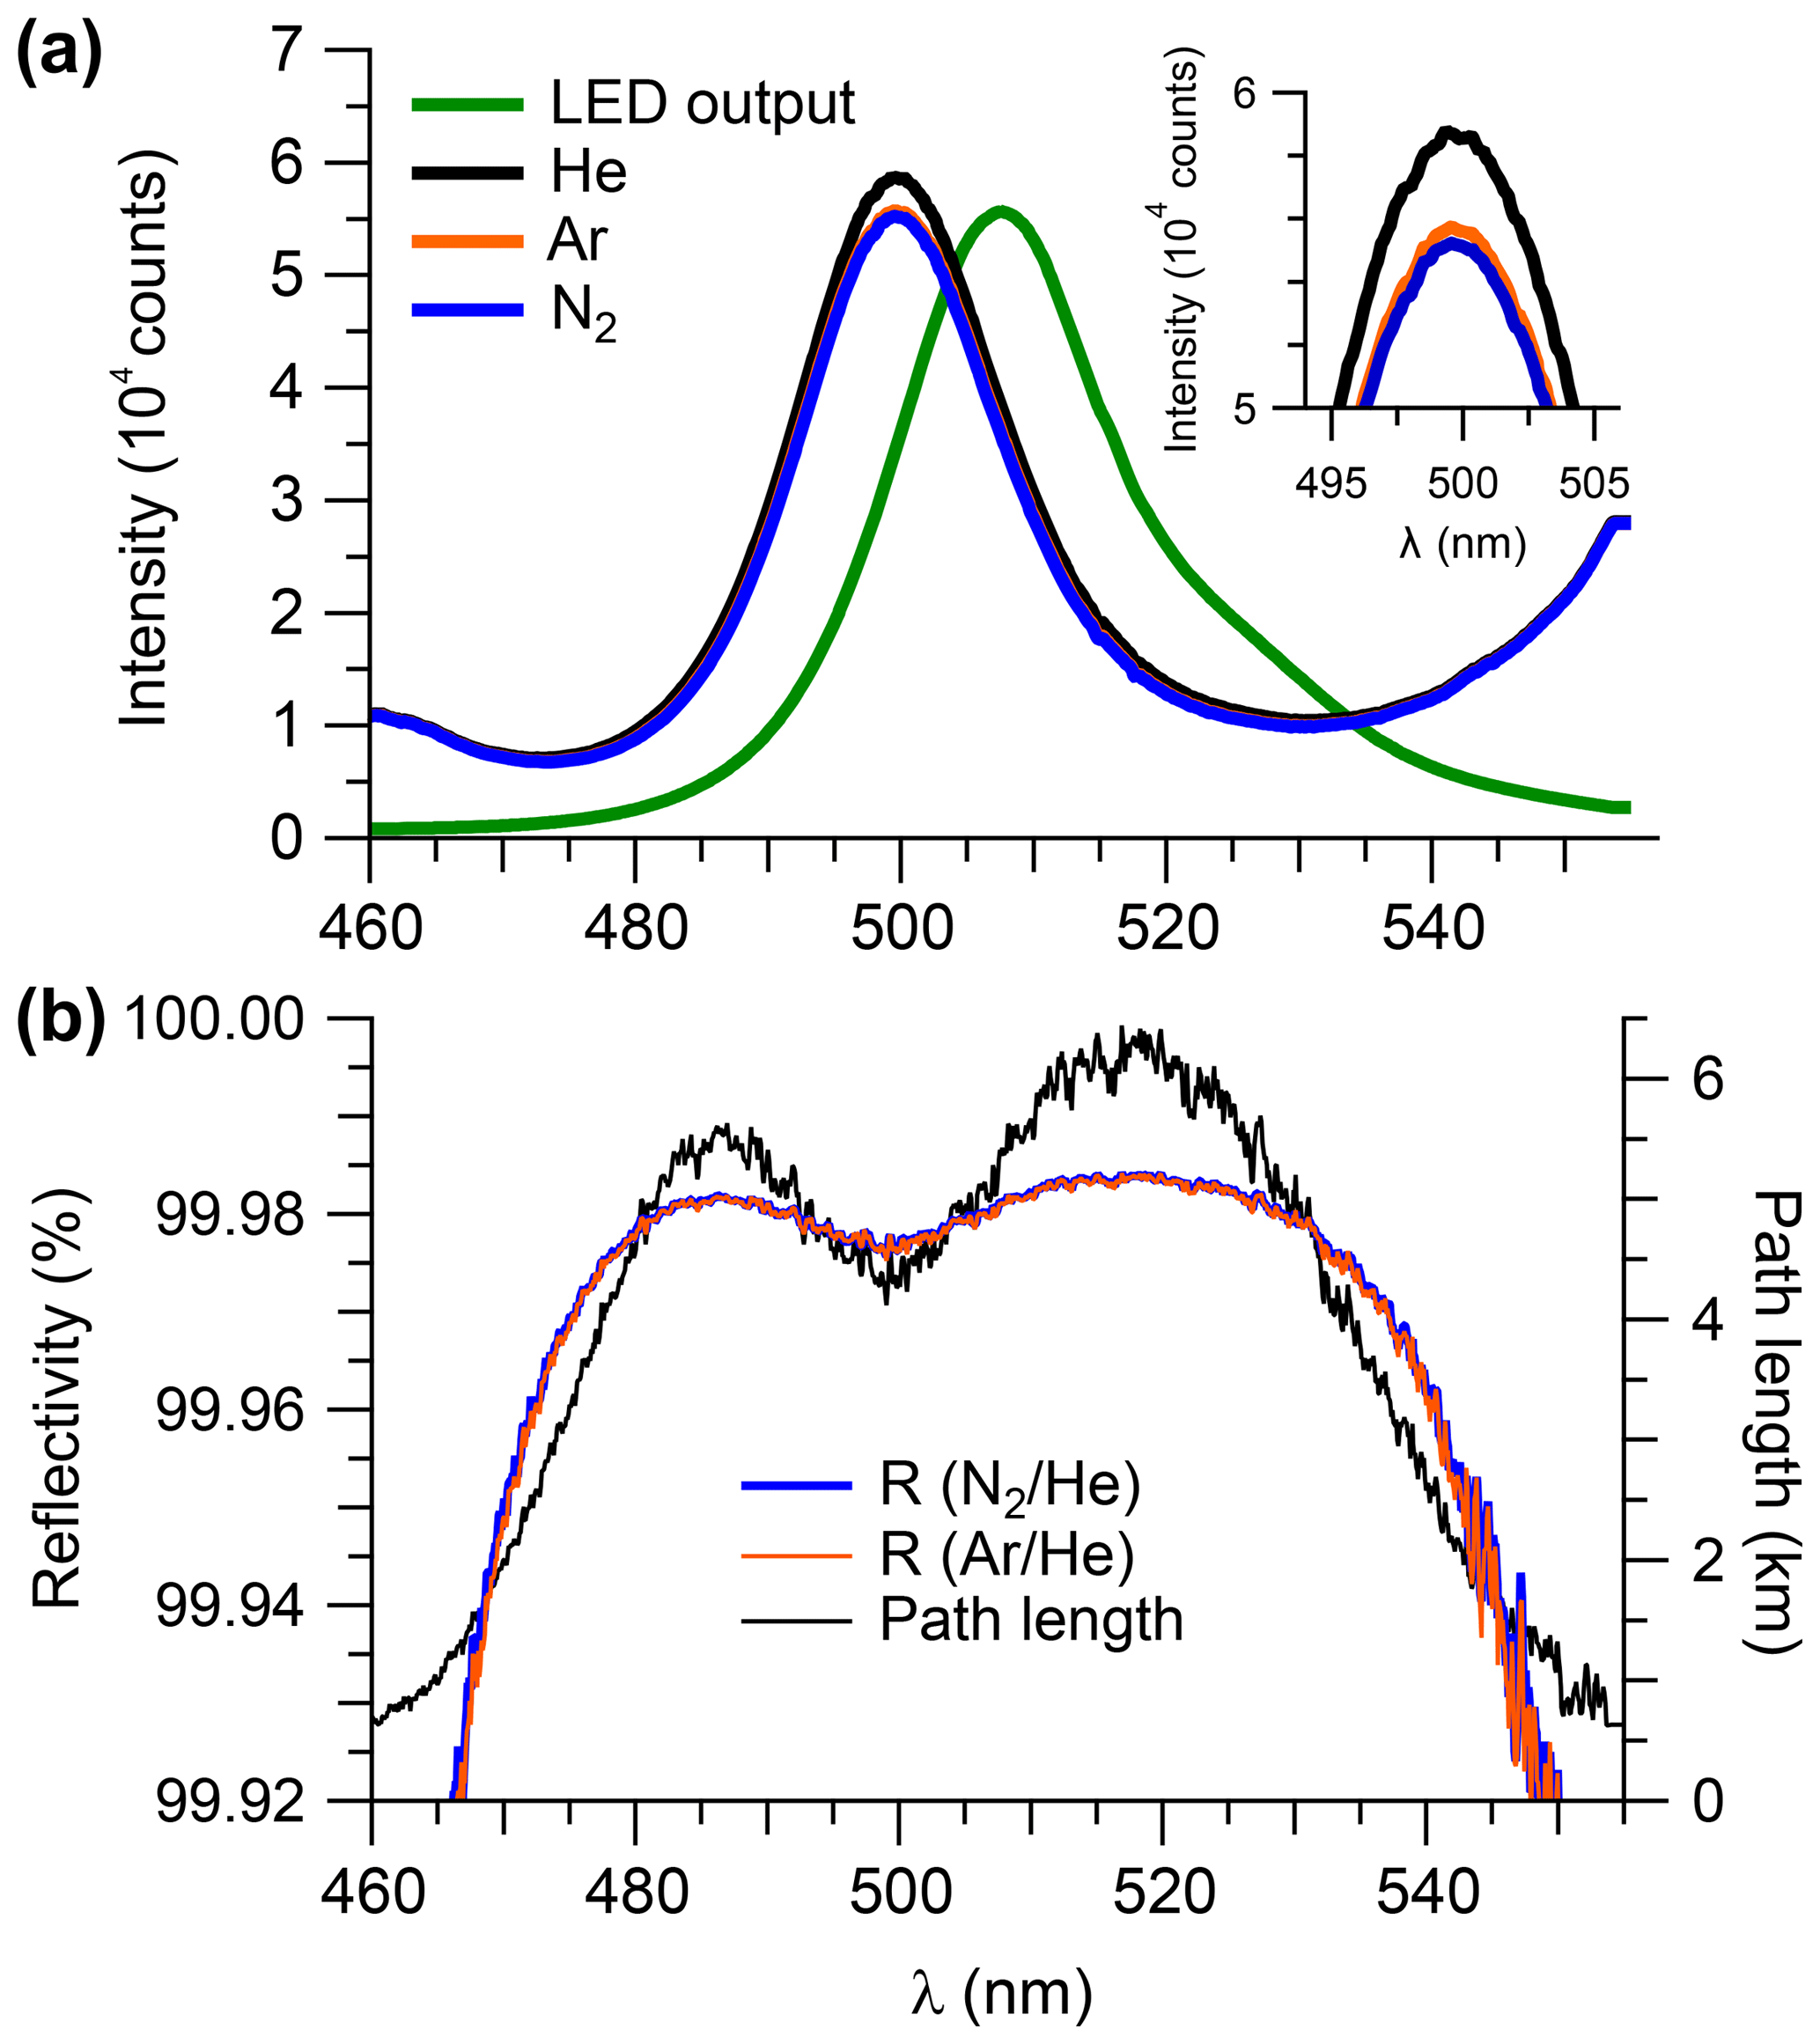
Figure 3(a) Transmission spectra (averaged over 15 min) observed when the sample cell was filled with He, Ar, or N2 at ambient pressure (890 hPa). The LED output spectrum (in arbitrarily scaled units) is superimposed. (b) Mirror reflectivity and effective path length (based on Ar∕He) calculated from the data shown in panel (a).
3.2 Determination of the mirror reflectivity
The response of the IBBCEAS instrument depends on R(λ) and d0 (Eq. 1), which need to be accurately known. If an optical cavity is filled with a non-absorbing and inert gas, and aerosols are removed by filtering, the optical extinction is due to gas scattering only. In this case, R(λ) can be derived from the extinction caused by two individual gases with known and different scattering cross sections such as N2 and He (Washenfelder et al., 2008):
Here, IX(λ) and are the intensities and extinction coefficients of N2 and He, respectively. Other pairs (e.g., He and Ar) may be used as well. For this work, we chose scattering cross sections from Peck and Khanna (1966) for N2, Cuthbertson and Cuthbertson (1932) for He, and Peck and Fisher (1964) for Ar. Typically, combinations with He provide a higher signal-to-noise due to He having a much smaller scattering cross section than other gases (Thalman et al., 2014). The above approach assumes that scattering and absorption within the optical cavity are small (Washenfelder et al., 2008) and neglects absorption and scattering due to the mirror substrate.
To determine R(λ) in this work, the cavity output intensity was recorded when the cell was filled with high-purity N2 (99.998 %) or with He (99.998 %) to atmospheric pressure (∼890 hPa). In each case, the gases were delivered from a compressed gas cylinder (Praxair) and continuously injected through the purge ports until all other sample cell constituents were displaced through the open inlet port. To corroborate the results, the cavity was also filled with Ar (99.998 %), which has slightly larger scattering cross sections than N2.
Figure 3a shows cavity-enhanced transmission spectra with the optical cavity filled with N2, He, and Ar, each averaged over a 15 min time period. The intensity difference due to scattering by Ar and N2 was more pronounced in the case when the sample cell was filled with He (Fig. 3a, inset), as expected based on their relative cross sections (Thalman et al., 2014).
Figure 3b shows the reflectivity spectra calculated using Eq. (6). The reflectivity curves are essentially smooth continua, with a maximum reflectivity of ∼99.98 %. The relative difference between the reflectivity calculated from the ratios of Ar∕He and N2∕He was in the 480–530 nm range. Arbitrarily, the N2∕He mirror curve was chosen to calculate the mirror reflectivity for the remaining data analysis in this work with the exception of the scattering cross sections of N2 and CO2 (see Sect. 4.1.1 and 4.1.5) for which the Ar∕He pair was used. The observed reflectivity corresponds to a total path length of 5.5 and 6.3 km near 485 and 520 nm, respectively. Intermittent measurements of mirror reflectivity showed that it remained unchanged throughout this work; in particular, no difference in reflectivity was found prior to and following the ORCA campaign.
The overall uncertainty in the measured mirror reflectivity was ±2.3 %, resulting from addition by quadrature of a ±1 % uncertainty in the N2 scattering cross section (Peck and Khanna, 1966), a ±2 % uncertainty in the He cross section (Washenfelder et al., 2008; Min et al., 2016), ±0.4 % uncertainty in temperature, ±0.1 % uncertainty in pressure, and ±0.1 % random noise due to photon counting statistics.
3.3 Determination of the effective optical absorption path
When sampling ambient air, knowledge of the path length over which sampled air is present (d0) and the associated correction factor RL is essential for accurate IBBCEAS measurements when purge gases are used to maintain clean mirrors as in this work. The effective cavity length, d0, was determined by sampling pure oxygen and monitoring the O2 dimer (Duan et al., 2018). This experiment was performed in the 350–390 nm wavelength region using highly reflective mirrors and an LED (Thorlabs M365LP1) suitable for this wavelength region, though in principle it could have been performed in the cyan region as well since both spectral regions contain O4 absorption lines. Following Duan et al. (2018), d0 is given by
where and are the [O2] retrieved using cross sections by Thalman and Volkamer (2013) with or without the purge flows. Consistent results were obtained when a constant mixing ratio of NO2 was sampled (and purge flows were turned on and off) and from the ratio of expected absorption by O4 (calculated from the square of the number density of O2 and the O4 cross section) relative to the observed O4 absorption, though the latter may be less accurate as the absorption changes non-linearly in the region where purge and sample gases mix and requires accurate knowledge of mirror reflectivity.
At a sample flow rate of 2.0 slpm, a purge flow rate of 0.1 slpm, and cell pressure of 870 hPa, we determined (1σ precision stated), with an accuracy of ±5 %. This RL value is smaller than calculated from the ratio of the inter-mirror distance d to the distance between the inlet and outlet of the sample flow (∼1.39), which suggests that sampled air partially mixes into the purge volume. At a volumetric flow rate of 11 L min−1 as deployed during ORCA, we observed (1σ precision).
3.4 Reference absorption cross sections
Figure 1 shows trace absorbers in the 480–530 nm window calculated as extinction (αi(λ)=σi(λ)N) for typical atmospheric mixing ratios. IBBCEAS analysis was performed using the high-resolution NO2 absorption cross section of Voigt et al. (2002) and the cross sections of Spietz et al. (2005) for OIO and Spietz et al. (2006) for I2, respectively. The NO2 cross section was convolved with the instrument function corresponding to a sharp peak line (540.06 nm) in the emission spectrum of the Hg(Ne) calibration lamp (Fig. S2), which was also used to calibrate the wavelength scale of the spectrometer.
The IBBCEAS instrument's resolution was 0.33 nm in the 480–530 nm window, whereas the NO2 literature spectrum was recorded at a higher resolution of better than 0.005 nm (Voigt et al., 2002). A convolved NO2 reference spectrum was used for the least-squares analysis. The literature cross sections of I2 and OIO (Spietz et al., 2005, 2006) at a resolution of 0.59 nm were not convolved because their resolution was lower than that of the IBBCEAS instrument.
The NO2 absorption cross section is somewhat pressure-dependent, which is important considering that the IBBCEAS instrument was operated at ∼466 hPa in the field. Voigt et al. (2002) reported cross sections at 1333 and 133 hPa (in N2). Following convolution to the IBBCEAS instrument, these differences were judged to be small (2 %–5 % in the 480–530 nm range).
3.5 Spectral fitting
The DOAS intelligent system (DOASIS; Kraus, 2003) was used to retrieve gas-phase concentrations. Optical extinction data collected in laboratory experiments were fitted using the literature absorption spectra (Sect. 3.3) and a third-degree polynomial to represent broadband processes (e.g., temperature fluctuation, Mie scattering, and extinction by aerosols). The “spectral shifting” setting in DOASIS was set to ±0.2 nm, and stretching was disallowed.
The same parameters were used to fit the data from the ORCA field campaign except that in an effort to minimize the fit residuals, the convolved absorption cross section of H2O based on the high-resolution data by Coheur et al. (2002) was also included in the fit. The contribution of water vapour to the optical extinction was small since the relative humidity of the air sampled during the background measurement was the same as during the measurement of NO2 or I2. Further, the optical extinction (α) values, as per Eq. (1), were smoothed using a fourth-order polynomial filter (Savitzky and Golay, 1964). Smoothing improved the root mean square of the residuals and the fit uncertainty by a factor of ∼2 (Fig. S3).
3.6 Description of the CRDS instrument
The IBBCEAS instrument quantified NO2 in parallel to a blue diode laser CRDS instrument, which has been described previously (Paul and Osthoff, 2010; Odame-Ankrah, 2015). Briefly, mixing ratios of NO2 are quantified by optical absorption using a continuous wave (cw) laser whose emission is centred at 405 nm (Power Technology IQµ2A105, Little Rock, AR, USA). The radiation is square-wave (on/off) modulated at a repetition rate of 1 kHz (50 % duty cycle) and enters a 111 cm long stable resonator formed by two highly reflective mirrors (2.54 cm diameter; Advanced Thin Films, Boulder, CO, USA) in a concentric configuration. The cavity output is coupled into a 200 µm diameter, 0.22 numerical aperture, multimode optical fibre (Thorlabs M25L01) illuminating a photomultiplier tube (Hamamatsu Photonics H9433-03MOD, Japan). The ring-down decay traces are co-added and fitted to an exponential using the discrete sums algorithm described by Everest and Atkinson (2008).
The CRDS NO2 channel was operated in parallel to a CRDS NOx channel, to which a small flow of O3 in O2 was added to convert NO to NO2, similar to the method described by Fuchs et al. (2009). Following the O3 addition point, the sampled air passed through a coiled reaction chamber with a total residence time of ∼7 s to ensure complete titration and a linear response up to ∼100 ppbv of NO (Odame-Ankrah, 2015). An identical chamber was added to the NO2 channel to match the response times of the two channels. Mixing ratios of NO2 and NOx measured by CRDS were accurate within ±10 % (Osthoff et al., 2018).
3.7 Generation and delivery of gases
Figure 2b shows the set-up for delivery and sampling of NO2. NO2 was generated by mixing the output of a standard NO cylinder (100.2±1.0 ppmv in N2; Scott-Marrin, Riverside, CA, USA) delivered using a 20 sccm all-metal MFC (MKS Instruments 1479A) with O3 produced by illuminating a flow of O2 (Praxair) with a 254 nm Hg pen-ray lamp (Jelight, Irvine, CA, USA) and dilution with zero air.
Iodine was purchased in solid crystalline form (≥ 99.8 %, Sigma-Aldrich, Oakville, ON, Canada). Small amounts were placed in a Teflon™ permeation tube (VICI Metronics, Poulsbo, WA, USA); these tubes were sealed on both ends with PTFE plugs compressed with stainless steel rings and were (individually) placed in a temperature-controlled permeation chamber (Vici Metronics, model 120-1) operated with a constant air flow of ∼0.3 L min−1. The flow from the permeation chamber was diluted with zero air, yielding iodine concentrations in the range of ∼70 pptv up to 21 ppbv depending on chamber temperature and permeation tube dimensions (i.e., wall thickness and length).
Ar, CO2, CH4, N2, O2, air, and He were delivered from compressed gas cylinders (Praxair) in the same manner as described in Sect. 3.2.
3.8 ORCA field campaign
The IBBCEAS instrument was operated alongside the CRDS during a 4-week-long field intensive conducted at the Amphitrite Point Observatory (APO) on the west coast of Vancouver Island, British Columbia, Canada (Tokarek et al., 2017). The APO was established as a marine background monitoring site but is sporadically impacted by NOx emissions mainly from ship and boat traffic in the region (McKendry et al., 2014).
The IBBCEAS and CRDS instruments sampled, in parallel, from a 5.5 m long common 0.63 cm o.d. and 0.48 cm i.d. FEP Teflon™ inlet line, flooded with calibration gases and zero air at regular intervals. Zero air was generated using a custom-built zero air generation system (Odame-Ankrah, 2015), which delivered air at ambient relative humidity that was free of trace gases such as NO2, NO, I2, or O3. This approach minimized absorption by H2O from the extinction spectra which can create artefacts (Bahrini et al., 2018). A flow restriction was placed upstream of the inlet filter. When the IBBCEAS instrument was operated at a flow rate of 5 slpm, an average (±1σ) sample cell pressure of 473 (±23) hPa and an inlet residence time of 2.3 s were achieved. The cell pressure varied over short time periods, with a standard deviation of ±2.4 hPa. A PAN gas chromatograph (Tokarek et al., 2014) and commercial NO∕NOy and O3 instruments (Thermo 42i and 49i), as well as a 662 nm diode laser N2O5 channel (Osthoff et al., 2018), also sampled off this common inlet line, resulting in all instruments periodically sampling a variety of calibration gases.
The IBBCEAS transmission spectrum was integrated for 9 s, resulting in ∼90 % saturation of the CCD at 500 nm. Dark spectra (to characterize the spectrometer offset) were acquired daily with the same integration time (9 s). Wavelength calibration spectra of the Hg(Ne) lamp were collected daily over a period of 2 min and showed that the spectrometer wavelength scale remained relatively unchanged (±0.02 nm) over the region of interest. The mirror reflectivity was measured prior to and after the campaign and agreed within ±(). Data were averaged over 60 s post-campaign prior to analysis.
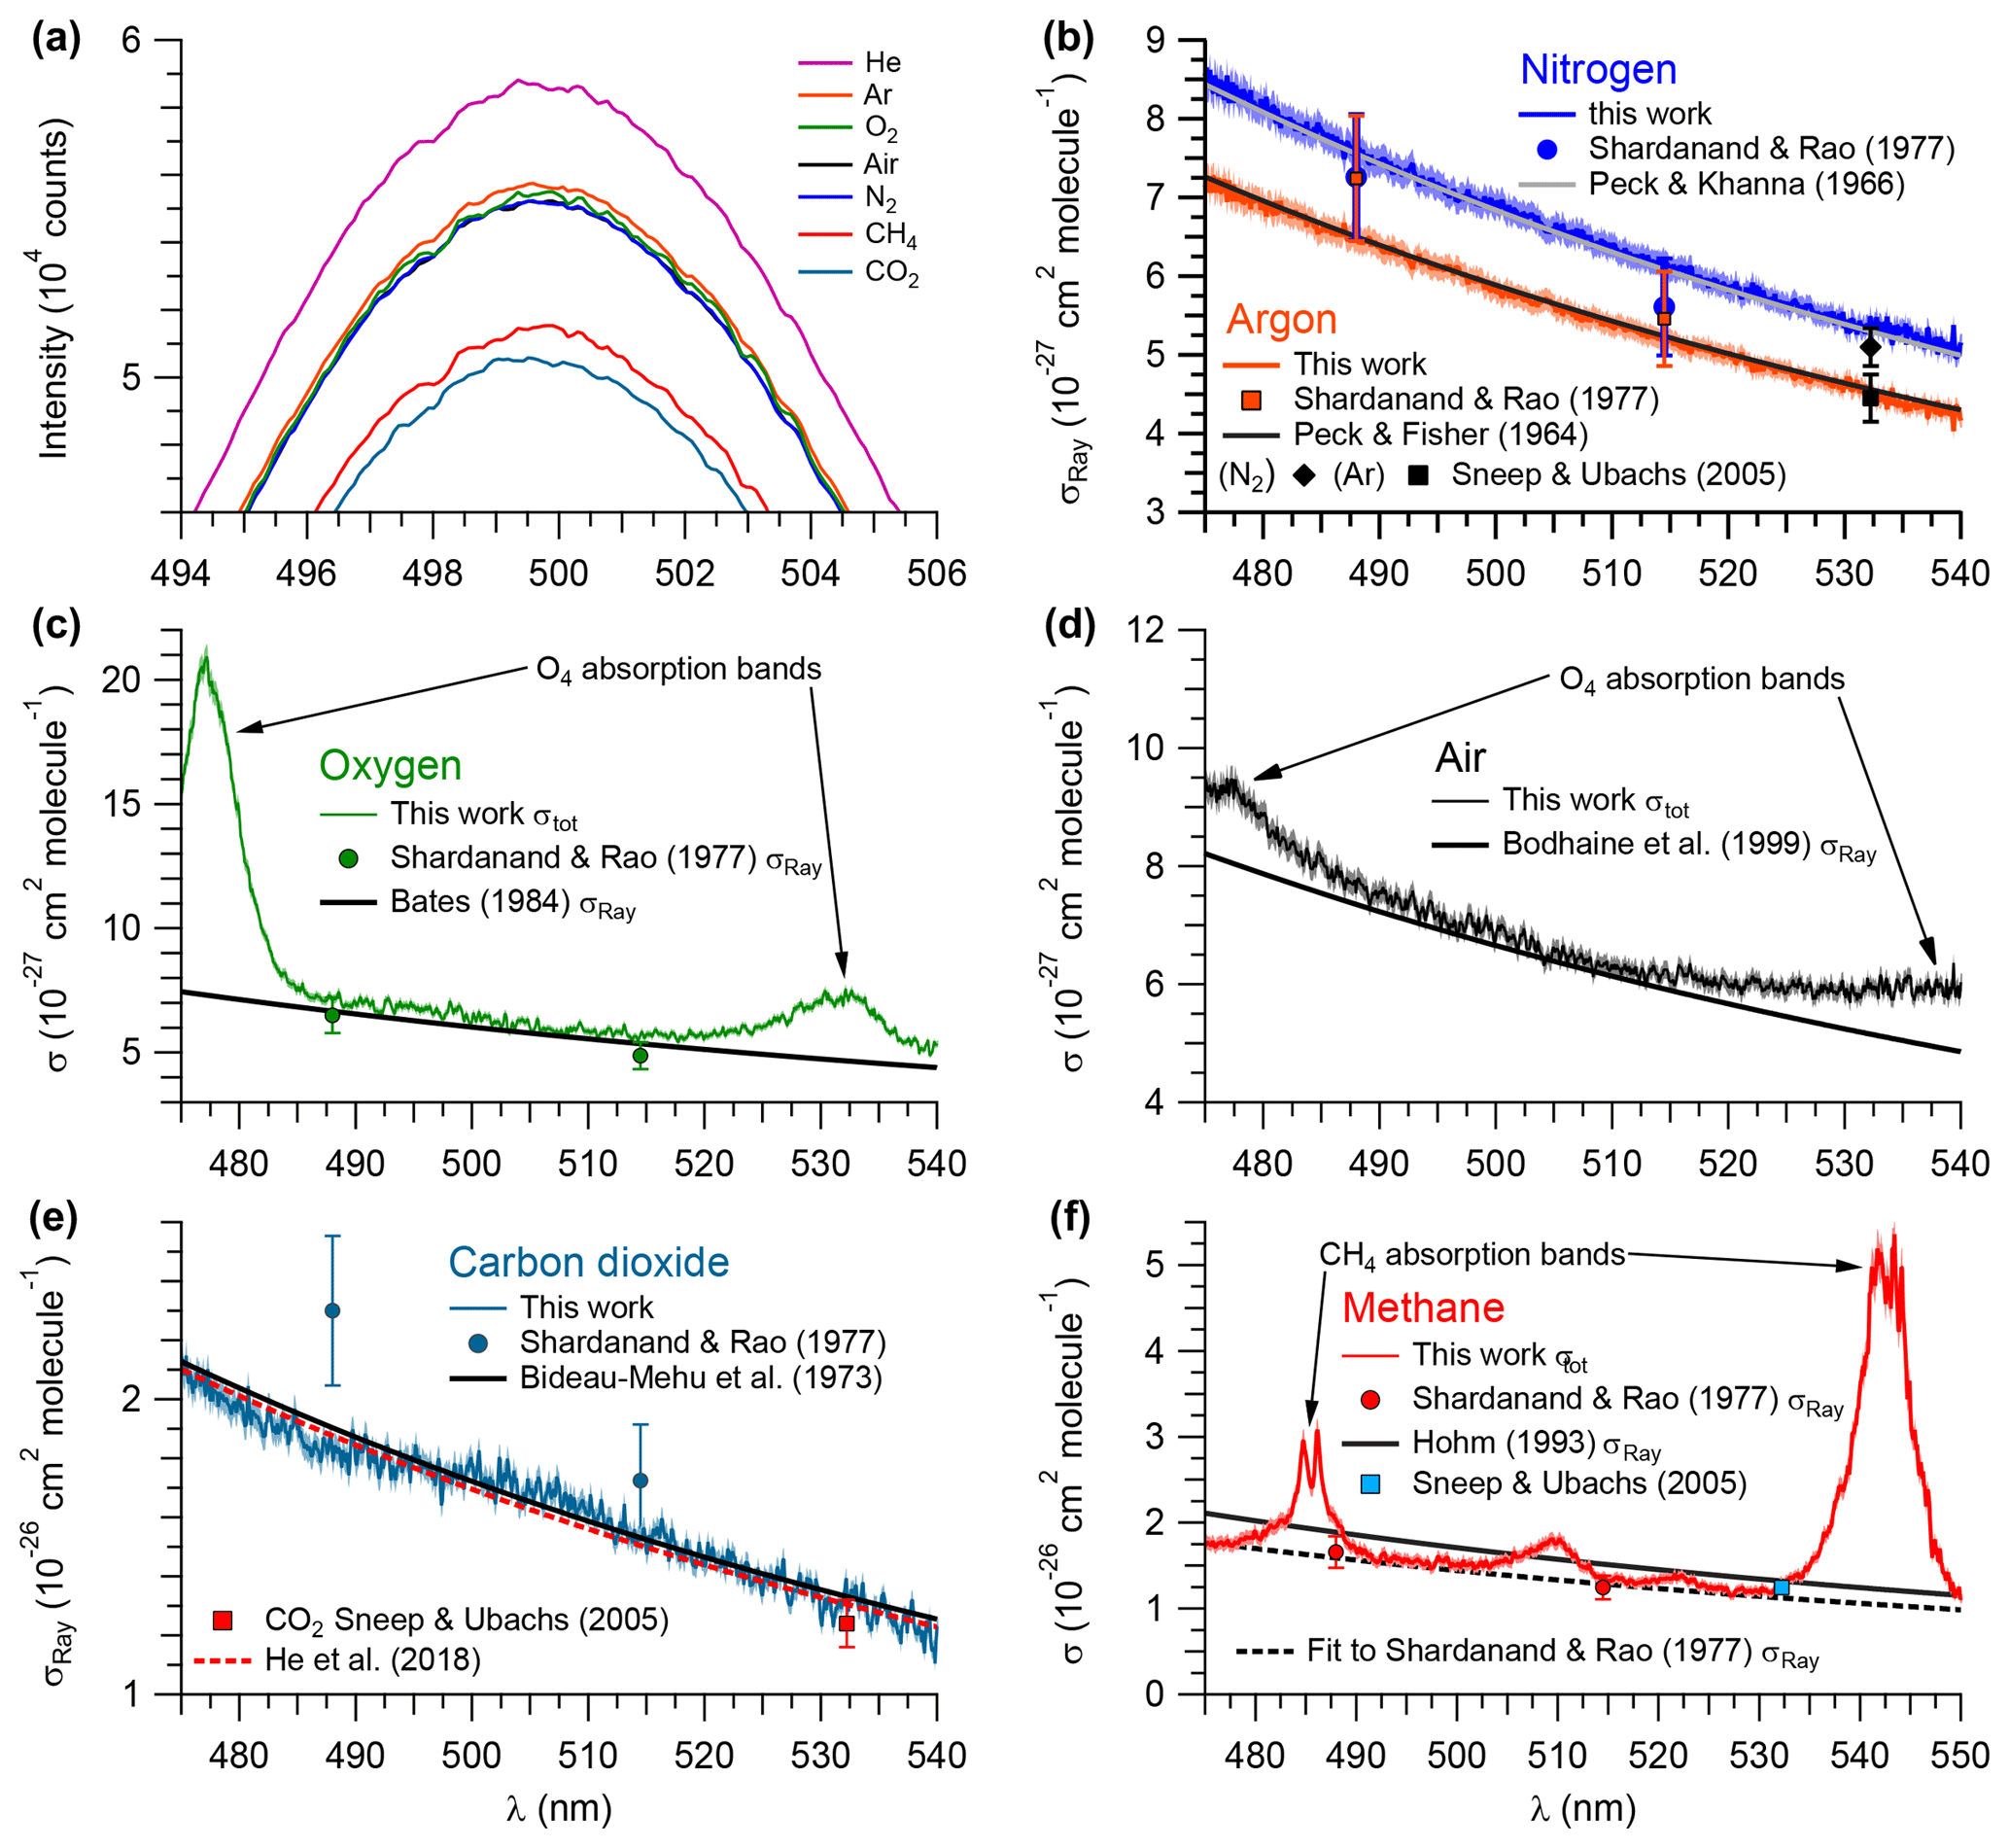
Figure 4Measurements of pure gases. (a) Relative intensities of the IBBCEAS signal due to each sampled gas. Extinction cross sections of (b) 99.998 % N2 (shown in blue) and 99.998 % Ar (red), (c) air (black), (d) 99.99 % O2 (green), (e) 99.95 % CO2 (teal), and (f) 99.97 % CH4 (red). Shaded areas represent ±2.5 % error margin in N2, Ar, O2, air, and CO2, and 4.6 % in CH4. σRay – Rayleigh scattering cross section; σtot – total extinction cross section (i.e., σRay + σabs).
4.1 Measurements of cross sections of pure gases
The extinction cross sections of N2, CO2 (based on mirror reflectivity determined from the Ar∕He ratio of scattering coefficients), O2, air, Ar, and CH4 (based on mirror reflectivity determined from the N2∕He ratio of scattering coefficients) in the 480–535 nm wavelength range are shown in Fig. 4; values at selected wavelengths are summarized in Table 1. For N2, Ar, and CO2, the extinction is due to scattering only. In contrast, the spectra of O2, air, and CH4 include optical losses due to absorption in addition to scattering. The systematic uncertainty of these data was ±2.5 %; the systematic errors arise mainly from uncertainties in the mirror reflectivity (±2.3 %, see Sect. 3.2) and errors in the scattering cross section terms in Eq. (3). The precision of the data (calculated after subtracting a fourth-order polynomial from the observed cross sections) varies from ±2.5 % for the CO2 data shown in Fig. 4e to ±0.9 % for the N2 data shown in Fig. 4b.
Table 1Summary of observed and n-based Rayleigh scattering cross sections.

a The absolute uncertainty is ±2.5 % (see Sect. 4.1). b,c See text for references of n-based scattering cross sections and references therein for corresponding calculations of King (1923) correction factors. d From Sneep and Ubachs (2005); uncertainty is stated as 1σ. e The ratio of N2∕O2 in the cylinder was . f Comparison is to the fitted expression to the data set of Shardanand and Rao (1977).
4.1.1 Nitrogen
Figure 4b shows the measured scattering cross sections of N2 at a temperature of 299.0±0.1 K and pressure of 879.7±0.7 hPa between 480 and 535 nm. Superimposed are n-based cross sections predicted using Eq. (5), data by Peck and Khanna (1966), and the King correction factor by Bates (1984). In addition, the single-wavelength CRDS measurement at 532.2 nm by Sneep and Ubachs (2005) and the nephelometer data of Shardanand and Rao (1977) are shown.
The IBBCEAS data are marginally larger than the n-based prediction, with the percent difference ranging from +0.2 % at 525.07 nm to +1.3 % at 485.03 nm (Table 1). These differences are well within the margin of measurement error (±2.5 %), set in this case by the accuracy of the scattering cross sections of He (±2 %) and Ar (< 1 %). The IBBCEAS data differ from the CRDS data of Sneep and Ubachs (2005) at 532.2 nm by +7.1 %, though the error bars overlap; the measurement uncertainty of the CRDS data alone is ±9.4 %. The IBBCEAS measurements also differ by +4.6 % at 488.0 nm and by +8.8 % at 514.5 nm from the data of Shardanand and Rao (1977) but are within the combined measurement error (±2.5 % and ±11 %, respectively).
4.1.2 Argon
The scattering cross sections of Ar at 299.0±0.1 K and 879.7±0.7 hPa are shown in Fig. 4b. Superimposed are the n-based cross sections calculated using data from Peck and Fisher (1964) and the King correction factor from Bates (1984). The single-wavelength measurement of Sneep and Ubachs (2005) and the nephelometer data of Shardanand and Rao (1977) are shown for comparison.
The observed scattering cross sections are marginally larger than the n-based prediction, by +1.3 % at shorter wavelengths and +0.21 % at 515.06 nm (Table 1). These differences are within the measurement error of the IBBCEAS instrument (±2.5 %) inferred from the accuracy in the determination of the scattering cross sections of He (±2 %) and N2 (±1 %) used in the determination of the mirror reflectivity. The IBBCEAS cross sections differ from the CRDS data by Sneep and Ubachs (2005) at 532.2 nm and are well within either measurement error bar (Fig. 4b). In contrast, the CEAS values differ from the nephelometer data by −10.8 % at 488.0 nm and by −5.1 % at 514.5 nm, though they are within the ±11 % uncertainty of the nephelometer.
4.1.3 Oxygen
The extinction cross sections of O2 (at a temperature of 299 K and a pressure of 880 hPa) are shown in Fig. 4c next to the n-based predictions based on Bates (1984) and the nephelometer measurements of Shardanand and Rao (1977). The IBBCEAS data show two absorption bands due to the oxygen dimer, O4, centred at 477 and 532 nm (Thalman and Volkamer, 2013). In the 490–515 nm wavelength interval, the contribution of these absorption bands to the total extinction is negligible (< 0.2 % at 515 nm); i.e., the extinction is dominated by scattering. In this region, the observed cross sections are slightly larger than the n-based data of Bates (1984): the differences range from +8.3 % at 495.08 nm to +2.5 % at 515.06 nm (Table 1). Relative to the nephelometer measurements, the IBBCEAS data differ by +8.7 % at 488 nm and by +15.3 % at 514.5 nm.
We calculated the absorption cross section of O4 by subtracting the scattering cross section of Bates (1984), upshifted by cm2 molecule−1 (i.e., by 6 %) to match the n-based data to the observed extinction from 487 to 516 nm, from the extinction shown in Fig. 4c, and dividing it by the number density of O2 (2.13×10¹⁹ molecules cm−3). The result is shown in Fig. S4. The error for this absorption cross section calculation is estimated at ±8.5 %, with the largest source of error being the correction to the scattering cross section extrapolated from the region where absorption is negligible, For the smaller band between 520 and 540 nm, the observed cross section of cm5 molecule−2 is in agreement with recent room-temperature measurements by other groups (Supplement Table S1). For the larger band between 467 and 485 nm, the peak cross section of cm5 molecule−2 is smaller than that reported in recent measurements (Thalman and Volkamer, 2013; Sneep et al., 2006), though the shape of the peak is identical and the error bars overlap.
4.1.4 Air
Figure 4d shows the extinction spectrum of ultrapure air (zero grade, Praxair) at a temperature of (298.5±0.1) K and pressure of 879.7±0.7 hPa. Superimposed is the n-based prediction from the refractive index data of Penndorf (1957) and the King correction factor from Bodhaine et al. (1999).
The sample cylinder contains a sufficiently high quantity of O2 (∼19.5 % by volume, Praxair) for O4 absorption bands to appear at 477.5 and 531.5 nm. In the 495–515 nm wavelength region, the cross sections observed by IBBCEAS are slightly larger than the n-based prediction, by +4.0 %, +3.0 %, and +6.8 % at 495, 505, and 515 nm, respectively (Table 1).
4.1.5 Carbon dioxide
Figure 4e shows the scattering cross sections of CO2 at (299.0±0.1) K and (879.7±0.7 hPa for the 475–540 nm wavelength interval. Superimposed are the n-based prediction based on Bideau-Mehu et al. (1973), nephelometer measurements (Shardanand and Rao, 1977), and a CRDS measurement at 532.2 nm (Sneep and Ubachs, 2005). The observed scattering cross sections differ from the n-based prediction by −2.9 %, +2.4 %, and −2.8 % at 485, 505, and 525 nm, respectively (Table 1). In contrast, the CRDS measurement at 532.2 nm, which has a relatively high uncertainty of ±6.5 % at the 1σ level, is 11 % lower than the IBBCEAS measurement. The nephelometer measurements (Shardanand and Rao, 1977), on the other hand, are significantly larger than the other data shown and appear to be in error.
4.1.6 Methane
Figure 4f shows the extinction spectrum of CH4 (research grade, 99.97 %) for the 475–550 nm interval at (298.5±0.1) K and 879.7±0.7 hPa. The CH4 spectrum in this region contains a number of combination and overtone absorption bands near 484.7, 486.1, 509.6, 522.0, and 543.4 nm that have been assigned by Giver (1978). These bands are relevant to studies simulating the atmospheres of Jovian planets (e.g., Uranus, Neptune) and Saturn's moon Titan that contain CH4 (Karkoschka, 1994). Superimposed are CRDS data by Sneep and Ubachs (2005), the n-based scattering cross sections, calculated using the parameterization by Sneep and Ubachs, and refractive index data from Hohm (1993), assuming a depolarization ratio of unity and nephelometer data by Shardanand and Rao (1977) extrapolated using Eq. (5) (dashed line). In spite of the many absorption bands, there are small windows in which the optical extinction appears to be dominated by scattering and a comparison with literature is feasible. There is very little difference (within combined measurement errors) between IBBCEAS and interpolated nephelometer data at those wavelengths. At 492.06 and 527.28 nm, for example, the data are within −0.07 % and 0.17 %, respectively (Table 1). There is also reasonable agreement between the IBBCEAS and CRDS data at 532.2 nm, which differs by 4.7 % but compares well with the total IBBCEAS uncertainty of 4.6 % for CH4.
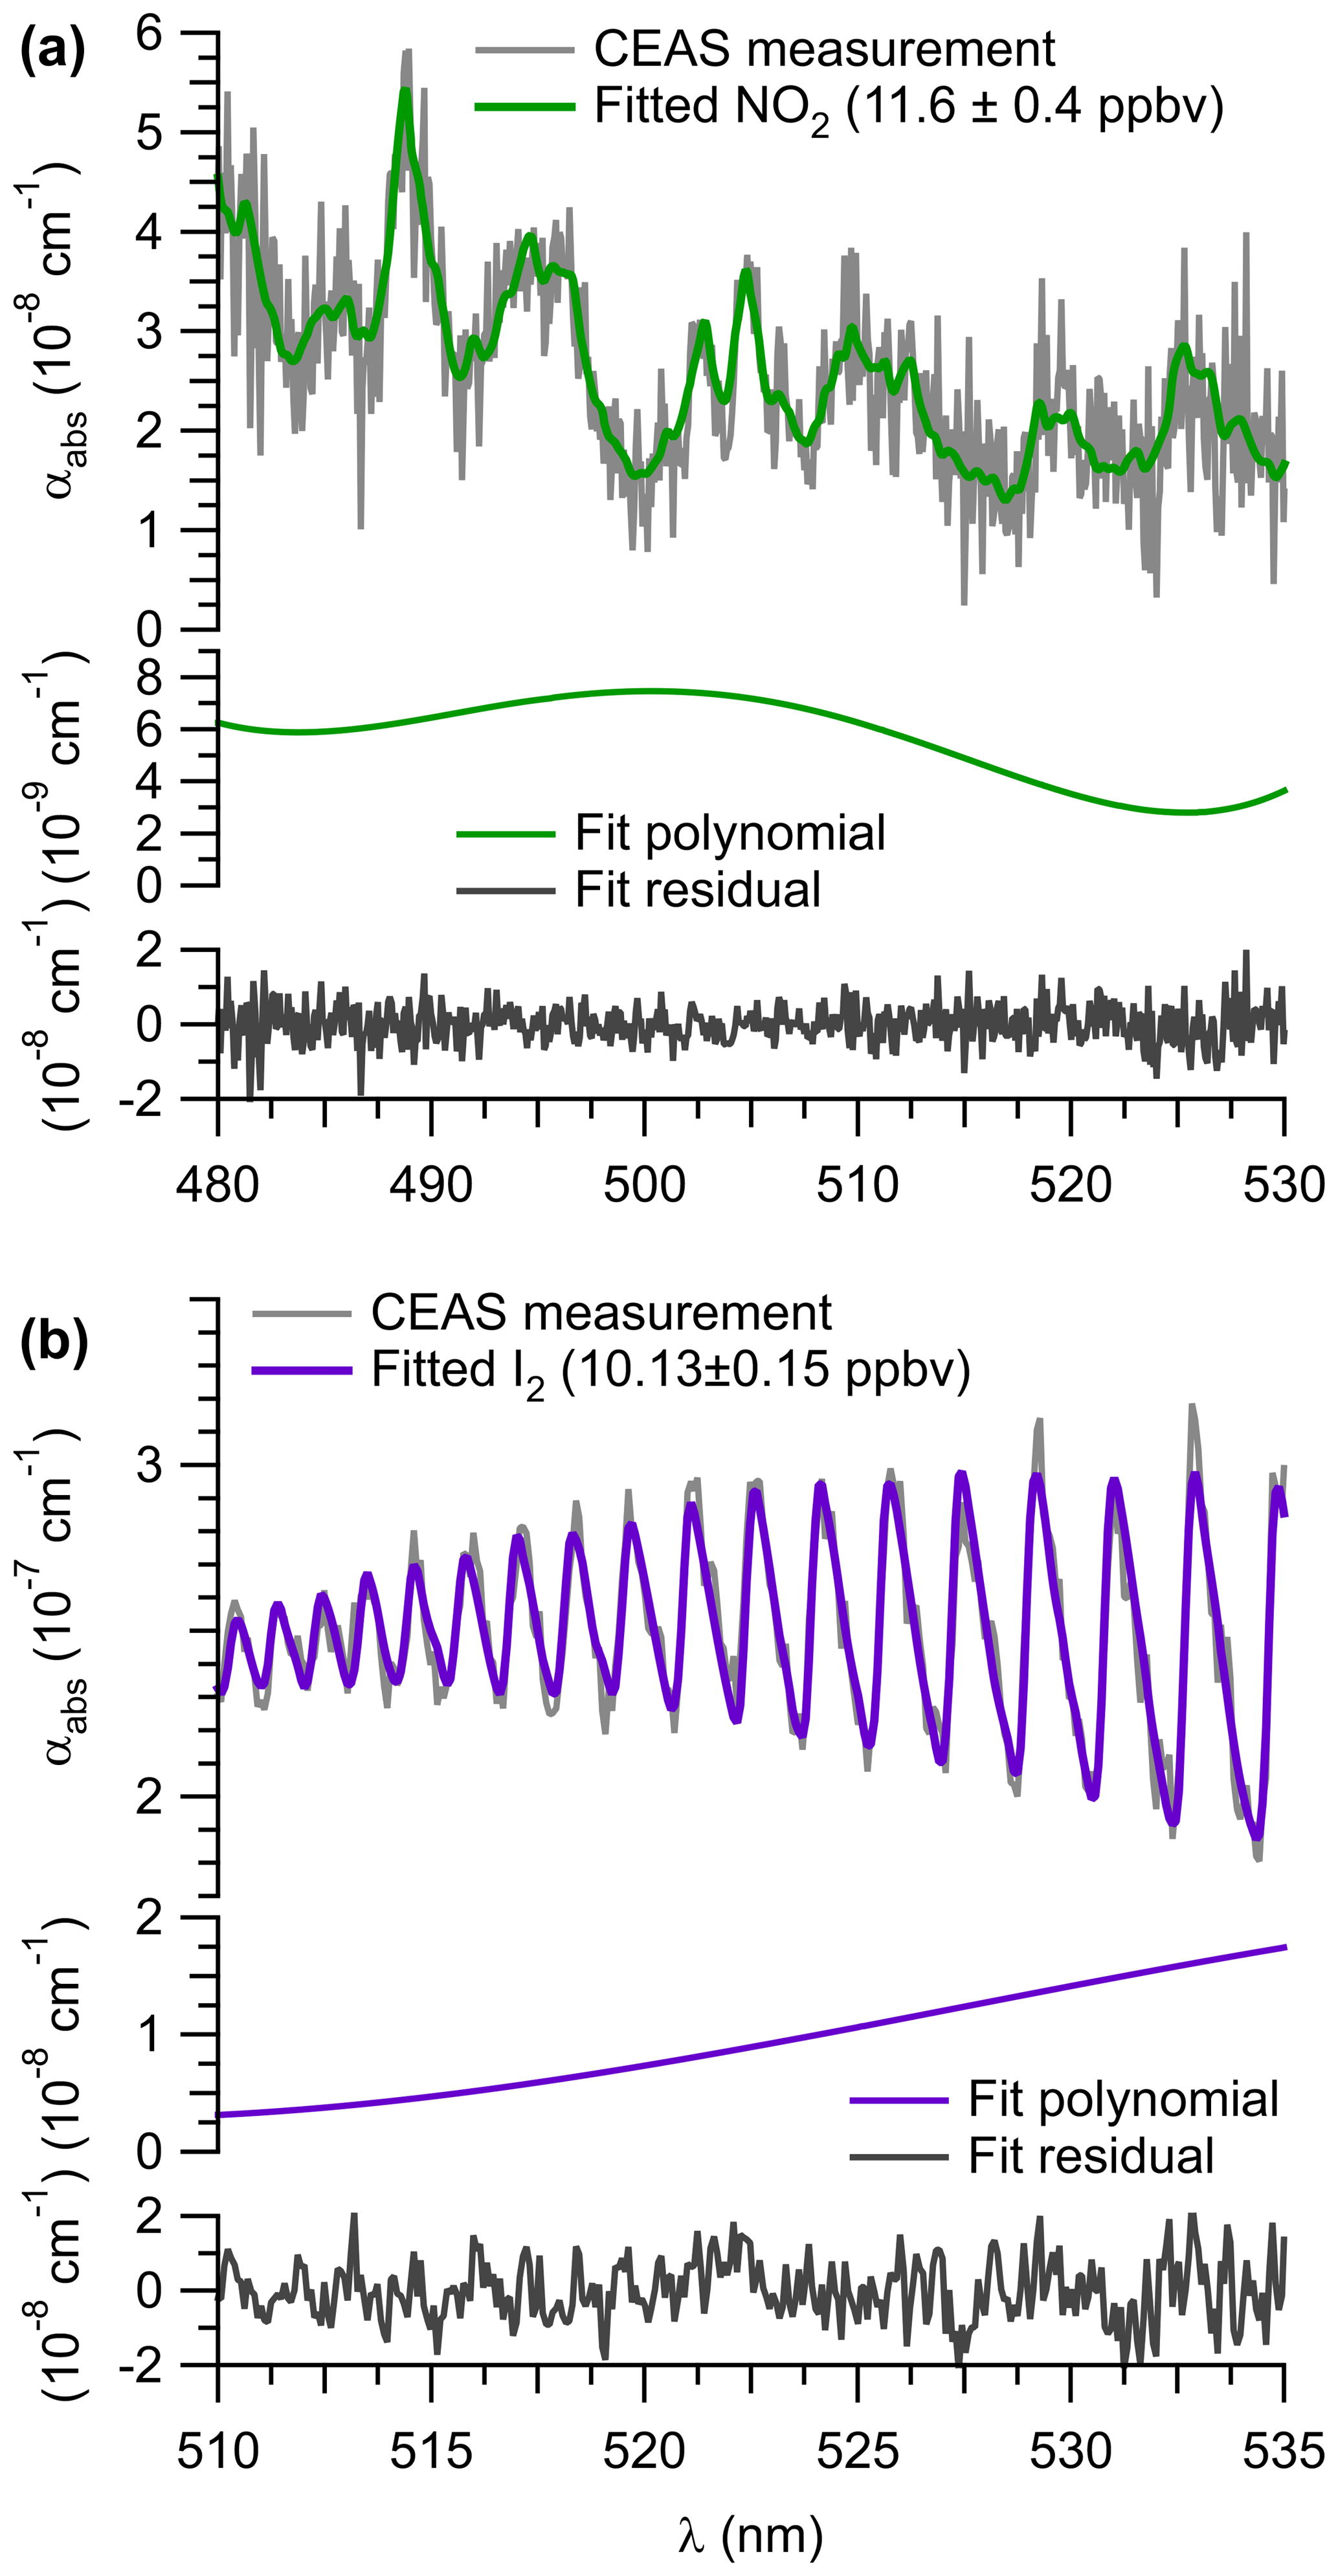
Figure 5Spectral fits to 60 s IBBCEAS signal, including a third-order polynomial and fit residual, for (a) NO2 (ambient) and (b) I2 (calibration) during the ORCA field campaign.
4.2 Measurement of trace gas mixing ratios
4.2.1 Nitrogen dioxide
An example of a spectral retrieval for NO2 in ambient air is shown on Fig. 5a. The figure shows the measured optical extinction (α) for a routine calibration period during the ORCA campaign on 22 July 2015 at 11:52:07 to 11:57:02 (UTC). Superimposed is a fit determined with DOASIS. An NO2 mixing ratio of (11.6±0.4) ppbv was retrieved, corresponding to an ambient air mixing ratio of (13.9±1.0) ppbv when RL is factored in. The residual spectrum is lacking structure, indicating that other absorbers are not significant in this wavelength region.
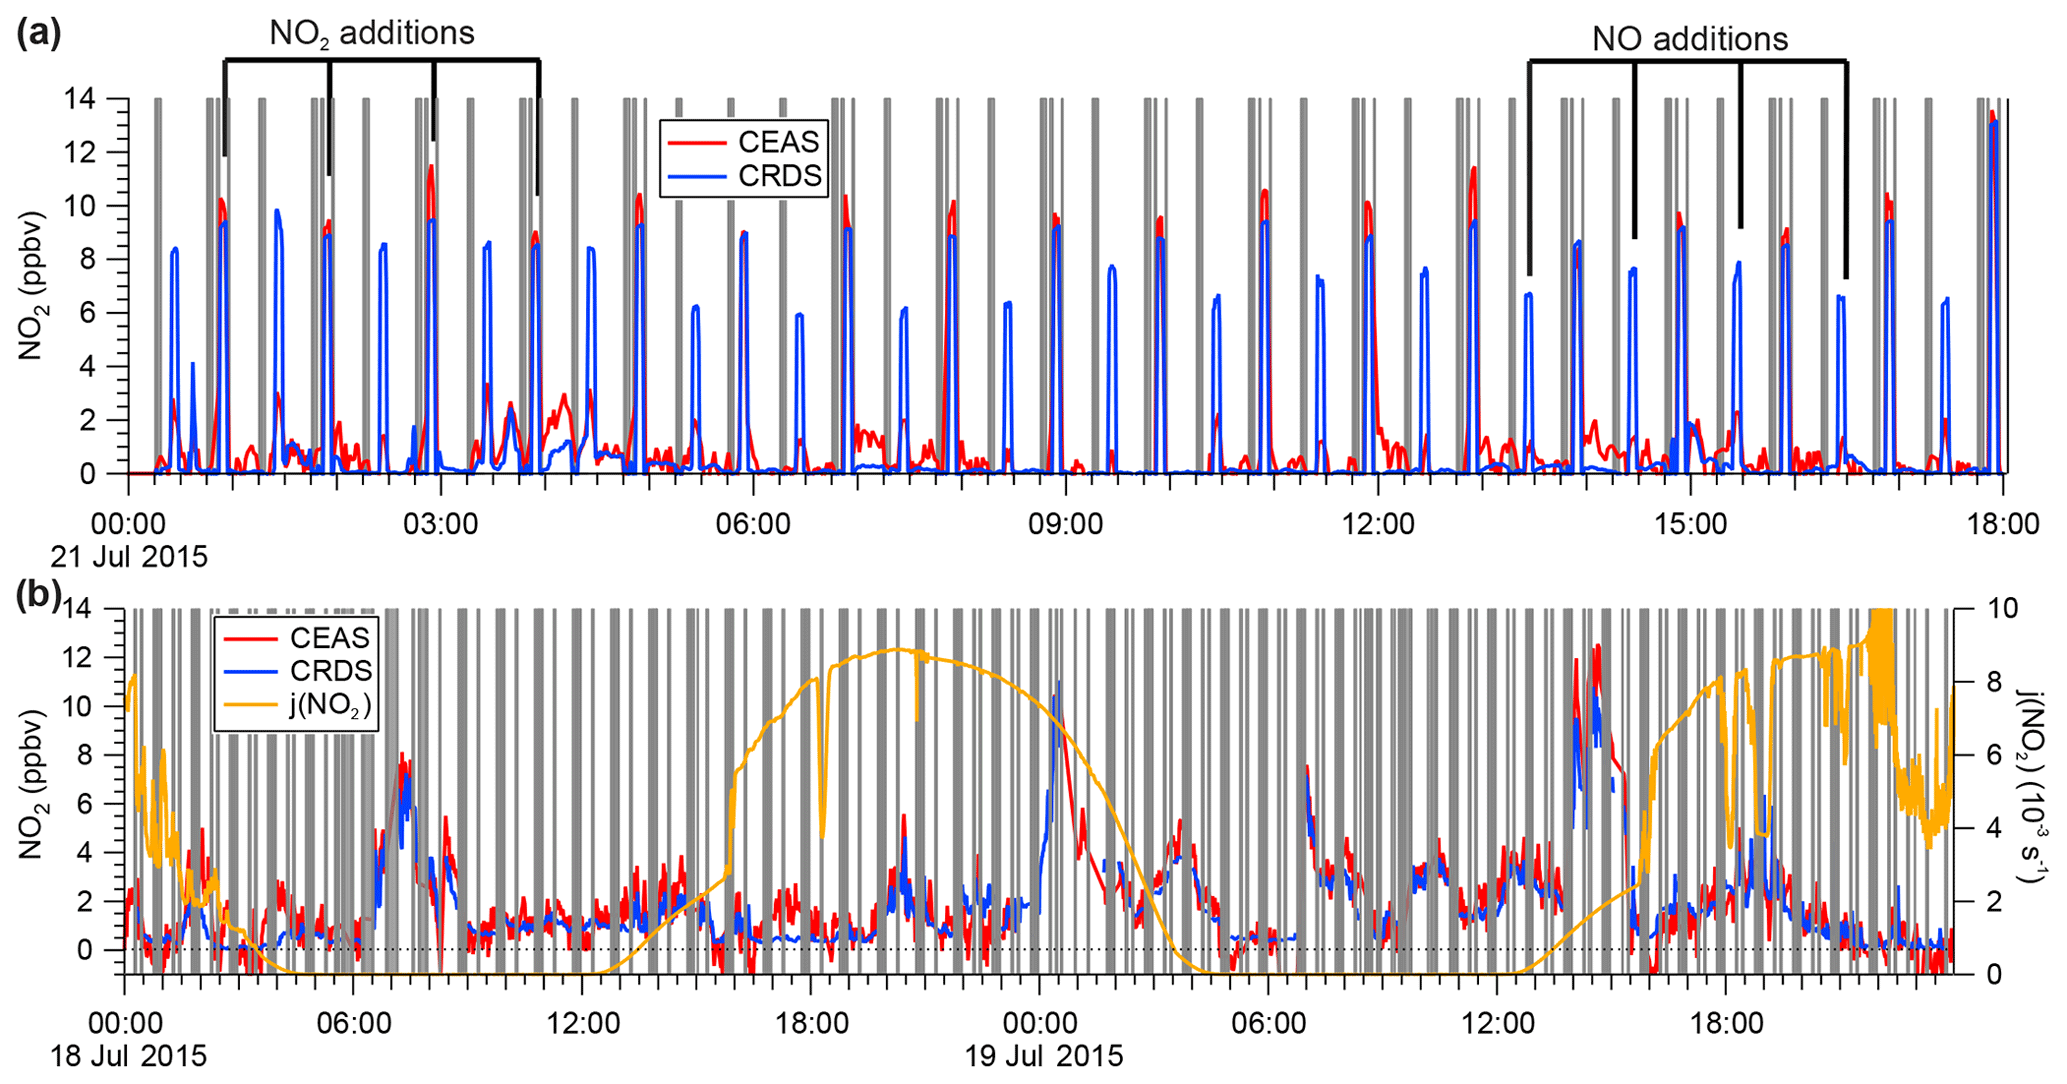
Figure 6(a) Sample time series of continuous IBBCEAS and CRDS data collected during the ORCA campaign showing measurements of ambient air, NO2-free zero air (every 30 min), and hourly standard additions of NO2 (∼10 ppbv) in zero air and NO (∼130 ppbv) to ambient air. The areas shaded in grey indicate times when both instruments sampled zero air. When high concentrations of NO were added, more NO2 was observed by CRDS due to this instrument's longer inlet residence time. (b) Sample time series of ambient air NO2 mixing ratios observed by IBBCEAS and CRDS during ORCA.
During the ORCA campaign, the inlet of the IBBCEAS instrument (and of the CRDS instrument, which sampled in parallel) was overflowed every 30 min with a standard gas mixture of ∼20 ppbv NOx containing up to 16 ppbv of NO2 in zero air and with ∼130 ppbv of NO added to ambient air. The zero air was generated using a scrubber constructed in-house that delivered air with a similar moisture content as ambient air. A subset of these data (and the ambient air data sampled in between) is shown in Fig. 6a.
High concentrations of NO in air are prone to oxidation (by O3 and, to a lesser degree, by O2) to NO2 (Atkinson et al., 2004). Because the CRDS had a longer inlet residence time (7 s) than the IBBCEAS instrument (2.3 s), it observed greater conversion of NO to NO2 when the high NO concentration standard was sampled in an ambient air matrix. On the other hand, when the lower concentration NOx standard was sampled in O3-free air, the two instruments were in better agreement (Fig. 6a).
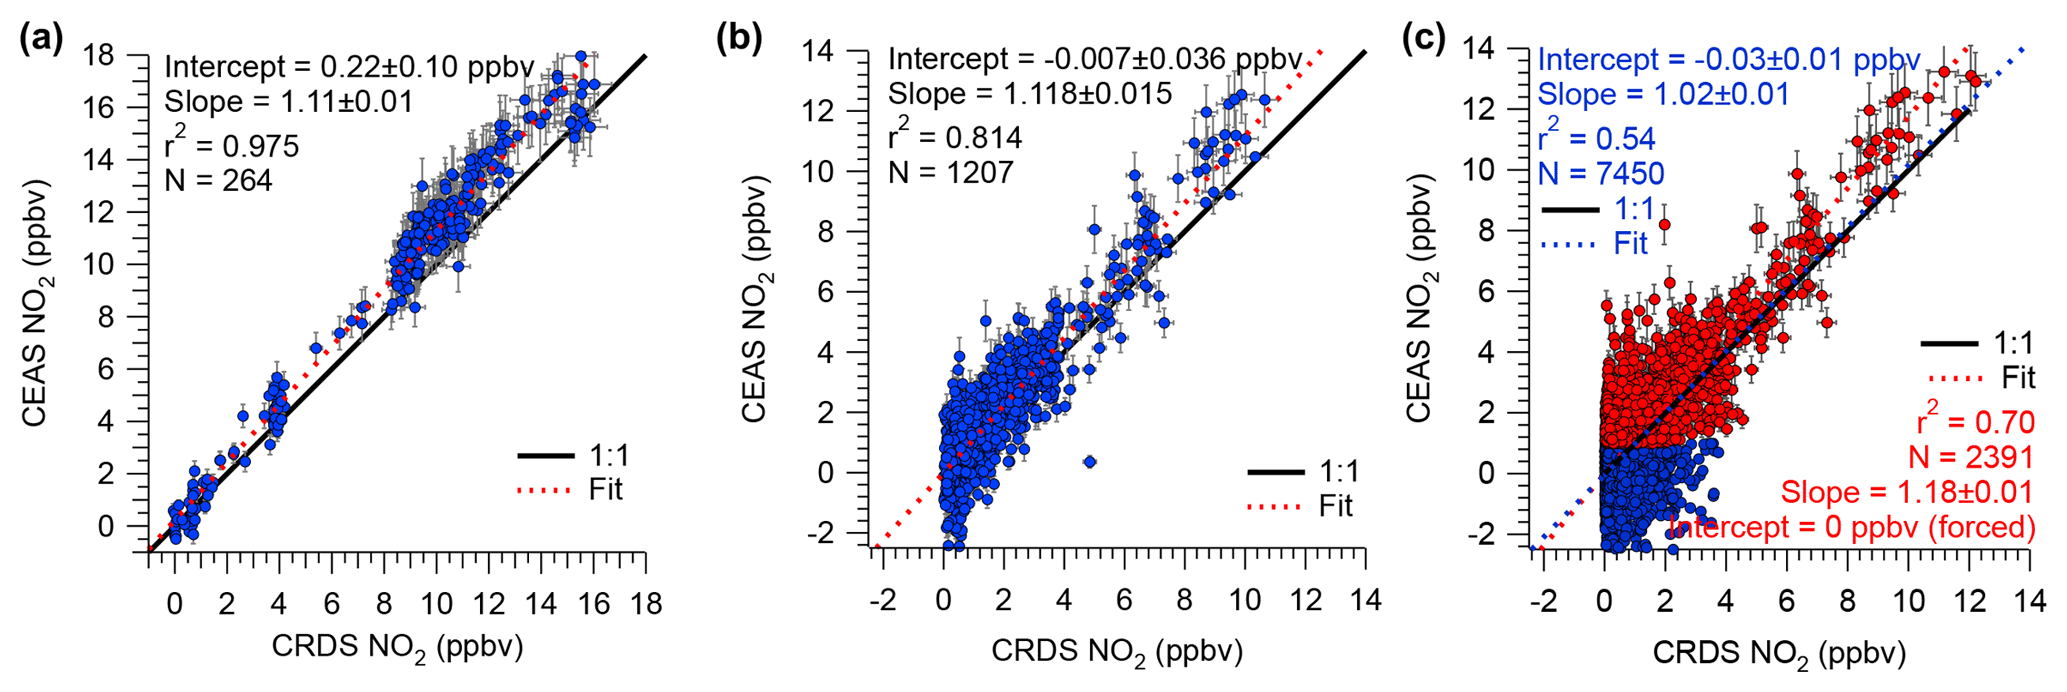
Figure 7Scatter plots and straight-line fits of IBBCEAS and CRDS NO2 mixing ratios for (a) standard additions and calibrations, (b) ambient air measurements on 18–19 July 2015, and (c) ambient air measurements of the entire campaign. For the fit line shown in red, IBBCEAS retrievals with NO2 mixing ratios < 1 ppbv were excluded. All data were averaged to 60 s.
Shown in Fig. 7a is a scatter plot of all of the NOx calibration data. This plot shows a linear relationship with a slope of 1.11±0.01, an intercept of 0.2±0.1 ppbv, and r2=0.975. The slope of the line in Fig. 7a reveals an 11 % systematic difference in the measurement of the calibration standard.
The median NO2 mixing ratio during ORCA was 1.24 ppbv. Shown in Fig. 6b is a time series of a subset of ambient air NO2 measurements. The IBBCEAS NO2 data clearly exhibit more scatter than the CRDS NO2 data and occasionally fall below zero. For ambient air data collected on 18–19 July 2015, the scatter plot of IBBCEAS and CRDS NO2 data (Fig. 7b) has the same slope (1.12±0.02) as that shown in Fig. 7a, while the scatter plot of the entire campaign has a slope of 1.02±0.01 (Fig. 7c). When data are filtered by removing all IBBCEAS points below a factor of 3 times the standard deviation of a blank measurement for 60 s (∼1 ppbv; see Sect. 4.3), the slope of the scatter plot, when forced through an intercept of zero, is 1.18±0.01 (r2=0.70), suggesting that the IBBCEAS data are biased high.
4.2.2 Iodine species (I2, OIO)
Figure 5b shows an example retrieval for I2. The extinction spectrum was recorded during the ORCA campaign on 18 July 2015, when I2 from a permeation source had been added to the inlet and represents a 60 s average. A mixing ratio of (10.1±0.2) ppbv was retrieved in this example.
Figure S5 shows spectra of laboratory-generated I2 samples and their respective absorption spectra, fits, and residuals. Fit results near 20 pptv showed large residuals (±27 %), indicating that the IBBCEAS instrument was near its detection limit.
A sample time series of laboratory I2 measurements (30 s averaged data) is shown in Fig. S6. Gas streams containing I2 were generated using four permeation tubes of different wall thickness, which were exchanged while the output of the permeation was bypassed and the IBBCEAS sampled zero air. The IBBCEAS instrument responded rapidly to concentration changes: for example, at 22:05, the response 30 s after “zeroing” was 10 % of the preceding value, indicating that memory effects (from slow adsorption and desorption kinetics of iodine on the inner walls of the inlet) were negligible.
Figure S7 shows a sample time series of I2 mixing ratios during the ORCA campaign. Concentrations of I2 (and of OIO, not shown) in ambient air were below the instrument's detection limits. At 22:30 UTC, I2 from a diffusion source was added to the inlet. While the transmission of iodine through inlets was not systematically investigated in this work, the square-wave response and quick rise and fall times suggest the absence of inlet transmission losses.
4.3 Accuracy and limits of detection
The accuracy of the IBBCEAS NO2 measurement is influenced by uncertainties in the absorption cross section of NO2 (±3 %) (Voigt et al., 2002), fit errors ±(3 %–5 %, which can be reduced to ±(2–4) % by smoothing), scattering cross sections, i.e., mirror reflectivity (±2.5 %; Sects. 3.2 and 4.1), RL (±5 %; Sect. 3.3), and errors in the mass flow controller reading (±1 %), sample cell pressure readout (±0.5 %), and temperature measurement (±0.7 %). The total uncertainty, expressed as the square root of the individual errors summed in quadrature, is ±(7–8) %. Not included in this estimate are errors arising from the interpolation of infrequent mirror reflectivity and RL determinations in the field.
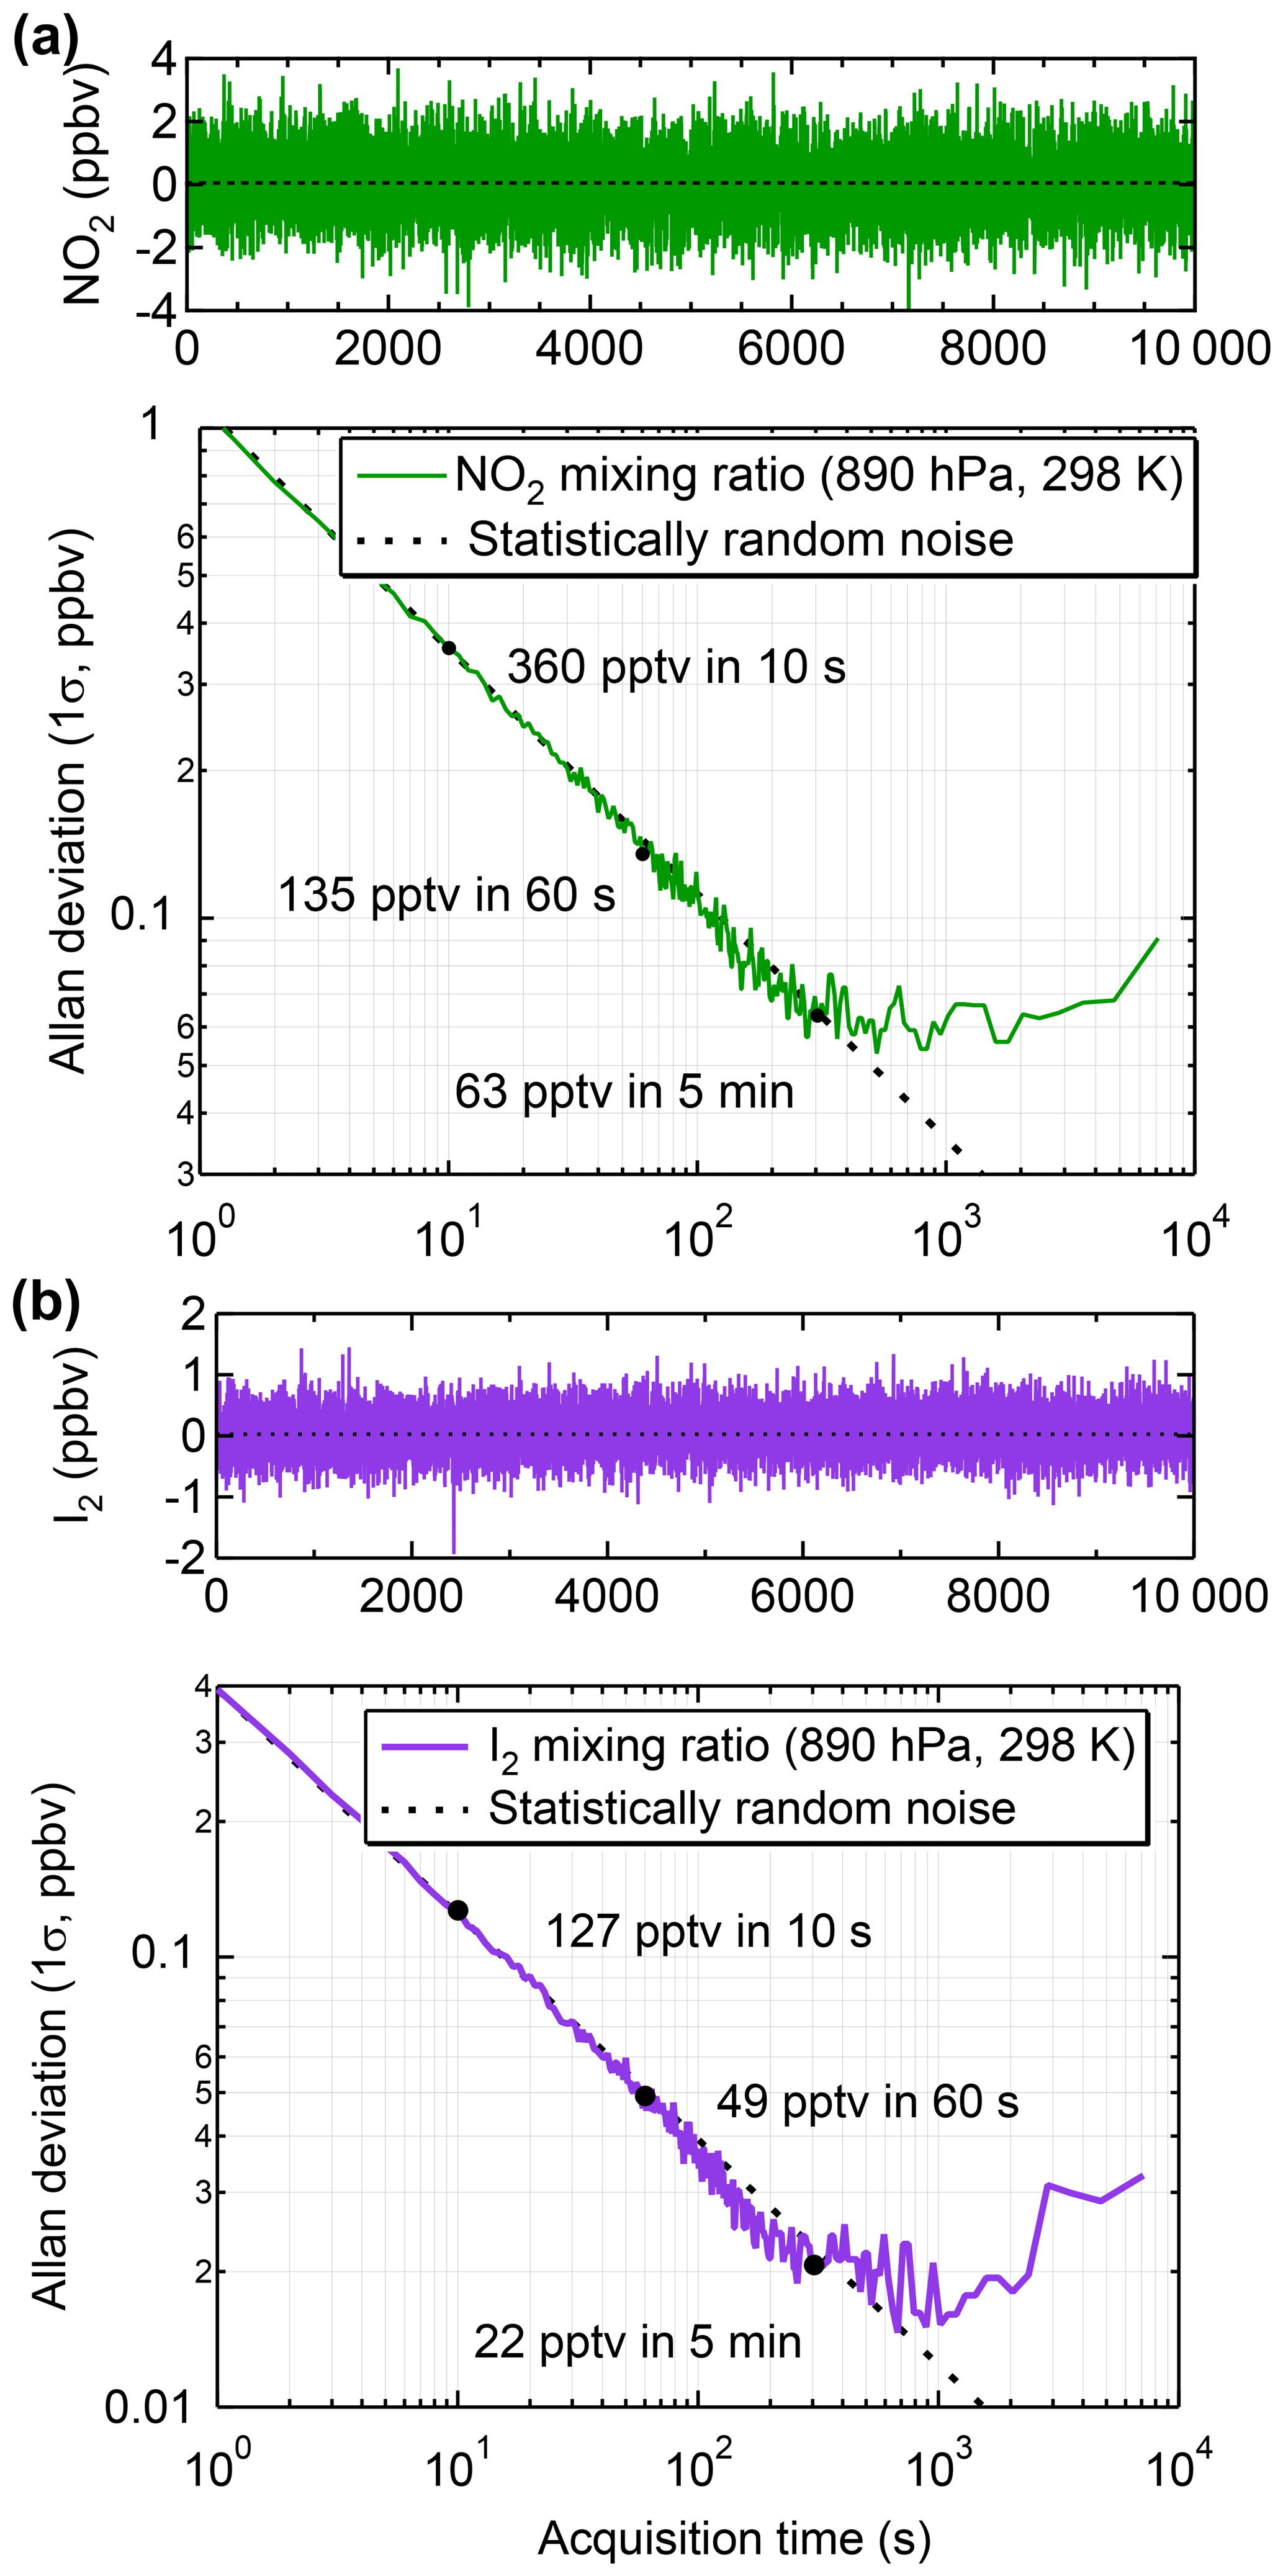
Figure 8Allan deviation plots of data collected while the IBBCEAS was sampling zero air to determine the optimum integration time of (a) the calculated NO2 mixing ratios at 890 hPa (1.5 slpm sample rate) and 298 K and (b) the calculated I2 mixing ratios under the same conditions.
The limit of detection (LOD) values were assessed through Allan deviation analyses (Werle et al., 1993). For NO2 sampled at a flow of 1.5 slpm and cell pressure of 890 hPa, the Allan deviation was ±360 pptv for 10 s data, ±135 pptv for 60 s data, and ±63 pptv for 5 min data averages (Fig. 8a). At the higher sample flow of 5 slpm and reduced cell pressure of 466 hPa used during the ORCA campaign, the Allan deviation was ±164 pptv for 334 s data (Fig. S8).
For I2 in laboratory-generated samples, typical 1σ fit errors for 60 s averaged data were ±7 pptv when 21 pptv I2 was sampled and ±9 pptv when 544 pptv I2 was sampled (Fig. S6). The accuracy of I2 data is, in principle, of similar magnitude to that of the NO2 data, except that it also depends on knowledge of inlet transmission efficiency, which was not assessed in this work. The Allan deviation plot in Fig. 8b demonstrates 1σ measurement precisions for I2 of ±49 pptv for 60 s and ±22 pptv for 5 min averaged data. During ORCA, the 1σ precisions were ±120 pptv for 60 s and ±60 pptv for 5 min data, respectively.
For OIO, the Allan deviation analysis gives 1σ measurement precisions of ±5.7 pptv for 60 s and ±2.3 pptv for 5 min averaged data (Fig. S9b) in the laboratory.
Table 2Selected CEAS detectors for quantification of NO2 in the near-UV and visible region of the electromagnetic spectrum. NA stands for not available.
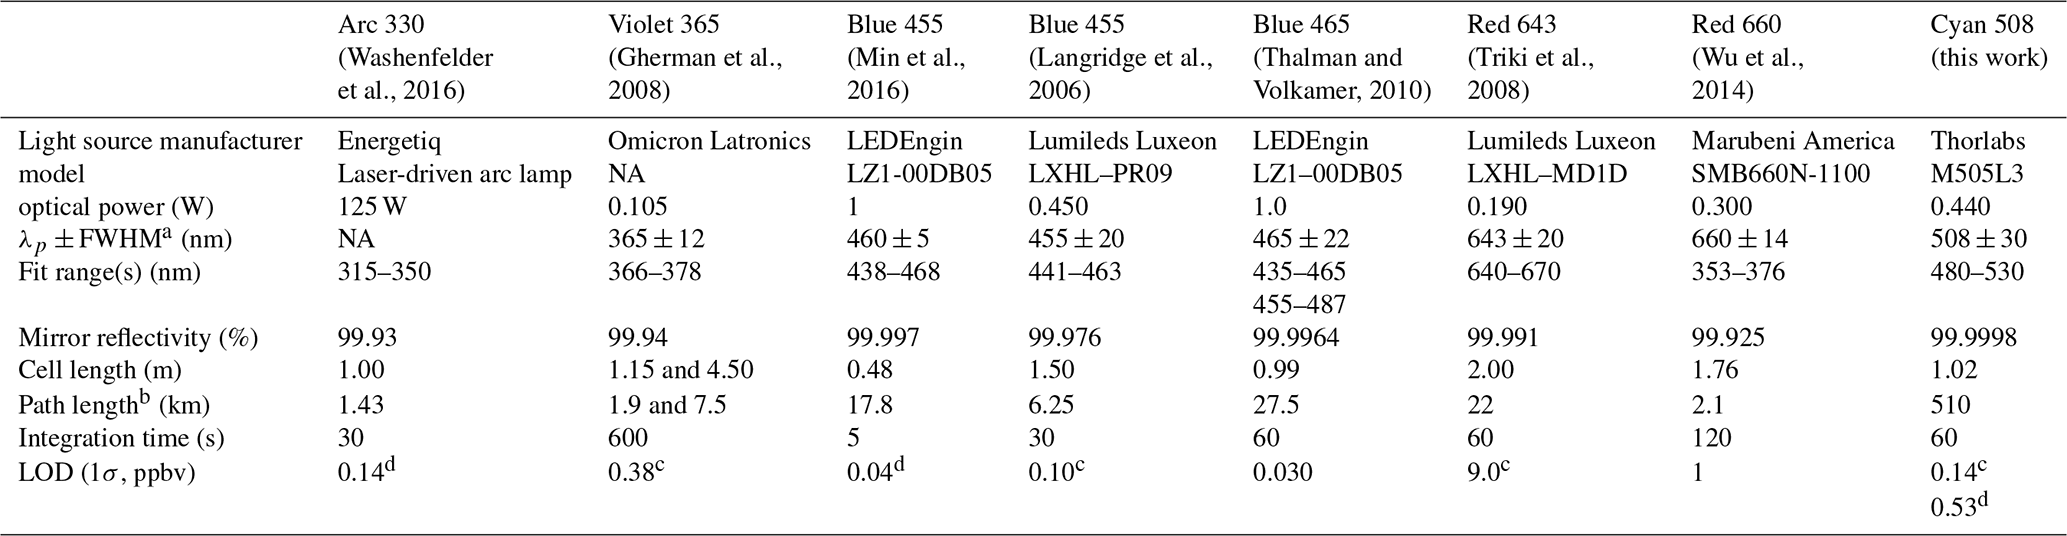
a Peak wavelength + full-width at half maximum. b Effective path length, . c Laboratory sample. d field samples.
The IBBCEAS instrument described in this work adds to a growing number of instruments designed for the measurement of atmospheric trace gases (Table 2). It differentiates itself foremost through its wavelength region, where several trace gases of atmospheric interest (e.g., NO2, I2, IO, and OIO) absorb (Fig. 1). Measurements of optical absorption in the cyan region enable simultaneous quantification of I2, and, potentially, IO and OIO in a single channel. Currently, such measurements require multiple detection channels, for example the quantification of I2 and OIO mixing ratios using the 525–555 nm range and those of IO using the 420–460 nm window in a separate channel (Vaughan et al., 2008). A reduction of channels and LEDs corresponds to savings in space and power requirements, important considerations in the field.
As such, this paper has laid some of the ground work for future measurements in the cyan spectral region, in that we measured relevant scattering and absorption cross sections of pure gases (see Supplement). Such information is needed to determine mirror reflectivity and is useful to probe the consistency of scattering cross sections reported for this wavelength region (of which there have been relatively few) and, hopefully, improve upon their accuracy, to better describe transmission of radiation through the atmosphere.
Scattering cross section measurements for non-absorbing gases agree with recent literature values (Fig. 4 and Table 1). For example, the IBBCEAS scattering cross section measurements agree, within the combined experimental uncertainties (1σ), with the CRDS data by Sneep and Ubachs (2005) at 532.2 nm for N2, Ar, CO2, and CH4, and with the nephelometer measurements of Shardanand and Rao (1977) at 488.0 and 514.5 nm for N2, Ar, O2, and CH4. For CO2, the IBBCEAS data closely match the data by Bideau-Mehu et al. (1973) and recent data by He et al. (2018); the older data by Shardanand and Rao (1977), in contrast, appear high (Fig. 4e).
In the case of CH4, to a lesser extent, O2 and air, the analysis is complicated by absorption lines. For O2, our data and derived collisional-induced absorption cross sections agree with literature (Table S1). For regions that appear to be free of absorption bands, the IBBCEAS data for CH4 (Fig. 4f) agree with cross section measurements of Shardanand and Rao (1977) but not with the more recent work of Hohm (1993) whose data appear high. The CRDS data point by Sneep and Ubachs (2005) is on a shoulder of a large absorption band and hence not a valid measurement of scattering but rather of the extinction cross section; their data agree with the extinction cross section observed in this work. Accurate knowledge of the scattering cross section of CH4 is important in the study of planetary bodies with atmospheric content of CH4 such as Saturn's moon Titan. Future studies should re-examine the scattering cross section measurements of CH4 to resolve the reported differences.
The detection limit for NO2 achieved under laboratory conditions in this work (63 pptv for 5 min data) is of similar magnitude as those by instruments operated in other wavelength regions (Table 2). However, the IBBCEAS measurement precision in this work was surpassed by the more mature blue diode CRDS, though future upgrades (see below) may improve the IBBCEAS precision. On the other hand, the IBBCEAS may ultimately be more accurate. Unlike IBBCEAS, for which all absorbing molecules are incorporated in the fit, the measurement of NO2 by blue diode laser CRDS is prone to potential interference from molecules that absorb at 405 nm, such as glyoxal and methyl glyoxal (Fuchs et al., 2009). For example, Fuchs et al. (2009) estimated that the presence of glyoxal could introduce an interference of ∼1 % in polluted and up to 10 % in forested environments. The low precision of the data in the scatter plot shown in Fig. 7c prevents us from drawing a definitive conclusion as to the magnitude of such interferences. Still, future comparisons of IBBCEAS and blue diode CRDS measurements of ambient NO2 should be conducted. The data presented in this paper show that accurate measurements of NO2 in ambient air by a cyan IBBCEAS are possible.
An important parameter in any IBBCEAS measurement is the effective cavity length. Duan et al. (2018) recently summarized past practices in its determination and found that these practices vary considerably between groups. In this work, the necessary correction (RL=1.28 at 2.0 slpm sample flow rate) differed substantially from the physical dimension of the cell (1.39), underlining its importance for accurate measurements. However, it is unclear to what extent RL varies between molecules, which will need to be investigated. To improve the accuracy of future measurements, we will deploy more frequent zeroing and verify RL periodically, for example by periodic sampling of molecular oxygen and measuring O4 concentration.
The sensitivity for I2 and OIO (22 and 2.3 pptv for 5 min averaged data under laboratory conditions) suffices for their quantification in environmental chamber studies (Dixneuf et al., 2009). Further, these LOD values are below maximum I2 and OIO abundances reported at Mace Head, Ireland, of 94 and 13 pptv (Bitter et al., 2005) and 61 and 9.2 pptv (Peters et al., 2005), respectively, but above the maximum I2 level of 4 pptv reported in California (Finley and Saltzman, 2008). This implies that iodine species on the west coast of British Columbia, Canada, might have been detected if the instrument had been operated optimally. Even then, the LOD for I2 of ∼100 pptv (2σ, 60 s average) is larger than the LOD of 26 pptv (2σ, 60 s average) reported by Vaughan et al. (2008). This suggests that improvements are possible.
One area for improvement is the thermal management of the LED. Its intensity and wavelength drift with temperature, necessitating temperature stabilization to achieve a constant emission profile. In this work, the cyan LED was stabilized by mounting a single Peltier thermoelectric module and thermocouple between the heat sink and the LED. When evaluated in the climate-controlled laboratory, this yielded a cavity emission profile that varied along the entire wavelength range (446.9–563.2 nm) of the spectrometer by ±15 counts (Fig. S10). At 500 nm, this corresponded to an absorption coefficient of cm−1. During the field deployment, however, the LED was subjected to greater output fluctuations, since the trailer temperature was not as well controlled as in the laboratory, and thermal gradients between the LED and thermocouple may have come into play.
When deployed in the field, the performance of the IBBCEAS instrument was also compromised by variable cell pressure which added noise to the optical extinction, caused in part by the large pressure drop from ∼1013 to ∼467 hPa. Furthermore, we discovered post-campaign that the alignment of the round-to-linear fibre bundle is very sensitive to vibrations, which would have added additional noise during the field campaign. In future deployments, improved pressure, temperature, and vibrational stabilization of the sample cell (as is common in aircraft deployments, for example) and instrument will be paramount.
The data used in this study are available from the corresponding author upon request (hosthoff@ucalgary.ca).
The supplement related to this article is available online at: https://doi.org/10.5194/amt-12-1277-2019-supplement.
NJ and HDO designed the experiments and carried them out. CZY collected and reduced the CRDS data used in this work. SG built an early version of the CEAS. RAW and SSB provided data acquisition software and advice on the use of DOASIS. NJ and HDO prepared the manuscript with inputs from RAW and SSB.
The authors declare that they have no conflict of interest.
This work was made possible by financial support from the Natural Science
and Engineering Research Council of Canada (NSERC) in the form of a
Discovery Grant and from the Canadian Foundation for Innovation (CFI) in the form
of a LOF grant and by the Government of Alberta's Advanced Education and
Technology (AET) Small Equipment Grants Program (SEGP). The authors thank
the Birrs and Thurbide groups at the University of Calgary for loans of
CH4 and CO2 compressed gas cylinders used in this work.
Edited by: Mingjin Tang
Reviewed by: two anonymous referees
Atkinson, R., Baulch, D. L., Cox, R. A., Crowley, J. N., Hampson, R. F., Hynes, R. G., Jenkin, M. E., Rossi, M. J., and Troe, J.: Evaluated kinetic and photochemical data for atmospheric chemistry: Volume I – gas phase reactions of Ox, HOx, NOx and SOx species, Atmos. Chem. Phys., 4, 1461–1738, https://doi.org/10.5194/acp-4-1461-2004, 2004.
Axson, J. L., Washenfelder, R. A., Kahan, T. F., Young, C. J., Vaida, V., and Brown, S. S.: Absolute ozone absorption cross section in the Huggins Chappuis minimum (350–470 nm) at 296 K, Atmos. Chem. Phys., 11, 11581–11590, https://doi.org/10.5194/acp-11-11581-2011, 2011.
Bahrini, C., Grégoire, A.-C., Obada, D., Mun, C., and Fittschen, C.: Incoherent broad-band cavity enhanced absorption spectroscopy for sensitive and rapid molecular iodine detection in the presence of aerosols and water vapour, Opt. Laser Technol., 108, 466–479, https://doi.org/10.1016/j.optlastec.2018.06.050, 2018.
Ball, S. M., Hollingsworth, A. M., Humbles, J., Leblanc, C., Potin, P., and McFiggans, G.: Spectroscopic studies of molecular iodine emitted into the gas phase by seaweed, Atmos. Chem. Phys., 10, 6237–6254, https://doi.org/10.5194/acp-10-6237-2010, 2010.
Bates, D. R.: Rayleigh scattering by air, Planet. Space Sci., 32, 785–790, https://doi.org/10.1016/0032-0633(84)90102-8, 1984.
Bideau-Mehu, A., Guern, Y., Abjean, R., and Johannin-Gilles, A.: Interferometric determination of the refractive index of carbon dioxide in the ultraviolet region, Opt. Commun., 9, 432–434, https://doi.org/10.1016/0030-4018(73)90289-7, 1973.
Bitter, M., Ball, S. M., Povey, I. M., and Jones, R. L.: A broadband cavity ringdown spectrometer for in-situ measurements of atmospheric trace gases, Atmos. Chem. Phys., 5, 2547–2560, https://doi.org/10.5194/acp-5-2547-2005, 2005.
Bluvshtein, N., Flores, J. M., Riziq, A. A., and Rudich, Y.: An Approach for Faster Retrieval of Aerosols' Complex Refractive Index Using Cavity Ring-Down Spectroscopy, Aerosol Sci. Tech., 46, 1140–1150, https://doi.org/10.1080/02786826.2012.700141, 2012.
Bodhaine, B. A., Wood, N. B., Dutton, E. G., and Slusser, J. R.: On Rayleigh optical depth calculations, J. Atmos. Ocean. Tech., 16, 1854–1861, https://doi.org/10.1175/1520-0426(1999)016<1854:ORODC>2.0.CO;2, 1999.
Burkholder, J. B. and Talukdar, R. K.: Temperature-Dependence of the Ozone Absorption-Spectrum over the Wavelength Range 410 to 760 nm, Geophys. Res. Lett., 21, 581–584, https://doi.org/10.1029/93GL02311, 1994.
Chen, J. and Venables, D. S.: A broadband optical cavity spectrometer for measuring weak near-ultraviolet absorption spectra of gases, Atmos. Meas. Tech., 4, 425–436, https://doi.org/10.5194/amt-4-425-2011, 2011.
Coburn, S., Ortega, I., Thalman, R., Blomquist, B., Fairall, C. W., and Volkamer, R.: Measurements of diurnal variations and eddy covariance (EC) fluxes of glyoxal in the tropical marine boundary layer: description of the Fast LED-CE-DOAS instrument, Atmos. Meas. Tech., 7, 3579–3595, https://doi.org/10.5194/amt-7-3579-2014, 2014.
Coheur, P. F., Fally, S., Carleer, M., Clerbaux, C., Colin, R., Jenouvrier, A., Merienne, M. F., Hermans, C., and Vandaele, A. C.: New water vapor line parameters in the 26000–13000 cm−1 region, J. Quant. Spectrosc. Ra., 74, 493–510, https://doi.org/10.1016/S0022-4073(01)00269-2, 2002.
Cuthbertson, C. and Cuthbertson, M.: The refraction and dispersion of neon and helium, Philos. T. Roy. Soc. A, 135, 40–47, https://doi.org/10.1098/rspa.1932.0019, 1932.
Dixneuf, S., Ruth, A. A., Vaughan, S., Varma, R. M., and Orphal, J.: The time dependence of molecular iodine emission from Laminaria digitata, Atmos. Chem. Phys., 9, 823–829, https://doi.org/10.5194/acp-9-823-2009, 2009.
Duan, J., Qin, M., Ouyang, B., Fang, W., Li, X., Lu, K., Tang, K., Liang, S., Meng, F., Hu, Z., Xie, P., Liu, W., and Häsler, R.: Development of an incoherent broadband cavity-enhanced absorption spectrometer for in situ measurements of HONO and NO2, Atmos. Meas. Tech., 11, 4531–4543, https://doi.org/10.5194/amt-11-4531-2018, 2018.
Everest, M. A. and Atkinson, D. B.: Discrete sums for the rapid determination of exponential decay constants, Rev. Sci. Instrum., 79, 023108–023109, https://doi.org/10.1063/1.2839918, 2008.
Fiedler, S. E., Hese, A., and Ruth, A. A.: Incoherent broad-band cavity-enhanced absorption spectroscopy, Chem. Phys. Lett., 371, 284–294, https://doi.org/10.1016/s0009-2614(03)00263-x, 2003.
Finley, B. D. and Saltzman, E. S.: Observations of Cl2, Br2, and I2 in coastal marine air, J. Geophys. Res., 113, D21301, https://doi.org/10.1029/2008jd010269, 2008.
Fuchs, H., Dubé, W. P., Lerner, B. M., Wagner, N. L., Williams, E. J., and Brown, S. S.: A Sensitive and Versatile Detector for Atmospheric NO2 and NOx Based on Blue Diode Laser Cavity Ring-Down Spectroscopy, Environ. Sci. Technol., 43, 7831–7836, https://doi.org/10.1021/es902067h, 2009.
Gagliardi, G. and Loock, H.-P.: Cavity-Enhanced Spectroscopy and Sensing, 1 ed., Springer Series in Optical Sciences, 179, Springer, Berlin, Heidelberg, https://doi.org/10.1007/978-3-642-40003-2, 2014.
Gherman, T., Venables, D. S., Vaughan, S., Orphal, J., and Ruth, A. A.: Incoherent broadband cavity-enhanced absorption spectroscopy in the near-ultraviolet: Application to HONO and NO2, Environ. Sci. Technol., 42, 890–895, https://doi.org/10.1021/es0716913, 2008.
Giver, L. P.: Intensity measurements of the CH4 bands in the region 4350 Å to 10,600 Å, J. Quant. Spectrosc. Ra., 19, 311–322, https://doi.org/10.1016/0022-4073(78)90064-X, 1978.
He, Q., Bluvshtein, N., Segev, L., Meidan, D., Flores, J. M., Brown, S. S., Brune, W., and Rudich, Y.: Evolution of the Complex Refractive Index of Secondary Organic Aerosols during Atmospheric Aging, Environ. Sci. Technol., 52, 3456–3465, https://doi.org/10.1021/acs.est.7b05742, 2018.
Hoch, D. J., Buxmann, J., Sihler, H., Pöhler, D., Zetzsch, C., and Platt, U.: An instrument for measurements of BrO with LED-based Cavity-Enhanced Differential Optical Absorption Spectroscopy, Atmos. Meas. Tech., 7, 199–214, https://doi.org/10.5194/amt-7-199-2014, 2014.
Hohm, U.: Experimental determination of the dispersion in the main linear dipole polarizability α(ω) of small hydrocarbons and evaluation of Cauchy moments between 325 nm and 633 nm, Mol. Phys., 78, 929–941, https://doi.org/10.1080/00268979300100621, 1993.
Kahan, T. F., Washenfelder, R. A., Vaida, V., and Brown, S. S.: Cavity-Enhanced Measurements of Hydrogen Peroxide Absorption Cross Sections from 353 to 410 nm, J. Phys. Chem. A, 116, 5941–5947, https://doi.org/10.1021/jp2104616, 2012.
Karkoschka, E.: Spectrophotometry of the Jovian Planets and Titan at 300- to 1000-nm Wavelength: The Methane Spectrum, Icarus, 111, 174–192, https://doi.org/10.1006/icar.1994.1139, 1994.
Keller-Rudek, H., Moortgat, G. K., Sander, R., and Sörensen, R.: The MPI-Mainz UV/VIS Spectral Atlas of Gaseous Molecules of Atmospheric Interest, Earth Syst. Sci. Data, 5, 365–373, https://doi.org/10.5194/essd-5-365-2013, 2013.
King, L. V.: On the complex anisotropic molecule in relation to the dispersion and scattering of light, Philos. T. Roy. Soc. A, 104, 333–357, https://doi.org/10.1098/rspa.1923.0113, 1923.
Kraus, S.: DOAS Intelligent System Version 3.2.3505, Institute of Environmental Physics, University of Heidelberg, available at: https://doasis.iup.uni-heidelberg.de/bugtracker/projects/doasis/ (last access: 31 August 2018), 2003.
Knight, G., Ravishankara, A. R., and Burkholder, J. B.: Laboratory studies of OBrO, J. Phys. Chem. A, 104, 11121–11125, https://doi.org/10.1021/jp002226u, 2000.
Langridge, J. M., Ball, S. M., and Jones, R. L.: A compact broadband cavity enhanced absorption spectrometer for detection of atmospheric NO2 using light emitting diodes, Analyst, 131, 916–922, https://doi.org/10.1039/B605636A, 2006.
Langridge, J. M., Ball, S. M., Shillings, A. J. L., and Jones, R. L.: A broadband absorption spectrometer using light emitting diodes for ultrasensitive, in situ trace gas detection, Rev. Sci. Instrum., 79, 123110, https://doi.org/10.1063/1.3046282, 2008.
McKendry, I. G., Christensen, E., Schiller, C., Vingarzan, R., Macdonald, A. M., and Li, Y.: Low Ozone Episodes at Amphitrite Point Marine Boundary Layer Observatory, British Columbia, Canada, Atmos.-Ocean, 52, 271–280, https://doi.org/10.1080/07055900.2014.910164, 2014.
Meinen, J., Thieser, J., Platt, U., and Leisner, T.: Technical Note: Using a high finesse optical resonator to provide a long light path for differential optical absorption spectroscopy: CE-DOAS, Atmos. Chem. Phys., 10, 3901–3914, https://doi.org/10.5194/acp-10-3901-2010, 2010.
Min, K.-E., Washenfelder, R. A., Dubé, W. P., Langford, A. O., Edwards, P. M., Zarzana, K. J., Stutz, J., Lu, K., Rohrer, F., Zhang, Y., and Brown, S. S.: A broadband cavity enhanced absorption spectrometer for aircraft measurements of glyoxal, methylglyoxal, nitrous acid, nitrogen dioxide, and water vapor, Atmos. Meas. Tech., 9, 423–440, https://doi.org/10.5194/amt-9-423-2016, 2016.
Naus, H. and Ubachs, W.: Experimental verification of Rayleigh scattering cross sections, Opt. Lett., 25, 347–349, https://doi.org/10.1364/ol.25.000347, 2000.
Nitschke, U., Ruth, A. A., Dixneuf, S., and Stengel, D. B.: Molecular iodine emission rates and photosynthetic performance of different thallus parts of Laminaria digitata (Phaeophyceae) during emersion, Planta, 233, 737–748, https://doi.org/10.1007/s00425-010-1334-3, 2011.
Nitschke, U., Dixneuf, S., Schmid, M., Ruth, A. A., and Stengel, D. B.: Contribution of living and degrading kelp to coastal iodine fluxes, Mar. Biol., 162, 1727–1738, https://doi.org/10.1007/s00227-015-2699-4, 2015.
Odame-Ankrah, C. A.: Improved detection instrument for nitrogen oxide species, PhD, Chemistry, University of Calgary, https://doi.org/10.5072/PRISM/26475, Calgary, 2015.
Osthoff, H. D., Odame-Ankrah, C. A., Taha, Y. M., Tokarek, T. W., Schiller, C. L., Haga, D., Jones, K., and Vingarzan, R.: Low levels of nitryl chloride at ground level: nocturnal nitrogen oxides in the Lower Fraser Valley of British Columbia, Atmos. Chem. Phys., 18, 6293–6315, https://doi.org/10.5194/acp-18-6293-2018, 2018.
Paul, D. and Osthoff, H. D.: Absolute Measurements of Total Peroxy Nitrate Mixing Ratios by Thermal Dissociation Blue Diode Laser Cavity Ring-Down Spectroscopy, Anal. Chem., 82, 6695–6703, https://doi.org/10.1021/ac101441z, 2010.
Peck, E. R. and Fisher, D. J.: Dispersion of argon, J. Opt. Soc. Am., 54, 1362–1364, https://doi.org/10.1364/josa.54.001362, 1964.
Peck, E. R. and Khanna, B. N.: Dispersion of nitrogen, J. Opt. Soc. Am., 56, 1059–1063, https://doi.org/10.1364/josa.56.001059, 1966.
Penndorf, R.: Tables fo the refractive index for standard air and the Rayleigh scattering coefficient for the spectral region between 0.2 and 20.0 mu and their application to atmospheric optics, J. Opt. Soc. Am., 47, 176–182, https://doi.org/10.1364/josa.47.000176, 1957.
Peters, C., Pechtl, S., Stutz, J., Hebestreit, K., Hönninger, G., Heumann, K. G., Schwarz, A., Winterlik, J., and Platt, U.: Reactive and organic halogen species in three different European coastal environments, Atmos. Chem. Phys., 5, 3357–3375, https://doi.org/10.5194/acp-5-3357-2005, 2005.
Saiz-Lopez, A., Plane, J. M. C., Baker, A. R., Carpenter, L. J., von Glasow, R., Gómez Martín, J. C., McFiggans, G., and Saunders, R. W.: Atmospheric Chemistry of Iodine, Chem. Rev., 112, 1773–1804, https://doi.org/10.1021/cr200029u, 2012.
Savitzky, A. and Golay, M. J. E.: Smoothing and Differentiation of Data by Simplified Least Squares Procedures, Anal. Chem., 36, 1627–1639, https://doi.org/10.1021/ac60214a047, 1964.
Schuster, G., Labazan, I., and Crowley, J. N.: A cavity ring down/cavity enhanced absorption device for measurement of ambient NO3 and N2O5, Atmos. Meas. Tech., 2, 1–13, https://doi.org/10.5194/amt-2-1-2009, 2009.
Shardanand and Rao, A. D. P.: Absolute Rayleigh scattering cross sections of gases and freons of stratospheric interest in the visible and ultraviolet regions, NASA TN D-8442, 1977.
Sneep, M. and Ubachs, W.: Direct measurement of the Rayleigh scattering cross section in various gases, J. Quant. Spectrosc. Ra., 92, 293–310, https://doi.org/10.1016/j.jqsrt.2004.07.025, 2005.
Sneep, M., Ityaksov, D., Aben, I., Linnartz, H., and Ubachs, W.: Temperature-dependent cross sections of O2-O2 collision-induced absorption resonances at 477 and 577 nm, J. Quant. Spectrosc. Ra., 98, 405–424, https://doi.org/10.1016/j.jqsrt.2005.06.004, 2006.
Spietz, P., Gómez Martín, J. C., and Burrows, J. P.: Spectroscopic studies of the I2∕O3 photochemistry: Part 2. Improved spectra of iodine oxides and analysis of the IO absorption spectrum, J. Photoch. Photobio. A, 176, 50–67, https://doi.org/10.1016/j.jphotochem.2005.08.023, 2005.
Spietz, P., Gómez Martín, J., and Burrows, J. P.: Effects of column density on I2 spectroscopy and a determination of I2 absorption cross section at 500 nm, Atmos. Chem. Phys., 6, 2177–2191, https://doi.org/10.5194/acp-6-2177-2006, 2006.
Thalman, R. and Volkamer, R.: Inherent calibration of a blue LED-CE-DOAS instrument to measure iodine oxide, glyoxal, methyl glyoxal, nitrogen dioxide, water vapour and aerosol extinction in open cavity mode, Atmos. Meas. Tech., 3, 1797–1814, https://doi.org/10.5194/amt-3-1797-2010, 2010.
Thalman, R. and Volkamer, R.: Temperature dependent absorption cross-sections of O2-O2 collision pairs between 340 and 630 nm and at atmospherically relevant pressure, Phys. Chem. Chem. Phys., 15, 15371–15381, https://doi.org/10.1039/c3cp50968k, 2013.
Thalman, R., Zarzana, K. J., Tolbert, M. A., and Volkamer, R.: Rayleigh scattering cross-section measurements of nitrogen, argon, oxygen and air, J. Quant. Spectrosc. Ra., 147, 171–177, https://doi.org/10.1016/j.jqsrt.2014.05.030, 2014.
Thalman, R., Baeza-Romero, M. T., Ball, S. M., Borrás, E., Daniels, M. J. S., Goodall, I. C. A., Henry, S. B., Karl, T., Keutsch, F. N., Kim, S., Mak, J., Monks, P. S., Muñoz, A., Orlando, J., Peppe, S., Rickard, A. R., Ródenas, M., Sánchez, P., Seco, R., Su, L., Tyndall, G., Vázquez, M., Vera, T., Waxman, E., and Volkamer, R.: Instrument intercomparison of glyoxal, methyl glyoxal and NO2 under simulated atmospheric conditions, Atmos. Meas. Tech., 8, 1835–1862, https://doi.org/10.5194/amt-8-1835-2015, 2015.
Tokarek, T. W., Huo, J. A., Odame-Ankrah, C. A., Hammoud, D., Taha, Y. M., and Osthoff, H. D.: A gas chromatograph for quantification of peroxycarboxylic nitric anhydrides calibrated by thermal dissociation cavity ring-down spectroscopy, Atmos. Meas. Tech., 7, 3263–3283, https://doi.org/10.5194/amt-7-3263-2014, 2014.
Tokarek, T. W., Brownsey, D. K., Jordan, N., Garner, N. M., Ye, C. Z., Assad, F. V., Peace, A., Schiller, C. L., Mason, R. H., Vingarzan, R., and Osthoff, H. D.: Biogenic emissions and nocturnal ozone depletion events at the Amphitrite Point Observatory on Vancouver Island, Atmos.-Ocean, 55, 121–132, https://doi.org/10.1080/07055900.2017.1306687, 2017.
Triki, M., Cermak, P., Méjean, G., and Romanini, D.: Cavity-enhanced absorption spectroscopy with a red LED source for NOx trace analysis, Appl. Phys. B: Lasers O., 91, 195–201, https://doi.org/10.1007/s00340-008-2958-x, 2008.
Varma, R. M., Venables, D. S., Ruth, A. A., Heitmann, U., Schlosser, E., and Dixneuf, S.: Long optical cavities for open-path monitoring of atmospheric trace gases and aerosol extinction, Appl. Optics, 48, B159–B171, https://doi.org/10.1364/AO.48.00B159, 2009.
Vaughan, S., Gherman, T., Ruth, A. A., and Orphal, J.: Incoherent broad-band cavity-enhanced absorption spectroscopy of the marine boundary layer species I2, IO and OIO, Phys. Chem. Chem. Phys., 10, 4471–4477, https://doi.org/10.1039/b802618a, 2008.
Venables, D. S., Gherman, T., Orphal, J., Wenger, J. C., and Ruth, A. A.: High sensitivity in situ monitoring of NO3 in an atmospheric simulation chamber using incoherent broadband cavity-enhanced absorption spectroscopy, Environ. Sci. Technol., 40, 6758–6763, https://doi.org/10.1021/es061076j, 2006.
Voigt, S., Orphal, J., and Burrows, J. P.: The temperature and pressure dependence of the absorption cross-sections of NO2 in the 250–800 nm region measured by Fourier-transform spectroscopy, J. Photoch. Photobio. A, 149, 1–7, https://doi.org/10.1016/S1010-6030(01)00650-5, 2002.
Washenfelder, R. A., Langford, A. O., Fuchs, H., and Brown, S. S.: Measurement of glyoxal using an incoherent broadband cavity enhanced absorption spectrometer, Atmos. Chem. Phys., 8, 7779–7793, https://doi.org/10.5194/acp-8-7779-2008, 2008.
Washenfelder, R. A., Flores, J. M., Brock, C. A., Brown, S. S., and Rudich, Y.: Broadband measurements of aerosol extinction in the ultraviolet spectral region, Atmos. Meas. Tech., 6, 861–877, https://doi.org/10.5194/amt-6-861-2013, 2013.
Washenfelder, R. A., Attwood, A. R., Flores, J. M., Zarzana, K. J., Rudich, Y., and Brown, S. S.: Broadband cavity-enhanced absorption spectroscopy in the ultraviolet spectral region for measurements of nitrogen dioxide and formaldehyde, Atmos. Meas. Tech., 9, 41–52, https://doi.org/10.5194/amt-9-41-2016, 2016.
Watson, J. and Estes, J. A.: Stability, resilience, and phase shifts in rocky subtidal communities along the west coast of Vancouver Island, Canada, Ecol. Monogr., 81, 215–239, https://doi.org/10.1890/10-0262.1, 2011.
Werle, P., Mucke, R., and Slemr, F.: The Limits of Signal Averaging in Atmospheric Trace-Gas Monitoring by Tunable Diode-Laser Absorption-Spectroscopy (TDLAS), Appl. Phys. B-Photo., 57, 131–139, https://doi.org/10.1007/BF00425997, 1993.
Wu, T., Zha, Q., Chen, W., Xu, Z., Wang, T., and He, X.: Development and deployment of a cavity enhanced UV-LED spectrometer for measurements of atmospheric HONO and NO2 in Hong Kong, Atmos. Environ., 95, 544–551, https://doi.org/10.1016/j.atmosenv.2014.07.016, 2014.