the Creative Commons Attribution 4.0 License.
the Creative Commons Attribution 4.0 License.
Advancements in the Aerosol Robotic Network (AERONET) Version 3 database – automated near-real-time quality control algorithm with improved cloud screening for Sun photometer aerosol optical depth (AOD) measurements
Alexander Sinyuk
Mikhail G. Sorokin
Joel S. Schafer
Alexander Smirnov
Ilya Slutsker
Thomas F. Eck
Brent N. Holben
Jasper R. Lewis
James R. Campbell
Ellsworth J. Welton
Sergey V. Korkin
Alexei I. Lyapustin
The Aerosol Robotic Network (AERONET) has provided highly accurate, ground-truth measurements of the aerosol optical depth (AOD) using Cimel Electronique Sun–sky radiometers for more than 25 years. In Version 2 (V2) of the AERONET database, the near-real-time AOD was semiautomatically quality controlled utilizing mainly cloud-screening methodology, while additional AOD data contaminated by clouds or affected by instrument anomalies were removed manually before attaining quality-assured status (Level 2.0). The large growth in the number of AERONET sites over the past 25 years resulted in significant burden to the manual quality control of millions of measurements in a consistent manner. The AERONET Version 3 (V3) algorithm provides fully automatic cloud screening and instrument anomaly quality controls. All of these new algorithm updates apply to near-real-time data as well as post-field-deployment processed data, and AERONET reprocessed the database in 2018. A full algorithm redevelopment provided the opportunity to improve data inputs and corrections such as unique filter-specific temperature characterizations for all visible and near-infrared wavelengths, updated gaseous and water vapor absorption coefficients, and ancillary data sets. The Level 2.0 AOD quality-assured data set is now available within a month after post-field calibration, reducing the lag time from up to several months. Near-real-time estimated uncertainty is determined using data qualified as V3 Level 2.0 AOD and considering the difference between the AOD computed with the pre-field calibration and AOD computed with pre-field and post-field calibration. This assessment provides a near-real-time uncertainty estimate for which average differences of AOD suggest a +0.02 bias and one sigma uncertainty of 0.02, spectrally, but the bias and uncertainty can be significantly larger for specific instrument deployments. Long-term monthly averages analyzed for the entire V3 and V2 databases produced average differences (V3–V2) of +0.002 with a ±0.02 SD (standard deviation), yet monthly averages calculated using time-matched observations in both databases were analyzed to compute an average difference of −0.002 with a ±0.004 SD. The high statistical agreement in multiyear monthly averaged AOD validates the advanced automatic data quality control algorithms and suggests that migrating research to the V3 database will corroborate most V2 research conclusions and likely lead to more accurate results in some cases.
- Article
(9624 KB) - Full-text XML
- BibTeX
- EndNote
Space-based, airborne, and surface-based Earth observing platforms can remotely retrieve or measure aerosol abundance. Each method has its own assumptions and dependencies in which the aerosol total column abundance quantified by aerosol optical depth (AOD) introduces uncertainty in the retrieval or measurement. At the forefront, ground-based Sun photometry has been considered the ground truth in the measurement of AOD given minimal assumptions, reliable calibration, and weak dependency on trace gases at carefully selected wavelength bands, thus resulting in highly accurate data (Holben et al., 1998, 2001). Meanwhile, AOD inferred from other observing platforms such as satellite retrievals provides quantitative AOD but with significantly higher uncertainty (Remer et al., 2005; Li et al., 2009; Levy et al., 2010; Sayer et al., 2013). Further, in situ measurements lack the ability to provide a reliable columnar AOD due to the requirement of measuring aerosols vertically in each layer while not perturbing or modifying the particle properties during the measurement (Redemann et al., 2003; Andrews et al., 2017). Lidar is fundamental in the determination of the vertical aerosol extinction distribution (Welton et al., 2000; Omar et al., 2013). Quantification of columnar AOD from ground-based lidar, for example, may be less reliable due to low signal-to-noise ratio during the daylight hours at high altitudes and below the overlap region in which the aerosols very near the surface are poorly observed by lidar. Satellite retrieval issues include determining the AOD for very high aerosol loading episodes, cloud adjacency effects, land–water mask depiction, surface reflectance, highly varying topography, and aerosol type assumptions (Levy et al., 2010, 2013; Omar et al., 2013). With each of these measurement platforms, uncertainties exist with AOD; however, these concerns are minimized with AOD measurements from surface-based Sun photometry such as from the federated Aerosol Robotic Network (AERONET). Ground-based Sun photometry, a passive remote-sensing technique, is robust in measuring collimated direct sunlight routinely during the daytime in mainly cloud-free conditions (Shaw, 1983; Holben et al., 1998; Takamura and Nakajima, 2004; Smirnov et al., 2009; Kazadzis et al., 2018). While these surface-based measurements are only point measurements, the federated AERONET provides measurements of columnar AOD and aerosol characteristics over an expansive and diverse geographic area of the Earth's surface at high temporal resolution.
Standardization of Sun photometer instrumentation, calibration, and freely available data dissemination of AOD and related aerosol databases highlights the success of the federated AERONET. For more than 25 years, the AERONET federation has expanded due to the investments and efforts of NASA (Goddard Space Flight Center, GSFC) (Holben et al., 1998), the University of Lille (PHOtométrie pour le Traitement Opérationnel de Normalisation Satellitaire – PHOTONS) (Goloub et al., 2008), University of Valladolid (Red Ibérica de medida Fotométrica de Aerosoles – RIMA) (Toledano et al., 2011), other subnetworks (e.g., AEROCAN, Bokoye et al., 2001; AeroSpan, Mitchell et al., 2017; AeroSibnet, Sakerin et al., 2005; CARSNET, Che et al., 2015), collaborators at agencies, institutes, and universities, and individual scientists worldwide. Conceived in the late 1980s, AERONET's primary objective was to provide an aerosol database for validation of Earth Observing System (EOS) satellite retrievals of AOD and atmospheric correction (Kaufman and Tanré, 1996). In addition to columnar direct Sun AOD, sky radiances were used to infer aerosol characteristics initially from Nakajima et al. (1996) (SkyRad.PAK) and later by the Dubovik and King (2000) inversion algorithm to obtain products such as aerosol volume size distribution, complex index of refraction, single scattering albedo, and phase functions.
AERONET is a network of autonomously operated Cimel Electronique Sun–sky photometers used to measure Sun collimated direct beam irradiance and directional sky radiance and provide scientific-quality column-integrated aerosol properties of AOD and aerosol microphysical and radiative properties (Holben et al., 1998; https://aeronet.gsfc.nasa.gov, last access: 12 December 2018). The development and growth of the program relies on imposing standardization of instrumentation, measurement protocols, calibration, data distribution, and processing algorithms derived from the best scientific knowledge available. This instrument network design has led to a growth from two instruments in 1993 to over 600 in 2018. During that time, improvements were made to the Cimel instruments to provide weather-hardy, robust measurements in a variety of extreme conditions. While the basic optical technology has evolved progressively from analog to digital processing over the past 25 years, the most recent Sun–sky–lunar CE318-T instruments provide a number of new capabilities in measurement protocols, integrity, and customizability (Barreto et al., 2016).
All of the slightly varying models of the Cimel instruments can have measurement anomalies affecting direct Sun measurements, which include measurements in the presence of clouds, various obstructions in the instrument's field of view, or systematic instrumental issues such as electrical connections, high dark currents, and clock shifts to name a few. Some of these issues depend on the instrument model and, for more than a decade, these anomalies have been removed semiautomatically utilizing the cloud-screening method developed by Smirnov et al. (2000) and further quality controlled by an analyst to remove additional cloud-contaminated data and instrument artifacts from the database. Chew et al. (2011) identified up to 0.03 of AOD bias at Singapore due to optically thin cirrus clouds for Version 2 Level 2.0 data. Coincidentally, Huang et al. (2011) examined how cirrus clouds could contaminate AOD measurements in up to 25 % (on average) of the data in April at Phimai, Thailand, in the Version 2 Level 2.0 data set. The number of AERONET sites has increased to more than 600 sites in the network as of 2018 and the labor-intensive effort of quality controlling hundreds of thousands of measurements manually had resulted in a significant delay of quality-assured data (Level 2.0) in the AERONET Version 2 database.
With these issues at hand, the cloud-screening quality control procedure as well as all other aspects of the AERONET processing algorithm including instrument temperature characterization, ancillary data set updates, and further quality control automation were reassessed. Utilizing these improvements, the Version 3 Level 2.0 quality-controlled data set requires only the pre-field and post-field calibrations to be applied to the data so these data can now be released within a month of the final post-field instrument calibration instead of being delayed up to several months. As encouraged by the AERONET community, automatic quality controls in Version 3 are now also applied to near-real-time Level 1.5 AOD products allowing for improved data quality necessary for numerous applications such as numerical weather prediction, atmospheric transport models, satellite evaluation, data synergism, and air quality.
The AERONET Version 3 processing algorithm marks a significant improvement in the quality controls of the Sun photometer AOD measurements, particularly in near real time. The revised AERONET algorithm is introduced by first reviewing the calculations made to compute the AOD plus changes in the input data sets and the resulting calculation of optical depth components. Next, the preprocessing steps and data prescreening are discussed for the Version 3 quality control algorithm. Cloud screening and instrument quality control algorithm changes are discussed with reference to Smirnov et al. (2000), and the solar aureole cirrus cloud-screening quality control is introduced for the first time. The automation of instrument anomaly quality controls and additional cloud screening is described in the subsequent sections. Lastly, the AERONET Version 2 and Version 3 database results are analyzed for the entire data set as well as for selected sites.
Sun photometry is a passive remote-sensing measurement technique in which mainly collimated light generally not scattered or absorbed by the atmosphere illuminates a photodiode detector and this light energy is converted to a digital signal. The digital signal (V) measured by the instrument is proportional to the solar irradiance. The relative solar calibration is derived from the Langley method (Ångström, 1970; Shaw et al., 1973) utilizing the digital counts from the instrument versus the optical air mass to obtain the calibration coefficient (Vo) by choosing the intercept at which optical air mass is zero at the top of the atmosphere (Shaw, 1983). The relative extraterrestrial solar irradiance is proportional to Vo. As shown by Holben et al. (1998) and for completeness in this discussion, the Beer–Lambert–Bouguer law converted to instrument digital counts is shown in Eq. (1):
where V(λ) is the measured spectral voltage of the instrument dependent on the wavelength (λ), Vo(λ) is the relative extraterrestrial spectral calibration coefficient dependent on λ, d is the ratio of the average to the actual Earth–Sun distance (Michalsky, 1988; USNO, 2018), τ(λ)Total is the total optical depth, and m is the optical air mass, which is strongly dependent on the secant of the solar zenith angle (Kasten and Young, 1989). For the Cimel Sun photometer, the voltage signal is expressed as integer digital counts or digital number (DN). The error in the τ(λ)Total is generally dependent on the optical air mass (m) by δτ proportional to m−1 and hence the AOD computation error will tend to be at a maximum at m=1 (Hamonou et al., 1999). Cimel instrument repeatability is tested during calibration procedures by comparing voltage ratios between the field instrument and reference instrument to be less than ±1 % (Holben et al., 1998). The absolute uncertainty in the AOD measurement can be described as Eq. (2), with calibration uncertainty of Vo being the overwhelmingly dominant error source:
The spectral AOD (τ(λ)Aerosol) should be computed from the cloud-free spectral total optical depth τ(λ)Total) and the subtraction of the contributions of Rayleigh scattering optical depth and spectrally dependent atmospheric trace gases as shown in Eq. (3).
The Rayleigh optical depth (τRayleigh) is calculated based on the assumptions defined in Holben et al. (1998), optical air mass (Kasten and Young, 1989), and the formula by Bodhaine et al. (1999), except correcting the result based on the NCEP-derived station pressure. The ozone (O3) optical depth () is dependent on the O3 absorption coefficient () for the specific wavelength, the geographic and temporally dependent multiyear monthly climatological Total Ozone Mapping Spectrometer (TOMS) O3 concentration (), and the O3 optical air mass () (Komhyr et al., 1989) using the following formulation: . Similarly, nitrogen dioxide (NO2) optical depth () is computed using absorption coefficient () and geographic and temporally dependent multiyear monthly climatological Ozone Monitoring Instrument (OMI) NO2 concentration () assuming NO2 scale height is equal to aerosol: . The water vapor optical depth () is calculated based on filter-dependent (e.g., 1020 and 1640 nm) A and B coefficients (discussed further below) and precipitable water (PW) in centimeters (u) using the following linear formulation: . The carbon dioxide (CO2) optical depth () and methane () use station-elevation-dependent formulations: and , assuming the US standard atmosphere (1976) and absorption constants derived from HITRAN. Further descriptions of these calculations are provided below.
Table 1 provides a list of the spectral corrections used in the calculation of AOD and PW from 935 nm. The nominal standard aerosol wavelengths are 340, 380, 440, 500, 675, 870, 1020, and 1640 nm. For wavelengths shorter than and equal to 1020 nm, these channels are measured using a silicon photodiode detector with a spectral range from 320 to 1100 nm. If the Cimel instrument has an InGaAs detector with a 900 to 1700 nm spectral range, then the 1640 nm wavelength is measured along with a redundant 1020 nm measurement used to compare instrument optical characteristics among detectors, lenses, and collimator tubes. The Cimel SeaPrism instrument models, which are deployed on ocean or lake platforms as part of the AERONET Ocean Color component to retrieve normalized water leaving radiances at 8–12 additional visible band wavelengths for ocean and lake remote-sensing studies, are similarly corrected for atmospheric effects (Zibordi et al., 2010).
Rayleigh optical depth calculations require the use of the station pressure (Bodhaine et al., 1999) as well as the optical air mass (Kasten and Young 1989). To determine AERONET site station pressure (PS), the NCEP/NCAR reanalysis mean sea level pressure and geopotential heights at standard levels (1000, 925, 850, 700, and 600 hPa) are fitted by a quadratic function in logarithmic space to infer the station pressure at the corresponding interpolated geopotential height. The NCEP/NCAR reanalysis data are available routinely at 6-hourly temporal resolution and 2.5∘ spatial resolution (Kalnay et al., 1996). Errors in the station pressure are generally less than 2 hPa when the station elevation is accurate and the weather conditions are benign (i.e., atmospheric pressure tends to be stable) since aerosol measurements are typically performed in mainly cloud-free conditions.
Table 1Nominal AERONET wavelengths for ion-assisted deposition filters used for aerosol remote sensing and spectral corrections or components for each channel.
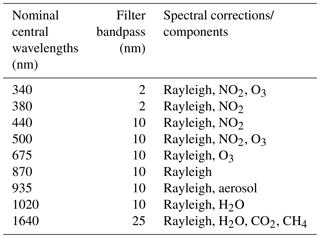
The 935 nm wavelength is used to determine the water vapor optical depth contribution, which is consequently subtracted from the longer aerosol wavelengths (i.e., 709 nm SeaPrism, 1020, and 1640 nm). The AOD at 935 nm is extrapolated based on the Ångström exponent (AE) computed from the linear regression of the AOD and wavelengths in logarithmic space within the range of 440–870 nm excluding channels affected by water vapor absorption (Eck et al., 1999). To extract the PW in centimeters from the 935 nm measurements, the Rayleigh optical depth and the AOD components need to be subtracted from the total optical depth at 935 nm. As a result, the dimensionless column water vapor abundance (u) is obtained using the following equations (4–7):
where TW is the water vapor transmission, constants A and B are absorption constants unique to the particular 935nm filter, C is an absorption constant assumed to be equal to 1 (Ingold et al., 2000), d and m are defined in Eq. (1), mW is the water vapor optical air mass (Kasten, 1965), and u is the total column water vapor abundance (Schmid et al., 2001; Smirnov et al., 2004). The total column water vapor abundance (u) is converted to total column water content or PW by using the normalization factor (uo=10 kg m−2) and dividing it by the mean value of water density (po=1000 kg m−3) to obtain water column height units of centimeters (Bruegge et al., 1992; Ingold et al., 2000).
In the calculation of the filter-dependent A and B constants, the water vapor absorption optical thickness is determined by the integration of water vapor extinction coefficient over height from the bottom to the top of the atmosphere. This calculation requires the following inputs to determine the extinction at each height: HITRAN spectral lines with assumed US Standard Atmosphere, 1976 temperature and pressure profiles, the absorption continuum lookup table from the Atmospheric and Environmental Research (AER) Radiative Transfer Working Group (Clough et al., 1989; Mlawer et al., 2012), and total internal partition sums that define the shape and position of lines dependent on temperature (Gamache et al., 2017). Nine defined total column water vapor amounts (0.5, 1.0, 1.5, 2.0, 2.5, 3.0, 4.0, 5.0, and 6.5 cm) are used to generate water vapor absorption optical depth lookup tables. From these lookup tables, transmittances are calculated based on the bandpass and averaged spectral solar irradiance for the quiet Sun obtained from the University of Colorado LASP/NRL2 model (Coddington et al., 2016) to generate filter-specific A and B coefficients. The one sigma uncertainty in the calculation of PW in centimeters is expected to be less than 10 % compared to GPS PW retrievals (Halthore et al., 1997; Bokoye et al., 2003; Sapucci et al., 2007; Alexandrov et al., 2009; Prasad and Singh, 2009; Bock et al., 2013; Van Malderen et al., 2014; Pérez-Ramírez et al., 2014; Campenelli et al., 2018). The spectral water vapor optical thickness () is determined by computing the average of all A and B constants from the suite of filters affected by water vapor absorption (i.e., 709 nm SeaPrism, 935, 1020, and 1640 nm) in the AERONET database. The (Eq. 8) is also dependent on the dimensionless total column water vapor abundance (Michalsky et al., 1995; Schmid et al., 1996):
The contribution of ozone (O3) optical depth is determined utilizing the total column TOMS monthly average climatology (1978–2004) of O3 concentration at 1.00∘ × 1.25∘ spatial resolution, the O3 optical air mass using O3 scale height adjustment by latitude (Komhyr et al., 1989), and the O3 absorption coefficient (Burrows et al., 1999). The OMI O3 data set is not used here due to instrument sampling anomalies (McPeters et al., 2015). While the TOMS O3 data set is extensive and generally characterizes the distribution of O3, recent changes in concentration could introduce some minor uncertainty in AOD. Similarly, the nitrogen dioxide (NO2) optical depth is calculated using the total column OMI monthly average climatology (2004–2013) of NO2 concentration at 0.25∘ × 0.25∘ spatial resolution and the NO2 absorption coefficient (Burrows et al., 1998). Tropospheric NO2 is highly variable spatially due to various source emissions, and stratospheric NO2 concentrations are more stable spatially than the tropospheric NO2 and can bias the calculation of AOD if neglected (Arola and Koskela, 2004; Boersma et al., 2004). Therefore, regions with high tropospheric NO2 emission will tend to have greater proclivity for deviating from climatological means. Further, NO2 can vary significantly on the diurnal scale (Boersma et al., 2008). Improved satellite observations, models, or collocation with surface-based PANDORA instruments measuring temporal total column O3 and NO2 may assist in reducing the uncertainty and determination of the total column NO2 optical depth contribution in later versions of the algorithm (Herman et al., 2009; Tzortziou et al., 2012). Concentrations for carbon dioxide (CO2) and methane (CH4) are assumed constant and optical depths are computed based on the HITRAN-derived absorption coefficients of 0.0087 and 0.0047 for the 1640 nm filter, respectively, and adjusted to the station elevation.
The calibration of the AOD measurements is traced to a Langley measurement performed by a reference instrument (Shaw, 1983; Holben et al., 1998). The reference instruments obtain a calibration based on the Langley method morning-only analyses based on typically 4 to 20 days of data performed at a mountaintop calibration site. The primary mountaintop calibration sites in AERONET are located at Mauna Loa Observatory (latitude 19.536, longitude −155.576, 3402 m) on the island of Hawai'i and Izana Observatory (latitude 28.309, longitude −16.499, 2401 m) on the island of Tenerife in the Canary Islands (Toledano et al., 2018). These reference instruments are routinely monitored for stability and typically recalibrated every 3 to 8 months. Reference instruments rotate between mountaintop calibration sites and inter-calibration facilities at NASA GSFC (latitude 38.993, longitude −76.839, 87 m) in Maryland, Carpentras (latitude 44.083, longitude 5.058, 107 m) in France, and Valladolid (latitude 41.664, longitude −4.706, 705 m) in Spain, where reference instruments operate simultaneously with field instruments to obtain pre-field and post-field deployment calibrations. For periods when the AOD is low (τ440 nm<0.2), optical air mass is low (m<2), and aerosol loading is stable, the reference Cimel calibration may be transferred to field instruments (Holben et al., 1998). Eck et al. (1999) estimate the reference instrument calibration uncertainty impact on AOD varies from 0.0025 to 0.0055 with the maximum representing uncertainty only in the UV channels (340 and 380 nm). In Version 3, the field instrument AOD uncertainty is still estimated to be from 0.01 to 0.02 with the maximum representing the uncertainty only in the UV channels (340 and 380 nm).
The Version 2 processing used default temperature corrections based on three sensor head temperature (TS) ranges (TS<21 ∘C, 21 ∘C ≤ TS≤32 ∘C, and TS>32 ∘C) using a constant nominal temperature sensitivity only for the 1020 nm filter direct Sun measurements. In Version 3, measurement temperature sensitivity has been updated for all wavelengths ≥ 400 nm and all measurement types (i.e., direct solar, sky, water, and lunar viewing measurements). Beginning in 2010, the temperature sensitivity was characterized for almost all wavelengths uniquely for each Cimel instrument. The temperature effect on signal (i.e., DN per degree Celsius) is a function of the combined sensitivity of the detector and the filter material itself. If any Cimel data relying on a filter were in use prior to 2010 and the filter was not temperature characterized, then the default values for the filter and manufacturer type are applied, if established. Filters in the ultraviolet (i.e., 340 and 380 nm) are not measured for temperature dependence because of low integrating sphere radiance output at these wavelengths. Due to temperature dependence of the field instrument and the reference instrument, the Sun and sky calibration transfer needs to be adjusted by computing the ratio of the Cimel temperature coefficients for each wavelength and for the temperature observed at the time of the calibration. In addition, when the AOD is computed for field instruments, the sensor head temperature is measured for each direct Sun measurement so these data can be adjusted to the temperature response of the instrument optics (i.e., combined effect of the detector and filters) and electronics.
The temperature response is measured at the AERONET calibration facilities using an integrating sphere and a temperature chamber in which the temperature is varied from −40 to +50 ∘C. The wavelength-dependent temperature coefficient is typically determined from the slope of ordinary least-squares (OLS) regression fit of the digital voltage counts versus the sensor head temperature reading. For this relationship, the second-order polynomial fit is computed for 1020 nm, while other filters use either a linear or second-order polynomial fit (depending on the larger correlation coefficient). For Cimel model 4 and some model 5 instruments with two silicon photodiode detectors, the digital counts for solar aureole and sky instrument gains are used to determine temperature coefficients for each detector (Holben et al., 1998; https://aeronet.gsfc.nasa.gov, last access: 12 December 2018). Some model 5 and all CE318-T instruments perform the direct Sun and sky measurements on the same detector (silicon or InGaAs) and typically utilize the solar aureole gain digital counts (Barreto et al., 2016; https://aeronet.gsfc.nasa.gov, last access: 12 December 2018).
According to Holben et al. (1998), all instruments generally perform measurements sequentially from longer wavelength to the shortest wavelength filters on a rotating filter wheel inside the sensor head, which positions each filter in front of the photodiode detector and behind the sensor head lenses and collimator tube. The robotically controlled sensor head points automatically at the Sun based on the time and geolocation of the instrument. The laboratory-tuned four-quadrant detector provides nearly perfect solar and lunar tracking to one motor step or ∼0.1∘ immediately following the geographic pointing. A dual-tube external collimator with internal baffles attached to the top of the sensor head reduces stray light effects into the sensor head 1.2∘ field-of-view optical train.
The instrument performs measurements of the Sun using measurement triplets, that is, performing the series of measurements of all filters starting at 0 s of the minute for a duration of about 8 s, and then repeating this measurement sequence at 30 s and 60 s from the initial measurement time. The resulting 1 min averaged measurement sequence is defined as a triplet measurement and the maximum to minimum range of these measurements is termed the triplet variability. The triplet measurement advantageously allows for separation of homogeneously dispersed aerosols versus highly temporally variable clouds. The triplet measurements are performed either every 15 min for older model 4 instruments or every 3 min for newer model 5 and CE318-T instruments increasing the temporal availability of the AOD measurements in the AERONET database.
The AERONET database has provided three distinct levels for data quality: Level 1.0, Level 1.5, and Level 2.0. In Version 2, Level 1.0 was defined as prescreened data, Level 1.5 represented near-real-time automatically cloud-cleared data, and Level 2.0 signified an automatically cloud-cleared, manually quality-controlled data set with pre- and post-field calibrations applied. In Version 3, the definitions have been modified substantially for Level 1.5 and Level 2.0. Version 3 Level 1.5 now represents near-real-time automatic cloud screening and automatic instrument anomaly quality controls and Level 2.0 additionally applies pre-field and post-field calibrations. The Version 3 fully automated cloud screening and quality control checks eliminate the need for manual quality control and cloud screening by an analyst and increases the timeliness of quality-assured data. Note that in all cases each subsequent data quality level requires the previous data level to be available as input (e.g., Level 1.5 requires Level 1.0 and Level 2.0 requires Level 1.5). The following sections will describe these new definitions and automatic quality controls and the impact these new quality assurance measures have on the AERONET database in detail.
3.1 Preprocessing steps and prescreening
Most preprocessing data quality criteria operate on voltage (V, expressed as the integer DN) or sensor head temperature (TS). The impact of these conditions may immediately remove data from Level 1.0 consideration or later only impact Level 1.5 and Level 2.0 AOD. Each quality control section describes the reasoning for the screening at the specified data quality level. Digital count anomalies typically result from anomalous electronic issues such as very low or high battery voltages, malfunctioning amplifiers, or loose connections of internal control box components. These digital count anomalies mostly affect older Cimel model 4 (CE318-1) and model 5 (CE318-N) instruments (Holben et al., 1998; https://aeronet.gsfc.nasa.gov, last access: 12 December 2018), while several of these connection issues have been mitigated in the Cimel model T (CE318-T) instruments (Barreto et al., 2016).
3.1.1 Electronic instability
Cimel model 4 instruments use a 16-bit analog–digital (A/D) converter in the processing unit in which the analog signal from the sensor head detector to the control box is subject to electronic noise. Cimel model 5 instruments use a 16-bit A/D converter inside the sensor head and the instrument invokes electronic chopping to reduce electronic noise. Cimel model T instruments utilize an increased quantization from 16 to 24 bits, which significantly reduces noise effects. Cimel model 5 and model T instruments internally adjust for the dark current (VD) with each measurement and no separate record is logged. Cimel model 4 instruments perform VD measurements after each sky scan (approximately hourly) for each spectrally dependent instrument gain parameter (i.e., Sun, aureole, and sky). Large VD values generally represent significant instrument electronic instability. Quality controls applied to the VD will remove the entire day for model 4 instrument data from all of the quality levels for either of the following conditions: (1) a single dark current measurement is greater than 100 counts for greater than N−1 wavelengths, where N is the total number of wavelengths, or (2) more than three dark current measurements are greater than 100 counts for three or more wavelengths.
Amplifiers in the Cimel model 4 instruments can produce unphysical increases in the digital counts or decreases in the AOD for the 340 and 380 nm wavelengths at large optical air mass (Fig. 1). These instability issues are evaluated simply using a relative threshold with respect to the available visible wavelength AOD measurements. If the τ380 is greater than 0.5⋅τ340 and (), then the triplet measurements for 340 and 380 nm are removed from the database for Level 1.5 and subsequent levels. These quality controls are limited to model 4 instruments that were not manufactured after 2001; however, the early AERONET database (1993–2005) contains many of these data. New Cimel model T instruments are replacing model 4 instruments but over 40 model 4 instruments remain active in 2018.
The instrument may rarely malfunction by producing constant digital voltages for triplet measurements and the result of keeping these data in the database leads to unphysical variations in the AOD. A frequency analysis is performed to determine if any DN values occur more than 10 times in a day. If more than 50 % of the DNs are from the same triplet measurement, then this measurement is identified as an anomalous measurement. If more than 50 % of the triplet measurements in the day are considered anomalous, then the entire day will be removed from Levels 1.5 and 2.0.
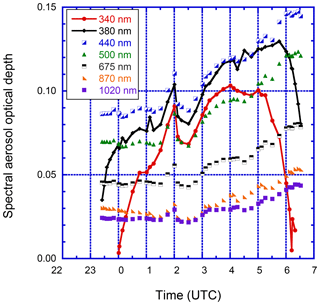
Figure 1Aerosol optical depth (AOD) data from AERONET Ussuriysk site (43.70∘ N, 132.16∘ E) on 30 November 2005 show electronic instability. For the Cimel model 4 instruments, the electronic sensitivity of the UV AOD data (340 and 380 nm) can be high due to a bad amplifier. The resulting AOD data for the UV channels are out of spectral dependence the entire day with a maximum error for large optical air mass due to large dark current values. The UV channels (identified by line plots) are removed by the quality control while preserving other wavelengths that are not affected by this condition.
3.1.2 Radiometer sensitivity evaluation
The Cimel four-quadrant solar near-infrared detector requires enough sensitivity to track the Sun, and a DN threshold of 100 in the near infrared is needed to have sufficient signal. Near-infrared wavelengths (e.g., 1020 nm) typically have a higher measured solar DN(V) due to higher atmospheric transmission in the presence of fine-mode-dominated aerosols even in very high aerosol loading conditions. When the DN (V870 nm or V1020 nm) is less than 100 counts for any measurement of the solar triplet, then the entire solar triplet AOD will be removed for all wavelengths from Level 1.0 and subsequent levels due to potential solar tracking accuracy issues.
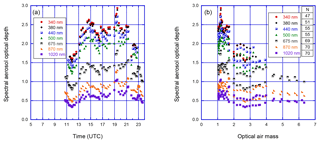
Figure 2Spectral-dependent low digital number removal at NASA Goddard Space Flight Center (GSFC; lat 38.99, long −76.84). (a) Level 1.0 AOD data from GSFC on 8 July 2002 are plotted for the Quebec forest fire smoke event. Significantly fewer Level 1.0 AOD data are available for the shorter wavelengths near local sunrise (∼ 11:00 UTC) and sunset (∼ 23:30 UTC). (b) The distribution of the AOD measurements with respect to optical air mass clearly shows the removal of short wavelengths for large air mass in this fine-mode aerosol event. The high aerosol loading due to smoke and haze results in significant extinction at UV and visible wavelengths, which corresponds to low digital counts. The low digital count quality control removes AOD measurements impacted by diffuse radiation scattered into the instrument field of view (Sinyuk et al., 2012).
Version 2 data processing assessed the instrument electronic and diffuse light sensitivity by defining a DN of 10 to remove solar AOD triplet measurements. Electronic issues impact Cimel model 4 instruments in the UV and short visible wavelengths due to high DN(VD). Scattered diffuse light into the collimated field of view can affect all instruments and produce unusual AOD changes with optical air mass, especially when the aerosol loading is high and optical air mass is large. The signal-to-noise ratio of the Cimel instrument requires setting a minimum threshold for the determination of the solar measured DN(V) to limit the effect of diffuse radiance in the instrument field of view (Sinyuk et al., 2012). A dark current DN(VD) (e.g., ∼50–100) nearly equal to or larger than the measured solar DN(V) (e.g., ∼25–50) will result in V and τ decreasing with increasing optical air mass. All wavelengths are evaluated to determine if the measured solar DN(V) (subtracted from the closest temporal dark current DN(VD) for model 4 instruments only) is less than DN(VO)∕1500; then the identified wavelength will be removed from all AOD levels. A threshold of 1500 is calculated from a DN of 15 000, a typical average DN(VO) for Cimel models 4 and 5, normalized to a minimum signal DN of 10. The maximum product of AOD times optical air mass () of approximately 7.3 is computed by the natural logarithm of 1500 (i.e., ln(15 000∕10)) for Cimel model T instruments. For non-model T instruments, the 100 DN threshold for 870 and 1020 nm limits the τm to approximately 5.0 (i.e., ln(15 000∕100)) for only those two wavelengths. The τm maximum threshold applies to all channels; however, the signal count can decrease significantly with optical air mass and depend on the wavelength dependence of VO. For values exceeding the τm maximum threshold, the diffuse radiation increases the signal and, as a result, unfiltered AODs show a decrease in magnitude as optical air mass increases for high AOD even when DN(VD) equals zero. A measured solar DN(V) lower than the ratio DN(VO)∕1500 threshold will result in the removal of the solar triplet AOD for the specific wavelength (Fig. 2).
3.1.3 Digital number triplet variance
As mentioned in Sect. 2, the Cimel instrument performs a direct Sun triplet measurement at regular intervals throughout the day. A variance threshold is applied based on the root-mean-square (RMS) differences of the triplet measurements relative to the mean of these three values. If the (RMS/mean) ⋅ 100 % of the DN triplet values is greater than 16 %, then these data are not qualified as Level 1.0 AOD (Eck et al., 2014). The DN temporal variance threshold is sensitive to clouds with large spatial-temporal variance in cloud optical depth and optically thick clouds such as cumulus clouds as well as issues due to poor tracking of the instrument.
3.1.4 Sensor head temperature anomaly identification
Each Cimel instrument has a fixed resistance (model 4) or band gap (models 5 and T) temperature sensor inside the optical head within 0.5 cm of the detector, filter wheel, and optical train assembly. As discussed in Sect. 2, the instrument optics and digital counts can have dependence on the sensor head temperature (TS), which is saved with each measurement triplet. Sensor head temperatures may be erroneous due to instrument electronic instability or communication issues. These potentially unphysical values of TS are evaluated by a number of algorithm steps such as checks for (1) constant TS values, (2) unphysical extreme high or low TS, (3) potentially physical yet anomalously low TS with respect to the NCEP/NCAR reanalysis ambient temperatures, and (4) unphysical TS decreases (dips) or increases (spikes). When the algorithm removes a TS reading or the TS measurement is missing, an assessment is made on the instrument temperature response based on ±15 ∘C of the NCEP/NCAR reanalysis temperature for the date and location to determine whether the temperature characterization coefficient for a specific wavelength would result in a change of AOD by more than 0.02. If this condition is met for a specific wavelength, then data associated with this wavelength-specific triplet measurement will be removed at Level 1.5 and subsequent levels while preserving other less-temperature-dependent spectral triplet measurements.
3.1.5 Eclipse circumstance screening
During episodic solar or lunar eclipses, AOD will increase to the maximum obscuration of the eclipse at a particular location on the Earth's surface. The AOD increases due to the reduction of the irradiance and the celestial body (Moon or Earth) obscuring the calibrated light source (Sun or Moon). While any one point on Earth infrequently experiences an eclipse, when an eclipse episode does occur, the eclipse can affect many locations nearly simultaneously, making manual removal tedious at sites distributed globally. To automate the removal of eclipse episodes, the NASA solar and lunar eclipse databases are queried for eclipse circumstances based on geographic position of the site to produce a table of eclipse episodes starting from 1992. The eclipse tool utilizes established Besselian elements based on the Five Millennium Canon of Solar Eclipses: −1999 to +3000 (Espenak and Meeus, 2006) to quantify the geometric and temporal position of the celestial bodies (Sun, Earth, and Moon), determine the type of eclipse (e.g., partial, annular, total), and predict times of the various stages of the solar or lunar eclipse. For the Version 3 database, the eclipse site-specific tables are used to discretely remove triplet measurements affected by any stage of the eclipse circumstance. For example, during a solar eclipse, solar triplets will be removed between the partial eclipse first contact and the partial eclipse last contact regardless of the eclipse obscuration or magnitude for Level 1.5 data and subsequent levels (Fig. 3). The partial eclipse first contact is defined as the time at which the penumbral shadow is visible at a point on the Earth's surface and the partial eclipse last contact is defined as the time at which the penumbral shadow is no longer a visible point on the Earth's surface. Efforts to retain AOD during solar eclipse episodes have been attempted by the authors in which up to 95 % of the AOD can be corrected based on adjusting calibration coefficients by the eclipse obscuration. However, spectral calibration coefficients also need to be adjusted to account for the solar atmosphere spectral irradiance, which becomes more dominant during the solar eclipse episode and is a topic of further investigation.
3.1.6 Very high AOD retention
Cloud-screening procedures in the next section may inadvertently remove aerosol in very high aerosol loading cases due to biomass burning smoke and urban pollution as discussed by Smirnov et al. (2000). For Version 3, each triplet reaching Level 1.0 is evaluated for possible retention in the event that a specific Level 1.5 cloud-screening procedure removes the triplet. When the AOD measurement for 870 nm is >0.5 and AOD 1020 nm > 0.0, these conditions will potentially qualify the triplet for very high AOD retention. Further analysis is performed on those qualified triplets to remove the effect of heavily cloud-contaminated data using the AE for the wavelength ranges of 675–1020 or 870–1020 nm (Eck et al., 1999). If the AE675−1020 nm1.2 (or AE, if AOD675 nm is not available), and the AE for the same range is less than 3.0, then the triplet qualifies for very high AOD retention and the triplet can be retained at Level 1.5 even if the measurement does not pass Level 1.5 cloud-screening quality control steps in Sect. 3.2.
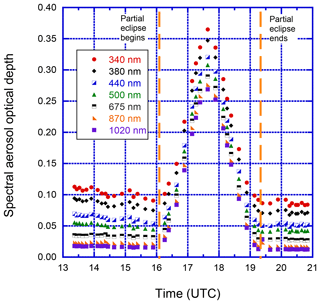
Figure 3Eclipse circumstance at the NASA Goddard Space Flight Center (GSFC; lat 38.99, long −76.84) on 25 December 2000 between 16:04:13 and 19:16:25 UTC. The maximum AOD during the eclipse occurs at the maximum obscuration of 0.42, which results in a change of ∼0.28 for AOD at 500 nm compared to data before and after the solar eclipse. Utilizing the NASA Solar Eclipse database, the AOD measurements are removed between the partial eclipse first contact and partial eclipse last contact as denoted by the vertical dashed lines.
3.1.7 Total potential daily measurements
Cloud-screening methods in Sect. 3.2 may incompletely remove all cloud-contaminated points and leave data fragments. To mitigate this issue, a methodology was developed based on the total number of potential measurements in the day and calculated AE values. The total number of potential measurements in the day is defined as the number of triplet measurements plus the number of wet sensor activations. If the number of remaining measurements after all screening steps in Sect. 3.2 are performed is less than three measurements or less than 10 % of the potential measurements (whichever is greater), then the algorithm will remove the remaining measurements. This condition is repeated after each cloud-screening step in Sect. 3.2 and will only be activated when the very high AOD restoration is not triggered (see Sect. 3.1.6) or when the AE440−870 nm is less than 1.0 for a triplet measurement, indicating large particles such as clouds may contaminate the remaining measurements.
3.1.8 Optical air mass range
The basic Cimel Sun photometer Sun and sky measurement protocols were specified to NASA requirements in Holben et al. (1992, 1998, 2006) and have only been slightly modified since that time for improved measurement capability of the model 5 and model T instruments (Barreto et al., 2016). All instruments systematically perform direct Sun measurements between the optical air mass (m) of 7.0 in the morning and m of 7.0 in the evening. In Version 2 and earlier databases, AERONET data processing limited the Level 1.5 and Level 2.0 AOD computation from m of 5.0 in the morning to m of 5.0 in the evening. The m limitation may avoid potential error in the computation of the optical air mass at large solar zenith angles (Russell et al., 1993) and possible increased cloud contamination (Smirnov et al., 2000). For Version 2 and 3 processing, the Kasten and Young (1989) formulation was used to account for very small differences in the optical air mass calculations at high solar zenith angles. Noting that the AOD error (δτ∕m) has a minimum at large m values (conversely a maximum at solar noon), the maximum m of 5.0 was extended to m of 7.0 in Version 3 processing. The larger optical air mass range leads to an increase in the number of solar measurements occurring in the early morning and the early evening contributing to additional AOD measurements used for input for almucantar and hybrid inversions plus an increase in AOD measurements at high-latitude sites when solar zenith angles may be large even at solar noon. The impact on the cloud-screening performance appears to be minimal for measurements closer to the horizon. The fidelity of the Version 3 cloud-screening (see Sect. 3.2) AODs supports the extended optical air mass range for Level 2.0.
3.2 Level 1.5 AOD cloud-screening quality controls
As discussed in Sect. 3.1, several preprocessed criteria and parameters are necessary to quality control the AOD data quality in near real time. Cloud-screening procedures proposed by Smirnov et al. (2000) were designated to remove or reduce cloud-contaminated AOD measurements. However, these procedures also had the effect of surreptitiously occasionally removing other non-cloud anomalies such as repeated AOD diurnal dependence when AOD had a large maximum at midday and minimum at high optical air masses due to environmental impacts on the optical characteristics of the instrument (e.g., moisture on the sensor head lens or spider webs in the collimator tube). While these cloud-screening methods have been implemented for about 25 years, the state of knowledge has progressed over this period and thus necessitates review and modification of cloud-screening quality control procedures (Kaufman et al., 2005, Chew et al., 2011; Huang et al., 2011). The calculation of the AOD at Level 1.0 essentially represents the following in Eq. (9):
where τapp Total is the apparent total optical depth, which at this point in the data processing may be affected by the contributions of liquid cloud droplets (τliquid cloud), cirrus amplification factor (Ccirrus) applied to the cirrus crystal optical depth (τcirrus) due to strong forward scattering into the field of view of the instrument, solar or lunar eclipses (τeclipse), and instrument anomalies (Γanomaly adjustment factor). Given cloud-free conditions and perfect instrument operation, the additional non-aerosol τ components would be zero and Ccirrus and Γanomaly would be 1. However, the Cimel Sun photometer always attempts to measure the Sun if it can be tracked regardless of the total optical depth magnitude.
Clouds are a major factor in the effort to quality control remotely sensed aerosol data (Smirnov et al., 2000; Martins et al., 2002; Kaufman et al., 2005; Chew et al., 2011; Kahn and Gaitley, 2015). A significant portion of the liquid cloud contribution is removed by the prescreening prior to Level 1.0 as discussed in Sect. 3.1.3. The τapp Total should be adjusted based on a multiplier dependent on the cirrus crystal size () according to Kinne et al. (1997). While this cirrus coefficient (Ccirrus) is not specifically modeled by Kinne et al. (1997) for the Cimel instrument field of view half angle of 0.6∘, this multiplier is likely to be close to 1 for small cirrus crystals (e.g., reff=6–16 µm), but near 2 for larger cirrus crystal sizes (e.g., reff=25–177 µm). These adjustment factors would result in the reduction of the τapp Total due to forward scattering in the presence of cirrus. Conversely, liquid water cloud droplets would significantly increase the τapp Total in a manner similar to large dust particles.
Cimel instruments may also have internal and external anomalous conditions that modify the optical characteristics or response of the instrument, resulting in amplification or dampening impacts (Γanomaly) of varying magnitudes on the computation of the τapp Total. These anomaly adjustments can be difficult to quantify and can have strong dependence on optical air mass (m) or the sensor head temperature (TS). As a result, the following sections will describe the mechanisms in which these additional cloud and anomaly components are automatically eliminated or reduced to as close to zero as possible to provide a quality-assured AOD (τaerosol) after final calibration is applied (see Sect. 4) across the global AERONET AOD database.
3.2.1 Cloud-screening quality controls
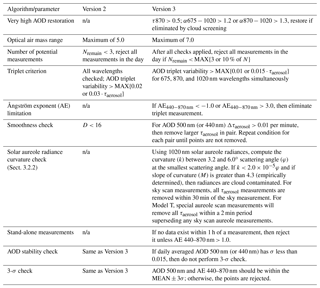
As Level 1.0 AOD data may have cloud contamination, these data should be considered potentially cloud contaminated where the triplet measurement represents the apparent AOD (τapp aerosol) as defined in the previous section. Table 2 provides a summary of the cloud-screening quality control changes from Version 2 to Version 3 and these changes are discussed in detail below and Sect. 3.2.2.
Table 2Summary of cloud-screening-related quality control changes from Version 2 to Version 3.
n/a = not applicable.
Cimel triplet measurements are performed typically every 3 min (every 15 min for older instrument types) and these triplet measurements can detect rapid changes in the τapp aerosol by analyzing the maximum to minimum variability (i.e., the Δτapp aerosol{MAX–MIN}). Assuming that spatial and temporal variance of aerosols plus clouds is much greater than aerosols alone, in many cases, Δτaerosol would be near zero and Δτcloud should be much larger than zero when especially liquid-phase cloud droplets exist. For Version 2 and earlier databases, Smirnov et al. (2000) methodology utilized all available wavelengths to perform τapp aerosol triplet screening for cloud contamination. Therefore, large triplet variability would indicate the presence of clouds due to large Δτcloud. Analyses (e.g., Eck et al., 2018) have shown that removing the entire triplet measurement when only one or more of the shorter wavelengths indicates a large variation (Δτaerosol(λ) much greater than zero) may not be the most robust approach. For example, cases of highly variable fine-mode aerosols such as smoke can produce large triplet variability as a result of the inhomogeneous nature of the aerosol plume, especially for shorter wavelengths (e.g., 340, 380, 440 nm) at which fine-mode-dominated aerosol particles can have radii similar to short wavelength measurements.
Considering these factors, several potential techniques were explored utilizing various wavelength combinations and utilizing the spectral deconvolution algorithm (SDA) fine- and coarse-mode triplet separation (O'Neill et al., 2001, 2003). While the SDA-algorithm-derived triplets for coarse-mode AOD relative change tended to show utility in cloud removal, the SDA algorithm itself could not be applied universally to the AERONET database due to anomalous results in which fine- and coarse-mode AODs can have a negative relationship when the number of available wavelengths or wavelength range is not satisfied. Anomalies in SDA retrievals can occur when the uncertainty in AOD is relatively large near solar noon compared to the magnitude of AOD as is sometimes the case when only the pre-field deployment calibration has been applied. Upon further consideration of the triplet variability technique, analyses indicated that using all three longest standard AERONET wavelengths (i.e., 675, 870, and 1020 nm) could be used to remove a triplet measurement when they have high triplet variability that exceeds 0.01 or 0.015 ⋅ AOD (whichever is greater). The reduction in the threshold of the triplet variability criterion is proportional to the magnitude of decrease in AOD uncertainty compared to UV wavelengths (0.02) and those of visible and near-infrared wavelengths (0.01).
While Smirnov et al. (2000) did not impose an AE limitation, Version 3 processing constrains the AE440−870 nm of Level 1.5 data to be within −1.0 and +3.0. In general, the AE440−870 nm values outside this range are unphysical and should not be used due to the inconsistency of the AOD spectral dependence. These inconsistencies typically occur at very low optical depth (<0.05) at which the uncertainty of the AOD may be up to 100 % of the actual value, thus producing AE values that are invalid.
The AOD time series smoothness uses a number of numerical methods and fits dependent on the application. For an AOD time series, rapid and large increases are usually the result of cloud contamination. Version 2 and prior versions include a technique proposed by Smirnov et al. (2000) to implement a smoothness methodology similar to Dubovik et al. (1995). In this scheme, the triplet measurements were considered to be discrete points, and differences in logarithm of τapp aerosol and relative difference in times between those measurements were utilized to calculate the first derivative differences in which an arbitrary parameter D (similar to the norm of the second derivative) is calculated. In Version 2 and earlier versions, when the value of D was greater than 16 for an AOD measurement time sequence for 500 or 440 nm, then this triplet was removed from the data set. Further, the smoothness procedure was repeated or measurements were rejected for the day if fewer than three triplets remained for the day as discussed in Smirnov et al. (2000). While the D=16 threshold was empirically derived, the smoothness parameter is somewhat arbitrary in origin and operates in logarithmic coordinates rather than natural ones. For example, the distribution of aerosol measurements in a single day is typically normally distributed rather than logarithmically distributed. Further, the D parameter smoothness procedure was not always successful at removing cloud-contaminated data and this may be related to the fact that the empirically derived D parameter was tuned for 15 min triplet measurement intervals rather than 3 min intervals now commonly observed in the network. Therefore, an approach adhering to the relative change in the total optical depth with time is feasible and a more straightforward physical quantification of the change in τapp aerosol with time.
The AOD time series smoothness in Version 3 evaluates the same τapp aerosol 500 nm wavelength (or 440 nm if 500 nm is not available). The Version 3 smoothness method computes the relative rate of change of τapp aerosol per minute and if per minute, then the larger triplet measurement in the pair is removed and the smoothness procedure will continue to remove triplets until measurement pairs in the day do not surpass the smoothness threshold. The selection of this threshold of 0.01 per minute hinges on the premise that the triplet average does not change rapidly within 1 min. The Version 3 smoothness procedure could be affected by extreme changes in AOD due to anomalous aerosol plumes (e.g., biomass burning or desert dust plumes) for which a strong gradient exists.
After the cirrus cloud-screening quality control (to be discussed in the Sect. 3.2.2), triplets are evaluated for spurious or isolated measurements remaining during the day after applying the cloud-screening quality control procedures. So-called “stand-alone points” may be relevant given the ability of the instrument to perform measurements in cloud breaks or gaps. Here, the definition of a stand-alone triplet is when no triplets are available within 1 h of the measurement. If the AE440−870 nm is greater than 1.0, the algorithm retains the triplet measurement; otherwise, the measurement will be removed from the data set. Further, daily averaged data are evaluated for temporal stability using the AOD stability during the day at 500 nm (or 440 nm) and daily outlier triplets using the 3-sigma check for AOD at 500 nm (or 440 nm) and AE440−870 nm to be within ±3 SD (standard deviations) (Smirnov et al., 2000). Finally, each wavelength is evaluated to be greater than or equal to −0.01 (based on uncertainty of 0.01; Eck et al., 1999). At this point in the quality control algorithm, the remaining triplet measurements are not expected to have a major component of τcloud or τcirrus.
3.2.2 Novel cirrus removal method utilizing solar aureole curvature
Utilizing satellite and surface-based lidar, studies have shown the AERONET Version 2 Level 2.0 AOD data are impacted by homogeneous optically thin cirrus clouds with a bias of up to 0.03 in AOD (DeVore et al., 2009; Chew et al., 2011; Huang et al., 2011). The optically thin cirrus bias can influence radiative forcing calculations and satellite validation when clouds contaminate the measurement (DeVore et al., 2012). In addressing the shortcoming of Smirnov et al. (2000) and manual checks in which the identification of optically thin cirrus clouds give relatively weak signal in the AOD or AE, the authors leveraged high-angular-resolution radiance measurements routinely performed in the solar aureole region (3.2–6.0∘ scattering angle range). While cirrus detection may be possible with other scattering angle ranges, Cimel Sun photometer radiance measurements do not presently have high enough angular resolution from 6.0 to 35.0∘ to reliably and consistently detect cirrus-induced atmospheric phenomena (e.g., solar halos and sun dogs) since these events depend on cirrus crystal shape and orientation and are not always detectable beyond levels of cloud optical depth variability.
The use of the solar aureole radiance (LA; µW cm−2 sr−1 nm−1) with respect to the scattering angle (φ; in radians) has been demonstrated using the Sun and aureole measurement (SAM) aureolegraph instrument to indicate the presence of large particles such as cirrus crystals (DeVore et al., 2009, 2012; Haapanala et al., 2017). The effect of the surface reflectance is much less than the radiance of the solar aureole so it is ignored; however, this may become important at very large solar zenith angles and bright surfaces such as snow (Eiden, 1968). All Cimel instrument models perform solar aureole measurements at the nominal 1020 nm wavelength. The Cimel performs solar triplet measurements directly on the solar disk, while solar aureole radiances are measured mainly during the almucantar, principal plane, and hybrid sky scans. These solar aureole measurements are performed hourly for model 4 and 5 instruments during sky scan scenarios and for model T instruments before each solar triplet as well as for the hourly almucantar and hybrid sky scan measurements.
The AERONET measurements of the solar aureole directional radiances (LA) depend on the absolute calibration of the integrating sphere. The integrating spheres at the AERONET calibration centers provide an absolute calibration traceable to a NIST standard lamp hosted at the NASA GSFC calibration facility. The uncertainty in the radiance calibration is typically less than 3 % due to systematic degradation in the lamp levels, changes in integrating sphere characteristics, and instrument spectral signal response. The solar aureole radiance magnitudes also depend on the instrument Sun sensitivity gain settings for each wavelength for Cimel model 4 and 5 instruments, while the model T instruments use an internal instrument gain switch applied to all wavelengths (Barreto et al., 2016). The LA measurements have calibration and temperature correction applied and are measured by all Cimel instruments at the 440, 675, 870, and 1020 nm wavelengths. Due to lower AOD in fine-mode aerosol loading situations, less Rayleigh scattering, and lower calibration uncertainty, the LA measurements at 1020 nm have less noise for evaluating cirrus cloud presence.
Given that the LA measurements are performed at discrete φ, we calculate the OLS linear regression fit on a logarithmic scale when more than three scattering angles are available to determine the intercept (a), slope (b), and the correlation coefficient (R). If R is less than or equal to 0.99, then we do not proceed to check for cirrus contamination. When R is greater than 0.99, the curvature (ko) for the first available scattering angle (φo) in the 3.2–6.0∘ scattering angle range is calculated using the equation of curvature of the signed planar curve, which gives the rate of turning of the tangent vector in Eq. (10) (Kline, 1998):
The curvature (k) can be formulated by assuming the power-law function and its derivatives and, in our application, using the first scattering angle (φo) in radians for φ below:
According to the k formulation, the stronger the forward scattering peak, then the smaller the value of curvature since the second derivative is small and the first derivative is large due to the steepness of the solar aureole radiances. Further, the overall slope of curvature for all of the scattering angles (3.2–6.0∘) can be calculated using the assumption that , rendering the addition of 1 in the denominator of Eq. (10a) insignificant. The slope of the logarithm of curvature versus logarithm of scattering angle is desired and this slope can be calculated using a and b from the linear regression above by converting from logarithmic coordinates. Therefore, we derive Eq. (11) to determine the slope of curvature dependent only on the slope of the linear regression fit of LA and φ on a logarithmic scale as follows:
Here, the slope of curvature (M) is defined as (1−2b). The value of M will typically be positive since b will tend to be negative due to the dimming of the solar aureole with increasing scattering angle. Alternatively, M can be calculated numerically for each k and φ to obtain similar results. A small value of curvature (ko) at the smallest scattering angle available represents the possible existence of large particles producing a forward scattering peak. The slope of curvature (M) represents the average characterization of the solar aureole shape across the scattering angle 3.2–6.0∘ range in which a large magnitude signifies the potential presence of large particles as curvature increases with increasing scattering angle across the forward scattering peak.
Table 3AERONET and MPLNET sites and date ranges used for assessing cirrus and non-cirrus cloud presence.
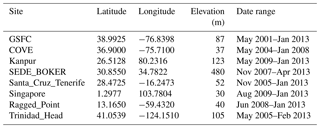
The Micro-Pulse Lidar Network (MPLNET) is a global network of lidars monitoring the vertical distribution of aerosols and clouds (Welton et al., 2000; Welton and Campbell, 2002; Campbell et al., 2002). To determine the thresholds for these Sun photometer solar aureole curvature parameters for different surface types and aerosol environments, the MPLNET lidar cloud identification database was used at eight collocated AERONET sites as shown in Table 3. Multiyear MPLNET lidar deployment data were analyzed and matched with AERONET observations when the solar zenith angle was less than 30∘ to minimize the spatiotemporal differences of the zenith pointing lidar versus the slantwise pointing of the Sun photometer in which sky condition can be quite different at large solar zenith angles. The MPLNET cloud base height data product was matched with the MERRA reanalysis vertical temperature profile corresponding to the geopotential height pressure surface. When a cloud top temperature is less than −37 ∘C, a cloud is designated to be cirrus, while other non-cirrus clouds may contain liquid or mixed-phase particles (Sassen and Campbell, 2001; Campbell et al., 2015; Lewis et al., 2016). Partitioning of the AERONET data set of solar aureole radiances in terms of cirrus clouds, non-cirrus clouds, all clouds, and clear (no cloud base detected) sky condition categories allowed for the empirical determination of potential thresholds for the curvature parameters. For each site, AERONET curvature parameters (k and M) were computed for almucantar and principal plane solar aureole (LA) measurements (i.e., left and right scans separately) and further categorized based on the coincident lidar-detected sky condition. These solar aureole radiances have calibration and temperature characterization applied for the 1020 nm channel and these LA measurements were only quality controlled based on the correlation threshold of 0.99 discussed above.
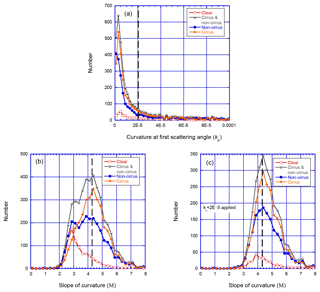
Figure 4a shows the number distribution of the k at NASA GSFC (lat 38.99, long −76.84) for each of the four lidar sky condition categories. The number of the potential clouds is large for magnitudes of k less than . Similarly, Fig. 4b and c show the number distributions of the M at NASA GSFC for each lidar sky condition category. In Fig. 4b, the number of potential clouds generally dominates when the M is greater than 4.3 with generally clear or possibly cloudy conditions when M is less than or equal to 4.3. Some overlapping of the categories for M may be related to the differences in the viewing geometry of the sky between the Sun photometer and the lidar or inhomogeneous cloud conditions.
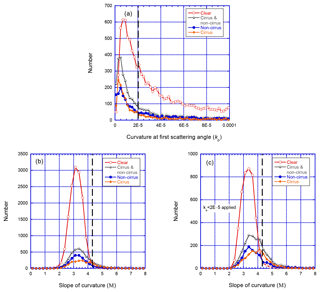
Algorithmically combining the two thresholds of k and M produces a defined distribution of the clear versus cloudy sky condition categories. When the threshold of is applied first, then the distribution of mainly cloudy conditions becomes more distinct as shown for NASA GSFC in Fig. 4c. The maximum in the number distribution for cirrus is near M=4.6 and the maximum in the number distribution of clear sky condition is at M=4.3 (Fig. 4c). At Singapore (lat 1.29, long 103.78), Fig. 5c suggests that the distinction of small aerosol particles and larger cirrus cloud ice crystals allows for adequate separation to identify an observation as cloud contaminated using a threshold of M greater than 4.3. Figure 6a shows the number distribution of the curvature at the first scattering angle for coincident AERONET and MPLNET observations at Sede Boker (lat 30.85, long 34.78). Figure 6c shows the distinction is distributed similarly to GSFC and Singapore to potentially identify cirrus-contaminated observations. For Fig. 6a, the clear sky condition category is much higher in number than other sky condition categories; however, the k values less than the first scattering angle threshold of (shown by the orange vertical line) indicate a significant presence of dust particles rather than cirrus clouds due to forward scattering of dust. Note that as for Figs. 4 and 5, the x axis of Fig. 6a is truncated to but the number distribution continues at values near zero for larger first point curvatures. Sede Boker data in Fig. 6c exhibit a significant contribution of clear conditions are preserved, indicating that this method does not appear to misidentify dust as cirrus at this mixed dust and urban pollution site.
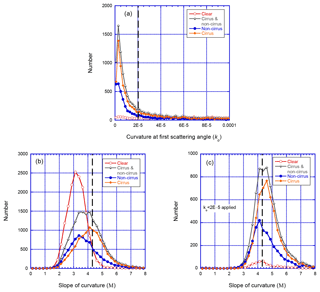
Figure 4NASA Goddard Space Flight Center (GSFC; lat 38.99, long −76.84) AERONET data coincident with MPLNET lidar-derived sky condition categories (clear, both cirrus and non-cirrus clouds, non-cirrus clouds, and cirrus clouds) from 2001 to 2013. The AERONET solar aureole 1020 nm radiances are used to calculate the curvature at the first scattering angle (ko) and the slope of curvature (M) between 3.2 and 6.0∘ scattering angles. (a) The number distribution of ko is shown and the dashed vertical line at ko equal to indicates the threshold at which values less than are considered possibly cirrus cloud contaminated (the x axis is truncated at for viewing purposes). (b) The number distribution of M is shown and M values greater than 4.3 are considered to be possibly cirrus cloud contaminated (the dashed vertical line indicates the threshold of 4.3). (c) Similar to (b) except that the ko threshold () is applied first and, as a result, data greater than 4.3 in this panel are considered to be cirrus cloud contaminated.
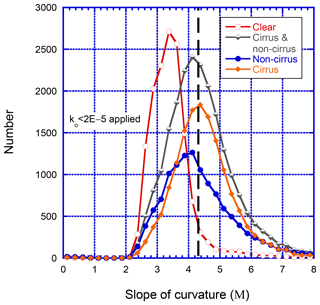
When evaluating all of the collocated AERONET–MPLNET sites in Table 3 (Fig. 7), the maximum in the number distribution for cirrus is at M=4.3 after the threshold is applied with a relative minimum for the clear conditions for M>4.3. Given this information, an empirical threshold of M>4.3 can be established for maximizing the removal of cirrus clouds and minimizing removal of potentially clear data points. As mentioned previously, the almucantar and principal plane sky scans are performed on an hourly basis. If cirrus clouds are homogeneously distributed in the sky, then this assumption allows for the application of the temporal screening of triplet measurements within 30 min of the solar aureole measurement time. As a result, a significant number of cirrus-contaminated measurements for M≤4.3 are likely removed with this procedure given the normally distributed number distribution of cirrus-identified solar aureole measurements around M=4.3. For the Cimel model T instruments, sky scan aureole measurements are superseded by a special solar aureole scan (CCS) performed in the 3.0 to 7.5∘ scattering angle range at 0.3∘ increments (left and right) after each triplet solar measurement; therefore, temporal screening for these triplet measurements is applied within 2 min of the CCS scan. Overall, the aureole curvature cirrus cloud-screening quality control decreases the probability of a cirrus bias in the AOD data set globally by using this standard procedure. However, the Version 3 Level 1.5 AOD data set may still be influenced by optically thin or sub-visible cirrus clouds with ice crystals similar in diameter to coarse-mode aerosols such as those found at polar latitudes or when solar aureole measurements are not available due to instrument malfunction or incomplete data transfer.
Figure 8 shows solar aureole radiances have significant nonlinearity with scattering angle when impacted by cirrus clouds while measurements without cirrus are more linear. The Sede Boker site is influenced by desert dust. Dust particles can affect the calculation of the k parameter to be close to the threshold of even when cirrus clouds are not present (Sede Boker case 1); however, the overall slope is more linear for the non-cirrus case compared to the cirrus case (Sede Boker case 2). As a result, the M parameter is much lower and the algorithm action would be to preserve the Sede Boker case 1 data and remove data for Sede Boker case 2. Note that the k parameter is quite low for Sede Boker case 1 and in general dusty sites may frequently have k less than ; therefore, the M curvature parameter is needed to prevent inadvertent removal of aerosol data. For the fine mode at GSFC case 1 and Singapore, small values of k and large values of M result in removal of the cirrus-contaminated data. For comparison, GSFC case 2 shows significant linearity when cirrus clouds are not present. GSFC case 3 and Trinidad Head case show the variation in these curvature parameters at low optical depths in which only one of the curvature parameters indicates the possibility of cirrus clouds. While these two curvature parameters may be used independently in certain conditions, the current algorithm must employ both curvature parameter thresholds to avoid inadvertently identifying aerosols as clouds in dust and low aerosol loading conditions.
3.3 Level 1.5 quality controls to screen instrument anomalies
While cloud-screening quality controls remove a significant portion of data impacted by cloud contamination and some instrument anomalies, a portion of the remaining AOD data set can be impacted by internal or external instrument anomalies. Most instrument anomalies can be removed utilizing the prescreening steps outlined in the Sect. 3.1, but a number of issues still exist that are more evident after the cloud-screening quality controls have been applied to the data set. A data set with some clouds can mask or offset patterns in the AOD spectra that can clearly identify data anomalies dependent on optical air mass. For AERONET instruments, data anomalies can be dependent on the optical air mass, the sensor head temperature, or leakage, degradation, or looseness of the optical interference filter. Section 3.1 addresses the quality control procedure with respect to the instrument temperature dependence. Some instrument anomalies dependent on the optical air mass include deviations of the measurement time to the true time (i.e., time shift) and obstruction of light into the silicon or InGaAs detector (e.g,. dust, moisture, spider webs). Measurements performed at high latitudes have a slowly varying optical air mass and thus optical air mass pattern recognition is more difficult. The AOD spectra may have optical air mass dependence for out-of-band leakage or degradation of transmittance due to irregularities in the optical filter composition, or the AOD may have significant variability due to a loose filter inside the sensor head.
The retained spectral AOD measurements passing the quality controls from Sect. 3.1 and 3.2 are evaluated as input for the quality controls in the present section. The removal of nearly all of the clouds and most instrument anomalies from the previous steps allow for more defined pattern recognition. This section will discuss the pattern recognition techniques utilized for the time shift and AOD diurnal dependence, provide a description of the detector consistency, and discuss AOD spectral dependence quality controls. Further, the AOD diurnal dependence algorithm can be used jointly with the detector consistency and AOD spectral dependence quality controls to remove anomalous data with more certainty. These quality controls can be applied for multiple days to remove data impacted by anomalies for more than 1 day even when clouds interrupt the day-to-day AOD pattern. The final data set is evaluated for the remaining number of observations in a day and deployment period.
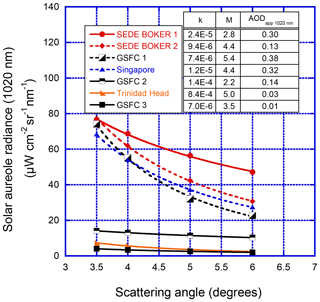
Figure 8The solar aureole 1020 nm radiance versus the scattering angle in degrees for selected sites. Data plots with the dashed lines (i.e., Sede Boker 2, GSFC 1, and Singapore) all qualify for the removal of data due to optically thin homogeneous cloud contamination.
3.3.1 Time shift screening
AERONET data are transferred by satellite data collection platform (DCP), personal computer (PC), or SIM card data transfer. The older Vitel satellite transmitters provided a handshake between the instrument and transmitter allowing for time adjustment, and newer Sutron SatLink transmitters provide a GPS time stamp for each message. While time shift is not an issue for satellite transmissions, the time shift can become more significant for PC data transfer and even some instruments using SIM card data transfer. AERONET has developed a program called cimel_https_connect that can update the processing unit clock of Cimel model 5 instruments. Older instruments (model 4) and old non-AERONET data transfer software (e.g., Cimel ASTPwin) do not have the capability to synchronize the Cimel control box with the time-synced AERONET server. Most non-AERONET software requires the PC time to be updated from a timeserver or GPS system to provide accurate clock synchronization. Even some newer model T instruments transferring data by PC or SIM can have faulty GPS modules in which the clock deviated significantly. Cimel model T instruments may allow for the PC software (e.g., cimelTS_https_connect) updating the time and overriding the GPS module.
A Cimel clock that deviates from true time can result in an optical air mass calculation not appropriate for the actual time, especially when the optical air mass varies relatively rapidly diurnally. This instrument anomaly can result in significant changes in the AOD, which affects all wavelengths but most greatly shorter wavelengths (e.g., 340, 380, and 440 nm) at large optical air mass when it changes rapidly. In general, longer wavelength AODs (675, 870, and 1020 nm) have less impact from erroneous optical air mass calculations due to less influence of molecular (Rayleigh) scattering. As a result, AODs from the longer wavelengths tend to be more stable and AODs from the shorter wavelengths will tend to cross over the longer wavelengths only at one end of the day (near sunrise or near sunset). The timing of the wavelength crossover depends on whether the Cimel clock is too fast or too slow with respect to the actual time. For example, if the time is slow (fast) relative to the actual time, the temporally deviated optical air mass magnitude will be larger (smaller) than the actual optical air mass and thus the short wavelength AODs will be lower (higher) and possibly cross the longer wavelength AODs (significantly increase spectral dependence). In general, Cimel clock temporal deviations in AOD data can be identified using the following:
-
when the shortest available wavelength AOD crosses neighboring UV, visible, and near-infrared channel AODs near sunset and the short wavelength AOD is decreasing significantly relative to a longer stable wavelength (e.g., 870 nm) AOD, this condition indicates the Cimel clock is too fast (Fig. 9a);
-
when the shortest available wavelength AOD crosses neighboring UV, visible, and near-infrared channel AODs near sunrise and the short wavelength AOD is increasing significantly relative to a longer stable wavelength (e.g., 870 nm) AOD, this condition indicates the Cimel clock is too slow (Fig. 9b).
The AOD differences and trends are used for a specific optical air mass interval (2.5–7.0), in which the temporal clock deviation amplifies the error in optical air mass calculations. Individual day screening is limited to mainly cloud-free periods with low AOD in areas with significant variation in optical air mass from ∼1.0 to 7.0.
The time shift algorithm is applied over a multiday period. The algorithm scans the current day plus 19 days in the past (∼3-week period) to determine if three or more days indicate the occurrence of a time shift. If the multiday time shift criterion of 3 or more days is met, then data between the current day and the last occurrence of the time shift are removed from the field deployment. Although the Cimel clock could possibly be adjusted periodically, most time shift issues tend to occur at remote sites and this approach will maximize the removal of data over the multiday period to minimize the negative impact on the data from the clock-shifted anomalies. Moderate to high aerosol loading can partly mask the temporal AOD time shift pattern and these data periods may not be removed completely unless they occur between periods of lower aerosol loading when the clock shift spectral AOD pattern is more defined.
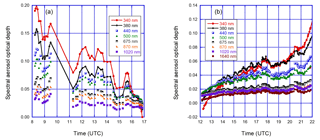
Figure 9Time-shifted aerosol optical depth (AOD) data examples at Málaga (lat 36.72, long −4.48) and Toronto (lat 43.79, long −79.47). Note the line plot is used to emphasize the 340 and 380 nm AOD impact for the time shift. (a) The Level 1.5 AOD cloud-screened-only data measured at the Málaga site on 30 January 2014. These data show the time-shifted AOD particularly at short wavelengths, representing that the instrument clock is too fast. (b) The Level 1.5 AOD cloud-screened-only data measured at the Toronto site on 24 September 2013. The time-shifted aerosol optical depth particularly at short wavelengths represents when the instrument clock was too slow. (a) Also shows the algorithm can be used with data gaps and a lower-temporal-resolution measurement interval compared to (b).
3.3.2 Detector consistency quality control
The instrument external collimator on the sensor head avoids stray light and reduces front lens contamination, while the internal sensor head defines the field of view of the instrument (nominally 1.2∘) by the achromatic front lens, filter, and field stop before each detector. The external collimator is composed of two tubes and the aperture design varies slightly by instrument type. The Cimel model 4 instrument type has two silicon photodiode detectors in the sensor head to measure the Sun and sky while newer model instruments have one silicon photodiode and one InGaAs photodiode detector to measure the Sun and sky on both detectors. One of the detectors could be impacted by an obstruction such as a spider web, insect debris, dust, or moisture. For Cimel model 4 and some model 5 instruments, the sky scan scenario performs two measurements at the 6∘ azimuth angle for the almucantar and 6∘ scattering angle for the principal plane at each wavelength over both detectors. For these older instruments, the solar aureole gain is used for the solar silicon diode detector and the sky gain is used for the sky silicon diode detector. These redundant measurements can allow for detection of the change in the relative signal but this method is currently more appropriate to use for quality controlling the inversion products due to uncertainty in sky calibration. Newer model 5 and model T instruments (with the solar and sky measurements performed on both detectors) do not have the redundant sky measurement; instead, these instruments have a redundant solar measurement at 1020 nm in both collimator tubes, where each solar measurement of the triplet is performed within 8 s of each other. The AOD 1020 nm measurements on silicon and InGaAs detectors can be compared directly to determine if an obstruction exists in front of either of the detectors. Applying a similar approach to Giles et al. (2012), the difference limit (ΔτLimit) can be computed using the optical air mass and AOD magnitude-dependent formulation (Eq. 12):
where MIN[τ1020 nm] is the minimum of the AOD at 1020 nm obtained from the redundant AOD 1020 nm measurements on silicon and InGaAs detectors and m is the optical air mass. The difference limit for an AOD 1020 nm minimum of 1.0 will result in the 0.06∕m 1020 nm difference limit described in Giles et al. (2012). A more lenient approach is used here based on the AOD magnitude to prevent removal of data for low AOD at 1020 nm. At low AOD, the average field instrument uncertainty (up to 0.01) becomes more significant while the maximum AOD error occurs at midday and differences due to their temperature dependency can contribute up to 0.02 AOD bias. Given the relative difference in the AOD 1020 nm measurements, the maximum uncertainties in both 1020 nm measurements must be considered. Therefore, the 0.02 threshold is derived from the average uncertainty (up to 0.01) and the 0.04 limit is derived from the maximum midday error in AOD and temperature dependency (up to 0.02). When more than 10 % of the total measurements for the day exceed the ΔτLimit, data are removed in the following manner.
-
If the AOD 1020 nm silicon subtracted by the AOD 1020 nm InGaAs detector is greater than ΔτLimit, then the silicon side has an obstruction and the entire measurement is removed for both silicon and InGaAs AOD data.
-
If AOD 1020 nm silicon subtracted by the AOD 1020 nm InGaAs is less than −ΔτLimit, then the InGaAs detector has an obstruction and only the InGaAs AOD for 1020 and 1640 nm measurements is removed.
-
If the redundant AOD 1020 nm values are nearly the same (), then an obstruction could possibly exist in the event that a substance (e.g., spider webs, dust, moisture) similarly obstructs both detectors.
For condition (3), this case is further evaluated by the AOD diurnal dependence quality control in the next section.
3.3.3 Aerosol optical depth diurnal dependence
The AERONET instrument has spectral calibrations made and typically applied both before and after field deployment. When the instrument operates in the field, the pre-field spectral calibration applied to the near-real-time data is constant. If the calibration changes significantly during the instrument deployment, the error in the computation of the AOD increases with decreasing optical air mass where the maximum error occurs when optical air mass approaches 1 ( Hamonou et al., 1999). As a result, an apparent diurnal dependence in the AOD can occur depending on the magnitude of the deviation from the pre-field calibration. When both the pre-field and post-field calibrations are applied and data still show a diurnal dependence in the AOD, then the deviation in the field measurements is due to a nonlinear change in the calibration coefficient since Level 2.0 data utilize a linear interpolation between the pre-field and post-field calibration coefficients.
Midday maximum (concave pattern) or midday minimum (convex pattern) of AOD diurnal dependence can be observed at any AOD magnitude but is typically more pronounced at lower aerosol loading due to calibration offset (Cachorro et al., 2004) or instrument anomalies. Quality controls developed for the analysis of the AOD diurnal dependence need to consider the impact of clouds and missing data to assess whether to remove these data while minimizing the removal of data exhibiting true diurnal dependence. For example, one cloud-free day may show diurnal dependence, but on another day, the morning or afternoon data may not be available due to missing data during cloudy or rainy periods. The algorithm must have a sufficient number of observations to perform a robust assessment of the AOD diurnal dependence.
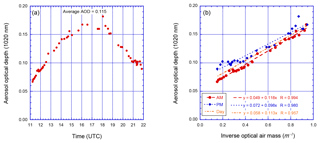
Figure 10AERONET data collected at Rio Branco (lat −9.96, long −67.87) on 30 August 2011. The AOD 1020 nm Level 1.5 with only the cloud-screening algorithm applied to the data. (a) The AOD diurnal dependence presents a concave shape during the solar day. (b) The AOD 1020 nm and the inverse optical air mass show a highly correlated linear fit and the slope is significant for the full day (day), morning (AM), and afternoon (PM). Data separation for AM and PM is defined by the local solar noon, which is 16:31:28 UTC at Rio Branco.
Variation in the number of available measurements in a day due to clouds or instrument issues can limit the application of a single-day-only approach. As a result, the morning and afternoon periods must have at least five measurements separately and the analysis of the full day must have at least 10 measurements. To analyze the diurnal dependence and reduce the impact of outliers, the GNU Scientific Library robust least-squares (RLS) linear regression fit is performed for AOD versus the inverse optical air mass (m−1, where m is approximately the cosine of the solar zenith angle). The slope and correlation coefficient (R) values derived from the linear fit are used as thresholds to determine the magnitude and strength of the diurnal dependence (Table 4).
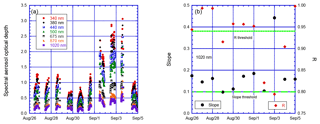
Figure 11AERONET data collected at Rio Branco (lat −9.96, long −67.87) from 15 August to 30 September 2011. (a) The time series of Level 1.5 spectral AOD (cloud screened only) data is plotted from 26 August to 5 September 2011 and shows repeated diurnal dependence for varying magnitudes of AOD. (b) The robust linear fit slope and correlation coefficient (R) are calculated from the AOD 1020 nm versus the inverse of the optical air mass (m−1). For the full day evaluation, the green dashed line indicates the threshold for the slope parameter at 0.1 and the solid green line indicates the threshold for the correlation coefficient (R=0.94). Both the slope and R must exceed these thresholds for at least 3 days scanning from the current day to the last occurrence within the 20-day period to remove the spectral AOD, and in this circumstance, all of the data are removed for the period for Levels 1.5 and 2.0.
The nominal AERONET 440, 675, 870, and 1020 nm wavelengths for the silicon detector and 1640 nm for the InGaAs detector are assessed for diurnal dependence and potential removal of all spectral channels. An example of the AOD diurnal dependence of the 1020 nm wavelength is shown in Fig. 10 at the Rio Branco (lat −9.96, long −67.87) AERONET site where the site manager indicated spider webs were obstructing measurements. If data are removed for the InGaAs detector, then only InGaAs detector data are removed, while removal of the silicon detector data will remove all data including InGaAs detector data, if any. The AOD diurnal dependence is classified as two categories: independent and dependent. If the algorithm meets the strict thresholds for independent diurnal dependence, then all channels exhibiting diurnal dependence can remove data for a day, except the 1020 nm channel since some old data with temperature defaults may exhibit false diurnal dependence. Otherwise, all of the above channels are used for the dependent diurnal dependence quality control. The dependent diurnal quality control relies on more lenient thresholds for the slope and R; however, the removal of data generally requires that another quality control flag is set such as the detector consistency quality control (Sect. 3.3.2), in which an obstruction was identified in front of one of the detectors or at least one additional qualified wavelength meeting the slope and R thresholds. When a qualified wavelength indicates dependent AOD diurnal dependence for day or both AM and PM and the AM and PM slopes are positive, then the entire day can qualify for independent removal. This methodology allows for a more skilled approach in removing only data affected by instrumental anomalies while minimizing the removal of data coincidently producing a true diurnal dependence signature.
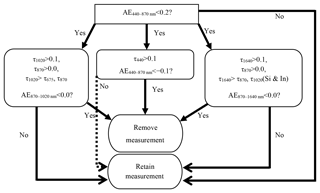
Figure 12Flowchart of the reverse spectral dependence algorithm used to remove cloud contamination artifacts and instrument anomalies. The 1640 nm wavelength is available on some Cimel model 5 instruments and all model T instruments.
The AOD diurnal dependence identification can be complicated by changes in aerosol loading during the day, cloud artifacts, and missing data. A multiday scan must be performed to maximize the removal of data impacted by instrument anomalies. A multiday assessment example is provided in Fig. 11 for Rio Branco. Figure 11a shows that the spectral AOD varies significantly diurnally for the period from 26 August to 5 September 2011, especially for the 870 and 1020 nm near-infrared wavelengths. Figure 11b shows evaluation of the slope and correlation coefficient (R) for the AOD 1020 nm daily variation, which shows 7 of the 10 days exceeding the thresholds (slope > 0.1 and R>0.94) and wavelengths established in Table 4. For these data to qualify for dependent AOD diurnal dependence removal, additional information is needed such as another qualified wavelength with slope and R exceeding the thresholds. For this case, the AOD 870 nm daily slope and correlation parameters (not shown) also exceed the thresholds, which lead to the elimination of these data from Levels 1.5 and 2.0. Similar to the time shift screening in Sect. 3.3.1, the AOD diurnal dependence algorithm scans the last 19 days including the current day to determine the first occurrence and last occurrence of the dependent and independent AOD diurnal dependence. When three or more days are identified, data are removed from the first occurrence to the last occurrence of AOD diurnal dependence during the 20-day period. The multiday screening allows for the elimination of data affected by an obstruction in the instrument field of view even with moderately high aerosol loading in the near-infrared wavelengths and when days have an incomplete number of measurements from the established protocol due to clouds.
3.3.4 Reverse spectral dependence
While the majority of the cloud-screening quality controls remove aerosol measurements contaminated by clouds, some spurious points or slowly varying changes in cloud properties may still affect the data set at this point in the algorithm. A new method (Fig. 12) utilizing the AE is applied to the remaining data set for evaluation of cloud contamination. AEs derived from anomalous AOD measurements due to instrument artifacts may produce a similar signature. The spectral dependence among the wavelengths is now much improved compared to Version 2 by removing temperature dependencies that influenced the calculation of the AE at low AODs, reducing the effect of improper spectral dependence due to temperature anomalies.
The AE is computed utilizing the OLS fit of the logarithms of AOD and wavelength for the ranges of 440–870, 870–1640 nm (if 1640 nm is available), and 870–1020 nm (for silicon detectors only) (Eck et al., 1999). The reverse spectral dependence algorithm in Fig. 12 removes cloud-contaminated points utilizing these AE ranges depending on the instrument model. Figure 13 shows the removal of the anomalously high AOD at the Bratt's Lake (lat 50.20, long −104.71) AERONET site in southwest Canada. In Fig. 13b, all negative and a few positive AE values are identified and the algorithm removes nearly all of the residual cloud contamination in this case. However, the penultimate and final measurements in Fig. 13c have slightly higher AOD than the previous hour of data, which may be due to marginal contamination by optically thin cirrus clouds. Additional algorithm development is still needed to further enhance the removal of cloud-contaminated data with small ice crystals while not removing dust aerosols.
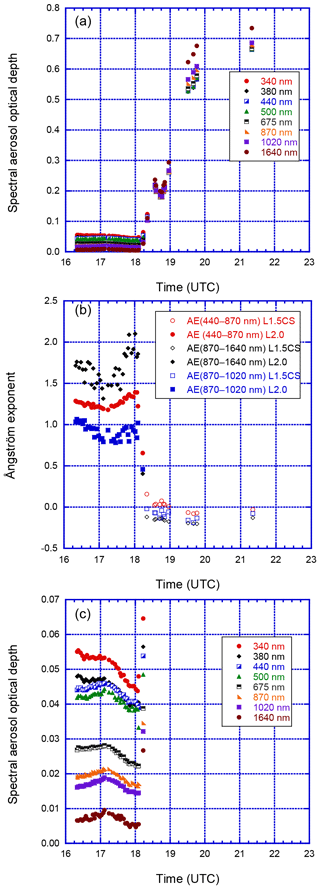
Figure 13 Data from Bratt's Lake (lat 50.20, long −104.71) on 7 January 2007. (a) The Level 1.5 data with only the cloud-screening (CS) algorithm applied show cloud-contaminated data remain after 18:10 UTC. (b) For the same period as in (a), the Ångström exponent values decreased significantly to a level at which coarse-mode aerosol particles are not expected. (c) The final Level 1.5 and Level 2.0 data series after the reverse spectral dependence quality control or additional cloud-screening method has been applied to the stand-alone Level 1.5 CS data.
3.3.5 Aerosol optical depth spectral dependence
The wavelength dependence of AOD is typically strong for fine-mode aerosols (e.g., pollution or smoke) and weak for coarse-mode aerosols (e.g., dust or sea salt). The AE provides an index of the strength of the spectral dependence related to the estimation of the possible aerosol size (Eck et al., 1999). In general, the AE440−870 nm will typically provide values between approximately 0.0 and 3.0. These prospective values indicate no spectral dependence at AE440−870 nm of 0.0 and very strong spectral dependence with an AE440−870 nm near 3.0 (AE values of 3.0 have not been observed in good-quality data with sufficiently high AOD). The spectral dependence can be used to evaluate the quality of each channel given that most channels in the measurement suite adhere to the stated AOD uncertainty of 0.01 for wavelengths ≥ 400 nm and 0.02 for wavelengths < 400 nm (Eck et al., 1999). The fit of the AOD with wavelength on a logarithmic scale should generally be linear for coarse-mode-dominated or fine- or coarse-mode particle mixtures. However, in moderate- to high-aerosol-loading cases (especially when fine mode dominated), a quadratic or cubic assumption is needed to fit the data depending on the wavelength range under evaluation (Eck et al., 1999; O'Neill et al., 2008). The OLS methodology is perturbed by the presence of outliers and therefore skews the fit towards outliers. If the boundary wavelengths are impacted by anomalies, the OLSs can poorly fit other intermediate wavelengths.
In an effort to reduce the influence of outliers, the GNU Scientific Library (GSL Version 2.2.1 C compilation) RLS technique is utilized to improve the removal of spectral AOD outliers. In general, the OLS technique is sensitive to the endpoints and to the number of points used in the regression. For example, the outlier detection will have less skill with a few points or anomalous endpoints. The RLS scheme uses an iterative approach with up to 100 passes using the Tukey biweight function and assigning the outliers a lower weight with each pass. The RLS approach allows for the more meticulous removal of wavelengths out of spectral dependence and more importantly preserves mid-visible wavelengths that could be removed incorrectly when utilizing the OLS method.
Outlier detection is performed utilizing the uncertainty of the AOD measurement and providing an allowable tolerance in the fit given the potential irregular nature of the uncertainty (0.01 to 0.02). For wavelengths ≥ 400 and <1600 nm, the allowable AOD difference between the measurements and fit for a candidate wavelength is (0.02 ⋅ AOD) + 0.02, based on the stated AOD uncertainty for these wavelengths (Holben et al., 1998; Eck et al., 1999). For wavelengths < 400 and 1640 nm, the allowable AOD difference between the measurements and fit for a candidate wavelength is (0.02 ⋅ AOD) + 0.04, which is adjusted for greater uncertainty at the UV wavelengths and greater uncertainty in the larger spectral range to fit the 1640 nm wavelength.
The spectral outlier procedure begins by identifying and removing any negative AOD values that are not within the allowable AOD difference from the RLS linear fit. Negative AOD due to slight calibration drift can be observed at very clean locations; otherwise, these negative values may be anomalous. The algorithm will evaluate each wavelength separately and compute the RLS linear fit based on the remaining wavelengths producing the slope, intercept, and R2 values, for which the slope and intercept are used to compute the AOD fit at the wavelength under evaluation. If the algorithm does not identify any wavelengths for removal, then the procedure is complete. If AOD is low (AOD440 nm<0.1) and one wavelength AOD exceeds the maximum allowable difference, then the wavelength will be removed due to the linear fit deviation. However, if more than one wavelength has AOD marked for removal for the low AOD condition, then the wavelength with the largest departure from the linear fit to the measurement and largest R2 will qualify for removal.
In the case of higher AOD (AOD440 nm≥0.1), the algorithm stores the information from the RLS linear fit and continues to perform a RLS quadratic fit (400 nm ≤ λ≤1020 nm) or a RLS cubic fit (λ=1640 nm). If the candidate wavelength deviates from the allowable difference in fit to the measurements for the higher-order fits, then the wavelength will be removed if it is identified as a wavelength that corresponds to the maximum deviation for the RLS linear fit. Figure 14 provides an example of this condition at the Osaka (lat 34.65, long 135.59) AERONET site. After each wavelength removal regardless of order of the fit, the algorithm repeats until no wavelength removals occur or when fewer than three wavelengths remain.
3.3.6 Large aerosol optical depth triplet variability
In addition to growth of hygroscopic aerosols near cumulus cloud boundaries and large triplet variability at short wavelengths in highly variable fine-mode plumes, a misaligned filter due to improper filter wheel movement or dust on the filter may produce large AOD triplet variability (AOD max–AOD min). The cloud-screening triplet variability quality control (Sect. 3.2.1) removes the entire measurement when 675, 870, and 1020 nm AOD triplets all have large triplet variability exceeding the threshold (0.01 or 0.015 ⋅ AOD, whichever is greater). A situation may exist in which one of those wavelengths or shorter wavelengths are impacted by a filter anomaly, making it necessary to assess the large AOD triplet variability. If the triplet measurement is identified for high AOD retention (Sect. 3.1.6), then the following large adjacent triplet quality control is not performed because very high aerosol loading in fine-mode events can lead to large triplet variability naturally. Occasionally, if the triplet is very large and exceeds the limit of 0.03+0.2 ⋅ AOD, then the wavelength is removed independently of the next longer wavelength.
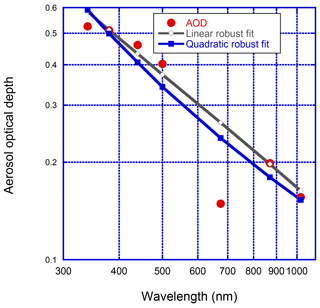
Figure 14AERONET data from the Osaka (lat 34.65, long 135.59) site on 16 October 2006 at 22:02:11 UTC. The plot shows AOD versus the wavelength with lines identifying the linear and quadratic robust regression fits on a logarithmic scale used by the AOD spectral dependence algorithm. The 675 nm channel is clearly anomalous with fits differing by 0.12 for linear fits and 0.09 for quadratic fits. In addition, the AOD at 340 nm appears anomalous with deviations of 0.06 from linear fit and 0.07 from quadratic fit. While both wavelengths exceed their respective AOD thresholds (0.023 for 675 nm and 0.051 for 340 nm), the algorithm determines the maximum deviation for linear and quadratic fits and removes the AOD at 675 nm measurement. A subsequent scan by the algorithm determined that the remaining AOD measurements from 340 to 1020 nm were within the established fit deviation thresholds.
To further screen anomalous triplets individually or the entire day, each triplet and wavelength is evaluated using the triplet variability from the shortest wavelength (e.g., 340 nm) and the next longer wavelength (e.g., 380 nm). The allowable triplet variability limit is computed based on the aerosol loading and the AOD triplet variability in the next longer wavelength: 0.03+0.02 ⋅ AOD + triplet_variability_of_next_longer_wave. If the total number of triplets for a wavelength exceeding the large triplet variability threshold is more than 25 %, then the AOD measurements for the wavelength are removed completely for the entire day. Figure 15 shows the large triplet variability removal at the Polar Environment Atmospheric Research Laboratory (PEARL) (lat 80.05, long −86.42) AERONET site in northern Canada. The triplets at shorter wavelengths may naturally exhibit relatively large triplet variability; hence it is necessary to check the shorter wavelength in comparison to the next longer wavelength, which typically will be more stable if clouds do not impact the measurements.
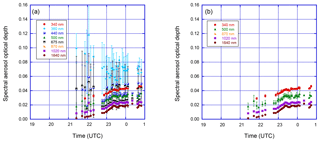
Figure 15Spectral AOD exhibiting large triplet variability at PEARL (lat 80.05, long −86.42) on 25 August 2013. (a) Version 3 Level 1.5 cloud-screened-only data are plotted with large triplet variability and these data were not removed by the cloud screening. The error bars represent the triplet variability (AOD max–AOD min) divided by 2 so the full range represents the AOD triplet variability. The large triplet variability occurs mainly at shorter wavelengths than 675 nm. (b) Data affected by large triplet variability (i.e., AOD 380 nm, AOD 440 nm, and AOD 675 nm) are removed by using the Level 1.5 large triplet variability quality controls.
3.3.7 Remaining measurement evaluation
After the previous quality control algorithms have been applied, extraneous data points may remain and are identified for possible removal. A number of conditions have been implemented based on the total data removed for the day, number of wavelengths remaining for the day, and number of measurements for a wavelength for a deployment. These “cleanup” conditions below will remove all wavelengths in a day for any of the following conditions dependent on the high AOD retention from Sect. 3.1.6 and the number of wavelengths in a day:
-
if high AOD retention and fewer than two wavelengths remain in a day;
-
if high AOD retention and two wavelengths but are not 870 and 1020 nm in a day;
-
if no high AOD retention and fewer than three wavelengths remain in a day;
-
if no high AOD retention and fewer than half of the wavelengths remain in a day.
Each wavelength must be evaluated for remnant data artifacts. If greater than 50 % of the total cloud screened AOD data for a wavelength in a day are removed, then AOD measurements for the candidate wavelength will be removed for the day. Further, a condition is implemented to remove specific wavelengths for an entire deployment. For example, if the number of measurements for a wavelength is less than 20 % of the total cloud screened data set for a deployment, then all of the measurements for the specified wavelength will be removed for the deployment. These removal conditions are necessary to fully quality control the spectral AOD data set and avoid unphysically irregular and fragmented data sets.
3.4 Algorithm performance assessment
Data quality controls applied to the quality-controlled Level 1.0 data set are evaluated for removal performance for each part of the Level 1.0 prescreening and Level 1.5 algorithm. The Level 1.0 prescreening is applied to about 84 million solar triplet measurements from 1993 to 2018. The radiometric sensitivity screening (see Sect. 3.1.2) for the DN of 1020 nm removes about 36 % and the digital voltage triplet variance greater than 0.16 (see Sect. 3.1.3) removes nearly 11 % of the Level 1.0 data. The remaining Level 1.0 prescreening that checks for radiometric sensitivity screening for DN of 870 nm, extreme temperatures ( or TS>100 ∘C), and bad measurement configuration conditions removes approximately 0.5 % of the Level 1.0 data. Therefore, nearly half (48 %) of the initial 84 million solar triplet measurements are removed by the Level 1.0 prescreening steps due to the presence of clouds in the solar measurements that greatly reduce the signal (e.g., stratus clouds) or exhibit significant temporal variability within the 1 min triplet measurement sequence (e.g., cumulus clouds).
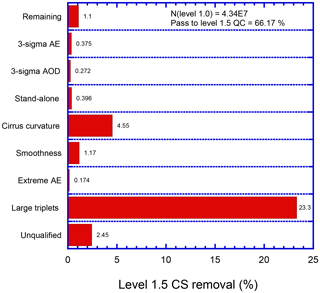
Figure 16The Level 1.0 AOD measurement removal by the Level 1.5 cloud-screening algorithm from 1993 to 2018. The plot shows the impact of the major cloud-screening steps in the Level 1.5 cloud-screening algorithm and removal of these data applies to all wavelengths. The triplet criterion removes more than 23 % of the Level 1.0 data. Nearly 5 % of the Level 1.0 data are removed due to cirrus cloud contamination. The “remaining” category indicates the check performed after each cloud-screening step to determine if enough measurements are available and do not meet the high AOD retention criteria. The “unqualified” category indicates data that are not triplets or lack sufficient channels to participate in the cloud-screening algorithm.
The Level 1.5 quality control algorithm is divided into the two main steps for cloud screening and instrument data anomaly removal. Figure 16 shows the percentage of the Level 1.0 data removed by the Level 1.5 cloud-screening quality control. Over 23 % of the removal in the cloud-screening algorithm was due to the large triplets at the long wavelengths (675, 870, and 1020 nm). Nearly 5 % of the removal of the Level 1.0 data was due to the presence of cirrus clouds as detected by the solar aureole curvature algorithm and is significant since a cirrus contamination bias is evident in the AOD in Version 2 Level 2.0 data set. The “unqualified” category indicates data that are not triplets or lack the sufficient channels to participate in the cloud-screening part of the algorithm and these measurements are rejected from Level 1.5. Finally, spectral AOD removed due to too low negative values (AOD < −0.01) has maximum removal of approximately 0.5 % for 380 nm and 1 % for 340 nm of the total Level 1.5 AOD measurements due to 0.02 uncertainty in the UV range at very low optical depths, while other AOD wavelengths have generally much less than 0.5 % removal. After all of the data are cloud screened, about 66 % of the Level 1.0 data are passed to the second part of the Level 1.5 instrument quality control algorithm for examination of the instrument anomalies and other spurious clouds and artifacts.
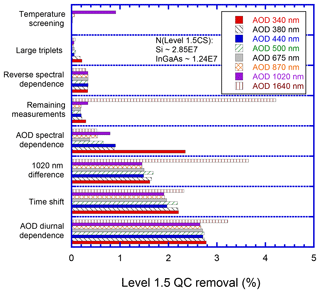
Figure 17Level 1.5 quality control algorithm wavelength-dependent impacts for each major step for the period analyzed from 1993 to 2018. The most significant removal for most channels is due to AOD diurnal dependence, time shift, and difference between AOD at 1020 nm for the silicon and InGaAs detectors (resulting from collimator inconsistency). The AOD at 340 nm has significant removal of AOD spectral dependence. The 1640 nm InGaAs channel has significant removal by “remaining measurements” since this wavelength cannot be checked for quality when the silicon channels are not available. Temperature screening mostly applies to the 1020 nm silicon wavelength due to its strong temperature dependence near the edge of the signal sensitivity of the silicon photodiode detector.
The second stage of the Level 1.5 quality control algorithm utilizes measurements passed from the cloud-screening algorithm. While the cloud-screening algorithm rejects the entire measurement in the presence of clouds, the instrument quality controls can also reject the entire measurement or remove data by wavelength depending on the anomalous condition. Figure 17 shows the removal of Level 1.5 cloud screened data due to mainly instrument anomalies for each wavelength. More than 2.5 % of the data are removed due to the AOD diurnal dependence screening, about 2 % for the time shift screening, and 1.5 % for the AOD 1020 nm difference screening. These three instrument quality control algorithms remove, in general, the most across all wavelengths. Some removal occurs significantly spectrally for the InGaAs channel (1640 nm). The InGaAs channels can be affected in some instruments more significantly by water contamination as the InGaAs side of the collimator is facing away from the Sun when in the parked or resting position. Further, when the algorithm removes all of the silicon channels, the remaining InGaAs channels are also removed since no other independent method exists to check the InGaAs channel data quality. The “remaining” measurement removal shows that nearly 4 % of the cloud screened data are removed from the InGaAs data set. The AOD spectral dependence removes more than 2 % of the 340 nm wavelength data, which tends to be the most unstable wavelength (due to filter degradation), and about 0.5 % for all other wavelengths. The temperature screening removal of missing or anomalous temperatures mostly affects the silicon 1020 nm wavelength with nearly 1 % of the cloud-screened data removed due to their large temperature dependence compared to the other wavelengths.
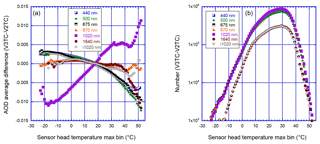
Figure 18Difference in AOD response between Version 3 and Version 2 temperature correction applied to Version 3 AOD data based on the sensor head temperature from 1993 to 2018. The Version 2 temperature correction assumes temperature ranges for 1020 nm and no temperature correction for all other wavelengths, while Version 3 temperature correction characterizes the temperature response for each filter or set of default filters for each instrument for wavelengths ≥ 400 nm. (a) The AOD average difference plotted for each 1 ∘C temperature bin from −25 to +55 ∘C. The AOD at 1020 nm exhibits an opposite trend compared to the other wavelengths varying from −0.01 at low temperatures to up to +0.01 at high temperatures. Other wavelengths have slight differences at cold temperatures but apparent dependencies at high temperatures greater than 40 ∘C possibly due to extrapolation of the temperature coefficients to higher temperatures. (b) The number of measurements plotted for each 1 ∘C temperature bin with a minimum of 1000 observations.
The AOD data will be qualified for consideration of Level 2.0 once it passes the Level 1.5 checks. To reach Level 2.0, these data must meet the following conditions:
-
Data must have pre-field and post-field calibration applied, or in some cases, the pre-field deployment or post-field deployment calibration may be made constant for the deployment after evaluation of the best calibration values.
-
Temperature characterization must be applied utilizing the temperature correction for the instrument or default values for each wavelength.
-
Instrument must be designated as the primary instrument for the site.
Once the above conditions are met, these data are considered to reach Level 2.0. These Level 2.0 data are recommended for publication and use in various atmospheric applications. The automated quality control algorithm attempts to preserve aerosol data while removing data artifacts. Some unusual atmospheric conditions (e.g., small cirrus particles r<5 µm) or rare instrument anomalies (e.g., loose filters or partially removed multiday AOD diurnal dependence) affecting the AOD may rarely pass through the algorithm and users are advised to consider inspecting these data carefully when using them for detailed studies. Further, optical air-mass-dependent anomalies such as the time shift and AOD diurnal dependence quality controls may allow data to pass when aerosol loading is high or too few data exist to make an assessment. These quality controls can determine patterns more skillfully at lower aerosol loading, which could result in retaining potentially contaminated high aerosol loading periods when the pattern may be less defined and does not meet the quality control thresholds.
The subsequent sections discuss the impact of the temperature characterization on the Version 3 Level 2.0 AOD data to quantify the change in regards to the Version 2 Level 2.0 data set. Further, the assessment of the Version 3 near-real-time product is made to determine the average bias of the AOD based on the applied calibration. Finally, an analysis is made of the Version 3 Level 2.0 AOD long-term averages for select AERONET sites and these are compared to the Version 2 Level 2.0 AOD long-term averages.
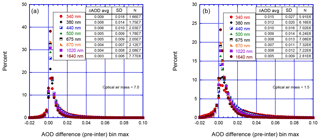
Figure 19Using data qualified as Version 3 Level 2.0, aerosol optical depth (AOD) average difference comparing measurements only with the pre-field calibration applied versus instruments with both the pre-field and post-field calibrations applied from 1993 to 2018. Calibration sites are excluded from the analysis. The histogram of AOD differences is provided for the optical air mass range in (a) and range in (b). The average difference is largest for the UV wavelengths and smallest for the longer wavelengths.
4.1 Temperature characterization evaluation
The accurate measurement of the spectral direct-beam Sun intensity (from which AOD is computed) depends on the sensor head temperature of the instrument as discussed in Sect. 2. The sensor head temperature can vary significantly since the optical head canister is heated by the Sun and can be much higher (>10 ∘C) than the ambient temperature, especially near solar noon. The temperature sensitivity of the silicon detector is more significant for the 1020 nm filter due to the proximity to the edge of the spectral range of the detector in which temperature dependence becomes more significant. The temperature dependence for all wavelengths may vary due to the composition and/or manufacturing quality of the filters and/or detectors. Due to technical difficulty, the ultraviolet wavelength (λ<400 nm) filters have not been temperature characterized in Version 3; however, UV filters may have a temperature dependence. Figure 18 shows the difference in the AOD temperature coefficients for Version 3 temperature correction applied to Version 3 data and Version 2 temperature correction applied to Version 3 AOD data from 1993 to 2018. The AOD varies most significantly for the silicon 1020 nm channel with a full range of ∼0.02 for sensor head temperatures between −25 and +55 ∘C. Notably, the shorter wavelength channels and the InGaAs wavelengths (i.e., 1020 and 1640 nm) do not show significant change in AOD less than 40 ∘C. All of the wavelengths, except the silicon 1020 nm, show an AOD difference decrease from −0.005 to −0.010 for temperatures greater than 40 ∘C, which may be due to changes in instrument characteristics (e.g., electronic instability in the instrument) at high temperatures. The decreasing AOD difference with increasing temperature may be related to the smaller number of observations at high temperatures and contribution by instruments with temperature characterization measurements that did not reach temperatures greater than 40 ∘C. Temperature characterization has proven to be a small yet necessary adjustment to the AOD computation and this improvement is especially exhibited in polar regions or at sites with very low aerosol loading in which the Version 3 AOD spectra have much less crossover, allowing for the computation of more accurate AEs than in the Version 2 data set.
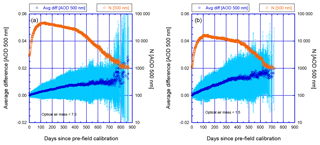
Figure 20Using data qualified as the Version 3 Level 2.0 aerosol optical depth (AOD) 500 nm average difference comparing measurements only with the pre-field calibration applied versus instruments with both the pre-field and post-field calibrations applied from 1993 to 2018. The AOD average differences are provided for the optical air mass range in (a) and range in (b). Vertical bars represent the standard deviation for each day bin. The secondary y axis on a logarithmic scale represents the number of measurements of AOD at 500 nm for each day bin.
4.2 Level 1.5 near-real-time aerosol optical depth bias and uncertainty
The Version 3 near-real-time data set provides improved data quality compared to Version 2 since the algorithm has improved cloud screening and instrument quality controls applied to the data. The data set can vary in the near-real-time interval from current day up to 1 month as ancillary data sets are received and processed; hence, these database changes invoke reprocessing of the AOD throughout the near-real-time phase. Once AOD data have been pre-field and post-field calibrated, then these data may be raised to Level 2.0 as described in Sect. 4. The near-real-time data using only constant pre-field calibration are compared to the quality-assured data set that uses both the pre-field and post-field calibrations applied to the data with the assumption of linear interpolation. Figure 19 shows the distribution by wavelength for this comparison of the near-real-time and quality-assured data set for the entire database of Level 2.0 qualified data excluding calibration site data and deployments using a copied pre-field or post-field calibration. These results are based on the Version 3 Level 2.0 data set in which the Level 1.5 algorithm scans the entire deployment. The AOD difference histograms were computed for optical air mass ranges ( and 1). The optical air mass range includes all of the data; however, these AOD difference magnitudes will be constrained by the improved AOD measurements at large optical air mass and influenced toward Northern Hemisphere winter midlatitude sites when AOD tends to be low. The optical air mass range includes data that will provide AOD measurements near solar noon and these measurements are generally less accurate (δτ⋅m) than at larger optical air mass. In addition, optical air mass range data include a greater influence of tropical locations and data from the midlatitude summer when AOD tends to be moderate to high.
Figure 19 shows the AOD average differences for the 1 range indicate a positive bias in which the AOD for the pre-field only calibration tends to be on average +0.003 to +0.009 higher than the AOD using the interpolated calibration. Similarly, AOD average differences for the range show a positive bias and similar wavelength variations but up to 2 times larger differences than for the range. The largest average differences and standard deviations are for the UV wavelengths, which have greater uncertainty as discussed in Sect. 2. The AOD differences for the wavelengths longer than 500 nm have about less than half the bias of the UV wavelengths. The Level 1.5 algorithm performance improves with increased data availability, such as a greater number of wavelengths or number of days. When an instrument deployment begins, some of the Level 1.5 algorithm steps such as multiday removal schemes are not available until several days into the deployment, producing larger differences in the near-real-time AOD with respect to the final product. While wavelength-dependent biases of +0.003 to +0.009 for the range and +0.006 to +0.015 for the range exist when only the pre-field calibration is applied, the difference can vary significantly depending on each instrument deployment, necessitating continued post-field calibration and maintenance effort.
When an instrument is deployed in the field, the pre-field calibration is used constantly until the post-field calibration is assessed and applied to the data using linear interpolation. The difference of pre-field calibration AOD minus the post-field calibration AOD average difference and standard deviation are computed in day bins for the number of days since the pre-field calibration. Figure 20 shows the AOD 500 nm average difference for the optical air mass ranges: and . Instruments typically operate in the field between 12 and 18 months from the pre-field calibration date; however, the instrument deployment may be delayed and the instrument may not begin operation for a few months after the pre-field calibration. Thus, the number of AOD measurements in the days since pre-field calibration bins increases to a maximum at about 100 days. Some instruments may operate longer in the field to support field campaigns and other scientific priorities. Figure 20 shows that the AOD average difference and the standard deviation slowly but steadily increase for each optical air mass range. At about 1.5 years after pre-field calibration (∼550 days), the AOD average difference is about +0.010 with a standard deviation of 0.015 for optical air mass range and +0.017 with a standard deviation of 0.021 for . For the UV wavelengths, the average differences, and the standard deviations tend to increase slightly while the longer visible and near-infrared wavelengths tend to decrease slightly. Therefore, the quality of the Level 1.5 near-real-time AOD changes with time with high-quality data at the start of the deployment but up to a +0.02 bias and 0.02 uncertainty for data collected more than 1.5 years since pre-field calibration.
4.3 Multiyear monthly comparisons of Version 3 Level 2.0 to Version 2 Level 2.0 databases
Long-term average differences between the Version 3 and Version 2 Level 2.0 data sets provide insight into the changes to be expected across most AERONET sites. The analysis of the Version 3 and Version 2 data sets shows mainly the differences in the AOD, AE440−870 nm, PW in centimeters, and the number of days clustered near zero (Fig. 21). Note that PW data quality depends on the quality of the input wavelengths (675 and 870 nm) and no further quality control is made on the 935 nm wavelength. The increases in the Version 3 Level 2.0 multiyear monthly average AOD are often due to the increased presence of fine-mode particles from high aerosol loading events as well as aerosols in near-cloud environments (Eck et al., 2018). The decrease in the multiyear monthly average AOD is due to the improved removal of clouds in the Version 3 quality control algorithm. Generally, the results should be very similar between Version 3 and Version 2 in AOD calculation since the temperature characterizations as well as NO2 absorption contributions typically have relatively minor contributions.
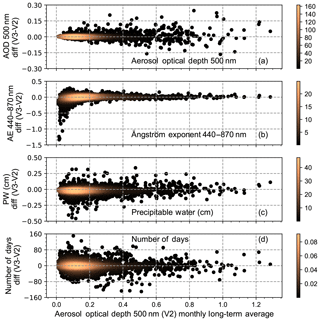
Figure 21Comparison of Version 3 and Version 2 Level 2.0 multiyear monthly average data sets. (a) The aerosol optical depth (AOD) interpolated to 500 nm to include data from instruments without 500 nm. (b) The Ångström exponent (AE) is calculated utilizing the inclusive ordinary least-squares regression fit from 440 to 870 nm. (c) The precipitable water in centimeters is derived from the 935 nm water vapor channel. (d) The difference in the number of days is determined for each monthly long-term average.
Other factors affecting the AOD calculation include the adjustment of site coordinates and elevation information for about 100 AERONET sites utilizing GPS or a digital elevation model. A few rare extreme coordinate adjustments of more than 25 km included Petrolina_SONDA (latitude −9.0691, longitude −40.3201), Ilorin (latitude 8.4841, longitude 4.6745), and Ouagadougou (latitude 12.4241, −1.4872). A large site coordinate adjustment can complicate satellite matchups for these few cases but the review of all AERONET sites showed that a less than 5 km distance adjustment and less than 100 m elevation adjustment were needed for most of these 100 suspected sites.
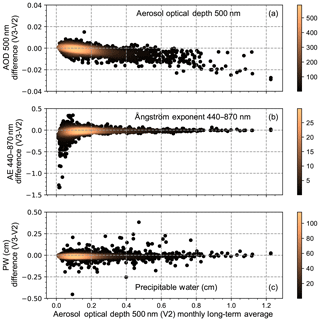
Figure 22Comparison of Version 3 and Version 2 Level 2.0 multiyear monthly average data sets for time-matched instantaneous observations in both data sets. The panels are similar to those in Fig. 21.
Figure 22 shows plots similar to Fig. 21 except that for the observations used for the multiyear monthly averages in both data sets the instantaneous observations are time matched; hence, each data set has the same number of observations and number of days. The time-matched long-term average comparison provides insight into the AOD calculation differences rather than impacts due to cloud screening and instrument quality controls applied in Level 1.5. Table 5 shows the multiyear monthly overall standard deviation, and AOD maximum to minimum range is significantly reduced compared to the data set without time-matched observations. Figure 22a shows a slight decreasing trend in Version 3 AOD for increasing Version 2 AOD and most of the larger AOD deviations are for sites in Asia where the impact of the OMI NO2 corrections may be contributing to the slight shift of up to 0.02 for a few months and sites.
Table 5Statistics corresponding to Figs. 21 and 22 for AOD interpolated to 500 nm, Ångström exponent at 440–870 nm, precipitable water (cm), and the number of days. Version 3 Level 2.0 and Version 2 Level 2.0 data are compared for the same multiyear monthly averages when sites have a total of more than 1000 days for all months and more than 30 days in each month. Data represented as “matched” indicates the further condition that the exact observations were matched in Version 2 and Version 3 Level 2.0 multiyear monthly average data sets. Note that PW values for the “matched” data set are approximately the same as the unmatched data set.

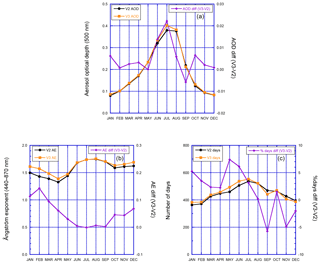
Figure 23Long-term multiyear (1993–2016) monthly average comparisons of the Version 3 and Version 2 Level 2.0 data sets at the NASA Goddard Space Flight Center (GSFC), Maryland, USA. Panel (a) provides the AOD interpolated to 500 nm for each version on the primary y axis and differences on the secondary y axis. Panels (b) and (c) are plotted similarly for the AE440−870 nm and the number of days in the multiyear monthly average, respectively.
For unmatched or time-matched data sets in Table 5, the PW climatology changed on insignificantly average. The multiyear monthly overall day difference (Table 5) for the unmatched PW data set was near zero and the standard deviation was near 25 days while the maximum of +150 and minimum of −130 days indicate significant variability due to the differences in quality controls among the algorithms. Overall, the changes from Version 2 to Version 3 in PW are generally negligible in terms of the contribution to the calculation of the AOD.
The multiyear monthly overall average difference between Version 3 and Version 2 for unmatched data is +0.002 and time-matched data is −0.002, indicating remarkable consistency among the long-term average quality-assured data sets. For example, the NASA GSFC AERONET site multiyear monthly average (Fig. 23) located 20 km north of Washington, D.C., shows minor variations in the AOD and an increase in AE due to removal of cirrus clouds during the winter months and increasing AOD in the summer months due to the greater abundance of cloud-processed or near-cloud aerosols (Eck et al., 2014).
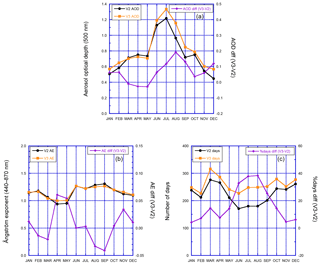
Figure 25Similar to Fig. 23 except for Xianghe, China (lat 39.75, long 116.96), from 2001 to 2017, except 2009.
Comparison of AE440−870 nm in Figs. 21b and 22b shows significantly lower values for Version 3 than Version 2 Level 2.0 at low optical depth. An analysis of long-term average data at Lulin, Taiwan (lat 23.47, long 120.87), identified significant reduction of Version 3 AE relative to Version 2 AE at very low AOD due to temperature characterization that resulted in improved AOD spectral dependence (Fig. 24). The Lulin site is a high-altitude mountain station located in south central Taiwan, and this site is affected episodically by trans-boundary aerosol plumes from East and Southeast Asia (Lin et al., 2013; Wang et al., 2013). In eastern China, multiyear monthly averages from the Xianghe site (lat 39.75, long 116.96) show a significant Version 3 AOD increase of 0.2, while maintaining nearly the same AE and increasing the number of days up to near 40 % for the multiyear monthly average in July and August (Fig. 25). The Xianghe site is located to the east of Beijing and is routinely impacted by urban pollution and episodically by biomass burning and desert dust events (Li et al., 2007). The significant increase in the AOD for Xianghe is likely due to the retention of highly variable fine-mode aerosol events particularly at very high AOD, which were removed by the Version 2 cloud-screening wavelengths utilizing large triplets of less than 675 nm (Eck et al., 2018). Additionally, some very high AOD events at Xianghe were previously removed by the Version 2 mid-visible low signal threshold but are now retained in Version 3, but often only for wavelengths longer than 675 nm, so the statistics for these days are not accounted for in the 500 nm data shown in Fig. 25.
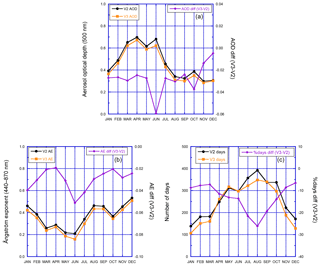
Figure 27Similar to Fig. 23, except for IER Cinzana, Mali (lat 13.28, long −5.93), from 2004 to 2017.
At the Mongu (lat −15.25, long 23.15) site (Fig. 26), the biomass burning smoke typically occurs during the dry season from April through November due to biomass fuel cooking and agricultural burning (Eck et al., 2003). Comparisons of multiyear monthly averages for the Mongu site show small deviations for AOD up to ±0.01 with slight increases in Version 3 AE during December through March due to enhanced cirrus cloud removal from the solar aureole check. Notably, the number of days for the Mongu multiyear monthly averages significantly decreased by 10 % to 25 % in Version 3 due to improved cloud screening and sensor head temperature anomalies affecting instrument performance. In Cinzana, Mali (Fig. 27), the aerosol loading is dominated by background dust aerosol with episodic contributions to the aerosol loading from biomass burning smoke from November to March (Cavalieri et al., 2010). The AERONET IER Cinzana site (lat 13.28, long −5.93) multiyear monthly averages show generally 0.03 lower AOD for Version 3 than Version 2 and nearly the same AE for both versions. The number of days for each month is 7 % to 25 % lower in Version 3 when compared to Version 2, mainly due to improved cirrus cloud screening.
The Aerosol Robotic Network (AERONET) has adopted a new automated quality assurance algorithm called Version 3. The significant impacts of the Version 3 algorithm are updated and improved cloud screening and quality control methods, which are powerful tools in quality assuring the Sun photometer AOD data. Comparisons between the quality-assured data sets of Version 3 and Version 2 show excellent agreement. Deviations can be explained by known algorithm differences such as changes in the cloud-screening triplet variability, cirrus cloud detection and removal, implementation of temperature characterization, updates to NO2 climatology, modification of site coordinates and elevation, and identification of instrument anomalies such as aerosol optical depth (AOD) diurnal dependence, AOD spectral dependence, and instrument electrical and temperature stability. The high statistical agreement in multiyear monthly averaged AOD substantiates Version 3 algorithms and suggests that the Version 3 database will validate most Version 2 research conclusions but exceptions can exist. For example, the Version 3 algorithm permitted AOD measurements of thick biomass burning smoke in Indonesia during the strong 2015 El Niño event during which Version 2 AOD data were not available (Eck et al., 2019). As a result, MODIS satellite retrieval modifications have been identified to capture more high-optical-depth events rather than masking them as clouds (Shi et al., 2019). Given AERONET algorithm enhancements, we recommend the Version 3 AOD database for scientific investigations.
Major highlights of this work include (not listed in priority) the following.
-
An automatic quality control algorithm significantly reduces the necessity of analysts to inspect millions of AERONET measurements. The AERONET Version 3 algorithm applied in near-real-time provides high-quality AOD for data assimilation applications. The Version 3 Level 2.0 data are provided within 30 days of the post-field calibration evaluation after the instrument deployment, improving the timeliness of quality-assured data.
-
Improvements to the total AERONET database cloud screening result in about 60 % removal of clouds from the complete Sun photometer database and this value is similar to the coverage of clouds globally of about 68 % (Rossow and Schiffer, 1999). Autonomous Cimel Sun photometers can view gaps and nearby regions of the clouds and become inactive during rain periods due to wet sensor activation, and AERONET sites are dominated by land locations, which generally have lower cloud cover on average; therefore, these factors would reduce the difference between total AERONET cloud removal percentage and global satellite observations. Over 36 % of the total data were removed by the four-quadrant solar tracker sensitivity check due to less accuracy in tracking the Sun in cloudy conditions, while about 23 % of the removal was due to the variability in clouds with respect to more homogeneous aerosol loading.
-
Utilizing the shape of the solar aureole radiances with scattering angle, a cirrus detection algorithm was developed by leveraging MPLNET lidar cloud detection capabilities. The solar aureole cirrus algorithm eliminates ∼5 % of the Level 1.0 AOD data to reduce the bias of optically thin cirrus clouds in the AERONET database.
-
Spectral temperature correction has been implemented for all AERONET instruments using the sensor head temperature sensor reading. The temperature characterization shows significant AOD deviation ± 0.01 variation between −25 and +50 ∘C for the silicon at 1020 nm since this wavelength is on the edge of the silicon detector sensitivity range. Other wavelengths in the 440 to 1640 nm range have weak temperature dependence from −25 to +30 ∘C with a few wavelengths having greater temperature dependence at higher temperatures.
-
New automated instrument anomaly screening provides a systematic and objective scheme to remove entire measurements or individual wavelengths from the AERONET AOD database. Importantly, obstructions to the instrument optics are now removed automatically using an AOD diurnal dependence algorithm based on the optical air mass. The AOD diurnal dependence technique employs several conditions that were developed to mitigate the removal of true diurnal dependence conditions while maximizing the removal of data significantly impacted by anomalies affecting the instrument optics.
-
Bias and uncertainty estimates for near-real-time AOD are computed by using the difference of the pre-field calibration AOD minus the interpolated calibration AOD. The near-real-time AERONET data have an estimated bias of up to +0.02 and 1σ uncertainty of up to 0.02; these values have slightly higher uncertainty for shorter wavelengths and slightly lower uncertainty for longer wavelengths.
-
The AERONET Version 3 and Version 2 AOD quality-controlled databases are analyzed to have a long-term monthly average difference of +0.002 with ±0.02 SD and greater agreement for time-matched observations with an average difference of −0.002 with ±0.004 SD. The high statistical agreement in multiyear monthly averaged AOD validates the advanced automatic data quality control algorithms and suggests that migrating research to the Version 3 database will corroborate most Version 2 research results and likely lead to some more accurate results.
-
Examination of long-term sites in various aerosol source regions indicates mainly subtle changes in AOD, AE, and the number of days available; however, in some months, improved cloud screening, high aerosol loading retention, and improved instrument anomaly screening not attained by Version 2 explain larger deviations in these parameters.
AERONET Version 3 has evolved into a database with unparalleled presence in Sun photometry. Future algorithms could include improvements to the detection of cirrus clouds in polar environments, where the ice crystal size is approaching the size of large non-cloud aerosols, the determination of anomalies in high-aerosol-loading conditions, and the identification of true AOD diurnal dependence versus one generated by an instrument anomaly. Cimel radiometers will also measure the moon to derive lunar AOD (Berkoff et al., 2011; Barreto et al., 2013, 2016; Li et al., 2016). For example, current lunar measurement protocols do not include lunar aureole measurements analogous to the solar aureole measurements; hence the lack of these measurements potentially reduces the ability of the algorithm to remove cirrus clouds at night, and thus a variation of the quality control methodology may need to be developed. Other surface-based remote-sensing networks such as MAN (Smirnov et al., 2009), SKYNET (Takamura et al., 2004), GAW-PFR (Kazadzis et al., 2018), and PANDORA (Herman et al., 2009) may benefit by implementing applicable quality control methods established by AERONET.
Version 3 AOD data are available from the AERONET web site (https://aeronet.gsfc.nasa.gov, last access: 1 August 2018) and the web site provides these data freely to the public. Data may be acquired by utilizing several download mechanisms including site-by-site download tools and web service options for near-real-time data acquisition.
For 5 years, the AERONET staff (listed from DG to BH) worked individually and collaboratively drawing on their decades of scientific, engineering, and programming expertise to develop and assess the Version 3 AOD processing system presented herein. Traditional assignment of co-authorship is not possible. Aside from the first author, contributing AERONET staff are listed in reverse chronological order based on their start date with the project. JL, JC, and EW provided lidar data for development of the cirrus curvature methodology. SK and AL provided gaseous and water vapor absorption coefficients based on radiative transfer models.
The authors declare that they have no conflict of interest.
The AERONET and MPLNET projects at NASA GSFC are supported by the Earth Observing System Project Science Office cal–val, Radiation Sciences Program at NASA headquarters, and various field campaigns. NCEP Reanalysis data are obtained routinely from the US National Weather Service Climate Prediction Center. We would like to thank Edward Celarier for several discussions and providing the OMI NO2 monthly climatology. Fred Espenak and Chris O'Byrne (NASA GSFC) provided solar and lunar eclipse predictions and the Eclipse Explorer software.
We thank the MPLNET PIs for their effort in establishing and maintaining the sites: Arnon Karnieli (SEDE_BOKER), Sachi Tripathi (Kanpur), Greg Schuster (COVE), Margarita Yela Gonzalez (Santa Cruz de Tenerife), and John Barnes (Trinidad Head).
The authors thank the AERONET calibration facilities in the USA (NASA GSFC,
NOAA Mauna Loa Observatory, and NEON), France (PHOTONS), and Spain (RIMA and
Izana). We thank the following AERONET PIs and their staff for maintaining
the sites and contributing aerosol data: Norm O'Neill, Ihab Abboud, and
Vitali Fioletov (PEARL, Toronto, Bratt's Lake); Itaru Sano (Osaka); Paulo Artaxo
(Rio Branco); Neng-Huei Lin (Lulin); Pucai Wang and Xiangao Xia
(Xianghe); Mikhail Panchenko (Ussuriysk); Arnon Karnieli (Sede Boker);
Emilio Cuevas-Agullo (Santa Cruz Tenerife); Joseph Prospero (Ragged Point);
Soo-Chin Liew and Santo Salinas Cortijo (Singapore); Sachchida Nand Tripathi
(Kanpur); Francisco Reyes (Màlaga); and Jean Rajot and Beatrice Marticorena
(IER-Cinzana). A special acknowledgement is given to the AERONET principal
investigators and their site staff around the world, who participate in
monitoring aerosols to expand our scientific understanding of the Earth.
Edited by: Vassilis Amiridis
Reviewed by: two anonymous referees
Alexandrov, M. D., Schmid, B., Turner, D. D., Cairns, B., Oinas, V., Lacis, A. A., Gutman, S. I., Westwater, E. R., Smirnov, A., and Eilers, J.: Columnar water vapor from multifilter rotating shadowband radiometer data, J. Geophys, Res., 114, D02306, https://doi.org/10.1029/2008JD010543, 2009.
Andrews, E., Ogren, J. A., Kinne, S., and Samset, B.: Comparison of AOD, AAOD and column single scattering albedo from AERONET retrievals and in situ profiling measurements, Atmos. Chem. Phys., 17, 6041–6072, https://doi.org/10.5194/acp-17-6041-2017, 2017.
Ångström, A.: Apparent solar constant variations and their relation to variability of atmospheric transmission, Tellus, 22, 205–218, https://doi.org/10.3402/tellusa.v22i2.10215, 1970.
Arola, A. and Koskela, T.: On the sources of bias in aerosol optical depth retrieval in the UV range, J. Geophys. Res., 109, D08209, https://doi.org/10.1029/2003JD004375, 2004.
Barreto, A., Cuevas, E., Damiri, B., Guirado, C., Berkoff, T., Berjón, A. J., Hernández, Y., Almansa, F., and Gil, M.: A new method for nocturnal aerosol measurements with a lunar photometer prototype, Atmos. Meas. Tech., 6, 585–598, https://doi.org/10.5194/amt-6-585-2013, 2013.
Barreto, Á., Cuevas, E., Granados-Muñoz, M.-J., Alados-Arboledas, L., Romero, P. M., Gröbner, J., Kouremeti, N., Almansa, A. F., Stone, T., Toledano, C., Román, R., Sorokin, M., Holben, B., Canini, M., and Yela, M.: The new sun-sky-lunar Cimel CE318-T multiband photometer – a comprehensive performance evaluation, Atmos. Meas. Tech., 9, 631–654, https://doi.org/10.5194/amt-9-631-2016, 2016.
Berkoff, T.A., Sorokin, M., Stone, T., Eck, T.F., Hoff, R., Welton, E., and Holben, B.: Nocturnal Aerosol Optical Depth Measurements with a Small-Aperture Automated Photometer Using the Moon as a Light Source. J. Atmos. Ocean. Tech., 28, 1297–1306, https://doi.org/10.1175/JTECH-D-10-05036.1, 2011.
Bock, O., Bosser, P., Bourcy, T., David, L., Goutail, F., Hoareau, C., Keckhut, P., Legain, D., Pazmino, A., Pelon, J., Pipis, K., Poujol, G., Sarkissian, A., Thom, C., Tournois, G., and Tzanos, D.: Accuracy assessment of water vapour measurements from in situ and remote sensing techniques during the DEMEVAP 2011 campaign at OHP, Atmos. Meas. Tech., 6, 2777–2802, https://doi.org/10.5194/amt-6-2777-2013, 2013.
Bodhaine, B. A., Wood, N. B., Dutton, E. G., and Slusser, J. R.: On Rayleigh Optical Depth Calculations, J. Atmos. Ocean. Tech., 16, 1854–1861, https://doi.org/10.1175/1520-0426(1999)016<1854:ORODC>2.0.CO;2, 1999.
Boersma, K. F., Eskes, H. J., and Brinksma, E. J.: Error analysis for tropospheric NO2 retrieval from space, J. Geophys. Res., 109, D04311, https://doi.org/10.1029/2003JD003962, 2004.
Boersma, K. F., Jacob, D. J., Eskes, H. J., Pinder, R. W., Wang, J., and van der A, R. J.: Intercomparison of SCIAMACHY and OMI tropospheric NO2 columns: Observing the diurnal evolution of chemistry and emissions from space, J. Geophys. Res., 113, D16S26, https://doi.org/10.1029/2007JD008816, 2008.
Bokoye, A. I., Royer, A., O'Neill, N. T., Cliche, P., Fedosejevs, G., Teillet, P. M., and McArthur, L. J. B.: Characterization of atmospheric aerosols across Canada from a ground-based sunphotometer network: AEROCAN, Atmosphere-Ocean, 39, 429–456, https://doi.org/10.1080/07055900.2001.9649687, 2001.
Bokoye, A. I., Royer, A., O'Neill, N. T., Cliché, P., McArthur, L. J. B., Teillet, P. M., Fedosejevs, G., and Thériault, J.-M.: Multisensor analysis of integrated atmospheric water vapor over Canada and Alaska, J. Geophys. Res., 108, 4480, https://doi.org/10.1029/2002JD002721, 2003.
Bruegge, C. J., Conel, J. E., Green, R. O., Margolis, J. S., Holm, R. G., and Toon, G.: Water vapor column abundance retrievals during FIFE, J. Geophys. Res., 97, 18759–18768, https://doi.org/10.1029/92JD01050, 1992.
Burrows, J. P., Dehn, A., Deters, B., Himmelmann, S., Richter, A., Voigt, S., and Orphal, J.: Atmospheric Remote-Sensing Reference Data from GOME: Part 1. Temperature-Dependent Absorption Cross-sections of NO2 in the 231–794 nm Range, J. Quant. Spectrosc. Ra., 60, 1025–1031, https://doi.org/10.1016/S0022-4073(97)00197-0, 1998.
Burrows, J. P., Richter, A., Dehn, A., Deters, B., Himmelmann, S., Voigt, S., and Orphal J.: Atmospheric remote-sensing reference data from GOME – 2. Temperature-dependent absorption cross sections of O3 in the 231–794 nm range, J. Quant. Spectrosc. Ra., 61, 509–517, 1999.
Cachorro, V. E., Romero, P. M., Toledano, C., Cuevas, E., and de Frutos, A. M.: The fictitious diurnal cycle of aerosol optical depth: A new approach for “in situ” calibration and correction of AOD data series, Geophys. Res. Lett., 31, L12106, https://doi.org/10.1029/2004GL019651, 2004.
Campanelli, M., Mascitelli, A., Sanò, P., Diémoz, H., Estellés, V., Federico, S., Iannarelli, A. M., Fratarcangeli, F., Mazzoni, A., Realini, E., Crespi, M., Bock, O., Martínez-Lozano, J. A., and Dietrich, S.: Precipitable water vapour content from ESR/SKYNET sun–sky radiometers: validation against GNSS/GPS and AERONET over three different sites in Europe, Atmos. Meas. Tech., 11, 81–94, https://doi.org/10.5194/amt-11-81-2018, 2018.
Campbell, J. R., Hlavka, D. L., Welton, E. J., Flynn, C. J., Turner, D. D., Spinhirne, J. D., Scott, V. S., and Hwang, I. H.: Full-time, Eye-Safe Cloud and Aerosol Lidar Observation at Atmospheric Radiation Measurement Program Sites: Instrument and Data Processing, J. Atmos. Ocean. Tech., 19, 431–442, https://doi.org/10.1175/1520-0426(2002)019<0431:FTESCA>2.0.CO;2, 2002.
Campbell, J. R., Vaughan, M. A., Oo, M., Holz, R. E., Lewis, J. R., and Welton, E. J.: Distinguishing cirrus cloud presence in autonomous lidar measurements, Atmos. Meas. Tech., 8, 435–449, https://doi.org/10.5194/amt-8-435-2015, 2015.
Cavalieri, O., Cairo, F., Fierli, F., Di Donfrancesco, G., Snels, M., Viterbini, M., Cardillo, F., Chatenet, B., Formenti, P., Marticorena, B., and Rajot, J. L.: Variability of aerosol vertical distribution in the Sahel, Atmos. Chem. Phys., 10, 12005–12023, https://doi.org/10.5194/acp-10-12005-2010, 2010.
Che, H., Zhang, X.-Y., Xia, X., Goloub, P., Holben, B., Zhao, H., Wang, Y., Zhang, X.-C., Wang, H., Blarel, L., Damiri, B., Zhang, R., Deng, X., Ma, Y., Wang, T., Geng, F., Qi, B., Zhu, J., Yu, J., Chen, Q., and Shi, G.: Ground-based aerosol climatology of China: aerosol optical depths from the China Aerosol Remote Sensing Network (CARSNET) 2002–2013, Atmos. Chem. Phys., 15, 7619–7652, https://doi.org/10.5194/acp-15-7619-2015, 2015.
Chew, B. N., Campbell, J. R., Reid, J. S., Giles, D. M., Welton, E. J., Salinas, S. V., and Liew, S. C.: Tropical cirrus cloud contamination in sun photometer data, Atmos. Environ., 45, 6724–6731, https://doi.org/10.1016/j.atmosenv.2011.08.017, 2011.
Clough, S. A., Kneizys, F. X., and Davies, R. W.: Line shape and the water vapor continuum, Atmos. Res., 23, 229–241, https://doi.org/10.1016/0169-8095(89)90020-3, 1989.
Coddington, O., Lean, O. J., Pilewskie, P., Snow, M., and Lindholm, D.: A solar irradiance climate data record, B. Am. Meteorol. Soc., 97, 1265–1282, https://doi.org/10.1175/BAMS-D-14-00265.1, 2016.
DeVore, J. G., Stair, A. T., LePage, A., Rall, D., Atkinson, J., Villanucci, D., Rappaport, S. A., Joss, P. C., and McClatchey, R. A.: Retrieving Properties of Thin Clouds from Solar Aureole Measurements, J. Atmos. Ocean. Tech., 26, 2531–2548, https://doi.org/10.1175/2009JTECHA1289.1, 2009.
DeVore, J. G., Stair Jr., A. T., LePage, A. J., and Villanucci, D.: Using scattering calculations to compare MODIS retrievals of thin cirrus optical properties with SAM solar disk and aureole radiance measurements, J. Geophys. Res., 117, D01204, https://doi.org/10.1029/2011JD015858, 2012.
Dubovik, O. and King, M. D.: A flexible inversion algorithm for retrieval of aerosol optical properties from Sun and sky radiance measurements, J. Geophys. Res., 105, 20673–20696, https://doi.org/10.1029/2000JD900282, 2000.
Dubovik, O. V, Lapyonok, T. V., and Oshchepkov, S. L.: Improved technique for data inversion: optical sizing of multicomponent aerosols, Appl. Optics, 34, 8422–8436, https://doi.org/10.1364/AO.34.008422, 1995.
Eck, T. F., Holben, B. N., Reid, J. S., Dubovik, O., Smirnov, A., O'Neill, N. T., Slutsker, I., and Kinne, S.: Wavelength dependence of the optical depth of biomass burning, urban, and desert dust aerosols, J. Geophys. Res., 104, 31333–31349, https://doi.org/10.1029/1999JD900923, 1999.
Eck, T. F., Holben B. N., Reid, J. S., O'Neill, N. T., Schafer, J. S., Dubovik, O., Smirnov, A., Yamasoe, M. A., and Artaxo, P.: High aerosol optical depth biomass burning events: A comparison of optical properties for different source regions, Geophys. Res. Lett., 30, 2035, https://doi.org/10.1029/2003GL017861, 2003.
Eck, T. F., Holben, B. N., Reid, J. S., Arola, A., Ferrare, R. A., Hostetler, C. A., Crumeyrolle, S. N., Berkoff, T. A., Welton, E. J., Lolli, S., Lyapustin, A., Wang, Y., Schafer, J. S., Giles, D. M., Anderson, B. E., Thornhill, K. L., Minnis, P., Pickering, K. E., Loughner, C. P., Smirnov, A., and Sinyuk, A.: Observations of rapid aerosol optical depth enhancements in the vicinity of polluted cumulus clouds, Atmos. Chem. Phys., 14, 11633–11656, https://doi.org/10.5194/acp-14-11633-2014, 2014.
Eck, T. F., Holben, B. N., Reid, J. S., Xian, P., Giles, D. M., Sinyuk, A., Smirnov, A., Schafer, J. S., Slutsker, I., Kim, J., Koo, J.-H., Choi, M., Kim, K. C., Sano, I., Arola, A., Sayer, A. M., Levy, R. C., Munchak, L. A., O'Neill, N. T., Lyapustin, A., Hsu, N. C., Randles, C. A., Da Silva, A. M., Buchard, V., Govindaraju, R. C., Hyer E., Crawford, J. H., Wang, P., and Xia, X.: Observations of the interaction and transport of fine mode aerosols with cloud and/or fog in Northeast Asia from Aerosol Robotic Network and satellite remote sensing, J. Geophys. Res.-Atmos., 123, 5560–5587, https://doi.org/10.1029/2018JD028313, 2018.
Eck, T. F., Holben, B. N., Giles, D. M., Slutsker, I., Sinyuk, A., Schafer, J. S., Smirnov, A., Sorokin, M., Reid, J. S., Sayer, A. M., Hsu, N. C., Shi, Y. R., Levy, R. C., Lyapustin, A., Rahman, M. A., Liew, S.-C., Cortijo, S. V. S., Li, T., Kalbermatter, D., Keong, K. L., Elifant, M., Aditya, F., Mohamad, M., Mahmud, M., Chong, T. K., San, L. H., Choon, Y. E., Deranadyan, G., Kusumaningtyas, S. D. A., and Aldrian, E.: AERONET remotely sensed measurements and retrievals of biomass burning aerosol optical properties during the 2015 Indonesian burning season, J. Geophys. Res., in review, 2019.
Eiden, R.: Calculations and measurements of the spectral radiance of the solar aureole, Tellus, 20, 380–399, https://doi.org/10.3402/tellusa.v20i3.10017, 1968.
Espenak, F. and Meeus, J.: Five Millennium Cannon of Solar Eclipses: −1999 to +3000 (2000 BCE to 3000 CE), NASA Technical Publication TP-2006-214141, NASA, Greenbelt, MD, 2006.
Gamache, R. R., Roller, C., Lopes, E., Gordon, I. E., Rothman, L. S., Polyansky, O. L., Zobov, N. F., Kyuberis, A. A., Tennyson, J., Yurchenko, S. N., Csaszar, A. G., Furtenbacher, T., Huang, X., Schwenke, D. W., Lee, T. J., Drouin, B. J., Tashkun, S. A., Perevalov, V. I., and Kochanov, R. V.: Total internal partition sums for 166 isotopologues of 51 molecules important in planetary atmospheres: Application to HITRAN2016 and beyond, J. Quant. Spectrosc. Ra., 203, 70–87, https://doi.org/10.1016/j.jqsrt.2017.03.045, 2017.
Giles, D. M., Holben, B. N., Eck, T. F., Sinyuk, A., Smirnov, A., Slutsker, I., Dickerson, R. R., Thompson, A. M., and Schafer, J. S.: An analysis of AERONET aerosol absorption properties and classifications representative of aerosol source regions, J. Geophys. Res., 117, D17203, https://doi.org/10.1029/2012JD018127, 2012.
Goloub, P., Li, Z., Dubovik, O., Blarel, L., Podvin, T., Jankowiak, I., Lecoq, R., Deroo, C., Chatenet, B., Morel, J. P., Cuevas, E., and Ramos, R.: PHOTONS/AERONET sunphotometer network overview: description, activities, results, Proc. SPIE, 6936, 69360V, https://doi.org/10.1117/12.783171, 2008.
Haapanala, P., Räisänen, P., McFarquhar, G. M., Tiira, J., Macke, A., Kahnert, M., Nousiainen, T.: Disk and circumsolar radiances in the presence of ice clouds, Atmos. Chem. Phys., 17, 6865–6882, https://doi.org/10.5194/acp-17-6865-2017, 2017.
Halthore, R. N., Eck, T. F., Holben, B. N., and Markham, B. L.: Sun photometric measurements of atmospheric water vapor column abundance in the 940-nm band, J. Geophys. Res., 102, 4343–4352, https://doi.org/10.1029/96JD03247, 1997.
Hamonou, Chazette, E., P., Balis, D., Dulac, F., Schneider, X., Galani, E., Ancellet, G., and Papayannis, A.: Characterization of the vertical structure of Saharan dust export to the Mediterranean basin, J. Geophys. Res., 104, 22257–22270, https://doi.org/10.1029/1999JD900257, 1999.
Herman, J., Cede, A., Spinei, E., Mount, G., Tzortziou, M., and Abuhassan, N.: NO2 column amounts from ground-based Pandora and MFDOAS spectrometers using the direct-sun DOAS technique: Intercomparisons and application to OMI validation, J. Geophys. Res., 114, D13307, https://doi.org/10.1029/2009JD011848, 2009.
Holben, B. N., Vermote, E., Kaufman, Y. J., Tanre, D., and Kalb, V.: Aerosol retrieval over land from AVHRR data-application for atmospheric correction, IEEE T. Geosci. Remote, 30, 212–222, https://doi.org/10.1109/36.134072, 1992.
Holben, B. N., Eck, T. F., Slutsker, I., Tanre, D., Buis, J. P., Setzer, A., Vermote, E., Reagan, J. A., Kaufman, Y., Nakajima, T., Lavenue, F., Jankowiak, I., and Smirnov, A.: AERONET – A federated instrument network and data archive for aerosol characterization, Remote Sens. Environ., 66, 1–16, https://doi.org/10.1016/S0034-4257(98)00031-5, 1998.
Holben, B. N., Tanre, D., Smirnov, A., Eck, T. F., Slutsker, I., Abuhassan, N., Newcomb, W. W., Schafer, J., Chatenet, B,. Lavenue, F., Kaufman, Y., Vande Castle, J., Setzer, A., Markham, B., Clark, D., Frouin, R., Halthore, R., Karnieli, A., O'Neill, N. T., Pietras, C., Pinker, R. T., Voss, K., and Zibordi, G.: An emerging ground-based aerosol climatology: Aerosol optical depth from AERONET, J. Geophys. Res., 106, 12067–12097, https://doi.org/10.1029/2001JD900014, 2001.
Holben, B. N., Eck, T. F., Slutsker, I., Smirnov, A., Sinyuk, A, Schafer, J., Giles, D., and Dubovik, O.: Aeronet's Version 2.0 quality assurance criteria, Proc. SPIE, 6408, 64080Q, https://doi.org/10.1117/12.706524, 2006.
Huang, J., Hsu, N., Tsay, S.-C., Jeong, M.-J., Holben, B. N., Berkoff, T. A., and Welton, E. J.: Susceptibility of aerosol optical thickness retrievals to thin cirrus contamination during the BASE-ASIA campaign, J. Geophys. Res., 116, D08214, https://doi.org/10.1029/2010JD014910, 2011.
Ingold, T., Schmid, B., Mätzler, C., Demoulin, P., and Kämpfer, N.: Modeled and empirical approaches for retrieving columnar water vapor from solar transmittance measurements in the 0.72, 0.82 and 0.94-mm absorption bands, J. Geophys. Res., 105, 24327–24343, https://doi.org/10.1029/2000JD900392, 2000.
Kahn, R. A. and Gaitley, B. J.: An analysis of global aerosol type as retrieved by MISR, J. Geophys. Res.-Atmos., 120, 4248–4281, https://doi.org/10.1002/2015JD023322, 2015.
Kalnay, E., Kanamitsu, M., Kistler, R., Collins, W., Deaven, D., Gandin, L., Iredell, M., Saha, S., White, G., Woollen, J., Zhu, Y., Chelliah, M., Ebisuzaki, W., Higgins, W., Janowiak, J., Mo, K. C., Ropelewski, C., Wang, J., Leetmaa, A., Reynolds, R., Jenne, R. and Joseph, D.: The NCEP/NCAR 40-Year Reanalysis Project, B. Am. Meteorol. Soc., 77, 437–471, https://doi.org/10.1175/1520-0477(1996)077<0437:TNYRP>2.0.CO;2, 1996.
Kasten, F.: A new table and approximation formula for relative optical air mass, Arch. Meteorol. Geophys. Bioklimatol. Ser. B, 14, 206–223, https://doi.org/10.1007/BF02248840, 1965.
Kasten, F. and Young, A. T.: Revised optical air mass tables and approximation formula, Appl. Optics, 28, 4735–4738, https://doi.org/10.1364/AO.28.004735, 1989.
Kaufman, Y. J., and Tanré, D.: Strategy for direct and indirect methods for correcting the aerosol effect on remote sensing: From AVHRR to EOS-MODIS, Remote Sens. Environ., 55, 65–79, https://doi.org/10.1016/0034-4257(95)00193-X, 1996.
Kaufman, Y. J., Remer, L. A., Tanre, D., Li, R.-R., Kleidman, R., Mattoo, S., Levy, R. C., Eck, T. F., Holben, B. N., Ichoku, C., Martins, J. V., and Koren, I.: A Critical Examination of the Residual Cloud Contamination and Diurnal Sampling Effects on MODS Estimates of Aerosol Over Ocean, IEEE T. Geosci. Remote, 43, 2886–2897, https://doi.org/10.1109/TGRS.2005.858430, 2005.
Kazadzis, S., Kouremeti, N., Nyeki, S., Gröbner, J., and Wehrli, C.: The World Optical Depth Research and Calibration Center (WORCC) quality assurance and quality control of GAW-PFR AOD measurements, Geosci. Instrum. Method. Data Syst., 7, 39–53, https://doi.org/10.5194/gi-7-39-2018, 2018.
Kinne, S., Akerman, T. P., Shiobara, M., Uchiyama, A., Heymsfield, A. J., Miloshevich, L., Wendell, J., Eloranta, E., Purgold, C., and Bergstrom, R. W.: Cirrus cloud radiative and microphysical properties from ground observations and in situ measurements during FIRE 1991 and their application to exhibit problems in cirrus solar radiative transfer modeling, J. Atmos. Sci., 54, 2320–2344, https://doi.org/10.1175/1520-0469(1997)054<2320:CCRAMP>2.0.CO;2, 1997.
Kline, M.: Calculus: An Intuitive and Physical Approach, Dover Publications, Inc. Mineola, New York, 457–461, 1998.
Komhyr, W. D., Grass, K. D., and Leonard, R. K.: Dobson Spectrophotometer 83: a standard for total ozone measurements, 1962–1987, J. Geophys. Res., 94, 9847–9861, https://doi.org/10.1029/JD094iD07p09847, 1989.
Levy, R. C., Remer, L. A., Kleidman, R. G., Mattoo, S., Ichoku, C., Kahn, R., and Eck, T. F.: Global evaluation of the Collection 5 MODIS dark-target aerosol products over land, Atmos. Chem. Phys., 10, 10399–10420, https://doi.org/10.5194/acp-10-10399-2010, 2010.
Levy, R. C., Mattoo, S., Munchak, L. A., Remer, L. A., Sayer, A. M., Patadia, F., and Hsu, N. C.: The Collection 6 MODIS aerosol products over land and ocean, Atmos. Meas. Tech., 6, 2989–3034, https://doi.org/10.5194/amt-6-2989-2013, 2013.
Lewis, J., Campbell, J., Welton, E. J., Stewart, S. A., and Haftings, P. C.: Overview of MPLNET Version 3 Cloud Detection, J. Atmos. Ocean Tech., 33, 2113–2134, https://doi.org/10.1175/JTECH-D-15-0190.1, 2016.
Li, Z., Xia, X., Cribb, M., Mi, W., Holben, B., Wang, P., Chen, H., Tsay, S.-C., Eck, T. F., Zhao, F., Dutton, E. G., and Dickerson, R. E.: Aerosol optical properties and their radiative effects in northern China, J. Geophys. Res., 112, D22S01, https://doi.org/10.1029/2006JD007382, 2007.
Li, Z., Zhao, X., Kahn, R., Mishchenko, M., Remer, L., Lee, K.-H., Wang, M., Laszlo, I., Nakajima, T., and Maring, H.: Uncertainties in satellite remote sensing of aerosols and impact on monitoring its long-term trend: a review and perspective, Ann. Geophys., 27, 2755–2770, https://doi.org/10.5194/angeo-27-2755-2009, 2009.
Li, Z., Li, K., Li, D., Yang, J., Xu, H., Goloub, P., and Victori, S.: Simple transfer calibration method for a Cimel Sun–Moon photometer: calculating lunar calibration coefficients from Sun calibration constants, Appl. Optics, 55, 7624–7630, https://doi.org/10.1364/AO.55.007624, 2016.
Lin, N.-H., Tsay, S.-C., Maring, H. B., Yen, M.-C., Sheu, G.-R., Wang, S.-H., Chi, K. H., Chuang, M.-T., Ou-Yang, C.-F., Fu, J. S., Reid, J. S., Lee, C.-T., Wang, L.-C., Wang, J.-L., Hsu, C. N., Sayer, A. M., Holben, B. N., Chu, Y.-C., Nguyen, X. A., Sopajaree, K., Chen, S.-J., Cheng, M.-T., Tsuang, B.-J., Tsai, C.-J., Peng, C.-M., Schnell, R. C., Conway, T., Chang, C.-T., Lin, K.-S., Tsai, Y. I., Lee, W.-J., Chang, S.-C., Liu, J.-J., Chiang, W.-L., Huang, S.-J., Lin, T.-H., and Liu, G.-R.: An overview of regional experiments on biomass burning aerosols and related pollutants in Southeast Asia: From BASE-ASIA and the Dongsha Experiment to 7-SEAS, Atmos. Environ., 78, 1–19, https://doi.org/10.1016/j.atmosenv.2013.04.066, 2013.
Martins, J. V., Tanré, D., Remer, L., Kaufman, Y., Mattoo, S., and Levy, R.: MODIS Cloud screening for remote sensing of aerosols over oceans using spatial variability, Geophys. Res. Lett., 29, 1619, https://doi.org/10.1029/2001GL013252, 2002.
McPeters, R. D., Frith, S., and Labow, G. J.: OMI total column ozone: extending the long-term data record, Atmos. Meas. Tech., 8, 4845–4850, https://doi.org/10.5194/amt-8-4845-2015, 2015.
Michalsky, J. J.: The astronomical almanac's algorithm for approximate solar position (1950–2030), Solar Energy, 40, 227–235, https://doi.org/10.1016/0038-092X(88)90045-X, 1988.
Michalsky, J. J., Liljegren, J. C., and Harrison, L. C.: A Comparison of Sun Photometer Derivations of Total Column Water Vapor and Ozone to Standard Measures of Same at the Southern Great Plains Atmospheric Radiation Measurement Site, J. Geophys. Res., 100, 25995–26003, https://doi.org/10.1029/95JD02706, 1995.
Mitchell, R. M., Forgan, B. W., and Campbell, S. K.: The Climatology of Australian Aerosol, Atmos. Chem. Phys., 17, 5131–5154, https://doi.org/10.5194/acp-17-5131-2017, 2017.
Mlawer, E. J., Payne, V. H., Moncet, J.-L., Delamere, J. S., Alvarado, M. J., and Tobin, D. D.: Development and recent evaluation of the MT_CKD model of continuum absorption, Philos. T. Roy. Soc. A, 370, 1–37, https://doi.org/10.1098/rsta.2011.0295, 2012.
Nakajima, T., Tonna, G., Rao, R., Boi, P., Kaufman, Y., and Holben, B.: Use of sky brightness measurements from ground for remote sensing of particulate polydispersions, Appl. Optics, 35, 2672–2686, https://doi.org/10.1364/AO.35.002672, 1996.
Omar, A. H., Winker, D. M., Tackett, J. L., Giles, D. M., Kar, J., Liu, Z., Vaughan, M. A., Powell, K. A., and Trepte, C. R., CALIOP and AERONET aerosol optical depth comparisons: One size fits none, J. Geophys. Res.-Atmos., 118, 4748–4766, https://doi.org/10.1002/jgrd.50330, 2013.
O'Neill, N. T., Eck, T. F., Holben, B. N., Smirnov, A., Dubovik, O., and Royer, A.: Bimodal size distribution influences on the variation of Angstrom derivatives in spectral and optical depth space, J. Geophys. Res., 106, 9787–9806, https://doi.org/10.1029/2000JD900245, 2001.
O'Neill, N. T., Eck, T. F., Smirnov, A., Holben, B. N., and Thulasiraman, S.: Spectral discrimination of coarse and fine mode optical depth, J. Geophys. Res., 108, 4559–4573, https://doi.org/10.1029/2002JD002975, 2003.
O'Neill, N. T., Eck, T. F., Reid, J. S., Smirnov, A., and Pancrati, O.: Coarse mode optical information retrievable using ultraviolet to short-wave infrared Sun photometry: Application to United Arab Emirates Unified Aerosol Experiment data, J. Geophys. Res., 113, D05212, https://doi.org/10.1029/2007JD009052, 2008.
Pérez-Ramírez, D., Whiteman, D. N., Smirnov, A., Lyamani, H., Holben, B. N., Pinker, R., Andrade, M., and Alados-Arboledas, L.: Evaluation of AERONET precipitable water vapor versus microwave radiometry, GPS, and radiosondes at ARM sites, J. Geophys. Res.-Atmos., 119, 9596–9613, https://doi.org/10.1002/2014JD021730, 2014.
Prasad, A. K. and Singh R. P.: Validation of MODIS Terra, AIRS, NCEP/DOE AMIP-II Reanalysis-2, and AERONET Sun photometer derived integrated precipitable water vapor using ground-based GPS receivers over India, J. Geophys. Res., 114, D05107, https://doi.org/10.1029/2008JD011230, 2009.
Redemann, J., Masonis, S. J., Schmid, B., Anderson, T. L., Russell, P. B., Livingston, J. M., Dubovik, O., and Clarke, A. D.: Clear-column closure studies of aerosols and water vapor aboard the NCAR C-130 during ACE-Asia, 2001, J. Geophys. Res., 108, 8655, https://doi.org/10.1029/2003JD003442, 2003.
Remer, L. A., Kaufman, Y. J., Tanré, D., Mattoo, S., Chu, D. A., Martins, J. V., Li, R., Ichoku, C., Levy, R. C., Kleidman, R. G., Eck, T. F., Vermote, E., and Holben, B. N.: The MODIS Aerosol Algorithm, Products, and Validation, J. Atmos. Sci., 62, 947–973, https://doi.org/10.1175/JAS3385.1, 2005.
Rossow, W. B. and Schiffer, R. A.: Advances in Understanding Clouds from ISCCP, B. Am. Meteorol. Soc., 80, 2261–2288, https://doi.org/10.1175/1520-0477(1999)080<2261:AIUCFI>2.0.CO;2, 1999.
Russell, P. B., Livingston, J. M., Dutton, E. G., Pueschel, R. F., Reagen, J. A., DeFoor, T. E., Box, M. A., Allen, D., Pilewskie, P., Herman, B. M., Kinne, S. A., and Hoffman, D. J..: Pinatubo and pre-Pinatubo optical-depth spectra: Mauna Loa measurements, comparisons, inferred particle size distributions, radiative effects, and relationship to lidar data, J. Geophys. Res., 98, 22969–22985, https://doi.org/10.1029/93JD02308, 1993.
Sakerin, S. M., Kabanov, D. M., Panchenko, M. V., Pol'kin, V. V., Holben, B. N., Smirnov, A. V., Beresnev, S. A., Gorda, S. Y., Kornienko, G. I., Nikolashkin, S. V., Poddubnyi, V. A., and Tashchilin, M. A.: Monitoring of atmospheric aerosol in the Asian part of Russia in 2004 within the framework of AEROSIBNET program, Atmos. Oceanic Optics, 18, 871–878, 2005.
Sapucci, L. F., Machado, L. A., Monico, J. F., and Plana-Fattori, A.: Intercomparison of Integrated Water Vapor Estimates from Multisensors in the Amazonian Region, J. Atmos. Ocean. Tech., 24, 1880–1894, https://doi.org/10.1175/JTECH2090.1, 2007.
Sassen, K. and Campbell, J. R.: A midlatitude cirrus cloud climatology from the Facility for Atmospheric Remote Sensing. Part I: Macrophysical and synoptic properties, J. Atmos. Sci., 58, 481–496, https://doi.org/10.1175/1520-0469(2001)058<0481:AMCCCF>2.0.CO;2, 2001.
Sayer, A. M., Hsu, N. C., Bettenhausen, C., and Jeong, M.-J.: Validation and uncertainty estimates for MODIS Collection 6 “Deep Blue” aerosol data, J. Geophys. Res.-Atmos., 118, 7864–7872, https://doi.org/10.1002/jgrd.50600, 2013.
Schmid, B., Thome, K. J., Demoulin, P., Peter, R., Matzler, C., and Sekler, J.: Comparison of modeled and empirical approaches for retrieving columnar water vapor from solar transmittance measurements in the 0.94 micron region, J. Geophys. Res., 101, 9345–9358, https://doi.org/10.1029/96JD00337, 1996.
Schmid, B, Michalsky, J. J., Slater, D. W., Barnard, J. C., Halthore, R. N., Liljegren, J. C., Holben, B. N., Eck, T. F., Livingston, J. M., Russell, P. B., Ingold, T., and Slutsker, I.: Comparison of Columnar Water-Vapor Measurements from Solar Transmittance Methods, Appl. Optics, 40, 1886–1896, https://doi.org/10.1364/AO.40.001886, 2001.
Shaw, G. E.: Sun Photometry, B. Am. Meteorol. Soc., 64, 4–10, https://doi.org/10.1175/1520-0477(1983)064<0004:SP>2.0.CO;2, 1983.
Shaw, G. E., Reagan, J. A., and Herman, B. M.: Investigations of atmospheric extinction using solar radiation measurements made with multiple wavelength radiometer, J. Appl. Meteorol., 12, 374–380, https://doi.org/10.1175/1520-0450(1973)012<0374:IOAEUD>2.0.CO;2, 1973.
Shi, Y. R., Levy, R. C., Eck, T. F., Fisher, B., Mattoo, S., Remer, L. A., Slutsker, I., and Zhang, J.: Characterizing the 2015 Indonesia fire event using modified MODIS aerosol retrievals, Atmos. Chem. Phys., 19, 259–274, https://doi.org/10.5194/acp-19-259-2019, 2019.
Sinyuk, A., Holben, B. N., Smirnov, A., Eck, T. F., Slutsker, I., Schafer, J. S., Giles, D. M., and Sorokin, M.: Assessment of error in aerosol optical depth measured by AERONET due to aerosol forward scattering, Geophys. Res. Lett., 39, L23806, https://doi.org/10.1029/2012GL053894, 2012.
Smirnov, A., Holben, B. N., Eck, T. F., Dubovik, O., and Slutsker, I.: Cloud screening and quality control algorithms for the AERONET database, Remote Sens. Environ., 73, 337–349, https://doi.org/10.1016/S0034-4257(00)00109-7, 2000.
Smirnov, A, Holben, B. N., Lyapustin A., Slutsker, I., and Eck, T. F.: AERONET processing algorithms refinement, AERONET 2004 Workshop, 10–14 May 2004, El Arenosillo, Spain, 2004.
Smirnov, A., Holben, B. N., Slutsker, I., Giles, D. M., McClain, C. R., Eck, T. F., Sakerin, S. M., Macke, A., Croot, P., Zibordi, G., Quinn, P. K., Sciare, J., Kinne, S., Harvey, M., Smyth, T. J., Piketh, S., Zielinski, T., Proshutinsky, A., Goes, J. I., Nelson, N. B., Larouche, P., Radionov, V. F., Goloub, P., Moorthy, K. K., Matarrese, R., Robertson, E. J., and Jourdin, F.: Maritime Aerosol Network as a component of Aerosol Robotic Network, J. Geophys. Res., 114, D06204, https://doi.org/10.1029/2008JD011257, 2009.
Takamura, T, T. Nakajima and SKYNET community group: Overview of SKYNET and its Activities, Proceedings of AERONET workshop, El Arenosillo, Optica Pura y Aplicada, 37, 3303–3308, 2004.
Toledano, C., Cachorro, V. E., Berjon, A., de Frutos, A. M., Fuertes, D., Gonzalez, R., Torres, B., Rodrigo, R., Bennouna, Y., Martin, L., and Guirado, C.: RIMA-AERONET network: long-term monitoring of aerosol properties, Opt. Pura Apl., 44, 629–633, 2011.
Toledano, C., González, R., Fuertes, D., Cuevas, E., Eck, T. F., Kazadzis, S., Kouremeti, N., Gröbner, J., Goloub, P., Blarel, L., Román, R., Barreto, Á., Berjón, A., Holben, B. N., and Cachorro, V. E.: Assessment of Sun photometer Langley calibration at the high-elevation sites Mauna Loa and Izaña, Atmos. Chem. Phys., 18, 14555–14567, https://doi.org/10.5194/acp-18-14555-2018, 2018.
Tzortziou, M., Herman, J. R., Cede, A., and Abuhassan, N.: High precision, absolute total column ozone measurements from the Pandora spectrometer system: Comparisons with data from a Brewer double monochromator and Aura OMI, J. Geophys. Res., 117, D16303, https://doi.org/10.1029/2012JD017814, 2012.
USNO: Approximate Solar Coordinates derived from The Astronomical Almanac, available at: http://aa.usno.navy.mil/faq/docs/SunApprox.php, last access: 1 August 2018.
Van Malderen, R., Brenot, H., Pottiaux, E., Beirle, S., Hermans, C., De Mazière, M., Wagner, T., De Backer, H., and Bruyninx, C.: A multi-site intercomparison of integrated water vapour observations for climate change analysis, Atmos. Meas. Tech., 7, 2487–2512, https://doi.org/10.5194/amt-7-2487-2014, 2014.
Wang S.-H., Tsay, S.-C., Lin, N.-H., Chang, S.-C., C. L., Welton, E. J., Holben, B. N., Hsu, N. C., Lau, W. K. M., Lolli, S., Kuo, C.-C., Chia, H.-P., Chiu, C.-Y., Lin, C.-C., Bell, S. W., Ji, Q., Hansell, R. A., Sheu, G.-R., Chi, K.-H., and Peng, C.-M.: Origin, transport, and vertical distribution of atmospheric pollutants over the northern South China Sea during the 7-SEAS/Dongsha Experiment, Atmos. Environ., 78, 124–133, https://doi.org/10.1016/j.atmosenv.2012.11.013, 2013.
Welton, E. J. and Campbell, J. R.: Micro-pulse Lidar Signals: Uncertainty Analysis, J. Atmos. Ocean. Tech., 19, 2089–2094, https://doi.org/10.1175/1520-0426(2002)019<2089:MLSUA>2.0.CO;2, 2002.
Welton, E. J., Voss, K. J., Gordon, H. R., Maring, H., Smirnov, A., Holben, B., Schmid, B., Livingston, J. M., Russell, P. B., Durkee, P. A., Formenti, P., and Andreae, M. O.: Ground-based Lidar Measurements of Aerosols During ACE-2: Instrument Description, Results, and Comparisons with other Ground-based and Airborne Measurements, Tellus B, 52, 635–650, https://doi.org/10.1034/j.1600-0889.2000.00025.x, 2000.
Zibordi, G., Holben, B., Melin, F., D'Alimonte, D., Berthon, J.-F, Slutsker, I., and Giles, D.: AERONET-OC: an overview, Can. J. Remote Sens., 36, 488–497, https://doi.org/10.5589/m10-073, 2010.


