the Creative Commons Attribution 4.0 License.
the Creative Commons Attribution 4.0 License.
 | 04 Apr 2019
OMI total bromine monoxide (OMBRO) data product: algorithm, retrieval and measurement comparisons
Raid M. Suleiman
Kelly Chance
Xiong Liu
Gonzalo González Abad
Thomas P. Kurosu
Francois Hendrick
Nicolas Theys
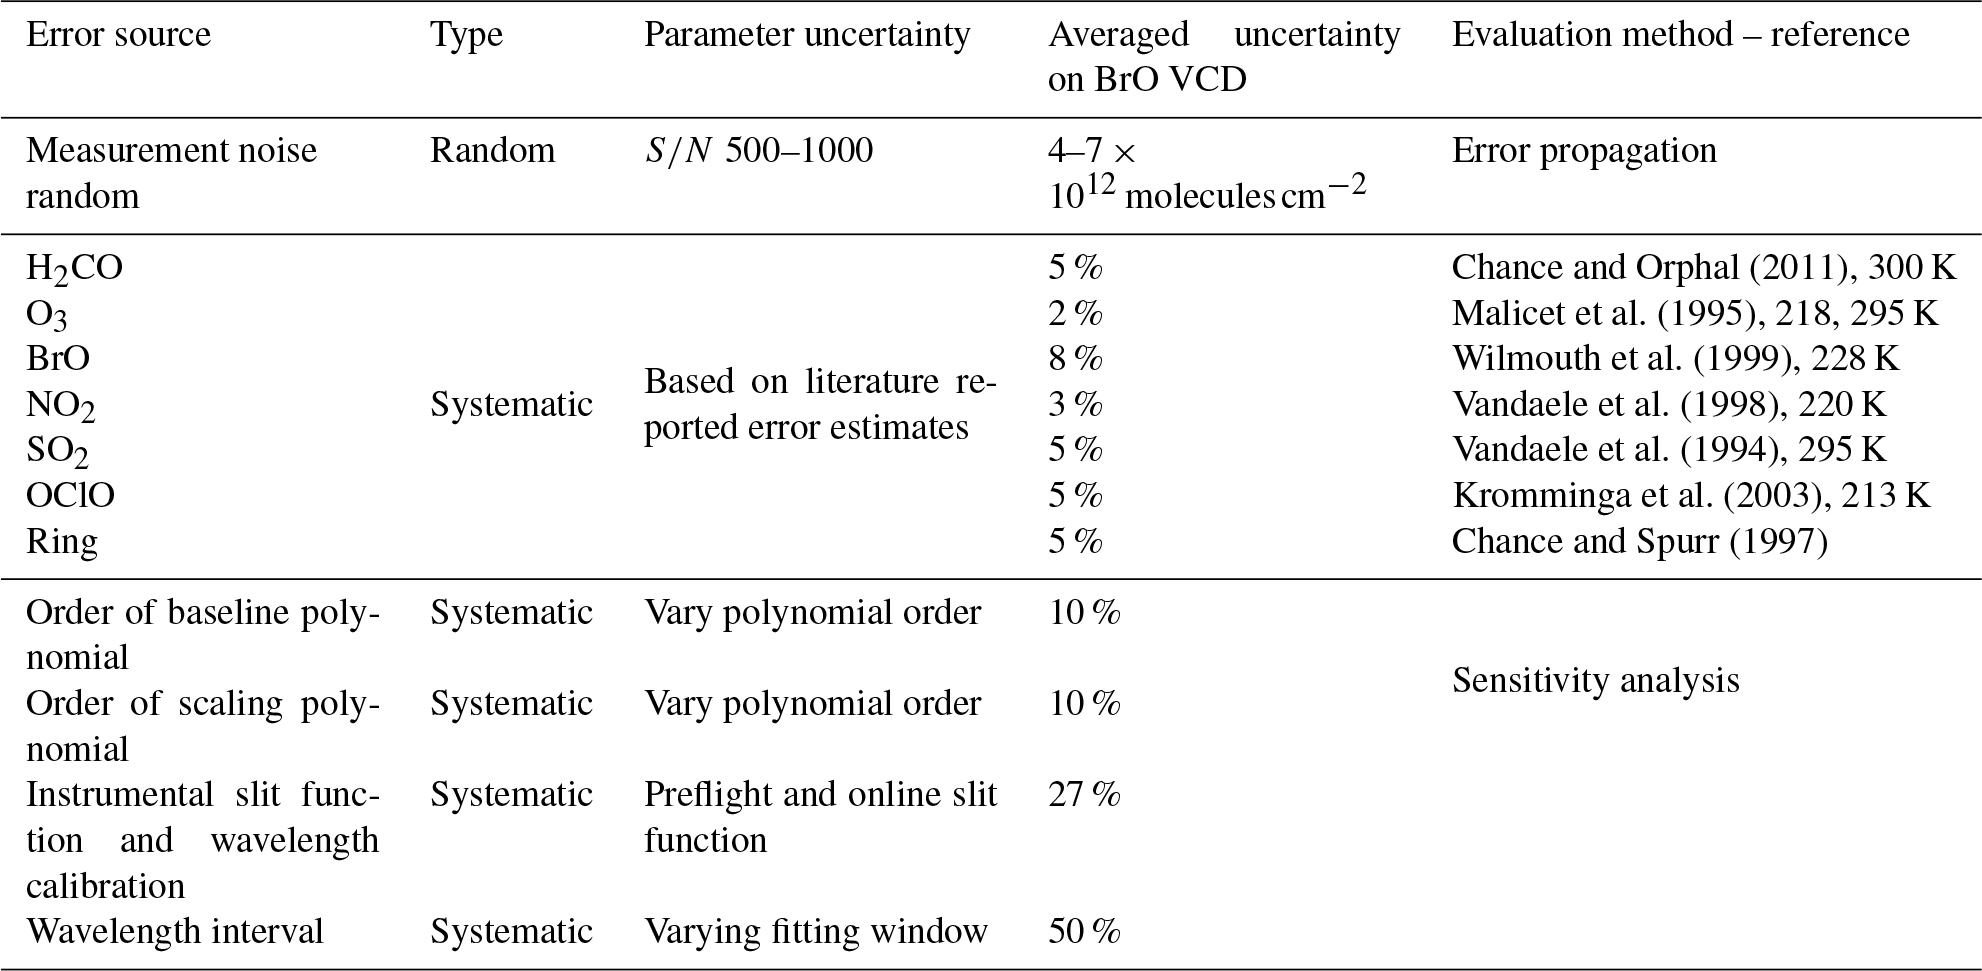
This paper presents the retrieval algorithm for the operational Ozone Monitoring Instrument (OMI) total bromine monoxide (BrO) data product (OMBRO) developed at the Smithsonian Astrophysical Observatory (SAO) and shows comparisons with correlative measurements and retrieval results. The algorithm is based on direct nonlinear least squares fitting of radiances from the spectral range 319.0–347.5 nm. Radiances are modeled from the solar irradiance, attenuated by contributions from BrO and interfering gases, and including rotational Raman scattering, additive and multiplicative closure polynomials, correction for Nyquist undersampling and the average fitting residual spectrum. The retrieval uses albedo- and wavelength-dependent air mass factors (AMFs), which have been pre-computed using a single mostly stratospheric BrO profile. The BrO cross sections are multiplied by the wavelength-dependent AMFs before fitting so that the vertical column densities (VCDs) are retrieved directly. The fitting uncertainties of BrO VCDs typically vary between 4 and 7×10¹² molecules cm−2 (∼10 %–20 % of the measured BrO VCDs). Additional fitting uncertainties can be caused by the interferences from O2-O2 and H2CO and their correlation with BrO. AMF uncertainties are estimated to be around 10 % when the single stratospheric-only BrO profile is used. However, under conditions of high tropospheric concentrations, AMF errors due to this assumption of profile can be as high as 50 %.
The retrievals agree well with GOME-2 observations at simultaneous nadir overpasses and with ground-based zenith-sky measurements at Harestua, Norway, with mean biases less than and molecules cm−2, respectively. Global distribution and seasonal variation of OMI BrO are generally consistent with previous satellite observations. Finally, we confirm the capacity of OMBRO retrievals to observe enhancements of BrO over the US Great Salt Lake despite the current retrieval setup considering a stratospheric profile in the AMF calculations. OMBRO retrievals also show significant BrO enhancements from the eruption of the Eyjafjallajökull volcano, although the BrO retrievals are affected under high SO2 loading conditions by the sub-optimum choice of SO2 cross sections.
- Article
(6991 KB) - Full-text XML
- BibTeX
- EndNote


Bromine monoxide (BrO) is a halogen oxide, predominantly located in the stratosphere and upper troposphere, where, like chlorine monoxide (ClO), it is a catalytic element in the destruction of stratospheric ozone (von Glasow et al., 2004; Salawitch et al., 2005) but with higher efficiency per molecule. Sources of tropospheric BrO include bromine release (“explosions”) during the polar spring (Hausmann and Platt, 1994; Hollwedel et al., 2004; Simpson et al., 2007; Begoin et al., 2010; Salawitch et al., 2010; Abbatt et al., 2012; Blechschmidt et al., 2016), volcanic eruptions (Bobrowski et al., 2003; Chance, 2006; Theys et al., 2009), salt lakes (Hebestreit et al., 1999; Hörmann et al., 2016) and stratospheric transport (Salawitch et al., 2010). Global BrO measurements from space were first proposed for the Scanning Imaging Absorption Spectrometer for Atmospheric Cartography (SCIAMACHY) instrument (Chance et al., 1991) and were first demonstrated with Global Ozone Monitoring Experiment (GOME-1) measurements (Chance, 1998; Platt and Wagner, 1998; Richter et al., 1998; Hegels et al., 1998), and since with SCIAMACHY nadir (Kühl et al., 2008), Global Ozone Monitoring Experiment 2 (GOME-2) measurements (Theys et al., 2011; Toyota et al., 2011) and TROPOMI (Seo et al., 2018). Initial observations of BrO by the Ozone Monitoring Instrument (OMI) were first reported by Kurosu et al. (2004). Polar spring BrO enhancements are known to be associated with boundary layer O3 depletion (Hausmann and Platt, 1994; von Glasow et al., 2004; Salawitch et al., 2005, 2010; Simpson et al., 2007; Abbatt et al., 2012). OMI measurements of BrO have been used together with chemical and dynamical modeling to investigate stratospheric versus tropospheric enhancements of atmospheric BrO at high northern latitudes (Salawitch et al., 2010). OMI BrO retrieval using the Differential Optical Absorption Spectroscopy (DOAS) method has been used to study the seasonal variations of tropospheric bromine monoxide over the Rann of Kutch salt marsh (Hörmann et al., 2016). The Arctic Research of the Composition of the Troposphere from Aircraft and Satellites (ARCTAS) campaign (Choi et al., 2012) found consistency between BrO column densities calculated from Chemical Ionization Mass Spectrometer (CIMS) measurements with the tropospheric BrO columns derived from OMI using our operational retrieval algorithm. BrO has been observed from the ground in Harestua, Norway (Hendrick et al., 2007); Lauder, New Zealand (Schofield et al., 2004a, b); Antarctica (Schofield et al., 2006); Utqiaġvik (formerly Barrow), Alaska (Liao et al., 2011, 2012; Frieß et al., 2011; Sihler et al., 2012; Peterson et al., 2016); Eureka, Canada (Zhao et al., 2015); Summit, Greenland (Stutz et al., 2011); and the Arctic Ocean (Burd et al., 2017).
Enhancement of BrO in the vicinity of salt lakes like the Dead Sea and the Great Salt Lake has been observed from ground-based measurements (Hebestreit et al., 1999; Matveev et al., 2001; Stutz et al., 2002; Tas et al., 2005; Holla et al., 2015). The active bromine compound release is due to the reaction between atmospheric oxidants with salt reservoirs. Satellite observation of salt lake BrO was first reported over the Great Salt Lake and the Dead Sea by OMI (Chance, 2006; Hörmann et al., 2016). Seasonal variations of tropospheric BrO over the Rann of Kutch salt marsh have been observed using OMI from an independent research BrO product (Hörmann et al., 2016). Bobrowski et al. (2003) made the first ground-based observations of BrO and SO2 abundances in the plume of the Soufrière Hills volcano (Montserrat) using multi-axis DOAS (MAX-DOAS). BrO and SO2 abundances as functions of the distance from the source were measured by MAX-DOAS in the volcanic plumes of Mt. Etna in Sicily, Italy, and Villarica in Chile (Bobrowski et al., 2007). The BrO∕SO2 ratio in the plume of Nyiragongo and Etna was also studied (Bobrowski et al., 2015). The first volcanic BrO measured from space was from the Ambrym volcano, measured by OMI (Chance, 2006). Theys et al. (2009) reported on GOME-2 detection of volcanic BrO emission after the Kasatochi eruption. Hörmann et al. (2013) examined GOME-2 observations of BrO slant column densities (SCDs) in the vicinity of volcanic plumes; the study showed clear enhancements of BrO in ∼ one-quarter of the volcanos and revealed large spatial differences in BrO∕SO2 ratios.
The purpose of this paper is to describe the OMI BrO operational algorithm and the data product, compare it with ground-based and other satellite measurements and analyze its spatiotemporal characteristics. This paper is organized as follows: Sect. 2 describes the OMI instrument and the data product. Section 3 gives a detailed description of the operational algorithm including algorithm and product history, spectral fitting, air mass factor (AMF) calculations, destriping and fitting uncertainties. Section 4 presents results and discussion including comparison with GOME-2 and ground-based zenith-sky measurements at Harestua, Norway, and global distribution, seasonality and enhanced BrO from the US Great Salt Lake and Iceland's Eyjafjallajökull volcano. Section 5 concludes this study.
2.1 OMI instrument
OMI (Levelt et al., 2006) was launched on the NASA Earth Observing System (EOS) Aura satellite into a sun-synchronous orbit on 15 July 2004. It is a push-broom imaging spectrometer that observes solar backscattered radiation in the visible and ultraviolet from 270 to 500 nm in three channels (UV1: 270–310 nm, UV2: 310–365 nm, visible: 350–500 nm) at a spectral resolution of 0.42–0.63 nm and spatial resolution in the normal (global sampling) mode ranging from 13 km × 24 km at direct nadir to about 28 km × 150 km at the swath edges. The global mode (GM) has 60 ground pixels with a total cross-track swath of 2600 km.
Since June 2007, certain cross-track positions of OMI data have been affected by the row anomaly (http://projects.knmi.nl/omi/research/product/rowanomaly-background.php, last access: 20 November 2017): some loose thermal insulating material likely appeared in front of the instrument's entrance slit, which can block and scatter the light, thus causing errors in level 1b data and subsequently the level 2 retrievals (Kroon et al., 2011). Initially, the row anomaly only affected a few positions, and the effect was small. But since January 2009, the anomaly has become more serious, spreading to ∼ one-third of the positions, and retrievals at those positions are not recommended for scientific use. A flagging field has been introduced in the OMI level 1b data to indicate whether an OMI pixel is affected by this instrument anomaly.
OMI measures O3 and other trace gases, aerosols, clouds and surface properties. Products developed at the SAO include operational BrO, chlorine dioxide (OClO), and formaldehyde (H2CO; González Abad et al., 2015) that are archived at NASA Goddard Earth Sciences (GES) Data and Information Services Center (DISC) and offline (“pre-operational”) O3 profile and tropospheric O3 (Liu et al., 2010; Huang et al., 2017, 2018), glyoxal (C2H2O2) (Chan Miller et al., 2014, 2016) and water vapor (H2O) (Wang et al., 2014, 2016) that are available at the Aura Validation Data Center (AVDC). All the products except for the O3 profile product are produced using nonlinear least squares (NLLS) fitting methods based on those previously developed at the SAO for the analysis of measurements from the GOME (now GOME-1) (Chance, 1998; Chance et al., 2000) and SCIAMACHY instruments (Burrows and Chance, 1991; Chance et al., 1991; Martin et al., 2006).
2.2 OMBRO data product
The current operational BrO product, OMBRO version 3, contains BrO vertical column densities (VCDs), slant column densities (SCDs), effective air mass factors (AMFs) and ancillary information retrieved from calibrated OMI radiance and irradiance spectra. Each BrO product file contains a single orbit of data, from pole to pole, for the sunlit portion of the orbit. The data product from 26 August 2004 through the present is available at GES DISC. Data used in this study cover the period from 1 January 2005 to 31 December 2014.
3.1 Algorithm and product history
OMBRO Version 1.0 was released on 1 February 2007, based on a spectral fitting window of 338–357 nm. Version 2.0 was released on 13 April 2008. It included major adjustments for Collection 3 level 1b data, improved destriping measures, a change of the fitting window to 340–357.5 nm, improvements to radiance wavelength calibration, and several improvements for processing near-real-time data. In both Version 1 and 2, total BrO VCDs were retrieved in two steps: first performing spectral fitting using the basic optical absorption spectroscopy (BOAS) method to derive SCDs from OMI radiance spectra and then converting from SCDs to VCDs by dividing AMFs. This is similar to current SAO H2CO, H2O and C2H2O2, as mentioned previously. The latest Version 3.0.5, released on 28 April 2011, includes major algorithm changes: the fitting window was moved to 319.0–347.5 nm, and BrO cross sections are multiplied by wavelength-dependent AMFs, which are a function of albedo, before fitting, for a direct retrieval of BrO VCDs. SCDs are similarly retrieved in a separate step by fitting BrO cross sections that have not been multiplied with wavelength-dependent AMFs, and an effective is computed. Diagnostic cloud information from the OMCLDO2 product (Acarreta et al., 2004) was added, and the row-anomaly-indicating flags were carried over from the level 1b product. We recommend not using pixels affected by the row anomaly despite being processed by the retrieval algorithm.
The current algorithm is described in detail in the rest of this section, with spectral fitting in Sect. 3.2, AMF calculation prior to spectral fitting in Sect. 3.3, post-processing de-stripping to remove cross-track-dependent biases in Sect. 3.4 and fitting uncertainties and error estimates in Sect. 3.5.
3.2 Spectral fitting
Most aspects of the algorithm physics for the direct fitting of radiances by the BOAS method were developed previously at SAO for analysis of GOME and SCIAMACHY satellite spectra (Chance, 1998; Chance et al., 2000; OMI, 2002; Martin et al., 2006) and in the various algorithm descriptions of other SAO OMI products (Wang et al., 2014; Chan Miller et al., 2014; González Abad et al., 2015).
The spectral fitting in the SAO OMI BrO retrieval is based on a Gauss–Newton NLLS fitting procedure, the CERN ELSUNC procedure (Lindström and Wedin, 1987), which provides for bounded NLLS fitting. Processing begins with wavelength calibration for both irradiance and radiance. In each case the wavelength registration for the selected fitting window is determined independently for each cross-track position by cross-correlation of OMI spectra with a high spectral resolution solar irradiance (Caspar and Chance, 1997; Chance, 1998; Chance and Kurucz, 2010) using the preflight instrument slit functions (Dirksen et al., 2006). Radiance wavelength calibration is performed for a representative swath line of radiance measurements (usually in the middle of the orbit) to determine a common wavelength grid for reference spectra.
Following wavelength correction, an undersampling correction spectrum is computed to partially correct for spectral undersampling (lack of Nyquist sampling: Chance, 1998; Slijkhuis et al., 1999; Chance et al., 2005). The calculation of the corrections for the undersampling is accomplished by convolving the preflight slit functions with the high-resolution solar spectrum and differencing its fully sampled and undersampled representations (Chance et al., 2005).
To process each OMI orbit, it is split into blocks of 100 swath lines. Spectral fitting is then performed for each block by processing the 60 cross-track pixels included in each swath line sequentially before advancing to the next swath line. The spectra are modeled as follows:
where I0 is the solar irradiance (used in our operational BrO retrieval) or radiance reference measurement, I is the Earthshine radiance (detected at satellite), a is albedo, αi, βj and γk are the coefficients to the reference spectra of Ai, Bj and Ck (for example, trace gas cross sections, Ring effect, vibrational Raman, undersampling correction, common mode) of model constituents. To improve cross-track stripe biases (Sect. 3.4), the OMI daily solar irradiance (I0) is substituted by the first principal component of the solar irradiances measured by OMI between 2005 and 2007 (one for each cross-track position). The principal component derived between 2005 and 2007 is used to process the entire mission. The reference spectra are derived separately for each cross-track position from original high-resolution cross sections convolved with the corresponding pre-launch OMI slit functions (Dirksen et al., 2006) after correcting for the solar I0 effect (Aliwell et al., 2002). Figure 1 shows the trace gas cross sections and Ring spectra used in the current operational algorithm. The black lines are the original high-resolution reference spectra, and the colored lines show the corresponding spectra convolved with the OMI slit function, which are used in the fitting.
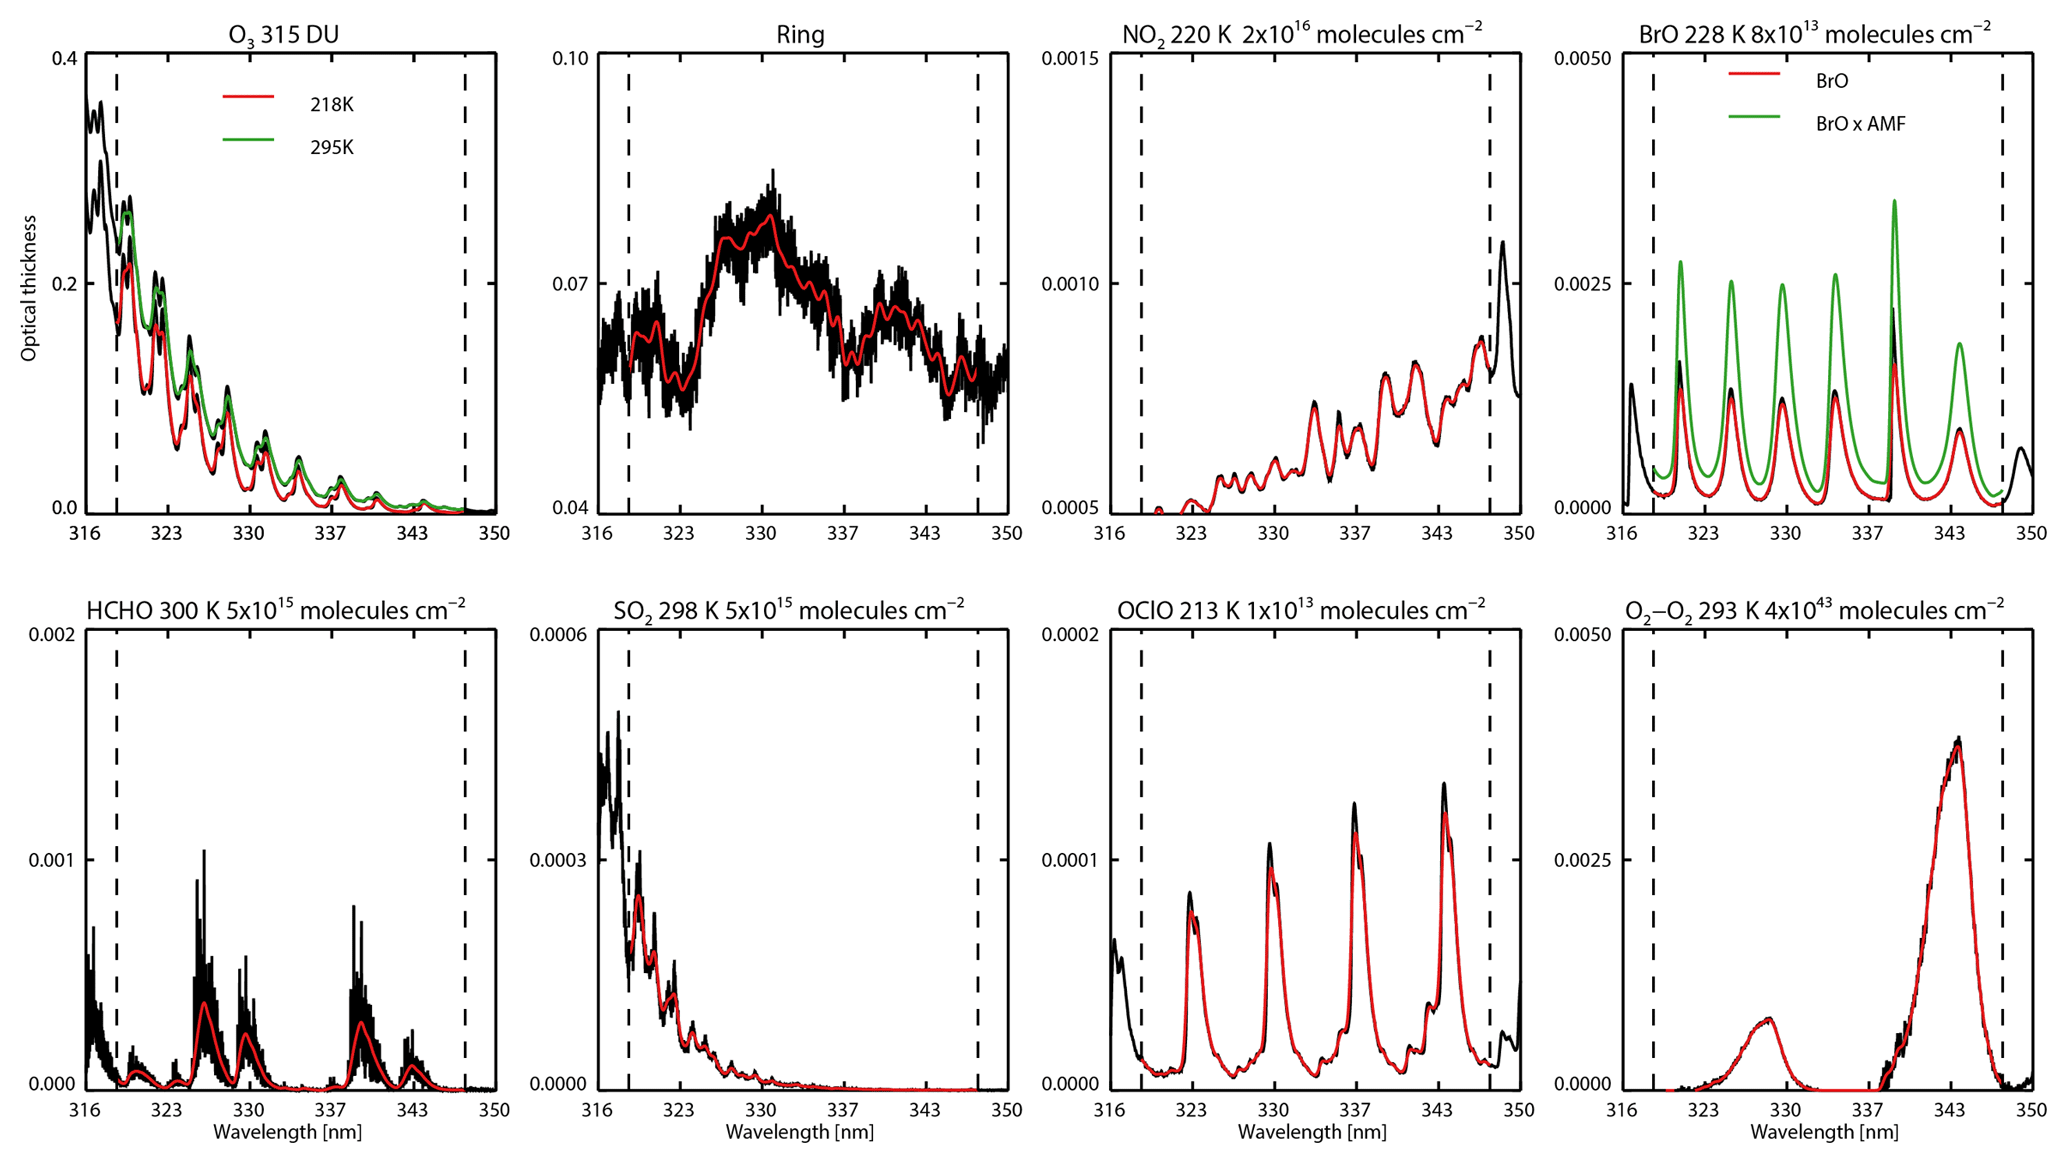
Figure 1Cross sections used in the current operational BrO algorithm except for the SO2 cross section at 298 K which is to be used in the next version. The black lines are the original cross sections, and the colored lines show the cross sections convolved with approximate OMI slit function (which is assumed to be a Gaussian with 0.42 nm full width at half maximum). The O2-O2 calculation is based on Lampel et al. (2018) cross sections. The BrO cross section after multiplication with the wavelength-dependent AMFs used these parameters for the AMF calculation: albedo=0.05, SZA=5.0∘ and VZA=2.5∘. The rms of the fitting residuals is on the order of , indicating that BrO spectral features are slightly bigger than typical fitting residuals.
For improved numerical stability, radiances and irradiances are divided by their respective averages over the fitting window, renormalizing them to values of ∼1. BrO is fitted in the spectral window 319.0–347.5 nm, within the UV-2 channel of the OMI instrument. The switch from the previous fitting window of 340–357.5 nm to this shorter and wider fitting window is based on extensive sensitivity analysis following the method described by Vogel et al. (2013). This new fitting window aims at reducing the fitting uncertainty by including more BrO spectral structures as shown in Fig. 1 and reducing retrieval noise while preserving the stability of the algorithm. An analysis of the retrieval sensitivity to different windows is included in Sect. 3.5.
The rotational Raman scattering (Chance and Spurr, 1997; Chance and Kurucz, 2010) and undersampling correction spectra, Ai, are first added to the albedo-adjusted solar irradiance aI0, with coefficients αi as shown in Eq. (1). Radiances I are then modeled as this quantity attenuated by absorption from BrO, O3, NO2, H2CO, and SO2, with coefficients βj fitted to the reference spectra Bj as shown in Eq. (1). A common mode spectrum Ck, computed online, is added by fitting coefficient γk after the Beer–Lambert law contribution terms. For each cross-track position, an initial fit of all the pixels along the track between 30∘ N and 30∘ S is performed to determine the common mode spectra, derived as the average of the fitting residuals. The common mode spectra include any instrument effects that are uncorrelated to molecular scattering and absorption. This is done to reduce the fitting root-mean-square (rms) residuals and the overall uncertainties. These are then applied as reference spectra in fitting of the entire orbit. The fitting additionally contains additive (Polybaseline) and multiplicative closure polynomials (Polyscale), parameters for spectral shift and, potentially, squeeze (not normally used). The operational parameters and the cross sections used are provided in Table 1.
Table 1Fitting window and parameters used to derive BrO vertical column densities.
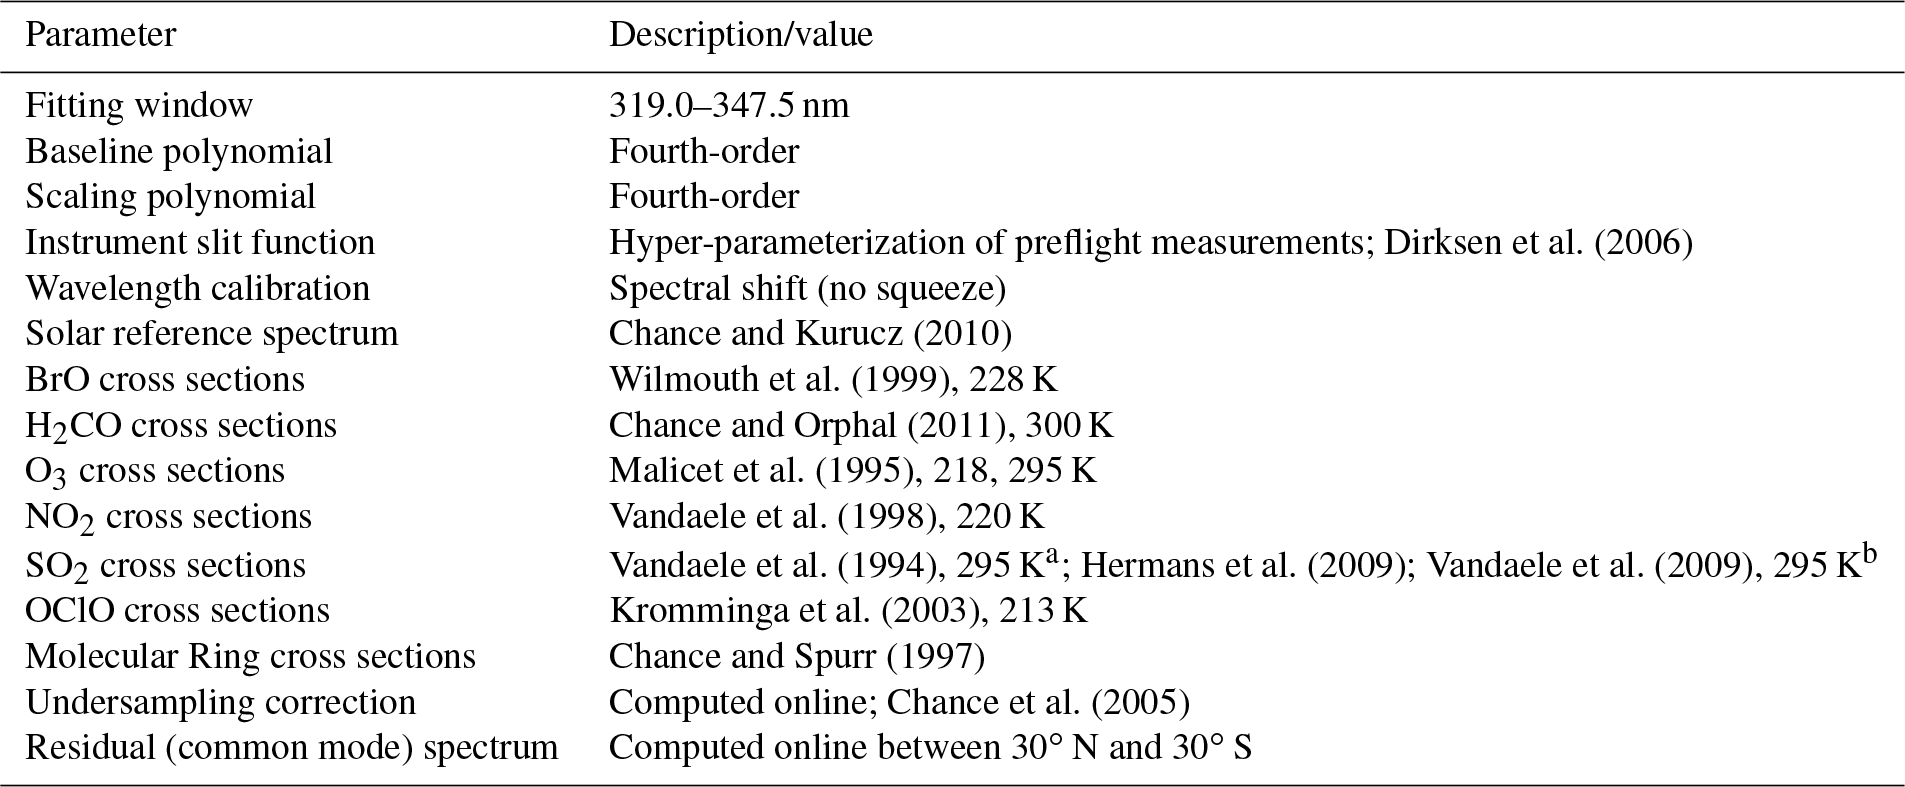
a Used in the current operational algorithm.
b Used for testing sensitivity to SO2 cross sections and will be used in
the next version.
As part of the development of the OMBRO retrieval algorithm, a significant amount of effort was dedicated to algorithm “tuning”, i.e., the optimization of elements in the retrieval process, including interfering absorbers like O2-O2. The spectral region of 343 nm, where O2-O2 has an absorption feature larger than the BrO absorption, essentially is impossible to avoid in BrO retrievals: the fitting window would have to either terminate at shorter wavelengths or start past this feature, and both approaches yield low information content that is too unacceptable for the BrO retrievals to succeed. During the tuning process, we investigated the effects of, among many other things, including or excluding O2-O2, the use of different spectroscopic data sets (Greenblatt et al., 1990; Hermans et al., 1999, cross sections), shorter or longer wavelength windows for the retrieval and even extending the retrieval window beyond the O2-O2 absorption feature but excluding the approximate wavelength slice of the feature itself. The only approach that provided quantitatively satisfactory results – i.e., stability of the retrieval under a wide range of conditions, minimized correlation with clouds, low fitting uncertainties, consistency of OMI global total column BrO with published results, and low noise in pixel-to-pixel retrievals – was to exclude O2-O2 from the OMBRO V3. It is difficult to quantify O2-O2 atmospheric content from the absorption feature around 343 nm alone, and its correlation with absorption bands of BrO and H2CO leads to spectral correlations in the course of the nonlinear least squares minimization process that are detrimental to the OMI BrO retrievals. Lampel et al. (2018) provide spectrally resolved O2-O2 cross sections not only at 343 nm but also at 328 nm (see Fig. 1), which is about 20 % of the absorption at 343 nm and has not been shown in previous O2-O2 cross sections. Future updates to the operational OMBRO algorithm will investigate the effect of including Lampel et al. (2018) O2-O2 cross sections on the fitting.
3.3 Air mass factors
Due to significant variation in O3 absorption and Rayleigh scattering in the fitting window AMFs vary with wavelength by 10 %–15 % as shown in Fig. 2. At large solar and viewing zenith angles it is difficult to identify a single representative AMF ad hoc. The wavelength-dependent AMFs are introduced to take into account for such strong variation within the BrO fitting window. They are applied prior to fitting to the BrO cross sections, and the spectral fit retrieves VCDs directly. This direct fitting approach is a major departure from the commonly employed two-step fitting procedure (OMI, 2002). It was first developed for retrievals of trace gases from SCIAMACHY radiances in the shortwave infrared (Buchwitz et al., 2000) and has been demonstrated for total O3 and SO2 retrievals from GOME/SCIAMACHY measurements in the ultraviolet (Bracher et al., 2005; Coldewey-Egbers et al., 2005; Weber et al., 2005; Lee et al., 2008).
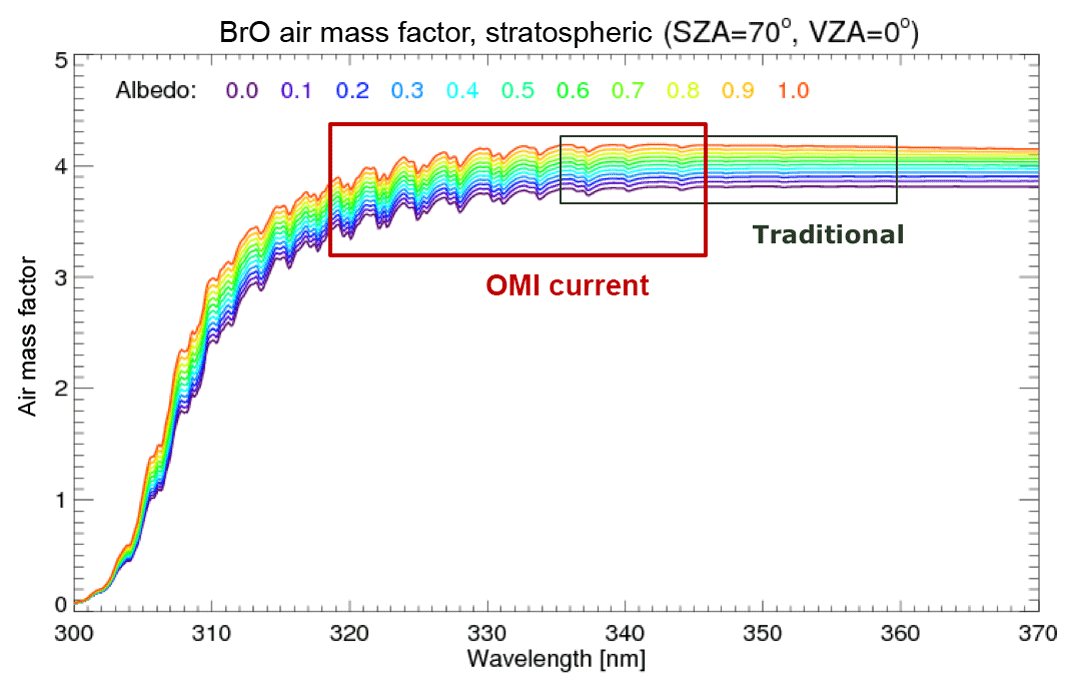
Figure 2Wavelength- and albedo-dependent air mass factors calculated using a mostly stratospheric fixed BrO profile. The blue box shows the fitting window used in our previous versions, and the red box shows the fitting window used in the current operational algorithm.
The albedo- and wavelength-dependent AMFs were pre-computed with the Linearized Discrete Ordinate Radiative Transfer code (LIDORT, Spurr, 2006) using a single mostly stratospheric BrO profile (Fig. 3, left panel). The BrO profile, based on the model of Yung et al. (1980), has ∼30 % BrO below 15 km, ∼10 % BrO below 10 km and ∼2 % BrO below 5 km. It should be noted that a fixed profile is inconsistent with the varying tropopause height (both with latitude and dynamically, e.g., Salawitch et al., 2010) and therefore with the profile shape in the stratosphere, but the impact on the AMF is typically small as the scattering weight does not change much in the stratosphere. For conditions with enhanced BrO in the lower troposphere, using this profile will overestimate the AMFs and therefore underestimate the BrO VCDs as discussed in Sect. 3.5. Surface albedos are based on a geographically varying monthly mean climatology derived from OMI (Kleipool et al., 2008). Although AMFs based on this BrO profile only slightly depend on surface albedo, albedo effects can be significant over highly reflective snow or ice surfaces, reducing VCDs by 5 %–10 %.
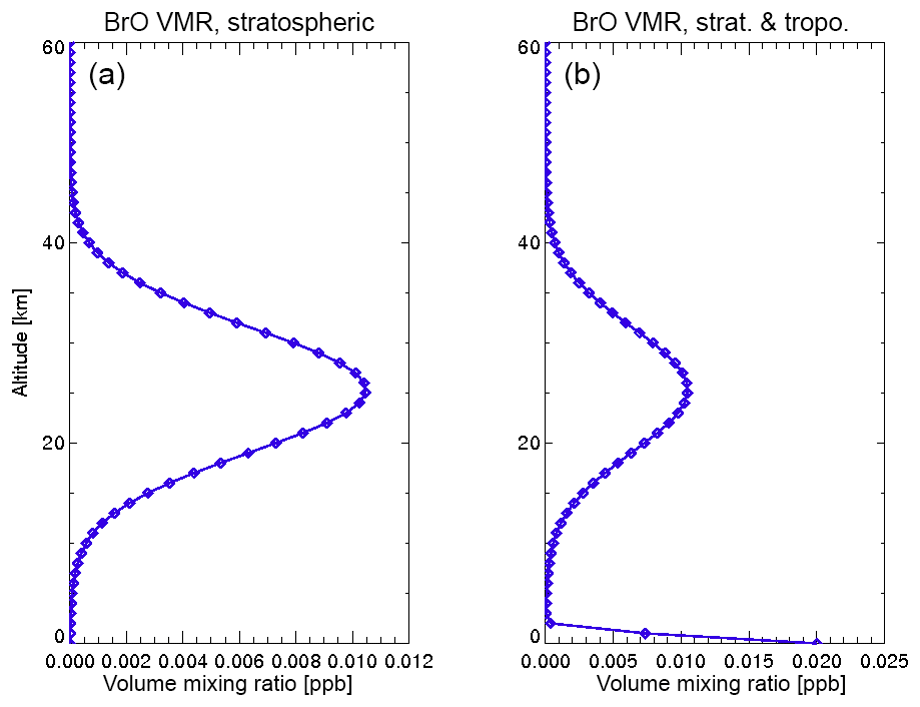
Figure 3(a) A mostly stratospheric vertical BrO profile used for air mass factors calculations in OMBRO V3. Total BrO, BrO <15 km, BrO <10 km and BrO <5 km are 2.05×10¹³, 5.06×10¹², 1.55×10¹² and 2.87×10¹¹ molecules cm−2, respectively. (b) A stratospheric tropospheric vertical BrO profile used to investigate the impact of high tropospheric BrO columns on air mass factors calculations. Total BrO, BrO <15 km, BrO <10 km and BrO <5 km are 6.99×10¹³, 5.45×10¹³, 5.10×10¹³ and 4.97×10¹³ molecules cm−2, respectively.
In order to provide the AMF in the data product for consistency with previous versions based on a two-step approach, a second fitting of all OMI spectra is performed with unmodified BrO cross sections, which yields SCDs. An effective AMF can then be computed as .
The green line in the top right panel of Fig. 1 shows the modified BrO cross section after multiplication with the wavelength-dependent AMF (albedo=0.05, SZA (solar zenith angle) = 5.0∘, and VZA (viewing zenith angle) = 2.5∘). The wavelength dependence in AMF is visible from the varying differences near BrO absorption peaks and the right wings at different wavelengths. The correlation of the unmodified BrO cross sections with the rest of the fitted molecules is small (typically less than 0.12), except with H2CO (0.43). However, it is safe to assume that in most polar regions with enhanced BrO there are no high concentrations of formaldehyde. It will be worthwhile for future studies to assess the interference of H2CO under high H2CO and background BrO conditions, similar to De Smedt et al. (2015). In addition, the AMF wavelength dependence increases with the increase of solar and viewing zenith angles and surface albedo, which increases the correlation between modified BrO cross sections and O3 cross sections. However, the correlation with O3 only becomes noticeable (∼0.10) at SZAs above ∼80∘.
3.4 Destriping
OMI L1b data exhibit small differences with cross-track position, due to differences in the dead/bad pixel masks (cross-track positions are mapped to physically separate areas on the CCD), dark current correction and radiometric calibration, which lead to cross-track stripes in the level 2 product (Veihelmann and Kleipool, 2006). Our destriping algorithm employs several methods to reduce cross-track striping of the BrO columns. First, we screen outliers in the fitting residuals. This method, originally developed to mitigate the effect of the South Atlantic Anomaly in SAO OMI BrO, H2CO, and OClO data products, is now also being employed for GOME-2 (Richter et al., 2011). Screening outliers is done through computing the median, rmed, and the standard deviation σ of residual spectra r(λ) and in subsequent refitting excluding any spectral points for which . This can be done repeatedly for every ground pixel, which makes the processing slow. However, we do it once for a reference swath line, recording the positions of the bad pixels and excluding them by default in each subsequent fit. Second, after the completion of the spectral fitting process for all ground pixels in the granule, a post-processing cross-track bias correction is performed: an average cross-track pattern is calculated from the along-track averages of all BrO VCDs for each cross-track position within a ±30∘ latitude band around the Equator, to which a low-order polynomial is fitted. The differences between the cross-track pattern and the fitted polynomial are then applied as a cross-track VCD correction (or “smoothing”) factor. The smoothed VCDs are provided in a separate data field, ColumnAmountDestriped. Smoothed SCDs are derived in an analogous fashion and are also included in the data product.
3.5 BrO VCD error analysis
Estimated fitting uncertainties are given as , where C is the covariance matrix of the standard errors. This definition is only strictly true when the errors are normally distributed. In the case in which the level 1 data product uncertainties are not reliable estimates of the actual uncertainties, spectral data are given unity weight over the fitting window, and the 1σ fitting error in parameter i is determined as
where εrms is the root mean square of the fitting residuals, “n points” is the number of points in the fitting window and “n varied” is the number of parameters varied during the fitting.
The fitting uncertainties for single measurements of the BrO VCDs typically vary between 4×10¹² and 7×10¹² molecules cm−2, consistently throughout the data record. The uncertainties vary with cross-track positions, from at nadir positions to at edge positions due to the increase of photon path length through the stratosphere. Relatively, the VCD uncertainties typically range between 10 % and 20 % of individual BrO VCDs but could be as low as 5 % over BrO hotspots. This is roughly 2–3 times worse that what was achieved from GOME-1 data.
The BrO VCD retrieval uncertainties listed in the data product only include random spectral fitting errors. Error sources from AMFs (i.e., BrO climatology), atmospheric composition and state (pressure–temperature vertical profiles, total O3 column, etc.) and other sources of VCD uncertainty are not included. We provide error estimates for these additional error sources here.
Uncertainties in the AMFs, used to convert slant to vertical columns, are estimated to be 10 % or less except when there is substantially enhanced tropospheric BrO. Hence the total uncertainties of the BrO vertical columns typically range within 15 %–30 %. To estimate the AMF error associated with enhanced tropospheric concentrations, we have studied the difference between AMFs calculated using the stratospheric-only BrO profile and a stratospheric–tropospheric profile as shown in Fig. 3b. Figure 4 shows the dependency of the relative AMF difference with respect to wavelength (panel a), albedo (panel b) and VZA (panel c) as a function of the SZA between calculations performed using these two profiles. The use of the stratospheric-only BrO profile can lead to AMF errors up to 50 % depending on albedo and viewing geometry. On average, using the stratospheric-only BrO profile overestimates AMF and underestimates VCD by 41 %.
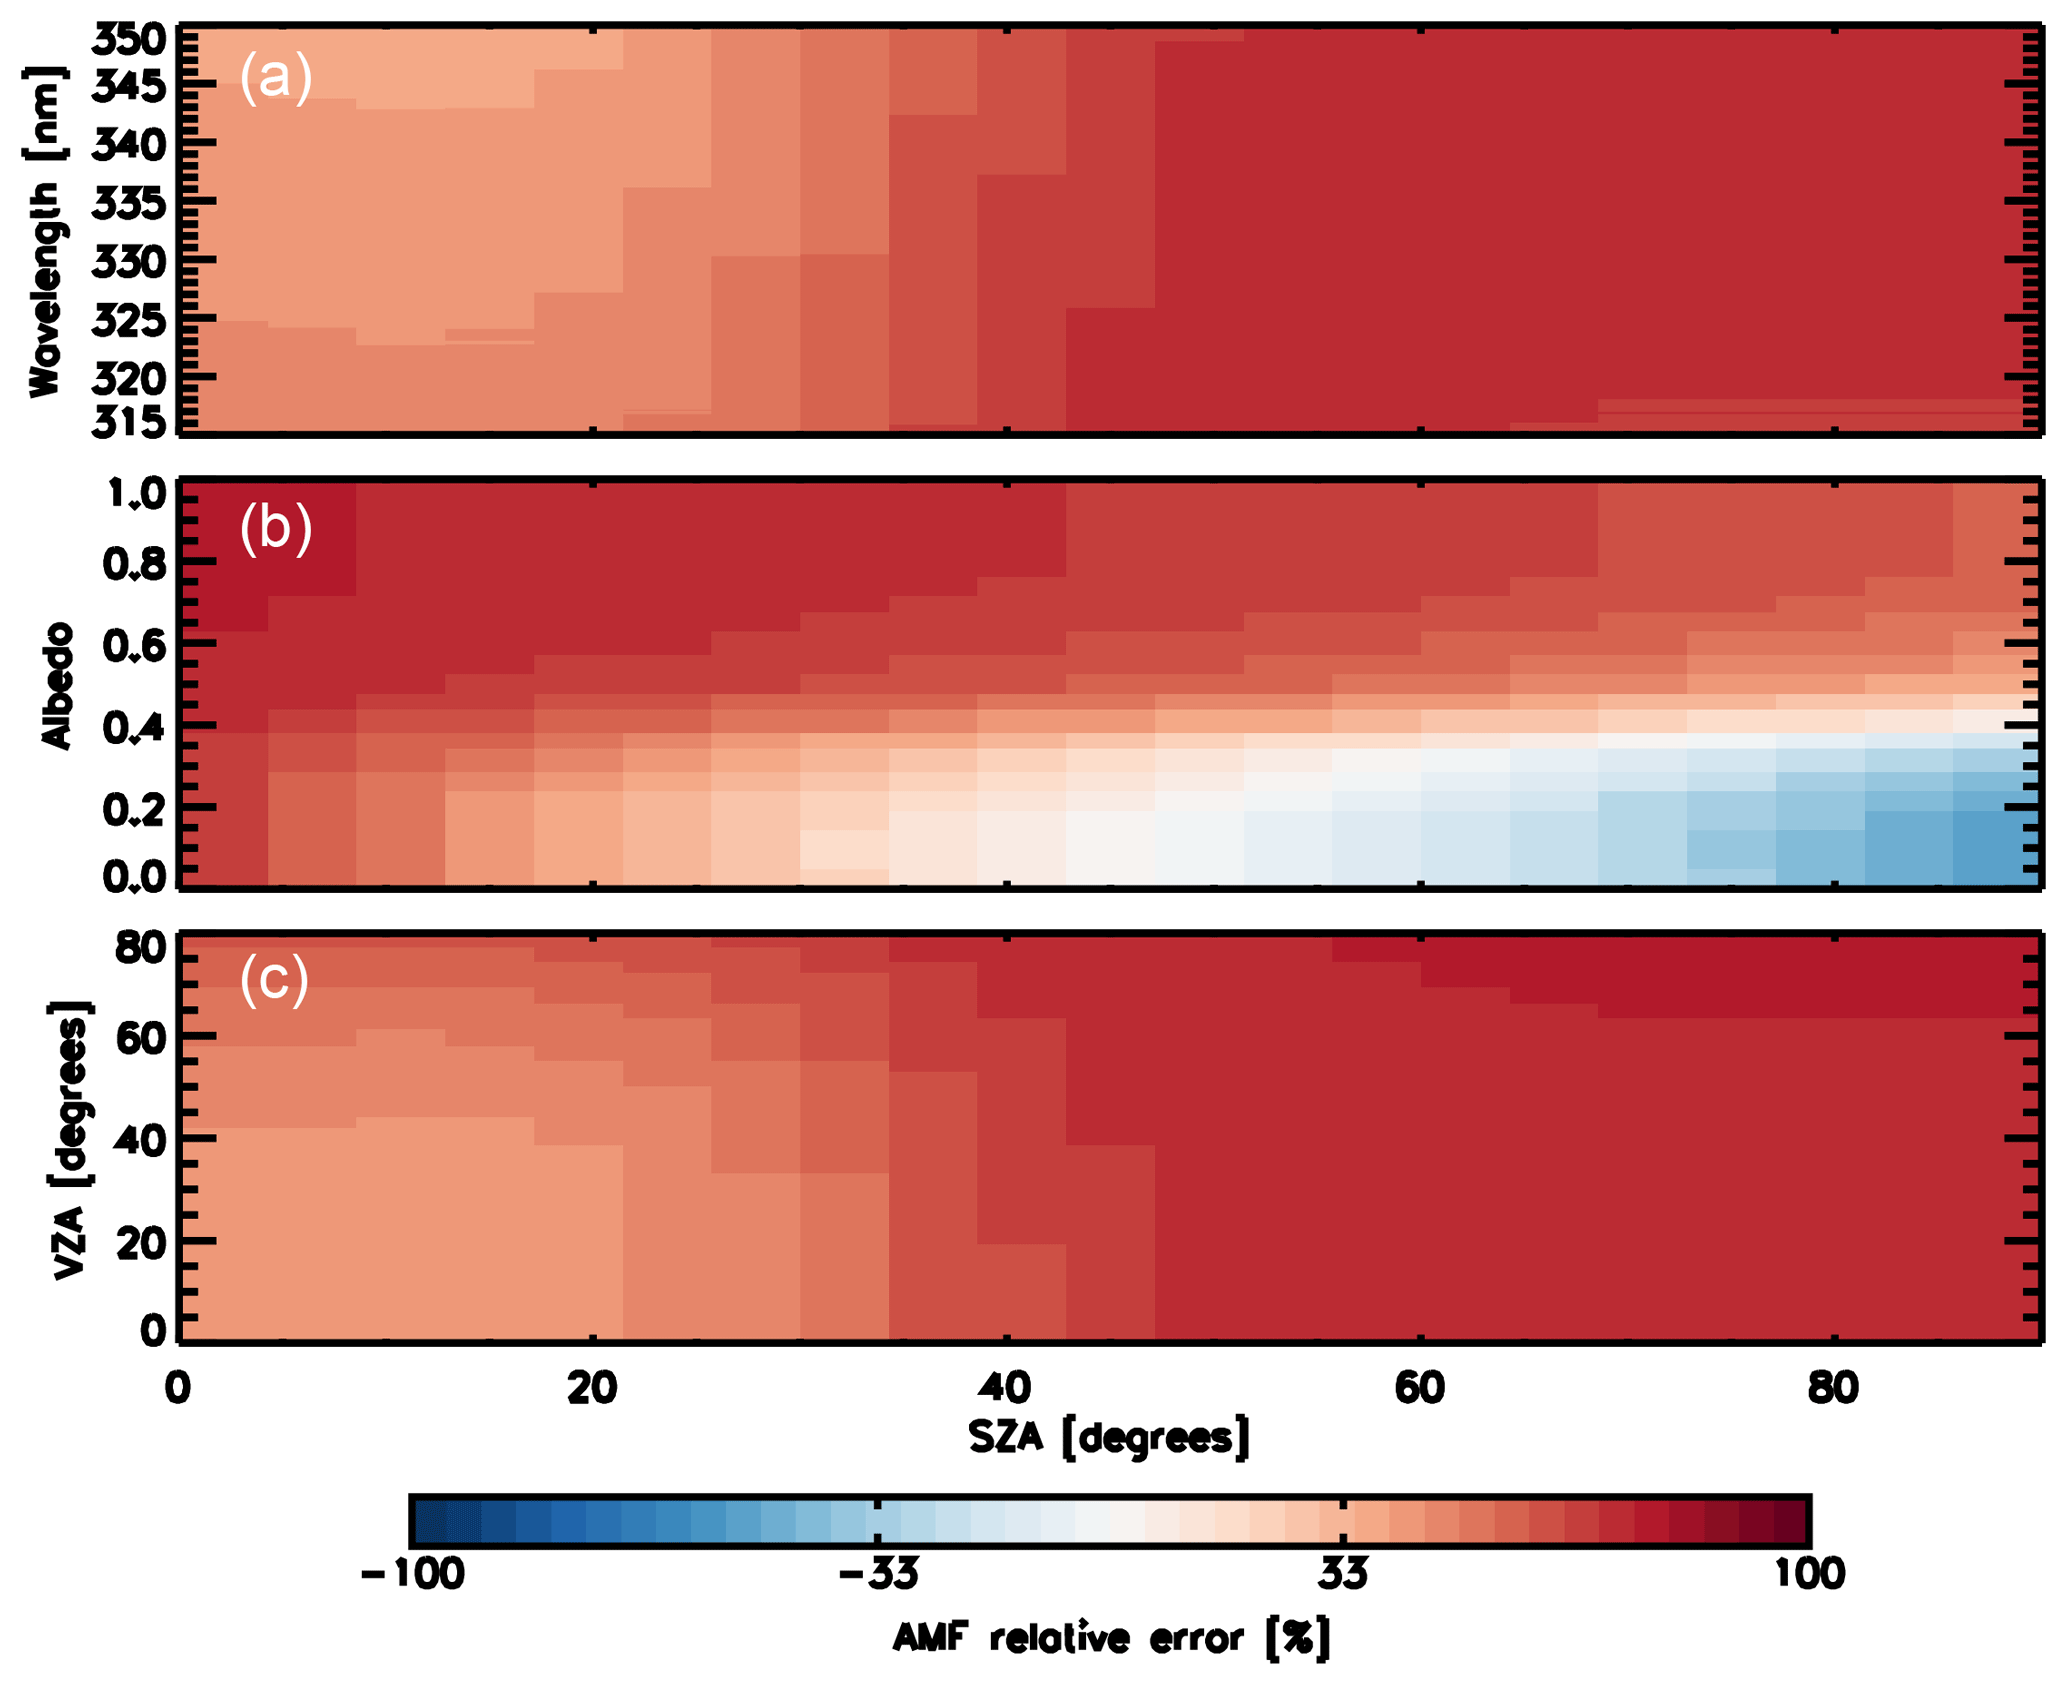
Figure 4The percentage of relative AMF errors as a function of the SZA and the wavelength (a), albedo (b) and VZA (c) when using the stratospheric-only BrO profile (Fig. 3a) in the case there is a significant tropospheric BrO column as shown in the stratospheric–tropospheric BrO profile (Fig. 3b).
We have performed sensitivity analysis of OMI BrO VCD with respect to various retrieval settings using orbit 26564 on 13 July 2009. Table 2 shows the median VCDs, median fitting uncertainties and the number of negative VCD pixels for each configuration. Table 3 summarizes the overall fitting error budget including the random fitting uncertainty, cross section errors (as reported in the literature) and various retrieval settings. We studied five wavelength windows including the current operational window (319.0–347.5 nm) version 2 window (323.0–353.5 nm), version 1 (340.0–357.5 nm) and two extra windows, exploring the impact of extending the window to shorter wavelengths (310.0–357.5 nm) and reducing it by limiting its extension to wavelengths above 325 nm (325.0–357.5). The choice of fitting window can cause significant differences in BrO VCDs of up to 50 %. The current window results in the most stable retrievals with the smallest number of pixels with negative VCD values.
Table 2Error analysis studies. For reference, the total number of retrieved pixels not affected by the row anomaly is 58 112.
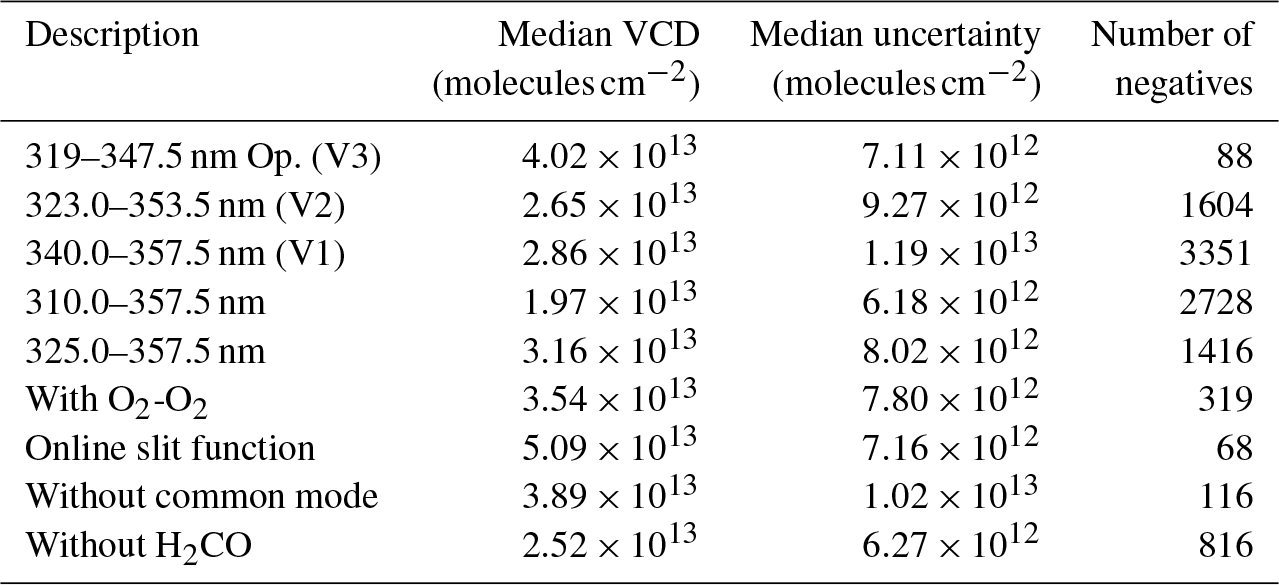
Table 3Summary of different errors sources in the BrO vertical column.
Including the interference of O2-O2 leads to a decrease of the median VCD by ∼12 % and an increase of the median fitting uncertainty by ∼10 % with respect to the operational setup. Excluding H2CO from the fitting significantly reduces the retrieved BrO columns by ∼37 %, given that the strong anticorrelation between both molecules is not taken into account. Fitting the mean residual (common mode) has a small impact on the retrieval results; the median VCD only changes ∼3 % but reduces the median fitting uncertainty by ∼30 % with respect to the exclusion of the common mode. To study the impact of the slit functions, we have performed the retrieval using both online slit functions, modeled as a Gaussian, and the preflight instrument slit functions. The median difference between these two retrievals is 27 % for orbit number 26564. We have investigated the impacts of the order of scaling and baseline polynomials; it can cause uncertainties of ∼10 % as shown in Table 3.
To study the impact of the radiative transfer effects of the O3 absorption in our retrieval, we have adopted the correction method described by Puķīte et al. (2010). We find that between 60∘ S and 60∘ N, the average difference is smaller than 10 %, with values around 2 % near the Equator. However, as we move near the poles with solar zenith angles above 60∘, the differences start to be bigger, arriving at mean values around 30 %.
Comparisons of the OMI OMBRO product with GOME-2 satellite retrievals and remote sensing ground-based measurements over Harestua, Norway, as well as monthly mean averages illustrate the quality of the retrieval on a global scale. On a local scale, recent scientific studies looking at BrO enhancements in volcanic plumes and over salt lakes are pushing the limits of the current OMBRO setups. In the following sections, we provide details of these comparisons (Sect. 4.1) and discuss OMI OMBRO global distribution (Sect. 4.2) and local enhancements over salt lakes and volcanic plumes observations (Sect. 4.3) and their applicability and strategies to correctly use the publicly available OMBRO product.
4.1 Comparisons with GOME-2 and ground-based observations
To assess the quality of the OMBRO product, we first compared OMI BrO VCDs with BIRA/GOME-2 BrO observations (Theys et al., 2011). GOME-2 has a descending orbit with a local Equator crossing time (ECT) of 09:30, and OMI has an ascending orbit with an ECT of 13:45. To minimize the effects of diurnal variation, especially under high SZAs (e.g., McLinden et al., 2006; Sioris et al., 2006), on the comparison, we conduct the comparison using simultaneous nadir overpasses (SNOs) within 2 min between GOME-2 and OMI predicted by NOAA National Calibration Center's SNO prediction tool (https://ncc.nesdis.noaa.gov/SNOPredictions, last access: 15 October 2017). Given Aura and Metop-A satellite orbits, all these SNOs occur at high latitudes around 75∘ S and 75∘ N. Figure 5 shows the time series of comparison of individual OMI/GOME-2 BrO retrievals from February 2007 through November 2008. The temporal variation of BrO at the SNO locations is captured similarly by OMI and GOME-2 BrO. The scatter plot in Fig. 6 quantifies the comparison between OMI and GOME-2 BrO. OMI BrO shows excellent agreement with GOME-2 BrO, with a correlation of 0.74 and a mean bias of molecules cm−2 (mean relative bias of %). Considering very different retrieval algorithms including different cross sections and BrO profiles, such a good agreement is remarkable. GOME-2 retrievals use the BrO cross sections of Fleischmann et al. (2004), while our BrO retrievals use the BrO cross sections of Wilmouth et al. (1999). According to the sensitivity studies by Hendrick et al. (2009), using the Fleischmann cross section increases BrO by ∼10 %. So, accounting for different cross sections, OMI BrO underestimates the GOME-2 BrO by ∼10 %. In addition, the GOME-2 algorithm uses a residual technique to estimate tropospheric BrO from measured BrO SCDs by subtracting a dynamic estimate of stratospheric BrO climatology driven by O3 and NO2 concentrations and by using two different tropospheric BrO profiles depending on surface albedo conditions. This is very different from the approach of using a single BrO profile in the OMI BrO algorithm and can contribute to some of the BrO differences. Furthermore, additional algorithm uncertainties in both algorithms and different spatial sampling can also cause some differences. Figure 7 shows the VCD monthly averages of GOME-2 data (green) and OMBRO (black) from February 2007 to December 2009, for which the seasonal variations are clearly seen. Our study shows that OMI has negative mean biases of 0.35×10¹³ molecules cm−2 (12 %), 0.33×10¹³ molecules cm−2 (10 %), 0.25×10¹³ molecules cm−2 (17 %) and 0.30×10¹³ molecules cm−2 (10 %) for Alaska, the South Pacific, Hudson Bay and Greenland, respectively.
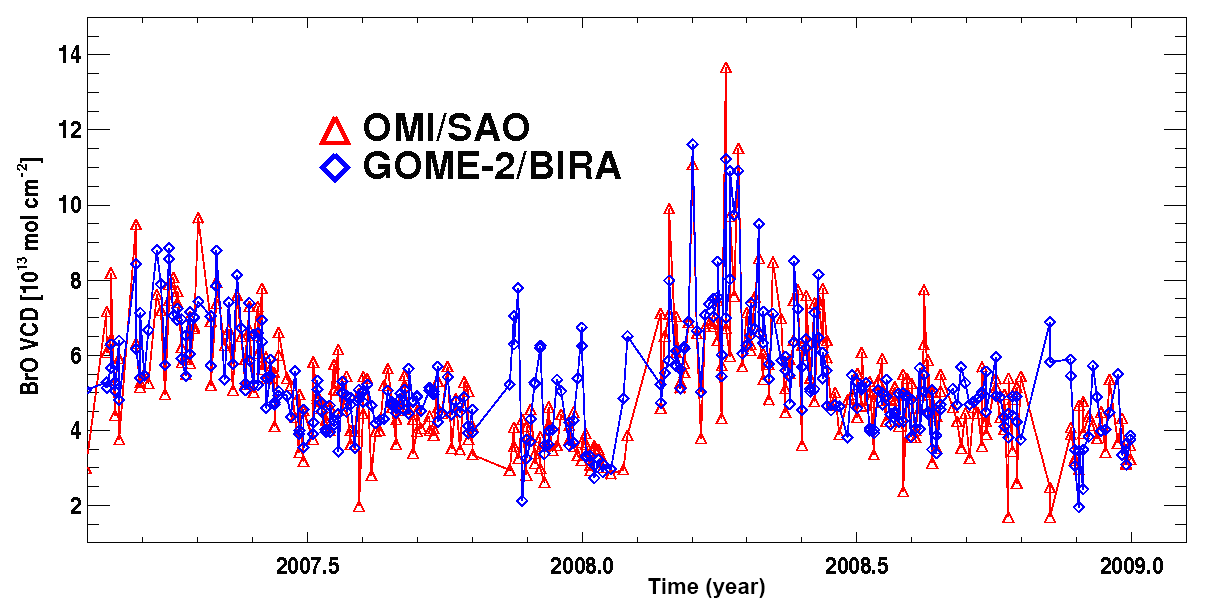
Figure 5Time series comparison of SAO OMI (red) BrO and BIRA/GOME-2 (blue) BrO VCDs from February 2007 to November 2008 using simultaneous nadir overpasses occurring at high latitudes, around 75∘ S and 75∘ N, and within 2 min between OMI and GOME-2 observations.
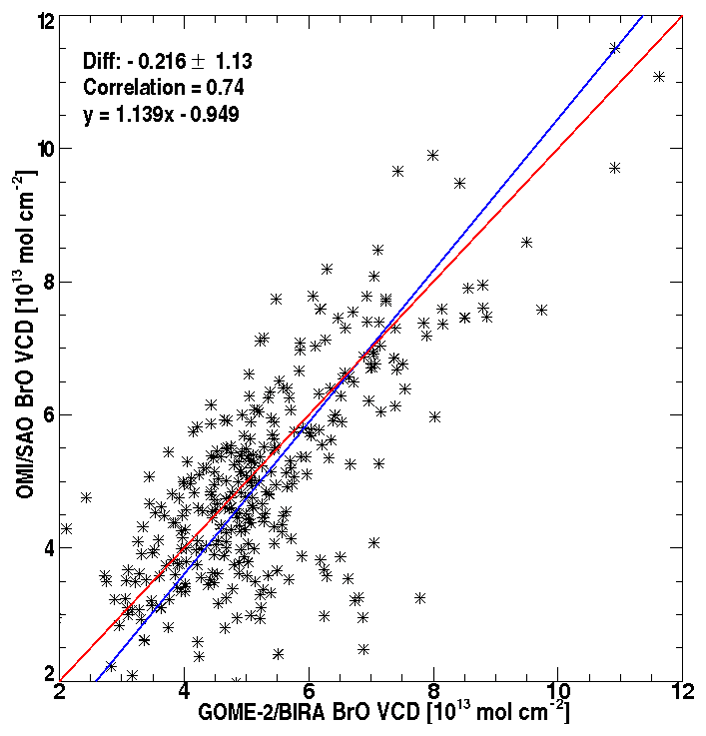
Figure 6Correlation and orthogonal regression of OMI and GOME-2 BrO for the data shown in Fig. 5. The legends show the mean bias and standard deviation of the differences, correlation and the orthogonal regression.
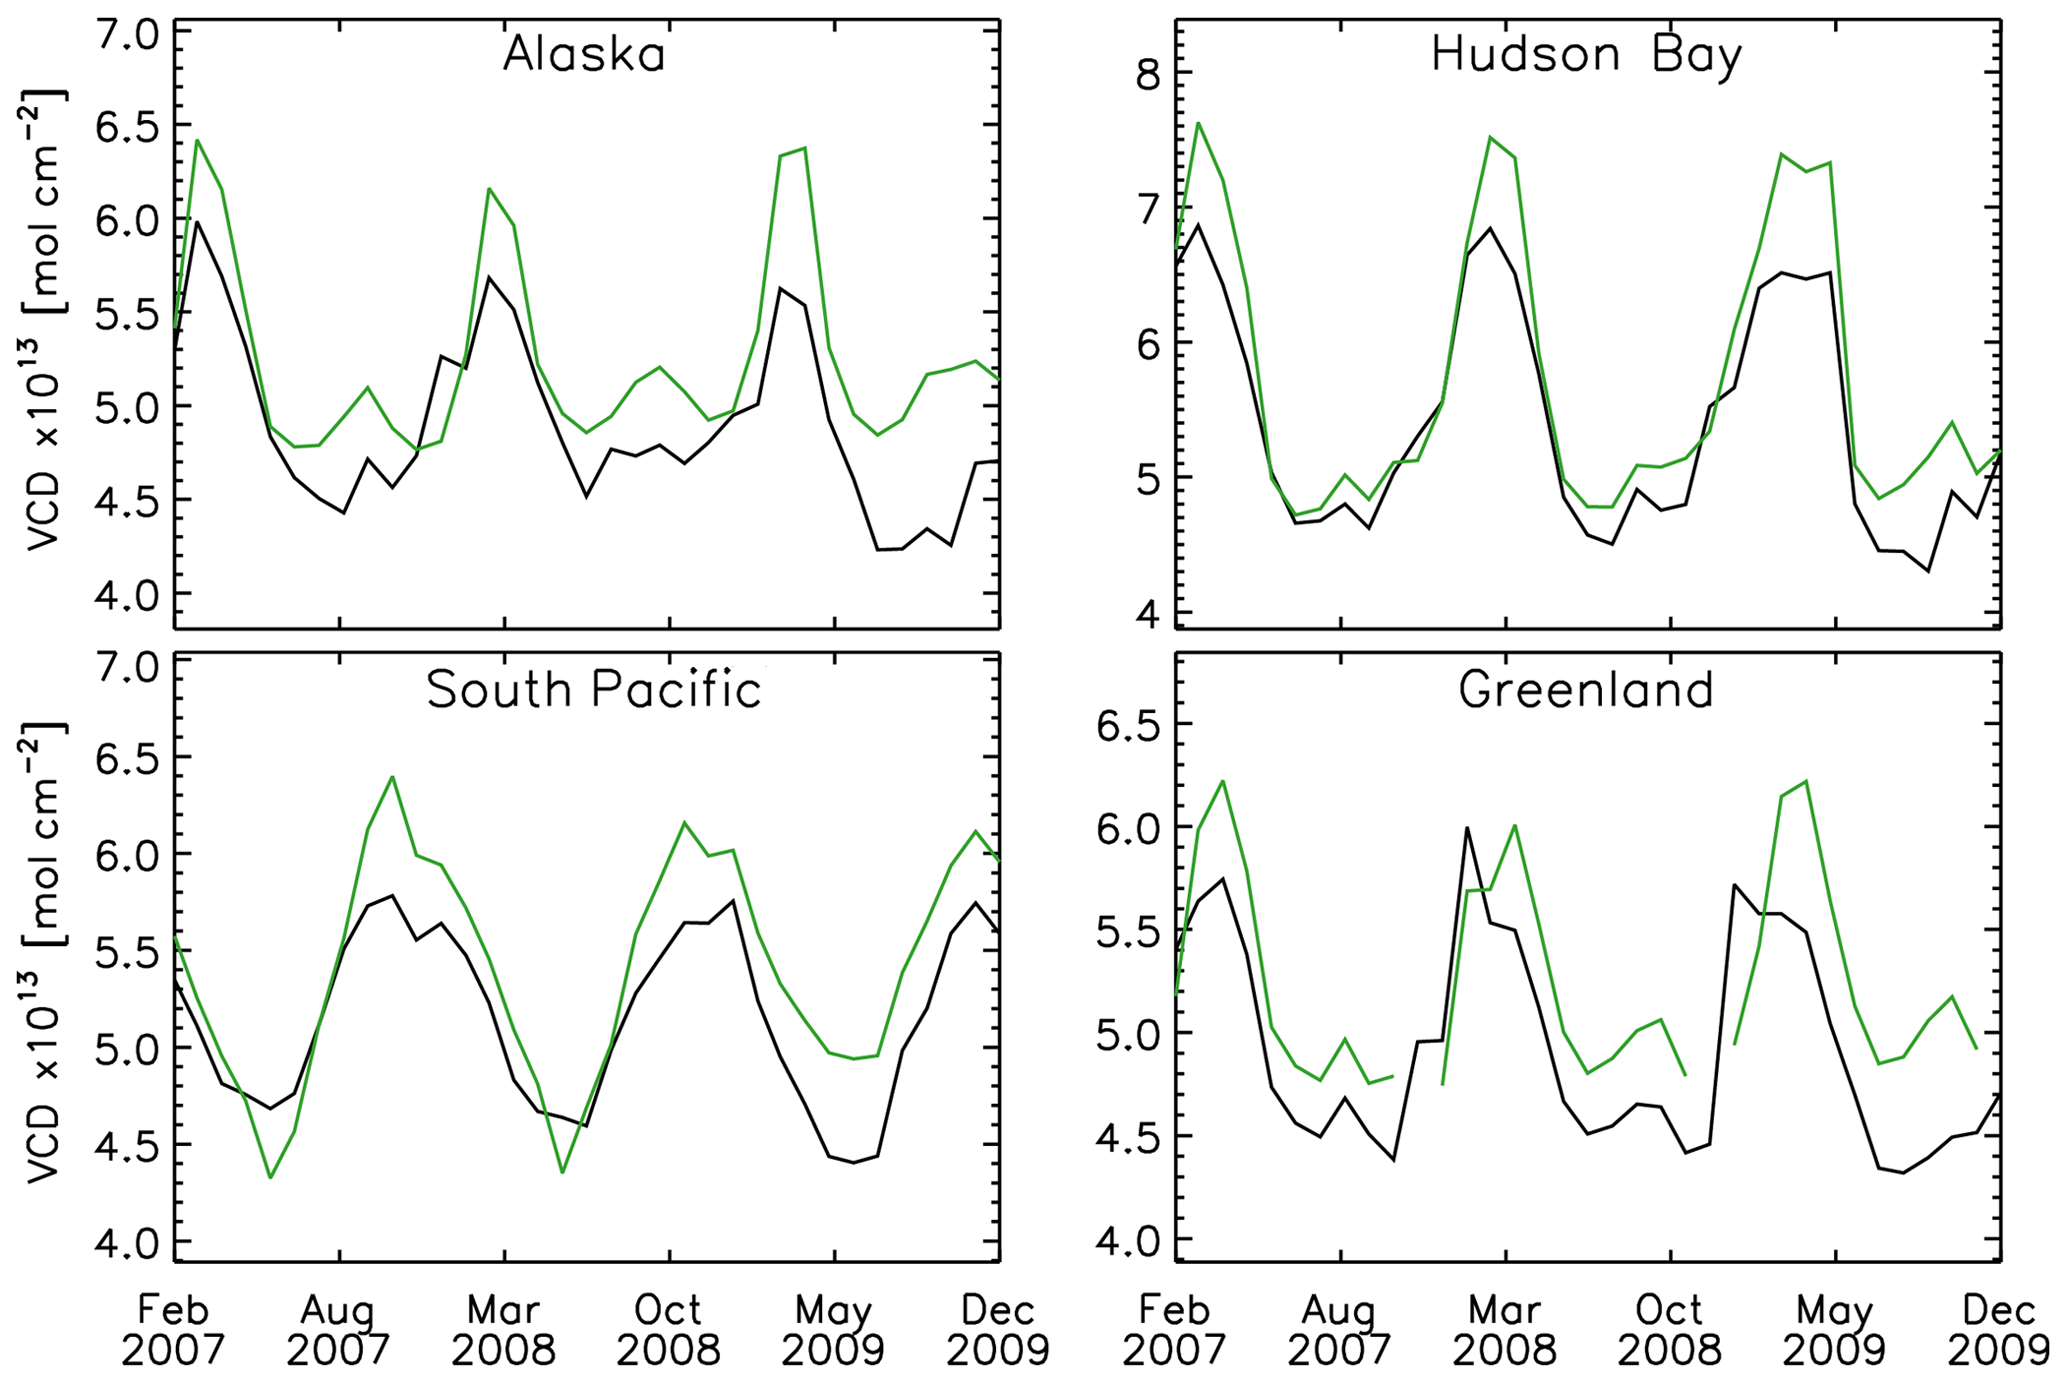
Figure 7VCD of GOME-2 (green) comparison to OMI (black) over four regions from February 2007 to December 2009 for four regions. Each region is defined by a square with the following latitude and longitude boundaries: Alaska (50–70∘ N, 165–135∘ W), Hudson Bay (50–65∘ N, 95–75∘ W), the South Pacific (70–50∘ S, 135–155∘ E) and Greenland (60–80∘ N, 60–15∘ W).
We also used ground-based zenith-sky measurements of total column BrO at Harestua, Norway (Hendrick et al., 2007) to estimate the quality of the OMI BrO. We compared daily mean total BrO at Harestua with the mean OMI BrO from individual footprints that contain the location of Harestua site. Figure 8 shows the time series of the comparison between OMI total BrO and Harestua total BrO from February 2005 through August 2011 with the scatter plot shown in Fig. 9. Ground-based BrO shows an obvious seasonality with high values in the winter–spring and low values in the summer–fall. Such seasonality is well captured by OMI BrO. OMI BrO shows a reasonable good agreement with Harestua BrO, with a correlation of 0.46 and a mean bias of molecules cm−2 (mean relative bias of 3.18±16.30 %, with respect to individual Harestua BrO). Sihler et al. (2012) compared GOME-2 BrO to ground-based observations at Utqiaġvik (formerly Barrow), finding the correlation to be weaker (r=0.3), likely due to both elevated and shallow surface layers of BrO. However, their correlation between GOME-2 BrO and ground-based measurements made from the icebreaker Amundsen, in the Canadian Arctic Ocean (r=0.4), is closer to our correlation here. From the Harestua data, tropospheric BrO typically consists of 15 %–30 % of the total BrO, larger than what we have assumed in the troposphere. The use of a single BrO profile in the OMI BrO algorithm will likely underestimate the actual BrO. Accounting for the uncertainty due to profile shape, OMI BrO will have a larger positive bias relative to Harestua measurements, which can be caused by other algorithm uncertainties and the spatiotemporal differences between OMI and Harestua BrO.
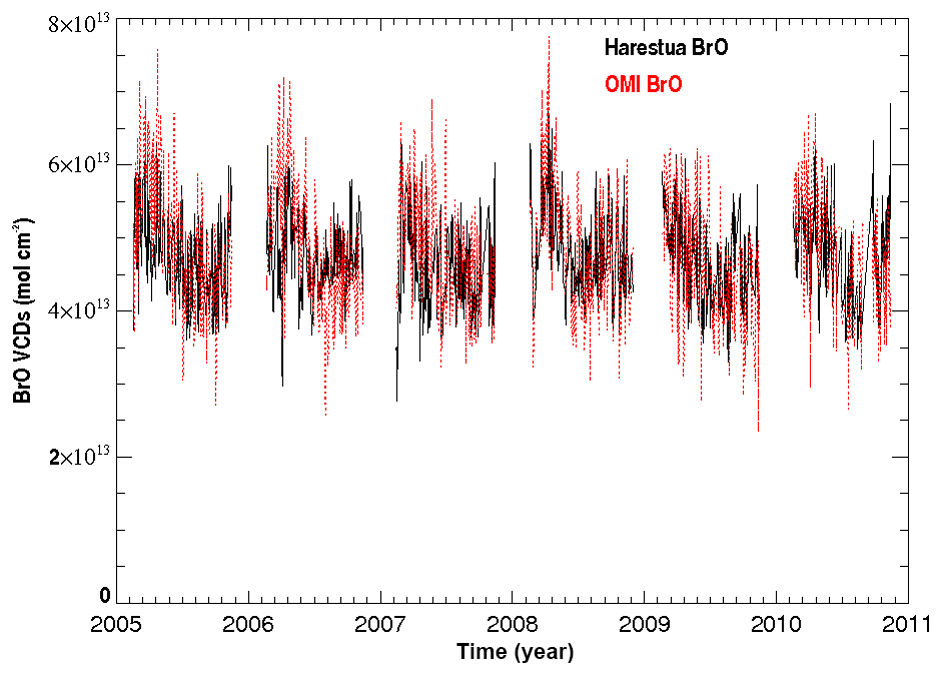
Figure 8Time series comparison of ground-based zenith-sky total BrO (black) at Harestua, Norway, and coincident SAO OMI BrO (red) from February 2005 through August 2011.

Figure 9Correlation and orthogonal regression of OMI and Harestua BrO for the data in Fig. 8. The legends show the mean biases and standard deviations of the differences, correlation and the orthogonal regression.
4.2 Global distribution of BrO VCDs
Figure 10 presents the global distribution of monthly mean BrO VCDs for selected months (March, June, September, December), showing BrO seasonality for three different years (2006, 2007 and 2012). BrO typically increases with latitude, with minimal values in the tropics ( molecules cm−2) and maximum values (∼ 1014 molecules cm−2) around polar regions especially in the Northern Hemisphere winter–spring. In the tropics, BrO shows little seasonality, but at higher latitudes in polar regions, BrO displays evident seasonality. The seasonality is different between the Northern and Southern Hemisphere. In the Northern Hemisphere, BrO values are larger in spring (March) with widespread enhancement and are smaller in fall (September/December). In the Southern Hemisphere, BrO values are larger in southern hemispheric spring and summer (i.e., September and December) and smaller in the winter (June). Such global distribution and seasonal variation are generally consistent with previous satellite measurements (cf. Chance, 1998; http://bro.aeronomie.be/level3_monthly.php?cmd=map, last access: 15 October 2017). BrO in the tropics shows consistent zonal distributions, with lower values over land and in the intertropical convergence zone. This might be related to the impacts of clouds on the retrievals (e.g., BrO below thick clouds cannot be measured; there are uncertainties in the AMF calculation under cloudy conditions) and will be investigated in detail in future studies. The global distribution and seasonal variation are consistent from year to year, but the distributions from different years disclose some interannual variation. For example, BrO values in 2007 are smaller in January but are larger in March compared to those in 2006. Although OMI data since 2009 have been seriously affected by the row anomaly at certain cross-track positions, the monthly mean data derived from good cross-track positions are hardly affected by the row anomaly as shown by the very similar global distribution and seasonality in 2012.
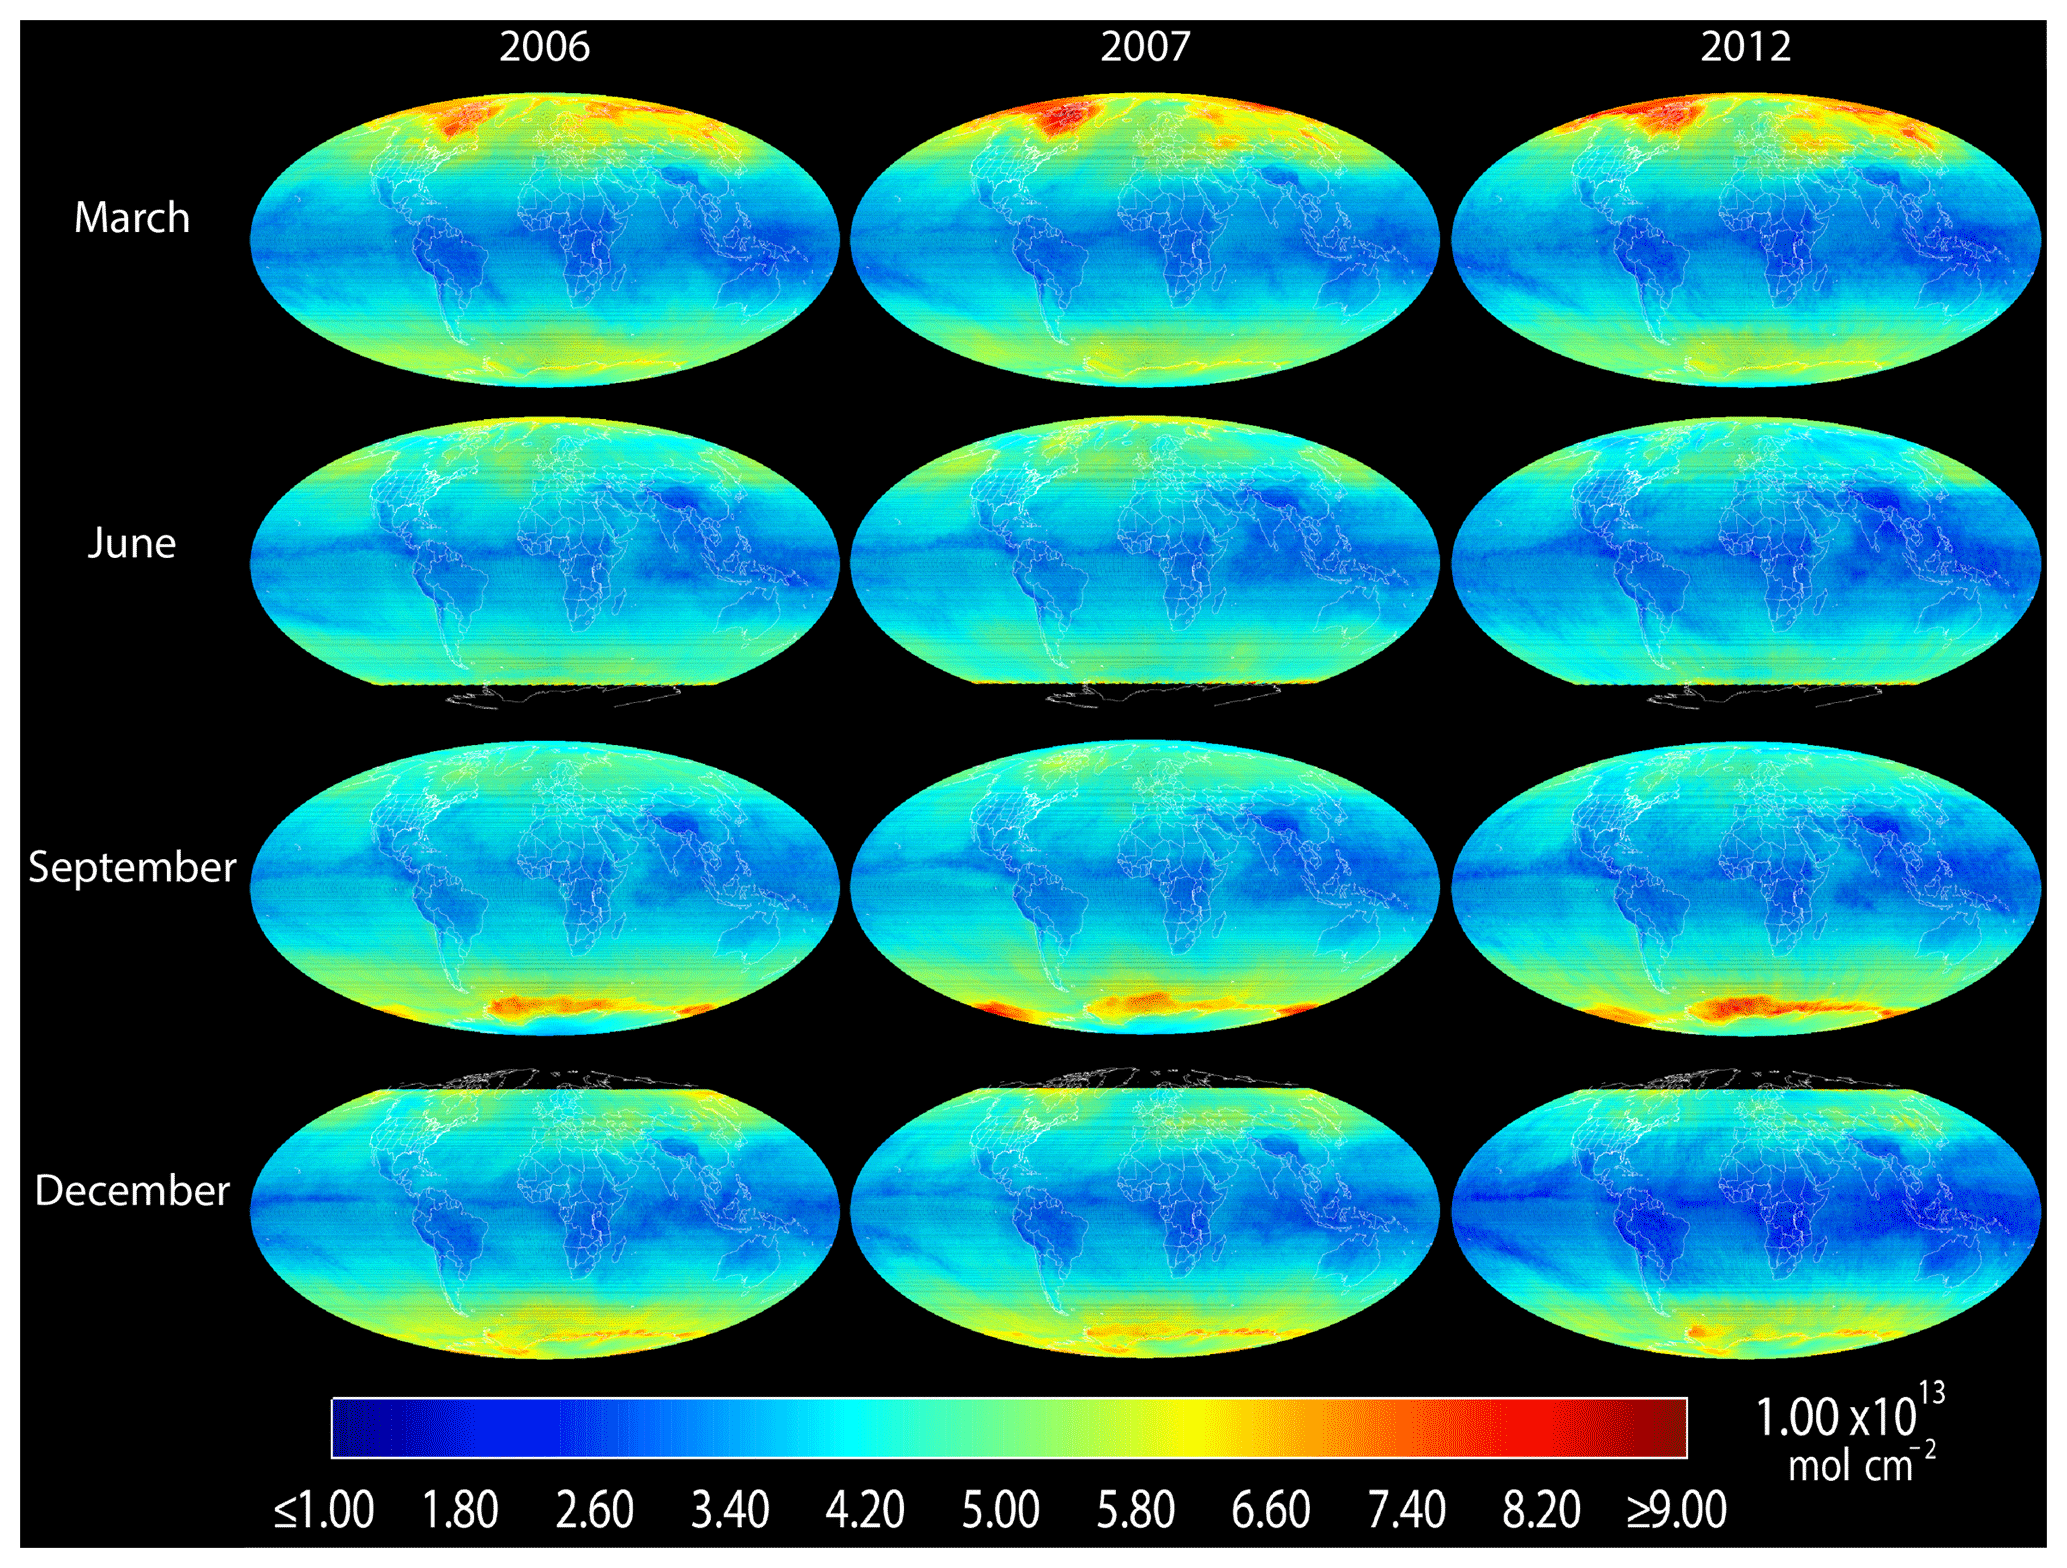
Figure 10Global distributions of monthly mean BrO VCDs in March, June, September and December (in different rows) of 2006, 2007 and 2012 (different columns). Bromine release “explosions” during the polar spring months can be seen clearly.
4.3 Salt lakes and volcanic plumes enhancements of BrO
Following recent work by Hörmann et al. (2016) over the Rann of Kutch using OMI BrO retrievals from an independent research product, we have explored the capability of our OMBRO product to observe similar enhancements in other salt lakes. Figure 11 shows monthly averaged OMI BrO over the Great Salt Lake for June 2006, the corresponding surface albedo used in the retrieval, cloud cover (assuming a cloud filter of 40 %), and the cloud pressure. Over the Great Salt Lake, BrO enhancement occurs predominantly over the lake bed, with enhancements of ∼5–10×1012 molecules cm−2 over background values (3–4×10¹³ molecules cm−2). Despite observing these enhancements, the users of OMBRO for these kinds of studies should be aware of three limitations of the current retrieval algorithm. First, the BrO columns assume a mostly stratospheric BrO profile (Fig. 3a) for the AMF calculation. Second, the OMI-derived albedo climatology (Kleipool et al., 2008) used in OMBRO has a resolution of 0.5∘ . At this resolution OMBRO retrievals can have biases given the size of OMI pixels and the inherent sub-pixel albedo variability. Finally, high albedos inherent to salt lakes surface yield abnormally high cloud fractions and low cloud pressures over the salt lakes (Hörmann et al., 2016). All these factors should be considered in studies addressing the spatiotemporal distribution of BrO over salt lakes using OMBRO.
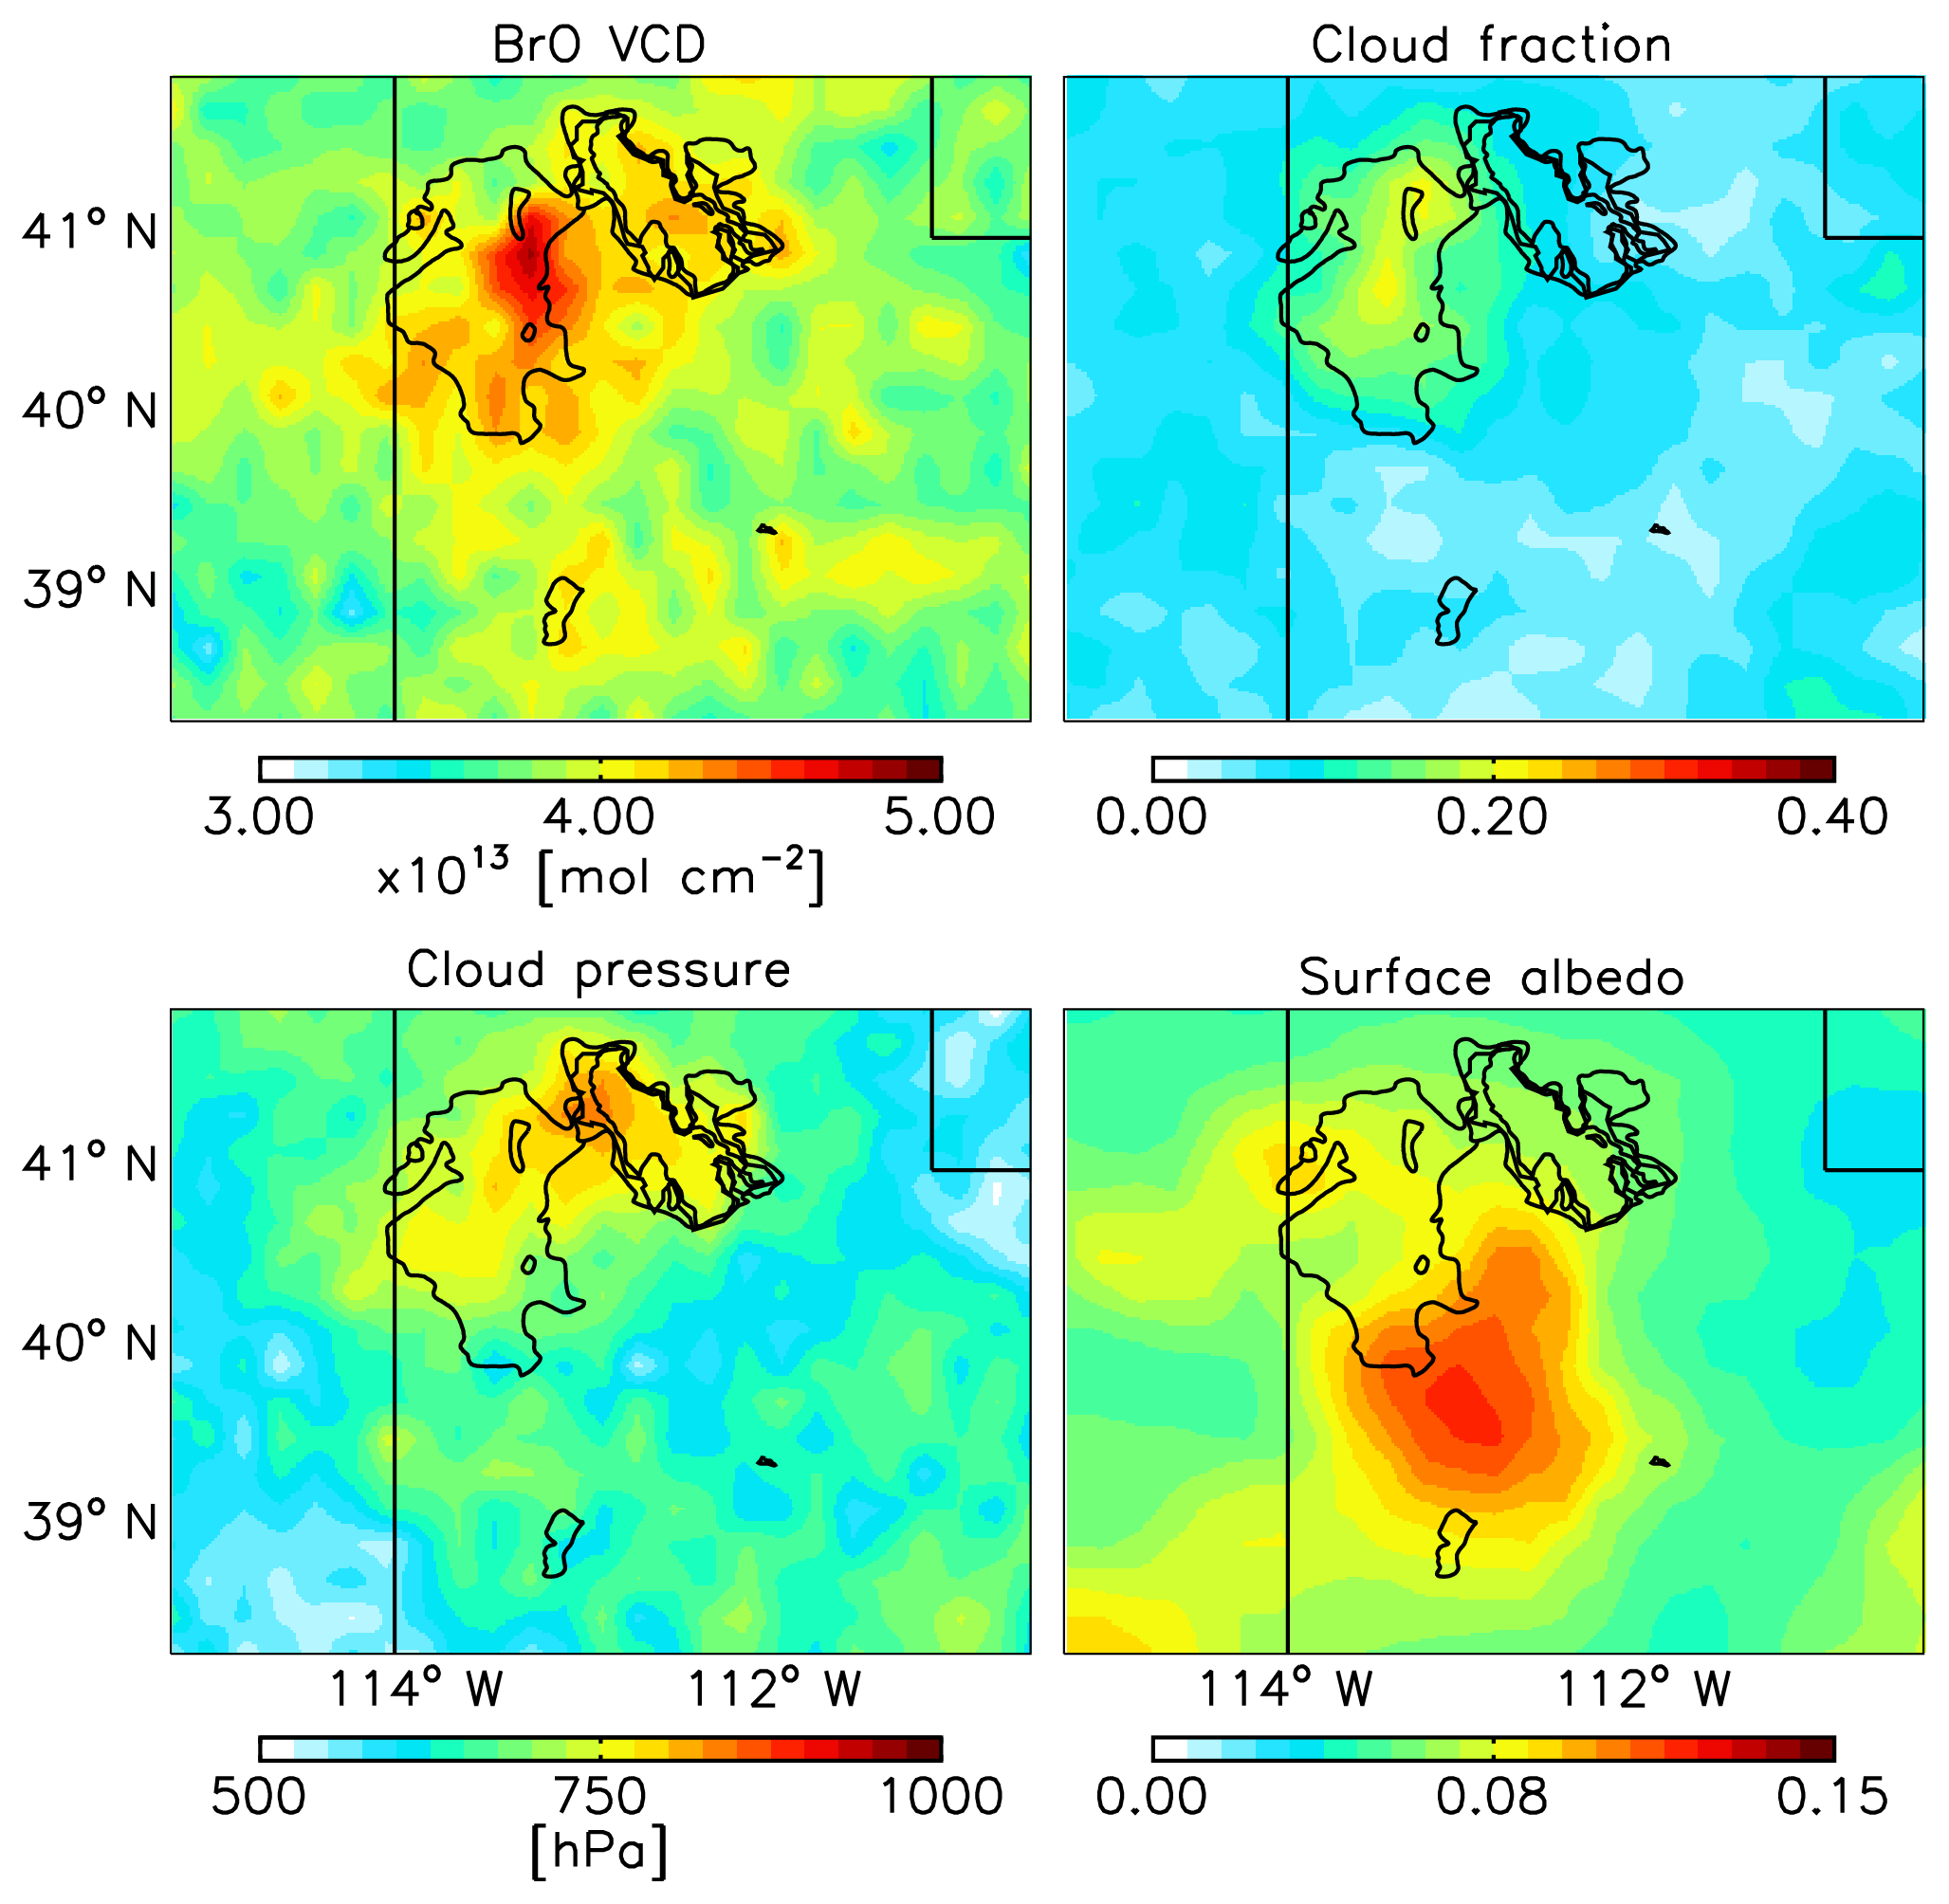
Figure 11Mean June 2006 BrO VCD over the Great Salt Lake area. Averages have been calculated on a 0.2∘ × 0.2∘ grid including only pixels with cloud fractions smaller than 0.4. The straight lines are borders of the state of Utah, and the curving lines represent the Great Salt Lake (eastern oval area) and Salt Flats (western oval area).
During our analysis of volcanic eruption scenarios, it was discovered that the currently implemented SO2 molecular absorption cross sections (Vandaele et al., 1994) are a sub-optimum choice (see Fig. 12). Compared to more recent laboratory measurements (Hermans et al., 2009; Vandaele et al., 2009), the original SO2 cross sections implemented in OMBRO do not extend over the full BrO fitting window and exhibit the wrong behavior longward of 324 nm, overestimating the most recent measurement by up to a factor of 3. As the correlation between BrO and both SO2 cross sections is very small (−0.03 for the current SO2 and 0.11 for the latest SO2 cross sections) over the spectral range of SO2 cross sections, interference by SO2 in BrO retrievals is usually not an issue at average atmospheric SO2 concentrations, but strong volcanic eruptions will render even small SO2 absorption features past 333 nm significant. Around 334 nm, the Vandaele et al. (2009) data show an SO2 feature that correlates with BrO absorption when SO2 concentrations are significantly enhanced. As a consequence of this spectral correlation, SO2 may be partially aliased as BrO, since the implemented SO2 cross sections cannot account for it. Figure 13 presents an example from the 2010 Eyjafjallajökull eruption to show that the BrO retrieval can be affected by the choice of SO2 cross sections. The next version of the OMBRO public release will be produced using the updated SO2 absorption cross sections. Until then, caution is advised when using the OMI BrO product during elevated SO2 conditions. We recommend using the OMBRO product together with the operational OMI SO2 product (Li et al., 2013) to flag abnormally high BrO retrievals.
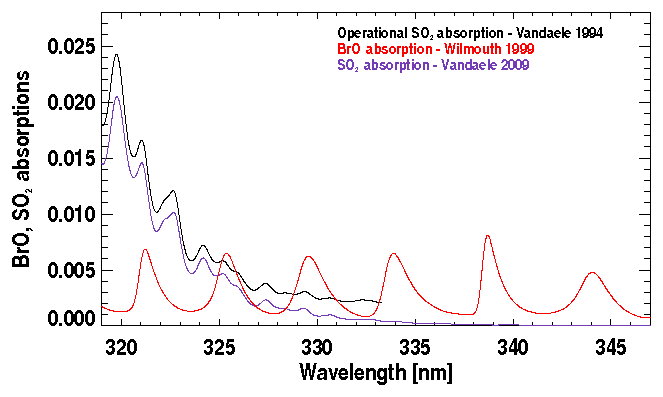
Figure 12Comparison of BrO absorption (red) and SO2 absorptions under volcanic scenarios based on cross sections used in the operational algorithm (Vandaele et al., 1994) as shown in black and the recent laboratory cross sections (Vandaele et al., 2009) as shown in purple. For BrO, a SCD of 1.0×10¹⁴ molecules cm−2 is assumed; for SO2, a SCD of 15 Dobson units (i.e., 4.03×10¹⁷ molecules cm−2) is assumed. Cross sections have been convolved with the OMI slit function (which is assumed to be a Gaussian with 0.42 nm full width at half maximum).
Figure 13a and b show daily average operational BrO VCDs from the eruption of the Eyjafjallajökull volcano on 5 and 17 May 2010, respectively. Enhanced BrO values in excess of 8.0×10¹³ molecules cm−2 are detected in the vicinity of this volcano (e.g., plume extending southeastward from the volcano on 5 May and high BrO over Iceland on 17 May). Some of these enhanced BrO values correspond to the locations of enhanced SO2 as shown on the NASA global SO2 monitoring website (https://so2.gsfc.nasa.gov/, last access: 7 October 2017). This enhancement of BrO is not related to the seasonal variation of BrO as no such BrO enhancement is detected over Eyjafjallajökull during 5–17 May 2011 (a year after the eruption), with BrO values of only up to molecules cm−2 (not shown). Figure 13c and d show the same BrO retrievals using SO2 cross sections by Vandaele et al. (2009). Using the improved SO2 cross sections increases the BrO over a broader area on both days, supporting the theory that the choice of SO2 cross sections can affect the BrO retrievals. However, BrO enhancement around the volcano can still clearly be seen with the improved SO2 cross sections. This suggests that this BrO enhancement is not totally due to aliasing of SO2 as BrO but potentially real BrO from the volcanic eruption.
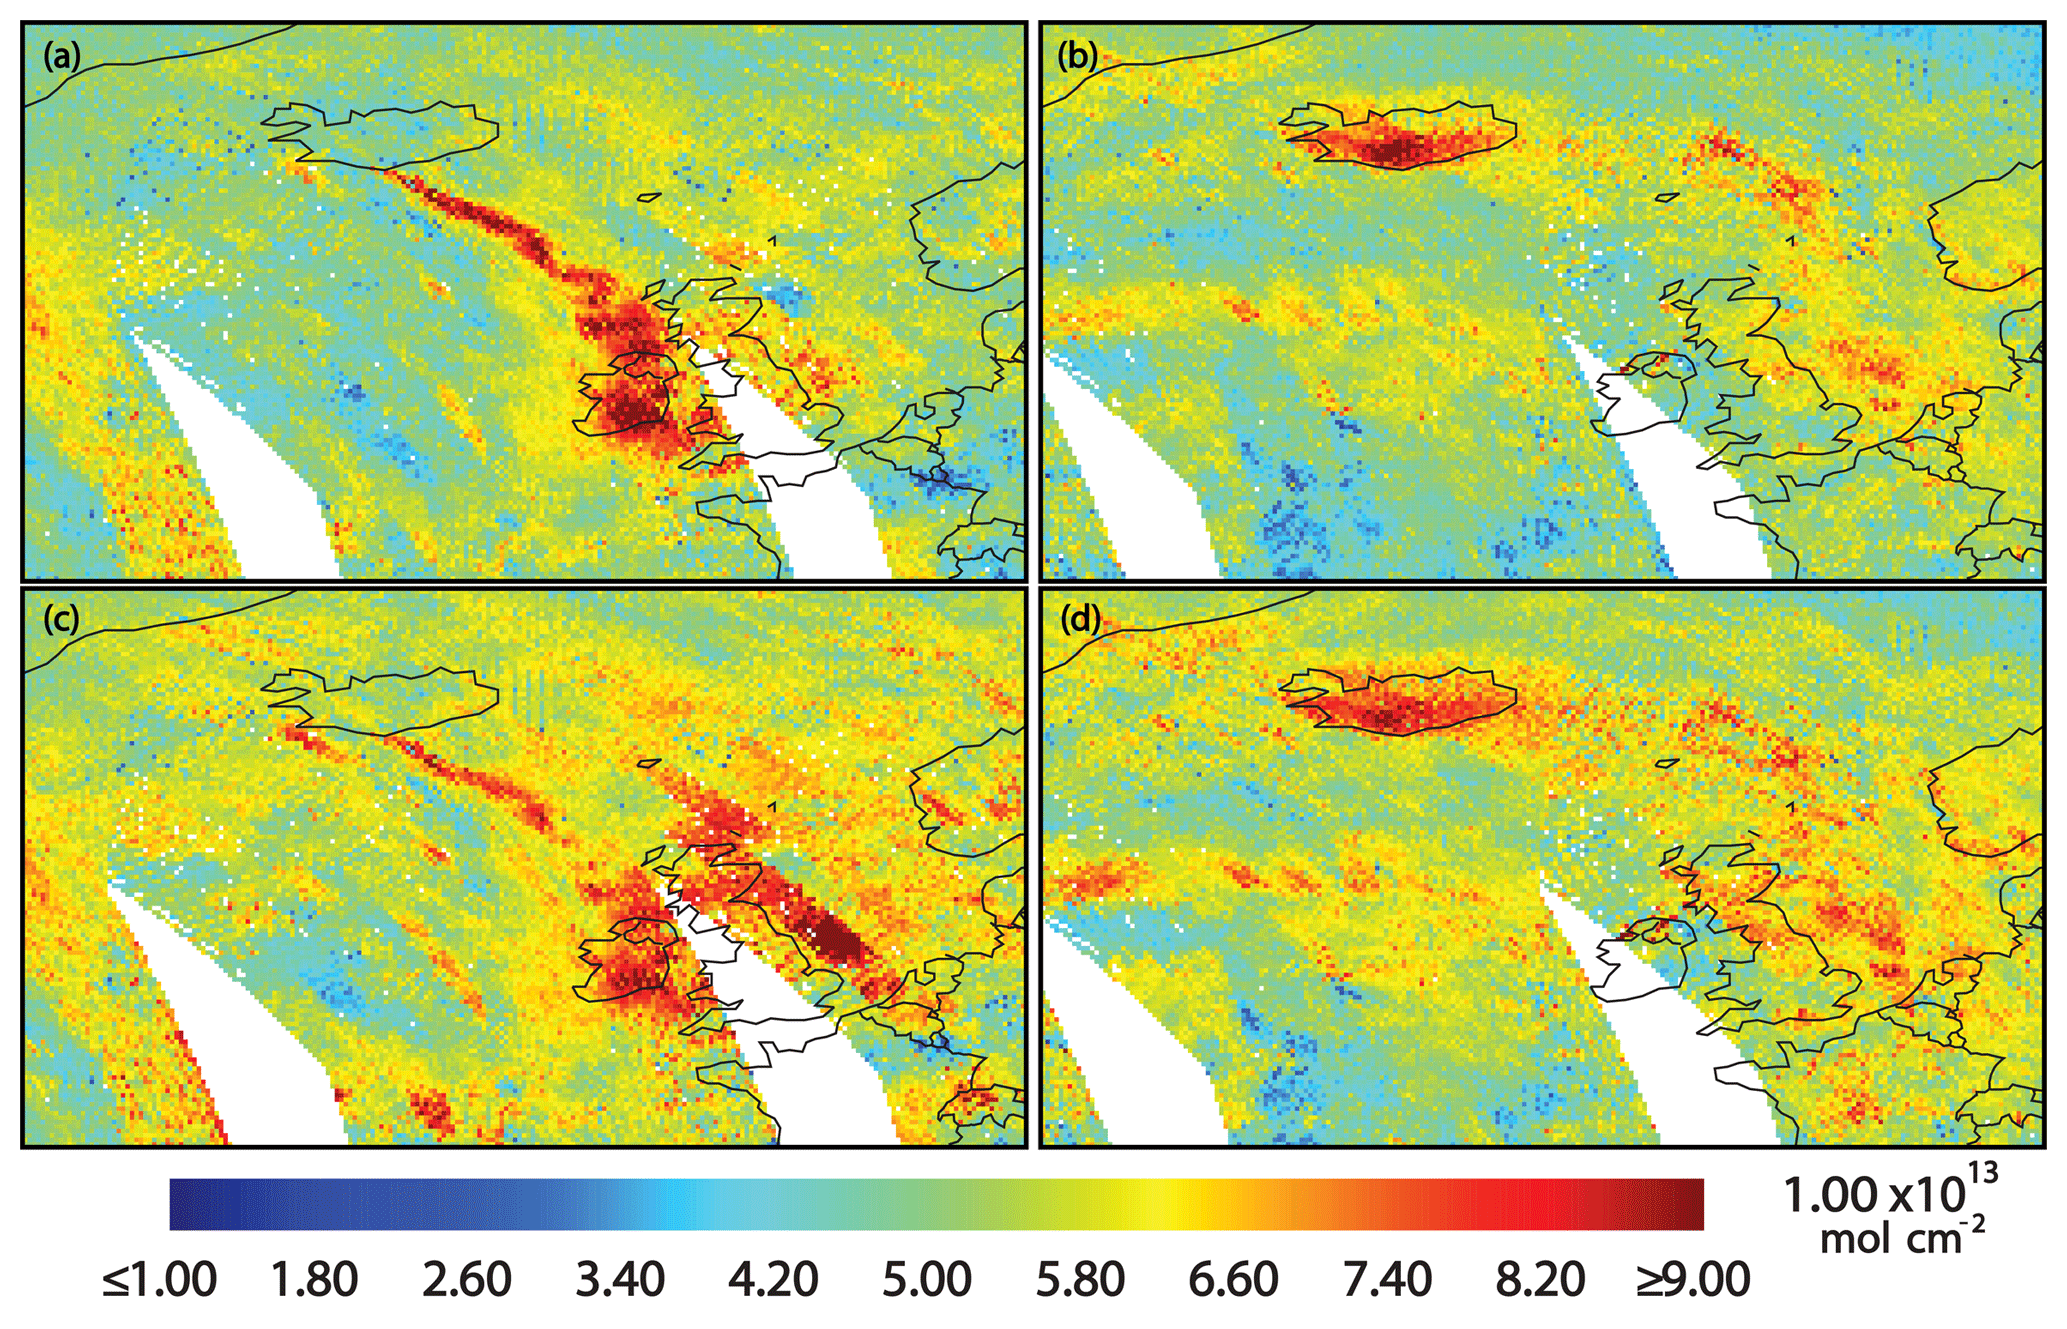
Figure 13Daily average BrO VCDs from Eyjafjallajökull on 5 May 2010 (a) and 17 May 2010 (b) produced using the operational SO2 cross sections for the same days (c) and using the Vandaele et al. (2009) SO2 cross sections (d).
This paper describes the current operational OMI BrO retrieval algorithm developed at SAO and the corresponding V3 OMI total BrO (OMBRO) product in detail. The OMI BrO retrieval algorithm is based on nonlinear least squares direct fitting of radiance spectra in the spectral range 319.0–347.5 nm to obtain vertical column densities (VCDs) directly in one step. Compared to previous versions of two-step algorithms, the fitting window was moved to shorter wavelengths, and the spectral range was increased to reduce the fitting uncertainty. Because air mass factors (AMFs) vary significantly with wavelength as a result of significant variation of O3 absorption, the wavelength- and surface-albedo-dependent AMF, which is precomputed with the Linearized Discrete Ordinate Radiative Transfer (LIDORT) code using a single mostly stratospheric BrO profile, is applied prior to fitting to BrO cross sections for direct fitting of VCDs. Prior to the spectral fitting of BrO, wavelength calibration is performed for both irradiance and radiance at each cross-track position ,and reference spectra are properly prepared at the radiance wavelength grid. Then radiances are modeled from the measured solar irradiance, accounting for rotational Raman scattering, undersampling and attenuation from BrO and interfering gases and including additive and multiplicative closure polynomials and the average fitting residual spectrum. To maintain consistency with previous versions, a second fitting of all OMI spectra is performed with unmodified BrO cross sections to derive SCDs and the effective AMFs. Then a destriping step is employed to reduce the cross-track-dependent stripes.
The uncertainties of BrO VCDs included in the data product include only spectral fitting uncertainties, which typically vary between 4 and 7×10¹² molecules cm−2 (10 %–20 % of BrO VCDs; this could be as low as 5 % over BrO hotspots), consistent throughout the data record. The uncertainties vary with cross-track positions, from at nadir positions to at edge positions. We have investigated additional fitting uncertainties caused by interferences from O2-O2, H2CO, O3, and SO2, the impact of the choice of fitting window, the use of common mode, the orders of closure polynomials and instrument slit functions. Uncertainties in the AMF calculations are estimated at ∼10 % unless the observation is made over a region with high tropospheric BrO columns. In this case, the use of a single stratospheric BrO profile is another source of uncertainty, overestimating AMFs (up to 50 %) and therefore underestimating BrO VCDs.
We compared OMI BrO VCDs with BIRA/GOME-2 BrO observations at locations of simultaneous nadir overpasses (SNOs), which only occur around 75∘ N and 75∘ S. OMI BrO shows excellent agreement with GOME-2 BrO, with a correlation of 0.74 and a mean bias of molecules cm−2 (mean relative bias of %). Monthly mean OMBRO VCDs during 2007–2009 show negative biases of 0.25–0.35×10¹³ molecules cm−2 (10 %–17 %) over Alaska, the South Pacific, Hudson Bay and Greenland, respectively. We also compared OMI BrO with ground-based zenith-sky measurements of total BrO at Harestua, Norway. The BrO seasonality in Harestua is well captured by the OMI BrO and OMBRO retrieval, showing a reasonable good agreement with the ground-based measurements. The correlation between both datasets is 0.46, and the mean bias is molecules cm−2 (mean relative bias of 3.18±16.30 %).
The global distribution and seasonal variation of OMBRO are generally consistent with previous satellite measurements. There are small values in the tropics with little seasonality and large values at high latitudes with distinct seasonality. The seasonality is different between the Northern and Southern Hemisphere, with larger values in the hemispheric winter–spring (spring–summer) and smaller values in summer–fall (winter) for the Northern (Southern) Hemisphere. This spatiotemporal variation is generally consistent from year to year and is hardly affected by the row anomaly but does show some interannual variation. Finally, we have explored the feasibility of detecting enhanced BrO column over salt lakes and in volcanic plumes using OMBRO retrievals. We found enhancement of the BrO with respect to the background levels of 5–10×1012 molecules cm−2 over the US Great Salt Lake. We also observed a significant enhancement from the eruption of Eyjafjallajökull volcano although BrO retrievals under high SO2 conditions can be affected by the current use of a sub-optimal choice of SO2 cross sections.
Several important retrieval issues in the current operational algorithm that affect the quantitative use BrO VCDs have been raised in this paper such as the exclusion of O2-O2, nonoptimal SO2 cross sections, the neglect of the radiative effect of O3 absorption and the assumption of the stratospheric-only BrO profile. Users are advised to pay attention to these issues so that the product can be used properly. Future versions of OMBRO will include updated SO2 and O2-O2 cross sections, corrections for the radiative transfer effect of the O3 absorption, and reoptimization of the spectral fitting windows to mitigate the interferences of other trace gases. We will also improve the AMF calculation accounting for clouds and O3 and will consider the use of model-based climatological BrO profiles. These updates will increase the capabilities of the OMBRO retrieval to quantitatively estimate enhancements over salt lakes and in volcanic plumes.
SAO OMI BrO retrievals were performed using radiance data publicly accessible at https://doi.org/10.5067/Aura/OMI/DATA1002 (Dobber, 2007). SAO OMBRO data are publicly available at https://doi.org/10.5067/Aura/OMI/DATA2006 (Chance, 2007).
The authors declare that they have no conflict of interest.
This study is supported by the NASA Atmospheric Composition Program/Aura Science Team (NNX11AE58G) and the Smithsonian Institution. Part of the research was carried out at the Jet Propulsion Laboratory, California Institute of Technology, under a contract with NASA. The Dutch–Finnish OMI instrument is part of the NASA EOS Aura satellite payload. The OMI project is managed by NIVR and KNMI in the Netherlands. We acknowledge the OMI International Science Team for providing the SAO OMBRO data product used in this study.
This paper was edited by William R. Simpson and reviewed by Johannes Lampel and three anonymous referees.
Abbatt, J. P. D., Thomas, J. L., Abrahamsson, K., Boxe, C., Granfors, A., Jones, A. E., King, M. D., Saiz-Lopez, A., Shepson, P. B., Sodeau, J., Toohey, D. W., Toubin, C., von Glasow, R., Wren, S. N., and Yang, X.: Halogen activation via interactions with environmental ice and snow in the polar lower troposphere and other regions, Atmos. Chem. Phys., 12, 6237–6271, https://doi.org/10.5194/acp-12-6237-2012, 2012.
Acarreta, J. R., De Haan, J. F., and Stammes, P.: Cloud pressure retrieval using the O2-O2 absorption band at 477 nm, J. Geophys. Res.-Atmos., 109, D05204, https://doi.org/10.1029/2003JD003915, 2004.
Aliwell, S. R., Van Roozendael, M., Johnston, P. V., Richter, A., Wagner, T., Arlander, D. W., Burrows, J. P., Fish, D. J., Jones, R. L., Tornkvist, K. K., Lambert, J.-C., Pfeilsticker, K., and Pundt, I.: Analysis for BrO in zenith-sky spectra: An intercomparison exercise for analysis improvement, J. Geophys. Res., 107, 4199, https://doi.org/10.1029/2001JD000329, 2002.
Begoin, M., Richter, A., Weber, M., Kaleschke, L., Tian-Kunze, X., Stohl, A., Theys, N., and Burrows, J. P.: Satellite observations of long range transport of a large BrO plume in the Arctic, Atmos. Chem. Phys., 10, 6515–6526, https://doi.org/10.5194/acp-10-6515-2010, 2010.
Blechschmidt, A.-M., Richter, A., Burrows, J. P., Kaleschke, L., Strong, K., Theys, N., Weber, M., Zhao, X., and Zien, A.: An exemplary case of a bromine explosion event linked to cyclone development in the Arctic, Atmos. Chem. Phys., 16, 1773–1788, https://doi.org/10.5194/acp-16-1773-2016, 2016.
Bobrowski, N., Hönninger, G., Galle, B. and Platt, U.: Detection of bromine monoxide in a volcanic plume, Nature, 423, 273–276, 2003.
Bobrowski, N., von Glasow, R., Aiuppa, A., Inguaggiato, S., Louban, I., Ibrahim, O. W., and Platt, U.: Reactive halogen chemistry in volcanic plumes, J. Geophys. Res. Atmos., 112, D06311, https://doi.org/10.1029/2006JD007206, 2007.
Bobrowski, N., von Glasow, R., Giuffrida, G. B., Tedesco, D., Aiuppa, A., Yalire, M., Arellano, S., Johansson, M., and Galle, B.: Gas emission strength and evolution of the molar ratio of BrO∕SO2 in the plume of Nyiragongo in comparison to Etna, J. Geophys. Res.-Atmos., 120, 277–291, https://doi.org/10.1002/2013JD021069, 2015.
Bracher, A., Lamsal, L. N., Weber, M., Bramstedt, K., Coldewey-Egbers, M., and Burrows, J. P.: Global satellite validation of SCIAMACHY O3 columns with GOME WFDOAS, Atmos. Chem. Phys., 5, 2357–2368, https://doi.org/10.5194/acp-5-2357-2005, 2005.
Buchwitz, M., Rozanov, V. V., and Burrows, J. P.: A near-infrared optimized DOAS method for the fast global retrieval of atmospheric CH4, CO, CO2, H2O, and N2O total column amounts from SCIAMACHY Envisat-1 nadir radiances, J. Geophys. Res., D105, 15231–15245, 2000.
Burd, J. A., Peterson, P. K., Nghiem, S. V., Perovich, D. K., and Simpson, W. R.: Snowmelt onset hinders bromine monoxide heterogeneous recycling in the Arctic, J. Geophys. Res.-Atmos., 122, 8297–8309, 2017.
Burrows, J. P. and Chance, K. V.: Scanning Imaging Absorption Spectrometer for Atmospheric ChartographY, Proc. SPIE, Future European and Japanese Remote Sensing Sensors and Programs, 1490 146–154, 1991.
Caspar, C. and Chance, K.: GOME wavelength calibration using solar and atmospheric spectra, in: Third ERS Symposium on Space at the service of our Environment, edited by: Guyenne, T.-D. and Danesy, D., ESA Special Publication, 414, 609, 1997.
Chance, K.: Analysis of BrO measurements from the Global Ozone Monitoring Experiment, Geophys. Res. Lett., 25, 3335–3338, 1998.
Chance, K.: Spectroscopic Measurements of Tropospheric Composition from Satellite Measurements in the Ultraviolet and Visible: Steps Toward Continuous Pollution Monitoring from Space, in: Remote Sensing of the Atmosphere for Environmental Security, edited by: Perrin, A., Ben Sari-Zizi, N., and Demaison, J., NATO Security through Science Series, ISBN 1-4020-5089-5, Springer, the Netherlands, pp. 1–25, 2006.
Chance, K.: OMI/Aura Bromine Monoxide (BrO) Total Column 1-orbit L2 Swath 13x24 km V003, Greenbelt, MD, USA, Goddard Earth Sciences Data and Information Services Center (GES DISC), last access: 20 November 2017, https://doi.org/10.5067/Aura/OMI/DATA2006, 2007.
Chance, K. and Kurucz, R.: An improved high-resolution solar reference spectrum for earth's atmosphere measurements in the ultraviolet, visible, and near infrared, J. Quant. Spectrosc. Ra., 111, 1289–1295, https://doi.org/10.1016/j.jqsrt.2010.01.036, 2010.
Chance, K. and Orphal, J.: Revised ultraviolet absorption cross sections of H2CO for the HITRAN database, J. Quant. Spectrosc. Ra., 112, 1509–1510, https://doi.org/10.1016/j.jqsrt.2011.02.002, 2011.
Chance, K., Palmer, P. I., Spurr, R. J. D., Martin, R. V., Kurosu, T. P., and Jacob, D. J.: Satellite observations of formaldehyde over North America from GOME, Geophys. Res. Lett., 27, 3461–3464, https://doi.org/10.1029/2000GL011857, 2000.
Chance, K., Kurosu, T. P., and Sioris, C. E.: Undersampling correction for array-detector based satellite spectrometers, Appl. Optics, 44, 1296–1304, 2005.
Chance, K. V. and Spurr, R. J. D.: Ring effect studies: Rayleigh scattering, including molecular parameters for rotational Raman scattering, and the Fraunhofer spectrum, Appl. Optics, 36, 5224–5230, https://doi.org/10.1364/AO.36.005224, 1997.
Chance, K. V., Burrows, J. P., and Schneider, W.: Retrieval and molecule sensitivity studies for the Global Ozone Monitoring Experiment and the SCanning Imaging Absorption spectroMeter for Atmospheric CHartographY, Proc. SPIE, Remote Sensing of Atmospheric Chemistry, 1491, 151–165, 1991.
Chan Miller, C., Gonzalez Abad, G., Wang, H., Liu, X., Kurosu, T., Jacob, D. J., and Chance, K.: Glyoxal retrieval from the Ozone Monitoring Instrument, Atmos. Meas. Tech., 7, 3891–3907, https://doi.org/10.5194/amt-7-3891-2014, 2014.
Chan Miller, C., Jacob, D. J., González Abad, G., and Chance, K.: Hotspot of glyoxal over the Pearl River delta seen from the OMI satellite instrument: implications for emissions of aromatic hydrocarbons, Atmos. Chem. Phys., 16, 4631–4639, https://doi.org/10.5194/acp-16-4631-2016, 2016.
Choi, S., Wang, Y., Salawitch, R. J., Canty, T., Joiner, J., Zeng, T., Kurosu, T. P., Chance, K., Richter, A., Huey, L. G., Liao, J., Neuman, J. A., Nowak, J. B., Dibb, J. E., Weinheimer, A. J., Diskin, G., Ryerson, T. B., da Silva, A., Curry, J., Kinnison, D., Tilmes, S., and Levelt, P. F.: Analysis of satellite-derived Arctic tropospheric BrO columns in conjunction with aircraft measurements during ARCTAS and ARCPAC, Atmos. Chem. Phys., 12, 1255–1285, https://doi.org/10.5194/acp-12-1255-2012, 2012.
Coldewey-Egbers, M., Weber, M., Lamsal, L. N., de Beek, R., Buchwitz, M., and Burrows, J. P.: Total ozone retrieval from GOME UV spectral data using the weighting function DOAS approach, Atmos. Chem. Phys., 5, 1015–1025, https://doi.org/10.5194/acp-5-1015-2005, 2005.
De Smedt, I., Stavrakou, T., Hendrick, F., Danckaert, T., Vlemmix, T., Pinardi, G., Theys, N., Lerot, C., Gielen, C., Vigouroux, C., Hermans, C., Fayt, C., Veefkind, P., Müller, J.-F., and Van Roozendael, M.: Diurnal, seasonal and long-term variations of global formaldehyde columns inferred from combined OMI and GOME-2 observations, Atmos. Chem. Phys., 15, 12519–12545, https://doi.org/10.5194/acp-15-12519-2015, 2015.
Dirksen, R., Dobber, M., Voors, R., and Levelt, P.: Prelaunch characterization of the Ozone Monitoring Instrument transfer function in the spectral domain, Appl. Optics, 45, 3972–3981, 2006.
Dobber, M.: OMI/Aura Level 1B UV Global Geolocated Earthshine Radiances 1-orbit L2 Swath 13×24 km V003, Greenbelt, MD, USA, Goddard Earth Sciences Data and Information Services Center (GES DISC), last access: 31 March 2017, https://doi.org/10.5067/Aura/OMI/DATA1002, 2007.
Fleischmann, O. C., Hartmann, M., Burrows, J. P., and Orphal, J.: New ultraviolet absorption cross sections of BrO at atmospheric temperatures measured by time-windowing Fourier transform spectroscopy, J. Photochem. Photobiol. A., 168, 117–132, https://doi.org/10.1016/j.jphotochem.2004.03.026, 2004.
Frieß, U., Sihler, H., Sander, R., PöHler, D., Yilmaz, S., and Platt, U.: The vertical distribution of BrO and aerosols in the Arctic: Measurements by active and passive differential optical absorption spectroscopy, J. Geophys. Res., 116, D00R04, https://doi.org/10.1029/2011JD015938, 2011.
González Abad, G., Liu, X., Chance, K., Wang, H., Kurosu, T. P., and Suleiman, R.: Updated Smithsonian Astrophysical Observatory Ozone Monitoring Instrument (SAO OMI) formaldehyde retrieval, Atmos. Meas. Tech., 8, 19–32, https://doi.org/10.5194/amt-8-19-2015, 2015.
Greenblatt, G. D., Orlando, J. J., Burkholder, J. B., and Ravishankara, A. R.: Absorption measurements of oxygen between 330 and 1140 nm, J. Geophys. Res., 95, 18577–18582, 1990.
Hausmann, M. and Platt, U.: Spectroscopic measurement of bromine oxide and ozone in the high Arctic during Polar Sunrise Experiment 1992, J. Geophys. Res., D12, 25399–25413, 1994.
Hebestreit, K., Stutz, J., Rosen, D., Matveiv, V., Peleg, M., Luria, M., and Platt, U.: DOAS Measurements of Tropospheric Bromine Oxide in Mid-Latitudes, Science, 283, 5398, https://doi.org/10.1126/science.283.5398.55, 1999.
Hegels, E., Crutzen, P. J., Klüpfel, T., Perner, D., and Burrows, J. P.: Global distribution of atmospheric bromine-monoxide from GOME on earth observing satellite ERS-2, Geophys. Res. Lett., 25, L3127, https://doi.org/10.1029/98GL02417, 1998.
Hendrick, F., Van Roozendael, M., Chipperfield, M. P., Dorf, M., Goutail, F., Yang, X., Fayt, C., Hermans, C., Pfeilsticker, K., Pommereau, J.-P., Pyle, J. A., Theys, N., and De Mazière, M.: Retrieval of stratospheric and tropospheric BrO profiles and columns using ground-based zenith-sky DOAS observations at Harestua, 60∘ N, Atmos. Chem. Phys., 7, 4869–4885, https://doi.org/10.5194/acp-7-4869-2007, 2007.
Hendrick, F., Rozanov, A., Johnston, P. V., Bovensmann, H., De Mazière, M., Fayt, C., Hermans, C., Kreher, K., Lotz, W., Sinnhuber, B.-M., Theys, N., Thomas, A., Burrows, J. P., and Van Roozendael, M.: Multi-year comparison of stratospheric BrO vertical profiles retrieved from SCIAMACHY limb and ground-based UV-visible measurements, Atmos. Meas. Tech., 2, 273–285, https://doi.org/10.5194/amt-2-273-2009, 2009.
Hermans, C., Vandaele, A. C., Carleer, M., Fally, S., Colin, R., Jenouvrier, A., Coquart, B., and Mérienne, M.-F.: Absorption cross-sections of atmospheric constituents: NO2, O2, and H2O, Environ. Sci. Pollut. Res., 6, 151–158, 1999.
Hermans, C., Vandaele, A. C., and Fally, S.: Fourier transform measurements of SO2 absorption cross sections: I. Temperature dependence in the 24 000–29 000 cm−1 (345–420 nm) region, J. Quant. Spectrosc. Ra., 110, 756–765, 2009.
Holla, R., Schmitt, S., Frieß, U., Pöhler, D., Zingler, J., Corsmeier, U., and Platt, U.: Vertical distribution of BrO in the boundary layer at the Dead Sea, Environ. Chem., 12, 438–460, https://doi.org/10.1071/EN14224, 2015.
Hollwedel, J., Wenig, M., Beirle, S., Kraus, S., Kühl, S., Wilms-Grabe, W., Platt, U., and Wagner, T.: Year-to-year variations of spring time polar tropospheric BrO as seen by GOME, Adv. Space Res., 34, 804–808, 2004.
Hörmann, C., Sihler, H., Bobrowski, N., Beirle, S., Penning de Vries, M., Platt, U., and Wagner, T.: Systematic investigation of bromine monoxide in volcanic plumes from space by using the GOME-2 instrument, Atmos. Chem. Phys., 13, 4749–4781, https://doi.org/10.5194/acp-13-4749-2013, 2013.
Hörmann, C., Sihler, H., Beirle, S., Penning de Vries, M., Platt, U., and Wagner, T.: Seasonal variation of tropospheric bromine monoxide over the Rann of Kutch salt marsh seen from space, Atmos. Chem. Phys., 16, 13015–13034, https://doi.org/10.5194/acp-16-13015-2016, 2016.
Huang, G., Liu, X., Chance, K., Yang, K., Bhartia, P. K., Cai, Z., Allaart, M., Ancellet, G., Calpini, B., Coetzee, G. J. R., Cuevas-Agulló, E., Cupeiro, M., De Backer, H., Dubey, M. K., Fuelberg, H. E., Fujiwara, M., Godin-Beekmann, S., Hall, T. J., Johnson, B., Joseph, E., Kivi, R., Kois, B., Komala, N., König-Langlo, G., Laneve, G., Leblanc, T., Marchand, M., Minschwaner, K. R., Morris, G., Newchurch, M. J., Ogino, S.-Y., Ohkawara, N., Piters, A. J. M., Posny, F., Querel, R., Scheele, R., Schmidlin, F. J., Schnell, R. C., Schrems, O., Selkirk, H., Shiotani, M., Skrivánková, P., Stübi, R., Taha, G., Tarasick, D. W., Thompson, A. M., Thouret, V., Tully, M. B., Van Malderen, R., Vömel, H., von der Gathen, P., Witte, J. C., and Yela, M.: Validation of 10-year SAO OMI Ozone Profile (PROFOZ) product using ozonesonde observations, Atmos. Meas. Tech., 10, 2455–2475, https://doi.org/10.5194/amt-10-2455-2017, 2017.
Huang, G., Liu, X., Chance, K., Yang, K., and Cai, Z.: Validation of 10-year SAO OMI ozone profile (PROFOZ) product using Aura MLS measurements, Atmos. Meas. Tech., 11, 17–32, https://doi.org/10.5194/amt-11-17-2018, 2018.
Kleipool, Q. L., Dobber, M. R., de Haan, J. F., and Levelt, P. F.: Earth surface reflectance climatology from 3 years of OMI data, J. Geophys. Res., 113, D18308, https://doi.org/10.1029/2008JD010290, 2008.
Kromminga, H., Voigt, S., Orphal, J., and Burrows, J. P.: The temperature dependence (213–293 K) of the absorption cross-sections of OClO in the 340–450 nm region measured by Fourier-transform spectroscopy, J. Photochem. Photobiol. A, 157, 149–160, 2003.
Kroon, M., de Haan, J. F., Veefkind, J. P., Froidevaux, L., Wang, R., Kivi, R., and Hakkarainen, J. J.: Validation of operational ozone profiles from the Ozone Monitoring Instrument, J. Geophys. Res., 116, D18305, https://doi.org/10.1029/2010JD015100, 2011.
Kühl, S., Pukite, J., Deutschmann, T., Platt, U., and Wagner, T.: SCIAMACHY limb measurements of NO2, BrO and OClO. Retrieval of vertical profiles: algorithm, first results, sensitivity and comparison studies, Adv. Space Res., 42, 1747–1764, 2008.
Kurosu, T. P., Chance, K., and Sioris, C. E.: Preliminary results for HCHO and BrO from the EOS-Aura Ozone Monitoring Instrument, in: Proc. SPIE 5652, Passive Optical Remote Sensing of the Atmosphere and Clouds IV, 5652, 116–123, https://doi.org/10.1117/12.578606, 2004.
Lampel, J., Zielcke, J., Schmitt, S., Pöhler, D., Frieß, U., Platt, U., and Wagner, T.: Detection of O4 absorption around 328 and 419 nm in measured atmospheric absorption spectra, Atmos. Chem. Phys., 18, 1671–1683, https://doi.org/10.5194/acp-18-1671-2018, 2018.
Lee, C., Richter, A., Weber, M., and Burrows, J. P.: SO2 Retrieval from SCIAMACHY using the Weighting Function DOAS (WFDOAS) technique: comparison with Standard DOAS retrieval, Atmos. Chem. Phys., 8, 6137–6145, https://doi.org/10.5194/acp-8-6137-2008, 2008.
Levelt, P. F., van den Oord, G. H. J., Dobber, M. R., Mälkki, A., Visser, H., de Vries, J., Stammes, P., Lundell, J., and Saari, H.: The Ozone Monitoring Instrument, IEEE T. Geosci. Remote, 44, 1093–1101, https://doi.org/10.1109/TGRS.2006.872333, 2006.
Li, C., Joiner, J., Krotkov, N. A., and Bhartia, P. K.: A fast and sensitive new satellite SO2 retrieval algorithm based on principal component analysis: Application to the ozone monitoring instrument, Geophys. Res. Lett., 40, 6314–6318, https://doi.org/10.1002/2013GL058134, 2013.
Liao, J., Sihler, H., Huey, L. G., Neuman, J. A., Tanner, D. J., Friess, U., Platt, U., Flocke, F. M., Orlando, J. J., Shepson, P. B., Beine, H. J., Weinheimer, A. J., Sjostedt, S. J., Nowak, J. B., Knapp, D. J., Staebler, R. M., Zheng, W., Sander, R., Hall, S. R., and Ullmann, K.: A comparison of Arctic BrO measurements by chemical ionization mass spectrometry and long path-differential optical absorption spectroscopy, J. Geophys. Res.-Atmos., 116, D00r02, https://doi.org/10.1029/2010jd014788, 2011.
Liao, J., Huey, L. G., Tanner, D. J., Flocke, F. M., Orlando, J. J., Neuman, J. A., Nowak, J. B., Weinheimer, A. J., Hall, S. R., Smith, J. N., Fried, A., Staebler, R. M., Wang, Y., Koo, J.-H., Cantrell, C. A., Weibring, P., Walega, J., Knapp, D. J., Shepson, P. B., and Stephens, C. R.: Observations of inorganic bromine (HOBr, BrO, and Br2) speciation at Barrow, Alaska, in spring 2009, J. Geophys. Res.-Atmos., 117, D00R16, https://doi.org/10.1029/2011JD016641, 2012.
Lindström, P. and Wedin, P.-Å.: Gauss-Newton Based Algorithms for Constrained Nonlinear Least Squares Problems, Tech. Rep. UMINF-901.87, University of Umeå, software and report available at: http://plato.asu.edu/sub/nonlsq.html (last access: 10 July 2017), 1987.
Liu, X., Bhartia, P. K., Chance, K., Spurr, R. J. D., and Kurosu, T. P.: Ozone profile retrievals from the Ozone Monitoring Instrument, Atmos. Chem. Phys., 10, 2521–2537, https://doi.org/10.5194/acp-10-2521-2010, 2010.
Malicet, J., Daumont, D., Charbonnier, J., Parisse, C., Chakir, A., and Brion, J.: Ozone UV spectroscopy. II. Absorption cross sections and temperature dependence, J. Atmos. Chem., 21, 263–273, https://doi.org/10.1007/BF00696758, 1995.
Martin, R. V., Sioris, C. E., Chance, K., Ryerson, T. B., Bertram, T. H., Wooldridge, P. J., Cohen, R. C., Neuman, J. A., Swanson, A., and Flocke, F. M.: Evaluation of space-based constraints on global nitrogen oxide emissions with regional aircraft measurements over and downwind of eastern North America, J. Geophys. Res., 111, D15308, https://doi.org/10.1029/2005JD006680, 2006.
Matveev, V., Mordechai, P., Rosen, D., Tov-Alper, D. S., Hebestreit, K., Stutz, J., Platt, U., Blake, D., and Luria, M.: Bromine oxide-ozone interaction over the Dead Sea, J. Geophys. Res.-Atmos., 106, 10375–10387, 2001.
McLinden, C. A., Haley, C. S., and Sioris, C. E.: Diurnal effects in limb scatter observations, J. Geophys. Res., 111, D14302, https://doi.org/10.1029/2005JD006628, 2006.
OMI: Algorithm Theoretical Basis Document, Volume IV, OMI Trace Gas Algorithms, edited by: Chance, K., ATBD-OMI-04, Version 2.0, available at: http://projects.knmi.nl/omi/documents/data/OMI_ATBD_Volume_4_V2.pdf (last access: 5 December 2008), 2002.
Peterson, P. K., Simpson, W. R., and Nghiem, S. V.: Variability of bromine monoxide at Barrow, Alaska, over four halogen activation (March–May) seasons and at two on-ice locations, J. Geophys. Res.-Atmos., 121, 1381–1396, https://doi.org/10.1002/2015JD024094, 2016.
Platt, U. and Wagner, T.: Satellite mapping of enhanced BrO concentrations in the troposphere, Nature, 395, 486–490, 1998.
Puķīte, J., Kühl, S., Deutschmann, T., Platt, U., and Wagner, T.: Extending differential optical absorption spectroscopy for limb measurements in the UV, Atmos. Meas. Tech., 3, 631–653, https://doi.org/10.5194/amt-3-631-2010, 2010.
Richter, A., Wittrock, F., Eisinger, M., and Burrows, J. P.: GOME observations of tropospheric BrO in northern hemispheric spring and summer 1997, Geophys. Res. Lett., 25, 2683–2686, 1998.
Richter, A., Begoin, M., Hilboll, A., and Burrows, J. P.: An improved NO2 retrieval for the GOME-2 satellite instrument, Atmos. Meas. Tech., 4, 1147–1159, https://doi.org/10.5194/amt-4-1147-2011, 2011.
Salawitch, R. J., Weinstein, D. K., Kovalenko, L. J., Sioris, C. E., Wennberg, P. O., Chance, K., Ko, M. K. W., and McLinden, C. A.: Sensitivity of ozone to bromine in the lower stratosphere, Geophys. Res. Lett., 32, L05811, https://doi.org/10.1029/2004GL021504, 2005.
Salawitch, R. J., Canty, T., Kurosu, T., Chance, K., Liang, Q., da Silva, A., Pawson, S., Nielsen, J. E., Rodriguez, J. M., Bhartia, P. K., Liu, X. L., Huey, G., Liao, J., Stickel, R. E., Tanner, D. J., Dibb, J. E., Simpson, W. R., Donohoue, D., Weinheimer, A., Flocke, F., Knapp, D., Montzka, D., Neuman, J. A., Nowak, J. B., Ryerson, T. B., Oltmans, S., Blake, D. R., Atlas, E. L., Kinnison, D. E., Tilmes, S., Pan, L. L., Hendrick, F., Van Roozendael, M., Kreher, K., Johnston, P. V., Gao, R. S., Johnson, B., Bui, T. P., Chen, G., Pierce, R. B., Crawford, J. H., and Jacob, D. J.: A new interpretation of total column BrO during Arctic spring, Geophys. Res. Lett., 37, L21805, https://doi.org/10.1029/2010GL043798, 2010.
Schofield, R., Connor, B. J., Kreher, K., Johnston, P. V., and Rodgers, C. D.: The retrieval of profile and chemical information from groundbased UV-visible spectroscopic measurements, J. Quant. Spectrosc. Ra., 86, 115–131, 2004a.
Schofield, R., Kreher, K., Connor, B. J., Johnston, P. V., Thomas, A., Shooter, D., Chipperfield, M. P., Rodgers, C. D., and Mount, G. H.: Retrieved tropospheric and stratospheric BrO columns over Lauder, New Zealand, J. Geophys. Res., 109, D14304, https://doi.org/10.1029/2003JD004463, 2004b.
Schofield, R., Johnston, P. V., Thomas, A., Kreher, K., Connor, B. J., Wood, S., Shooter, D., Chipperfield, M. P., Richter, A., von Glasow, R., and Rodgers, C. D.: Tropospheric and stratospheric BrO columns over Arrival Heights, Antarctica, 2002, J. Geophys. Res., 111, D22310, https://doi.org/10.1029/2005JD007022, 2006.
Seo, S., Richter, A., Blechschmidt, A.-M., Bougoudis, I., and Burrows, J. P.: First high resolution BrO column retrievals from TROPOMI, Atmos. Meas. Tech. Discuss., https://doi.org/10.5194/amt-2018-365, in review, 2018.
Sihler, H., Platt, U., Beirle, S., Marbach, T., Kühl, S., Dörner, S., Verschaeve, J., Frieß, U., Pöhler, D., Vogel, L., Sander, R., and Wagner, T.: Tropospheric BrO column densities in the Arctic derived from satellite: retrieval and comparison to ground-based measurements, Atmos. Meas. Tech., 5, 2779–2807, https://doi.org/10.5194/amt-5-2779-2012, 2012.
Simpson, W. R., von Glasow, R., Riedel, K., Anderson, P., Ariya, P., Bottenheim, J., Burrows, J., Carpenter, L. J., Frieß, U., Goodsite, M. E., Heard, D., Hutterli, M., Jacobi, H.-W., Kaleschke, L., Neff, B., Plane, J., Platt, U., Richter, A., Roscoe, H., Sander, R., Shepson, P., Sodeau, J., Steffen, A., Wagner, T., and Wolff, E.: Halogens and their role in polar boundary-layer ozone depletion, Atmos. Chem. Phys., 7, 4375–4418, https://doi.org/10.5194/acp-7-4375-2007, 2007.
Sioris, C. E., Kovalenko, L. J., McLinden, C. A., Salawitch, R. J., Van Roozendael, M., Goutail, F., Dorf M., Pfeilsticker, K., Chance, K., von Savigny, C., Liu, X., Kurosu, T. P., Pommereau, J.-P., Bosch, H., and Frerick, J.: Latitudinal and vertical distribution of bromine monoxide in the lower stratosphere from Scanning Imaging Absorption Spectrometer for Atmospheric Chartography limb scattering measurements, J. Geophys. Res., 111, D14301, https://doi.org/10.1029/2005JD006479, 2006.
Slijkhuis, S., von Bargen, A., Thomas, W., and Chance, K.: Calculation of undersampling correction spectra for DOAS spectral fitting, Proceedings of the European Symposium on Atmospheric Measurements from Space, ESA WPP-161, ISSN 1022-6656, 563–569, 1999.
Spurr, R. J. D.: VLIDORT: A linearized pseudo-spherical vector discrete ordinate radiative transfer code for forward model and retrieval studies in multilayer multiple scattering media, J. Quant. Spectrosc. Ra., 102, 316–342, https://doi.org/10.1016/j.jqsrt.2006.05.005, 2006.
Stutz, J., Ackermann, R., Fast, J. D., and Barrie, L.: Atmospheric reactive chlorine and bromine at the Great Salt Lake, Utah, Geophys. Res. Lett., 29, 1–18, https://doi.org/10.1029/2002GL014812, 2002.
Stutz, J., Thomas, J. L., Hurlock, S. C., Schneider, M., von Glasow, R., Piot, M., Gorham, K., Burkhart, J. F., Ziemba, L., Dibb, J. E., and Lefer, B. L.: Longpath DOAS observations of surface BrO at Summit, Greenland, Atmos. Chem. Phys., 11, 9899–9910, https://doi.org/10.5194/acp-11-9899-2011, 2011.
Tas, E., Peleg, M., Matveev, V., Zingler, J., and Luria, M.: Frequency and extent of bromine oxide formation over the Dead Sea, J. Geophys. Res., D11304, https://doi.org/10.1029/2004JD005665, 2005.
Theys, N., Van Roozendael, M., Dils, B., Hendrick, F., Hao, N., and De Mazière, M.: First satellite detection of volcanic bromine monoxide emission after the Kasatochi eruption, Geophys. Res. Lett., 36, L03809, https://doi.org/10.1029/2008GL036552, 2009.
Theys, N., Van Roozendael, M., Hendrick, F., Yang, X., De Smedt, I., Richter, A., Begoin, M., Errera, Q., Johnston, P. V., Kreher, K., and De Mazière, M.: Global observations of tropospheric BrO columns using GOME-2 satellite data, Atmos. Chem. Phys., 11, 1791–1811, https://doi.org/10.5194/acp-11-1791-2011, 2011.
Toyota, K., McConnell, J. C., Lupu, A., Neary, L., McLinden, C. A., Richter, A., Kwok, R., Semeniuk, K., Kaminski, J. W., Gong, S.-L., Jarosz, J., Chipperfield, M. P., and Sioris, C. E.: Analysis of reactive bromine production and ozone depletion in the Arctic boundary layer using 3-D simulations with GEM-AQ: inference from synoptic-scale patterns, Atmos. Chem. Phys., 11, 3949–3979, https://doi.org/10.5194/acp-11-3949-2011, 2011.
Vandaele, A. C., Simon, P. C., Guilmot, J. M., Carleer, M., and Colin, R.: SO2 Absorption Cross Section measurement in the UV using a Fourier Transform Spectrometer. J. Geophys. Res., 99, 25599–25605, 1994.
Vandaele, A. C., Hermans, C., Simon, P. C., Carleer, M., Colin, R., Fally, S., Mérienne, M. F., Jenouvrier, A., and Coquart, B.: Measurements of the NO2 absorption cross sections from 42 000 cm−1 to 10 000 cm−1 (238–1000 nm) at 220 K and 294 K, J. Quant. Spectrosc. Ra., 59, 171–184, 1998.
Vandaele, A. C., Hermans, C., and Fally, S.: Fourier Transform measurements of SO2 absorption cross sections: II. Temperature dependence in the 29 000–44 000 cm−1 (227–345 nm) region, J. Quant. Spectrosc. Ra., 110, 2115–2126, 2009.
Veihelmann, B. and Kleipool, Q.: Reducing Along-Track Stripes in OMI-Level 2 Products, TN-OMIE-KNMI-785, 24 pp., 2006.
Vogel, L., Sihler, H., Lampel, J., Wagner, T., and Platt, U.: Retrieval interval mapping: a tool to visualize the impact of the spectral retrieval range on differential optical absorption spectroscopy evaluations, Atmos. Meas. Tech., 6, 275–299, https://doi.org/10.5194/amt-6-275-2013, 2013.
von Glasow, R., von Kuhlmann, R., Lawrence, M. G., Platt, U., and Crutzen, P. J.: Impact of reactive bromine chemistry in the troposphere, Atmos. Chem. Phys., 4, 2481–2497, https://doi.org/10.5194/acp-4-2481-2004, 2004.
Wang, H., Liu, X., Chance, K., González Abad, G., and Chan Miller, C.: Water vapor retrieval from OMI visible spectra, Atmos. Meas. Tech., 7, 1901–1913, https://doi.org/10.5194/amt-7-1901-2014, 2014.
Wang, H., Gonzalez Abad, G., Liu, X., and Chance, K.: Validation and update of OMI Total Column Water Vapor product, Atmos. Chem. Phys., 16, 11379–11393, https://doi.org/10.5194/acp-16-11379-2016, 2016.
Weber, M., Lamsal, L. N., Coldewey-Egbers, M., Bramstedt, K., and Burrows, J. P.: Pole-to-pole validation of GOME WFDOAS total ozone with groundbased data, Atmos. Chem. Phys., 5, 1341–1355, https://doi.org/10.5194/acp-5-1341-2005, 2005.
Wilmouth, D. M., Hanisco, T. F., Donahue, N. M., and Anderson, J. G.: Fourier transform ultraviolet spectroscopy of the transition of BrO, J. Phys. Chem. A, 103, 8935–8945, 1999.
Yung, Y. L., Pinto, J. P., Watson, R. T., and Sander, S. P.: Atmospheric bromine and ozone perturbations in the lower stratosphere, J. Atmos. Sci., 37, 339–353, 1980.
Zhao, X., Strong, K., Adams, C., Schofield, R., Yang, X., Richter, A., Friess, U., Blechschmidt, A.-M., and Koo, J.-H.: A case study of a transported bromine explosion event in the Canadian high arctic, J. Geophys. Res.-Atmos., 121, 457–477, https://doi.org/10.1002/2015JD023711, 2015.