the Creative Commons Attribution 4.0 License.
the Creative Commons Attribution 4.0 License.
 | 15 Apr 2019
The impact of bath gas composition on the calibration of photoacoustic spectrometers with ozone at discrete visible wavelengths spanning the Chappuis band
Michael I. Cotterell
Andrew J. Orr-Ewing
Kate Szpek
Jim M. Haywood
Justin M. Langridge
Photoacoustic spectroscopy is a sensitive in situ technique for measuring the absorption coefficient for gas and aerosol samples. Photoacoustic spectrometer (PAS) instruments require accurate calibration by comparing the measured photoacoustic response with a known level of absorption for a calibrant. Ozone is a common calibrant of PAS instruments, yet recent work by Bluvshtein et al. (2017) has cast uncertainty on the validity of ozone as a calibrant at a wavelength of 405 nm. Moreover, Fischer and Smith (2018) demonstrate that a low O2 mass fraction in the bath gas can bias the measured PAS calibration coefficient to lower values for wavelengths in the range 532–780 nm. In this contribution, we present PAS sensitivity measurements at wavelengths of 405, 514 and 658 nm using ozone-based calibrations with variation in the relative concentrations of O2 and N2 bath gases. We find excellent agreement with the results of Fischer and Smith at the 658 nm wavelength. However, the PAS sensitivity decreases significantly as the bath gas composition tends to pure oxygen for wavelengths of 405 and 514 nm, which cannot be rationalised using arguments presented in previous studies. To address this, we develop a model to describe the variation in PAS sensitivity with both wavelength and bath gas composition that considers Chappuis band photodynamics and recognises that the photoexcitation of O3 leads rapidly to the photodissociation products O(3P) and O2(X, v > 0). We show that the rates of two processes are required to model the PAS sensitivity correctly. The first process involves the formation of vibrationally excited O3() through the reaction of the nascent O(3P) with bath gas O2. The second process involves the quenching of vibrational energy from the nascent O2(X, v > 0) to translational modes of the bath gas. Both of these processes proceed at different rates in collisions with N2 or O2 bath gas species. Importantly, we show that the PAS sensitivity is optimised for our PAS instruments when the ozone-based calibration is performed in a bath gas with a similar composition to ambient air and conclude that our methods for measuring aerosol absorption using an ozone-calibrated PAS are accurate and without detectable bias. We emphasise that the dependence of PAS sensitivity on bath gas composition is wavelength-dependent, and we recommend strongly that researchers characterise the optimal bath gas composition for their particular instrument.
- Article
(1727 KB) - Full-text XML
- BibTeX
- EndNote


The shortage of measurements of aerosol optical properties for light absorbing aerosol precludes their accurate representation in climate models (Stier et al., 2007). In particular, the light absorption for a particular class of aerosol referred to as brown carbon is poorly known, giving large uncertainties in the impact of brown carbon on climate (Feng et al., 2013; Lin et al., 2014). Moreover, light absorption by brown carbon depends strongly on wavelength, with larger absorption at short (∼400 nm) compared to longer (∼700 nm) visible wavelengths. Therefore, the development of improved instruments for accurate aerosol absorption coefficient (αabs) measurements over the visible spectrum – particularly at short visible wavelengths relevant to brown carbon studies – is crucial to reduce the uncertainties in absorbing aerosol optical properties. Photoacoustic spectroscopy is a sensitive technique for measuring αabs in situ for analytes that include gaseous or aerosol samples (Miklós et al., 2001; Moosmüller et al., 2009). Our research focusses on developing PAS instruments to provide accurate and sensitive measurements of aerosol absorption coefficients in both laboratory and field studies (Davies et al., 2018; Lack et al., 2012).
To characterise aerosol in the natural environment, field-deployable instruments need to be both robust and compact. For example, we often operate our instrument aboard the UK research aircraft (FAAM BAe-146) which imposes constraints on the instrument weight and dimensions. Traditional filter-based techniques for aerosol absorption measurement use a photo-detector to record the light transmission through a filter substrate on which ambient aerosol is impacted. These instruments are lightweight and robust and can operate over long periods (∼ days) unattended (Cappa et al., 2008; Sedlacek and Lee (2007); Virkkula et al., 2005). However, there are known biases in the retrieved aerosol absorption coefficient. For example, Lack et al. (2008) report biases in the range 50 %–80 %, with larger biases associated with aerosol samples containing a large organic fraction relative to black carbon, although we have demonstrated recently that advanced correction schemes can remove the bias dependence on organic mass fraction with modest biases in derived absorption coefficients of up to 17 % (Davies et al., 2019). Biases are also attributed to processes that include the modification of the filter substrate by liquid aerosol components, changes in the aerosol structure and size upon impaction (e.g. from the redistribution of organic components and the aggregation of particles) and multiple scattering interactions. Filter-based absorption measurements are limited by their inability to study aerosol in situ.
The PAS uses a laser beam to heat (by photoexcitation) the analyte aerosol in situ, and the heated sample cools by collisional relaxation with the bath gas. The bath gas consequently undergoes adiabatic thermal expansion and generates an acoustic pressure wave for detection by a sensitive microphone. The microphone response is directly proportional to αabs and therefore provides an in situ measure of aerosol absorption. The relationship between this microphone response and the absorption coefficient is determined by calibrating the PAS with a calibrant of known or independently measured absorption, with the quality of this calibration determining the accuracy of PAS absorption measurements.
Researchers have used a variety of analytes to calibrate their PAS systems, including gas or aerosol calibrants (Bluvshtein et al., 2017; Davies et al., 2018; Fischer and Smith, 2018; Lack et al., 2006, 2012). For aerosol absorption measurement applications, an aerosol calibrant may be desired (Bluvshtein et al., 2017; Haisch, 2012). However, there can be large uncertainties in aerosol-based calibrations that rely on a known refractive index for the aerosol and accurate measurements of the size distribution and number concentration of the aerosol passed to the PAS. In particular, typical biases in number concentration are often quoted to be as large as 10 % (Miles et al., 2011). Moreover, aerosol-based calibrations require additional equipment such as a differential mobility analyser that are not deployed conveniently in the field. Therefore, many researchers use a gas species to calibrate their PAS. Such calibrations typically pass the gaseous sample through the PAS to record the microphone signal S before measurement of the gas extinction coefficient (αext) by cavity ring-down spectroscopy (CRDS) using an in-line spectrometer. CRDS measures αext directly (without calibration) from the change in attenuation rate for transmitted light through a multi-pass optical cavity, and, in the case of a gas species for which scattering can be assumed negligible, αext is equivalent to αabs. Therefore, the CRDS-measured αabs is related to S via the PAS calibration coefficient (often referred to as the sensitivity) by
Both NO2 and ozone are popular analytes for calibration of PAS instruments (Bluvshtein et al., 2017; Davies et al. , 2018; Fischer and Smith, 2018; Lack et al., 2006, 2012). The O3 absorption cross section varies by only 2 orders of magnitude over the wavelength range of our spectrometers (405–658 nm), while the NO2 cross section varies by 3 orders of magnitude. The large NO2 absorption cross section range causes saturation in the 405 nm spectrometers for concentrations that are optimal for the 658 nm spectrometers, preventing the fast (∼1 h) and simultaneous calibration of all our photoacoustic spectrometers from a single source of calibration gas. Importantly, NO2 photodissociates at optical wavelengths < 430 nm, with NO2 lost irreversibly from the sample to form stable nascent NO and O2 products (Tian et al., 2013). This photodissociation pathway limits NO2 as a calibration standard for photoacoustic spectrometers at short visible wavelengths. Therefore, we use ozone to calibrate our PAS instruments.
Lack et al. (2006) calibrated their 532 nm PAS with ozone and demonstrated a precision in the calibration coefficient of 0.09 %. Moreover, subsequent measurements of αabs for nigrosin aerosol were in excellent agreement with expected values calculated from the known aerosol refractive index, controlled particle size and measured number concentration. However, Bluvshtein et al. (2017) repeated the experiments of Lack et al. (2006) using a PAS wavelength of 405 nm and found an unaccounted-for factor of 2 discrepancy between ozone-based and aerosol-based calibrations. This result challenged the validity of ozone as a calibrant for photoacoustic spectrometers at short wavelengths, i.e. the wavelength range that is often of most interest to studies of brown carbon. We repeated the experiments of Bluvshtein et al. (2017) using our photoacoustic spectrometers that operate at wavelengths of 405, 514 and 658 nm and instead observed excellent agreement between ozone and aerosol calibrations across all wavelengths, including the short 405 nm wavelength (Davies et al., 2018).
Most recently, Fischer and Smith (2018) recognised that one key difference between the ozone calibrations performed by ourselves and by Bluvshtein et al. (2017) was the composition of the bath gas. Bluvshtein et al. (2017) diluted an ozonised oxygen flow with N2 to give an overall bath gas composition of 90 % N2 and 10 % O2, while we (Davies et al., 2018) injected an ozonised oxygen flow into ambient air to give an overall bath gas composition of 76 % N2 and 24 % O2 (ignoring < 1 % concentrations of argon, CO2 and trace gases). Fischer and Smith (2018) measured the PAS calibration coefficient as a function of the O2:N2 ratio for PAS wavelengths of 532, 662 and 780 nm. They showed that the PAS calibration coefficient depends on the O2 mole fraction, with a factor of 2 increase in the PAS calibration coefficient as the bath gas O2 mole fraction increased from 0.0 to 1.0, reaching an asymptotic maximum value that agreed with calibration coefficients measured using NO2 gas or an aerosol calibrant. We highlight three important aspects of the work of Fischer and Smith. First, the asymptotic value in the calibration coefficient is attained at an O2 mole fraction of ∼0.2 within measurement uncertainty, i.e. at the O2 mole fraction that is relevant to our previous work (Davies et al., 2018). Second, the PAS sensitivity is reduced to only ∼20 % of the asymptotic value at the O2 mole fraction of 0.1 that pertains to Bluvshtein et al. (2017). Therefore, the impact of bath gas does not reconcile our past measurements with those of Bluvshtein et al. (2017), if the observed variations in PAS sensitivity with bath gas composition at wavelengths > 532 nm also apply at 405 nm. Third, the authors account for the asymptotic behaviour by using a model that treats the relaxation of photoexcited ozone and the relative rates at which this excited state is quenched by either O2 or N2 bath gas species. Their model ascribed the drop in PAS sensitivity (i.e. the calibration coefficient) at low O2 mole fractions to poorer quenching of photoexcited O3 by N2. The authors concluded that ozone calibrations should be performed in a bath gas of pure O2.
One drawback of the Fischer and Smith (2018) study is that the PAS sensitivity measurements were not performed for the 405 nm wavelength for which Bluvshtein et al. (2017) reported significant discrepancies between ozone and aerosol calibrations. This omission prevents a direct assessment of the contribution of bath gas to biases in the ozone calibrations performed in the Bluvshtein et al. (2017) study. A second drawback is that, in developing a model to describe their measured PAS data, they attribute the generation of a photoacoustic signal to the direct relaxation of (the superscript * implying that O3 is in an electronically excited state). However, as we discuss further in this contribution, O3 photoexcitation within the Chappuis band (spanning an approximate wavelength range of 400–700 nm) gives photodissociation to O(3P) and O2(X) within < 1 ps (picosecond) irrespective of bath gas. The nascent photofragments subsequently undergo further collisional reactions and relaxation. As we argue here, these collisional processes must be taken into account when interpreting the PAS response.
Here, we present measurements of the dependence of PAS sensitivity on the bath gas O2:N2 ratio at three wavelengths of 405, 514 and 658 nm that span the Chappuis band. Importantly, our measurements include the 405 nm wavelength at which our previous work and that of Bluvshtein et al. (2017) were performed (Bluvshtein et al., 2017; Davies et al., 2018). At short visible wavelengths, we report very different variations in the PAS sensitivity with bath gas O2 mass fraction than those reported by Fischer and Smith (2018), although our measurements agree at the longer 658 nm wavelength. To describe our results and reconcile them with those of Fischer and Smith, we present a complete description of Chappuis band photodynamics, accounting for the photodissociation of ozone, and develop a PAS sensitivity model treating the relative rates of collisional reactions and energy quenching of the nascent photofragments in the presence of both O2 and N2 bath gas species. In the following section, we describe briefly our instrument and our method for performing ozone-based calibrations for different bath gas compositions. Section 3 presents measurements of the variation in PAS sensitivity with bath gas composition, develops a model to describe the measured variations in PAS sensitivity, and justifies the determined relaxation rates of the nascent photofragments from Chappuis band photolysis in the context of previously published studies.
We have described our CRDS and PAS instrument in detail in a previous publication, and only a brief overview of our spectrometers is provided here, with the reader directed to Davies et al. (2018) for further details. The following sub-sections describe the methods used to generate ozone, control the bath gas composition, measure the sample extinction using CRDS and measure the sample absorption using the PAS.
2.1 Ozone generation
Figure 1a shows how we generated an ozone-laden oxygen flow that was then split to provide ozone to three flow lines that included PAS instruments operating at wavelengths 405, 514 or 658 nm. A mass flow controller (MFC) passed 0.15 standard litres per minute (SLPM) of high-purity (99.999 %) O2 from a gas cylinder supply through an ozone generator that used a cold corona discharge. We varied the frequency of this discharge to control the ozone concentration in the output O3–O2 flow. For our calibrations, we chose 10 values of discharge frequency in the range 3–800 Hz, with higher frequencies providing larger ozone concentrations. The frequency of the ozone generator was controlled directly by a LabVIEW software interface. A manifold then split the ozone-laden sample into five lines, although only three of these ozone lines were used for direct injection of ozone into the bath gas that then passed to 405, 514 and 658 nm spectroscopy channels (with channels referring to spectrometers operating at different wavelengths; see Fig. 1c). The output from the remaining two ozone lines was sent to an exhaust. Each ozone line had an approximate flow rate of 0.03 SLPM, although these rates were not exactly equal for all lines, and we discuss this further in Sect. 2.5. The ozone flows were passed through 0.125 in. Teflon tubing that minimised contamination.
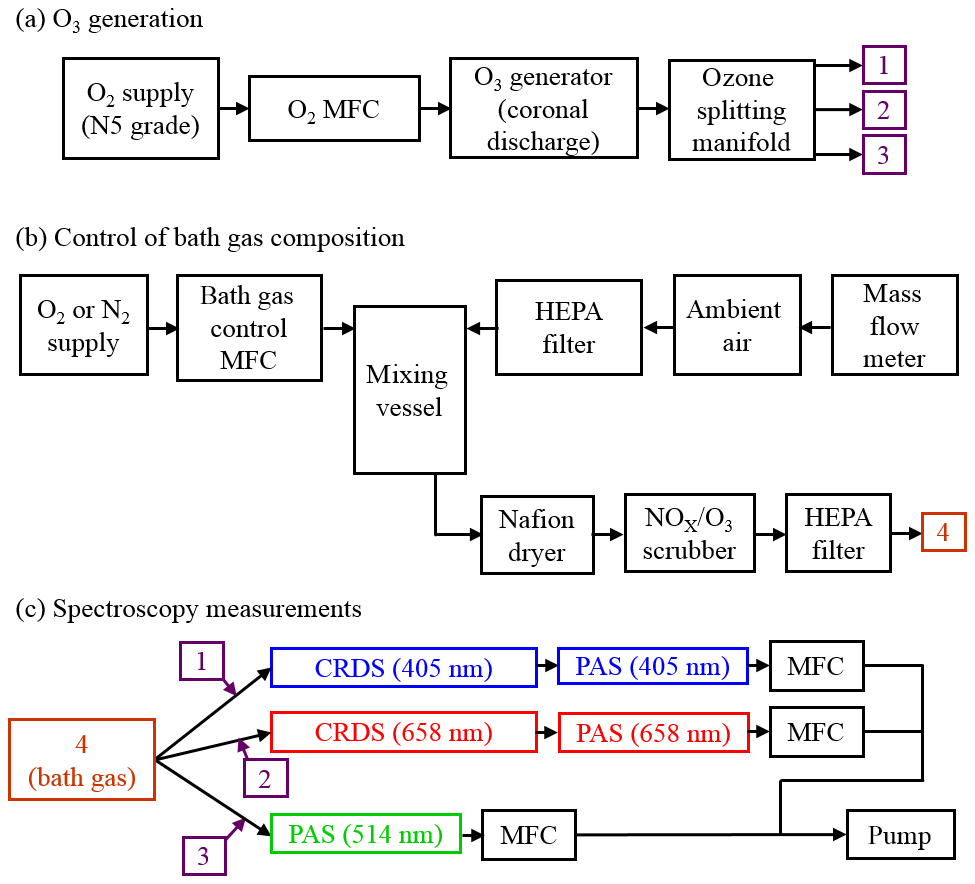
Figure 1Schematic diagrams of the experimental arrangements for (a) the generation of ozone, (b) the control of the composition of the bath gas, and (c) performance of CRDS and PAS measurements of extinction and absorption, respectively, at different optical wavelengths. MFC denotes a mass flow controller.
2.2 Control of the bath gas composition
A schematic for the control of the bath gas composition is shown in Fig. 1b. The flow rate at point “4” in Fig. 1b is determined by the total flow rate regulated by the MFCs in Fig. 1c, the flow rate of the ozonised flow and the flow rate of purge gas used to prevent deposition of contaminants on the CRDS mirrors (see Sect. 2.3). An aluminium mixing vessel with a 1.1 L volume was used to mix ambient air with a controlled flow of either O2 or N2 from a high-purity (99.999 %) gas cylinder. A MFC was used to set the mass flow of either O2 or N2 into the mixing volume, with any make up flow consisting of ambient air (∼21 % O2, 78 % N2, 1 % argon and trace amounts of other gases) with an in-line HEPA filter used to remove aerosol. The mass flow rate of ambient air into the mixing volume was monitored with a mass flow meter, with the magnitude determined by the total flow rate at position “4” and the controlled mass flow of O2 or N2 into the mixing volume. By changing the mass flow rate of the high-purity gas species, we varied the oxygen mass fraction of the bath gas over the range 0.0–1.0. The mixed gas was then passed through a Nafion dryer that dried the gas to a relative humidity < 4 % before passing to a NOx∕O3 scrubber to remove contributions to gas phase absorption from trace bath gas species. Finally, the bath gas passed through a further HEPA filter. We confirmed that the bath gas was devoid of particles by using a condensation particle counter.
Figure 1c shows that the bath gas was split into three flow lines corresponding to the 405, 514 and 658 nm spectroscopy channels. Each ozonised flow was mixed with bath gas 1 cm prior to a spectrometer sample inlet. The total sample flow rates through the three spectroscopy flow lines were controlled by MFCs set to 1.0 L min−1. This flow rate corresponded to mass flow rates of 0.97 SLPM at the 950 hPa pressure measured for all the experiments performed in this work.
Figure 1c shows that we operated CRDS cells at wavelengths of 405 and 658 nm and PAS cells at wavelengths of 405, 514 and 658 nm. For each channel, the sample (bath gas with added ozonised flow and CRDS purge gas) passed through both a CRDS and PAS channel that operated at the same wavelength. We chose to pass the sample through the CRDS channel first because its 0.8 s residence time was lower than for the PAS cell (∼12 s). The low residence time in the CRDS channels minimised ozone loss to surfaces between successive spectrometer measurements. Moreover, we maintained short (< 15 cm) lengths of 0.25 in. conductive tubing between the CRDS and PAS. No corresponding CRDS channel operating at the same wavelength was available for the 514 nm PAS, and the sample passed through the 514 nm PAS only. We now describe the operation of our cavity ring-down and photoacoustic spectrometers.
2.3 Cavity ring-down spectrometers
We used two cavity ring-down spectrometers with identical configurations, albeit using different laser sources and cavity mirrors optimised for two different wavelengths. The output from a continuous-wave diode laser was injected into a high finesse optical cavity that consisted of two highly reflective mirrors (reflectivities of > 99.999 %) separated by a distance of 40 cm. The laser diode current was modulated with a 50:50 duty cycle square wave signal to pulse the laser power between 0 and ∼300 mW at a frequency of 2000 Hz. The spectral widths of the lasers (∼100 GHz) were much larger than the free spectral range of the CRDS optical cavity (∼375 MHz). Therefore, the laser coupled passively into the optical cavity and overlapped numerous longitudinal modes. For each pulse injected into the optical cavity, a fraction of light leaking from the rear mirror was detected with a photomultiplier tube, the voltage from which was recorded by a 2.5 mega-samples per second (MS s−1) data acquisition (DAQ) card. The time trace in this voltage is referred to as the ring-down trace. In the case that the linewidth of the sample extinction is larger than the linewidth of light circulating in the optical cavity, a criterion met for the cases of ozone in the Chappuis band and for aerosol, Zalicki and Zare (1995) demonstrated that the time dependence in the cavity output intensity obeys a single exponential decay, with the characteristic 1∕e folding time for this decay referred to as the ring-down time (τRD). Therefore, by fitting the ring-down trace to a single exponential, τRD was determined. We used the linear regression of the sum method described by Everest and Atkinson (2008) for the fast and accurate retrieval of τRD in real time. The cavity mirrors were mounted on kinematic mirror mounts (Newport), and the alignment of each mirror was optimised to maximise both τRD and the maximum intensity (voltage) in the ring-down trace, thereby maximising the sensitivity of each CRDS channel.
Sample inlet and outlet ports were located at opposite ends of the cavity and 3 cm away from the CRDS mirrors. To prevent contaminants depositing on the highly reflective mirror surfaces, a 0.0125 SLPM purge gas flow was passed over the mirror surfaces. Zero air was used as the purge gas for calibrations corresponding to a bath gas O2 mole fraction of 0.23 (i.e. ambient conditions) only and represents the purge gas used in measurements (including calibrations) under normal operation of the instrument in the field or laboratory. Otherwise, high-purity N2 or O2 purge flows were used.
From knowledge of the ring-down time in the presence (τRD) and absence (τRD,0) of the sample, the extinction coefficient αext is calculated using
in which c is the speed of light, and RL is the ratio of the cavity mirror separation (40 cm) to the length over which the sample occupies the cavity. We take this latter length to be the distance between the sample inlet and outlet ports (34 cm), and RL is taken as 1.1765 for both CRDS channels. We applied a small correction to αext to account for the small dilution of the sample by the purge gas flows. Typical values of τRD,0 are 24±0.004 and 34±0.04 µs for the 405 nm and 658 nm CRDS channels, with the quoted uncertainties corresponding to 1 standard deviation over 60 s.
For the calibrations in this work, the ozone extinction at the 514 nm PAS wavelength (αext,514) was calculated from the 658 nm CRDS-measured extinction (αext,658) from knowledge of the variation in ozone cross section with wavelength using
in which and are the O3 absorption cross sections at 514 and 658 nm, respectively. We used the recommended absorption cross sections for O3 provided by the NASA Jet Propulsion Laboratory (Burkholder et al., 2015). We also applied a further correction to αext,514 to account for the difference in ozone concentrations between the 514 nm PAS and the 658 nm CRDS due to the parallel flow configurations for these two spectrometers. This correction is described in Sect. 2.5. We can also calculate αext,514 from the 405 nm CRDS measurements using the same approach above. However, Sect. 3.1 shows that there is significant uncertainty in the αext,514 arising from uncertainty in the 405 nm laser wavelength. Therefore, this work only presents αext,514 data calculated from 658 nm CRDS measurements.
2.4 Photoacoustic spectrometers
The output from a continuous-wave diode laser was directed into an astigmatic multi-pass optical cavity that provided multiple reflections (∼50) of the laser beam through a photoacoustic cell (PAS cell). The intensity of the laser beam was periodically modulated with a frequency that matched the resonance frequency of the PAS cell (see below). A photodiode behind the rear cavity mirror monitored the rms laser power, Wrms. The geometry of the cell has been described previously by Lack et al. (2012) and consisted of two cylindrical resonators (an upper and lower resonator) that were coupled through acoustic buffer volumes. We used Brewster-angled windows to minimise the detection of laser interactions with the PAS cell windows and improve sensitivity. The laser beam was multi-passed through the lower resonator of the PAS cell. Sample inlet and outlet ports were located in opposite acoustic buffer volumes, and the sample flow was drawn through the PAS cell. Ozone passing through the laser beam was photoexcited, and the bath gas was heated through collisional energy transfer from the ozone photoproducts to translational degrees of freedom of the bath gas. The heat in the bath gas generated a pressure (acoustic) wave through adiabatic expansion. These pressure waves were coupled into a standing wave pressure eigenmode of the PAS cell, with the amplitude of the excited eigenmode detected by sensitive microphones located in each resonator. The voltage from each microphone was passed through a differential amplifier and the amplified output sent to a DAQ card that recorded the microphone waveform with a time resolution of 8 MS s−1 over a 1 s interval.
A speaker was located close to the microphone in the lower resonator and was driven by a voltage waveform that, in the frequency domain, was a top hat distribution over the frequency range 1250–1650 Hz. At multiple intervals during the calibration routine using ozone, the speaker was used to excite the standing wave eigenmode of the PAS cell. The 1 s microphone time trace was recorded and processed through a fast Fourier transform that gave an acoustic spectrum with a Lorentzian distribution (see Fig. 2 of Lack et al., 2012). By fitting this measured distribution to a Lorentzian function, the cell resonance frequency fres and quality factor Q were measured. Importantly, this measured fres was used to set the modulation frequency of the laser to ensure this frequency matched the PAS cell resonance frequency at all times.
To measure the PAS response from ozone absorption during calibrations, 1 s waveforms were recorded, and the amplitude of the frequency component corresponding to fres was measured. This amplitude is referred to as the raw photoacoustic signal Sraw. As described in previous publications (Davies et al., 2018; Lack et al., 2012), Sraw requires fres, Q and Wrms to be corrected for, and it can be shown from first principles (Miklós et al., 2001) that this correction should be performed according to
in which Scorr is the corrected PAS signal. In our measurements, Wrms is measured from the voltage response of an uncalibrated photodiode detector. Therefore, the units of Wrms and Scorr are arbitrary. An additional correction is required to account for a background contribution to Scorr from laser interactions with the PAS cell windows. We denote this background contribution . is constant over a calibration and typically represents < 10 % of the photoacoustic signal during calibrations with ozone. Each ozone calibration performed for this work lasted ∼1 h during which the ozone concentration was increased sequentially. Before and after this ∼1 h period when the PAS cells were devoid of any absorbing sample, the mean was characterised over 60 s periods. These two mean background values were identical within measurement precision, and a linear interpolation between these values was used to describe over the calibration period. The PAS signal of interest is then given by
For the 405 and 658 nm PAS channels that were in a serial flow configuration with a CRDS channel (see Fig. 1c), an additional but small correction was applied to Sfinal to account for dilution by the CRDS purge flows.
2.5 Correction of αext,514 for differences in ozone concentrations
Section 2.3 stated that a correction to the calculated αext,514 was applied to account for unequal ozone concentrations between the 514 nm PAS and 658 nm CRDS channels. We used our measurements of fres for the 514 and 658 nm PAS channels to calculate the relative difference in O3 between flow lines. We demonstrated in Davies et al. (2018) that the resonance frequency shift Δfres upon the introduction of the ozonised flow could be used to correct αext,514 according to
2.6 Calibration procedure and the calculation of PAS sensitivity
We measured the PAS calibration coefficient for multiple values of bath gas O2 mass fraction. Each calibration involved measuring Sfinal and corrected extinction coefficients for 10 ozone concentrations (10 values of coronal discharge frequency), and the calibration procedure was controlled by automated LabVIEW software. For a given coronal discharge frequency, we waited 120 s for the new ozone concentration to stabilise across all channels. The fres and Q for the PAS channels were measured at the end of this wait period. Then, Sraw and αext were measured at 1 Hz and averaged over a 60 s period before the coronal discharge frequency was increased to a higher level. The Sraw and αext for each ozone concentration were corrected using the procedures described in Sect. 2.3–2.5, giving the values Sfinal and . PAS sensitivity was calculated from a linear regression of the variation in the mean Sfinal with mean for all 10 ozone concentrations constrained through the intercept Sfinal=0, consistent with the definition of PAS sensitivity in Eq. (1).
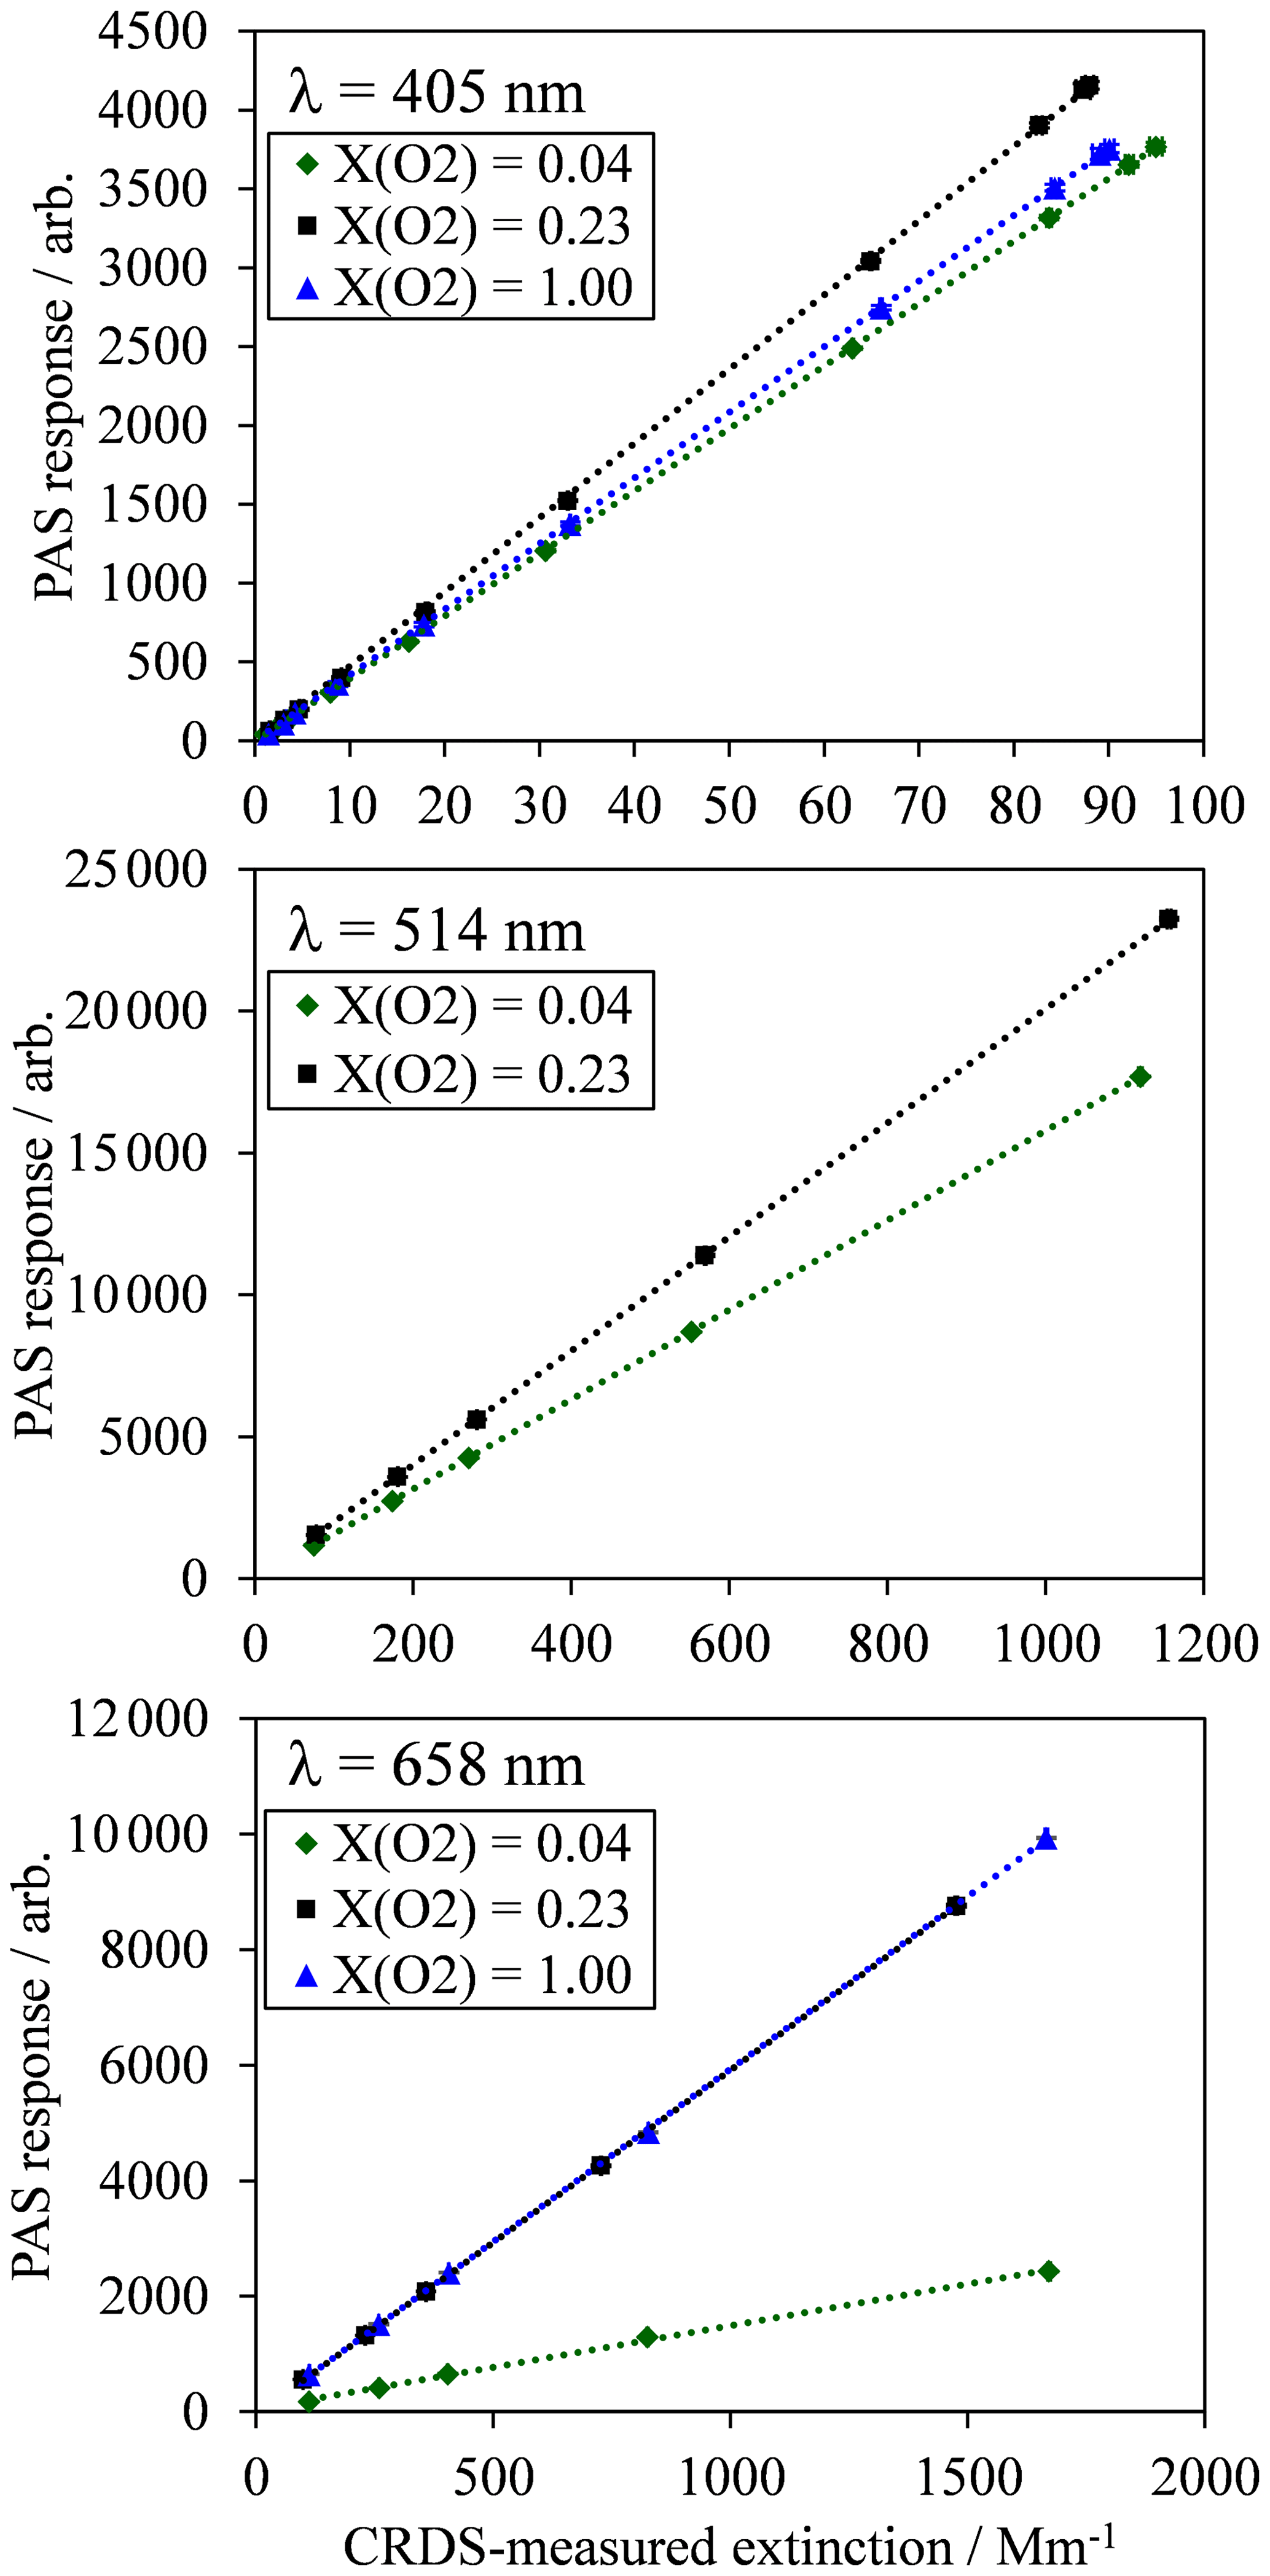
Figure 2For each PAS channel, example calibration measurements of PAS response variation with CRDS-measured extinction for an analyte of ozone gas. Each plot shows typical calibration data for ozone gas in bath gases composed of a mixture of N2 and O2, with O2 mole fractions of 0.04 (near-pure N2), 0.23 (ambient air composition) and 1.0 (pure O2). All data points include error bars corresponding to 1 standard deviation in the measured PAS response or extinction, although these error bars are not visible on the plot scales because of the low variance in the measurements. Dashed lines represent straight line fits to the measured data, with the fit constrained such that the intercept is zero.
3.1 Measured variations in PAS sensitivity with bath gas composition
For each PAS channel, Fig. 2 shows example calibration plots for the variation in PAS response (Sfinal) with the CRDS-measured extinction ( for bath gas compositions with oxygen mass fractions () of (near-pure N2), 0.23 (ambient air with added ozonised O2 flow) and 1.0 (pure O2). The plot for the 514 nm PAS channel does not show data for the calibration. This is because the derived 514 nm extinction relies on correcting the 658 nm extinction, measured by CRDS in a parallel flow configuration, for differing ozone concentrations caused by unequal splitting of the ozonised flow by the gas manifold (Fig. 1a). As described in Sect. 2, a correction factor for this uneven ozone splitting is determined by the ratio of PAS resonance frequency shifts in the 514 and 658 nm channels, , upon the addition of the ozonised flow. In the case of a bath gas of , the resonance frequency shift in all PAS cells upon the addition of the ozonised flow is zero, thus precluding the calculation of and the 514 nm extinction.
In Fig. 2, each data point corresponds to the mean values for measurements of Sfinal and over a 60 s period at a given corona discharge lamp frequency, with 1 standard deviation error bars shown; these uncertainties are barely visible on Fig. 2 due to their low value. Typical 1σ uncertainties in the extinction and absorption measurements are 0.74 % and 0.17 % for αext-405 and αext-658 respectively and 2.43 %, 0.36 % and 0.32 % for Sfinal,405, Sfinal,514 and Sfinal,658 respectively. The 1σ uncertainty in αext-514 is related to that in αext-658, although there is additional uncertainty in the 514 nm extinction measurement arising from the correction factors for and differences in ozone cross section at the 514 and 658 nm laser wavelengths. Typically, the standard error in is 1.67 %. Meanwhile, the uncertainty in O3 cross section ratio for a 1 nm wavelength uncertainty in the 658 nm laser wavelength is 1.8 %. Therefore, the uncertainty in the measured αext-514 is 2.5 %. For comparison, the uncertainty in the ratio for a 1 nm uncertainty in the 405 nm laser wavelength is 7.5 % and would correspond to a 7.7 % uncertainty in the measured αext-514. Hence, due to the sensitivity of the O3 cross section ratios to uncertainties in the laser wavelength, we opt to use the 658 nm laser in calibrating our 514 nm PAS channel. For completeness, we find that the calculated αext-514 from extinction measurements at the 405 and 658 nm wavelengths is well correlated (with a linear Pearson correlation coefficient of 0.93), and the average αext-514 is 14 % larger when calculated from 405 compared to 658 nm measurements.
Figure 2 demonstrates the excellent linearity in calibrations for all channels and bath gas compositions over the extinction range covered. Each calibration is fit to a straight line via a least squares fit routine, with the intercept constrained to pass through zero. The slope of this linear fit is equal to the PAS sensitivity C (see Eq. 1). For all calibrations performed for this publication, the mean standard errors in C arising from the aforementioned least-squares fit routine are 0.31 %, 0.33 % and 0.40 % for the 405, 514 and 658 nm PAS channels respectively.
Figure 2 also demonstrates that there are significant variations in C with bath gas composition at all PAS wavelengths for the limited range of calibrations at different values presented. Meanwhile, Fig. 3a shows all our measurements of PAS sensitivity with variation in for 16 separate calibrations at 14 different bath gas compositions. Our 658 nm measurements demonstrate similar behaviour to that reported by Fischer and Smith (2018), approaching a plateau as tends to 1. However, the PAS sensitivities for wavelengths of 405 and 514 nm demonstrate a very different dependence on O2 mass fraction. In both of these channels, the PAS sensitivity is a maximum at O2 mass fractions close to 0.2 (i.e. at mass fraction values similar to that of ambient air) and is lower at other O2 mass fractions.
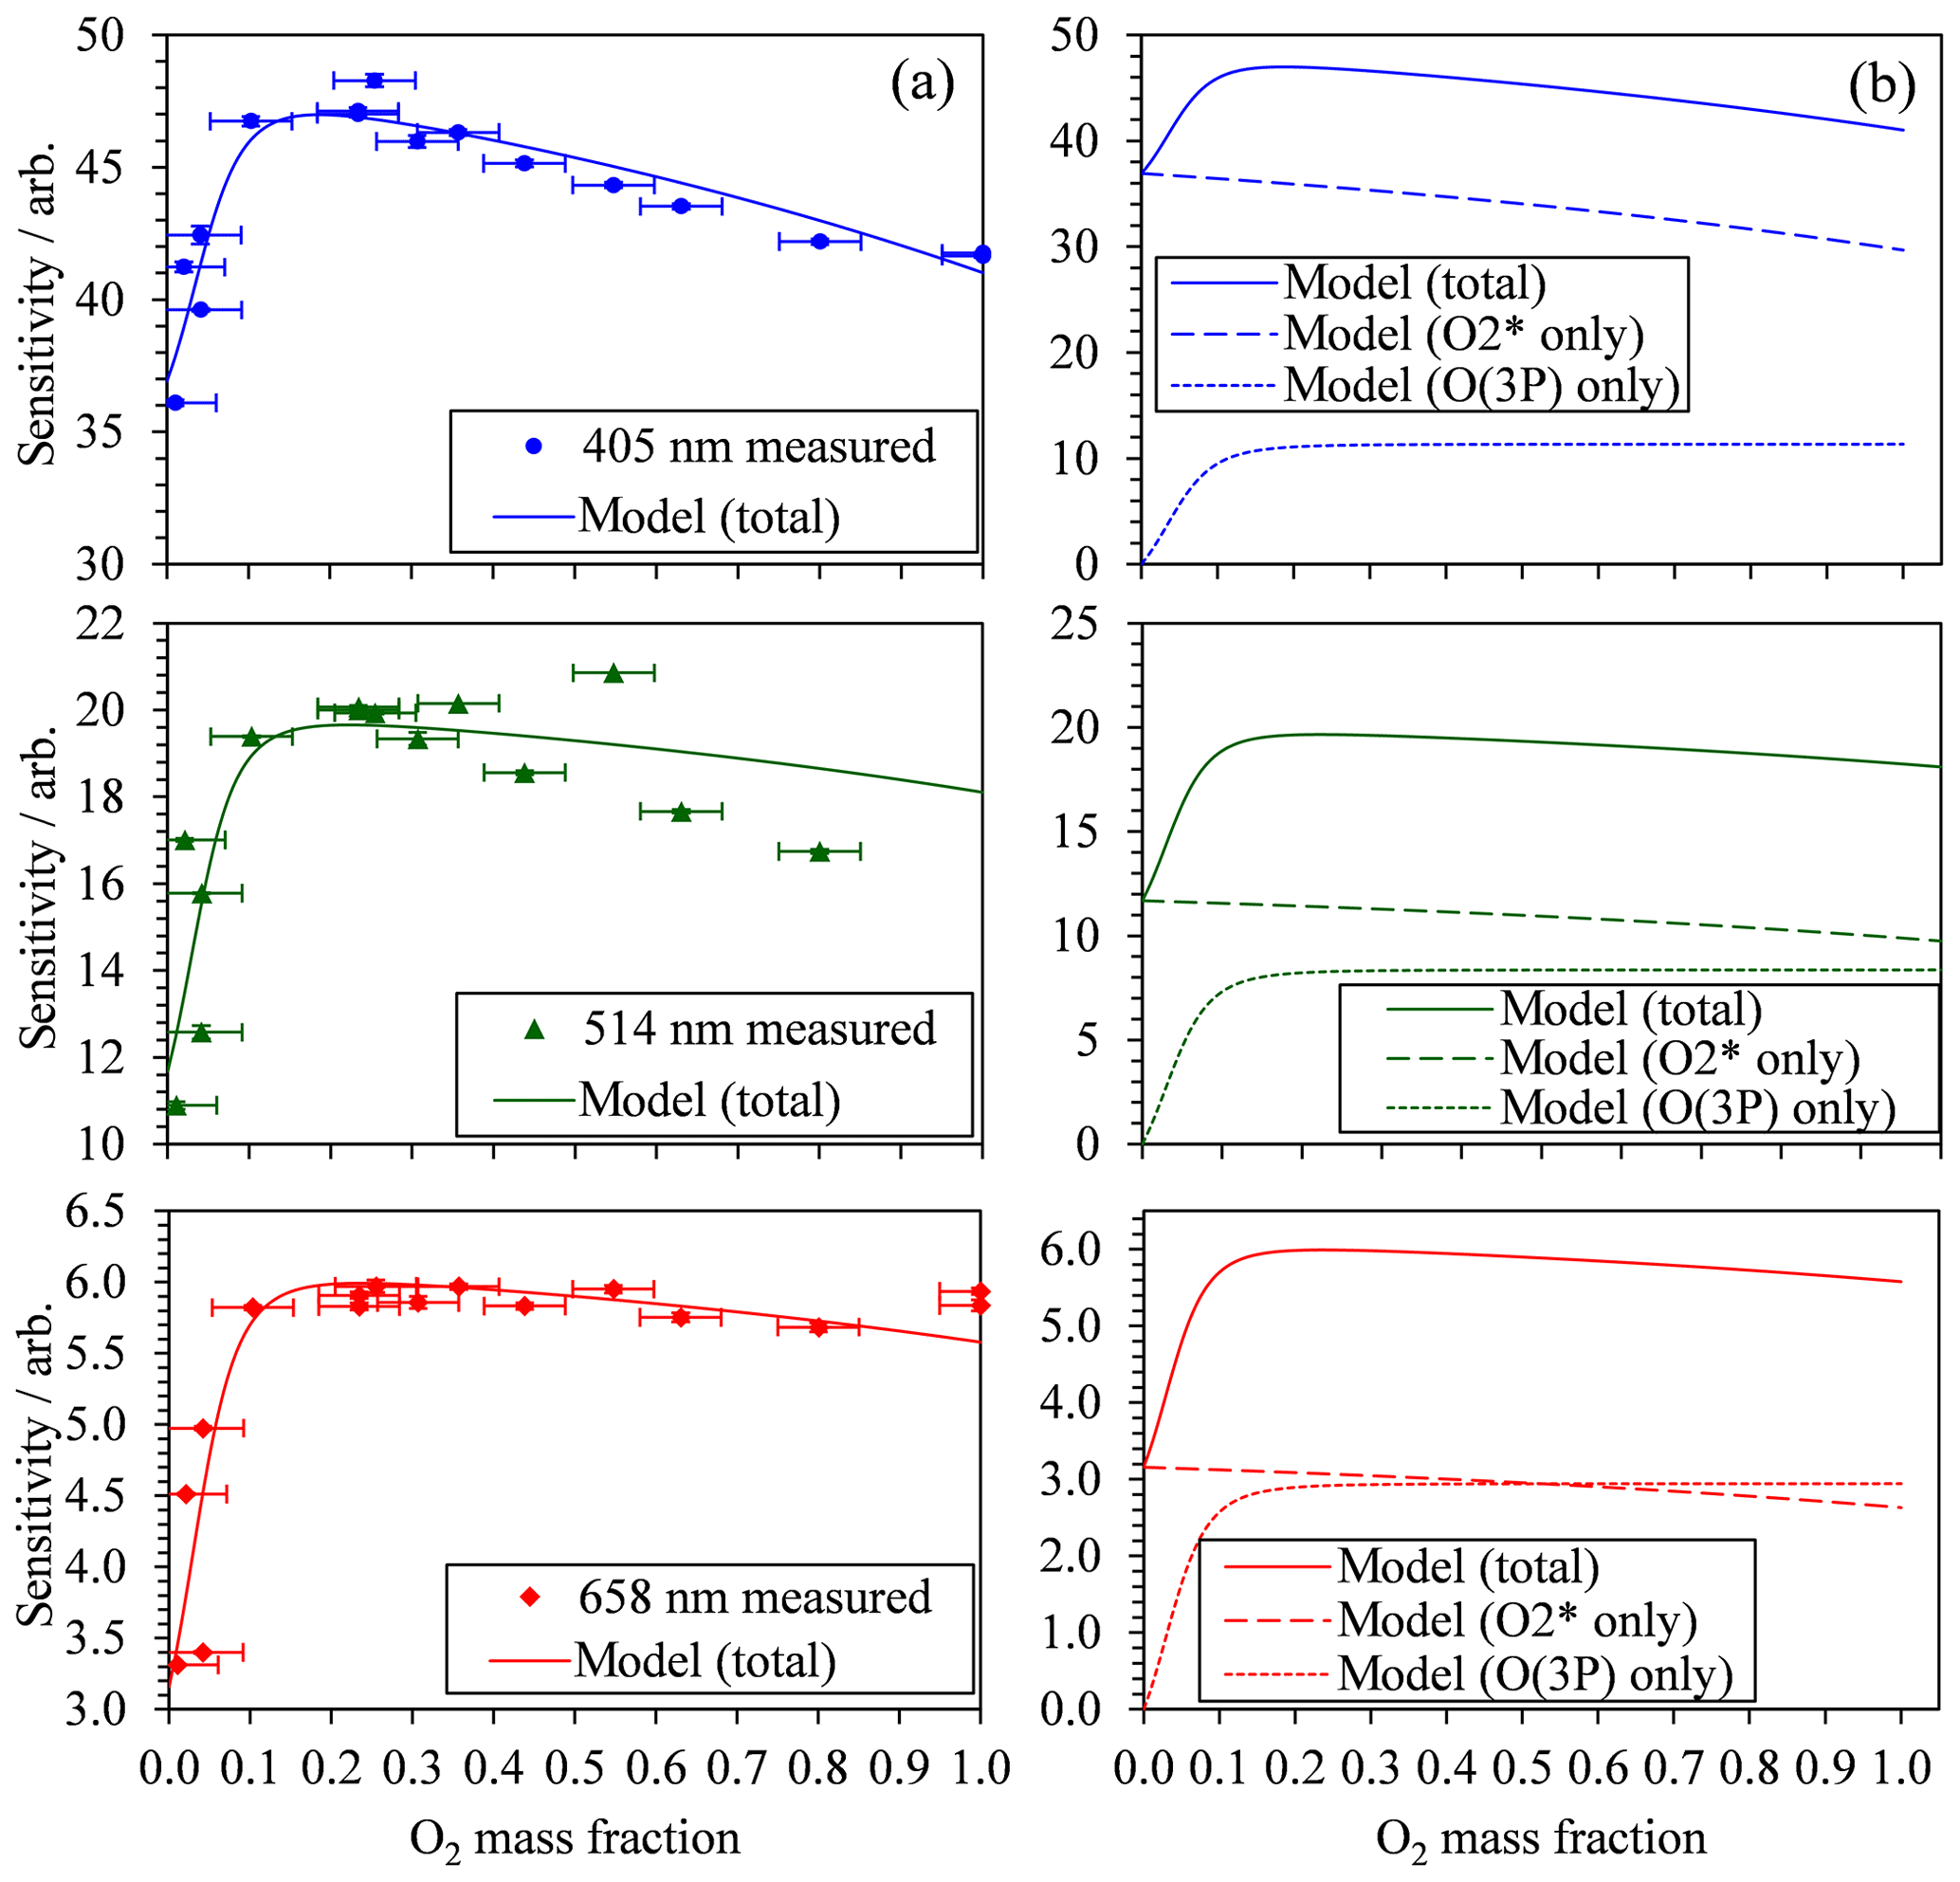
Figure 3(a) The measured PAS sensitivity C with variation in the bath gas O2 mass fraction (points) and best fit descriptions of the data for the model described by Eqs. (8), (11) and (12). The measured data include vertical error bars that represent 1 standard deviation in the measured sensitivity, although these error bars are not visible on the vertical scale shown. Horizontal error bars represent the uncertainty in O2 mass fraction arising from the standard errors in the mass flow controller flow rates that control concentrations of O2 and N2 in the bath gas. (b) The best fit model description from (a) and the contributions from the two components of the model that correspond to quenching of O(3P) and O2(X, v > 0).
To explain the measured variation in PAS sensitivity with bath gas composition and excitation frequency, we consider the potential energy surfaces for ground and photoexcited states of O3. Grebenshchikov et al. (2007) provide an excellent review of O3 photodissociation over various bands that include the Chappuis band (wavelengths in the range of ∼400–700 nm). The authors calculate the potential energy surfaces for O3, including potential energy cuts along the O2–O dissociation coordinate, and describe the Chappuis band photodynamics concisely. The Chappuis band arises from excitation to two adiabatic 1A′′ states. The lower state correlates asymptotically to the formation of O(3P) + O2(X) and is a repulsive surface, while the upper state is bound with a dissociation energy (corresponding to the formation of O(1D) + O2(a1Δg)) that cannot be overcome from Chappuis band excitation at room temperature. To support this latter point, the experiments of Levene et al. (1987) find no evidence for the formation of O2(a1Δg) state following Chappuis band photoexcitation. A symmetry-allowed conical intersection connecting the two 1A′′ states is located close to the Franck–Condon point and the equilibrium bond length of the upper 1A′′ state. After photoexcitation in the Chappuis band, the electronically excited population is distributed equally between the two electronic states as the two adiabatic transition dipole moments are similar in the Franck–Condon region. While in the lower repulsive state dissociates within a few tens of femtoseconds to form O(3P) + O2(X), population in the upper 1A′′ state may undergo two vibrations at most before crossing the 1A′′ conical intersection and dissociating via the lower repulsive state to O(3P) + O2(X) (Flöthmann et al., 1997). Nevertheless, the lifetime of the population in this upper state is less than a few picoseconds, demonstrated by the diffuse structures in the absorption cross section for O3 within the Chappuis band. Importantly, the s timescale for photodissociation is much faster than the modulation period of our PAS laser intensity (τmod is in the range 600–780 µs, corresponding to modulation frequencies of 1280–1640 Hz) and can be considered an instantaneous process. Ultimately, Chappuis band excitation leads to the prompt photodissociation of O3(1A′′) and to the formation of O(3P) and O2(X), in which the nascent O2 photofragment is vibrationally excited (v > 0) (Flöthmann et al., 1998):
For PAS measurements of absorption by O3, we need to consider the subsequent fate of O(3P) and O2(X) and, importantly, the rate at which energy is quenched into translational modes of bath gas M = N2 and O2 for the generation of a PAS signal.
First, we note that the nascent O2(X), although formed in the ground electronic state, is vibrationally excited (Flöthmann et al., 1998). For our PAS measurements, we need to consider the rates of quenching of energy from O2(X, v > 0) to translational modes of both bath gas species M = N2, O2 through the quenching reaction:
Second, the nascent O(3P) rapidly combines with bath gas O2 (collision frequency on the order of 1012 s−1) to form ground-state O3() via Reactions (R3) and (R5):
in which M (N2 or O2) is a third body that removes energy from the initial metastable O3); because the nascent O(3P) has significant kinetic energy following photodissociation, the initial O3‡() has energy above the energy threshold correlating to O(3P) + O2(X). We emphasise that the resulting O3 is now in the ground electronic state but is vibrationally excited (v>0). The collisional stabilisation of O3‡() (Reaction R5) competes with the re-dissociation of O3‡() to O(3P) + O2(X) (Reaction R4), with this latter process expected to be fast compared to the stabilisation pathway. The contribution to the PAS signal from O3(, v>0) will depend on (i) the rate at which stabilised O3(, v > 0) (through collision with M = N2, O2) is formed and (ii) the rate of energy quenching from vibrationally excited O3(, v > 0) into translational modes of M = N2, O2. For this latter process, Ménard-Bourcin et al. (1991) and Zeninari et al. (2000) measured vibration-to-translation (V–T) energy transfer rates for both N2 and O2 bath species, with similar rates of s−1 atm−1 that correspond to a characteristic timescale for quenching of ∼1.4 µs at the 950 hPa pressure measured during our experiments. This timescale is sufficiently fast compared to our PAS modulation period that it can be considered instantaneous. We note that Ménard-Bourcin et al. (1991) and Zeninari et al. (2000) studied the V–T relaxation of ozone in a vibrationally excited state containing a single quantum of energy corresponding to a symmetric stretch (v1=1103 cm−1), bend (v2=701 cm−1) or asymmetric stretch (v3=1042 cm−1); i.e. O3 was in the (v1, v2, v3) state of (1, 0, 0), (0, 1, 0) or (0, 0, 1) prior to V–T relaxation. However, Siebert et al. (2002) show that O3 exists in vibrational states as high as (7, 0, 0) for energies below the O3 photodissociation threshold (approximately 1 eV =8065 cm−1). Therefore, the relaxation of ozone in our studies that is formed in vibrational states close to the O–O2 bond dissociation threshold will occur on a timescale longer than the 1.4 µs estimated above. However, we do not anticipate that the timescale for the removal of ∼7 quanta of energy will be sufficiently larger than the 1.4 µs timescale for single quantum relaxation as to impact on the PAS signal, and we assume the relaxation of O3(X, v > 0) occurs much faster than the PAS laser modulation period. Thus, while we can assume that the quenching rate of vibrationally excited O3(, v > 0) is essentially instantaneous on our PAS timescale, the rates of formation of O3(, v > 0) from Reactions (R3)–(R5) for bath gases M = N2, O2 are not well studied. We expect the process of O3(, v > 0) formation to impact on the measured PAS sensitivity if the associated formation rate is slow. Indeed, this recombination process is likely to proceed at a slower rate than that for the quenching of the stabilised O3(, v > 0); the collisional stabilisation of O3) to form O3(, v > 0) (Reaction R5) competes with re-dissociation of O3‡() to O(3P) + O2 (Reaction R4). This latter process likely proceeds on a timescale of tens of picoseconds at most.
We now develop a model to describe our PAS sensitivity. We will show that processes with associated timescales that are slow compared to the PAS laser modulation period degrade the PAS sensitivity. Therefore, while the processes in Reaction (R1) for the production of O(3P) + O2(X, v > 0) and for the energy quenching of the stabilised O3(, v > 0) can be considered instantaneous, the rates of V–T relaxation of O2(X, v > 0) and the rate at which stabilised O3(, v > 0) is formed could be slow.
3.2 A PAS sensitivity model that considers energy transfer rates from both O(3P) and O2(X, v > 0)
Using the model of Kosterev et al. (2006), the photoacoustic signal C is described by Arnott et al. (2003) and Moosmüller et al. (2009)
in which fres is the frequency of the laser modulation that is set to the resonant frequency of the PAS cell, τ is the relaxation time of the excited state and C0 is the PAS sensitivity in the limit ; i.e. quenching is fast compared to the modulation period of the laser intensity. In the current case of PAS measurements of O3, a contribution to the total PAS signal is made from quenching of energy from both O(3P) and O2(X, v > 0), and we write
Here, represents ground-state O2 in a vibrationally excited state. As described above, the rate of quenching of energy from O(3P) is limited by the recombination of O(3P) with O2, with stabilisation by a further bath gas species of either O2 or N2. From Eqs. (R3)–(R5), we can write rate equations for the production of the intermediate and, under the steady-state approximation, we find that the rate of O3(X, v > 0) production is given by
in which the rate constants k1–k3 are those for Reactions (R3)–(R5), respectively. As discussed above, we expect the rate of collisional stabilisation of O3 (proceeding with a rate constant k3) to be slow compared to that for the re-dissociation pathway (proceeding with a rate constant k2). In the limit k2 ≫k3[M], Eq. (9) simplifies such that the production rate of O3(X, v > 0) depends on [O][O2][M], and the rate at which O(3P) is lost is described by
in which and are rate coefficients related to the formation rate for O3 (k1), the re-dissociation of O3 (k2) and the quenching rate of O3 to O3(X, v > 0) by M (k3), for M = N2 or O2 bath gas species respectively. Thus, the time dependence in the loss of O(3P), and the formation of O3(, v > 0), follows an exponential form with a time constant:
Similarly, we write the characteristic relaxation time of O2(X, v > 0) by
in which and are quenching rate constants in bath gas N2 or O2, respectively. We fit the model of Eq. (8) to our measured PAS data, using expressions for τO and provided in Eqs. (11) and (12), respectively. For this fitting, the values of , , and are constrained such that their values are invariant with wavelength. Although nascent products may be produced in different vibrational states for different photolysis energies, we find the aforementioned constraint on rate constants is necessary to reduce the uncertainties in fit parameters and give meaningful insight into the wavelength dependence of the PAS sensitivity to O3 absorption. Also, we have reported previously (Davies et al., 2018) the excellent agreement between measured aerosol absorption (using an ozone calibration in a bath gas of ambient air) and predicted values, with a maximum discrepancy of 9 %. Therefore, we expect the relaxation time constants τO and to be near-instantaneous relative to the PAS modulation frequency at ambient-air bath gas composition and . Thus, in fitting the above model, we constrained the sum such that the maximum allowed value is 20 % larger than the measured maximum in Ctotal. The resonant frequency fres in Eq. (8) varies with the bath gas O2 mass fraction and is taken as the mean measured cell resonance frequency during a calibration for a given bath gas composition. Figure 4 shows these measured variations in fres with O2 mass fraction for each PAS channel, with fres decreasing by ∼7 % as increases from to . In contrast, the fres values vary by < 2 Hz (<0.14 %) over a single calibration as the O3 concentration is increased over the calibration period.
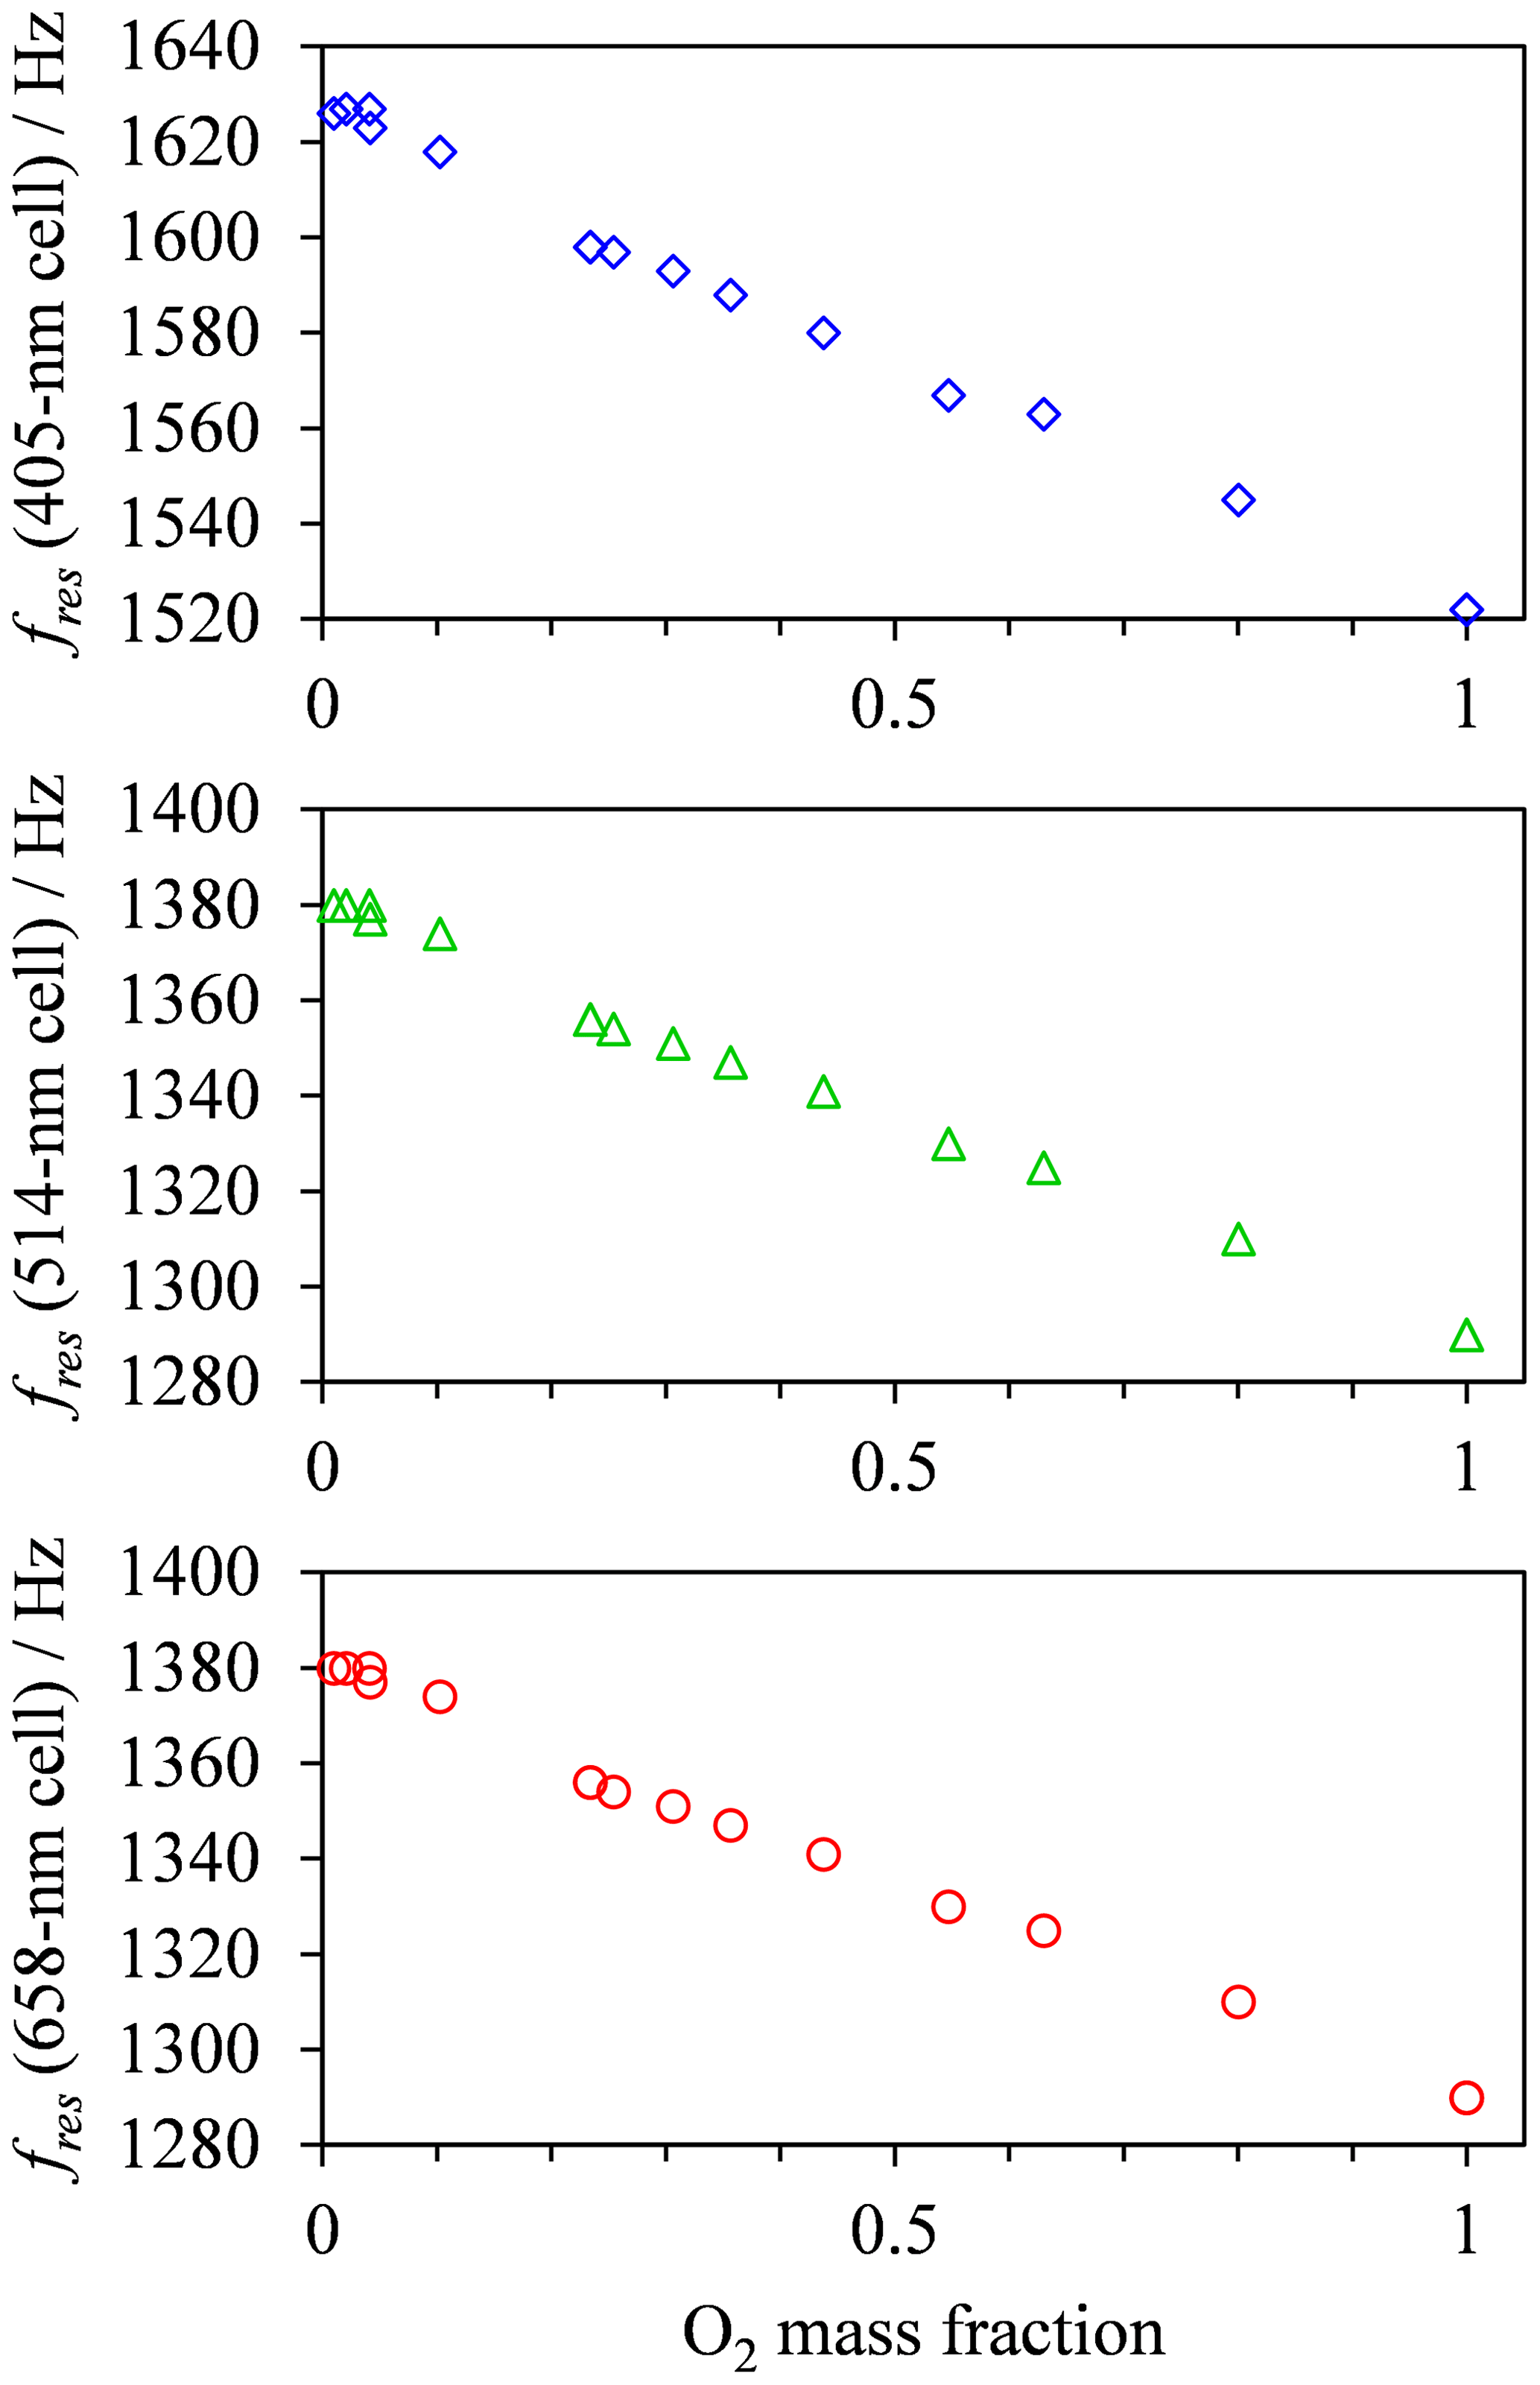
Figure 4The variation in the mean measured PAS cell resonance frequency with O2 mass fraction for each PAS channel used in this study.
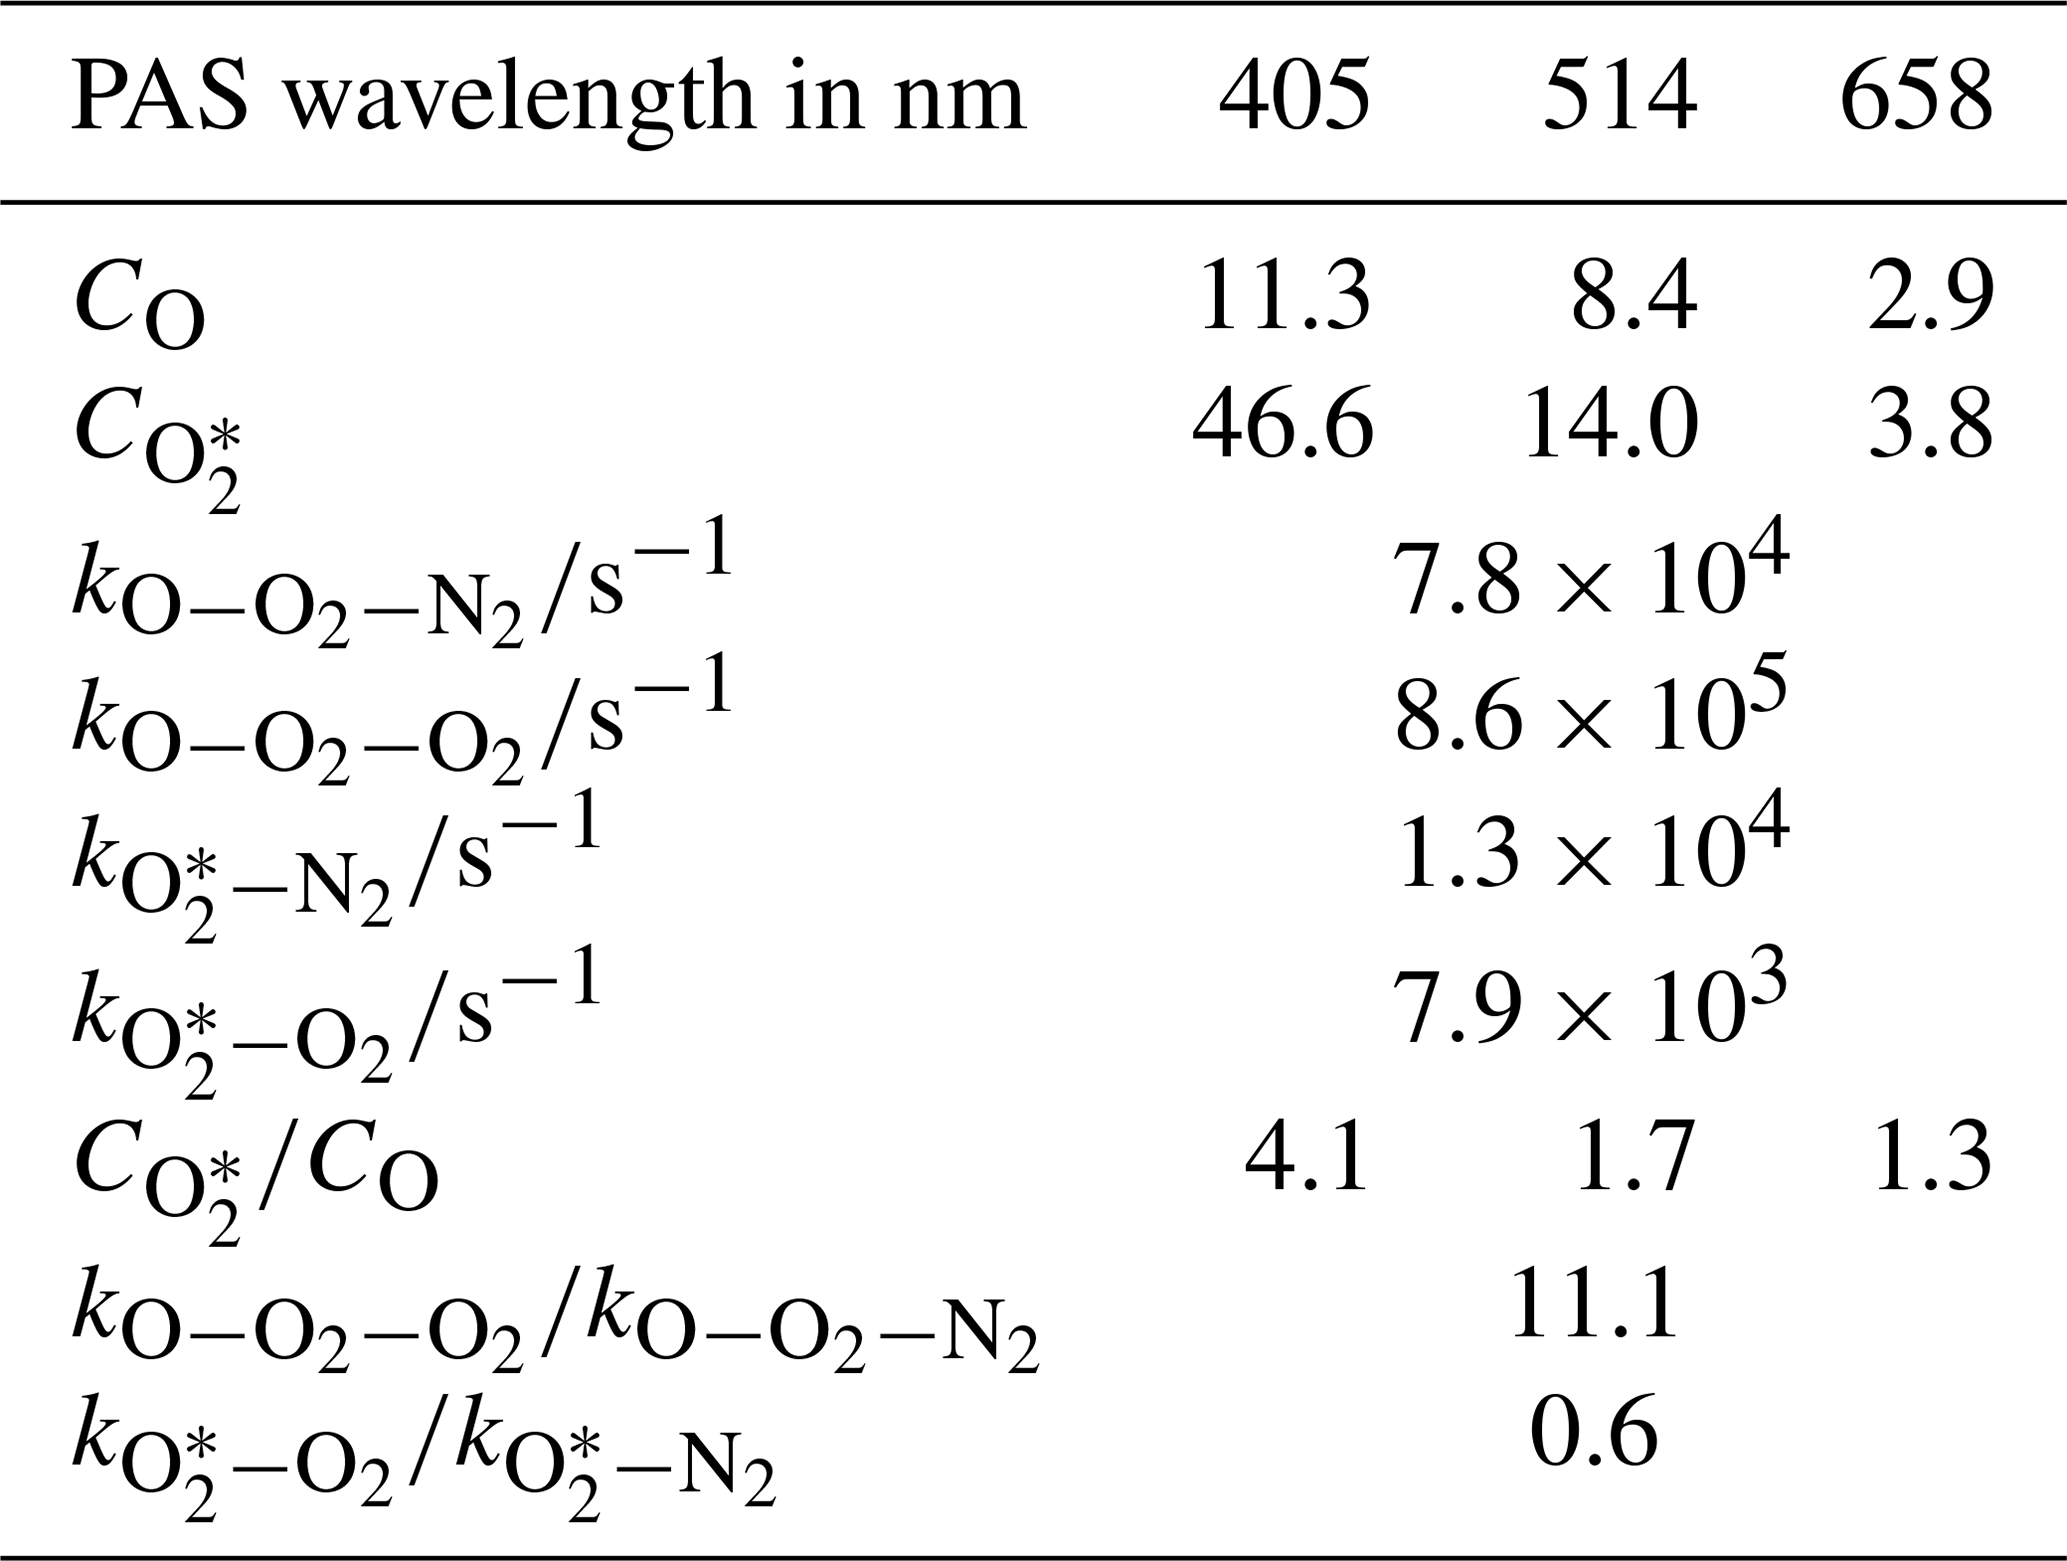
The 10 fit parameters that include , , and , in addition to six coefficients corresponding to CO and for each of our three PAS wavelengths are fit to the measured data by minimising the sum of least squares between measured and modelled values of PAS sensitivity. Figure 3 shows these best-fit model descriptions for each wavelength, while Table 1 summarises the best-fit parameters. We fitted our model to measured data in the mass fraction domain, and, therefore, the rate coefficients have units of s−1. The model developed here describes the measured data very well, with the PAS signal suppressed at high O2 mass fractions associated with a slow rate of quenching of O2(X, v > 0) energy into translational degrees of freedom of O2 bath gas molecules. The model agreement with the 514 nm PAS measurements is worse than that for the 405 and 658 nm channels, and considerations of the larger errors associated with the 514 nm PAS measurements (as described in Sect. 3.1) cannot fully reconcile these differences. Instead, this poorer agreement is likely to be a consequence of the requirement to constrain the four rate coefficients to be invariant with wavelength; as we discuss below, different vibrational states of O2(X, v > 0) are accessed as the photolysis wavelength is reduced below ∼550 nm that will affect relaxation rate constants. The calculated ratios and are also given in Table 1. Over all PAS wavelengths, the best fit of our model suggests that bath O2 is more effective at stabilising the formation of O3(, v > 0) by a factor of ∼11 compared to bath N2. However, there is significant uncertainty in the fit values of and , with a factor of 2 increase in either rate constant having little impact on the modelled PAS sensitivity. Reducing the uncertainty in this fit parameter requires more measurements of the PAS sensitivity at low O2 mass fractions (< 0.2) and reductions in the uncertainty in the O2 mass fraction measurement. Meanwhile, bath N2 is a factor of 1.68 more effective at quenching vibrational energy from O2(X, v > 0) into translation modes compared to bath O2. We also examine the relative contributions of the O(3P) and O2(X, v > 0) channels to the total PAS signal, with given in Table 1, while Fig. 3b shows the contributions of both species to the total modelled PAS sensitivity. Figure 3b shows that the signal contribution from quenching of energy from O(3P) decreases to zero as the bath gas composition tends towards that of pure N2. In this limit, the absence of O2 prevents the formation of O3(, and the characteristic relaxation time in Eq. (11) tends to infinity. The ratio ranges from 1.3 to 4.1 as the photolysis energy increases (wavelength decreases from 658 to 405 nm). This suggests that the fraction of energy that goes into vibrational modes of the nascent O2(X), compared to that partitioning to O(3P) kinetic energy, increases with decreasing wavelength.
Table 1Summary of the best fit parameters for the PAS sensitivity model described in the main text.
3.3 Understanding the best-fit rate constants for O2(X, v > 0) and ()
We begin by considering the quenching of O2(X, v > 0) before considering that of O3. First, we need to understand the vibrational energy distribution for the nascent O2(X, v > 0); the relaxation rate of O2 will depend on its vibrational state. Flöthmann et al. (1998) calculated the vibrational energy distribution of O2(X following the Chappuis band photodissociation. At a photolysis wavelength of ∼620 nm, the authors predicted that the vibrational energy distribution was Boltzmann-like, with the population of v=0 dominating the distribution and agreeing well with the experiments of Levene et al. (1987). However, a shoulder in this distribution develops as the wavelength decreases; at wavelengths in the range 450–500 nm, a significant population of v=4–8 is predicted, and higher v is accessed with decreasing wavelength. As the wavelength decreases further, we would expect v > 8 to be populated.
We now consider the rates of energy quenching from O2(X, v > 0) to bath gas molecules and how these depend on v. Indeed, this quenching can occur through V–T and vibration-to-vibration (V–V) energy transfer; while the bath gas translation energy generates acoustic pressure waves relevant to a photoacoustic measurement, V–V energy transfer could influence the vibrational state from which V–T energy transfer occurs. Coletti and Billing (2002) reported V–T and V–V rate constants for O2(X, v > 0) to O2 bath gas for v in the range 1–29. Meanwhile, Billing (1994) reported the V–T rate constants for O2(X, v) to N2 bath gas for v in the range 13–25, and Park and Slanger (1994) measured the associated V–V rates. These studies provide data for a temperature of 300 K, and the rate constants are plotted in Fig. 5. We note that the total rate constants (the sum of the V–T and V–V rate constants) for an O2 bath gas were validated by experimental measurements of Park and Slanger (1994) and Hickson et al. (1998). In a bath gas of pure O2 and for an initial nascent photoproduct O2(X, v) with v∼8 at wavelengths < 500 nm, the V–V rate constant ( cm3 s−1) is approximately 3 orders of magnitude higher than the V–T transfer rate ( cm3 s−1). Therefore, V–V energy transfer dominates and rapidly quenches O2(X, v=m) (with m > 0) to m⋅O2(X, v=1) via single quantum transfer steps on a characteristic timescale of ∼0.4–0.6 µs. Upon quenching all nascent O2(X, v) to the v=1 level, V–T energy transfer then becomes the only route to removing vibrational energy. For v=1, the V–T rate is cm3 s−1 and corresponds to a characteristic quenching timescale of ∼80 ms, i.e. ∼ 100 times slower than the PAS laser modulation period. Conversely, in a pure N2 bath gas and for an initial nascent photoproduct O2(X, v) with v∼8, the V–V rate is less than the V–T rate. For O2-to-N2 V–V energy transfer, the two quantum transition O2(X, v) + N2(X, ) → O2(X, v−2) + N2(X, ) is resonant at v=19 and gives rise to the maximum in the V–V rate shown in Fig. 5 (Park and Slanger, 1994), but this rate decreases rapidly as v departs from v=19. At v∼8, the V–V rate is cm3 s−1, and the V–T rate is cm3 s−1, with the latter rate estimated from an exponential fit to V–T rates available for v > 13 extrapolated to lower v (see Fig. 5). Assuming V–T energy transfer dominates at v∼8, energy is quenched into N2 bath gas translational modes on a characteristic timescale of ∼500 µs that is less (albeit only marginally) than the PAS modulation period (600–780 µs). We emphasise that there are large uncertainties in the V–T rates (Coletti and Billing, 2002 stated that the accuracies are worse than 25 %) and in the exact vibrational states of the initial O2(X, v) photoproducts. However, it is encouraging that we can reconcile our measured decrease in PAS sensitivity as the bath O2 mass fraction increases with calculated V–V and V–T rates. These rates predict a similar V–T quenching timescale to the PAS laser modulation period in pure N2 but much extended timescales (by a factor of ∼100) in pure O2. Moreover, Billing (1994) noted that the calculated V–T rates for O2(X, v) are about a factor of 2 larger for N2 bath gas compared to O2, that is in good agreement with our measurements that suggest .

Figure 5Calculated quenching rates of O2(X, v > 0) for V–T energy transfer to bath gas O2 (blue squares) or N2 (green circles), with variation in the vibrational quantum state. Also shown are the corresponding variations in V–V quenching rates of O2(X, v > 0) in a bath gas of O2 (blue diamonds) and N2 (green crosses). Data are taken from Billing (1994), Coletti and Billing (2002) and Park and Slanger (1994).
We now focus briefly on the quenching rates of O3 by bath gas O2 and N2 and the observation that the best-fit is ∼11. To the best of our knowledge, the quenching of the O3 is ill studied and there are no past measurements with which to compare our data. In studies of vibrational quenching of hot O3 (below the dissociation threshold), Ménard-Bourcin et al. (1991) and Zeninari et al. (2000) reported these rates in O2 and N2 bath gases to be identical within measurement uncertainties. As discussed above, our model is relatively insensitive to . Indeed, with further measurements of PAS sensitivity at lower O2 mass fractions and with reductions in the uncertainties in O2 mass fraction determinations (e.g. controlling the flow of the ozonised oxygen fraction into each channel directly with a MFC), should be retrieved to a higher accuracy, and might be found to be closer to unity.
3.4 Other possible routes to degrading the PAS sensitivity
We explored other possible mechanisms to account for the variation in PAS sensitivity with bath gas composition. In particular, Greenblatt et al. (1990) reported that the O2–O2 dimer has five sharp absorption bands between 446 and 630 nm. However, none of these absorption bands are predicted to contribute to extinction or absorption at our spectroscopic wavelengths (see Fig. 1 of Greenblatt et al., 1990). Moreover, the formation of the O2–O2 dimer increases strongly with increasing O2 concentration, while our CRDS-measured extinction does not demonstrate any increase as the bath gas O2 concentration increases. This can be seen in Fig. 2, in which the maximum values in the CRDS-measured extinction show no dependence on the bath gas O2 mass fraction. However, other authors should consider the influence of O2–O2 dimer absorption on their PAS measurements in the visible range, particularly when the CRDS measurement of extinction is performed at a different wavelength to that of the PAS measurement of absorption. In particular, we note that dimer absorption at wavelengths of 477.3, 532.2, 577.2 and 630.0 nm corresponds to significant absorption coefficients of 34.5, 5.5, 60.2 and 39.4 Mm−1 at atmospheric temperature and pressure for a gas of pure O2. Indeed, Fischer and Smith (2018) used a PAS channel operating at 532 nm that is close to a dimer absorption feature at 532.2 nm, while the authors' CRDS measurements were performed at λ=658 nm at which there is no dimer absorption contribution. The recommendation of Fischer and Smith that calibrations are performed in pure oxygen could be detrimental at some PAS wavelengths due to effects associated with O2–O2 dimer formation, and we have shown in this work that calibrations in pure oxygen are detrimental at wavelengths below ∼600 nm associated with inefficient V–T quenching of O2(X, v > 0) by bath O2.
We have studied the impact of bath gas composition on the PAS calibration coefficient determined using an ozone calibrant. We varied the ratio of O2:N2 concentrations of the bath gas and measured the PAS sensitivity for three photoacoustic spectrometers that operate at wavelengths of 405, 514 and 658 nm. Our measured variation in PAS sensitivity with O2 mass fraction at 658 nm is in excellent agreement with the measurements presented by Fischer and Smith (2018). However, at the shorter wavelengths of 405 and 514 nm (higher photolysis energies), we find that the PAS sensitivity decreases as the O2 mass fraction is increased above values of ∼0.3 (i.e. the approximate composition of ambient air). We have developed a model to explain these measured variations that fully accounts for the photodynamics of ozone in the Chappuis band. We find that the reduced sensitivity in the limit of pure N2 corresponds to the inefficient recombination of O(3P) with bath gas O2, while the reduced sensitivity in the limit of pure O2 corresponds to the inefficient quenching of energy from O2(X, v > 0) into translational degrees of freedom of bath O2 on the timescale of the PAS laser modulation period.
Importantly, we have demonstrated that the PAS sensitivity is optimised (i.e. biases are minimised) when the PAS calibration is performed in a bath gas with a composition corresponding to that of ambient air. In combination with the results of our previous publication demonstrating excellent agreement between expected and PAS-measured (using ozone calibrations with ambient bath gas compositions) aerosol absorption coefficient for a laboratory aerosol standard (Davies et al., 2018), we conclude that our methods for measuring aerosol absorption using an ozone-calibrated PAS are accurate and without detectable bias.
Another important aspect to our work is that our calibrations were performed at the PAS wavelength of 405 nm for which we have previously demonstrated excellent agreement between an aerosol-based and ozone-based calibration (Davies et al., 2018), while Bluvshtein et al. (2017) find that the ozone calibration differs from an aerosol calibration by a factor of 2. As discussed above, the calibrations in our work are performed by injecting an ozonised flow into ambient air, while those of Bluvshtein et al. (2017) are performed in a bath gas composed of 10 % O2 and 90 % N2. Our measurements predict only a 2 % difference in the PAS sensitivity at 405 nm for these two bath gas compositions. Therefore, we support the conclusion of Fischer and Smith (2018) that the low bath O2 mass fraction does not explain the poor ozone calibration results described by Bluvshtein et al. (2017).
We emphasise that the dependence of PAS sensitivity on bath gas composition is wavelength-dependent within the Chappuis band, particularly for wavelengths in the range 400–660 nm, and researchers should perform measurements of their PAS sensitivity to ascertain the optimal bath gas composition for their instrument. Furthermore, researchers must consider the impact of O2 dimer absorption on their measurements, particularly when the PAS and CRDS measurements of absorption are performed at different wavelengths.
Finally, we note that some PAS instruments (including our own) are designed to operate on aircraft platforms and measure aerosol absorption at high altitude where the ambient pressure is reduced to values as low as 400 hPa. One aspect not considered in the present work is the impact of pressure on quenching rate coefficients and the impact this has on PAS sensitivity. Therefore, future work will study the impact of pressure on the PAS sensitivity variation with bath gas composition.
For data related to this paper, please contact Michael I. Cotterell (m.cotterell@exeter.ac.uk) or Justin M. Langridge (justin.langridge@metoffice.gov.uk).
The authors declare that they have no conflict of interest.
This work was funded by the Met Office. Michael I. Cotterell and Jim M. Haywood thank the Natural Environment Research Council for support through the CLARIFY-2017 grant (NE/L013797/1). Michael I. Cotterell also acknowledges support from the Royal Society of Chemistry Analytical Chemistry Trust Fund through a Tom West Fellowship. Further support was provided by the Research Council on Norway via the projects AC/BC (240372) and NetBC (244141). We thank Michael N. R. Ashfold (University of Bristol) for useful discussions concerning the potential impacts of O2–O2 dimer formation on the measurements presented in this work.
This paper was edited by Mingjin Tang and reviewed by three anonymous referees.
Arnott, W. P., Moosmüller, H., Sheridan, P. J., A., O. J., Raspet, R., Slaton, W. V., Hand, J. L., Kreidenweis, S. M., and Collet Jr., J. L.: Photoacoustic and filter-based ambient aerosol light absorption measurements: Instrument comparisons and the role of relative humidity, J. Geophys. Res., 108, 4034, https://doi.org/10.1029/2002JD002165, 2003.
Billing, G. D.: VV and VT rates in N2-O2 collisions, Chem. Phys., 179, 463–467, https://doi.org/10.1016/0301-0104(94)87022-5, 1994.
Bluvshtein, N., Flores, J. M., He, Q., Segre, E., Segev, L., Hong, N., Donohue, A., Hilfiker, J. N., and Rudich, Y.: Calibration of a multi-pass photoacoustic spectrometer cell using light-absorbing aerosols, Atmos. Meas. Tech., 10, 1203–1213, https://doi.org/10.5194/amt-10-1203-2017, 2017.
Burkholder, J. B., Sander, S. P., Abbatt, J. P. D., Barker, J. R., Huie, R. E., Kolb, C. E., J., K. M., Orkin, V. V., Wilmouth, D. M., and Wine, P. H.: Chemical Kinetics and Photochemical Data for Use in Atmospheric Studies, Evaluation Number 18, JPL Publ., 2015.
Cappa, C. D., Lack, D. A., Burkholder, J. B., and Ravishankara, A. R.: Bias in Filter-Based Aerosol Light Absorption Measurements Due to Organic Aerosol Loading: Evidence from Laboratory Measurements, Aerosol Sci. Tech., 42, 1022–1032, https://doi.org/10.1080/02786820802389285, 2008.
Coletti, C. and Billing, G. D.: Vibrational energy transfer in molecular oxygen collisions, Chem. Phys. Lett., 356, 14–22, https://doi.org/10.1016/S0009-2614(02)00279-8, 2002.
Davies, N. W., Cotterell, M. I., Fox, C., Szpek, K., Haywood, J. M., and Langridge, J. M.: On the accuracy of aerosol photoacoustic spectrometer calibrations using absorption by ozone, Atmos. Meas. Tech., 11, 2313–2324, https://doi.org/10.5194/amt-11-2313-2018, 2018.
Davies, N. W., Fox, C., Szpek, K., Cotterell, M. I., Taylor, J. W., Allan, J. D., Williams, P. I., Trembath, J., Haywood, J. M., and Langridge, J. M.: Evaluating biases in filter-based aerosol absorption measurements using photoacoustic spectroscopy, Atmos. Meas. Tech. Discuss., https://doi.org/10.5194/amt-2018-411, in review, 2019.
Everest, M. A. and Atkinson, D. B.: Discrete sums for the rapid determination of exponential decay constants, Rev. Sci. Instrum., 79, 023108, https://doi.org/10.1063/1.2839918, 2008.
Feng, Y., Ramanathan, V., and Kotamarthi, V. R.: Brown carbon: A significant atmospheric absorber of solar radiation, Atmos. Chem. Phys., 13, 8607–8621, https://doi.org/10.5194/acp-13-8607-2013, 2013.
Fischer, D. A. and Smith, G. D.: Can ozone be used to calibrate aerosol photoacoustic spectrometers?, Atmos. Meas. Tech., 11, 6419–6427, https://doi.org/10.5194/amt-11-6419-2018, 2018.
Flöthmann, H., Beck, C., Schinke, R., Woywod, C., and Domcke, W.: Photodissociation of ozone in the Chappuis band. II. Time-dependent wave-packet calculations and interpretation of diffuse vibrational structures, J. Chem. Phys., 107, 7296–7313, https://doi.org/10.1063/1.474970, 1997.
Flöthmann, H., Schinke, R., Woywod, C., and Domcke, W.: Photodissociation of ozone in the Chappuis band. III. Product state distributions, J. Chem. Phys., 109, 2680–2684, https://doi.org/10.1063/1.476867, 1998.
Grebenshchikov, S. Y., Qu, Z., Zhu, H., and Schinke, R.: New theoretical investigations of the photodissociation of ozone in the Hartley, Huggins, Chappuis, and Wulf bands, Phys. Chem. Chem. Phys., 9, 2044–2064, https://doi.org/10.1039/b701020f, 2007.
Greenblatt, G. D., Orlando, J. J., Burkholder, J. B., and Ravishankara, A. R.: Absorption measurements of oxygen between 330 and 1140 nm, J. Geophys. Res., 95, 18577, https://doi.org/10.1029/JD095iD11p18577, 1990.
Haisch, C.: Photoacoustic spectroscopy for analytical measurements, Meas. Sci. Technol., 23, 012001, https://doi.org/10.1088/0957-0233/23/1/012001, 2012.
Hickson, K. M., Sharkey, P., Smith, I. W. M., Symonds, A. C., Tuckett, R. P., and Ward, G. N.: Formation and relaxation of O2(X) in high vibrational levels () in the photolysis of O3 at 266 nm, J. Chem. Soc. Farad. T., 94, 533–540, https://doi.org/10.1039/a707569c, 1998.
Kosterev, A. A., Mosely, T. S., and Tittel, F. K.: Impact of humidity on quartz-enhanced photoacoustic spectroscopy based detection of HCN, Appl. Phys. B-Lasers O., 85, 295–300, https://doi.org/10.1007/s00340-006-2355-2, 2006.
Lack, D. A., Lovejoy, E. R., Baynard, T., Pettersson, A., and Ravishankara, A. R.: Aerosol Absorption Measurement using Photoacoustic Spectroscopy: Sensitivity, Calibration, and Uncertainty Developments, Aerosol Sci. Tech., 40, 697–708, https://doi.org/10.1080/02786820600803917, 2006.
Lack, D. A., Cappa, C. D., Covert, D. S., Baynard, T., Massoli, P., Sierau, B., Bates, T. S., Quinn, P. K., Lovejoy, E. R., and Ravishankara, A. R.: Bias in filter-based aerosol light absorption measurements due to organic aerosol loading: Evidence from ambient measurements, Aerosol Sci. Tech., 42, 1033–1041, https://doi.org/10.1080/02786820802389277, 2008.
Lack, D. A., Richardson, M. S., Law, D., Langridge, J. M., Cappa, C. D., McLaughlin, R. J., and Murphy, D. M.: Aircraft Instrument for Comprehensive Characterization of Aerosol Optical Properties, Part 2: Black and Brown Carbon Absorption and Absorption Enhancement Measured with Photo Acoustic Spectroscopy, Aerosol Sci. Tech., 46, 555–568, https://doi.org/10.1080/02786826.2011.645955, 2012.
Levene, H. B., Nieh, J., and Valentini, J. J.: Ozone visible photodissociation dynamics, J. Chem. Phys., 87, 2583–2593, https://doi.org/10.1063/1.453097, 1987.
Lin, G., Penner, J. E., Flanner, M. G., Sillman, S., Xu, L., and Zhou, C.: Radiative forcing of organic aerosol in the atmosphere and on snow: Effects of SOA and brown carbon, J. Geophys. Res.-Atmos., 119, 7453–7476, https://doi.org/10.1002/2013JD021186, 2014.
Ménard-Bourcin, F., Ménard, J., and Doyennette, L.: Vibrational relaxation of ozone in O3–O2 and O3–N2 gas mixtures from infrared double-resonance measurements, J. Chem. Phys., 94(3), 1875–1881, https://doi.org/10.1063/1.459961, 1991.
Miklós, A., Hess, P., and Bozóki, Z.: Application of acoustic resonators in photoacoustic trace gas analysis and metrology, Rev. Sci. Instrum., 72, 1937–1955, https://doi.org/10.1063/1.1353198, 2001.
Miles, R. E. H., Rudic, S., Orr-Ewing, A. J., and Reid, J. P.: Sources of error and uncertainty in the use of cavity ring down spectroscopy to measure aerosol optical properties, Aerosol Sci. Tech., 45, 1360–1375, https://doi.org/10.1080/02786826.2011.596170, 2011.
Moosmüller, H., Chakrabarty, R. K., and Arnott, W. P.: Aerosol light absorption and its measurement: A review, J. Quant. Spectrosc. Ra., 110, 844–878, https://doi.org/10.1016/j.jqsrt.2009.02.035, 2009.
Park, H. and Slanger, T. G.: O2 (X, v=8–22) 300 K quenching rate coefficients for O2 and N2 , and O2 (x) vibrational distribution from 248 nm O3 photodissociation, J. Chem. Phys., 100, 287–300, https://doi.org/10.1063/1.466997, 1994.
Sedlacek, A. and Lee, J.: Photothermal interferometric aerosol absorption spectrometry, Aerosol Sci. Tech., 41, 1089–1101, https://doi.org/10.1080/02786820701697812, 2007.
Siebert, R., Fleurat-Lessard, P., Schinke, R., Bittererová, M., and Farantos, S. C.: The vibrational energies of ozone up to the dissociation threshold: Dynamics calculations on an accurate potential energy surface, J. Chem. Phys., 116, 9749–9767, https://doi.org/10.1063/1.1473664, 2002.
Stier, P., Seinfeld, J. H., Kinne, S., and Boucher, O.: Aerosol absorption and radiative forcing, Atmos. Chem. Phys., 7, 5237–5261, https://doi.org/10.5194/acp-7-5237-2007, 2007.
Tian, G., Moosmüller, H., and Arnott, W. P.: Influence of photolysis on multispectral photoacoustic measurement of nitrogen dioxide concentration, J. Air Waste Manage., 63, 1091–1097, https://doi.org/10.1080/10962247.2013.790323, 2013.
Virkkula, A., Ahlquist, N. C., Covert, D. S., Arnott, W. P., Sheridan, P. J., Quinn, P. K., and Coffman, D. J.: Modification, calibration and a field test of an instrument for measuring light absorption by particles, Aerosol Sci. Tech., 39, 68–83, https://doi.org/10.1080/027868290901963, 2005.
Zalicki, P. and Zare, R. N.: Cavity ring-down spectroscopy for quantitative absorption measurements, J. Chem. Phys., 102, 2708–2717, https://doi.org/10.1063/1.468647, 1995.
Zeninari, V., Tikhomirov, B. A., Ponomarev, Y. N., and Courtois, D.: Photoacoustic measurements of the vibrational relaxation of the selectively excited ozone (v3) molecule in pure ozone and its binary mixtures with O2, N2, and noble gases, J. Chem. Phys., 112, 1835–1843, https://doi.org/10.1063/1.480747, 2000.