the Creative Commons Attribution 4.0 License.
the Creative Commons Attribution 4.0 License.
 | 13 Jun 2019
Two-wavelength thermal–optical determination of light-absorbing carbon in atmospheric aerosols
Alessandro Altomari
Virginia Vernocchi
Paolo Prati
Thermal–optical analysis is widely adopted for the quantitative determination of total (TC), organic (OC), and elemental (EC) carbon in atmospheric aerosol sampled by suitable filters. Nevertheless, the methodology suffers from several uncertainties and artifacts such as the well-known issue of charring affecting the OC–EC separation. In the standard approach, the effect of the possible presence of brown carbon, BrC, in the sample is neglected. BrC is a fraction of OC, usually produced by biomass burning with a thermic behavior intermediate between OC and EC. BrC is optically active: it shows an increasing absorbance when the wavelength moves to the blue–UV region of the electromagnetic spectrum. Definitively, the thermal–optical characterization of carbonaceous aerosol should be reconsidered to address the possible BrC content in the sample under analysis.
We introduce here a modified Sunset Lab Inc. EC–OC analyzer. Starting from a standard commercial instrument, the unit has been modified at the physics department of the University of Genoa (Italy), making possible the alternative use of the standard laser diode at λ=635 nm and of a new laser diode at λ=405 nm. In this way, the optical transmittance through the sample can be monitored at both wavelengths. Since at shorter wavelengths the BrC absorbance is higher, a better sensitivity to this species is gained. The modified instrument also gives the possibility to quantify the BrC concentration in the sample at both wavelengths. The new unit has been thoroughly tested, with both artificial and real-world aerosol samples: the first experiment, in conjunction with the multi-wavelength absorbance analyzer (MWAA; Massabò et al., 2013, 2015), resulted in the first direct determination of the BrC mass absorption coefficient (MAC) at λ=405 nm: MAC m2 g−1.
- Article
(2554 KB) - Full-text XML
- BibTeX
- EndNote


Light-absorbing carbon (LAC) is the fraction of carbonaceous aerosol that can absorb electromagnetic radiation in the visible or near-visible range (Pöschl, 2003; Bond and Bergstrom, 2006; Moosmüller et al., 2009; Ferrero et al., 2018). A wide literature investigates and characterizes the optical properties of the inorganic-refractory LAC fraction, usually referred as black carbon, BC (e.g., Bond et al., 2013, and references therein), which is strongly absorbing from UV to infrared (IR) ranges, with a weak dependence on wavelength (Bond and Bergstrom, 2006; Moosmüller et al., 2009). Much less studied and understood is the organic LAC, often labeled as brown carbon (BrC), which appears to be optically active at wavelengths shorter than 650 nm and with an increasing absorbance moving to the blue and ultraviolet (UV) range (Pöschl, 2003; Andreae and Gelencsér, 2006; Moosmüller et al., 2011; Laskin et al., 2015; Olson et al., 2015). BrC can therefore be considered to be the “optically active” part of the OC dispersed in the atmosphere. When considered from a thermochemical point of view, BrC also shows a refractory behavior since, in an inert atmosphere, it volatizes at temperatures greater than 400 ∘C only (Chow et al., 2015). A discussion on the primary and secondary sources of atmospheric LAC is outside the scope of the present work; we simply remind the reader that primary BrC is produced mainly by biomass burning even if, in some cases, incomplete combustion of fossil fuels used in transport activities (i.e., terrestrial vehicles, ships and aircrafts) can also generate this kind of compound (Corbin et al., 2018). It is also worth underlining that carbonaceous aerosols impact human health (Pope and Dockery, 2006; Chow et al., 2006; Mauderly and Chow, 2008), as well as climate and environment (Bond and Sun, 2005; Highwood and Kinnersley, 2006; Chow et al., 2010).
In the wider landscape of atmospheric carbonaceous aerosol, despite a worldwide diffused effort, the situation is not satisfactory and a standardized and conclusive approach is still missing. The quantitative determination of total, organic, and elemental carbon (TC, OC, and EC) is often performed by a thermal–optical analysis (Birch and Cary, 1996; Watson et al., 2005; Hitzenberger et al., 2006) of aerosol samples collected on quartz-fiber filters. However, thermal–optical analyses are affected by several issues and artifacts (Yang and Yu, 2002; Chow et al., 2004) and different laboratories/agencies adopt protocols which systematically result in discrepancies, particularly large in the EC quantification (Birch and Cary, 1996; Chow et al., 2007; Cavalli et al., 2010). A further issue arises when the effects of the possible presence of BrC in the sample are taken into account. So far, the monitoring of the sample transmittance during the thermal cycle has been introduced to correct for the well-known charring effect and the formation of pyrolytic carbon (Birch and Cary, 1996). This implies that BC is the sole absorbing compound at the wavelength implemented in the thermal–optical analyzer (for instance at λ=635 nm, the wavelength of the laser diode mounted in the extremely diffused Sunset Lab. Inc. EC–OC analyzer). Basically, with a sizeable concentration of BrC in the sample, one of the key assumptions of the thermal–optical methods fails and the EC–OC separation is even more unstable (not to say that, by design, the BrC quantification is not possible). This issue was preliminarily addressed by Chen et al. (2015) by a multi-wavelength thermal–optical reflectance and thermal–optical transmittance (TOR–TOT) instrument (thermal spectral analysis – TSA) and further investigated in Massabò et al. (2016). In the latter work, a method to correct the results of a standard Sunset analyzer and to retrieve the BrC concentration in the sample was introduced. The achievement was possible thanks to a synergy with the information provided by the multi-wavelength absorbance analyzer, MWAA (Massabò et al., 2015) developed in the same laboratory. A further step towards BrC quantification through the utilization of TSA was discussed in Chow et al. (2018), where it was proven that the use of seven wavelengths in thermal–optical carbon analysis allows contributions from biomass burning and secondary organic aerosols to be estimated. It is worth noting that the biomass burning contribution to PM concentration can also be estimated by other methods such as aerosol mass spectrometry, AMS (Daellenbach et al., 2016).
The MWAA approach allows the determination of the spectral dependence of the aerosol absorption coefficient (babs), which can be generally described by the power-law relationship babs (λ) ∼ λ−AAE, where AAE is the Ångström absorption exponent. Several works reported AAE values which depend on the aerosol chemical composition (Kirchstetter et al., 2004; Utry et al., 2013) as well as its size and morphology (Lewis et al., 2008; Lack et al., 2012; Lack and Langridge, 2013; Filep et al., 2013; Utry et al., 2014). Furthermore, the spectral dependence of the aerosol has been exploited to identify different sources of carbonaceous aerosol (e.g., Sandradewi et al., 2008; Favez et al., 2010; Lack and Langridge, 2013; Massabò et al., 2013, 2015). In general, AAE values close to 1.0 have been found to be related to urban PM where fossil fuel combustion is dominant, while higher AAE values, up to 2.5, have been linked to carbonaceous aerosols produced by wood burning (Harrison et al., 2013, and references therein) and therefore to the presence of BrC.
In previous work by Massabò et al. (2016) the effect of the BrC possibly contained in the sample on the thermal–optical analysis was quantified and exploited to retrieve the BrC concentration from the raw data provided by a standard Sunset Lab analyzer. This first step, suggested modifying/upgrading a Sunset unit by adding the possibility to use a second laser diode in the blue range. This improves the sensitivity to the BrC and allows us to check whether the BrC quantification depends on the adopted wavelength. We finally followed this route and we here introduce our modified Sunset analyzer unit, the validation tests, and the results of the first campaign in which the new unit was deployed.
2.1 The 2-lambda Sunset analyzer
We have modified a commercial thermal–optical transmittance (TOT) instrument (Sunset Lab Inc.). This equipment had been originally designed (Birch and Cary, 1996) with a red laser diode (λ=635 nm) to have the possibility to monitor and correct the well-known problem of the formation of pyrolytic carbon by charring (Birch and Cary, 1996; Bond and Bergstrom, 2006; Chow et al., 2007; Cavalli et al., 2010). The assumption that OC is optically inactive at wavelengths greater than 600 nm is at the basis of the technique; therefore the laser beam attenuation is only due to the EC originally present or formed by charring in the sample under analysis. Actually, even at this wavelength, BrC can affect the reliability of the OC/EC separation and the standard methodology can be modified to quantify the BrC concentration (Massabò et al., 2016). Nevertheless, at λ=635 nm the BrC mass absorption coefficient, MAC(BrC), remains much smaller than the corresponding MAC(BC) and the modified procedure could/should be implemented at shorter wavelengths to gain in sensitivity.
We have modified our Sunset unit by making possible the alternative use of the standard laser diode at λ=635 nm or of a World Star Technologies, 100 mW, laser diode at λ=405 nm. This second laser diode can be mounted on the top of the Sunset furnace by a homemade adapter (see Fig. 1) and easily exchanged with the native red diode. With the new laser diode, the light detector placed at the bottom of the Sunset furnace has to be changed too and we selected a photodiode (PD) Thorlabs FDS1010 coupled with a bandpass filter Thorlabs FBH405-10. The responsivity of the PD FDS1010 around λ=400 nm is quite low (about 50 mA W−1) but the high power delivered by the laser diode results in signals with an amplitude comparable to the values measured with the original Sunset setup (i.e., laser diode and PD). Furthermore, the FBH405-10 filter cuts all the light background produced by the high temperature of the Sunset furnace, thus preserving the signal-to-noise ratio. Both laser and PD can be exchanged in about 10 min and no particular attention is requested other than the proper alignment to maximize the PD output signal (i.e., the transmittance value displayed by the Sunset control software). We have to note that the original configuration of the Sunset instrument adopts a lock-in amplifier to improve the signal-to-noise ratio of the PD: we did not have the possibility to manipulate the parameters of the lock-in amplifier and to tune it to the new configuration.
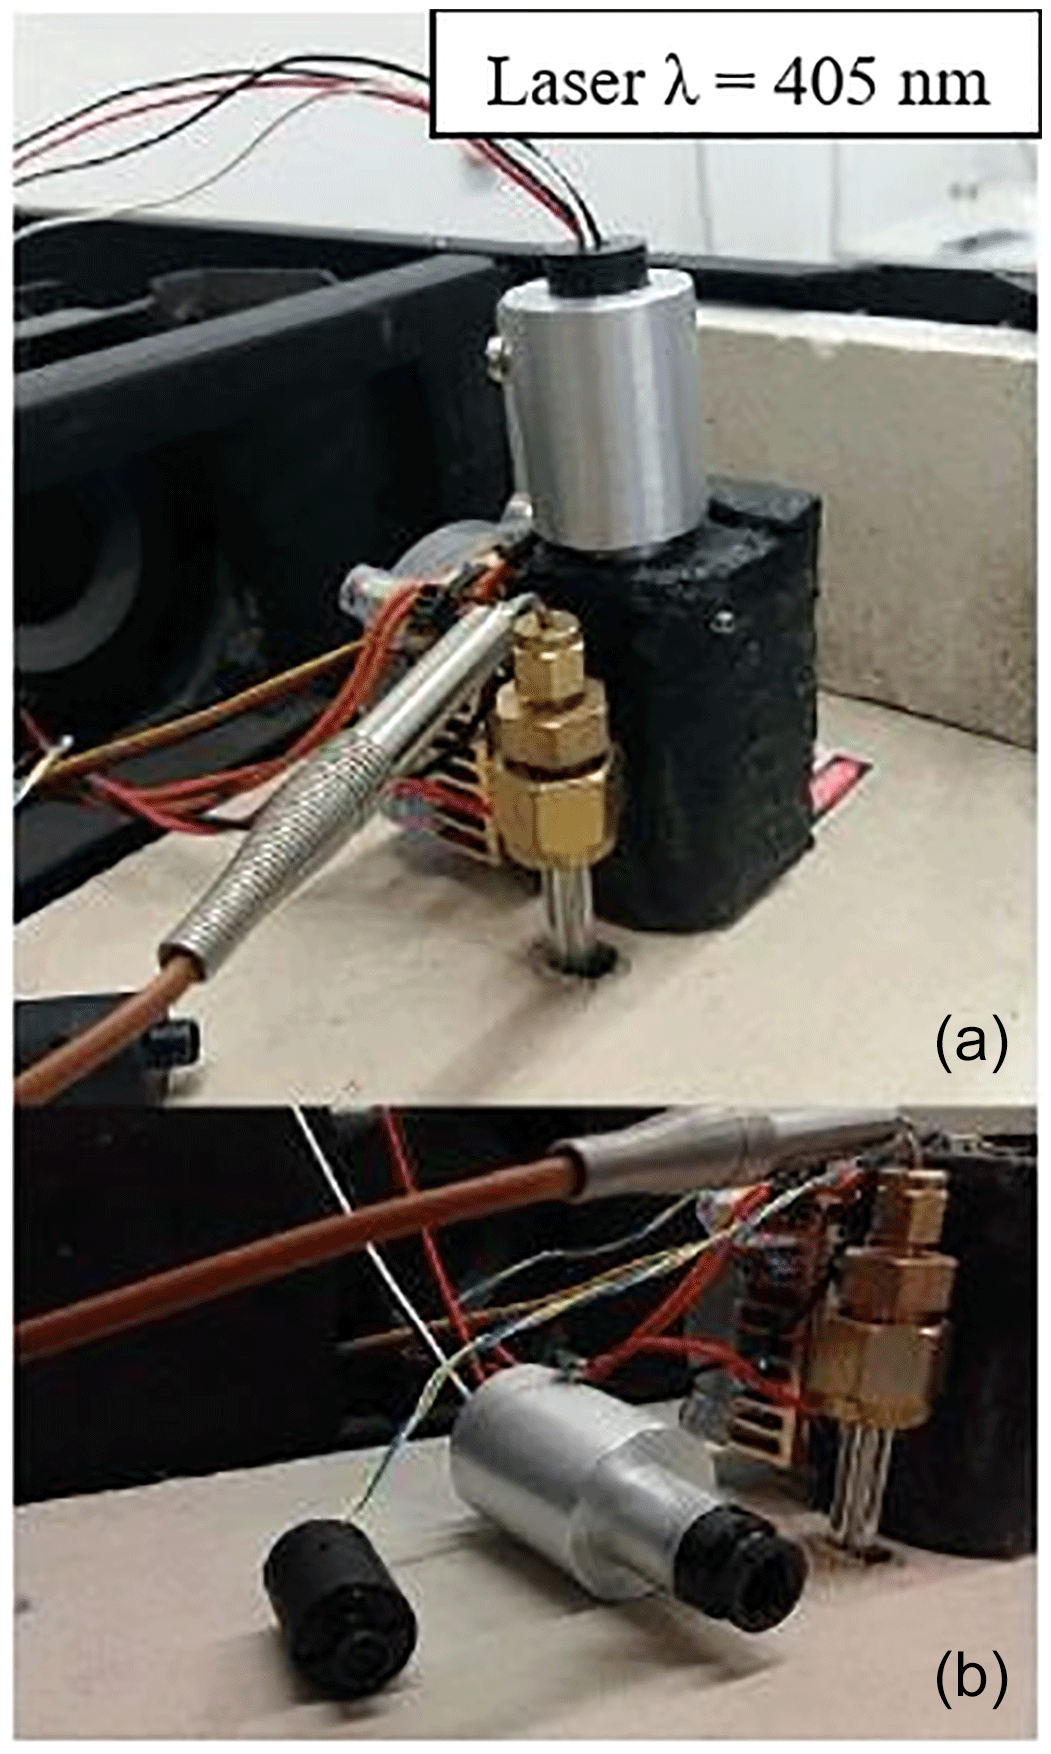
Figure 1The new λ=405 nm laser diode mounted by a steel adapter on the Sunset furnace (a) and comparison with the standard λ=635 nm laser diode implemented by the manufacturer (b).
2.2 Test of the new configuration
The new blue-light setup of the Sunset analyzer was tested using both synthetic and real-world aerosol samples, collected on quartz-fiber filters. Synthetic samples were prepared starting with a 5 % (volume) solution of Aquadag, then nebulized by a Blaustein atomizer (BLAM), and collected on quartz-fiber filters. Aquadag is the trade name of a water-based colloidal graphite coating (particle diameters between 50 and 100 nm): these samples can therefore be considered to be composed of EC–BC only. The samples were first sent to an optical characterization by the MWAA instrument (Massabò et al., 2015), which demonstrated that the optical absorption of Aquadag is independent of the wavelength. Actually, Aquadag particles tend to form conglomerates on the filter surface, with dimensions about double the longer wavelength implemented in the MWAA (i.e., 850 nm of the infrared laser diode; Massabò et al., 2015). So, the comparison between the new blue-light and original Sunset setups was made with samples having the same absorption properties. EC and TC quantifications obtained at λ=635 and λ=405 nm were in excellent agreement for both the NIOSH5040 and EUSAAR_2 protocols (Cavalli et al., 2010), as shown in Fig. 2 for the whole set of synthetic samples.
A second set of synthetic samples was prepared to mimic the behavior of real-world aerosol samples: a 3 % (weight) solution of ammonium sulfate (NH4)2SO4 in Aquadag was prepared and nebulized with the BLAM. This way, a scattering compound is mixed to the absorbing Aquadag spherules. The optical absorption measured with MWAA was independent of wavelength with this second set of samples too. The results of the Sunset analysis with both the red and blue laser setups are shown in Fig. 3. This second set of samples was analyzed through the EUSAAR_ 2 protocol only: we used two punches for each laser in each sample to have a reproducibility check. A strong correlation between the TC and EC values measured in red and blue light was obtained again with a slope close to unity.
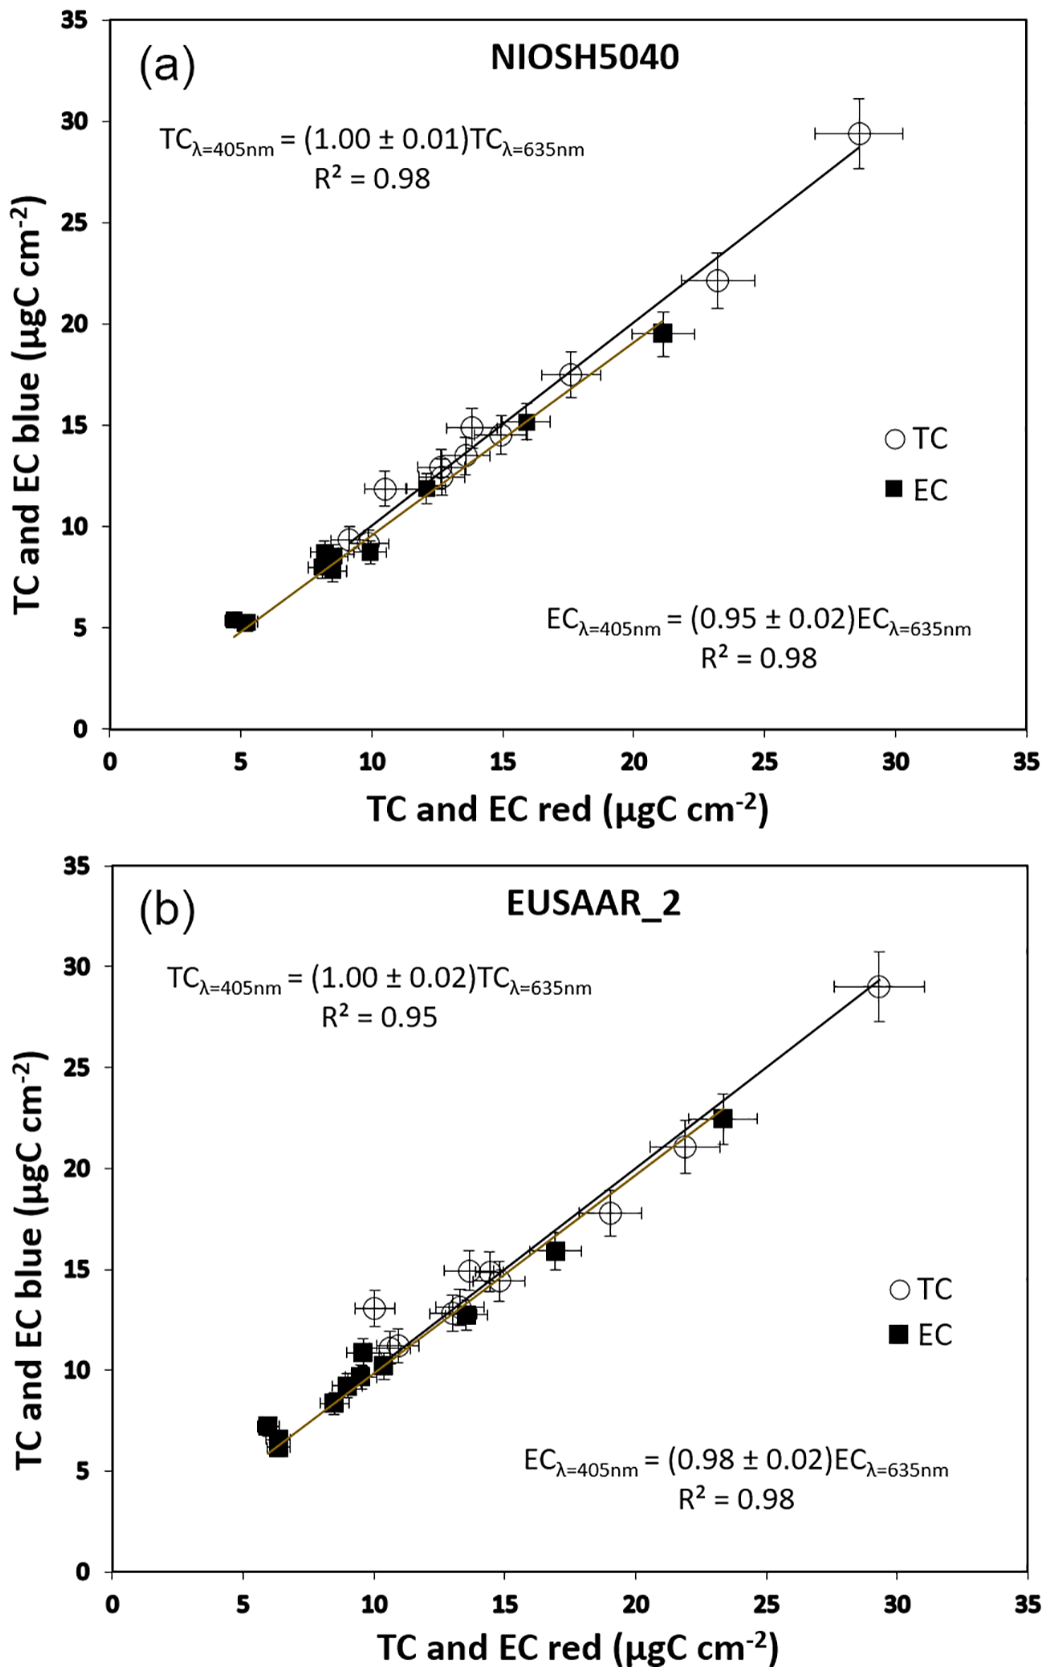
Figure 2Quantification of TC and EC at λ=635 (red) and λ=405 nm (blue) for the set of synthetic Aquadag samples. (a) NIOSH5040 protocol; (b) EUSAAR_2 protocol.
A third and final test was performed using a set of daily PM10 samples collected by a low-volume sampler (TCR – Tecora, Italy) on quartz-fiber filters (Pall-2500 QAO-UP, 47 mm diameter) in spring 2016 in the urban area of the city of Genoa (Italy). A previous and long set of similar campaigns addressing PM10 characterization (e.g., Bove et al., 2014, and references therein) in the same urban area could not identify a sizeable contribution from biomass burning to PM composition, in particular during spring and summer. Such a situation was confirmed by the determination of the Ångström exponent in the present samples by the MWAA. Actually, in the set of 20 PM10 samples, the values of the Ångström exponent ranged between 0.9 and 1.2, confirming that black carbon is the sole or totally dominant light-absorbing component in the local PM10 (Sandradewi et al., 2008; Harrison et al., 2013). Half of the samples were then sent to Sunset analysis by the NIOSH5040 protocol while the EUSAAR_2 protocol was adopted for the remaining subset of samples. The results are shown in Fig. 4. The EC concentration values measured with the standard and modified Sunset analyzers are fully compatible when the NIOSH5040 protocol is adopted (basically, the split point position in the Sunset thermogram does not change with the two laser diodes). Instead, EC values determined by the EUSAAR_2 protocol resulted in about 30 % lower values when the blue laser diode was mounted. This corresponds to a shift of the split point position, which moves rightward and thus increases the amount of carbonaceous aerosol counted in the OC fraction. This effect is linked to the well-known issue of the formation of pyrolytic carbon during the thermal cycle in the inert atmosphere (i.e., in He). Several literature studies (e.g., Cavalli et al., 2010; Panteliadis et al., 2015) indicated that the charring is smaller at the higher temperatures reached during the NIOSH thermal protocol. In the other protocol, standard thermal–optical analyses of urban PM samples often give higher EC values (up to 50 %) when performed following the EUSAAR_2 instead of higher-temperature protocols (Subramanian et al., 2006; Zhi et al., 2008; Piazzalunga et al., 2011; Karanasiou et al., 2015; Panteliadis et al., 2015). Furthermore, as a by-product of previous PM10 studies in the urban area of Genoa by a standard Sunset unit, we could observe a systematic and very reproducible 40 % discrepancy between EC values determined in the same samples by EUSAAR_2 and NIOSH5040 protocols (with EC: EUSAAR > EC: NIOSH). Therefore, the thermal–optical analysis in blue light seems to be more sensitive to the charring formation during the EUSAAR_2 protocol.
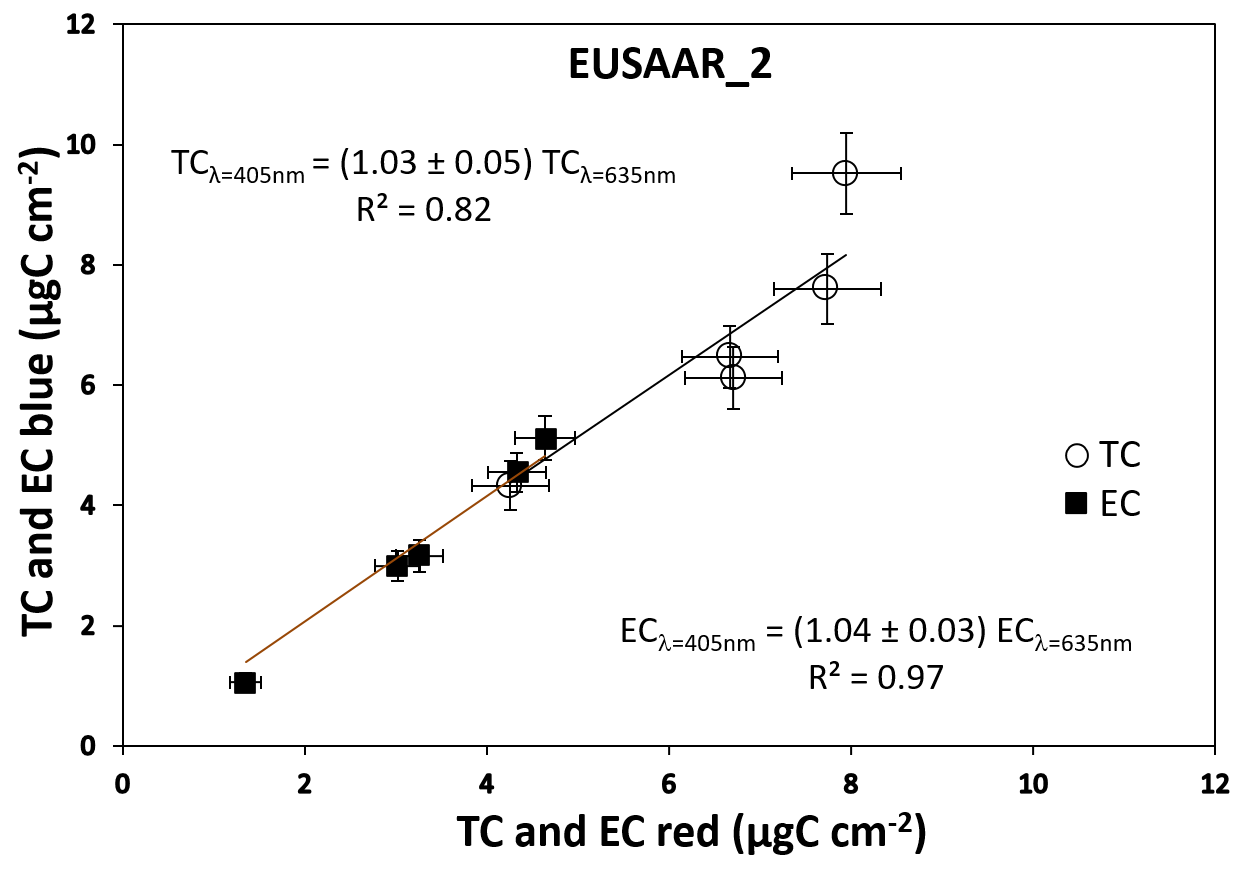
Figure 3Quantification of TC and EC at λ=635 (red) and λ=405 nm (blue) for the set of synthetic Aquadag + ammonium sulfate samples by the EUSAAR_2 protocol.
The modified Sunset instrument was used for the first time, in conjunction with the MWAA instrument and apportionment methodology (Massabò et al., 2015), to retrieve the MAC (mass absorption coefficient) of brown carbon at the two wavelengths of λ=635 and λ=405 nm, in a set of samples collected during wintertime at a mountain site.
3.1 Sample collection
Aerosol samples were collected in a small village (Propata, 44∘33′52.93′′ N, 9∘11′05.57′′ E, 970 m a.s.l.) situated in the Ligurian Apennines, Italy. Three different sets of PM10 aerosol samples were collected by a low-volume sampler (38.3 L min−1 by TCR Tecora): the first and the third sets had a filter change set every 24h while the second set was sampled on a 48 h basis. In total, 41 () PM10 samples were collected on quartz-fiber filters (Pall, 2500QAO-UP, 47 mm diameter), between 2 February and 19 April 2018. Before the sampling, the filters were baked at T=700 ∘C for 2 h to remove possible internal contamination. Field blank filters were used to monitor possible contaminations during the sampling phase. Wood burning is one of the PM sources around the sampling site, especially during the cold season, as it is used for both domestic heating and cooking purposes.
3.2 Laboratory analyses
All filters were weighed before and after sampling in an air-conditioned room ( ∘C; R.H. %), after 48 h conditioning. The gravimetric determination of the PM mass was performed using an analytical microbalance (precision: 1 µg), which was operated inside the conditioned room; electrostatic effects were avoided by the use of a deionizing gun.
After weighing, samples were first optically analyzed by MWAA to retrieve the absorption coefficient (babs) of PM at five different wavelengths. The EC and OC determination was performed adopting the EUSAAR_2 protocol (Cavalli et al., 2010) with both laser diodes at λ=635 and at λ=405 nm (two different punches were extracted from each filter sample).

Figure 4EC concentration measured in two subsets of PM10 samples collected in consecutive days in the urban area of Genoa in late spring 2016. Values determined with the Sunset analyzer equipped with blue and red laser diodes are compared.
Finally, the remaining portion of the same quartz-fiber filters underwent a chemical determination of the levoglucosan (1,6-Anhydro-beta-glucopyranose) concentration by high-performance anion exchange chromatographer coupled with pulsed amperometric detection (Piazzalunga et al., 2010). As is well-known in literature, this sugar is one of the typical markers of biomass burning (Vassura et al., 2014).
3.3 Optical apportionment
The MWAA provided the raw data to measure the spectral dependence of the aerosol absorption coefficient (babs), which can be generally described by the power-law relationship babs (λ) ∼ λ−AAE, where AAE is the Ångström absorption exponent.
The time series of the resulting AAE values is shown in Fig. 5: they range between 1.05 and 1.96 with a mean value of 1.55±0.21. This figure indicates a substantial presence of wood burning in the sampling area. In Massabò et al. (2015) and Bernardoni et al. (2017), an optical apportionment model (the “MWAA model”) based on the measurement of babs at five wavelengths had been introduced to directly obtain the BrC AAE (αBrC) and the BrC absorption coefficient () at each measured wavelength. It is worth noting that, at the basis of the MWAA model, there is the assumption that BrC is produced by wood combustion only (see Sect. 4 in Massabò et al., 2015; Zheng et al., 2013). In Fig. 5, we report the optical apportionment at λ=635 and at λ=405 nm, i.e., at the wavelength of the two laser diodes used in our modified Sunset instrument. At λ=635 nm, light absorption resulted mainly due to BC from both fossil fuel (FF) and wood burning (WB), and the average value is 15 % of total babs, with the notable exception of some days on which it reached values of ∼30 %, in correspondence with AAE > 1.9. Instead, at λ=405 nm, the BrC contribution to light absorption increases up to 33 % (average percentage of total babs), with a maximum value of 51 %, again when AAEexp > 1.9. The time series of values at both wavelengths turned out to be well correlated (R2=0.71) with the levoglucosan (levo, in the following) concentration values, as reported in Fig. 6. The slope of the correlation curve increases by a factor of 5.8 when moving from the red to the blue light.
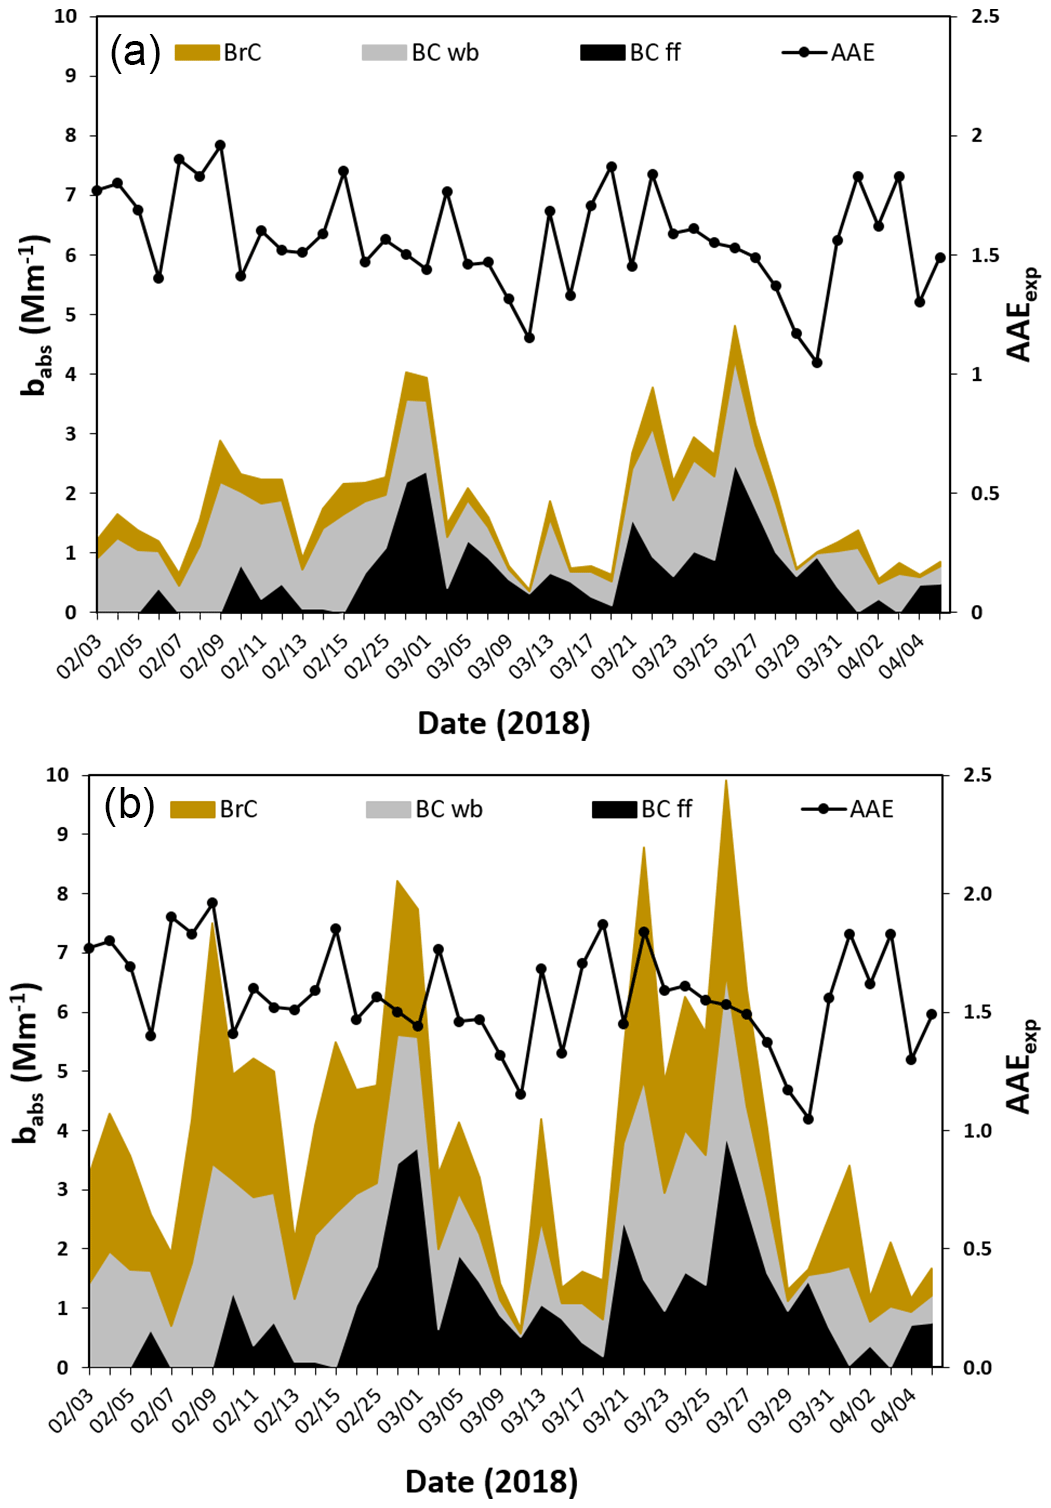
Figure 5Primary axis: optical apportionment of the aerosol absorption coefficient (babs) at λ=635 (a) and λ=405 nm (b). Secondary axis: experimental AAE (AAEexp) values obtained by fitting the measured babs values with a power-law relationship babs (λ) . FF and WB stand for fossil fuel and wood burning, respectively.
The average αBrC value turned out to be , in very good agreement with a previous value () obtained in the same site and with the same approach (Massabò et al., 2016). The result is also in agreement with other literature (Yang et al., 2009; Massabò et al., 2015; Chen et al., 2015).
3.4 Brown carbon MAC
The methodology to extract the MAC value for BrC by the coupled use of MWAA and thermal–optical analysis has been introduced in a previous work (Massabò et al., 2016). In that case, a standard (i.e., with a red laser diode only) Sunset unit was used. The entire procedure is described in detail in Massabò et al. (2016); here we briefly summarize the main steps.
- a.
The fraction of light attenuation due to the BrC is first calculated in each sample with the MWAA raw data.
- b.
The empirical relationship between the light attenuation through the sample, observed in the MWAA and in the Sunset analyzer and at both wavelengths, is then determined. We remind the reader that in the Sunset measurement, the light attenuation is continuously recorded during the analysis; the value characteristic of each blank filter can be retrieved when all the light-absorbing PM has been volatized (i.e., at the end of the thermal protocol).
- c.
The fraction of light attenuation due to the BrC in the sample is therefore calculated for the Sunset analysis and the initial transmittance value is corrected to estimate the attenuation value that would have been found if BrC were not present in the filter sample.
- d.
A new split-point position is then determined taking into account the corrected value of the initial transmittance.
- e.
The OC and EC values determined with the standard and corrected split-point positions are then compared and the difference (OCcor – OCstd= ECstd – ECcor) is operatively assumed to be equal to the BrC in the sample. The corresponding BrC atmospheric concentration is finally calculated.
- f.
The correlation between the values of , provided by the MWAA analysis (see Sect. 3.3) and BrC concentration, is studied to determine the MAC value.
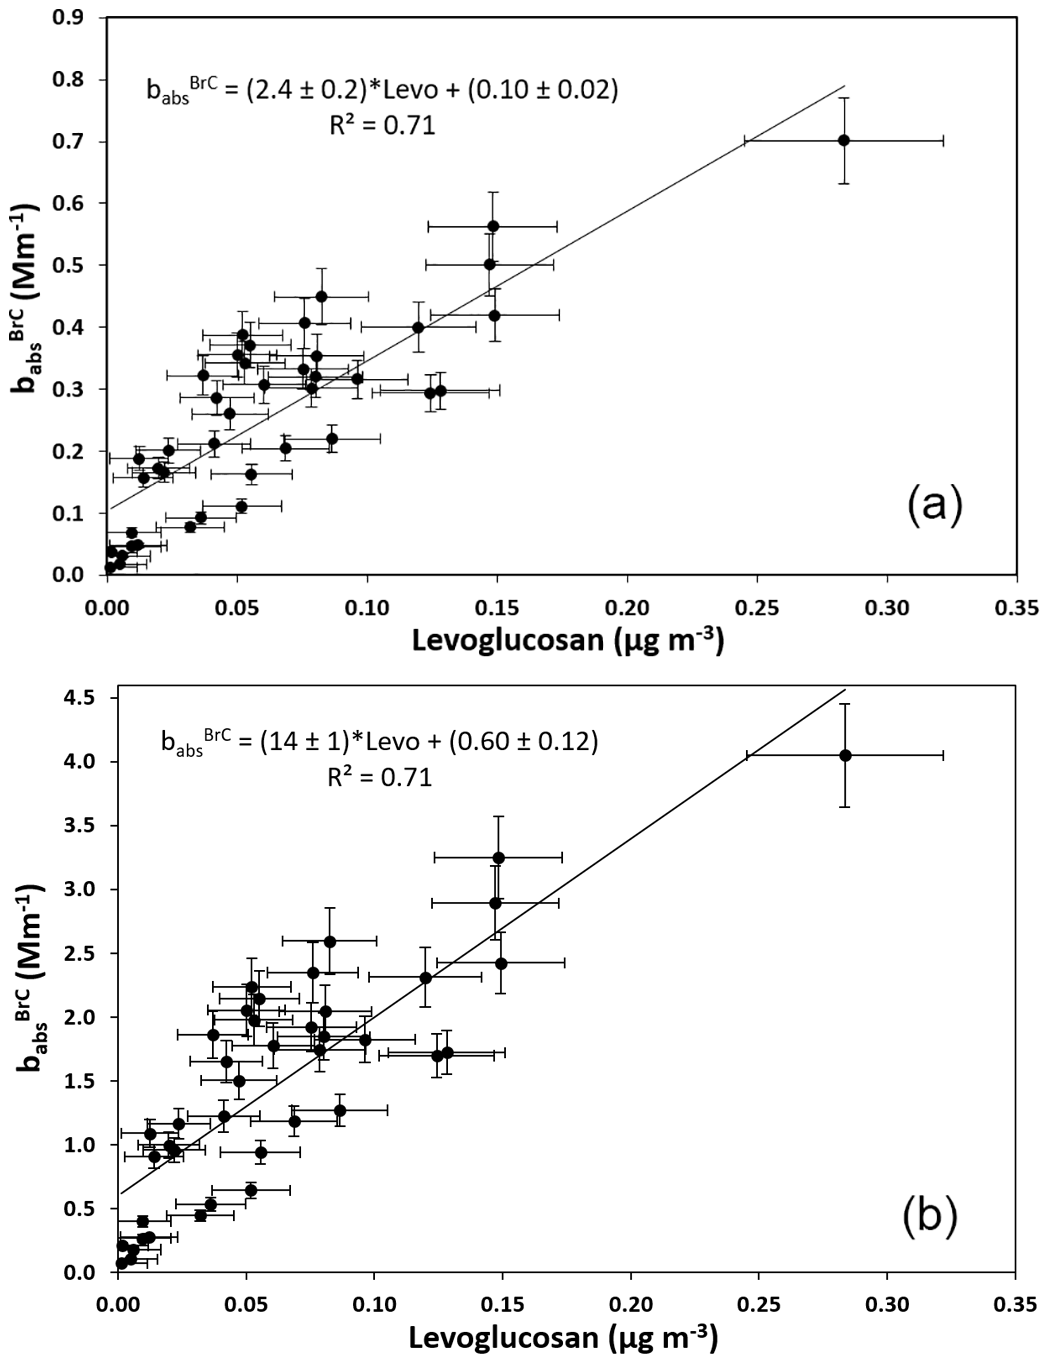
Figure 6Aerosol absorption coefficient apportioned to brown carbon () at λ=635 (a) and at λ=405 nm (b) vs. levoglucosan concentration.
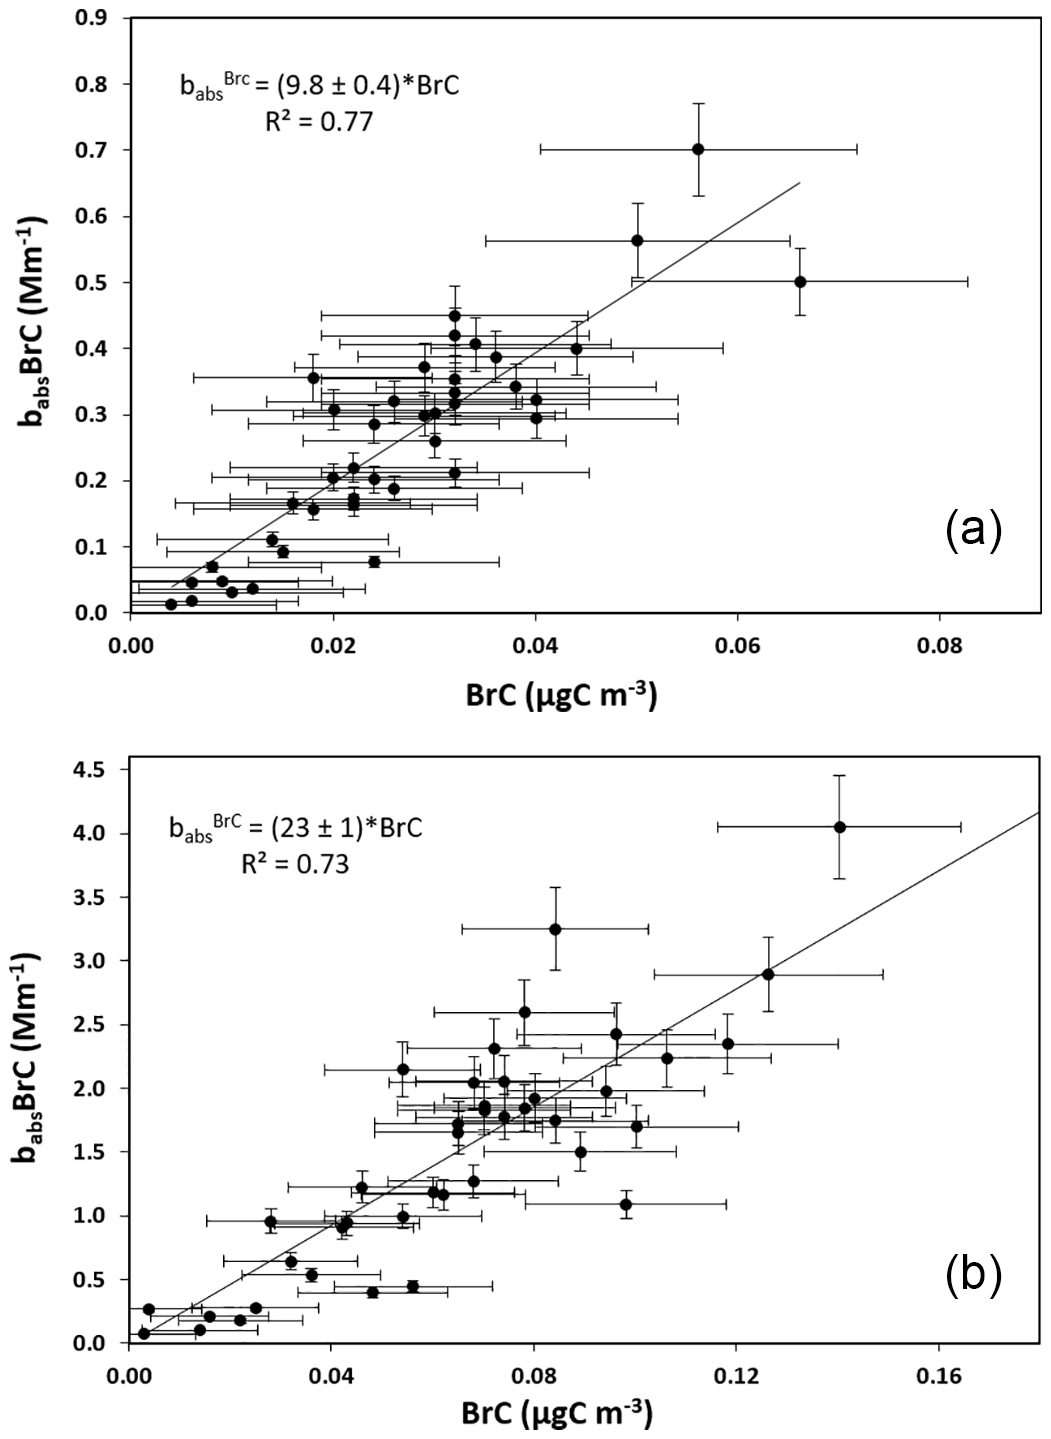
Figure 7Comparison between the aerosol absorption coefficient apportioned to brown carbon vs. the resulting operative BrC concentration values at λ=635 (a) and at λ=405 nm (b).
In the present experiment, the procedure was adopted to analyze the thermograms produced with both the red and the blue laser diodes mounted in the Sunset unit: the results are summarized in Fig. 7. Despite a rather high noise in the data, the MAC(BrC) value at the two wavelengths can be determined and it turns out to be MAC(BrC) and 23±1 m2 g−1, respectively, at λ=635 and 405 nm. This result deserves some comments.
-
The MAC value at λ=635 nm differs for about 3σ from the result reported in Massabò et al. (2016) and obtained for the same site and in a similar season (i.e., November 2015 to January 2016; MAC m2 g−1). Since differences in the type of wood burned in the past and present campaign cannot be excluded, the two values can be considered to be in fair agreement.
-
No comparison with previous or other literature values is possible for the MAC value at λ=405 nm, given the substantial differences in adopted definitions and methodologies (Yang et al., 2009; Feng et al., 2013; Chen and Bond, 2010). However, the increase by a factor of 2.3 with respect to the MAC at λ=635 nm follows the expected behavior.
-
Under the assumption that the sole source of BrC is biomass burning, the MAC values can be attributed to the total concentration of organic carbon (i.e., including the part not optically active) produced by biomass burning. Adopting with the present data set the optical OC apportionment methodology reported in Massabò et al. (2015), the BrC values determined at λ=635 nm turn out to be about 4 % of the OC produced by wood combustion, OCWB, and consequently MAC(OC nm) m2 g−1. When the analysis is performed at λ=405 nm, BrC is about 10 % of OCWB and MAC(OC nm) m2 g−1. Previous literature (Feng et al., 2013; Laskin et al., 2015, and references therein) reports MAC values of BrC and/or related OC ranging in quite a large interval.
-
The ratio between BrC and levo concentration values results in BrC : levo and 0.42±0.06, respectively, when considering the BrC concentration determined by MWAA + Sunset at λ=635 and 405 nm. In other words, the operative procedure, introduced in Massabò et al. (2016), results in different BrC concentration values according to the considered/used wavelength. This fact can be interpreted in different ways: while the analytical sensitivity is higher at λ=405 nm and the corresponding BrC values could be considered to be more firm, the category of compounds collected under the label “brown carbon” could be itself “wavelength dependent”. The latter would imply that the BrC concentration cannot be defined separately from the wavelength and that its meaning is even more “operative” than in the case for the more widespread OC and EC fractions. As a matter of fact, while the values discussed in Sect. 3.3 increase by a factor of 5.8 moving from λ=635 to λ=405 nm, the corresponding variation in the MAC(BrC) values is by a factor of 2.3 only. This is because the BrC concentration determined at λ=405 nm is twice the value measured at λ=635 nm. The purposes and the limits of the present study prevent any firm conclusion on the alternative explanation: BrC definition is wavelength dependent or the analysis in red light is not sensitive enough.
-
When considering the OCWB : levo concentration ratio, the MWAA analysis at λ=635 and λ=405 nm gives very compatible results, with a mean value of OCWB : levo .
We introduced a modified version of a commercial Sunset Lab Inc. OC/EC analyzer. We upgraded the standard instrument unit making possible the alternative use of a red (λ=635 nm) or blue (λ=405 nm) laser diode to monitor the light transmittance through the sample during the thermal cycle. The analytical performance of the new setup has been tested with both artificial and real-world aerosol samples.
The new Sunset setup was used to analyze a set of samples collected during mostly wintertime at a mountain site of the Italian Apennines. We retrieved brown carbon concentration values directly from the Sunset thermograms following Massabò et al. (2016). Exploiting the synergic information provided by the multi-wavelength absorbance analyzer, MWAA (Massabò et al., 2015), we could obtain the MAC(BrC) at the two wavelengths. The result at λ=635 nm (MAC m2 g−1) is in fair agreement with a previous study performed for the same site in winter 2015–2016. To our knowledge, the result at λ=405 nm, MAC m2 g−1, is the sole direct observation at this wavelength.
In our findings, the ratio between BrC and levo concentration values depends on the wavelength of the transmittance signal adopted during the thermal–optical analysis. This behavior could be due to (1) a better accuracy of the results in blue light, more sensitivity to BrC, or (2) the definition of BrC itself, which has to be considered wavelength dependent. The present results do not allow any conclusive statement on this issue: actually, the label “brown carbon”, as well as the widely used “organic and elemental carbon”, comes from an operative definition, which is not without ambiguity.
We provide all the original research data at the following permanent URL, available through the website of our laboratory (https://labfisa2.ge.infn.it/index.php/data-repository, last access: 6 June 2019).
DM and PP designed and took care of the modification of the Sunset unit. DM, PP, VV, and AA prepared and carried on the sampling campaign. VV, AA, and DM performed the two-wavelength measurements. DM and PP prepared the article with contributions from the other authors.
The authors declare that they have no conflict of interest.
This research has been supported by the Instituto Nazionale di Fisica Nucleare (grant no. CSN5-TRACCIA).
This paper was edited by Willy Maenhaut and reviewed by three anonymous referees.
Andreae, M. O. and Gelencsér, A.: Black carbon or brown carbon? The nature of light-absorbing carbonaceous aerosols, Atmos. Chem. Phys., 6, 3131–3148, https://doi.org/10.5194/acp-6-3131-2006, 2006.
Bernardoni, V., Pileci, R. E., Caponi, L., and Massabò, D.: The Multi-Wavelength Absorption Analyzer (MWAA) model as a tool for source and component apportionment based on aerosol absorption properties: application to samples collected in different environments, Atmosphere, 8, 218 https://doi.org/10.3390/atmos8110218, 2017.
Birch, M. E. and Cary, R. A.: Elemental carbon-based method for occupational monitoring of particulate diesel exhaust: methodology and exposure issues, Analyst, 121, 1183–1190, 1996.
Bond, T. C. and Bergstrom, R. W.: Light absorption by carbonaceous particles: an investigative review, Aerosol Sci. Tech., 40, 27–67, 2006.
Bond, T. C. and Sun, H. L.: Can reducing black carbon emissions counteract global warming?, Environ. Sci. Technol., 39, 5921–5926, 2005.
Bond, T. C., Doherty, S. J., Fahey, D. W., Forster, P. M., Berntsen, T., De Angelo, B. J., Flanner, M. G., Ghan, S., Kärcher, B., Koch, D., Kinne, S., Kondo, Y., Quinn, P. K., Sarofim, M. C., Schultz, M. G., Schulz, M., Venkataraman, C., Zhang, H., Zhang, S., Bellouin, N., Guttikunda, S. K., Hopke, P. K., Jacobson, M. Z., Kaiser, J. W., Klimont, Z., Lohmann, U., Schwarz, J. P., Shindell, D., Storelvmo, T., Warren, S. G., and Zender, C. S.: Bounding the role of black carbon in the climate system: a scientific assessment, J. Geophys. Res.-Atmos., 118, 5380–5552, 2013.
Bove, M. C., Brotto, P., Cassola, F., Cuccia, E., Massabò, D., Mazzino, A., Piazzalunga, A., and Prati, P.: An integrated PM2.5 source apportionment study: positive matrix factorisation vs. the chemical transport model CAMx, Atmos. Environ., 94, 274–286, 2014.
Cavalli, F., Viana, M., Yttri, K. E., Genberg, J., and Putaud, J.-P.: Toward a standardised thermal-optical protocol for measuring atmospheric organic and elemental carbon: the EUSAAR protocol, Atmos. Meas. Tech., 3, 79–89, https://doi.org/10.5194/amt-3-79-2010, 2010.
Chen, L.-W. A., Chow, J. C., Wang, X. L., Robles, J. A., Sumlin, B. J., Lowenthal, D. H., Zimmermann, R., and Watson, J. G.: Multi-wavelength optical measurement to enhance thermal/optical analysis for carbonaceous aerosol, Atmos. Meas. Tech., 8, 451–461, https://doi.org/10.5194/amt-8-451-2015, 2015.
Chen, Y. and Bond, T. C.: Light absorption by organic carbon from wood combustion, Atmos. Chem. Phys., 10, 1773–1787, https://doi.org/10.5194/acp-10-1773-2010, 2010.
Chow, J. C., Watson, J. G., Chen, L. W. A., Arnott, W. P., Moosmüller, H., and Fung, K. K.: Equivalence of elemental carbon by thermal-optical reflectance and transmittance with different temperature protocols, Environ. Sci. Technol., 38, 4414–4422, 2004.
Chow, J. C., Watson, J. G., Mauderly, J. L., Costa, D. L., Wyzga, R. E., Vedal, S., Hidy, G. M., Altshuler, S. L., Marrack, D., Heuss, J. M., Wolff, G. T., Pope III, C. A., and Dockery, D. W.: Health effects of fine particulate air pollution: lines that connect, J. Air Waste Manage., 56, 1368–1380, 2006.
Chow, J. C., Watson, J. G., Chen, L. W. A., Chang, M. C. O., Robinson, N. F., Trimble, D. L., and Kohl, S. D.: The IMPROVE_A temperature protocol for thermal-optical carbon analysis: maintaining consistency with a long-term database, J. Air Waste Manage., 57, 1014–1023, 2007.
Chow, J. C., Watson, J. G., Lowenthal, D. H., Chen, L. W. A., and Motallebi, N.: Black and organic carbon emission inventories: review and application to California, J. Air Waste Manage., 60, 497–507, 2010.
Chow, J. C., Wang, X., Sumlin, B. J., Gronstal, S. B., Chen, L. W. A., Trimble, D. L., Kohl, S. D., Mayorga, S. R., Riggio, G., Hurbain, P. R., Johnson, M., Zimmermann, R., and Watson, J. G.: Optical calibration and equivalence of a multiwavelength thermal-optical carbon analyzer, Aerosol Air Qual. Res., 15, 1145–1159, 2015.
Chow, J.C, Watson, J. G., Green, M. C., Wang, X., Chen, L. W. A., Trimble, D. L., Cropper, P. M., Kohl S. D., and Gronstal, S. B.: Separation of brown carbon from black carbon for IMPROVE and Chemical Speciation Network PM2.5 samples, J. Air Waste Manage., 68, 494–510, 2018.
Corbin J. C., Pieber, S. M., Czech, H., Zanatta, M., Jakobi, G., Massabò, D., Orasche, J., El Haddad, I., Mensah, A. A., Stengel, B., Drinovec, L., Mocnik, G., Zimmermann, R., Prévôt A. S. H., and Gysel, M.: Brown and Black Carbon emitted by a marine engine operated on heavy fuel oil and distillate fuels: optical properties, size distributions, and emission factors, J. Geophys. Res.-Atmos., 123, 6175–6195, 2018.
Daellenbach, K. R., Bozzetti, C., Křepelová, A., Canonaco, F., Wolf, R., Zotter, P., Fermo, P., Crippa, M., Slowik, J. G., Sosedova, Y., Zhang, Y., Huang, R.-J., Poulain, L., Szidat, S., Baltensperger, U., El Haddad, I., and Prévôt, A. S. H.: Characterization and source apportionment of organic aerosol using offline aerosol mass spectrometry, Atmos. Meas. Tech., 9, 23–39, https://doi.org/10.5194/amt-9-23-2016, 2016.
Favez, O., El Haddad, I., Piot, C., Boréave, A., Abidi, E., Marchand, N., Jaffrezo, J.-L., Besombes, J.-L., Personnaz, M.-B., Sciare, J., Wortham, H., George, C., and D'Anna, B.: Inter-comparison of source apportionment models for the estimation of wood burning aerosols during wintertime in an Alpine city (Grenoble, France), Atmos. Chem. Phys., 10, 5295–5314, https://doi.org/10.5194/acp-10-5295-2010, 2010.
Feng, Y., Ramanathan, V., and Kotamarthi, V. R.: Brown carbon: a significant atmospheric absorber of solar radiation?, Atmos. Chem. Phys., 13, 8607–8621, https://doi.org/10.5194/acp-13-8607-2013, 2013.
Ferrero, L., Močnik, G., Cogliati, S., Gregorič, A., Colombo, R., and Bolzacchini, E.: Heating rate of light absorbing aerosols: time-resolved measurements, the role of clouds, and source identification, Environ. Sci. Technol., 52, 3546–3555, 2018.
Filep, Á., Ajtai, T., Utry, N., Pintér, M. D., Nyilas, T., Takács, S., Máté, Z., Gelencsér, A., Hoffer, A., Schnaiter, M., Bozóki, Z., and Szabó, G.: Absorption spectrum of ambient aerosol and its correlation with size distribution in specific atmospheric conditions after a red mud accident, Aerosol Air Qual. Res., 13, 49–59, 2013.
Harrison, R. M., Beddows, D. C. S., Jones A. M., Calvo A., Alves C., and Pio C.: An evaluation of some issues regarding the use of aethalometers to measure woodsmoke concentrations, Atmos. Environ., 80, 540–548, 2013.
Highwood, E. J. and Kinnersley, R. P.: When smoke gets in our eyes: the multiple impacts of atmospheric black carbon on climate, air quality and health, Environ. Int., 32, 560–566, 2006.
Hitzenberger, R., Petzold, A., Bauer, H., Ctyroky, P., Pouresmaeil, P., Laskus, L., and Puxbaum, H.: Intercomparison of thermal and optical measurement methods for elemental carbon and black carbon at an urban location, Environ. Sci. Technol., 40, 6377–6383, 2006.
Karanasiou, A., Minguillón, M. C., Viana, M., Alastuey, A., Putaud, J.-P., Maenhaut, W., Panteliadis, P., Močnik, G., Favez, O., and Kuhlbusch, T. A. J.: Thermal-optical analysis for the measurement of elemental carbon (EC) and organic carbon (OC) in ambient air a literature review, Atmos. Meas. Tech. Discuss., 8, 9649–9712, https://doi.org/10.5194/amtd-8-9649-2015, 2015.
Kirchstetter, T. W., Novakok, T., and Hobbs, P. V.: Evidence that the spectral dependence of light absorption by aerosols is affected by organic carbon, J. Geophys. Res., 109, D21208, https://doi.org/10.1029/2004JD004999, 2004.
Lack, D. A. and Langridge, J. M.: On the attribution of black and brown carbon light absorption using the Ångström exponent, Atmos. Chem. Phys., 13, 10535–10543, https://doi.org/10.5194/acp-13-10535-2013, 2013.
Lack, D. A., Langridge, J. M., Bahreini, R., Cappa, C. D., Middlebrook, A. M., and Schwarz, J. P.: Brown carbon and internal mixing in biomass burning particles, P. Natl. Acad. Sci. USA, 109, 14802–14807, 2012.
Laskin, A., Laskin, J., and Nizkorodov S. A.: Chemistry of atmospheric brown carbon, Chem. Rev., 115, 4335–4382, 2015.
Lewis, K., Arnott, W. P., Moosmüller, H., and Wold, C. E.: Strong spectral variation of biomass smoke light absorption and single scattering albedo observed with a novel dual-wavelength photoacoustic instrument, J. Geophys. Res., 113, D16203, https://doi.org/10.1029/2007JD009699, 2008.
Massabò, D., Bernardoni, V., Bove, M. C., Brunengo, A., Cuccia, E., Piazzalunga, A., Prati, P., Valli, G., and Vecchi, R.: A multi-wavelength optical set-up for the characterization of carbonaceous particulate matter, J. Aerosol Sci., 60, 34–46, 2013.
Massabò, D., Caponi, L., Bernardoni, V., Bove, M. C., Brotto, P., Calzolai, G., Cassola, F., Chiari, M., Fedi, M. E., Fermo, P., Giannoni, M., Lucarelli, F., Nava, S., Piazzalunga, A., Valli, G., Vecchi, R., and Prati, P.: Multi-wavelength optical determination of black and brown carbon in atmospheric aerosols, Atmos. Environ., 108, 1–12, 2015.
Massabò, D., Caponi, L., Bove, M. C., and Prati, P.: Brown carbon and thermal-optical analysis: a correction based on optical multi-wavelength apportionment of atmospheric aerosols, Atmos. Environ., 125, 119–125, 2016.
Mauderly, J. L. and Chow, J. C.: Health effects of organic aerosols, Inhal. Toxicol., 20, 257–288, 2008.
Moosmüller, H., Chakrabarty, R. K., and Arnott, W. P.: Aerosol light absorption and its measurement: a review, J. Quant. Spectrosc. Ra., 110, 844–878, 2009.
Moosmüller, H., Chakrabarty, R. K., Ehlers, K. M., and Arnott, W. P.: Absorption Ångström coefficient, brown carbon, and aerosols: basic concepts, bulk matter, and spherical particles, Atmos. Chem. Phys., 11, 1217–1225, https://doi.org/10.5194/acp-11-1217-2011, 2011.
Olson, M. R., Garcia, M. V., Robinson, M. A., Van Rooy, P., Dietenberger, M. A., Bergin, M., and Schauer, J. J.: Investigation of black and brown carbon multiple-wavelength-dependent light absorption from biomass and fossil fuel combustion source emissions, J. Geophys. Res.-Atmos., 120, https://doi.org/10.1002/2014JD022970, 2015.
Panteliadis, P., Hafkenscheid, T., Cary, B., Diapouli, E., Fischer, A., Favez, O., Quincey, P., Viana, M., Hitzenberger, R., Vecchi, R., Saraga, D., Sciare, J., Jaffrezo, J. L., John, A., Schwarz, J., Giannoni, M., Novak, J., Karanasiou, A., Fermo, P., and Maenhaut, W.: ECOC comparison exercise with identical thermal protocols after temperature offset correction – instrument diagnostics by in-depth evaluation of operational parameters, Atmos. Meas. Tech., 8, 779–792, https://doi.org/10.5194/amt-8-779-2015, 2015.
Piazzalunga, A., Fermo, P., Bernardoni, V., Vecchi, R., Valli, G., and De Gregorio M. A.: A simplified method for levoglucosan quantification in wintertime atmospheric particulate matter by high performance anion-exchange chromatography coupled with pulsed amperometric detection, Int. J. Environ. An. Ch., 90, 934–947, 2010.
Piazzalunga, A., Bernardoni, V., Fermo, P., Valli, G., and Vecchi, R.: Technical Note: On the effect of water-soluble compounds removal on EC quantification by TOT analysis in urban aerosol samples, Atmos. Chem. Phys., 11, 10193–10203, https://doi.org/10.5194/acp-11-10193-2011, 2011.
Pope III, C. A. and Dockery, D. W.: Health effects of fine particulate air pollution: lines that connect, J. Air Waste Manage., 56, 709–742, 2006.
Pöschl, U.: Aerosol particle analysis: challenges and progress, Anal. Bioanal. Chem., 375, 3032, https://doi.org/10.1007/s00216-002-1611-5, 2003.
Sandradewi, J., Prevot, A. H., Szidat, S., Perron, N., Rami Alfarra, M., Lanz, V., Weingartner, E., and Baltensperger, U.: Using aerosol light absorption measurements for the quantitative determination of wood burning and traffic emission contributions to particulate matter, Environ. Sci. Technol., 42, 3316–3323, https://doi.org/10.1021/es702253m, 2008.
Subramanian, R., Khlystov, A. Y., and Robinson, A. L.: Effect of peak inert-mode temperature on elemental carbon measured using thermal-optical analysis, Aerosol Sci. Tech., 40, 763–780, 2006.
Utry, N., Ajtai, T., Filep, Á., Dániel P. M., Hoffer, A., Bozoki, Z., and Szabó, G.: Mass specific optical absorption coefficient of HULIS aerosol measured by a four-wavelength photoacoustic spectrometer at NIR, VIS and UV wavelengths, Atmos. Environ., 69, 321–324, 2013.
Utry, N., Ajtai, T., Filep, Á., Pintér, M., Török, Zs., Bozóki, Z., and Szabó, G.: Correlations between absorption Angström exponent (AAE) of wintertime ambient urban aerosol and its physical and chemical properties, Atmos. Environ., 91, 52–59, 2014.
Vassura, I., Venturini, E., Marchetti, S., Piazzalunga, A., Bernardi, E., Fermo, P., and Passarini, F.: Markers and influence of open biomass burning on atmospheric particulate size and composition during a major bonfire event, Atmos. Environ., 82, 218–225, 2014.
Watson, J. G., Chow, J. C., and Chen, L. W. A.: Summary of organic and elemental carbon/black carbon analysis methods and intercomparisons, Aerosol Air Qual. Res., 5, 65–102, 2005.
Yang, H. and Yu, J. Z.: Uncertainties in charring correction in the analysis of elemental and organic carbon in atmospheric particles by thermal-optical methods, Environ. Sci. Technol., 36, 5199–5204, 2002.
Yang, M., Howell, S. G., Zhuang, J., and Huebert, B. J.: Attribution of aerosol light absorption to black carbon, brown carbon, and dust in China – interpretations of atmospheric measurements during EAST-AIRE, Atmos. Chem. Phys., 9, 2035–2050, https://doi.org/10.5194/acp-9-2035-2009, 2009.
Zheng, G., He, K., Duan, F., Cheng, Y., and Ma, Y.: Measurement of humic-like substances in aerosols: A review, Environ. Pollut., 181, 301–314, 2013.
Zhi, G., Chen, Y., Sheng, G., and Fu, J.: Effects of temperature parameters on thermal-optical analysis of organic and elemental carbon in aerosol, Environ. Monit. Assess., 154, 253–261, 2008.