the Creative Commons Attribution 4.0 License.
the Creative Commons Attribution 4.0 License.
 | 17 Jun 2019
Characterization and application of artificial light sources for nighttime aerosol optical depth retrievals using the Visible Infrared Imager Radiometer Suite Day/Night Band
Shawn L. Jaker
Jeffrey S. Reid
Steven D. Miller
Jeremy Solbrig
Travis D. Toth
Using nighttime observations from Visible Infrared Imager Radiometer Suite (VIIRS) Day/Night band (DNB), the characteristics of artificial light sources are evaluated as functions of observation conditions, and incremental improvements are documented on nighttime aerosol retrievals using VIIRS DNB data on a regional scale. We find that the standard deviation of instantaneous radiance for a given artificial light source is strongly dependent upon the satellite viewing angle but is weakly dependent on lunar fraction and lunar angle. Retrieval of nighttime aerosol optical thickness (AOT) based on the novel use of these artificial light sources is demonstrated for three selected regions (United States, Middle East and India) during 2015. Reasonable agreement is found between nighttime AOTs from the VIIRS DNB and temporally adjacent daytime AOTs from the AErosol RObotic NETwork (AERONET) as well as from coincident nighttime AOT retrievals from the Cloud-Aerosol Lidar with Orthogonal Polarization (CALIOP), indicating the potential of this method to begin filling critical gaps in diurnal AOT information at both regional and global scales. Issues related to cloud, snow and ice contamination during the winter season, as well as data loss due to the misclassification of thick aerosol plumes as clouds, must be addressed to make the algorithm operationally robust.
- Article
(3931 KB) - Full-text XML
-
Supplement
(103 KB) - BibTeX
- EndNote


The Visible Infrared Imager Radiometer Suite (VIIRS), on board the Suomi National Polar-orbiting Partnership (NPP) satellite, features 22 narrow-band channels in the visible and infrared spectrum. Included on VIIRS is the Day/Night band (DNB), designed to detect both reflected solar energy during daytime and low-light visible and near-infrared signals at nighttime (e.g., Lee et al., 2006; Miller et al., 2013; Elvidge et al., 2017). Compared to the Operational Line Scan (OLS) sensor on the legacy Defense Meteorological Satellite Program (DMSP) constellation, the VIIRS DNB has an improved response to nighttime visible signals, owing to its higher spatial resolution, radiometric resolution and sensitivity (e.g., Miller et al., 2013; Elvidge et al., 2017). The DNB, unlike the OLS, is calibrated, which enables quantitative characterization of nighttime environmental parameters via a variety of natural and artificial light signals, including reflected moonlight in cloudy and cloud-free regions, natural and anthropogenic emissions from forest fires, volcanic eruptions, gas flares from oil fields, and artificial light sources from cities (e.g., Miller et al., 2013; Elvidge et al., 2017).
Using nighttime observations from VIIRS and OLS over artificial light sources such as cities, several studies have attempted to derive nighttime aerosol optical properties. For example, Zhang et al. (2008) proposed the concept of estimating nighttime aerosol optical thickness (AOT) by examining changes in DMSP and OLS radiances over artificial light sources between aerosol-free and high aerosol loading (and cloud-free) nights. However, the OLS visible channel does not have onboard calibration, which limits the use of OLS data for quantitative studying of nighttime aerosol properties. Compared to OLS, VIIRS has improved spatial and spectral resolutions and onboard calibration that make accurate quantification of nighttime aerosol properties feasible.
Using VIIRS radiances over selected artificial light sources, Johnson et al. (2013) developed a retrieval of nighttime AOT for selected cities. However, radiances from artificial light-free regions are needed for this retrieval process. McHardy et al. (2015) proposed an improved method, based on the method proposed by Johnson et al. (2013), which uses changes in spatial variations within a given artificial light source for retrieving nighttime AOT. The advantage of McHardy et al. (2015) is that only observations over the artificial light sources themselves are needed, eliminating the need for artificial light-free regions and implicit spatial invariance assumptions of Johnson et al. (2013). Following those early attempts, several other studies have also explored the potential of applying similar methods for air quality studies and for applying it to small cities (e.g., Choo and Jeong, 2016; Wang et al., 2016).
As proof-of-concept studies, only a few selected artificial light sources have been considered in those pioneering nighttime aerosol retrieval studies that utilize VIIRS observations. As suggested from McHardy et al. (2015), careful study of the characteristics of artificial light sources is needed to apply the method over a broader domain. Thus, in this study, using VIIRS data from 2015 over the US, the Middle East and India, we focus on answering the following questions.
-
How do radiance fields from artificial light sources vary as functions of observing conditions?
-
Are nighttime AOT retrievals using VIIRS DNB feasible on a regional basis? In particular, for our selected regions, can reasonable agreement be achieved between nighttime VIIRS DNB-derived AOT, aerosol retrievals from the Cloud-Aerosol Lidar with Orthogonal Polarization (CALIOP) and approximated nighttime AOT values from the daytime AErosol RObotic NETwork (AERONET)?
-
What are the limitations in the current approach that can be improved in future attempts?
In the current study, we do not aim to finalize the nighttime retrieval methods but rather explore existing issues, report incremental advancements and propose revised methods for future studies. This paper is organized as follows: Sect. 2 introduces the datasets used in this study as well as data processing and aerosol retrieval methods. Section 3 discusses artificial light source patterns as functions of viewing and lunar geometries and lunar fraction, as well as other observation-related parameters. Results of regionally based retrievals are also included in Sect. 3. Section 4 closes the paper with discussion and conclusions.
2.1 Datasets
Flying in a sun-synchronous polar orbit, Suomi NPP VIIRS has a local nighttime overpass time of ∼01:30. The spatial resolution of a VIIRS DNB pixel is ∼750 m across the full swath width of ∼3000 km. VIIRS DNB observes at a wavelength range of 0.5–0.9 µm, with a peak wavelength of ∼0.7 µm (e.g., Miller et al., 2013). VIIRS differs from its ancestor, OLS, by providing onboard calibration for tracking signal degradation, as well as changes in modulated spectral response function through the use of a solar diffuser (e.g., Chen et al., 2017). Early versions of VIIRS DNB data suffer from stray light contamination (e.g., Johnson et al., 2013). These issues have since been corrected for in later versions of the VIIRS DNB data (Mills et al., 2013).
In this study, three processed and terrain-corrected Suomi NPP VIIRS datasets were used for 2015. The VIIRS Day Night Band SDR (SVDNB) includes calibrated VIIRS DNB radiance data for the study as well as quality assurance (QA) flags for each pixel. The VIIRS Cloud Cover Layers EDR (VCCLO) dataset was used for cloud clearing, and the VIIRS Day Night Band SDR Ellipsoid Geolocation (GDNBO) dataset was used for obtaining geolocation for the VIIRS DNB radiance data. The GDNBO dataset also includes other ancillary parameters including solar, lunar, and satellite zenith and azimuth angles, as well as lunar phase, that were used as diagnostic information in support of this study. The VIIRS data were obtained from the NOAA Comprehensive Large Array-Data Stewardship System (CLASS) site (https://www.avl.class.noaa.gov/saa/products/welcome, last access: 27 May 2019).
To evaluate the VIIRS retrieved AOTs, cloud-cleared and quality-assured level 2, version 3 AERONET data were enlisted as the “ground truth.” Reported in AERONET data are AOTs at a typical wavelength range of 0.34 to 1.64 µm (Holben et al., 1998). We point out that AERONET AOTs are derived through measuring the attenuation of solar energy at defined wavelengths, and thus are only available during daytime. Therefore, averaged AOTs (0.675 µm) for the day before and after the VIIRS observations were used in evaluating the performance of VIIRS retrievals at night. A pair of VIIRS and AERONET retrievals are considered collocated if the temporal difference is within ±24 h and the spatial difference is within 0.4∘ latitude and longitude. All collocated AERONET data for one VIIRS data point were averaged to represent the AERONET-retrieved AOT value of the desired VIIRS retrieval.
Nighttime aerosol retrievals are also available from CALIOP aerosol products at both regional and global scales and for both day and nighttime (Winker et al., 2007). Thus, we also intercompared VIIRS nighttime AOTs retrieved from this study with CALIOP column-integrated AOTs. The version 4.10, level 2 CALIOP aerosol profile products (L2_05kmAPro) were used in this study. After implementing quality assurance steps, as mentioned in Toth et al. (2018), column-integrated CALIOP AOTs were derived at the 0.532 and 1.064 µm channels and then interpolated to the 0.70 µm channel (central wavelength of the DNB) for this study. The VIIRS and CALIOP data pair is considered to be collocated if the spatial difference is within 0.4∘ latitude and longitude and the temporal difference is within ±1 h. Note that one VIIRS retrieval may be associated with multiple CALIOP AOT retrievals, and thus collocated CALIOP aerosol retrievals were averaged to a single value for this comparison.
An open-source global city database from MaxMind (https://www.maxmind.com/, last access: 11 May 2018) was used in this study for cross-checking with the detected artificial light sources for this study. The city database includes the name and geolocation of the cities, as well as other ancillary information. Based on these data, a total of 999 cities from the Middle East region (11–42∘ N, 28–60∘ E) and 2995 cities from the Indian region (8–35∘ N, 68–97∘ E) were used in this study. These cities, as well as their geolocations, are shown in Fig. 1b and c for the Middle East and Indian regions, respectively, and are documented in the Supplement.
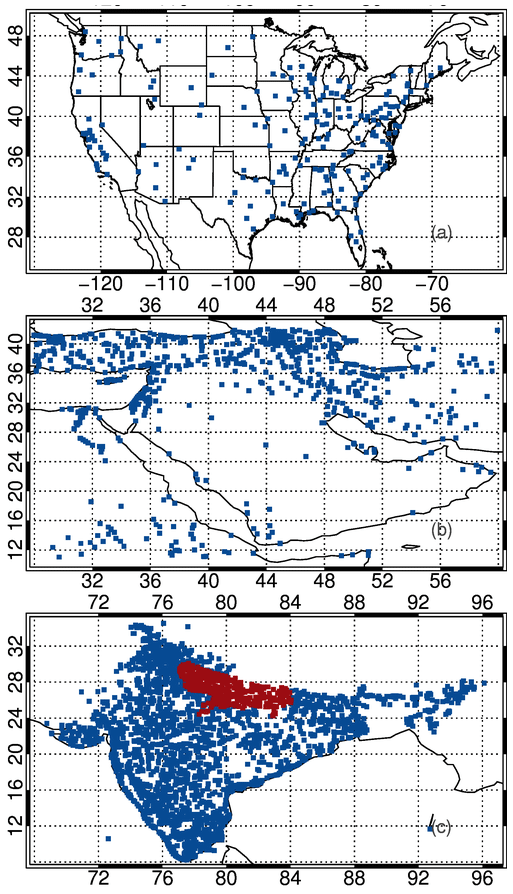
Figure 1Spatial distribution of the (a) 200 cities over the US, (b) 999 cities over the Middle East and (c) 2995 cities over India used in this study. Red dots show cities and towns from the state of Uttar Pradesh (UP) in India – a region of climatologically high aerosol loading.
One focus of this study is to understand the variations in artificial light sources as a function of observing conditions. To achieve this goal, we have arbitrarily selected 200 cities across the US. Since aerosol loadings are relatively low in the US compared to regions such as the Middle East and India, this selection gives insight into the characteristics of artificial light sources. Also, we require the selected cities to be isolated – that is, not in the immediate vicinity of another city or major light source, as to avoid light dome contamination. The majority of selected cities have populations within the range of 25 000 and 100 000, with a few higher-population exceptions such as Memphis, New Orleans and Charleston. The geolocations of the 200 cities are shown in Fig. 1a and, as mentioned above, the full list of the cities is also included as a Supplement.
2.2 Retrieval methods
The theoretical basis for retrieving nighttime AOT using stable artificial lights is based upon previous studies (Zhang et al., 2008; Johnson et al., 2013; McHardy et al., 2015). In the current approach, the VIIRS-observed radiance over a cloud-free artificial light source can be expressed as follows:
where Isat is the satellite received radiance, represented as the sum of contributions from three principal components: upwelling surface light emission through direct () and diffuse (IsT(μ)) transmittance and the path radiance source term (Ip). Here, τ is the total column optical thickness from aerosol and Rayleigh components, μ is the cosine of the viewing zenith angle, and T(μ) is the diffuse-sky transmittance. Is is the cloud-free sky surface upward radiance, which can be further rewritten as follows:
where rs, μ0 and F0 are (respectively) the surface reflectance, cosine of the lunar zenith angle and the top-of-atmosphere downward lunar irradiance convolved with the VIIRS DNB response function. T(μ0) is the diffuse transmittance term, is the reflectance from the aerosol layer and Ia is the emission from the artificial light source. The three terms inside the parentheses of Eq. (2) comprise the surface downward irradiance terms, where is the downward irradiance from moonlight through direct attenuation (or Fdirectdown) and μ0F0T(μ0) is the downward irradiance from moonlight through diffuse transmittance (or Fdiffusedown). πIs represents the surface emission (irradiance) that is reflected back downward to the surface by the aerosol layer, which has a layer mean reflectivity of . Equation (2) shows that the surface emission term includes emissions from the artificial light source, as well as from reflected downward fluxes. Solving Is from Eq. (2) and inserting that result into Eq. (1), after rearranging, yields the following equation:
We expect the artificial light source emission term, Ia, to vary spatially within a heterogeneous light source such as a larger city. Within that city, we can assume that the Fdirectdown, Fdiffusedown and Ip terms have negligible spatial variations. This assumption follows McHardy et al. (2015), who also assume the surface diffuse emission term (IsT(μ)) is spatially invariant. However, as indicated in Eq. (2), the surface diffuse emission term includes the Is, which contains the Ia term. Thus, we retain the surface diffuse emission term in this study.
By taking the spatial derivative of Eq. (3) (using the delta operator Δ) and by eliminating terms that have small variation within a city, we can derive the following equation:
The ΔIa and ΔIsat are the spatial variance in TOA radiance within an artificial light source for aerosol- and cloud-free and cloud-free conditions, respectively. Similar to McHardy et al. (2015), the spatial variance in radiance in this study is represented by the standard deviation of radiance within an artificial light source. Also, the diffuse transmittance, T(μ), is required. Following Johnson et al. (2013), we estimated the ratio (k) between direct transmittance () and total transmittance using the 6S radiative transfer model (Vermote et al., 1997). This approach can also be shown as Eq. (5):
The lookup table (LUT) values of k were computed for the AOT ranges of 0–1.5 (with every 0.05 AOT interval for AOT < 0.6 and for every 0.1 AOT interval for AOT of 0.6–1.0 and with two high AOT values of 1.2 and 1.5), for three different aerosol types: dust, smoke and pollutants. We also modified the 6S model (Vermote et al., 1997) to account for the spectral response function of the VIIRS DNB band (e.g., Chen et al., 2017). No sea salt aerosol was included in the LUT for this study, as artificial light sources considered in this study were inland with less probability of sea salt aerosol contamination. Still, sea salt aerosol can be added in later studies. Thus, we can rewrite Eq. (4) as follows:
As suggested from Eq. (6), nighttime column optical thickness (τ) can be estimated using spatial variances of an artificial light source over aerosol- and cloud-free conditions. The term arises from the reflectance between the aerosol and the surface layers. This term is small for dark surfaces or low aerosol loading cases but could be significant for thick aerosol plumes over bright surfaces, such as dust aerosols over the desert. We assume this term is negligible for this study. Note that τ values from Eq. (6) include AOT, as well as scattering (Rayleigh) and absorption (e.g., oxygen A band) optical depth from gas species. To derive nighttime AOTs, 6S radiative transfer calculations (Vermote et al., 1997) were used, assuming a standard atmosphere, to compute and remove the component due to molecular scattering.
2.3 Data preprocessing steps
The VIIRS data preprocessing for nighttime aerosol retrievals is implemented through two steps. First, artificial light sources are identified. Second, the detected artificial light sources are evaluated against a known city database and a detailed regional analysis is performed. This latter step is necessary to eliminate any unwanted “false” artificial light sources such as cloud contamination or lightning strikes.
In the first step, conducted on individual “granules” (∼90 s orbital subsets) or composites of adjacent granules, artificial light sources are selected after cloud screening and quality assurance procedures. Since VIIRS nighttime aerosol retrievals assume cloud-free conditions, cloud-contaminated pixels must be removed using the VIIRS cloud products. Note that the nighttime VIIRS cloud mask is thermal-infrared-based and has its limitations in detecting low clouds (especially over land), and thus additional cloud screening methods are also implemented, as mentioned in a later section. A single granule of VIIRS DNB radiance data is 4064 by 768 pixels, while for the same VIIRS granule the VIIRS cloud product reports values at 2032 by 384 pixels. Thus, the VIIRS cloud product is first oversampled and then used to screen the radiance data. Following the cloud screening step, VIIRS DNB quality assurance (QA) flags are used to eliminate pixels that either have missing or out-of-range data, exhibit saturation, or have bad calibration quality. We require the solar zenith angle to be larger than 102∘ to eliminate solar (including twilight) contamination. Upon cloud screening and QA checks, artificial light pixels are detected using a threshold-based method by examining the difference in radiance of a given pixel to background pixels (non-artificial light pixels), as suggested in Johnson et al. (2013). Artificial light pixels are defined as pixels having radiance values greater than 1.5 times that of the granule or multi-granule mean cloud-free background radiances.
The implementation of the first preprocessing step is illustrated in Fig. 2a–d. Figure 2a shows VIIRS DNB radiance data over North America for 1 October 2015. Figure 2b shows the same data as Fig. 2a but with cloud screening (shown in gray) and QA steps applied. Data removed by the day and night terminator (i.e., solar zenith angle < 102∘) are shown in cyan, and pixels with QA values indicating signal saturation are shown in yellow. Orange pixels in Fig. 2c are the detected potential light sources on the granule scale. As shown in Fig. 2c, some cloud pixels may still be misclassified as artificial light sources. To avoid such false detection, the detected artificial light sources are further evaluated against a list of known cities for a given region, as mentioned in Sect. 2. This step is shown in Fig. 2d, where green pixels are artificial light sources confirmed by the known city light source database. Here, only 200 arbitrarily selected cities in the US were used, and thus some of the artificial light sources, although positively identified, were not highlighted in green as they were not in the city list.
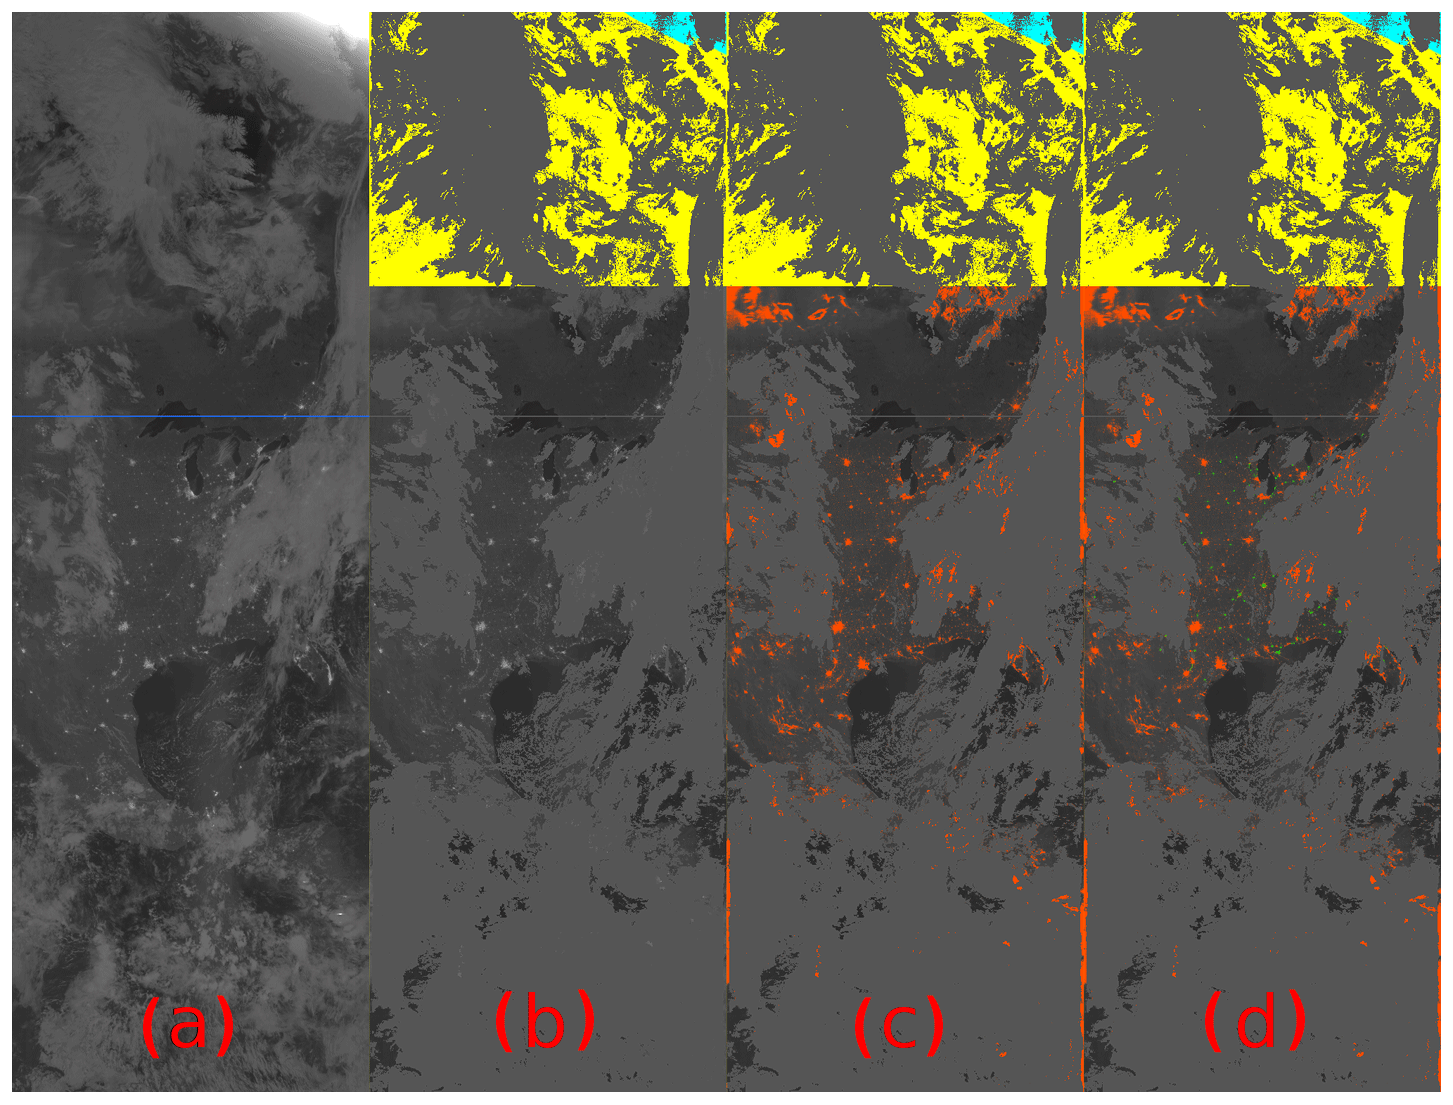
Figure 2(a) VIIRS DNB contrast-enhanced imagery centered over North America from the VIIRS DNB for 1 October 2015. Panel (b) is the same as (a) but with cloud screening and quality assurance steps applied for cloudy (gray), saturated pixels (yellow) and solar zenith angles < 102∘ (cyan). Panel (c) is similar to (b) but with artificial light sources identified through a granule-level detection (orange). Panel (d) is similar to (c) but shows artificial light sources cross-checked with a known city database and through a regional-level detection (green).
The granule or multi-granule mean cloud-free background radiances are used for detecting artificial light sources in the first step, which may introduce an over- or under-detection of artificial light sources. To refine this detection, a regionally based artificial light source detection step is implemented. In this step, a bounding box is selected for each cloud-free city. The bounding boxes are manually selected for 200 cities in the US and 8 cities in the Middle East. Based on experimenting, we found that most cities have a bounding box size of less than ±0.3∘ latitude and longitude, except for large cities that have a population of ∼ 250 000 or more, depending on the country. Thus, for the remaining 991 cities in the Middle East and 2995 cities in India, to simplify the process, a latitude and longitude region was picked as the bounding box. The bounding boxes for large cities need to be manually selected in future studies.
Even if a city is partially included in a bounding box, or multiple cities reside within a bounding box, retrievals can still be performed, since variances of detected artificial light sources are used for aerosol retrievals regardless of origins of those artificial light sources. The latitude and longitude ranges of the bounding boxes for all cities used in the study are included in the Supplement. Similar steps to those mentioned in the granule or multi-granule-level detection scheme are implemented here but with the use of localized mean cloud-free background radiances. The results from the regional detection are shown in Fig. 3. Figure 3a is the VIIRS nighttime image for Sioux City, Iowa, for 13 April 2015. The detected artificial light sources are shown in Fig. 3b, where green pixels represent artificial light sources that are identified based on the local detection scheme (the second step) and the orange pixels represent pixels identified at the granule or multi-granule level (the first step) but fail on regional detection or outside the bounding box.
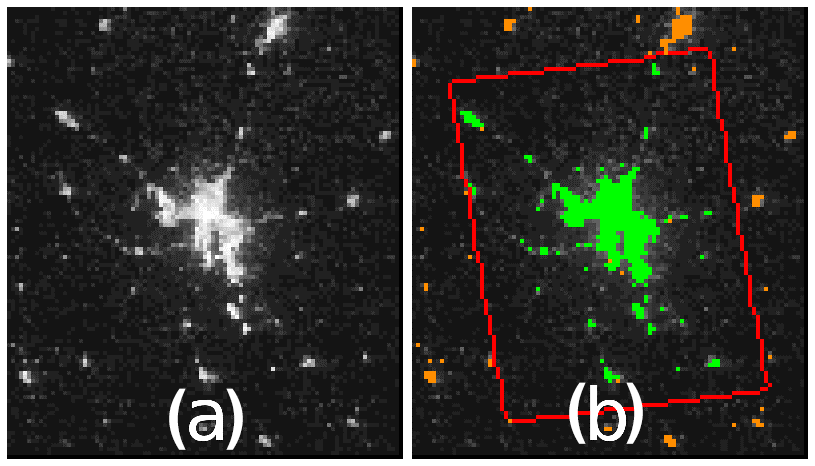
Figure 3(a) VIIRS nighttime imagery on 13 April 2015 over Sioux City, Iowa, US. Panel (b) is similar to (a) but shows detected artificial light sources using data within (latitude) and (longitude) of the city center (green), as indicated by the red box. Orange colors show the detected artificial light sources through a granule-level detection. Only green pixels are utilized for aerosol retrievals.
Cloud contamination, especially cirrus cloud contamination, remains an issue in the above steps, as shown in Fig. 2c, owing to limitations in the VIIRS infrared-based nighttime cloud mask. To further eliminate cities that are partially covered by clouds for a given artificial light source, nights with mean latitudes and longitudes from detected light source pixels that are larger than 0.02∘ of the seasonally or yearly mean geolocations are excluded. This process is based on the assumption that, for a partially cloud-covered city, only a portion of the city is detected as artificial light source, and thus the mean geolocations likely deviate from the multi-night composited mean geolocations. However, this step may misidentify heavy aerosol plumes as cloud-contaminated scenes. These nuances of city light identification remain a topic of ongoing research and, for now, remain as an outstanding source of uncertainty in the current retrieval algorithm.
On each night and for each light source (e.g., a given city that is composed of multiple VIIRS DNB pixels such as shown in Fig. 3b), the averaged radiance, its standard deviation, the lunar fraction (fraction of the lunar disk illuminated by the sun, as viewed from Earth), viewing geometries and the number of artificial light source pixels identified are reported as diagnostic information. To further avoid contamination from potential cloud- and surface-contaminated pixels, or from pixels with erroneously high radiance values due to lightning flashes, in the process of computing standard deviation the top 0.5 % and bottom 10 % of pixels are excluded. Finally, this dataset is further used in the retrieval process.
3.1 Linkages between artificial lights and observing conditions
As mentioned in Sect. 2, 200 cities within the US were arbitrarily chosen to examine the properties of artificial light sources, as we expect less significant aerosol contaminations over the US in comparison to other regions considered in this study. This analysis allows us to gain insight into the natural variations in artificial light sources as a function of various observing parameters – variations that will determine the inherent uncertainty of aerosol retrievals.
Cities have varying spatial light patterns, populations and nighttime electricity usage, as well as different surface conditions. To study the overall impacts of the observing conditions on artificial light source patterns, the yearly mean radiance and standard deviation of the detected light sources were computed for each city, regardless of observing conditions. Here, for each artificial light source (city or town), for a given satellite overpass of a given night, the mean radiance and the standard deviation of radiance for artificial light source pixels within the given city or town were computed and were further used as the base elements for computing yearly mean radiance and standard deviation values. Then, for each city and for each night, the instantaneous radiance and standard deviation values were scaled based on yearly mean values to derive a yearly mean normalized radiance (N_Radiance) and standard deviation (N_Rstd). This process was necessary to remove city-specific characteristics, making the comparison of artificial light source properties from different cities feasible. Also, to remove nights with cloud contamination or bad data, the yearly mean (N) and standard deviation (N_STD) of the total number of light source pixels identified for a given artificial light source was computed. Only nights with a number of detected light source pixels exceeding _STD were used in the subsequent analysis.
Figure 4a shows the plot of Julian day versus normalized radiance using data from all 200 cities on all available nights, regardless of the observing conditions (with the exception of totally cloudy scenes, as identified by the VIIRS cloud product, which were removed). As suggested from Fig. 4a, nighttime artificial light sources vary as a function of Julian day. Higher radiance values were found over the Northern Hemisphere winter season (Julian days greater than 300 or less than 100, corresponding to the months of November through March of the following year), compared to the Northern Hemisphere spring, summer and fall seasons. In particular, during the Northern Hemisphere winter season, high spikes of radiance values were clearly visible. The increase in radiance values, as well as frequent high spikes in radiance values during the winter season, may be due in part to snow and ice reflectance (modifying the surface albedo, and hence the multiple scatter between the atmosphere and surface, as well as augmented lunar reflectance), especially for high-latitude regions. Thus, snow- and ice-removal steps are needed for nighttime aerosol retrievals on both regional and global scales. Still, upon characterizing the snow and ice cover from daytime observations, retrievals may still be possible over snow- and ice-contaminated regions for future studies.
Also apparent in Fig. 4a is variation in the number of observations (cloud-free or partially cloudy) with respect to Julian day. The minimum number of cloud-free or partially cloudy observations that passed the QA checks occurs during the months of June and July, likely due to a saturation of QA-flagged pixels (colored in yellow in Fig. 2) reaching the furthest south during those 2 months. VIIRS DNB QA checks also label a block of pixels adjacent to the day and night terminator as pixels with bad QA (e.g., the yellow area in Fig. 2b). Thus, during June and July, a significant portion of artificial light sources at high latitudes were removed from the analysis. These QA steps are retained in the process, although relaxing these QA requirements may be an option for enhancing data volume over high latitudes. An assessment of the uncertainties incurred by reducing the conservative nature of the QA flag is a subject for future studies.
Figure 4c and e show that the yearly mean normalized radiance, N_Radiance, varies as a function of lunar status, including the lunar fraction and lunar zenith angle. As the lunar fraction increases, the N_Radiance increases, possibly due to the increase in reflected moonlight. As lunar zenith angle increases (i.e., the moon is less high in the sky), a decrease in the N_Radiance is found, indicating a reduction in downward moonlight as lunar zenith angle increases. An interesting relationship between the N_Radiance and satellite zenith angle emerges in Fig. 4g. A 10 %–20 % increase in N_Radiance is observed for an increase in satellite zenith angle from 0 to 60∘.
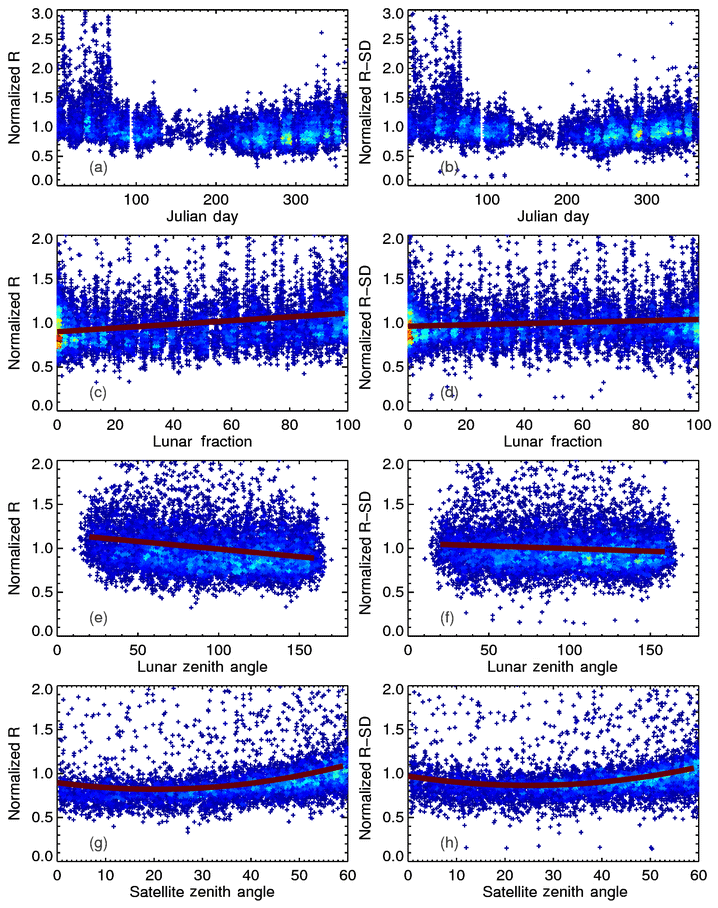
Figure 4Panels (a), (c), (e) and (g) show the normalized radiance of artificial light sources (200 selected cities over the US for 2015) as functions of Julian day, lunar fraction, lunar zenith angle and satellite zenith angle, respectively. Panels (b), (d), (f) and (h) show similar plots as those in panels (a), (c), (e) and (g) but for the normalized standard deviation of radiance for artificial light sources. Cold to warm colors represent data density from low to high.
Figure 4b, d, f and h show similar analyses to Fig. 4a, c, e and g but for N_Rstd. A similar relationship between N_Rstd and Julian day is also found, with larger N_Rstd values found in winter and smaller values found in the summer. Also, larger spikes of N_Rstd, possibly due to snow and ice contamination, are found in the winter season, suggesting that careful ice and snow detection methods are needed for processing VIIRS DNB data over high latitudes during the winter season. Still, the increase in nighttime radiance and standard deviation of radiance may also be due to the increase in artificial light usage at night during the winter months, and, for this reason, seasonal or monthly based ΔIa values may be needed. In contrast to the normalized radiance, insignificant changes in N_Rstd were observed with the varying of either lunar fraction or lunar zenith angle, indicating that lunar fraction or lunar zenith angle have less impact on nighttime aerosol retrievals when considering N_Rstd.
N_Rstd was found to be strongly dependent upon the satellite zenith angle, with values larger than 1 observed at a near 60∘ viewing zenith angle, likely due to the anisotropic behavior of artificial light sources, as well as longer slant paths, although the true reason remains unknown. To account for this viewing zenith angle dependency, a correction factor c was introduced in Johnson et al. (2013) in anticipation of this result. Based on Fig. 4h, the correction factor, c, specified as a function of the satellite viewing zenith angle (θ), was calculated using VIIRS DNB data from 2015 over the 200 selected cities:
Radiance and standard deviation values from this study were further divided by c to account for the viewing angle dependency.
Figure 5a is a scatterplot of N_Radiance versus N_Rstd. A strong linear relationship is shown, with a correlation of 0.92, suggesting that brighter artificial light sources are typically associated with larger spatial variations in radiance. Figure 5b shows the relationship between N_Rstd and AOT using a collocated VIIRS DNB and AERONET dataset. Only data from non-winter months (April–October 2015) were considered. Since nighttime AERONET data are not available, the AERONET data used for the AOT comparisons in Fig. 5b are taken from the day immediately prior and after the VIIRS nighttime observations, following the same collocation method as described in Sect. 2. Figure 5b shows a non-linear linkage between N_Rstd values and collocated AERONET AOTs, and N_Rstd decreases as AOT increases. As such, Fig. 5b justifies the rationale for retrieving nighttime AOT using spatial variations in artificial light sources.
3.2 Parameter quantification for nighttime aerosol optical depth retrievals
As shown in Eq. (6), to retrieve nighttime AOT using VIIRS DNB, ΔIa, ΔIsat and k values must be quantified. ΔIsat is the standard deviation of an artificial light source under cloud-free conditions, calculated directly from VIIRS DNB data. ΔIa is the spatial standard deviation of the same artificial light source but under aerosol- and cloud-free conditions. The ΔIa shall be derived over nights with minimum aerosol contamination, or in principle, from nights with the highest standard deviation of radiance (Rstd) values. However, given that some of the highest Rstd values may correspond to unscreened clouds or lightning, for a given year and for a given city we computed the mean (Rstd_ave(30 %)) and standard deviation (Rstd_std(30 %)) of the 30 % highest Rstd values. We then used the mean plus 2 times standard deviation of the 30 % highest Rstd values (Rstd_ave(30 %) (30 %)) to represent the ΔIa value. Assuming a normal data distribution, two standard deviations above the mean Rstd_ave(30 %) values should represent the top 1 % of the highest Rstd values of all data points – providing a way to compute the highest Rstd value while simultaneously minimizing cloud and lightning contamination. Artificial light sources are excluded if the ratio of Rstd_std(30 %) to Rstd_ave(30 %) is above 15 %. Those artificial light sources with larger variations in peak Rstd values are likely to be associated with cities that have less stable artificial light signals. Over the US, because of the concerns for ice and snow contamination, as mentioned in Sect. 3.1, only data from non-winter months (April–October 2015) were used. For the India and Middle East regions, snow and ice contamination is likely insignificant, and thus data from all months in 2015 were used.
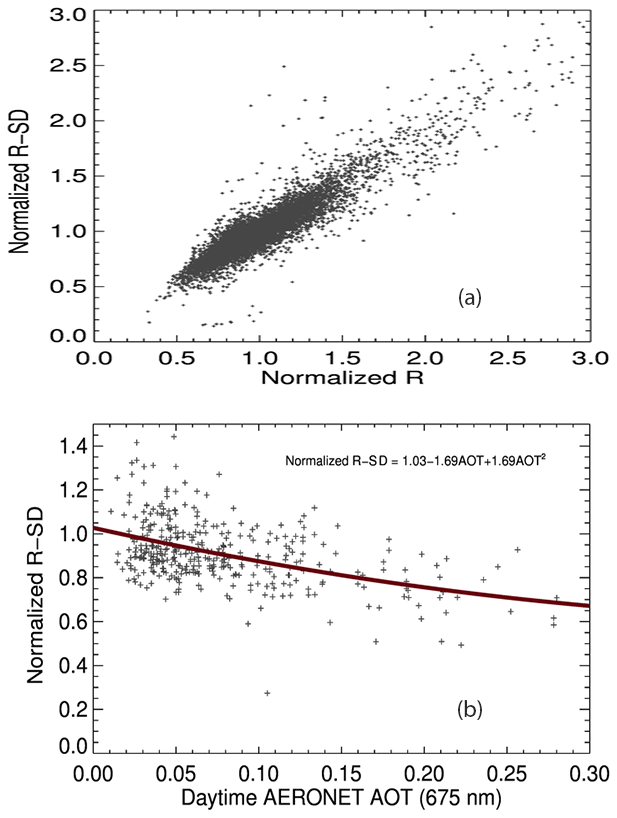
Figure 5(a) Normalized radiance versus normalized standard deviation of radiance for 200 cities over the US for 2015. (b) The normalized standard deviation of radiance as a function of adjacent daytime AERONET AOT (0.675 µm).
As mentioned in Sect. 2.2, k values are computed using a LUT (precomputed using the 6S radiative transfer model) for dust, smoke and pollutant aerosols. For simplicity, we assumed the US, the Middle East and Indian regions were dominated by pollutant, dust and smoke aerosols, respectively. In future applications, k values (related to aerosol type) shall either be evaluated on a regional basis, following Remer et al. (2005), or derived directly from VIIRS, as mentioned in a later section.
Cloud contamination is a long-standing challenge to passive-based satellite aerosol research (e.g., Zhang et al., 2005). In this study, the VIIRS cloud product (VCCLO) was used for cloud clearing of the observed VIIRS DNB scenes. However, only VIIRS Infrared channels are applied for cloud detection at night (Godin and Vicente, 2015). Thus, it is possible that low-level clouds, unseen by the VIIRS nighttime cloud mask, may still be present in the “cloud-cleared” scenes. To further exclude potential cloud-contaminated artificial light sources, we have implemented additional quality control steps. First, it is noted that in the presence of low clouds certain artificial light source patterns may appear differently from clear-sky conditions. Thus, only nights with mean geolocations of the detected artificial light sources that are within 0.02∘ of multi-night clear sky means are used. This approach, however, will introduce issues for regions with persistent cloud or thick aerosol plume coverage, such as the state of Uttar Pradesh (UP) in India, which is mentioned later.
It was noted in Sect. 3.1 that the radiance and standard deviation of radiance are strongly correlated. As such, for each city and for each year, a regression relationship between radiance and standard deviation of radiance values was constructed by calculating the mean and standard deviation of Rstd for a given radiance range. For a given range of radiance values, Rstd values that were two standard deviations above the mean Rstd for that range were discarded as noisy data. After removing these noisy points, the same procedures were repeated to compute the regression between radiance and Rstd values for each city. The overall mean of Rstd (Rstd_mean) for the given artificial light source was also computed. Data were removed if the Rstd value was above the estimated Rstd based on radiance values using the above discussed regression plus 0.5 times Rstd_mean. This step was taken to further remove cloud-contaminated data but may also remove scenes with thick aerosol plumes.
3.3 Regional retrievals
One of the goals of this study is to apply the proposed algorithm on a regional scale. A full retrieval and evaluation, using modified schemes as identified from this paper, will be conducted in follow-up research. Here, we present preliminary results conducted on a regional scale for three selected regions in 2015: the US, the Middle East and India. As mentioned previously, only non-winter months were used (April–October) for the US region due to concerns of snow and ice contamination, while all months were included for the other two regions.
Figure 6a shows the comparison between retrieved nighttime AOTs from VIIRS DNB and collocated daytime AERONET AOTs (0.675 µm) for the selected 200 cities in 2015. Here VIIRS DNB AOTs are retrieved without using the k (diffuse transmittance) correction term mentioned in Sects. 2 and 3.2. A total of 368 collocated points are found with a correlation of 0.59. Figure 6b shows the collocated CALIOP and VIIRS nighttime AOTs, again using the retrievals without correcting for the diffuse transmittance term. A correlation of 0.47 was found between CALIOP AOT (interpolated to 0.700 µm) and VIIRS nighttime AOT.
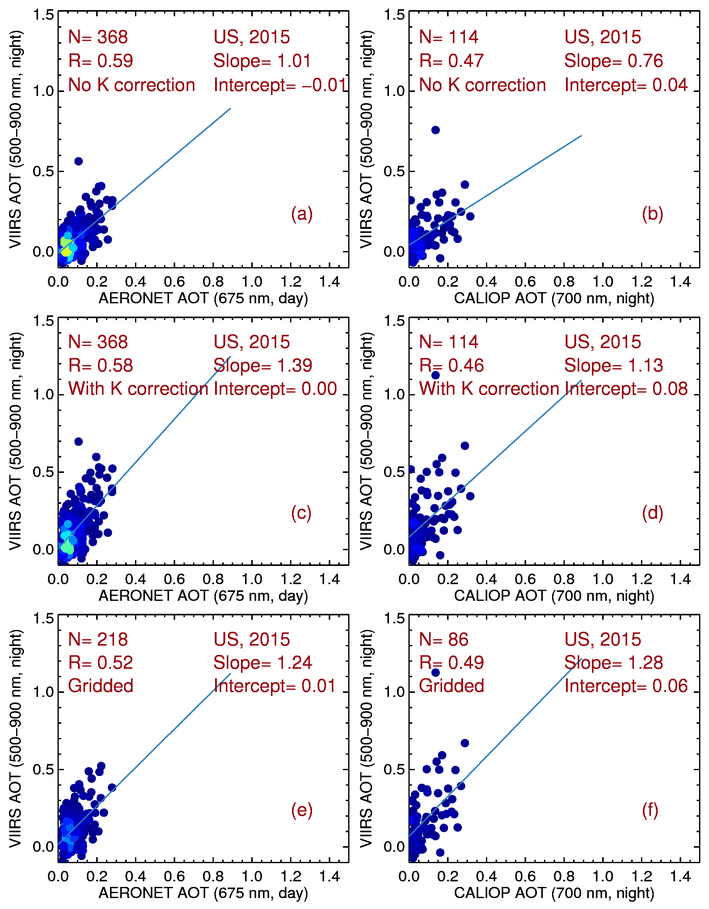
Figure 6(a) Scatterplot of VIIRS nighttime AOT versus adjacent daytime AERONET AOT (0.675 µm) for 200 selected cities over the US for 2015. No diffuse correction is applied. Panel (b) is similar to (a) but using nighttime CALIOP AOT (0.7 µm). Panels (c) and (d) are similar to panels (a) and (b) but with the diffuse correction implemented. Panels (e) and (f) are similar to (c) and (d) but for gridded VIIRS data (averaged into latitude by longitude grids). Artificial light sources with fewer than 20 nights that passed various cloud screening and QA checks are excluded. Cold to warm colors represent data density from low to high.
Figure 6c and d show retrieval comparisons similar to Fig. 6a and b but revised to include the k (diffuse transmittance) correction term. An overcorrection was found as a slope that is higher than 1 between VIIRS and daytime AERONET AOTs, indicating that the correction for diffuse transmittance may be less important for low aerosol loading cases. The daytime AERONET AOT may not be a fair representation of nighttime AOTs in all cases. Large uncertainties exist in CALIOP extinctions and AOTs as well, due to necessary assumptions of the lidar ratios made in the retrieval process (e.g., Omar et al., 2013). Therefore, significant uncertainties exist in both the AERONET and CALIOP validation sources. Still, this can be improved with the use of nighttime lunar photometry data that is in development from the AERONET group (e.g., Berkoff et al., 2011; Barreto et al., 2013).
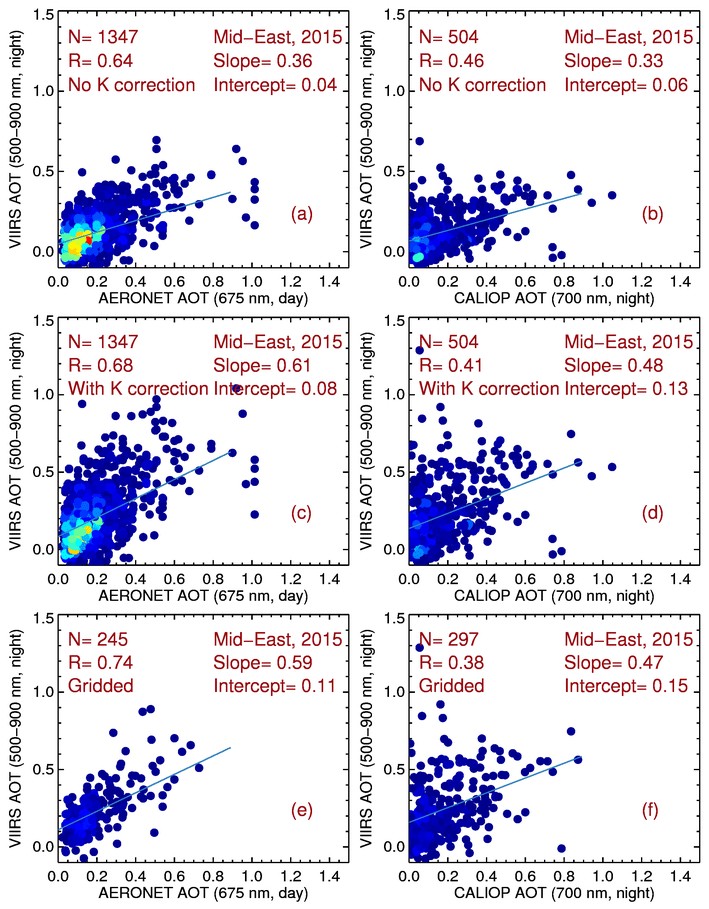
Figure 7a and b show scatterplots of VIIRS DNB AOTs versus daytime AERONET and nighttime CALIOP AOTs, respectively, for the Middle East for 2015, using retrievals without k. A total of 999 cities were included in the study, and 368 cities were excluded for not passing the stable light source check (or Rstd_std(30 %)∕Rstd_ ave(30 %) < 15 %) or not having three or more nights that passed the various checks, as mentioned in previous sections (both criteria are referred to as the stable light source requirement). Note that these criteria may exclude artificial light sources with highly variable day-to-day changes in AOT. A correlation of 0.64 and 0.46 was found between VIIRS and AERONET and CALIOP AOTs, respectively. However, a low bias is clearly present in both comparisons. Figure 7c and d show the VIIRS nighttime AOTs versus AERONET (day) and CALIOP (night) AOTs with k included. Similar correlations are found, yet the low bias is largely corrected.
A similar study was conducted for India. Here we separated cities in India inside and outside of UP (retrieval for UP is discussed later). Of a total of 2573 cities outside of UP, 1807 cities were found to satisfy the stable light source requirement. Again, Fig. 8a and b are for VIIRS nighttime AOTs versus AERONET adjacent daytime and CALIOP nighttime AOTs without k correction and Fig. 8c and d are the plots with the diffuse transmittance (k) correction term included, for cities that are outside UP. In all four cases, correlations of around 0.5–0.6 were found, indicating the developed algorithm has a reasonable capacity for tracking nighttime AOTs. A low bias occurred when k was not included. When k was included, a near one-to-one agreement is found in both Fig. 8c and d. This exercise reinforces the notion that there is indeed a need to account for diffuse transmittance.
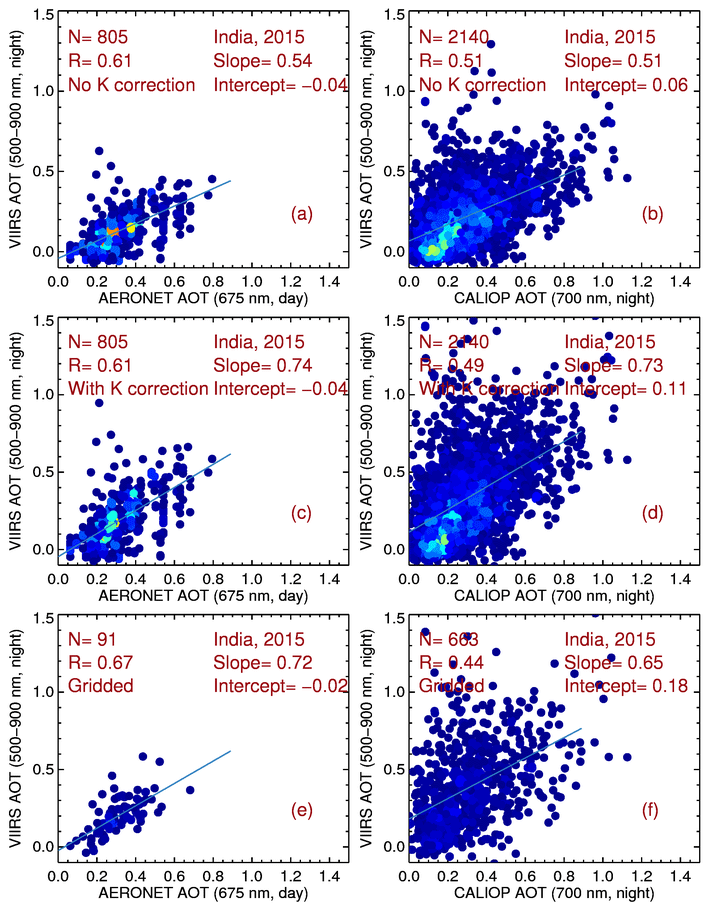
Figure 8Similar to Fig. 7 but for the Indian region for 2015. Artificial light sources from the state of Uttar Pradesh in India are excluded.
Figure 9a and b compares AOTs reported by VIIRS, AERONET and CALIOP for cities within UP. Of a total of 422 cities, 325 passed the stable city light requirement. However, a low correlation was found between VIIRS nighttime and daytime AERONET AOTs. This result is not surprising, as thick aerosol plumes cover this region most of the year, and thus the derived cloud- and aerosol-free sky standard deviation of the artificial light sources (the ΔIa values) are not always representative of true aerosol-free cases. Therefore, a longer study period, or careful analysis by hand, may be needed for deriving ΔIa values for regions that are known to have persistent thick aerosol plume coverage.
Ideally, the retrievals at each light source location should be gridded and averaged to further increase the signal-to-noise ratio. We have tested this concept by averaging retrievals shown in Figs. 6, 7 and 8 into a (latitude by longitude) averaged dataset. Artificial light sources that have fewer than 20 valid nights in a year were excluded to provide statistically robust estimates of ΔIa. Comparisons of (latitude by longitude) averaged VIIRS DNB AOT retrievals with daytime AERONET data (nighttime CALIOP AOTs) are shown in Figs. 6e (6f), 7e (7f) and 8e (8f) for the US, the Middle East and Indian regions, respectively. Increases in correlations were found between VIIRS and AERONET AOTs for the Indian and Middle East regions. Marginal changes in correlations, however, occurred between VIIRS and CALIOP AOTs. Although neither daytime AERONET nor nighttime CALIOP AOTs can be considered the “ground truth” for nighttime AOTs, these results suggest that the newly developed method has a capacity for retrieving nighttime AOTs over both dark and bright surfaces.
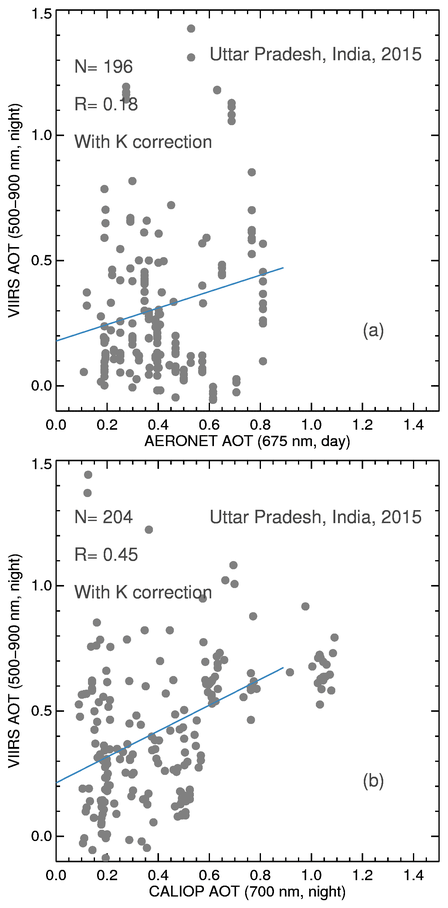
Figure 9(a) Scatterplot of VIIRS nighttime AOT versus adjacent daytime AERONET AOT (0.675 µm) over the state of Uttar Pradesh in India for 2015. Diffuse correction is applied. Panel (b) is similar to (a) but for nighttime CALIOP AOT (0.7 µm).
Figure 10 shows nighttime AOT retrievals over India for 12 and 16 January 2015, with the retrievals from UP removed. Figures 10a and b show true color imagery from Terra MODIS for 12 and 16 January 2015 (obtained from the NASA Worldview through the following site: https://worldview.earthdata.nasa.gov/, last access: 27 May 2019). Figure 10c and d show the nighttime images of VIIRS DNB radiance for 12 and 16 January 2015. Overplotted on Fig. 10c and d are retrieved VIIRS nighttime AOTs, with blue, green, orange and red representing AOT ranges of 0–0.2, 0.2–0.4, 0.4–0.6 and above 0.6, respectively, using the same gridded data as Fig. 8e–f. Shown in Fig. 10a, on 12 January, the western portion of India was relatively aerosol-free, but a heavy aerosol plume is visible around the east coast of India. Similarly, AOTs lower than 0.2 were detected over western India but AOTs larger than 0.6 were found over eastern India. On 16 January, as indicated from the MODIS daytime image, a thick plume covered the western portion of India, also seen in Fig. 10d via retrieved AOTs above 0.6. Also, the northeastern portion of India was relatively aerosol-free, as indicated from both MODIS true color imagery (Fig. 10b) and VIIRS nighttime AOT retrievals (Fig. 10d).
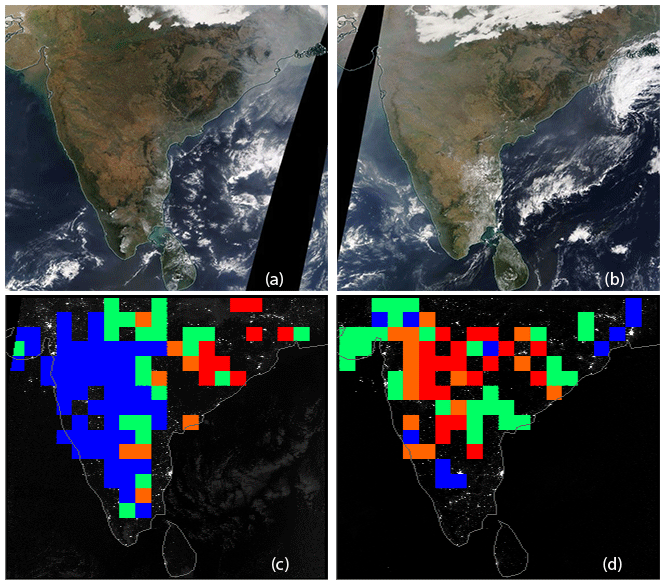
Figure 10Terra MODIS true color imagery (NASA Worldview) for 12 January 2015 over India. Panel (b) is similar to (a) but for 16 January 2015. (c) VIIRS nighttime imagery on 12 January 2015. Overplotted are VIIRS nighttime AOT retrievals in (latitude by longitude) grid format. Blue, green, orange and red represent AOT ranges of 0–0.2, 0.2–0.4, 0.4–0.6 and > 0.6, respectively. Panel (d) is similar to (c) but for 16 January 2015.
Based on Fig. 10c and d, there were many artificial light sources not used in the retrieval. Those sources were excluded by various quality control checks of the study due to such reasons as potential cloud contamination, light source instability, or insufficient valid data in a year. It is very likely that some valid data will be removed in this conservative filtering process. New methods must be developed to restore valid data. Some ideas to this effect are presented in the section to follow.
The diffuse correction term, k, was shown to be an important factor in reducing bias in these retrievals. We compared the k corrections estimated using the 6S model (Vermote et al., 1997) as well as those empirically derived from this study. By assuming CALIOP nighttime AOTs as the “true” AOTs and using VIIRS AOTs as shown in Figs. 7d and 8d as inputs, the k correction term could be inferred using Eq. (6). Figure 11a shows the derived k values versus CALIOP nighttime AOT for the Middle East region. Overplotted are the k values estimated from the 6S model (Vermote et al., 1997). The two patterns show some agreement, as both the modeled and the empirically derived k values are near or above 1 for CALIOP AOTs of 0.0 and below 0.5 when CALIOP AOTs are ∼1. This behavior indicates that the 6S-modeled k correction may provide a reasonable first-order estimate for dust aerosols in this region. Figure 11b shows a similar plot to Fig. 11a but for the Indian region. A larger data spread was found between the empirically derived and modeled k values assuming smoke aerosols, although the overall patterns were similar. One of the possible reasons for the disparity is that unlike the Middle East region, where dust aerosols dominate, the Indian region is subject to many other aerosol species including dust and pollutants, occurring across different regions and varying with season.
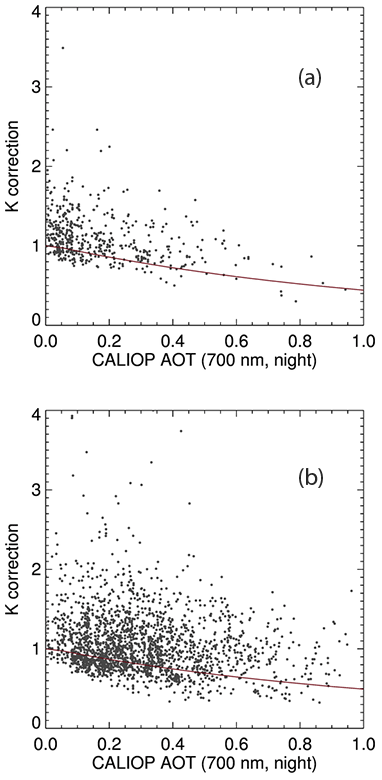
Figure 11(a) Empirically derived (using data from Fig. 7d; filled circles) and 6S-model-estimated (red line) diffuse correction terms for the Middle East for 2015. Panel (b) is similar to Fig. 11a but for the Indian region for 2015 (using data from Fig. 8d).
3.4 Limitations and possible improvements
Despite showing some capacity, the retrieval algorithm examined in this study has its limitations. First, most retrievals are limited to AOTs less than 1.5. This is because scenes with heavy aerosol plumes can either be misclassified as clouds by the VIIRS cloud product or removed during the additional cloud screening steps introduced in this study. For heavy aerosol plumes, much larger areas could be detected as “light sources” due to enhanced diffuse radiation (e.g., Fig. 11) and have different mean geolocations than low aerosol loadings and cloud-free nights, and thus would be removed due to the geolocation checks, as mentioned in Sect. 3.2. A data loss, especially for heavy aerosol cases, is experienced in this study due to those stringent data screening steps. Also, for the purpose of avoiding cloud or lightning contamination in this study, ΔIa values were not derived from nights with the highest radiance or standard deviation of radiance values. Doing so creates a problem for regions that have frequent heavy aerosol plume loading, such as UP.
Both issues mentioned above may be mitigated by constructing a prescribed city pattern for each light source based on a multi-night composite from cloud-free and low aerosol loading conditions. In that case, light source pixels from the exact same location would be used each night to reduce data loss, especially for nights with heavy aerosol plumes. In constructing the predefined city pattern, ΔIa values may also be derived. The construction of a prescribed city pattern will be attempted in a future study.
Even after vigorous attempts at cloud screening some cloud contamination remains. Such conditions may account for high VIIRS AOT but low CALIOP or AERONET AOT cases in Figs. 6–8, although both daytime AERONET data and CALIOP data have their own issues for representing nighttime aerosol optical depth, as discussed. More advanced cloud screening methods are needed to improve the screening-out of residual clouds. In addition, snow and ice cover poses challenges for this study, and new methods need to be developed to account for snow and ice coverage and allow for attempts at nighttime AOT retrievals over those scenes.
Even the algorithm as presented shows a capacity for retrieving nighttime AOT. Given that there are hundreds of thousands of cities and towns across the world that could serve as sources for this algorithm, the composite of retrievals from artificial light sources may provide a tractable means to attaining regional to global description of nighttime aerosol conditions, on both moonlit and moon-free nights and over both dark and bright land surfaces. Considering the current glaring nocturnal gap in AOT, the current results show promise for providing closure and thereby enabling cloud and aerosol process studies and improved parameterizations for weather and climate modeling.
In this study, based on Visible Infrared Imager Radiometer Suite (VIIRS) Day/Night band (DNB) data from 2015, we examined the characteristics of artificial light sources for selected cities in the US, India and the Middle East regions. Our findings point toward the following key conclusions.
Radiance from artificial light sources is a function of time of year, lunar illumination and geometry, and viewing geometry. Larger radiance values and spikes in radiance values can occur during the winter season, possibly related to snow and ice cover, indicating the need for careful snow and ice detection for nighttime retrievals using VIIRS data for regions that may experience snow and ice coverage. The normalized radiance increases with lunar fraction and decreases with increasing lunar zenith angle – as these parameters are tied to the magnitude of downwelling moonlight.
The normalized standard deviation of artificial light source radiance is a function of time of year and similar to normalized radiance and exhibits spikes during the winter season. However, no significant relationship was found between the normalized standard deviation of radiance and lunar characteristics, including lunar fraction and lunar zenith angle. This finding suggests that the standard deviation of radiance, as opposed to radiance, is a potentially more robust parameter for nighttime aerosol retrievals using VIIRS DNB data.
Both the normalized radiance and the normalized standard deviation of radiance are a strong function of satellite viewing angle, with larger normalized radiance and the normalized standard deviation of radiance values occurring at higher satellite viewing angles. As anticipated by past research, this viewing angle dependency must be accounted for in VIIRS DNB nighttime aerosol retrievals based on artificial light sources.
Preliminary evaluations over the US for 200 selected cities, over the Middle East for 999 cities and towns and over India for 2995 cities and towns (excluding the state of Uttar Pradesh in India) show reasonable agreements between VIIRS nighttime aerosol optical thickness (AOT) values and AOT values estimated by adjacent daytime AErosol RObotic NETwork (AERONET) and nighttime Cloud-Aerosol Lidar with Orthogonal Polarization (CALIOP). This finding suggests that the use of artificial light sources has the potential to be viable for regional as well as global nighttime aerosol retrievals.
Poor correlation was found between VIIRS nighttime AOTs and daytime AERONET AOTs for the state of Uttar Pradesh in India. This region is frequently covered by thick aerosol plumes, and this may introduce a difficulty in constructing cloud- and aerosol-free night characteristics of artificial light sources (ΔIa) for the retrieval process. Based on this finding, we conclude that detailed analysis, and perhaps selection by hand of non-turbid baseline conditions, is needed for estimating ΔIa values in regions of climatologically high and persistent turbidity.
In contrast with McHardy et al. (2015), the need for a diffuse correction in the nighttime aerosol retrieval process was found here to indeed be important for regions with heavy aerosol loadings. This study further suggests that radiative-transfer-model-based estimations of the diffuse correction term compare reasonably well with empirically derived values over the Middle East, where the dominant aerosol type is dust. However, in cases such as the Indian region, where several aerosol types may be expected during a year, a larger data spread was found and specification of the diffuse correction term requires additional study.
Despite the advances made here, many limitations to the current algorithm remain. For example, snow, ice and cloud contamination can significantly affect the retrieved AOTs. Advanced procedures for snow, ice and cloud removal are needed, with a full evaluation of the potential impact. Also, high aerosol loading may be screened out due to misclassification of thick aerosol plumes as clouds. A pattern-based artificial light source method will be examined in a future study as one approach to mitigate this issue. Despite these known issues, these low-light studies forge a promising new pathway toward providing nighttime aerosol optical property information on the spatial and temporal timescales of value to the significant needs of the aerosol modeling community in terms of regional to global nighttime aerosol property information (e.g., Zhang et al., 2014).
All data used in this study are publicly available. The VIIRS data were obtained from the NOAA CLASS site (https://www.avl.class.noaa.gov/saa/products/welcome, NOAA, 2019). The AERONET data were obtained from the NASA AERONET site (https://aeronet.gsfc.nasa.gov/, NASA Goddard Space Flight Center, 2019). The CALIOP data were obtained from the NASA Langley Research Center Atmospheric Science Data Center (https://eosweb.larc.nasa.gov/project/calipso/calipso_table, NASA Langley Research Center, 2019). The global city database used in this study is a free open-source dataset. This product includes data created by MaxMind, available from https://www.maxmind.com/ (MaxMind, 2018).
The supplement related to this article is available online at: https://doi.org/10.5194/amt-12-3209-2019-supplement.
Authors JZ, JSR, and SDM designed the research concept. Authors JSR, SDM, SLJ, and JS provided constructive suggestions during the study. Authors JZ, SLJ, and TDT conducted data processing. All authors participated in the writing of the manuscript.
The authors declare that they have no conflict of interest.
This article is part of the special issue “Holistic Analysis of Aerosol in Littoral Environments – A Multidisciplinary University Research Initiative (ACP/AMT inter-journal SI)”. It is not associated with a conference.
We thank the AERONET team for the AERONET data. We thank the two anonymous reviewers for their constructive suggestions.
This research has been supported by the Office of Naval Research (grant no. N00014-16-1-2040) and the NOAA JPSS Program Office. Shawn L. Jaker was partially supported by the NASA (grant no. NNX17AG52G), the NSF (grant no. IIA-1355466).
This paper was edited by Sebastian Schmidt and reviewed by two anonymous referees.
Barreto, A., Cuevas, E., Damiri, B., Guirado, C., Berkoff, T., Berjón, A. J., Hernández, Y., Almansa, F., and Gil, M.: A new method for nocturnal aerosol measurements with a lunar photometer prototype, Atmos. Meas. Tech., 6, 585–598, https://doi.org/10.5194/amt-6-585-2013, 2013.
Berkoff, T. A., Sorokin, M., Stone, T., Eck, T. F., Raymond Hoff, R., Welton, E., and Holben, B.: Nocturnal Aerosol Optical Depth Measurements with a Small-Aperture Automated Photometer Using the Moon as a Light Source, J. Atmos. Ocean. Tech., 28, 1297–1306, 2011.
Chen, H., Xiong, X., Sun, C., Chen, X., and Chiang, K.: Suomi-NPP VIIRS day–night band on-orbit calibration and performance, J. Appl. Remote. Sens., 11, 36019, https://doi.org/10.1117/1.JRS.11.036019, 2017.
Choo, G. H. and Jeong, M. J.: Estimation of nighttime aerosol optical thickness from Suomi-NPP DNB observations over small cities in Korea, Korean Journal of Remote Sensing, 32, 73–86, 2016.
Elvidge, C. D., Baugh, K., Zhizhin, M., Hsu, F. C., and Ghosh, T.: VIIRS Night-Time Lights, Int. J. Remote Sens., 38, 5860–5879, 2017.
Godin, R. and Vicente, G.: Joint Polar Satellite System (JPSS) Operational Algorithm Description (OAD) Document for VIIRS Cloud Mask (VCM) Intermediate Product (IP) Software, National Aeronautics and Space Administration (NASA), Greenbelt, Maryland, Goddard Space Flight Center, available at: https://jointmission.gsfc.nasa.gov/sciencedocs/2015-08/474-00062_OAD-VIIRS-Cloud-Mask-IP_I.pdf (last access: 2 November 2018), 2015.
Holben, B. N., Eck, T. F., Slutsker, I., Tanré, D., Buis, J. P., Setzer, A., Vermote, E., Reagan, J. A., Kaufman, Y. J., Nakajima, T., Lavenu, F., Jankowiak, I., and Smirnov, A.: AERONET – A Federated Instrument Network and Data Archive for Aerosol Characterization, Remote Sens. Environ., 66, 1–16, 1998.
Johnson, R. S., Zhang, J., Hyer, E. J., Miller, S. D., and Reid, J. S.: Preliminary investigations toward nighttime aerosol optical depth retrievals from the VIIRS Day/Night Band, Atmos. Meas. Tech., 6, 1245–1255, https://doi.org/10.5194/amt-6-1245-2013, 2013.
Lee, T. E., Miller, S. D., Turk, F. J., Schueler, C., Julian, R., Deyo, S., Dills, P., and Wang, S.: The NPOESS VIIRS day/night visible sensor, B. Am. Meteorol. Soc., 87, 191–199, 2006.
MaxMind: Free World Cities Database, available at: https://www.maxmind.com/, last access: 11 May 2018.
McHardy, T. M., Zhang, J., Reid, J. S., Miller, S. D., Hyer, E. J., and Kuehn, R. E.: An improved method for retrieving nighttime aerosol optical thickness from the VIIRS Day/Night Band, Atmos. Meas. Tech., 8, 4773–4783, https://doi.org/10.5194/amt-8-4773-2015, 2015.
Miller, S. D., Straka III, W., Mills, S. P., Elvidge, C. D., Lee, T. F., Solbrig, J., Walther, A., Heidinger, A. K., and Weiss, S. C.: Illuminating the Capabilities of the Suomi National Polar-Orbiting Partnership (NPP) Visible Infrared Imaging Radiometer Suite (VIIRS) Day/Night Band, Remote Sens., 5, 6717–6766, 2013.
Mills, S., Weiss, S., and Liang, C.: VIIRS Day/Night Band (DNB) Stray Light Characterization and Correction, Proceedings SPIE 8866, Earth Observing Systems XVIII, 88661P, https://doi.org/10.1117/12.2023107, 2013.
NASA Goddard Space Flight Center: Aerosol Robotic Network, The NASA AERONET site, available at: https://aeronet.gsfc.nasa.gov/ last access: 11 June 2019.
NASA Langley Research Center: Atmospheric Science Data Center, CALIOP data site, available at: https://eosweb.larc.nasa.gov/project/calipso/calipso_table last access: 11 June 2019.
NOAA: The NOAA Comprehensive Large Array-Data Stewardship System, The NOAA CLASS site, available at: https://www.avl.class.noaa.gov/saa/products/welcome, last access: 11 June 2019.
Omar, A. H., Winker, D. M., Tackett, J. L., Giles, D. M., Kar, J., Liu, Z., Vaughan, M. A., Powell, K. A., and Trepte, C. R.: CALIOP and AERONET aerosol optical depth comparisons: One size fits none, J. Geophys. Res.-Atmos., 118, 4748–4766, https://doi.org/10.1002/jgrd.50330, 2013.
Remer L. A., Kaufman, Y. J., Tanré, D., Mattoo, S., Chu, D. A., Martins, J. V., Li, R.-R., Ichoku, C., Levy, R. C., Kleidman, R. G., Eck, T. F., Vermote, E., and Holben, B. N.: The MODIS Aerosol Algorithm, Products, and Validation, J. Atmos. Sci., 62, 947–973, 10.1175/JAS3385.1, 2005.
Toth, T. D., Campbell, J. R., Reid, J. S., Tackett, J. L., Vaughan, M. A., Zhang, J., and Marquis, J. W.: Minimum aerosol layer detection sensitivities and their subsequent impacts on aerosol optical thickness retrievals in CALIPSO level 2 data products, Atmos. Meas. Tech., 11, 499–514, https://doi.org/10.5194/amt-11-499-2018, 2018.
Vermote, E. F., Tanré, D., Deuzé, J. L., Herman, M., and Morcrette, J. J.: Second simulation of the satellite signal in the solar spectrum, 6S: an overview, IEEE T. Geosci. Remote, 35, 675–686, 1997.
Wang, J., Aegerter, C., Xu, X., and Szykman, J. J.: Potential application of VIIRS Day/Night Band for monitoring nighttime surface PM2.5 air quality from space, Atmos. Environ., 124, 55–63, 2016.
Zhang, J., Reid, J. S., and Holben, B. N.: An analysis of potential cloud artifacts in MODIS over ocean aerosol optical thickness products, Geophys. Res. Lett., 32, L15803, https://doi.org/10.1029/2005GL023254, 2005.
Zhang, J., Reid, J. S., Turk, J., and Miller, S.: Strategy for studying nocturnal aerosol optical depth using artificial lights, Int. J. Remote Sens., 29, 4599–4613, 2008.
Zhang J., Reid, J. S., Campbell, J. R., Hyer, E. J., and Westphal, D. L.: Evaluating the Impact of Multi-Sensor Data Assimilation on A Global Aerosol Particle Transport Model, J. Geophys. Res.-Atmos., 119, 4674–4689, https://doi.org/10.1002/2013JD020975, 2014.