the Creative Commons Attribution 4.0 License.
the Creative Commons Attribution 4.0 License.
Evaluation of differential absorption radars in the 183 GHz band for profiling water vapour in ice clouds
Pavlos Kollias
Relative humidity (RH) measurements in ice clouds are essential for determining ice crystal growth processes and rates. A differential absorption radar (DAR) system with several frequency channels within the 183.3 GHz water vapour absorption band is proposed for measuring RH within ice clouds. Here, the performance of a DAR system is evaluated by applying a DAR simulator to A-Train observations in combination with co-located European Centre for Medium-Range Weather Forecasts (ECMWF) reanalysis. Observations from the CloudSat W-band radar and from the CALIPSO lidar are converted first into ice microphysical properties and then coupled with ECMWF temperature and relative humidity profiles in order to compute scattering properties at any frequency within the 183.3 GHz band. A self-similar Rayleigh–Gans approximation is used to model the ice crystal scattering properties. The radar reflectivities are computed both for a space-borne and airborne and a ground-based DAR system by using appropriate radar receiver characteristics. Sets of multi-frequency synthetic observation of attenuated reflectivities are then exploited to retrieve profiles of water vapour density by fitting the line shape at different levels. A total of 10 d of A-Train observations are used to test the measurement technique performance for different combinations of tones when sampling ice clouds globally. Results show that water vapour densities can be derived at the level that can enable ice process studies (i.e. better than 3 %), both from a ground-based system (at the minute temporal scale and with circa 100 m vertical resolution) and from a space-borne system (at 500 m vertical resolution and with circa 5 km integration lengths) with four tones in the upper wing of the absorption line. Deploying ground-based DAR system at high latitudes and high altitudes is highly recommended to test the findings of this work in the field.
- Article
(3863 KB) - Full-text XML
- BibTeX
- EndNote
Adequate understanding of the cloud and precipitation processes that contribute to Earth's water and energy cycle is required before significant progress can occur in our ability to predict future climate scenarios. This calls for a paradigm shift away from the current observing system that mainly capture snapshots of “states” to the next generation of observing systems that can observe both states and “processes” (Stephens et al., 2018).
Future space-borne cloud and precipitation radars are expected to be at the centre of such a revolution (The Decadal Survey, 2017), thus enhancing the view depicted in the past 20 years by the Tropical Rainfall Measuring Mission (TRMM) Ku-band Precipitation radar (Kummerow et al., 1998), the Global Precipitation Mission (GPM) Dual-frequency (Ku–Ka) Precipitation Radar (Skofronick-Jackson et al., 2016) and the CloudSat W-band Cloud Profiling Radar (Tanelli et al., 2007). While the first Doppler radar is expected to be launched on board the EarthCARE satellite in 2021 (Illingworth et al., 2015), innovative radar concepts have been studied in the past decade, ranging from multi-wavelength radars proposed, e.g. as payloads of the Aerosol/Cloud/Ecosystems (ACE) mission and the Polar Precipitation Measurement (PPM) mission, for microphysical studies, (Leinonen et al., 2015; Joe et al., 2010; Durden et al., 2016; Tanelli et al., 2018), to Doppler radars for understanding cloud dynamics (Battaglia and Kollias, 2014; Illingworth et al., 2018; Battaglia et al., 2018; Kollias et al., 2018), and to constellations of radars in a CubeSat for advancing convective parameterizations (Peral et al., 2015; Haddad et al., 2017; Sy et al., 2017).
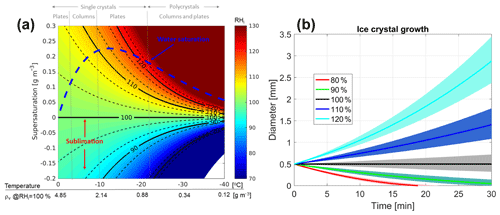
Figure 1(a) Temperature in ∘C vs. supersaturation in g m−3. The colour maps the relative humidity with respect to ice, RHi. The dashed blue line indicates the supersaturation of supercooled water relative to ice. Black lines correspond to different levels of RHi as indicated by the labels. The dashed lines surrounding each continuous line correspond to a ±3 % change in RHi. Some of the dominant ice crystal habits, as suggested by Bailey and Hallett (2009) for different environmental conditions, are indicated at the top of the figure. (b) Temporal evolution of the diameter of a 500 µm crystal environment with different supersaturation RHi (as indicated in the legend) and at T=260 K and p=500 mb. The shading corresponds to a ±3 % perturbation in RHi. The rate of mass change is assumed to be driven by diffusional growth or sublimation (description provided in Field et al., 2008) with the Brown and Francis (1995) mass–size relationship.
In parallel, radar systems operating at much higher frequencies such as the G band (110–300 GHz) have been proposed to study ice and snow microphysical properties (Hogan and Illingworth, 1999; Battaglia et al., 2014). Furthermore, there is interest in exploring the possibility of profiling the water vapour in cloudy areas (Lebsock et al., 2015; Millán et al., 2016; Roy et al., 2018) by using differential absorption radar (DAR) measurements near the 183.3 GHz water vapour absorption line. Water vapour is one of the most critical atmospheric variables for numerical weather prediction models (Millán et al., 2016) and profiles of humidity in cloudy areas are not adequately measured by current or planned systems, as stated by the World Meteorological Organization (Anderson, 2014; Nehrir et al., 2017). While Lebsock et al. (2015) theoretically investigated the possibility of profiling water vapour within the cloudy boundary layer in the presence of cumulus and stratocumulus clouds and of quantifying integrated column water vapour over ocean surfaces with a DAR system with channels on the upper wing of the 183.3 GHz absorption line, Millán et al. (2016) examined how the DAR technique can be applied to water vapour sounding in clouds at all levels by adopting multiple tones within the whole absorption band (140 to 200 GHz). A serious issue that must be considered is that international frequency allocations currently prohibit space-borne transmission at frequencies between 174.8 and 191.8 GHz due to reservation for passive-only remote sensing. In contrast, allocations are more flexible for ground-based instruments.
Recently, the DAR technique within the G band has been demonstrated by Cooper et al. (2018): not only ground-based measurements of planetary boundary layer clouds have also been performed but an error model and an inversion algorithm have been developed for retrieving the water vapour profile (Roy et al., 2018). An initial assessment of the performances of such retrievals have been performed for boundary layer clouds.
This work aims to assess the potential of both space-borne and ground-based DAR systems, with a specific focus on water vapour profiling in ice cloud studies. When coupled with that of temperature the knowledge of the water vapour density in ice clouds has three benefits.
-
It allows us to derive the relative humidity (RH) with respect to ice (RHi) and then to identify regions where depositional growth and sublimation processes are dominant (i.e. when the supersaturation is positive or negative in Fig. 1). Particle growth by deposition is an important growth process in cold environments, particularly when supercooled liquid water layers provide sufficient water vapour for rapid growth (i.e. in regions above the dashed blue line in Fig. 1a). Figure 1b shows, for instance, the growth rate of an initial 500 µm ice crystal for different RHi conditions, clearly highlighting how the ice crystal growth rate is affected by RHi.
DAR observations could complement polarimetric radar observations like differential reflectivity, which are particularly sensitive to depositional growth in temperature regions that favour growth of asymmetric particle shapes (e.g. Verlinde et al., 2013; Oue et al., 2016).
-
The detection and the description of supersaturation areas in high-level ice clouds could help us understand how ice crystal growth significantly enhances water mass fluxes due to sedimentation. This could have an impact on the dehydration of the air entering the lower stratosphere (Kärcher et al., 2014).
-
It may contribute to identifying ice crystal habits based on knowledge of the dominant growth in the different portions of the clouds, based on thermal and moisture conditions, as suggested by Bailey and Hallett (2009) (dominant habits reported at the top of Fig. 1). This identification may indeed be complicated by the fact that substantial changes in habit can occur due to vertical transport caused by convection or sedimentation with ice crystals experiencing temperature changes of tens of K across their lifetime. Since the shape and internal mass distribution of the ice particles affects their scattering properties, this has an immediate impact onto improving remote sensing retrievals.
The water vapour density for a given relative humidity is a strong function of temperature: for instance, for RHi=100 % the water vapour density, ρv, changes by more than 1 order of magnitude (from 4.85 to 0.34 g m−3; see x axis in Fig. 1) when moving from 0 to −30 ∘C. A knowledge of RHi within 5 %–7 % seems appropriate for identifying the relevant regimes in Fig. 1. Since (with ρs,i being the water vapour density in saturated condition with respect to ice), the uncertainty in RHi is affected by the uncertainty in the numerator and in the denominator. The uncertainty in the denominator is driven by the uncertainty in the temperature: an error of 1 K propagates into an 8 % to 10 % error in ρs,i, with temperatures ranging from 0 to −30 ∘C. Uncertainties in current analyses of atmospheric temperatures are strongly region dependent, with large uncertainties over polar, oceanic and developing nations which lack frequent radio soundings (Langland et al., 2008). Temperature uncertainties on the order of less than 1 K or better are expected from reanalysis in the middle and upper troposphere and in regions where radiosonde observations are plentiful. Advances in hyperspectral microwave sounders promise to reduce errors in temperature profiling to 0.5 K (Blackwell et al., 2011; Aires et al., 2019), and this figure is certainly in reach for ground locations hosting a remote sensing observatory. This highlights that in order to retrieve useful information for ice cloud studies water vapour densities must be retrieved within ∼3 %–5 % or better – this in order to account for the previously mentioned additional uncertainty due to temperature – for a range of values between 0.5 and 5 g m−3.
The previous study by Millán et al. (2016) has clearly demonstrated that, when dealing with DAR profiling capabilities, the main roadblock for the use of space-borne DAR measurements in process studies is represented by the precision of the measurements with potential biases being generally much smaller (e.g. see their Fig. 7). The key science question that we aim to answer in this work is therefore whether or not it is possible to beat the noise of the measurement (by averaging and by including more tones) to the level at which water vapour profiling in ice clouds could help in refining our understanding of microphysical processes. Our strategy is therefore to exploit the novel retrieval model proposed in Roy et al. (2018) in assessing the precision of DAR techniques in profiling ice clouds both from a ground and a space-borne perspective. This will allow us to draw some conclusions on the potential of such observations for ice studies.
The paper is structured as follows: first the theory of water vapour retrieval with DAR is shortly revisited (Sect. 2). In Sect. 3 CloudSat observations are used to reconstruct realistic ice microphysics profiles that can be used as input in a forward model for simulating reflectivity profiles at any frequency in the G band. Sect. 4 presents an assessment of the performance of a DAR instrument based on a statistical analysis built on CloudSat climatology.
Conclusions and future work are presented in Sect. 5.
Here the theory underpinning DAR, thoroughly covered in Lebsock et al. (2015), Millán et al. (2016) and Roy et al. (2018), is briefly revised. The measured reflectivity from a target with effective reflectivity Ze(r,f) at a given range r is given by the following equation:
where is the one-way optical depth from the radar to the range r. The exponential term accounts for the radar attenuation due to the gases and the hydrometeors with the factor of 2 in the exponent accounting for the two-way path of the radar wave. Note that multiple-scattering effects (Battaglia et al., 2010; Matrosov and Battaglia, 2009) will be neglected hereafter since they are minimized by the small radar footprints (less than 450 m for the space-borne configuration) and the low single-scattering albedo of the medium at frequencies in the vicinity of the absorption line. Multiple scattering could be an issue for tones located far away from the absorption centre when encountering heavily rimed particles and it could potentially be flagged by introducing a cross-polar channel to measure linear depolarization ratio (like proposed in Battaglia et al., 2007). As shown afterwards, such conditions, which certainly corresponds to CloudSat reflectivities exceeding 10 dBZ, are anyhow challenging for the DAR retrieval. Following Roy et al. (2018), we consider the ratio of measured reflectivities at two ranges r1 and :
where the 〈〉Δr symbol corresponds to taking the mean value for ranges between r1 and r2 so that
is the mean extinction coefficient for such ranges. This equation can be further simplified by separating the water vapour components from the other gases and introducing the water vapour absorption coefficient per unit mass, κv, as follows:
where we have assumed in the last step that the line shape κv(f) within the Δr layer can be approximated by its value at the mean temperature and pressure of the layer and we have conjoined the dry air and hydrometeor extinction.
If we invert Eq. (3) we can then write the following:
and recombining Eqs. (5) and (4) we finally get the following equation:
The DAR rationale is based on the idea that by performing measurements of the left-hand side of Eq. (6) at different frequencies it will be possible to fit the terms on the right-hand side. The first term is directly proportional to the water vapour density via the line shape κv(f); the last two terms are related to the dry air plus hydrometeor attenuation and the effective reflectivity ratio at the two ranges (thus affected by the vertical variability). They can be assumed to vary weakly with frequency. Extinction of the supercooled droplet is indeed proportional to frequency (e.g. see Lhermitte, 1990) and ice crystals behave similarly, with a linear increase with frequency, as demonstrated in Fig. 2. Note that the ice crystal attenuation is mainly driven by scattering since the single-scattering albedo for all the cases illustrated here exceeds 0.95. Also the ice crystal attenuation is strongly dependent on the ice crystal type (i.e. on the scattering model) as already noticed in Battaglia et al. (2014), but this dependence can be factored out in the differential method because of its distinctness from the absorption band spectral feature. Therefore, the last two terms are modelled in this study via a dependence which is linear with frequency. Since the line shape κv(f) is known at a given T and p then 〈ρv〉Δr can be derived by a least-squares fitting procedure that fits all three terms on the right in Eq. (6) to the measured γ terms. The procedure also allows the computation of errors for the retrieved fitted parameters and of a quality index for the fitting via the normalized χ2. Note that the quantities are not affected by absolute calibration, which makes the whole procedure immune to calibration errors.
If only three tones are available (or the full range of tones is less than 10 GHz) then B is assumed to be equal 0 (as done in Roy et al., 2018). When only two tones are available, ρv and its error can be directly computed from the following equation:
as derived in Roy et al. (2018), where ΔZ are the uncertainties in the reflectivity measurements at the given range and frequency. This shows that the maximum achievable absolute precision in water vapour density is fixed by the given spatial resolution (i.e. the value of Δr), by the difference in the line shape κv between the two tones and by the precision of the reflectivity measurements. This has the consequence that, with the latter two factors being the same, lower values of absolute humidity will be measured with lower relative precision. Averaging over a longer path or time improves the precision because it increases Δr and the number of radar pulses (thus improves the precision of Z measurements), respectively. Adopting multiple tones allows us to improve the precision for a range of water vapour densities by finding the right balance between large differences in κv and good precision in the reflectivity signal, i.e. good signal-to-noise ratio (SNR). When multiple tones are involved, the line-fitting retrieval routine implemented in this work gives an estimate of the measurement precision by generalizing Eq. (7).
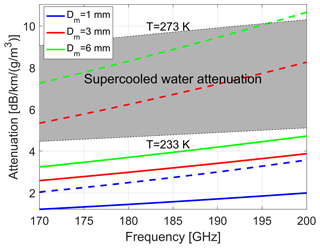
Figure 2Attenuation coefficient for ice crystals with different mass-weighted maximum particle diameters as indicated in the legend for the frequency range of interest for this study. Exponential size distributions have been assumed. Dashed and continuous lines correspond to the model “A; LWP=0.1 kg m−2” from Leinonen and Szyrmer (2015) and to the Hogan and Westbrook (2014) model, respectively. The grey-shaded area corresponds to the attenuation coefficient for supercooled liquid clouds for temperatures in the range between −30 and 0 ∘C. Water refractive index is computed according to the Ellison07 model; see Turner et al. (2016).
At present, no radar reflectivity measurements at multiple G-band tones are available that can be used to evaluate the performance of the technique. Our approach uses ice microphysical properties derived from space-borne sensors as input to a forward radar model (DAR model) to generate reflectivities around the 183.3 GHz absorption band.
The CloudSat 94 GHz (3.2 mm) Cloud Profiling Radar (CPR) provides global observations of ice cloud profiles at a vertical resolution of 480 m and a cross-track and along-track horizontal footprint of 1.5 km×2.5 km (Tanelli et al., 2008). When integrated with the observations from the CALIPSO Cloud-Aerosol Lidar with Orthogonal Polarization (CALIOP) (Winker et al., 2007) such observations can be used to retrieve ice microphysics. Here, retrievals adopting the DARDAR algorithm (Delanoë and Hogan, 2010, http://www.icare.univ-lille1.fr/projects/dardar/, last access: 20 June 2019) are used as input for the DAR modelling. ECMWF auxiliary data are used as input for temperature, pressure and relative humidity.
The DAR forward model uses the millimetre-wave propagation model from Rosenkranz (1999) for gas attenuation, whereas the self-similar Rayleigh–Gans scattering model (Hogan and Westbrook, 2014) is adopted for computing the scattering properties of ice particles. This approach has the clear advantage that scattering properties can be computed at any frequency with practically no computational cost. The ice crystals model proposed by Leinonen and Szyrmer (2015) and labelled as model “A; ” is used to derive the parameters for the self-similar model by taking into account the internal structure of the aggregates. Tridon et al. (2019) have shown that the scattering properties generated via this methodology generally fit triple frequency radar measurements and in situ measurements well.
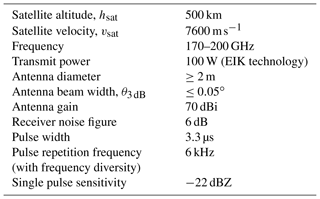
Table 1Technical specifications of the DAR space-borne system used in this study. The configuration here adopted is the one proposed in an on-going UK CEOI study (Duncan Robertson, personal communication, 2018).
Noise is injected into the reflectivity measurements according to the following formula (see the appendix in Hogan et al., 2005):
where Np is the number of transmitted radar pulses (e.g. in the space-borne configuration ∼4200 for an integration length of 5 km), τs is the time between samples (i.e. the reciprocal of the pulse repetition frequency) and σv is the spectral width of the Doppler spectrum. For space-borne systems the first term inside the bracket is practically always close to one because the Doppler spectral width is expected to exceed 2 m s−1 due to the large satellite velocity (see Eq. 6 in Battaglia and Kollias, 2014). The first term inside the square bracket needs to be at least one because the number of independent samples has to be smaller or equal to the number of samples. This implies that the so-called “time to independence” is of the order of 100 µs, thus smaller than the time between pulses (equal to 166.7 µs for a PRF=6 kHz). The single pulse sensitivity is assumed to be −22 dBZ, a realistic value with current technology (see Table 1). For ground-based systems on the other hand we have assumed a spectral width equal to 1 m s−1 and a single pulse sensitivity of −50 dBZ at 1 km range with 1 s integration (see Table 2). The DAR system shown in Table 1 is for a 2 % duty cycle, 100 W peak output power Extended Interaction Klystron (EIK) system. The Communications and Power Industries (CPI) instruments have about 15 GHz bandwidth. Selecting a number of tones (e.g. four) is technologically feasible using a single chirp generator and four intermediate chains, which are switched between them to select the tone. The switching can be done from pulse to pulse.
Table 2Specifics of the frequency-modulated continuous wave radar based on W-band power amplifier and GaAs Schottky diode frequency multiplication (Nils et al., 2017) for the ground-based simulation (Peter Huggard, personal communication, 2018).
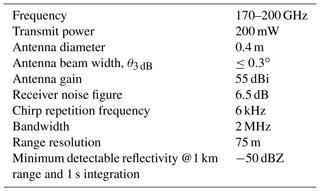
In addition to high-power sources (EIK), lower-power sources are available either using frequency multipliers coupled with commercially available amplifiers or microwave sources and oscillators (Virginal Diodes, https://www.vadiodes.com/, last access: 20 June 2019). Recently, the Jet Propulsion Laboratory developed a new power approach using GaAs Schottky diode frequency 2× multipliers at 183 GHz. Preliminary estimates of the expected radar sensitivity using these different architectures indicate that a minimum sensitivity of −22 dBZ is possible for four different tones. The impact of reducing the number of samples to accommodate additional tones is discussed in Sect. 4.
Case study
The methodology is demonstrated for a precipitating system observed by CloudSat over the Southern Ocean between Antarctica and South America on the 2 January 2007 at about 20:16 UTC. The system extends for roughly 1300 km with the temperature at the surface ranging from 281 K at the southern edge of the system to 274 K at the northern edge of the system. The CloudSat 94 GHz reflectivity as derived from the 2B-GEOPROF product (Mace et al., 2007) is shown in Fig. 3a. The zero isotherm clearly demarcates the ice vs. liquid transition. The co-located ECMWF reanalysis for the relative humidity field with respect to ice is depicted in Fig. 3b. In the glaciated region of the precipitating system, the synergy between the CloudSat radar and the CALIPSO lidar (Sassen et al., 2008) offers a unique perspective on the ice microphysics (Battaglia and Delanöe, 2013). The outputs of the DARDAR retrieval (Delanoë and Hogan, 2010) are shown in Fig. 3c and d.
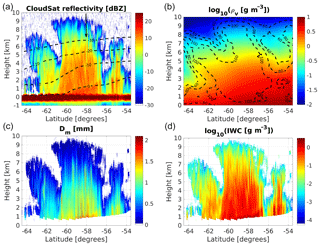
Figure 3(a) CloudSat measured reflectivity in the Southern Ocean southwest of Cape Horn. Dashed black lines correspond to different isotherms as labelled, while the black arrow corresponds to the profile analysed in Fig. 5. (b) Water vapour density as derived from ECMWF reanalysis with regions of constant relative humidity with respect to ice depicted as dashed lines. (c, d) Mean mass-weighted diameter of ice particle (c) and ice water content (d) as retrieved by the DARDAR product.
These microphysical outputs are then used with lookup tables generated from scattering models to compute reflectivities at any frequency within the 183.3 GHz absorption line. Examples of two pairs of frequencies (187 and 200 GHz for the space-borne and 186.3 and 200 GHz for the ground-based configurations, respectively) are shown in Fig. 4. It is interesting to note how differently the two frequencies penetrate into the precipitating system, with the 187 GHz (186.3 GHz) severely attenuated by water vapour below 4 km (above 3 km) in the space-borne (ground-based) configuration. On the other hand, the 200 GHz is clearly attenuated in the region below 2 km at latitudes between −60 and −58∘, a combined result of large ice water and water vapour contents.
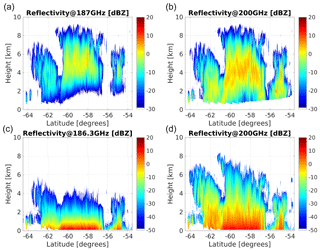
Figure 4Simulated reflectivities at 187 and 200 GHz (186.3 and 200 GHz) for a space-borne (a, b) and ground-based (c, d) systems, with specifics as in Table 1 for the scene shown in Fig. 3. The ground-based system is assumed to be located at the 270 K isotherm line drawn in Fig. 3a. Note the different ranges in the reflectivity colour bars of (a, b) and (c, d) driven by the better sensitivity achieved by the ground-based system at short ranges.
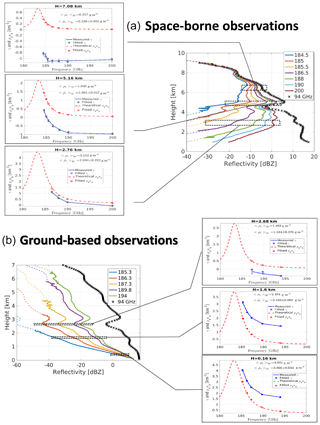
Figure 5(a) Simulated reflectivities for the profile at latitude −58.07∘ (black arrow in Fig. 3a) for a seven-channel space-borne DAR with frequencies on the upper wing of the 183.3 GHz line. An integration length of 1.1 km is assumed (corresponding to Np=920). The CloudSat 94 GHz profiles is shown for reference as well (black crosses). Continuous (dashed) lines correspond to reflectivities including (without) noise. The associated sets of three insets for each panel show examples of the fitting procedure at three different altitudes to estimate 〈ρv〉Δr with Δr=500 m. True and estimated values are inserted in the figure. (b) Same as (a) for a five-tone ground-based DAR. An integration time of 2 min (corresponding to Np=720 000) and a vertical resolution of 120 m are assumed.
The profile at latitude −58.07∘ (black arrow in Fig. 3a) is used here to demonstrate how to derive a water vapour profile in a three-step procedure (see Fig. 5):
-
an interval Δr is selected and the profiles of the quantity γ(fj,r) (see Eq. 6) are computed with their corresponding errors (computed from the estimated errors on the measured reflectivities via Eq. 8) at the different DAR frequencies f1, f2, etc. (continuous blue lines with bars in the small insets of Fig. 5);
-
the spectral dependence of the line shape is derived at each level (dashed red lines in the small insets of Fig. 5) by using the average temperature and pressure of the layer and the gas absorption model;
-
a least-squares fitting procedure of the form expressed in Eq. (6) that accounts for the errors in γ(fj,r) allows us to retrieve estimates of the three fitting parameters (, and . γ values that are too noisy are excluded from the fitting, e.g. at 2.76 km only four tones are considered for the space-borne configuration.
For the space-borne configuration the retrieval shows that a set of seven-tone DAR with frequencies on the upper wing of the 183.3 GHz band, as listed in the legend of Fig. 5a, can retrieve water vapour within the ice cloud with good precision (i.e. within 15 %) from 7.0 km (240 K) down to 2.5 km (268 K), with water vapour contents changing by more than 1 order of magnitude. The relative error in the retrieval of ρv for the whole case study shown in Fig. 3 is reproduced in the Fig. 6a. Clearly there are two critical regions: (1) at low temperatures ( ∘C) low values of ρv limit the amplitude of the signal (e.g. compare the red curves between the top three small insets in Fig. 5); (2) at warm temperatures ( ∘C) and large CloudSat reflectivities the cumulated attenuation tends to strongly reduce the SNR, and therefore (see Eq. 8) increase the uncertainty of the reflectivity measurements as a result of γ(fj,r). In both situations the retrieval errors become large, but such deterioration can be clearly identified by looking at the SNR of the different DAR channels and at the associated error induced in the estimated value of water vapour, .
The same profile has also been used to analyse the performance of a ground-based instrument by assuming that the instrument is located at the −3 ∘C isothermal line and is looking upward. Again, tones in the upper wing of the absorption band are selected. The simulated reflectivities, shown in the bottom panels of Figs. 4–5, show strong attenuation in the lower troposphere with the tones close to the centre of the line already reaching the noise level just above 2 km. The only tones that can penetrate deep into the clouds are the ones that do not have enough water vapour signal high up in the troposphere (e.g. the highest three tones at 2.68 km; see bottom small insets in Fig. 5). This demonstrates why, while the precision of the retrieval in the lower troposphere is excellent, it deteriorates quickly above 2.5 km. Figure 6b demonstrates the same thing for the whole event: the precision of the retrieval quickly worsens at 2 to 2.5 km above the ground, where temperatures decrease to values lower than −15 ∘C. On the other hand, by integrating for periods of the order of 1–2 min, ground-based system can achieve extremely accurate results for temperature between 0 and −15 ∘C.
Compared to the space-borne set-up things are expected to substantially improve when dealing with an airborne configuration (bottom panels). The key advantages are (1) better sensitivity because of closer distance to the target and a (2) slower platform speed that allows us to collect more pulses for the same integration length. As a result the precision and/or the resolution of the retrieval are significantly improved compared to the space-borne configuration (contrast Fig. 6a and c–d). The two bottom panels demonstrate the trade off between long and short pulses for the airborne mode. In the left panel a pulse which is 4 times shorter than that in the right panel is adopted (i.e. 120 vs. 480 m). As a result, the sensitivity is 12 dB (a factor of 16) better in the latter case, which translates to a much better precision of the retrieval. Thus, it is recommended to use pulses that match the required vertical resolution because SNR is a critical parameter for the precision of the measurement. Averaging more gates does not recover the same precision.
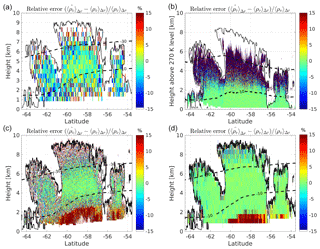
Figure 6(a) Relative error in the retrieval of ρv for the case study shown in Fig. 3 for a seven-channel space-borne DAR with frequencies as listed in the legend in Fig. 5a. Here Δr=480 m and a 5 km along-track averaging has been performed. The dashed lines correspond to the −30 and −10 ∘C isotherms and the black line corresponds to CloudSat reflectivities of −25 dBZ (roughly indicating the cloud boundaries). (b) Same as (a) for a five-tone ground-based DAR with frequencies as listed in the legend on the bottom side of Fig. 5. Here Δr=120 m and a 2 min averaging has been performed. (c, d) Same as (a) for an airborne system with Δr=120 m (c) and Δr=480 m (d) and a 1 km along-track averaging. The single pulse sensitivity is assumed to be −33 dBZ (c) and −45 dBZ (d) at 1 km distance.
This case study highlights that sounding ice clouds by airborne or space-borne DAR systems is clearly advantageous with respect to ground systems because regions with low water vapour contents (thus low attenuation) are encountered first. This implies that tones close to the line centre can stay well above the minimum detection threshold (MDT) in the areas where they provide useful information (i.e. at low water vapour contents). The same is not true for ground-based geometry because, unless the temperature at the ground is very cold, large levels of attenuation are experienced by the radar pulse in the lower troposphere.
The A-Train has provided the first global climatology of ice clouds with a detailed description of ice cloud occurrences, ice microphysics and ice radiative effects (Hong and Liu, 2015). The A-Train ice cloud dataset therefore represents an ideal test bed to investigate the potential of a DAR system for measuring relative humidity inside ice clouds. The methodology described in Sect. 3 has been applied to 10 d of CloudSat data (from 1 to 10 January 2007) to study the performances both of a space-borne and a ground-based DAR system with several channels within the 183.3 GHz absorption band. The ground-based system is assumed to look upward from the height corresponding to the 270 K isothermal level, as identified by the ECMWF reanalysis. For any profile with an ice water path exceeding 20 g m−2 the profile of water vapour is retrieved via the DAR technique and, by comparing such values with the assumed one (from ECMWF reanalysis), the relative error of ρv is computed. Results are binned according to the CloudSat reflectivity values (above −10 and −25 dBZ for the space-borne and ground-based system, respectively) and the ambient temperatures (above 240 K). Figure 7 shows the fractional occurrence when the DAR systems provide ρv with precision better than 3 % (i.e. a very valuable information). For the space-borne system there is an optimal region between −5 and 15 dBZ and for temperatures between 250 and 265 K. Results tends to worsen at temperatures close to 273 K and at very high W-band CloudSat reflectivities, which occur typically at higher temperatures (a result of the reduced number of tones with signal significantly above the noise floor) but also at very cold temperatures (a result of the reduced absorption for tones further away from the band centre) and low CloudSat reflectivities (a result of the reduced SNR).
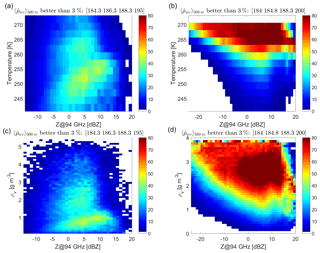
Figure 7Statistical analysis based on 10 d of CloudSat showing the expected frequency occurrence of retrievals of ρv better than 3 % for a space-borne system (a, c) and a ground-based system with ground temperature of 270 K (b, d). Results are clustered using reflectivities vs. temperatures (a, b) or water vapour contents (c, d). The specifications of the systems correspond to four-tone DARs, which are optimized for ice cloud studies.
For the ground-based system (Fig. 7b and d) ρv is optimally retrieved in the lower troposphere with the quality of the retrieval typically worsening with decreasing temperatures and decreasing reflectivities (due to the reduced SNRs). The only exception is at very large reflectivities, where non-linearities of the right-hand term in Eq. (6) introduced by Mie and attenuation effects cause larger errors.
We have selected different combinations with 2, 3, 4 and 5 tones and we have analysed which combinations achieve the best retrieval performances. As a first step we have assumed that the sensitivity of the system does not change when increasing the number of tones. This is the case if the duty cycle of the radar system could be increased accordingly and frequency diversity could be implemented. Otherwise the sensitivity of each channel decreases with because of the reduction in the number of samples Np, and the effect will be discussed later. Results are summarized in Fig. 8. Clearly increasing the number of tones (all with the same sensitivities) is beneficial but the improvement when surpassing four tones is marginal (e.g. compare the four with the five and six tones). On the other hand, it is obvious that improving the SNR generally produces better results via a reduction of the noise in the reflectivity measurements according to Eq. (8). For instance, for the two- and four-tone curves the impact of the improvement corresponding to a variation by a factor of 2 in sensitivity (±3 dB) is illustrated in Fig. 8 by the shading. As a result there is indeed an improvement in water vapour profiling when using four vs. two channels. In fact there is the obvious advantage that with four tones it is possible to perform the three-parameter fit of Eq. (6), thus avoiding the biases introduced by frequency-dependent hydrometeor scattering effects. This remains true even when considering DAR configurations with the same duty cycle. In that case, doubling the number of channels corresponds to averaging half the number of samples, which equates to a reduction of 1.5 dB in sensitivity (so roughly half the range currently shown by the shaded area). But the blue-shaded region remains well above the red-shaded region.
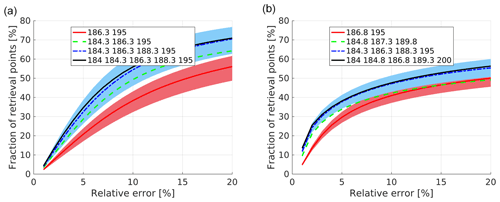
Figure 8Fraction of retrieval points (y axis) having errors lower than a given threshold (x axis) for the space-borne configuration (a) and the ground-based configuration (b) with 2, 3, 4 and 5 tones. Only the combinations that achieve the best accuracies (as indicated in the legend) are reported. The shaded region indicates results when the sensitivity is increased or decreased by 3 dB. For the space-borne (ground-based) configuration the retrieval is applied only to points corresponding to CloudSat reflectivities exceeding −15 dBZ (−25 dBZ) and temperature exceeding 240 K.
The potential of a multi-frequency differential absorption radar (DAR) system with several tones within the 183.3 GHz water vapour absorption band for profiling water vapour within ice clouds is assessed both for ground-based and space-borne configurations. Realistic ice profiles derived from A-Train observations are inputs of DAR simulations which are used to test the precision performances of water vapour retrievals based on fitting the line shape via a minimum least-squares fitting procedure.
Our findings can be summarized as follows.
-
With realistic minimum detection thresholds, DARs can provide useful information in thick ice- and mixed-phase clouds and they can complement other techniques (e.g. water vapour DIALs, Nehrir et al., 2017). Four-tone DARs seem to be the right balance between complexity (i.e. number of channels) and retrieval performances. In the domain of CloudSat reflectivities above −15 dBZ and T>240, some of the best four-tone combinations allow us to retrieve ρv with precision better than 3 % in more than 25 % of the cases when ice is present, with the best results obtained for ice clouds with W-band reflectivities between −5 and 10 dBZ.
-
Ground-based DAR systems can provide excellent profiling of the warmer parts of ice clouds, where ρv values exceed 1 g m−3, but they become increasingly less precise when looking at the cold regions with low moisture. In such areas, things are expected to improve when colder ground temperature are considered. In this study we have simulated a scenario with a ground temperature of 270 K with global climatology. Of course the selection of the tones could be optimized for a specific location and time of the year based on the local cloud and temperature climatology. Also, scanning options could be considered to increase the differential absorption signal of channels far away from the centre of the band by increasing the path length.
-
Airborne or space-borne DAR systems are clearly advantageous with respect to ground systems when looking at regions with low water vapour contents because such regions are encountered first by the radar wave, and therefore are affected by less attenuation. This implies that tones close to the band centre can stay well above the MDT in the areas where they provide useful information (i.e. at low water vapour contents). The same is not true for ground-based geometry because, unless the temperature at the ground is very cold, large levels of attenuation are experienced by the radar tones close to the band centre in the lower troposphere.
-
Because SNR is a critical parameter for the precision of the measurement, the selection of the radar resolution should ideally match the vertical resolution required for the water vapour product.
-
The selection of the tones is driven by a tradeoff between differential signal and signal-to-noise ratio. Ideally the attenuation signal should be maximized but if the attenuation is too strong the signal becomes increasingly noisy and ultimately goes below the minimum sensitivity. For ground-based systems it would be ideal to have tones that can be adjusted depending on the atmospheric conditions and latitude and altitude location since with lower ground temperatures channels closer to the 183.3 GHz centre become increasingly useful.
-
The quality of the retrieval can be easily evaluated by considering retrieval errors and χ2 values that are computed as part of the minimum least-squares fitting procedure.
-
Transmitting licenses are attainable for airborne and ground-based systems (e.g. in the UK, DAR tones within the following bands may be allowed: 173.85 to 182 GHz, 185 to 190 GHz, 191.8 to 195.75 GHz and 196.15 to 199.99 GHz, with other allowed windows below 173.85) but are currently much more unaccessible for space-borne systems since such bands are reserved to passive microwave radiometers. As a first step toward assessing the potential of the DAR concept for ice cloud studies and to properly evaluate its accuracy (via comparison with radio soundings) it is highly recommended to deploy a ground-based DAR system at high latitudes and high altitudes.
This research is based on CloudSat data that are publicly available at http://www.cloudsat.cira.colostate.edu/data-products (Cloudsat data processing center, 2019).
AB wrote the whole paper and developed the code for simulating the G-band DAR. PK contributed with the definition of the technology specifications and in the revision of the paper.
The authors declare that they have no conflict of interest.
The work by Alessandro Battaglia has been supported by the project Radiation and Rainfall funded by the UK National Centre for Earth Observation. This research used the ALICE High Performance Computing Facility at the University of Leicester.
This work was supported by the European Space Agency under the “Multi-Frequency Radar Instrument Study” project (contract no. 4000120689/17/NL/IA).
This paper was edited by Mark Kulie and reviewed by Richard Roy and two anonymous referees.
Aires, F., Prigent, C., Buehler, S. A., Eriksson, P., Milz, M., and Crewell, S.: Towards more realistic hypotheses for the information content analysis of cloudy/precipitating situations – Application to a hyperspectral instrument in the microwave, Q. J. Roy. Meteor. Soc., 145, 1–14, https://doi.org/10.1002/qj.3315, 2019. a
Anderson, E.: Statement of guidance for global numerical weather prediction (NWP), Tech. rep., World Meteorological Organization, available at: https://www.wmo.int/pages/prog/www/OSY/GOS-RRR.html (last access: 20 June 2019), 2014. a
Bailey, M. P. and Hallett, J.: A Comprehensive Habit Diagram for Atmospheric Ice Crystals: Confirmation from the Laboratory, AIRS II, and Other Field Studies, J. Atmos. Sci., 66, 2888–2899, https://doi.org/10.1175/2009JAS2883.1, 2009. a, b
Battaglia, A. and Delanöe, J.: Synergies and complementarities of CloudSat-CALIPSO snow observations, J. Geophys. Res., 118, 721–731, https://doi.org/10.1029/2012JD018092, 2013. a
Battaglia, A. and Kollias, P.: Error Analysis of a Conceptual Cloud Doppler Stereoradar with Polarization Diversity for Better Understanding Space Applications, J. Atmos. Ocean. Tech., 32, 1298–1319, https://doi.org/10.1175/JTECH-D-14-00015.1, 2014. a, b
Battaglia, A., Ajewole, M. O., and Simmer, C.: Evaluation of radar multiple scattering effects in Cloudsat configuration, Atmos. Chem. Phys., 7, 1719–1730, https://doi.org/10.5194/acp-7-1719-2007, 2007. a
Battaglia, A., Tanelli, S., Kobayashi, S., Zrnic, D., Hogan, R., and Simmer, C.: Multiple-scattering in radar systems: a review, J. Quant. Spectrosc. Ra., 111, 917–947, https://doi.org/10.1016/j.jqsrt.2009.11.024, 2010. a
Battaglia, A., Westbrook, C. D., Kneifel, S., Kollias, P., Humpage, N., Löhnert, U., Tyynelä, J., and Petty, G. W.: G band atmospheric radars: new frontiers in cloud physics, Atmos. Meas. Tech., 7, 1527–1546, https://doi.org/10.5194/amt-7-1527-2014, 2014. a, b
Battaglia, A., Dhillon, R., and Illingworth, A.: Doppler W-band polarization diversity space-borne radar simulator for wind studies, Atmos. Meas. Tech., 11, 5965–5979, https://doi.org/10.5194/amt-11-5965-2018, 2018. a
Blackwell, W. J., Bickmeier, L. J., Leslie, R. V., Pieper, M. L., Samra, J. E., Surussavadee, C., and Upham, C. A.: Hyperspectral Microwave Atmospheric Sounding, IEEE T. Geosci. Remote, 49, 128–142, https://doi.org/10.1109/TGRS.2010.2052260, 2011. a
Brown, P. R. A. and Francis, P. N.: Improved Measurements of the Ice Water Content in Cirrus Using a Total-Water Probe, J. Atmos. Ocean. Tech., 12, 410–414, 1995. a
Cloudsat data processing center: Level 2 data products, available at: http://www.cloudsat.cira.colostate.edu/data-products, last access: 21 June 2019. a
Cooper, K. B., Monje, R. R., Millán, L., Lebsock, M., Tanelli, S., Siles, J. V., Lee, C., and Brown, A.: Atmospheric Humidity Sounding Using Differential Absorption Radar Near 183 GHz, IEEE Geosci. Remote Sens. Lett., 15, 163–167, 2018. a
Delanoë, J. and Hogan, R.: Combined CloudSat-CALIPSO-MODIS retrievals of the properties of ice clouds, J. Geophys. Res., 115, D4, https://doi.org/10.1029/2009JD012346, 2010. a, b
Durden, S. L., Tanelli, S., Epp, L. W., Jamnejad, V., Long, E. M., Perez, R. M., and Prata, A.: System Design and Subsystem Technology for a Future Spaceborne Cloud Radar, IEEE Geosci. Remote Sens. Lett., 13, 560–564, 2016. a
Field, P. R., Heymsfield, J., Bansemer, A., and Twohy, C. H.: Determination of the Combined Ventilation Factor and Capacitance for Ice Crystal Aggregates from Airborne Observations in a Tropical Anvil Cloud, J. Atmos. Sci., 65, 376–391, https://doi.org/10.1175/2007JAS2391.1, 2008. a
Haddad, Z. S., Sy, O. O., Hristova-Veleva, S., and Stephens, G. L.: Derived observations from frequently-sampled microwave measurements of precipitation. Part I: Relations to atmospheric thermodynamics, IEEE T. Geosci. Remote, 55, https://doi.org/10.1109/TGRS.2017.2671598, 2017. a
Hogan, R. J. and Illingworth, A. J.: The Potential of Spaceborne Dual-Wavelength Radar to Make Global Measurements of Cirrus Clouds, J. Atmos. Ocean. Tech., 16, 518–531, https://doi.org/10.1175/1520-0426(1999)016<0518:TPOSDW>2.0.CO;2, 1999. a
Hogan, R. J. and Westbrook, C. D.: Equation for the microwave backscatter cross section of aggregate snowflakes using the Self-Similar Rayleigh-Gans Approximation, J. Atmos. Sci., 71, 3292–3301, 2014. a, b
Hogan, R. J., Gaussiat, N., and Illingworth, A.: Stratocumulus Liquid Water Content from Dual-Wavelength Radar, J. Atmos. Ocean. Tech., 22, 1207–1218, https://doi.org/10.1175/JTECH1768.1, 2005. a
Hong, Y. and Liu, G.: The Characteristics of Ice Cloud Properties Derived from CloudSat and CALIPSO Measurements, J. Climate, 28, 3880–3901, https://doi.org/10.1175/JCLI-D-14-00666.1, 2015. a
Illingworth, A. J., Barker, H. W., Beljaars, A., Chepfer, H., Delanoe, J., Domenech, C., Donovan, D. P., Fukuda, S., Hirakata, M., Hogan, R. J., Huenerbein, A., Kollias, P., Kubota, T., Nakajima, T., Nakajima, T. Y., Nishizawa, T., Ohno, Y., Okamoto, H., Oki, R., Sato, K., Satoh, M., Wandinger, U., and Wehr., T.: The EarthCARE Satellite: the next step forward in global measurements of clouds, aerosols, precipitation and radiation, B. Am. Meteorol. Soc., 96, 1311–1332, https://doi.org/10.1175/BAMS-D-12-00227.1, 2015. a
Illingworth, A. J., Battaglia, A., Bradford, J., Forsythe, M., Joe, P., Kollias, P., Lean, K., Lori, M., Mahfouf, J.-F., Mello, S., Midthassel, R., Munro, Y., Nicol, J., Potthast, R., Rennie, M., Stein, T., Tanelli, S., Tridon, F., Walden, C., and Wolde, M.: WIVERN: A new satellite concept to provide global in-cloud winds, precipitation and cloud properties, B. Am. Meteorol. Soc., 99, 1669–1687, https://doi.org/10.1175/BAMS-D-16-0047.1, 2018. a
Joe, P., Kidd, C., Kollias, P., Tanelli, S., Moisseev, D., Battaglia, A., Koikinen, J., Arbery, G., Deligny, B., Caubet, E., Hudak, D., Stewart, R., Wolde, M., Im, E., Vane, D., Stephens, G., Bennartz, R., Blanchet, J.-P., and Cober, S.: The Polar Precipitation Measurement mission, in: Proc. 6th European Conference on Radar Meteorology and Hydrology: Satellite radar measurements and hydro-meteorological applications, Sibiu, Romania, 6–10 September 2010. a
Kärcher, B., Dörnbrack, A., and Sölch, I.: Supersaturation Variability and Cirrus Ice Crystal Size Distributions, J. Atmos. Sci., 71, 2905–2926, https://doi.org/10.1175/JAS-D-13-0404.1, 2014. a
Kollias, P., Battaglia, A., Tatarevic, A., Lamer, K., Tridon, F., and Pfitzenmaier, L.: The EarthCARE cloud profiling radar (CPR) doppler measurements in deep convection: challenges, post-processing, and science applications, in: Proc. SPIE 10776, Remote Sensing of the Atmosphere, Clouds, and Precipitation VII, vol. 107760R, https://doi.org/10.1117/12.2324321, 2018. a
Kummerow, C. D., Barnes, W., Kozu, T., Shiue, J., and Simpson, J.: The Tropical Rainfall Measuring Mission (TRMM) sensor package, J. Atmos. Ocean. Tech., 15, 809–817, 1998. a
Langland, R. H., Maue, R. N., and Bishop, C. H.: Uncertainty in atmospheric temperature analyses, Tellus A, 60, 598–603, https://doi.org/10.1111/j.1600-0870.2008.00336.x, 2008. a
Lebsock, M. D., Suzuki, K., Millán, L. F., and Kalmus, P. M.: The feasibility of water vapor sounding of the cloudy boundary layer using a differential absorption radar technique, Atmos. Meas. Tech., 8, 3631–3645, https://doi.org/10.5194/amt-8-3631-2015, 2015. a, b, c
Leinonen, J. and Szyrmer, W.: Radar signatures of snowflake riming: A modeling study, Earth Space Sci., 2, 346–358, https://doi.org/10.1002/2015EA000102, 2015. a, b
Leinonen, J., Lebsock, M. D., Tanelli, S., Suzuki, K., Yashiro, H., and Miyamoto, Y.: Performance assessment of a triple-frequency spaceborne cloud–precipitation radar concept using a global cloud-resolving model, Atmos. Meas. Tech., 8, 3493–3517, https://doi.org/10.5194/amt-8-3493-2015, 2015. a
Lhermitte, R.: Attenuation and Scattering of Millimeter Wavelength Radiation by Clouds and Precipitation, J. Atmos. Ocean. Tech., 7, 464–479, 1990. a
Mace, G. G., Marchand, R., Zhang, Q., and Stephens, G.: Global hydrometeor occurrence as observed by CloudSat: Initial observations from summer 2006, Geophys. Res. Lett., 34, L09808, https://doi.org/10.1029/2006GL029017, 2007. a
Matrosov, S. Y. and Battaglia, A.: Influence of multiple scattering on CloudSat measurements in snow: a model study, Geophys. Res. Lett., 36, L12806, https://doi.org/10.1029/2009GL038704, 2009. a
Millán, L., Lebsock, M., Livesey, N., and Tanelli, S.: Differential absorption radar techniques: water vapor retrievals, Atmos. Meas. Tech., 9, 2633–2646, https://doi.org/10.5194/amt-9-2633-2016, 2016. a, b, c, d, e
Nehrir, A. R., Kiemle, C., Lebsock, M. D., Kirchengast, G., Buehler, S. A., Löhnert, U., Liu, C.-L., Hargrave, P. C., Barrera-Verdejo, M., and Winker, D. M.: Emerging Technologies and Synergies for Airborne and Space-Based Measurements of Water Vapor Profiles, Surv. Geophys., 38, 1445–1482, https://doi.org/10.1007/s10712-017-9448-9, 2017. a, b
Nils, K., Kneifel, S., Löhnert, U., Kollias, P., Czekala, H., and Rose, T.: A W-Band Radar–Radiometer System for Accurate and Continuous Monitoring of Clouds and Precipitation, J. Atmos. Ocean. Tech., 34, 2375–2392, https://doi.org/10.1175/JTECH-D-17-0019.1, 2017. a
Oue, M., Kumjian, M. R., Lu, Y., Jiang, Z., Clothiaux, E. E., Verlinde, J., and Aydin, K.: X-band polarimetric and Ka-band Doppler spectral radar observations of a graupel producing Arctic mixed-phase cloud, J. Appl. Meteorol. Climatol., 55, 403–424, 2016. a
Peral, E., Tanelli, S., Haddad, Z., Sy, O., Stephens, G., and Im, E.: Raincube: A proposed constellation of precipitation profiling radars in CubeSat, in: 2015 IEEE International Geoscience and Remote Sensing Symposium (IGARSS), Milan, 1261–1264, https://doi.org/10.1109/IGARSS.2015.7326003, 2015. a
Rosenkranz, P. W.: Correction [to“Water vapor microwave continuum absorption: A comparison of measurements and model” by Philip W. Rosenkranz], Radio Sci., 34, 1025–1025, https://doi.org/10.1029/1999RS900020, 1999. a
Roy, R. J., Lebsock, M., Millán, L., Dengler, R., Rodriguez Monje, R., Siles, J. V., and Cooper, K. B.: Boundary-layer water vapor profiling using differential absorption radar, Atmos. Meas. Tech., 11, 6511–6523, https://doi.org/10.5194/amt-11-6511-2018, 2018. a, b, c, d, e, f, g
Sassen, K., Wang, Z., and Liu, D.: The global distribution of cirrus clouds from CloudSat/CALIPSO measurements, Geophys. Res. Lett., 113, D00A12, https://doi.org/10.1029/2008JD009972, 2008. a
Skofronick-Jackson, G., Petersen, W., Berg, W., Kidd, C., Stocker, E., Kirschbaum, D., Kakar, R., Braun, S., Huffman, G., Iguchi, T., Kirstetter, P., Kummerow, C., Meneghini, R., Oki, R., Olson, W., Takayabu, Y., Furukawa, K., and Wilheit, T.: The Global Precipitation Measurement (GPM) Mission for Science and Society, B. Am. Meteorol. Soc., 98, 1679–1695, https://doi.org/10.1175/BAMS-D-15-00306.1, 2016. a
Stephens, G., Winker, D., Pelon, J., Trepte, C., Vane, D., Yuhas, C., L'Ecuyer, T., and Lebsock, M.: CloudSat and CALIPSO within the A-Train: Ten Years of Actively Observing the Earth System, B. Am. Meteorol. Soc., 99, 569–581, https://doi.org/10.1175/BAMS-D-16-0324.1, 2018. a
Sy, O. O., Haddad, Z. S., Stephens, G. L., and Hristova-Veleva, S.: Derived Observations From Frequently Sampled Microwave Measurements of Precipitation. Part II: Sensitivity to Atmospheric Variables and Instrument Parameters, IEEE T. Geosci. Remote, 55, 2898–2912, 2017. a
Tanelli, S., Im, E., Durden, S., and Pak, K.: In-Flight Performance of the CloudSat Radar & L1B processing, CloudSat/CALIPSO Joint Science Team meeting, 11–14 June, San Francisco, CA, USA, 2007. a
Tanelli, S., Durden, S., Im, E., Pak, K., Reinke, D., Partain, P., Haynes, J., and Marchand, R.: CloudSat's Cloud Profiling Radar After 2 Years in Orbit: Performance, Calibration, and Processing, IEEE T. Geosci. Remote, 46, 3560–3573, 2008. a
Tanelli, S., Haddad, Z. S., Im, E., Durden, S. L., Sy, O. O., Peral, E., Sadowy, G. A., and Sanchez-Barbetty, M.: Radar concepts for the next generation of spaceborne observations of cloud and precipitation processes, in: IEEE Proceedings of Radar Conference, Oklahoma City, OK, 2018. a
The Decadal Survey (Ed.): Thriving on Our Changing Planet: A Decadal Strategy for Earth Observation from Space, The National Academies Press, NW Washington, D.C., https://doi.org/10.17226/24938, 2017. a
Tridon, F., Battaglia, A., Chase, R., Turk, J., Leinonen, J., Kneifel, S., Mroz, K., Finlon, J., Bansemer, A., Tanelli, S., Heymsfield, A., and Nesbitt, S.: The microphysics of stratiform precipitation during OLYMPEX: compatibility between 3-frequency radar and airborne in situ observations, J. Geophys. Res., accepted, 2019. a
Turner, D. D., Kneifel, S., and Careddu, M. P.: An Improved Liquid Water Absorption Model at Microwave Frequencies for Supercooled Liquid Water Clouds, J. Atmos. Ocean. Tech., 33, 33–44, https://doi.org/10.1175/JTECH-D-15-0074.1, 2016. a
Verlinde, J., Rambukkange, M. P., Clothiaux, E. E., McFarquhar, G. M., and Eloranta, E. W.: Arctic multilayered, mixed-phase cloud processes revealed in millimeter-wave cloud radar Doppler spectra, J. Geophys. Res.-Atmos., 118, 13199–13213, https://doi.org/10.1002/2013JD020183, 2013. a
Winker, D. M., Hunt, W. H., and McGill, M. J.: Initial performance assessment of CALIOP, Geophys. Res. Lett., 34, L19803, https://doi.org/10.1029/2007GL030135, 2007. a


