the Creative Commons Attribution 4.0 License.
the Creative Commons Attribution 4.0 License.
 | 18 Jan 2019
Demonstration of an off-axis parabolic receiver for near-range retrieval of lidar ozone profiles
Betsy M. Farris
Guillaume P. Gronoff
William Carrion
Travis Knepp
Margaret Pippin
Timothy A. Berkoff
During the 2017 Ozone Water Land Environmental Transition Study (OWLETS), the Langley mobile ozone lidar system utilized a new small diameter receiver to improve the retrieval of near-surface signals from 0.1 to 1 km in altitude. This new receiver utilizes a single 90 ∘ fiber-coupled, off-axis parabolic mirror resulting in a compact form that is easy to align. The single reflective surface offers the opportunity to easily expand its use to multiple wavelengths for additional measurement channels such as visible wavelength aerosol measurements. Detailed results compare the performance of the receiver to both ozonesonde and in situ measurements from a UAV platform, validating the performance of the near-surface ozone retrievals. Absolute O3 differences averaged 7 % between lidar and ozonesonde data from 0.1 to 1.0 km and yielded a 2.3 % high bias in the lidar data, well within the uncertainty of the sonde measurements. Conversely, lidar O3 measurements from 0.1 to 0.2 km averaged 10.5 % lower than coincident UAV O3. A more detailed study under more stable atmospheric conditions would be necessary to resolve the residual instrument differences reported in this work. Nevertheless, this unique added capability is a significant improvement allowing for near-surface observation of ozone.
- Article
(981 KB) - Full-text XML
- BibTeX
- EndNote


Tropospheric ozone is a trace gas regulated by the US Environmental Protection Agency due to its harmful impacts to human health and the environment. Specifically, ground-level ozone can cause serious problems for sensitive groups such as children, the elderly, or those with respiratory diseases (Federal Register Environmental Protection Agency, 2015). Ozone is formed as a secondary pollutant from oxides of nitrogen, volatile organic compounds and photochemical reactions often present in metropolitan and densely populated communities. Ozone must be continuously monitored to comply with current air quality regulations designed to protect the public. Knowing the vertical ozone profile distribution allows for insights into boundary layer and free-troposphere dynamics, providing a more complete understanding of surface ozone behavior. Therefore it is desirable to have instruments capable of measuring ozone from the ground level to stratospheric altitudes.
The Tropospheric Ozone Lidar Network (TOLNet) was established by NASA to provide needed observations of ozone vertical distribution to better understand pollution dynamics for improving forecast models and satellite retrievals of atmospheric pollutants (Newchurch et al., 2016). The Langley mobile ozone lidar (LMOL), a participating lidar in TOLNet, is a differential absorption lidar system (De Young et al., 2017) that uses a custom pulsed UV laser that generates two wavelengths to obtain vertical profiles of ozone from backscattered light. The system fits into a small mobile trailer and is capable of being operated at remote locations. LMOL has been used in multiple field campaigns (Leblanc et al., 2017; Sullivan et al., 2014; Wang et al., 2017) and provided data for the Ozone Water Land Environmental Transition Study (Sullivan et al., 2018; Berkoff et al., 2017) in summer 2017. The OWLETS campaign aimed to evaluate gradients between water and land in coastal regions, and LMOL provided vertical profiles “over water” by stationing the lidar at the mid-point of the Chesapeake Bay Bridge Tunnel system near the mouth of the Chesapeake Bay. In addition to the UV measurements, this system can also transmit 527 nm light for additional measurements of aerosol and cloud profiles.
One of the key challenges for lidar systems, including those in TOLNet, is the recovery of the near-range signals closest to the surface where incomplete transit–receiver geometrical overlap, detector saturation, and other nonlinear effects impact the ability to correctly process signals. Secondary smaller diameter receivers with a wider field of view are often employed co-aligned with the lidar transmit beam to better recover near-range signals, typically using a single focusing lens (Megie, 1985). In this paper, we describe the use of a unique small-diameter (7.62 cm) off-axis parabolic (OAP) fiber-coupled mirror configuration to more easily recover LMOL near-range signals. The OAP approach enables closer range capability for the LMOL instrument in a small, compact form and, unlike traditional refractive elements, is able to simultaneously measure green and UV wavelengths more easily.
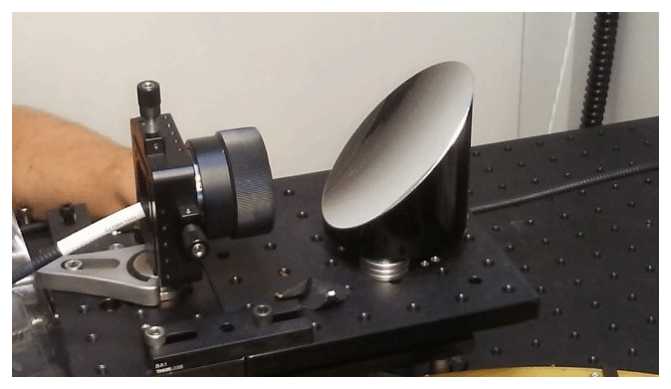
In previous campaigns prior to 2017, LMOL used a 30 cm diameter Fresnel lens as its near-field receiver. This arrangement had alignment stability issues, was mechanically cumbersome and could only monitor UV signals. For far-field measurements (> 800 m range in altitude) a 40 cm diameter Newtonian telescope was used to collect backscattered light and provided stable results in prior campaigns for both UV and green wavelengths. The configuration for the OWLETS 2017 campaign maintained the same far-field telescope, laser transmitter and optics while using a new near-field receiver consisting of a 7.6 cm diameter, 90 ∘ OAP with a 7.6 cm focal length (Fig. 1). A 1 mm core diameter multimode fiber with a 0.5 numerical aperture matching the fast (f-number 1.0) OAP was mounted in an x–y–z positioning stage and aligned to the focus point of the mirror (Fig. 2). The fiber core diameter and mirror focal length combination provides a 13.2 mrad full-angle field of view, approximately 10 times larger than the existing far-field receiver. Initial fiber alignment of the OAP was done in a laboratory setting using a visible collimated beam verified by an interferometric shear plate to position the fiber launch at the focal point of the OAP. The fiber x–y–z position was also verified using an autocollimator to examine the quality of beam collimation from the mirror when the fiber was back-illuminated. Once positioned, the fiber distance and position did not require any course adjustments in the field. The entire assembly was mounted on a two-axis goniometer with the mirror placed looking upward next to the LMOL far-field receiver. The goniometer arrangement allowed for repeatable angular adjustment of the assembly pointing direction for atmospheric alignment to the LMOL transmitted beam. The LMOL transmitted beam is generated by a tunable Ce:LiCAF laser at a 1 kHz pulse repetition rate, with 0.1 mJ pulse. Pulse-to-pulse wavelength switching is accomplished with rapidly tuning the Ce:LiCAF oscillator between 286 and 292 nm across an ozone absorption feature, enabling differential absorption backscatter measurements of ozone as a function of altitude and time to be obtained (De Young et al., 2017).
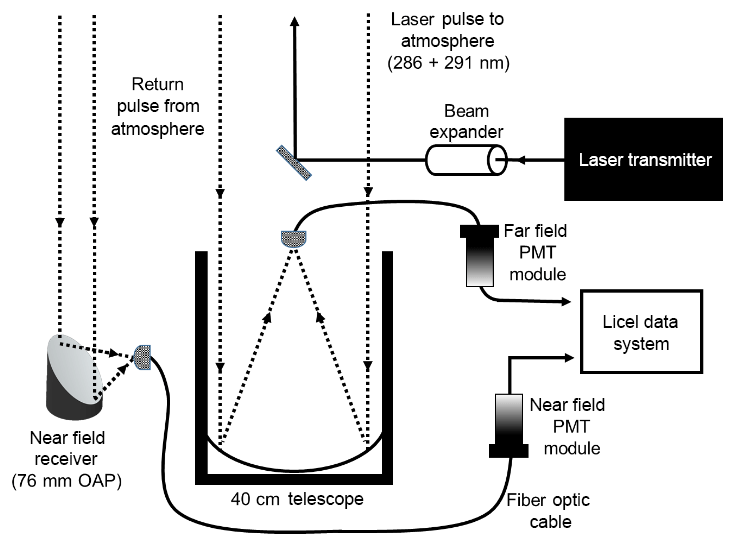
The outputs of the fibers from the near-field and far-field telescopes were coupled to collimating optics and UV bandpass filters (280–295 nm spectral window), which were integrated with Hamamatsu photomultiplier tube (PMT) detectors in light-tight enclosures. For normal atmospheric science data collection, the outputs of the PMTs were connected to a Licel data system that provided simultaneous analog and photon-counting measurements of both the near-field and far-field PMT signals. The Licel system was synchronously gated with the alternating wavelength pulses, so that 286 and 292 nm wavelength profiles were separately captured by the data system memory and subsequently recorded to the computer data acquisition system for processing of raw signals into calibrated ozone profiles.
A two-step process is used to align backscattered signals to the near-range and far-range receivers. First, the far-field receiver signal is optimized by changing the angular adjustments on the last outgoing mirror by monitoring the signal on either an oscilloscope or real-time raw signal display generated by the data acquisition system and fixing the mirror in place. The transmitted beam is placed at the center of the far-field receiver field of view (FOV) by monitoring the real-time signal amplitude at a range bin in the upper free troposphere (typically 3–5 km altitude) and centering the mirror adjustments at the maximum signal level. After alignment of the transmitted beam to the far-field receiver, the second step orients the near-field receiver to the transmit beam using the near-field goniometer mount adjustments. The near-field orientation is then optimized by centering its FOV to the transmit beam by finding the center maximum of the signal in the lower free troposphere (typically 1–1.5 km). Because of the higher noise level of the near-field channel, this alignment was refined with a real-time range-integrated (i.e., 1–1.5 km) signal which required sufficient signal strength to be obtained over a 2–3 s average. Once both receivers' signals were verified in alignment with the laser beam, then atmospheric data would be collected, typically at 20 s temporally averaged profiles at 7.5 m vertical sampling resolution.
The processing of raw profile signals to obtain calibrated ozone profiles is based on the standard DIAL technique described previously (Browell et al., 1985). Raw signals, both analog and photon counting, are background subtracted and range-squared before applying a single-pass Savitzky–Golay filter. The background subtraction is obtained from above 6 km for the near-field receiver data, where residual signal effects are insignificant. Analog and photon-count channels are merged together to provide a single optimized profile for range and signal-to-noise performance. Ozone cross sections, along with pressure and temperature information from co-located radiosonde launches, are used as part of the process to extract ozone mixing ratio as a function of altitude. The ozonesonde launches associated with the present data are frequent enough (> 2 day−1) to have a better than 3 % error due to pressure and temperature uncertainties. In general, LMOL uses the GEOS-5, near-real-time data product (Putman et al., 2011) to retrieve pressure and temperature when no ozonesonde/radiosonde data can be used. The process is repeated for each new profile on a 5 min temporal averaged basis to provide a continuous curtain display on the evolution of ozone vertical distribution during the course of a day.
LMOL far-field ozone profiles prior to 2017 have been compared with ozonesonde launches and other ozone lidar systems in various field campaigns and cross-validation studies (Leblanc et al., 2018; Sullivan et al., 2014). From these investigations, typical cross-comparisons of the far-field channel fall within ±5 %–7 % of the signal level reported, consistent with propagated errors in the LMOL ozone data products. The summer 2017 OWLETS campaign provided a unique opportunity to demonstrate the capabilities of the new near-range OAP receiver for LMOL. The LMOL lidar system was stationed at the third island of the Chesapeake Bay Bridge Tunnel site (CBBT) to obtain “over-water” measurements of ozone. In addition to the lidar, ozonesonde flights were regularly launched from CBBT during the OWLETS campaign. Each ozonesonde flight contained an in situ instrumentation package consisting of an iMet radiosonde measuring temperature, water vapor, winds, and pressure along with an electrochemical ozone sensor package manufactured by EN-SCI.
The OAP receiver alignment procedure was optimized during the OWLETS campaign and used to retrieve ozone profiles between 120 and 1000 m in altitude, nearly the entire atmospheric boundary layer. Values below 120 m in altitude were significantly influenced by typical near-range nonlinear effects and are not included in the analysis. Similarly, far-field data from 0 to 400 m in altitude are not analyzed. Future development of a similar OAP system for even closer-range capability is being considered.
For the OAP performance analysis, OWLETS data taken on 1–2 August 2017 represent the most comprehensive intercomparison opportunity taken during the campaign, with five ozonesondes launched during a continuous 32 h duration of LMOL measurements with the new OAP near-range receiver. In addition, a small drone (UAV) with an in situ ozone monitor on board was also flown at this time at the same CBBT location, providing near-range vertical ozone profiles from 0 to 200 m in altitude, allowing for additional lidar intercomparisons on both days. The UAV in situ ozone sensor consisted of a 2B Technologies model POM (personal ozone monitor) device that is an approved federal equivalent method (FEM) and NIST traceable ozone measurement with ±2 ppbv or better absolute accuracy and which contained its own built-in data storage, battery, sampling air flow pump, and GPS tracker (2B Technologies, 2016). The POM was mounted to the top structure of the UAV and then flown in different flight patterns to investigate near-range variability in ozone at the CBBT site.

Figure 3LMOL ozone 32 h lidar curtain obtained 1–2 August, overlaid with five ozonesonde measurements and UAV in situ measurements (0–200 m).
Figure 3 displays the 32 h data taken by the near-range OAP receiver, overlaid with the ozonesonde, UAV and surface in situ ozone measurements taken in the 1–2 August time frame. The vertical resolution of the lidar data changes with altitude by an adaptive smoothing technique that is described in work detailing a titration event captured during the OWLETS campaign (Gronoff et al., 2018). Data collection started at approximately 08:00 local time on 1 August, with surface and near-surface ozone increasing in magnitude as the day progressed. A collapse in boundary layer can be seen at ∼20:00 UTC (16:00 local time), which contributes to the formation of a more defined enhanced ozone layer (up to 95 ppbv) approximately 400 m above the surface. This remains as a residual layer into the evening, possibly contributing to some marginal ozone enhancement at the surface until 04:00 UTC. The sonde wind speed data were stagnant during this time, a significant rapid reduction in surface temperature was noted, and the ceilometer reported a corresponding layer height change, with its planetary boundary layer height product significantly dropping at 20:00 UTC to 500 m above the surface, consistent with the ozone layer height change. Further study would be needed to determine if the ozone enhancement at 400 m is due solely to the mixed layer collapse or other complex changes over short spatial scales, such as effects from the adjacent shipping channel or other nearby sources. Values at the surface and lowest altitudes then decrease significantly in the early morning hours of 2 August as the elevated layer also somewhat dissipates and also mixes to higher altitudes with the growth of the 2 August boundary layer. This result from the new near-range OAP capability illustrates that the temporal evolution of ozone can be complex and more clearly reveals how near-surface ozone layers influence surface ozone levels.
In general, the ozone measurements between lidar, ozonesonde, surface, and UAV were found to be fairly consistent with each other where spatiotemporal coincidences occur. However, measurement differences can occur in ozonesonde–lidar comparisons due to atmospheric sampling discrepancies due to wind advection of the ozonesonde position as well as due to the time constant of the electro-chemical sensor. From discussions with the manufacturer and known ascent rate of the ozonesonde, the vertical resolution of the ozonesonde is estimated to be 200 m.
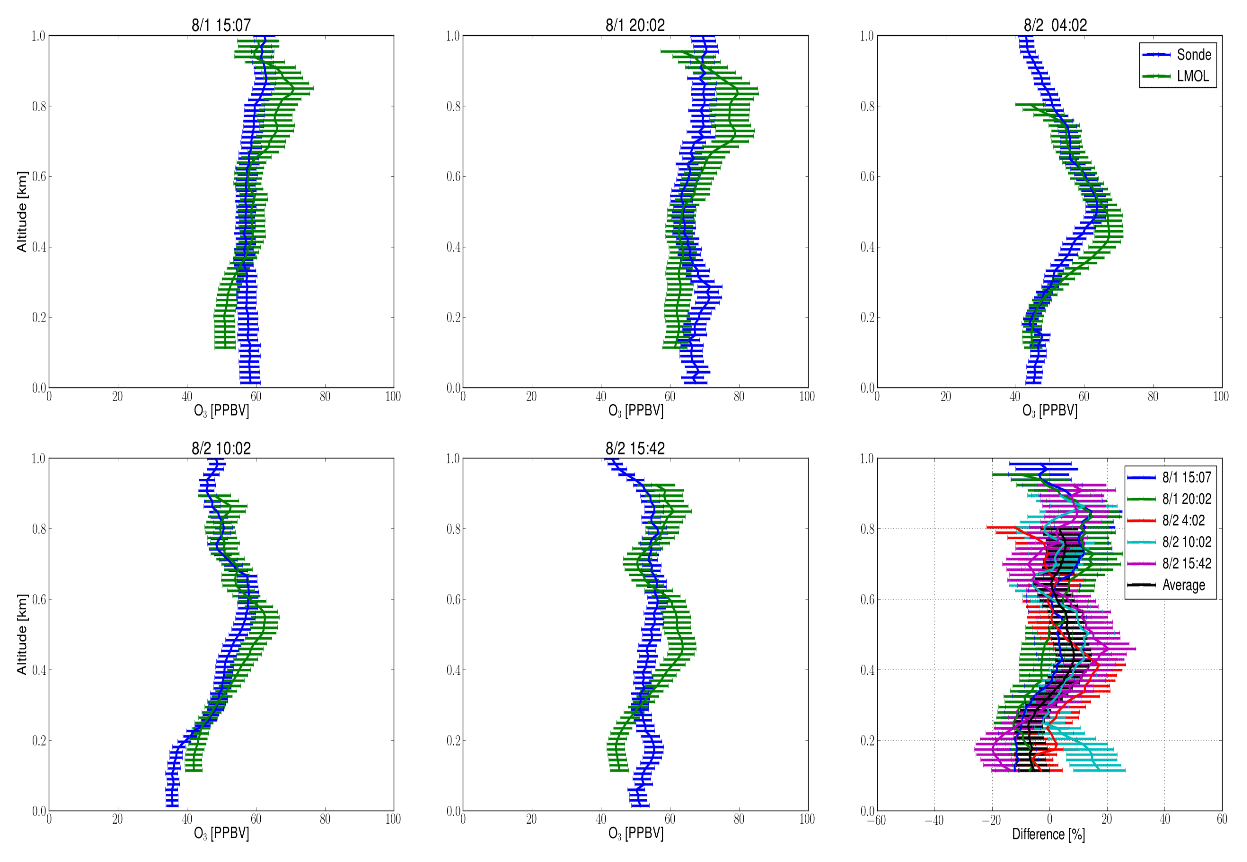
Figure 4Ozonesonde and LMOL comparison for near field (0–1000 m) and the percent height differences for all flights displayed on the bottom-right plot.
Figure 4 shows the ozonesonde profiles and corresponding OAP near-range receiver profiles and the corresponding uncertainties. For this comparison, the OAP receiver data were smoothed to 200 m resolution to match the expected ozonesonde vertical resolution.
Table 1Comparison of ozonesonde and LMOL column (0 to 1 km) average ozone values (ppbv), the percent differences (bias), and the absolute differences for Fig. 4 flights. The data sample standard deviations are also shown along with the mean values.
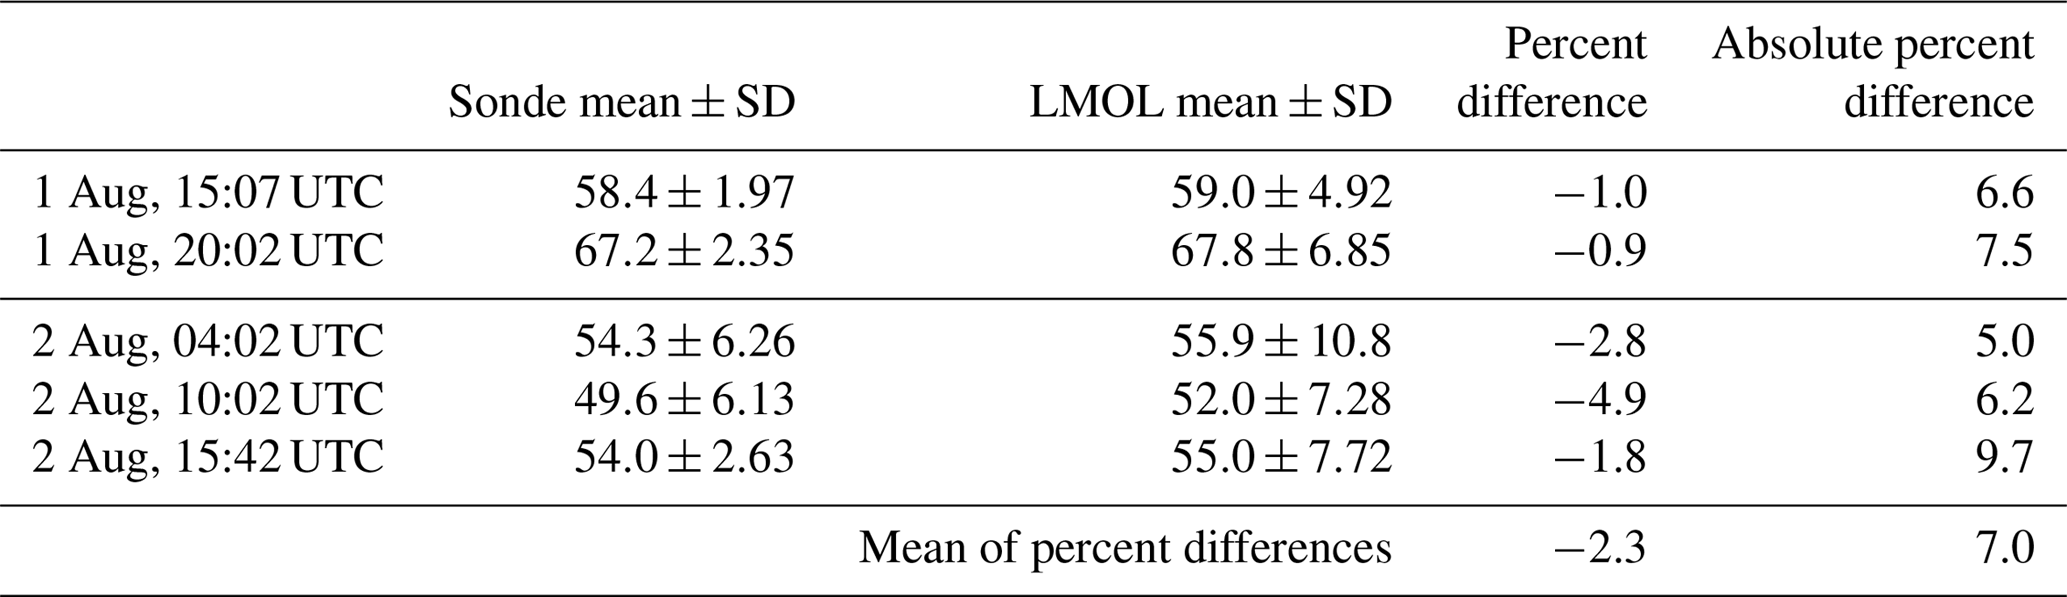
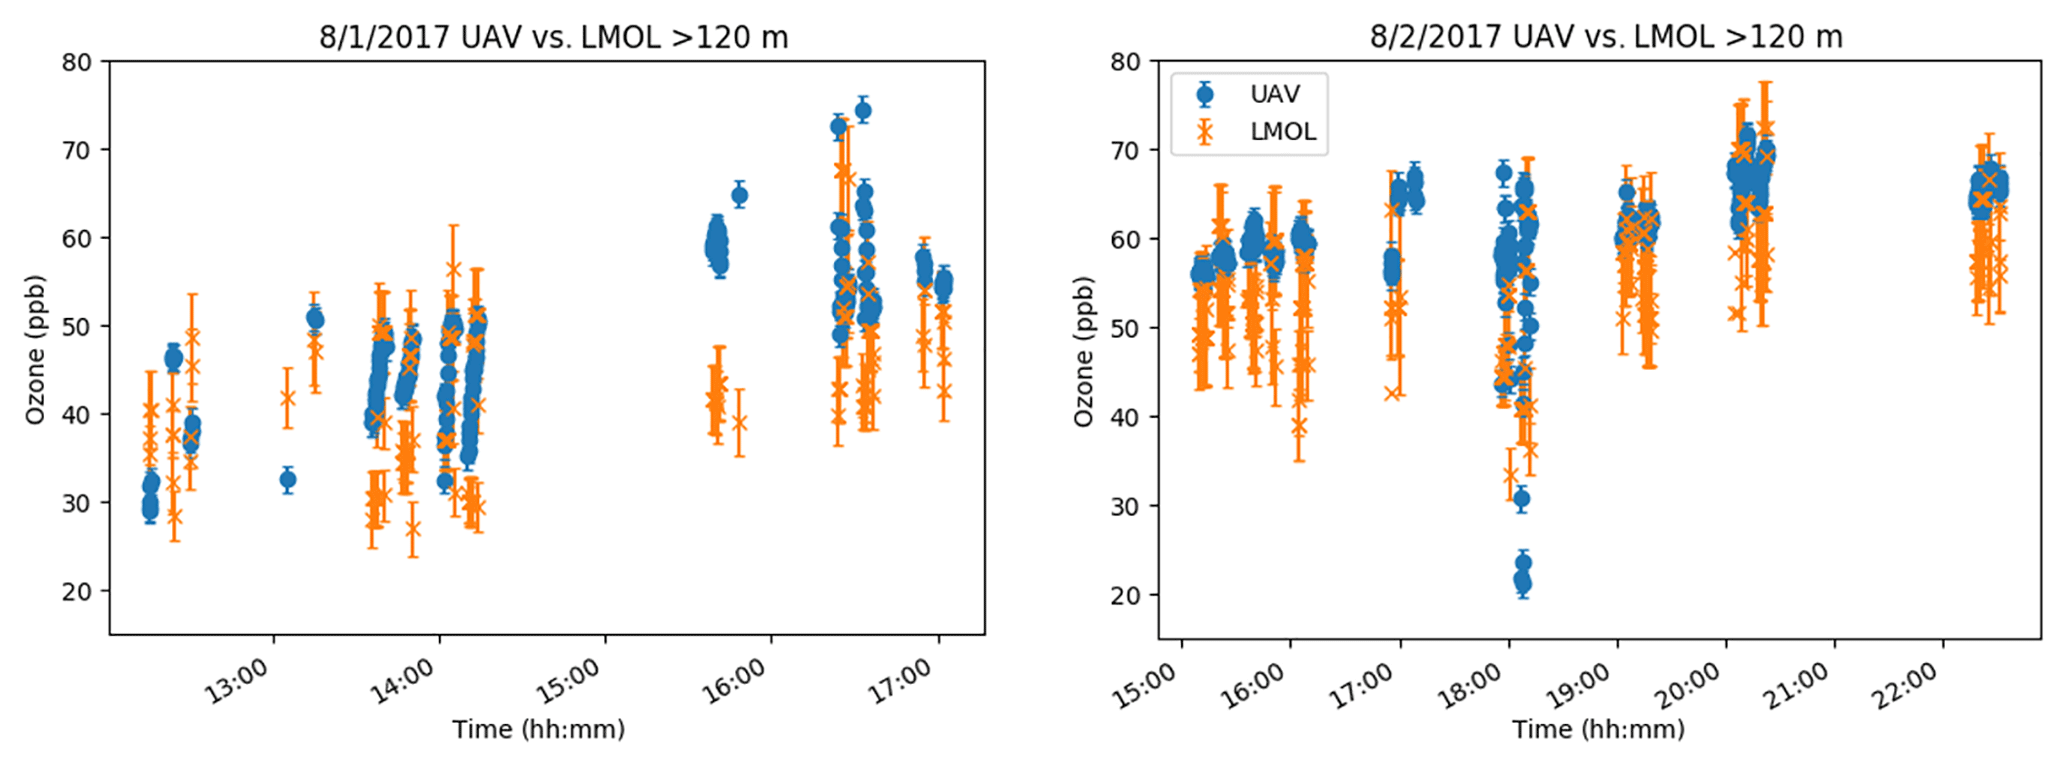
Figure 5Time series for 1–2 August 2017 of UAV measurements above 120 m and the corresponding LMOL data.
As can be seen from Table 1, the 0–1 km column bias differences between lidar and ozonesonde are relatively small, on average −2.3 %, with the lidar having an overall high bias relative to the ozonesonde launches. While the columnar bias is of interest to assess the overall polarity of the offset, an absolute columnar bias is also reported in Table 1, determined by taking the absolute difference at each height prior to the mean to assess magnitude of error irrespective of polarity. This absolute error parameter eliminates difference minimization effects when a positive bias in one part of the profile serves to reduce a negative bias at another location in the profile, providing additional information on differences in column magnitudes.
Table 2UAV and LMOL comparison for 1 and 2 August for samplings taken above LMOL above 120 m. The data sample standard deviations are also shown along with the mean values.

Although the UAV measurements were limited to 200 m altitude due to FAA airspace regulations, a number of vertical profiles were obtained on 1 and 2 August and provide additional intercomparison with the new OAP near-range receiver in the lowest portion of its altitude range. Figure 5 shows a time series comparison during the 1–2 August flights over the lidar and within the altitude range of the receiver. Unlike the ozonesonde, the UAV can be held to a controlled fixed position over the lidar, reducing some of the air mass sampling issues with the ozonesonde. The ozone concentrations measured by the POM on the UAV averaged 9.46 % and 11.63 % higher than LMOL measurements for 1 and 2 August, respectively.
Error discussion
TOLNet lidar systems have collectively developed rigorous processing algorithms based on Network for the Detection of Atmospheric Composition Change (NDACC) ozone lidar protocols to ensure consistency in O3 data products and associated uncertainties between instruments (Leblanc et al., 2016, 2018). The OAP error bars presented in Fig. 4 are the errors propagated from these standardized TOLNet/NDACC protocols and take into account random detector noise as well as other uncertainties including O3 absorption and Rayleigh cross sections used in determining concentration values. Comparisons with co-located electro-chemical ozonesonde flights is a traditional approach used to cross-validate with O3 lidar profiles, typically limited to 5 % absolute accuracy. LMOL's 5 min profiles have an uncertainty of 7 %–8 % in the 100 m–1 km range, somewhat larger than the absolute value for the ozonesonde. In Fig. 4, the LMOL profiles have been optimized to have a 200 m vertical resolution, which corresponds to the ozonesonde resolution. The percent difference profiles of all flights in Fig. 4 have deviations that appear fairly random in nature and fall within the propagated errors. The highest bias appears on the last ozonesonde at around 500 m; a more detailed study of that event indicates the atmosphere was highly variable at this time frame. A comparison of the lidar profile taken 20 min earlier to the same ozonesonde significantly reduces the deviation, suggesting atmospheric spatiotemporal variability as the cause. While the sample standard deviations reported in Table 1 are significant compared to the sonde–lidar difference biases, the per flight 0–1 km mean values allow for higher precision determinations due to the significant number of samples available in the column. Sonde–lidar column difference values, except flight no. 4 (2 August, 10:02 UTC), in Table 1 are close to or fall within the reported accuracy limits. It is also noted that flight no. 4 is closest to dawn when atmospheric heterogeneity is typically greatest and may explain some of its larger deviations. In general, the sonde–lidar differences overlap within their expected errors (with the exception of flight no. 4), indicating agreement to the extent possible within the performance limits of the ozonesonde and OAP data.
The UAV–lidar differences in Table 2 are biased opposite in sign and somewhat larger than the expected instrument error. The exact cause of the larger UAV–lidar bias remains unclear but could be potentially attributed to multiple factors. The UAV in situ sensor provides high temporal resolution (10 s) with a very small volume sample compared to the OAP observed air mass. The high degree of short-term signal variability evidenced by the Fig. 5 time series suggests rapidly changing significant small-scale gradients, making the UAV and lidar co-comparison more challenging than anticipated. The near-surface variability is attributed, in part, to large shipping lane traffic adjacent to the CBBT site as well as other factors, documented in Gronoff et al. (2018), where large changes in Pandora columnar NO2 correlated with lidar near-surface ozone titration events. Furthermore, the signal closest in range has the greatest potential for instrumental error, and limited height range of the UAV may have revealed an increased error for the lowest few recoverable range bins < 200 m, and suggests the need for further investigation. A more detailed study under more stable atmospheric conditions would be needed to more effectively resolve the residual instrumental biases reported here.
It was determined that the improved receiver setup for LMOL allowed for preliminary validation of ozone lidar measurements at a minimum of 120 m compared to the 800 m minimum of the larger far-field receiver. This improvement significantly enhances the capability of the LMOL system, allowing for a better understanding of low-altitude (120–1000 m) ozone atmospheric dynamics that are critical in evaluating atmospheric models and air pollution satellite retrievals. The new fiber-coupled OAP receiver offers the benefit of small compact form and can be adapted more easily to aerosol visible wavelength measurements due to the use of a reflective focusing element. Such a measurement can be possible by using a dichroic beamsplitter at the fiber output to separate green backscattered light from the laser pump of the current system to measure the light separately from the UV retrieval. Comparison measurements with ozonesonde and UAV measurements show good agreement with the ozone values obtained from the new receiver. LMOL values were biased above the ozonesonde measurements but biased below the UAV measurements, but generally fall within known uncertainties. This new measurement capability for LMOL improvements will continue to further the goals of TOLNet, allowing for development of more compact lower-cost lidar systems with near-range measurement capabilities.
All data for the OWLETS campaign are publicly available at the campaign's website, https://www-air.larc.nasa.gov/missions/owlets/index.html (last access: 12 May 2017).
The authors declare that they have no conflict of interest.
This work was supported in part by the NASA Science Innovation Fund, NASA
Tropospheric Composition Program, and the TEMPO Student Collaboration project
with funding provided through the NASA Science Mission Directorate Earth
System Science Pathfinder program. Special thanks to an exceptional group of
student interns that provided support that made ozonesonde and UAV
measurements possible during OWLETS: Lance Nino, Lindsey Rodio,
Jeremy Schroeder, Pablo Sanchez, Emily Gargulinski, Marlia Harnden,
Desorae Davis, and Angela Atwater. Thanks to Danette Allen, Eddie Adcock,
Zak Johns, Mark Motter, Jim Neilan, and Matt Vaughan of the NASA LaRC UAV
team. This work could also not have been completed without the helpful
accommodations of Edward Spencer and the management and employees with the
Chesapeake Bay Bridge and Tunnel District. A final thanks goes to
Tim Berkoff, Guillaume Gronoff, Margaret Pippin and the other OWLETS PIs for
their excellent mentorship and support.
Edited
by: Russell Dickerson
Reviewed by: two anonymous referees
2B Technologies: POM, personal ozone monitor, 1, 5–7, available at: http://www.twobtech.com/pom-personal-ozone-monitor.html (last access: 14 January 2019), 2016.
Berkoff, T., Sullivan, J., Pippin, M. R., Gronoff, G., Knepp, T. N., Twigg, L. W., Schroeder, J., Carrion, W., Farris, B., Kowalewski, M. G., Nino, L., Gargulinski, E., Langley, U., Rodio, L., Sanchez, P., Davis, A. A. D., Janz, S. J., Judd, L., Pusede, S., Wolfe, G. M., Stauffer, R. M., Munyan, J., Flynn, J., Moore, B., Dreessen, J., Salkovitz, D., Stumpf, K., King, B., Hanisco, T. F., Brandt, J., Blake, D. R., Abuhassan, N., Cede, A., Tzortziou, M., Demoz, B., Tsay, S.-C., Swap, R., Holben, B. N., Szykman, J., McGee, T. J., Neilan, J., and Allen, D.: Overview of the Ozone Water-Land Environmental Transition Study: Summary of Observations and Initial Results, in American Geophysical Union, Fall Meeting 2017, American Geophysical Union, Fall Meeting 2017, New Orleans, LA, available at: https://agu.confex.com/agu/fm17/meetingapp.cgi/Paper/246428 (last access: 14 January 2019), 2017.
Berkoff, T., Knepp, T., Aknan, A. and Chen, G.: OWLETS – Ozone Water-Land Environmental Transition Study, Natl. Aeronaut. Sp. Adm. Airborne Sci. Data Atmos. Compos., available at: https://www-air.larc.nasa.gov/missions/owlets/index.html, last access: 12 May 2017.
Browell, E. V, Ismail, S., and Shipley, S. T.: Ultraviolet DIAL measurements of O3 profiles in regions of spatially inhomogeneous aerosols., Appl. Opt., 24, 2827–2836, https://doi.org/10.1364/AO.24.002827, 1985.
De Young, R., Carrion, W., Ganoe, R., Pliutau, D., Gronoff, G., Berkoff, T., and Kuang, S.: Langley mobile ozone lidar: ozone and aerosol atmospheric profiling for air quality research, Appl. Optics, 56, 721–730, https://doi.org/10.1364/AO.56.000721, 2017.
Federal Register Environmental Protection Agency: National Ambient Air Quality Standards for Ozone Final Rule, 40 CFR Parts 50, 51, 52, 53, 58, 80, 1–7, available at: https://www.federalregister.gov/documents/2015/10/26/2015-26594/national-ambient-air-quality-standards-for-ozone (last access: 14 January 2019), 2015.
Gronoff, G., Robinson, J., Berkoff, T., Swap, R., Farris, B., Schroeder, J., Halliday, H. S., Knepp, T., Spinei, E., Carrion, W., Adcock, E., Johns, Z., Allen, D., and Pippin, M.: A Method for Quantifying Near Range Point Source Induced O3 Titration Events Using Co-located Lidar and PANDORA measurements, submitted to Atmos. Meas. Tech., 2018.
Leblanc, T., Sica, R. J., van Gijsel, J. A. E., Haefele, A., Payen, G., and Liberti, G.: Proposed standardized definitions for vertical resolution and uncertainty in the NDACC lidar ozone and temperature algorithms – Part 3: Temperature uncertainty budget, Atmos. Meas. Tech., 9, 4079–4101, https://doi.org/10.5194/amt-9-4079-2016, 2016.
Leblanc, T., Senff, C. J., Sullivan, J., Berkoff, T., Gronoff, G., Strawbridge, K. B., Portafaix, T., Duflot, V., and Mcgee, T. J.: Using a Centralized Lidar Data Processing Algorithm As a Reference Transfer for the Intercomparison of Campaign Data: Examples from the TOLNet SCOOP and the NDACC MORGANE Campaigns, in American Meteorological Society, 97th Annual Meeting, Seattle, WA, available at: https://ams.confex.com/ams/97Annual/videogateway.cgi/id/36928?recordingid=36928&uniqueid=Paper310453&entry_password=327228 (last access: 14 January 2019), 2017.
Leblanc, T., Brewer, M. A., Wang, P. S., Granados-Muñoz, M. J., Strawbridge, K. B., Travis, M., Firanski, B., Sullivan, J. T., McGee, T. J., Sumnicht, G. K., Twigg, L. W., Berkoff, T. A., Carrion, W., Gronoff, G., Aknan, A., Chen, G., Alvarez, R. J., Langford, A. O., Senff, C. J., Kirgis, G., Johnson, M. S., Kuang, S., and Newchurch, M. J.: Validation of the TOLNet lidars: the Southern California Ozone Observation Project (SCOOP), Atmos. Meas. Tech., 11, 6137–6162, https://doi.org/10.5194/amt-11-6137-2018, 2018.
Megie, G.: Laser Remote Sensing: Fundamentals and Applications, Eos, Trans. Am. Geophys. Union, 66, 681–692, https://doi.org/10.1029/EO066i040p00686-05, 1985.
Newchurch, M., Saadi, J. A. Al, Alvarez, R. J., Burris, J., Cantrell, W., Chen, G., Deyoung, R., Hardesty, R. M., Hoff, R. M., Kaye, J. A., Kuang, S., Langford, A., Leblanc, T., Mcdermid, S., Mcgee, T. J., Pierce, R. B., Senff, C. J., Sullivan, J., Szykman, J., Tonnesen, G., and Wang, L.: Tropospheric Ozone Lidar Network (TOLNet) – Long-term Tropospheric Ozone and Aerosol Profiling for Satellite Continuity and Process Studies, EPJ Web Conf., 119, 20001, https://doi.org/10.1051/epjconf/201611920001, 2016.
Putman, W. M. and Suarez, M.: Cloud-system resolving simulations with the NASA Goddard Earth Observing System global atmospheric model (GEOS-5), Geophys. Res. Lett., 38, 1–5, https://doi.org/10.1029/2011GL048438, 2011.
Sullivan, J. T., McGee, T. J., Sumnicht, G. K., Twigg, L. W., and Hoff, R. M.: A mobile differential absorption lidar to measure sub-hourly fluctuation of tropospheric ozone profiles in the Baltimore–Washington, D.C. region, Atmos. Meas. Tech., 7, 3529–3548, https://doi.org/10.5194/amt-7-3529-2014, 2014.
Sullivan, J. T., Berkoff, T., Gronoff, G., Knepp, T., Pippin, M., Allen, D., Twigg, L., Swap, R., Tzortziou, M., Thompson, A. M., Stauffer, R. M., Wolfe, G. M., Flynn, J., Pusede, S. E., Judd, L., Moore, W., Baker, B. D., Al-Saadi, J., and McGee, T. J.: The Ozone Water-Land Environmental Transition Study (OWLETS): An Innovative Strategy for Understanding Chesapeake Bay Pollution Events, B. Am. Meteorol. Soc., https://doi.org/10.1175/BAMS-D-18-0025.1, 2018.
Wang, L., Newchurch, M. J., Alvarez II, R. J., Berkoff, T. A., Brown, S. S., Carrion, W., De Young, R. J., Johnson, B. J., Ganoe, R., Gronoff, G., Kirgis, G., Kuang, S., Langford, A. O., Leblanc, T., McDuffie, E. E., McGee, T. J., Pliutau, D., Senff, C. J., Sullivan, J. T., Sumnicht, G., Twigg, L. W., and Weinheimer, A. J.: Quantifying TOLNet ozone lidar accuracy during the 2014 DISCOVER-AQ and FRAPPÉ campaigns, Atmos. Meas. Tech., 10, 3865–3876, https://doi.org/10.5194/amt-10-3865-2017, 2017.