the Creative Commons Attribution 4.0 License.
the Creative Commons Attribution 4.0 License.
Estimation of liquid water path below the melting layer in stratiform precipitation systems using radar measurements during MC3E
Jingjing Tian
Xiquan Dong
Christopher R. Williams
In this study, the liquid water path (LWP) below the melting layer in stratiform precipitation systems is retrieved, which is a combination of rain liquid water path (RLWP) and cloud liquid water path (CLWP). The retrieval algorithm uses measurements from the vertically pointing radars (VPRs) at 35 and 3 GHz operated by the US Department of Energy Atmospheric Radiation Measurement (ARM) and National Oceanic and Atmospheric Administration (NOAA) during the field campaign Midlatitude Continental Convective Clouds Experiment (MC3E). The measured radar reflectivity and mean Doppler velocity from both VPRs and spectrum width from the 35 GHz radar are utilized. With the aid of the cloud base detected by a ceilometer, the LWP in the liquid layer is retrieved under two different situations: (I) no cloud exists below the melting base, and (II) cloud exists below the melting base. In (I), LWP is primarily contributed from raindrops only, i.e., RLWP, which is estimated by analyzing the Doppler velocity differences between two VPRs. In (II), cloud particles and raindrops coexist below the melting base. The CLWP is estimated using a modified attenuation-based algorithm. Two stratiform precipitation cases (20 and 11 May 2011) during MC3E are illustrated for two situations, respectively. With a total of 13 h of samples during MC3E, statistical results show that the occurrence of cloud particles below the melting base is low (9 %); however, the mean CLWP value can be up to 0.56 kg m−2, which is much larger than the RLWP (0.10 kg m−2). When only raindrops exist below the melting base, the average RLWP value is larger (0.32 kg m−2) than the with-cloud situation. The overall mean LWP below the melting base is 0.34 kg m−2 for stratiform systems during MC3E.
- Article
(1964 KB) - Full-text XML
- BibTeX
- EndNote
Clouds in stratiform precipitation systems are important to the Earth's radiation budget. The vertical distributions of cloud microphysics, ice and liquid water content (IWC and LWC), determine the surface and top-of-the-atmosphere radiation budget and redistribute energy in the atmosphere (Feng et al., 2011, 2018). Also, stratiform precipitation systems are responsible for most tropical and midlatitude precipitation during summer (Xu, 2013). However, the representation of those systems in global climate and cloud-resolving models is still challenging (Fan et al., 2015). One of the challenges is due to the lack of comprehensive observations and retrievals of cloud microphysics (e.g., prognostic variables IWC and LWC) in stratiform precipitation systems. Liquid water path (LWP) is defined as an integral of LWC in the atmosphere. It is a parameter used to provide the characterization of liquid hydrometeors in the vertical column of atmosphere and study clouds and precipitation. The estimation of LWC and LWP is one of the critical objectives of the US Department of Energy's (DOE) Atmospheric Radiation Measurement (ARM) Program (Ackerman and Stokes, 2003).
LWP can be retrieved using a ground-based microwave radiometer (MWR), which sensed downwelling radiant energy at 23.8 and 31.4 GHz (Liljegren et al., 2001). In the last two decades, ARM has been operating a network of two-channel (23.8 and 31.4 GHz) ground-based MWRs to provide a time series of LWP at the ARM Southern Great Plains (SGP) site (Cadeddu et al., 2013). Absorption-based algorithms using multichannels of MWRs have been widely used to retrieve cloud LWP (e.g., Liljegren et al. 2001; Turner, 2007), and they are known to be accurate methods to estimate LWP of nonprecipitating clouds, with a mean LWP error of 15 g m−2 (Crewell and Löhnert, 2003). However, in precipitating conditions, LWP retrieved from conventional MWRs is generally not valid due to the violation of the Rayleigh assumption when large raindrops exist (e.g., Saavedra et al., 2012). In addition, a large increase of brightness temperatures is measured as a result of the deposition of raindrops on the MWR's radome. Unfortunately, it is very hard to model and quantify this increase from the rain layer on the radome (Cadeddu et al., 2017). This “wet radome” issue largely inhibits the retrieval of LWPs using ground-based MWRs during precipitation. Due to the limitations of retrieving LWP from MWRs during precipitation, cloud and precipitation radars were used to simultaneously retrieve LWP (Matrosov, 2010).
In the precipitating system, the liquid water cloud droplets and raindrops often coexist in the same atmospheric layer (e.g., Dubrovina, 1982; Mazin, 1989; Matrosov, 2009, 2010), indicating that the LWP consists of both cloud liquid water path (CLWP) and rain liquid water path (RLWP). However, the discrimination between suspended small cloud liquid water droplets and precipitating large raindrops is a very challenging remote-sensing problem. Even though the partitioning of LWP into CLWP and RLWP is important in cloud modeling (Wentz and Spencer, 1998; Hillburn and Wentz, 2008), there are few studies in which RLWP and CLWP were retrieved simultaneously and separately (Saavedra et al., 2012; Cadeddu et al., 2017). Battaglia et al. (2009) developed an algorithm to retrieve RLWP and CLWP from the six Advanced Microwave Radiometer for Rain Identification (ADMIRARI) observables under rainy conditions. Saavedra et al. (2012) developed an algorithm using both ADMIRARI and a micro rain radar to retrieve and analyze the CLWP and RLWP for midlatitude precipitation during fall. In addition to these RLWP and CLWP estimations mainly from passive microwave radiometers, there are several studies estimating the LWP using active radar measurements only. Ellis and Vivekanandan (2011) developed an attenuation-based technique to estimate LWC, which is the sum of cloud liquid water content (CLWC) and rain liquid water content (RLWC), using simultaneous S- and Ka-band scanning radars measurements. However, using these techniques to retrieve LWC is not always applicable. If raindrop diameters are comparable to at least one of the radar's wavelength, the “Mie effect” will be included in the measured differential reflectivity; however this Mie effect is not very distinguishable from differential attenuation effects (Tridon et al., 2013; Tridon and Battaglia, 2015).
Matrosov (2009) developed an algorithm to simultaneously retrieve CLWP and layer-mean rain rate using the radar reflectivity measurements from three ground-based W-, Ka-, and S-band radars. The CLWP was retrieved based on estimating the attenuation of cloud radar signals compared to S-band radar measurements. Matrosov (2010) developed an algorithm to estimate CLWP using a vertical pointing Ka-band radar and a nearby scanning C-band radar. The layer-mean rain rate was first estimated with the aid of a surface disdrometer, and then CLWP was retrieved by subtracting the rain attenuation from total attenuation measured from two radars. For the estimation of RLWP, Williams et al. (2016) developed a retrieval algorithm for raindrop size distribution (DSD) using Doppler spectrum moments observed from two co-located vertically pointing radar (VPRs) at frequencies of 3 and 35 GHz. The retrieved air motion and DSD parameters were evaluated using the retrievals from a co-located 448 MHz VPR.
In this study, the CLWP retrieval algorithms in Matrosov (2009, 2010) have been modified given the available radar measurements, vertical pointing Ka- and S-band radars, during the Midlatitude Continental Convective Clouds Experiment (MC3E) field campaign. For the estimation of RLWP, we will basically follow the idea described in Williams et al. (2016) to retrieve microphysical properties for raindrops. However instead of retrieving vertical air motion and rain DSDs (Williams et al., 2016), this study aims at retrieving RLWC and then integrating RLWC over the liquid layer to estimate RLWP. Overall, in this study, algorithms from three former publications are modified and combined to estimate the LWP in the stratiform precipitating systems.
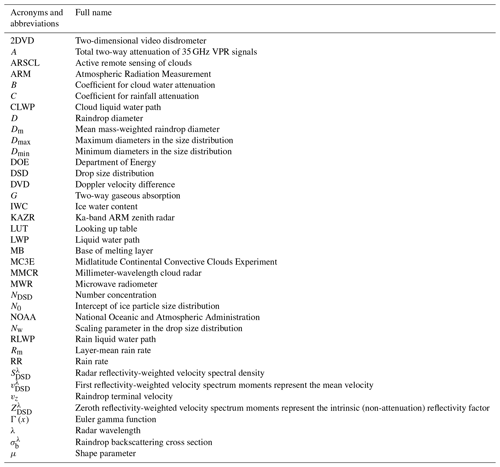
The goals of this study are to retrieve the LWP below the melting base, which includes both RLWP and CLWP retrievals using radars measurements, and tentatively answer two questions based on observations and retrievals in the stratiform precipitation systems during MC3E: (1) what is the occurrence of cloud below the melting base in the stratiform precipitation systems? (2) What are the values of simultaneous CLWP, RLWP, and LWP, and how does CLWP or RLWP contribute to the LWP? Note that the CLWP and RLWP are constrained in a stratiform precipitation layer below the melting base and above the surface. The LWP estimations in this study are primarily aimed at stratiform precipitating events exhibiting melting-layer features from radar measurements with lower-to-moderate rain rates (RR < 10 mm h−1). The instruments and data used in this study are introduced in Sect. 2. Section 3 describes the methods of retrieving LWP (both RLWP and CLWP). Section 4 illustrates two examples and is followed by statistical results from more samples during MC3E. The last section gives the summary and conclusions. Acronyms and abbreviations are listed in Table 1.
The MC3E field campaign, co-sponsored by the NASA Global Precipitation Measurement and the US DOE ARM programs, was conducted at the ARM SGP (northern Oklahoma) during April–June 2011 to study convective clouds and improve model parametrization (Jensen et al., 2015). MC3E provided an opportunity to develop new retrieval methods to estimate cloud microphysics and precipitation properties in precipitation systems (Giangrande et al., 2014; Williams, 2016; Tian et al., 2016, 2018). Several stratiform rain cases were observed by the VPRs during MC3E (as shown in Fig. 1). Distinct signatures of the “bright band” are detected by VPRs. To retrieve LWP associated with stratiform precipitation, this study mainly uses the observations from two co-located VPRs operating at 3 and 35 GHz at DOE ARM SGP Climate Research Facility.
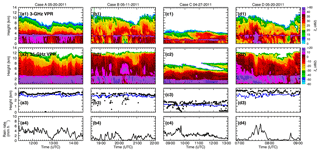
Figure 1Time series of (a1) radar reflectivity (Ze) from NOAA 3 GHz vertical pointing radar (VPR), (b1) radar reflectivity from ARM 35 GHz VPR, (c1) melting base (blue lines) and cloud base (black dots), and (d1) rain rates from RD-80 surface disdrometer measurement for Case A (20 May 2011, 11:20–14:30 UTC); (b1)–(b4) for Case B (11 May 2011, 18:30–22:00 UTC); (c1)–(c4) for Case C (27 April 2011, 08:30–13:00 UTC); (d1)–(d4) for Case D (20 May 2011, 07:00–09:00 UTC). Note that the ranges of radar reflectivity values are different in 3 and 35 GHz radars.
2.1 Vertical pointing radars
The 3 GHz (S-band) VPR was deployed by NOAA Earth System Research Laboratory for the 6 weeks during the MC3E. The NOAA 3 GHz VPR is a vertical pointing radar with 2.6∘ beamwidth monitoring precipitation overhead. This 3 GHz profiler bridges the gap between cloud radars, which are used to provide the structure of nonprecipitating clouds but are severely attenuated by rainfall, and precipitation radars, which, although unattenuated by rainfall, generally lack the sensitivity to detect more detailed cloud structure. The 3 GHz VPR observes the raindrops within the Rayleigh scattering regime, and its signal attenuation is negligible through the rain. The temporal resolution of the profiles of Doppler velocity spectra is 7 s, and the vertical resolution is 60 m. The 3 GHz VPR operated in two modes: a precipitation mode and a low-sensitivity mode. The precipitation-mode observations are used in this study.
The Ka-band ARM zenith radar (KAZR) is also a vertical pointing radar, operating at 35 GHz and permanently deployed by DOE ARM at the SGP site. The KAZR measurements include reflectivity, vertical velocity, and spectral width from the near-ground to 20 km. The KAZR data used in this study are the KAZR Active Remote Sensing of Clouds (ARSCL) product produced by the ARM (https://www.arm.gov, last access: 18 May 2017). The KAZR-ARSCL corrects for atmospheric gas attenuation and velocity aliasing. By selecting the mode with the highest signal-to-noise ratio at a given point, data from two simultaneous operating modes (general and cirrus mode) are combined for each profile to provide the best estimates of radar moments in the time-height fields. The vertical and temporal resolutions of KAZR-ARSCL product are 30 m and 4 s, respectively. Since the 3 and 35 GHz VPRs are independent radars with different dwell time and sample volumes (Williams et al., 2016), the radar observations are processed to 1 min temporal and 60 m vertical resolutions in this study.
2.2 Disdrometers
The DOE ARM program maintains a suite of surface precipitation disdrometers. Measurements and estimations from the Distromet model RD-80 disdrometer and the NASA two-dimensional video disdrometer (2DVD) deployed at the ARM SGP site are used in this study. The RD-80 disdrometer provides the most continuous raindrop size distribution (DSD) measurements at high spectral (20 size bins from 0.3 to 5.4 mm) and temporal resolutions (1 min), and its minimal detectable precipitation amount is 0.006 mm h−1. From the 2DVD, the rain DSDs are observed from 41 bins (0.1–10 mm), and its minimal detectable precipitation amount is 0.01 mm h−1. In addition to rain rate, the mean mass-weighted raindrop diameter (Dm) is also provided by the 2DVD, which is used for evaluating retrieved Dm from radar measurements.
2.3 Ceilometer
The Vaisala Laser Ceilometer (CEIL) operates at the SGP Central Facility, sensing cloud presence up to a height of 7700 m with 10 m vertical resolution. The laser ceilometer transmits near-infrared pulses of light, and the receiver detects the light scattered back by clouds and precipitation. It is designed to measure cloud-base height.
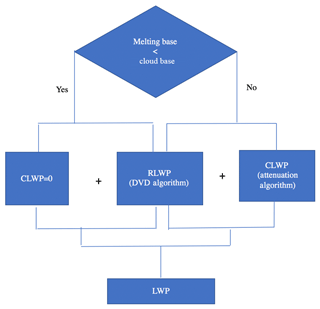
As mentioned earlier, both RLWP and CLWP contribute to the LWP. With the aid of the cloud-base height detected by the ceilometer, LWP is retrieved under two different situations: (I) the cloud base is higher than the melting base, and (II) the cloud base is lower than the melting base. For situation (I), there are almost no cloud droplets below the melting base (CLWP = 0), and thus the LWP below the melting base is solely from raindrops. The LWP is calculated by integrating RLWC over this layer. The RLWC could be retrieved by analyzing the measured Doppler velocity differences (“DVD algorithm”) from two co-located VPRs. In situation (II), the small cloud droplets and large raindrops coexist below the melting base. Both raindrops and cloud particles contribute to LWP. RLWP will still be estimated using the DVD algorithm. CLWP will be retrieved using an attenuation-based algorithm named the “attenuation algorithm”. The algorithms for LWP estimation are summarized in a flowchart (Fig. 2).
3.1 Situation I (no cloud droplets exist below the melting base)
The algorithm from Williams et al. (2016) was developed based on an assumption that the 3 GHz VPR operates within the Rayleigh scattering regime for all raindrops, while the 35 GHz VPR operates within the Rayleigh scattering regime for small raindrops (diameters < ∼1.3 mm) and non-Rayleigh scattering regime for larger raindrops (diameters mm). The different scattering regimes for the two operating frequencies result in different estimated radar moments. These estimated radar moments are in functions of rain microphysics. Thus, the rain microphysics could be retrieved with given measured radar moments. The details of this DVD algorithm and uncertainty estimation are introduced in Appendix A.
3.2 Situation II (cloud particles and rain droplets coexist below the melting base)
In situation (II), substantial cloud particles exist below the melting base, and both RLWP and CLWP retrievals are needed to estimate the LWP. The total two-way attenuation of 35 GHz VPR signals, A (in decibels, dB), in a layer between the melting base and the cloud base, mainly consists of rain attenuation, liquid cloud attenuation, and gaseous attenuation. The total attenuation (A) is expressed as
Rm is the layer-mean rain rate, and ΔH (km) is the thickness of the layer (Matrosov, 2009). G is the two-way attenuation/absorption from atmospheric gases, which is relatively small, and the absorption by gases has already been corrected in the KAZR ARSCL dataset and is assumed to be zero in our retrieval.
C and B are the coefficients for rainfall and cloud liquid water attenuation.
where λ is the wavelength of the Ka-band radar, and m is the complex refractive index of water. The unit of B is decibels per gram per meter (dB g−1 m−2).
where b is the correction factor considering raindrop fall velocities with changing air density.
where ρam and ρa0 are the mean air density in the rain layer and the density under normal atmospheric conditions.
Based on Eq. (1), CLWP can be written as
The attenuation (A) is estimated by comparing the drop in Ka-band reflectivity with the unattenuated S-band reflectivity through the cloud. Assuming the changes in reflectivity with altitude due to changes in raindrop size distributions with altitude are similar for Ka- and S-band reflectivities, then the difference in reflectivities through the cloud is a proxy for attenuation. This can be expressed using
Notice that the absolute calibration of the radar was not important to the retrieval results since the retrieval of CLWP used S- and K-band differential attenuation. This avoids radar calibration (Tridon et al., 2015, 2017), which is a serious issue limiting the accuracy of radar retrievals.
The Rm is estimated as
where Δh equals 60 m, MB is the melting base, and h0 is the height of the lowest unsaturated KAZR rang gate (Matrosov, 2010). RRs in the layer between the melting base and the cloud base are calculated from the DVD algorithm.
The uncertainties of retrieved CLWP are mainly due to the uncertainties of estimated Rm and observed total attenuation from VPRs. The value of B is on the order of 1 dB kg−1 m−2. The uncertainty of retrieved CLWP would be ∼0.25 kg m−2, with 0.5 dB uncertainty from the measured radar reflectivity difference or ∼0.5 kg m−2 for 1.0 mm h−1 uncertainty from the estimated layer-mean rain rate. Compared to the typical mean rain rate observed in the stratiform system (∼2–4 mm h−1), 1.0 mm h−1 represents a ∼30 % uncertainty. The uncertainty for CLWP retrievals is roughly estimated as ∼0.56 kg m−2 () in this study. For reference, the expected uncertainty is reported as ∼0.25 kg m−2 for typical rainfall rates (∼3–4 mm h−1) in Matrosov's (2009) retrieval method. More details of the estimation of CLWP uncertainties are in Appendix B.
4.1 Case studies
Even though situation (I) is dominated (Fig. 1), especially in Case A, the ceilometer cloud-base estimates can be lower than the melting base (Cases B to D). Two case studies (20 and 11 May 2011) are given as examples to demonstrate the estimation of LWP in stratiform precipitation systems for two different situations.
4.1.1 Case A
On 20 May 2011, an upper-level low-pressure system in the central Great Basin moved into the central and northern plains, while a surface low pressure in southeastern Colorado brought warm and moist air from the southern plains to a warm front over Kansas, and a dry line extended southward from Texas to Oklahoma. With these favorable conditions, a strong north–south-oriented squall line developed over the Great Plains and propagated eastward. The convection along the leading edge of this intense squall line exited the ARM SGP network around 11:00 UTC on 20 May, leaving behind a large area of stratiform rain (Case A in Fig. 1). This stratiform system passed over the ARM SGP site and was observed by two VPRs and disdrometers as shown in Fig. 1a–c. It clearly shows the 3 GHz radar echo tops are much lower than those from the 35 GHz VPR. Even though there is attenuation at 35 GHz by the raindrops and melting hydrometeors, the 35 GHz radar can still detect more small ice particles near the cloud top. The bright band, which occurs in a uniform stratiform rain region, is clearly seen from the 3 GHz VPR (a sudden increase and then decrease in radar reflectivity) but is not obvious from the 35 GHz VPR due to the non-Rayleigh scattering effects at 35 GHz (Sassen et al., 2005; Matrosov, 2008).
Figure 1a–b clearly show that the ceilometer-detected cloud base is in the middle of the melting layer, indicating almost no cloud particles below the melting layer, and the LWP in the liquid layer is equal to the RLWP. The RLWP is retrieved using the DVD algorithm introduced in Sect. 3.1 and Appendix A. Figure 3 shows an example of the DVD retrieval algorithm at 13:40 UTC on 20 May 2011. Radar reflectivity from 3 GHz, Doppler velocities from 3 and 35 GHz, and spectrum variance from 35 GHz are the inputs of the DVD algorithm. The Doppler velocity differences (3–35 GHz) from the surface to 4 km are also plotted in Fig. 3d. The melting base is defined as the height of maximum curvature in the radar reflectivity profile at 3 GHz (Fabry and Zawadzki, 1995), which is clearly seen at 2.5 km in Fig. 3. Below 2.5 km, the Doppler velocity differences between the two VPRs become relatively uniform, indicating that the process of melting snow/ice particles into raindrops is completed. Retrieved profiles of rain microphysical properties and their corresponding uncertainties (horizontal bars at different levels) in the rain layer (0–2.5 km) are shown in Fig. 3f–h. In general, the retrieved Dm values from the surface to 2.5 km are nearly a constant of ∼2 mm (Fig. 3f), while the retrieved RLWC and rain rate values slightly decrease from 2.5 km to the surface. One of the highlights of this study is, in addition to the surface rain rate, which can usually be observed using surface disdrometers, the vertical profiles of rain microphysical properties are retrieved. These retrieved rain microphysical properties will shed light on the understanding of liquid cloud and rain microphysical processes (like condensation, evaporation, autoconversion, and accretion) in the models.
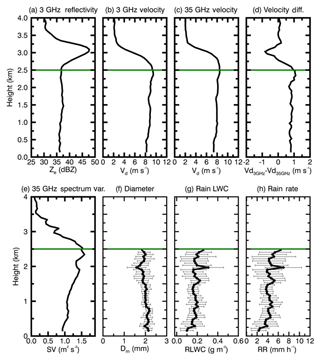
Figure 3An example of illustrating the Doppler velocity difference (DVD) retrieval algorithm at 13:40 UTC on 20 May 2011. The inputs of the DVD retrieval algorithm are (a) the 3 GHz vertical pointing radar reflectivity factor (Ze), (b) the 3 GHz radar Doppler velocities (Vd), (c) the 35 GHz radar Doppler velocities (Vd), and (e) the 35 GHz radar spectrum variance (SV). The Doppler velocity difference between 3 and 35 GHz is shown in (d). The outputs of the DVD retrieval algorithm are (f) mass-weighted mean diameter Dm, (g) rain liquid water content (RLWC), and (h) rain rate (RR). Retrieval uncertainties are shown as horizontal thin black lines.
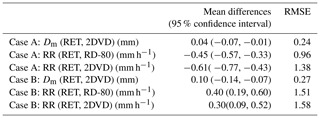
To evaluate the rain property retrievals, we compare the retrieved rain microphysical properties, the Dm, and rain rate at the surface, with the surface disdrometer measurements (Fig. 4). The Dm values range from 1.0 to 2.5 mm during a 3.5 h period, with nearly identical mean values of 1.79 and 1.81 mm from both retrievals and 2DVD measurements. There are large variations for rain rates, ranging from 0 to 8 mm h−1, with means of 3.19, 3.17, and 2.88 mm h−1, respectively, from the 2DVD, RD-80, and radar retrieval. The mean rain rates from 2DVD and RD-80 measurements are almost the same, although there are relatively large differences during certain time periods, while the retrievals from this study, on average, underestimate the rain rate by ∼10 % compared to the disdrometer measurements. More statistics (mean differences, their 95 % confidence intervals of mean differences and root mean square errors) can be found in Table 2. Overall, the mean differences are within the retrieval uncertainties. The variation of RLWP (Fig. 4c) mimics the variation of retrieved rain rate in Fig. 4d. The mean value of RLWP is 0.55 kg m−2 for this case, which is also the LWP below the melting base.
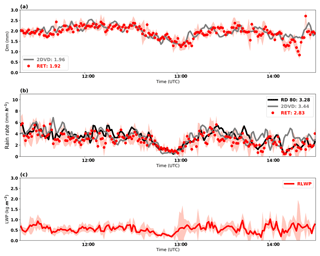
Figure 4Time series of (a) retrieved (RET) (red dots) and 2DVD surface disdrometer estimated (grey line) Dm, (b) RET (red line), 2DVD (grey line) and RD-80 (black line) surface disdrometer rain rate estimates, and (c) retrieved rain liquid water path (RLWP; red dots) for Case A (20 May 2011). The red shading areas are the estimated retrieval uncertainties.
4.1.2 Case B
On 11 May 2011, a surface cold front moved across the Oklahoma–Texas area, and then convections were initiated. At 16:00 UTC, a mesoscale convective system formed with a parallel stratiform precipitation region. A period of 2–3 h later (∼ 18:30 UTC), the mesoscale convective system was transitioned to a trailing stratiform mode passed over the ARM SGP site. The large stratiform regions are observed by two VPRs and disdrometers as shown in Fig. 1d–f. Figure 1d–f clearly show that the ceilometer-detected cloud bases are occasionally lower than the melting bases. Under this situation, both RLWP and CLWP could contribute to the LWP below the melting base.
Firstly, the surface rain microphysics (Dm, RLWC, rain rate, and RLWP) are retrieved using the DVD algorithm. These rain property retrievals are compared with the surface disdrometer measurements (Fig. 5). The Dm values at the surface range from 0.90 to 2.30 mm during a 4.5 h period with mean values of 1.41 and 1.52 mm, respectively, from both retrievals and 2DVD measurements. The difference between the retrieval and 2DVD measurements may be due to different sampling volumes between radar and the surface disdrometer, as well as wind shear. The rain rates, in this case, vary quite largely, ranging from 0.02 to 4.78 mm h−1, with means of 1.36, 1.26, and 1.66 mm h−1, respectively, from the single 2DVD, RD-80, and our retrieval. It is found that, from both Case A and Case B, the mean value from the RD-80 is smaller than that from the 2DVD. This may be due to the different ranges of measurable drop sizes from two types of disdrometers (0.3–5.4 mm for the RD-80, while 0.1 to 10 mm for the 2DVD). More statistics can be also found in Table 2. Overall, the mean differences are still within the retrieval uncertainties for this case.
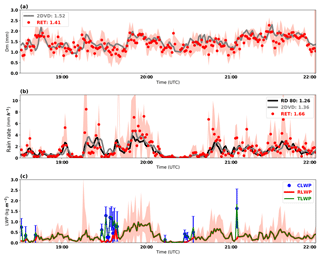
Figure 5Time series of (a) retrieved (RET) (red dots) and 2DVD surface disdrometer estimated (grey lines) Dm, (b) RET (red dots), 2DVD (grey line) and RD-80 (black line) surface disdrometer rain rate estimates, and (c) rain liquid water path (RLWP; red line), cloud liquid water path (CLWP; blue dots), and liquid water path (LWP = RLWP + CLWP, green lines) for Case B (11 May 2011). The red shading area and blue bars are the estimated retrieval uncertainties for rain microphysical properties (Dm, rain rate, and RLWP) and CLWP.
Secondly, the CLWP is retrieved using the attenuation algorithm introduced in Sect. 3.2. Figure 5c shows the time series of RLWP, CLWP, and LWP retrievals. It is found that the CLWP values (when they exist) are usually larger than RLWP values in the same vertical column. When cloud droplets and raindrops coexist below the melting base, the mean values are 0.11 and 1.64 kg m−2 for RLWP and CLWP, and the corresponding LWP below the melting layer is 0.76 kg m−2, while when only raindrops exist below the melting base, there is no CLWP (CLWP = 0), and the RLWP and LWP are the same (with average of 0.34 kg m−2). It is noticed that even though the occurrence of CLWP is low (11 %) in this case, the value of CLWP can be very large when it exists, and it is about 2 times larger than the mean RLWP. The mean value of LWP is 0.37 kg m−2 for all the samples in Fig. 5c. The blue uncertainty bars in Fig. 5c show the retrieved CLWP uncertainty when assuming both of the uncertainties of attenuation and total rain rate are 30 %. Due to the variations of the attenuation and total rain rate with time, the estimated uncertainties of CLWP vary point to point. More details about the estimation of CLWP are in Appendix B.
4.2 Statistical results
Box and whisker plots of retrieved RLWP, CLWP, and LWP for situations (I), (II), and all samples during MC3E are shown in Fig. 6. The horizontal dashed orange and red lines indicate the median and mean, boundaries of the box represent the first and third quartiles, and the whiskers are the 10th and 90th percentiles. During MC3E, a total of 13 h of stratiform rain was observed by VPRs at the ARM SGP Climate Research Facility, in which 91 % and 9 % the samples are categorized into situations (I) and (II), respectively. The mean RLWPs are 0.32 and 0.10 kg m−2 for situations (I) and (II). There are a substantial number of small cloud droplets sustaining in the rain layer that have not yet been converted to larger raindrops, which may partially explain the smaller RLWP in situation (II). The mean value of the surface rain rate is 2.06 mm h−1 when cloud droplets exist, which is also smaller than the mean value (2.38 mm h−1) in the rain-only situation. The mean CLWP in situation (II) is as large as ∼0.56 kg m−2, even though their occurrence is very low (9 %), which is much larger than mean RLWP in the liquid layer. The LWP from situation (II) (0.66 kg m−2) is much larger than the mean LWP from situation (I) (0.32 kg m−2), which is primarily contributed by cloud droplets. The overall mean LWP for stratiform rain during MC3E is 0.34 kg m−2.
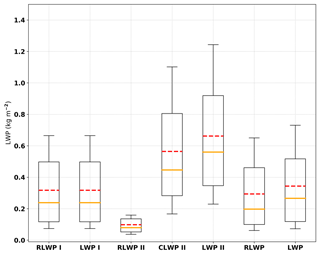
Figure 6Box and whisker plots of retrieved RLWP, CLWP, and LWP for situation (I), (II), and all samples. The horizontal orange line within the box indicates the median, boundaries of the box represent the 25th and 75th percentile, and the whiskers indicate the 10th and 90th percentile values of the results. The dashed red lines represent the mean values.
We also processed the ARM MWR-retrieved LWPs during MC3E and compared them with our retrievals as illustrated in Fig. 7a. The corresponding LWP uncertainties are also provided as the grey error bar for each retrieval, with the rain rate indicated by colors. It is noticed that the MWR has no LWP estimation when the rain rate is large. The MWR-retrieved LWPs increase with increased rain rate, and the retrievals from the MWR are much larger than the new LWP retrievals at high rate rates. The newly retrieved LWPs weakly correlate with rain rates, and most values are less than 1.0 kg m−2, especially at high rain rates. The MWR-retrieved LWPs increase with rain rate generally. The increase of retrieved LWP with rain rate from the MWR is possibly due to the wet radome effect (Cadeddu et al., 2017). In addition to the issue from standing water on the radome, the extinctions due to raindrops also affect MWR retrievals. The extinction for rain is much larger than that for cloud (Sheppard, 1996), and thus, the small amount of rainwater could enhance the measured brightness temperature significantly. More details of extinctions and brightness temperature calculations are shown in Appendix B. Statistical results of the retrieved LWPs from this study and the MWR are averaged for each measured rain rate bin (bin size = 0.25 mm h−1). The differences of LWPs from the MWR and this study are shown in Fig. 7b. The LWP differences increase with increased rain rate. The LWP differences between the MWR retrieval and this study could be for the following reasons. (1) MWR-retrieved LWP represents the entire vertical column (RWLP and CLWP below the melting layer, large water coated ice particles in the melting layer, and supercooled LWC above the melting layer), while our retrieval only represents the LWP below the melting base. As Battaglia et al. (2003) pointed out, the brightness temperature generally increases if mixed-phase precipitation is included. (2) The MWR radome was wet during rain periods, and the deposition of raindrops on the radome can cause a large increase in the measured brightness temperatures (Cadeddu et al., 2017). (3) Large extinctions due to raindrops would affect MWR retrievals. (4) Uncertainties exist in the retrieved LWP from this study.
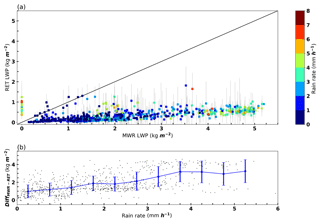
Figure 7(a) Comparisons between LWP from the microwave radiometer (MWR; on x axis) and LWP retrievals from this study (RET; on y axis, with estimated uncertainty in grey lines). The rain rates are indicated by colors. (b) The LWP differences between two estimations (MWR- RET) are shown as a function of rain rate.
LWP is a critical parameter for studying clouds, precipitation, and their life cycles. LWP can be retrieved from microwave radiometer measured brightness temperatures during cloudy and light precipitation conditions. However, MWR-retrieved LWPs are questionable under moderate and heavy precipitation conditions due to the wet radome and the large extinction in the unit volume caused by large raindrops. LWPs below the melting base in stratiform precipitation systems are estimated, which include both RLWP and CLWP. The measurements used in this study are mainly from two VPRs, 35 GHz from ARM and 3 GHz from NOAA during the MC3E field campaign.
In this study, the microphysical properties of raindrops, such as Dm, RLWC (and RLWP), and RR, are estimated following the method described in Williams et al. (2016) using measurements from co-located Ka- and S-band VPRs. The retrieved rain microphysical properties are validated by the surface disdrometer measurements. Instead of retrieving vertical air motion and rain DSDs (Williams et al., 2016), this study aims at retrieving RLWC and then integrating RLWC over the liquid layer to estimate RLWP. The CLWP is retrieved based on the modifications of the methods in Matrosov (2009, 2010) with available radar measurements, vertical pointing Ka- and S-band VPRs, during the MC3E field campaign.
The applicability of retrieval methods is illustrated for two stratiform precipitation cases (20 and 11 May 2011) observed during MC3E. Statistical results from a total of 13 h samples during MC3E show that the occurrence of cloud droplets below the melting base is low (9 %), while the CLWP value can be up to 0.56 kg m−2, which is much larger than the RLWP (0.10 kg m−2). When only raindrops exist below the melting base, the average RLWP value is 0.32 kg m−2, which is much larger than the mean RLWP in the situation of coexisting cloud droplets and raindrops. Our retrievals are also compared with ARM MWR-retrieved LWPs. It is noticed that the MWR has no LWP estimation when the rain rate is large. The MWR-retrieved LWPs increase with increased rain rate, and the retrievals from the MWR are much larger than our LWP retrievals at high rate rates. The LWP differences are fully discussed.
Reliable retrievals of RLWC and RLWP are critical for model evaluation and improvement, as RLWC (rain mixing ratio) is an important prognostic variable in weather and climate models. Furthermore, retrievals in the whole rain layer would be useful to understand the microphysical processes (i.e., condensation, evaporation, autoconversion, and accretion, etc.) and have great potential to improve model parametrizations in the future. Overall, the LWP (CLWP and RLWP) retrievals derived in this study can be used to evaluate the models that separately predict cloud and precipitation and contribute comprehensive information to study cloud–precipitation transitions. Note that the attenuation by liquid is more profound at 94 GHz, and the ratio of attenuation by liquid clouds and by rain is larger at 94 GHz compared to 35 GHz (Matrosov, 2009). Thus, using 94 GHz (W-band) radar measurements to develop a retrieval algorithm may be promising if the W-band radar signals are not fully attenuated. In addition, analyzing co-located multiple-frequency VPRs would also better define the uncertainties of retrievals made with co-located radars operating at different frequency pairs.
NOAA S-band vertical profile radar datasets are publicly available in the DOE archives (http://iop.archive.arm.gov/arm-iop/2011/sgp/mc3e/williams-s_band/, last access: 15 January 2015; Williams, 2012). KAZR ARSCL data are available in the DOE ARM archive (https://www.arm.gov/data, last access: 18 May 2017; ARM user facility, 2011).
Retrieving RLWC and other rain microphysical properties (i.e., drop size and rain rate) is based on the mathematics of DSD radar reflectivity-weighted velocity spectral density [(mm6 m−3) (m s], which is a product of the radar raindrop backscattering cross section (mm2) and DSD number concentration NDSD(D) (mm−1 m−3):
The [mm (m s] is used as a coordinate transformation from diameter to velocity, where vz (m s−1) is the raindrop terminal velocity of diameter D (mm) at altitude z. λ is the wavelength of the radar. equals 0.93, and it is the dielectric factor.
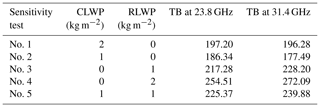
Table A1Brightness temperatures (TB) at 23.8 and 31.4 GHz for different assumptions of CLWP and RLWP values.
The NDSD(D) can be expressed as a normalized gamma shape distribution with three parameters (Leinonen et al., 2012):
where
Nw is the scaling parameter, μ is a shape parameter, Γ(x) is the Euler gamma function, and Dm is a mean mass-weighted raindrop diameter estimated from the ratio of the fourth to third DSD moments:
where Dmin and Dmax represent the minimum and maximum diameters in the distribution, respectively.

Figure A1Comparisons of (a) mass-weighted mean diameter Dm (mm), (b) shape parameter μ, (c) parameter α=10 log(Z3 GHz ∕ RLWC), and (d) parameter β = 10 log(Z3 GHz ∕ RR) calculated as functions of Doppler velocity difference (DVD) and spectrum variance at 35 GHz (SV35 GHz). Note that the units of RLWC and RR are grams per cubic meter (g m−3) and millimeters per hour (mm h−1).
The intrinsic (non-attenuation) reflectivity factor and the mean velocity and the spectrum variance are the zeroth, first, and second reflectivity-weighted velocity spectrum moments:
where vi represents the discrete velocities, and Δv is velocity resolution in the integration.
The Doppler velocity difference (DVD) is defined as
Note that both DVD and SV are dependent on DSD parameters (Dm and μ) only.
The RLWC and rain rate (RR) can also be described using the DSD:
In addition, there are two newly defined radar-related parameters (α and β), which are also dependent on Dm and µ only:
In this study, four variables, DVD, SV at 35 GHz (SV35 GHz), α, and β, are precalculated using different groups of Dm and μ values, and then these values are stored in lookup tables (LUTs). Raindrop backscattering cross sections are calculated using the T-matrix with different temperatures and oblate raindrop axis ratios (Leinonen, 2014). LUT examples are illustrated in Fig. A1 as functions of DVD and SV35 GHz. If we assume that the observed radar Doppler velocity difference and spectrum variance from the 35 GHz radar is equal to the DSD velocity difference and variance (DVD and SV35 GHz), the measured Doppler velocity difference and spectrum variance at 35 GHz can determine a solution for Dm from the LUT (Fig. A1a). Similarly, a value of Z3 GHzLWC (or Z3 GHzRR) can be found with measured DVD and SV35 GHz using the LUT in Fig. A1b (or Fig. A1c). Then RLWC (or RR) can be estimated using Eq. (A11) (or Eq. A12) with measured reflectivity at 3 GHz (Z3 GHz).
The observed radar Doppler velocity difference can be assumed to be equal to the DSD velocity difference for two reasons: (1) even though the radar observed Doppler velocity spectrum can be broaden by the air motion, this spectrum broadening variance is small (within 2 %) relative to the DSD velocity spectrum because of the narrow beamwidth (0.2∘) of KAZR, and (2) spectrum broadening is symmetric, which does not affect the first spectrum moment, and the DSD mean Doppler velocity only shifts due to the air motion. Therefore, the measured differences of Doppler velocity between the 3 and 35 GHz vertical pointing radar observations are independent of air motion and can be assumed to be the same as DVD from Eq. (A8). The validity of such an assumption is fully discussed in Williams et al. (2016).
The variabilities of 3 and 35 GHz VPR observations within each 1 min temporal resolution and 60 m vertical resolution bin are regarded as the measurement uncertainties and will be propagated through the retrieval to produce retrieval uncertainties. The retrieval uncertainties are estimated following two steps: (1) construction of a distribution of input radar measurements. For example, the temporal resolution for 3 GHz VPR is 7 s; thus there are about nine radar reflectivities observed for 1 min. A normal distribution is generated first using the mean and standard deviations of these nine observed radar reflectivities within 1 min and 60 m observations. (2) The DVD retrievals are repeated using samplings from distributions of all input measurements. We randomly select 100 groups of members from those (DVD, SV35 GHz, Z3 GHz) normal distributions to form 100 realizations and then produce 100 separate output estimates. The mean and standard deviation of the 100 solutions are regarded as the final retrieval and the retrieval uncertainty.
The uncertainties of RLWP are estimated based on the uncertainties of RLWC. More specifically, we first estimated the RLWC uncertainties at each height level, and then we calculated the ratios of RLWC uncertainties to the mean retrieved RLWC at each height level, which represent percentage values of retrieval uncertainties. Finally, we calculated the mean ratio of the uncertainties in the whole liquid layer below the melting base and regarded this mean ratio as the uncertainty of RLWP.
It is noted that the uncertainty here only considers estimates of instrument noise, not the uncertainties associated with assumptions used in the retrieval. For example, the gamma size distribution used in Eq. (A2) is an approximation which may introduce error into the retrieval. However, it is very difficult to quantify this type of retrieval uncertainty. In this study, we further compared our retrievals with independent surface disdrometer measurements to estimate the uncertainties of retrievals. Also, when both radars are observing within the Rayleigh scattering regime for small raindrops, the reflectivity-weighted radial velocities for these particles should be the same. In order to have a difference in radial velocity during the retrieval, large droplets must exist. The maximum diameters in drop size distribution measured by the disdrometer for all the stratiform cases during MC3E are investigated. It is found that the occurrence of small droplets only (maximum diameter < 1.3 mm) is very low (less than 3 %). Thus, it will not have a significant impact on the retrieval results. Notice that this algorithm is not suitable for strong convective rain due to the wind shear and strong turbulence as well as severe attenuation and extinction of the Ka-band radar signal.
CLWP can be simplified and estimated as follows:
The attenuation (A) is estimated by comparing the drop in Ka-band reflectivity with the unattenuated S-band reflectivity. The rain attenuation is estimated by the rain attenuation coefficient (C) multiplied by the total rain rate (Rtotal). C and B are the coefficients of rainwater and cloud water attenuation with values of ∼0.26 dB km−1 mm−1 h−1 and ∼0.87 dB kg−1 m−2, respectively. The influence of temperature uncertainty in B on the retrieval error is minor compared to the uncertainties of the total attenuation (A) and total rain rate (Rtotal) (Matrosov, 2010). The uncertainty of CLWP is calculated as
For given uncertainties of attenuation (Δa) and total rain rate (Δr), the uncertainty of CLWP can be calculated based on Eq. (B3).
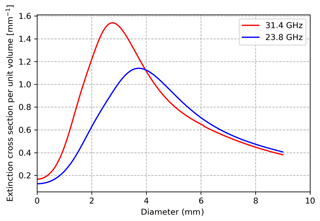
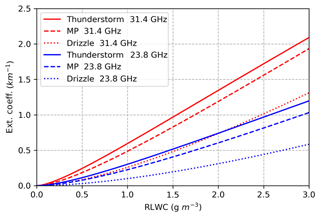
To better explain the “overestimation” issue of LWP retrieved by the microwave radiometer, several examples are given in this appendix. Firstly, we calculated the extinction cross section per volume as a function of the drop equivolume diameter for the two frequencies in the MWR (23.8 and 31.4 GHz) with a T-matrix method (Fig. B1). It is clearly shown that the extinction cross section increases with diameter when the diameter is smaller than 3 mm. This indicates the extinction (cross section) for raindrops (diameter > ∼50 µm) is much larger than that for cloud droplets (diameter < ∼ 50 µm). Secondly, we calculated the extinction coefficient as a function of RLWC for populations with three different drop size distributions (DSDs). The DSDs are modeled according to the exponential Marshall and Palmer (MP) distribution N(D) = N0 , where N0=8000 m−3 mm−1. N0 is changed to 4000 and 32 000 m−3 mm−1 to represent thunderstorm and drizzle DSDs. For more details of the DSDs please see Battaglia et al. 1(2009). Figure C clearly shows the extinctions of cloud and rain are also DSD-dependent. For example, at 31.4 GHz, even though the RLWC is the same, the extinctions are much larger from the precipitation with the thunderstorms and MP DSDs than the extinctions from light precipitation with the drizzle DSD.
In addition, the brightness temperatures in 23.8 and 31.4 GHz channels are calculated using the MicroWave Radiative Transfer (MWRT) model. Five different sensitivity tests are generated with five combinations of CLWP and RLWP values (Table A1). Table A lists the results and clearly demonstrates that the brightness temperatures in channels increase with increased cloud water amount (larger CLWP) and rainwater amount (larger RLWP). Comparing the results from test no. 2 and no. 3, it is clearly seen that the brightness temperatures contributed by raindrops are 31 and 51 K more than those contributed by cloud droplets at the frequencies of 23.8 and 31.4 GHz, even though their LWPs are the same (1 kg m−2) in these two tests.
JT and XD conceptualized this study. JT developed the retrievals, analyzed the data, and drafted the manuscript. XD contributed to the interpretation of the results and the editing of the paper. CW contributed to the discussions on the methodology in rain and cloud microphysics retrieval and the editing of the paper. BX and PW contributed to the discussions of the results.
The authors declare that they have no conflict of interest.
Jingjing Tian and Xiquan Dong are supported by the DOE CMDV project under grant DE-SC0017015 at the University of Arizona, and Baike Xi is supported by the NASA CERES project under grant NNX17AC52G at the University of Arizona. Christopher R. Williams is supported by the DOE ASR project under grant DE-SC0014294. Special thanks to Sergey Matrosov from NOAA Earth System Research Laboratory (ESRL) for his suggestions. Special thanks are given to Michael Jensen, PI of MC3E. The authors gratefully acknowledge the constructive comments by Alessandro Battaglia and one anonymous referee who helped improve the paper.
This research has been supported by the DOE CMDV project (grant no. DE-SC0017015), the NASA CERES project (grant no. NNX17AC52G), and the DOE ASR project (grant no. DE-SC0014294).
This paper was edited by Marcos Portabella and reviewed by Alessandro Battaglia and one anonymous referee.
Ackerman, T. P. and Stokes, G. M: The Atmospheric Radiation Measurement Program, Phys. Today, 56, 38–44, https://doi.org/10.1063/1.1554135, 2003.
ARM user facility (Atmospheric Radiation Measurement): Active Remote Sensing of CLouds (ARSCL) product using Ka-band ARM Zenith Radars (ARSCLKAZR1KOLLIAS), Southern Great Plains (SGP) Central Facility, Lamont, OK (C1), compiled by: Johnson, K., Toto, T., and Giangrande, S., ARM Data Center, available at: https://doi.org/10.5439/1350629 (last access: 18 May 2018), 2011.
Battaglia, A., Saavedra, P., T. Rose, and Simmer, C.: Characterization of precipitating clouds by ground-based measurements with the triple-frequency polarized microwave radiometer ADMIRARI, J. Appl. Meteorol., 49, 394–414, 2009.
Battaglia, A., Kummerow, C., Shin, D., and Williams, C.: Constraining Microwave Brightness Temperatures by Radar Brightband Observations, J. Atmos. Ocean. Technol., 20, 856–871, 2003.
Cadeddu, M. P., Liljegren, J. C., and Turner, D. D.: The Atmospheric radiation measurement (ARM) program network of microwave radiometers: instrumentation, data, and retrievals, Atmos. Meas. Tech., 6, 2359–2372, https://doi.org/10.5194/amt-6-2359-2013, 2013.
Cadeddu, M. P., Marchand, R., Orlandi, E., Turner, D. D., and Mech, M.: Microwave Passive Ground-Based Retrievals of Cloud and Rain Liquid Water Path in Drizzling Clouds: Challenges and Possibilities, IEEE Trans. Geosci. Remote Sens., 55, 6468–6481, https://doi.org/10.1109/TGRS.2017.2728699, 2017.
Crewell, S. and Löhnert, U.: Accuracy of cloud liquid water path from ground-based microwave radiometry, 2. Sensor accuracy and synergy, Radio Sci., 38, 8042, https://doi.org/10.1029/2002RS002634, 2003.
Dubrovina, L. S.: Cloudness and precipitation according to the data of airplane soundings, Gidrometeoizdat, Leningrad, 218 pp., 1982 (in Russian).
Ellis, S. M. and Vivekanandan, J.: Liquid water content estimates using simultaneous S and Ka band radar measurements, Radio Sci., 46, RS2021, https://doi.org/10.1029/2010RS004361, 2011.
Fabry, F. and Zawadzki, I.: Long-Term Radar Observations of the Melting Layer of Precipitation and Their Interpretation, J. Atmos. Sci., 52, 838–851, 1995.
Fan, J., Liu, Y.-C., Xu, K.-M., North, K., Collis, S., Dong, X., and Ghan, S. J.: Improving representation of convective transport for scale-aware parameterization: 1. Convection and cloud properties simulated with spectral bin and bulk microphysics, J. Geophys. Res.-Atmos., 120, 3485–3509, https://doi.org/10.1002/2014JD022142, 2015.
Feng, Z., Dong, X. Q., Xi, B. K., Schumacher, C., Minnis, P., and Khaiyer, M.: Top-of-atmosphere radiation budget of convective core/stratiform rain and anvil clouds from deep convective systems, J. Geophys. Res., 116, D23202, https://doi.org/10.1029/2011JD016451, 2011.
Feng, Z., Leung, L. R., Houze, R. A., Jr., Hagos, S., Hardin, J., Yang, Q., Han, B., and Fan, J.: Structure and evolution of mesoscale convective systems: Sensitivity to cloud microphysics in convection-permitting simulations over the United States, J. Adv. Model. Earth Syst., 10, 1470–1494, https://doi.org/10.1029/2018MS001305, 2018.
Giangrande, S. E., Collis, S., Theisen, A. K., and Tokay, A.: Precipitation estimation from the ARM distributed radar network during the MC3E campaign, J. Appl. Meteor. Climatol., 53, 2130–2147, https://doi.org/10.1175/JAMC-D-13-0321.1, 2014.
Hilburn, K. A. and Wentz, F. J.: Intercalibrated Passive Microwave Rain Products from the Unified Microwave Ocean Retrieval Algorithm (UMORA), J. Appl. Meteor. Climatol., 47, 778–794, https://doi.org/10.1175/2007JAMC1635.1, 2008.
Jensen, M. P., Petersen, W. A., Bansemer, A., Bharadwaj, N., Carey, L. D., Cecil, D. J., and Zipser, E. J.: The Midlatitude Continental Convective Clouds Experiment (MC3E), B. Am. Meteorol. Soc., 50, 419–432, https://doi.org/10.1175/BAMS-D-14-00228.1, 2015.
Leinonen, J.: High-level interface to T-matrix scattering calculations: architecture, capabilities and limitations, Opt. Express, 22, 1655–1660 https://doi.org/10.1364/OE.22.001655, 2014.
Leinonen, J., Moisseev, D., Leskinen, M., and Petersen, W. A.: A Climatology of Disdrometer Measurements of Rainfall in Finland over Five Years with Implications for Global Radar Observations, J. Appl. Meteor. Climatol., 51, 392–404, https://doi.org/10.1175/JAMC-D-11-056.1, 2012.
Liljegren, J. C., Clothiaux, E. E., Mace, G. G., Kato, S., and Dong, X.: A new retrieval for cloud liquid water path using a ground-based microwave radiometer and measurements of cloud temperature, J. Geophys. Res., 106, 14485–14500, https://doi.org/10.1029/2000JD900817, 2001.
Matrosov, S. Y.: Assessment of radar signal attenuation caused by the melting hydrometeor layer, IEEE Trans. Geosci. Remote Sens., 46, 1039–1047, https://doi.org/10.1109/TGRS.2008.915757, 2008.
Matrosov, S. Y.: A method to estimate vertically integrated amounts of cloud ice and liquid and mean rain rate in stratiform precipitation from radar and auxiliary data, J. Appl. Meteor. Climatol., 48, 1398–1410, 2009.
Matrosov, S. Y.: Synergetic use of millimeter- and centimeter-wavelength radars for retrievals of cloud and rainfall parameters, Atmos. Chem. Phys., 10, 3321–3331, https://doi.org/10.5194/acp-10-3321-2010, 2010.
Mazin, I. P. (Ed.): Clouds and the Cloudy Atmosphere, Gidrometeoizdat, Leningrad, 648 pp., 1989.
Saavedra, P., Battaglia, A., and Simmer, C.: Partitioning of cloud water and rainwater content by ground-based observations with the Advanced Microwave Radiometer for Rain Identification (ADMIRARI) in synergy with a micro rain radar, J. Geophys. Res., 117, D05203, https://doi.org/10.1029/2011JD016579, 2012.
Sassen, K., Campbell, J. R., Zhu, J., Kollias, P., Shupe, M., and Williams, C.: Lidar and Triple-Wavelength Doppler Radar Measurements of the Melting Layer: A Revised Model for Dark- and Brightband Phenomena, J. Appl. Meteor., 44, 301–312, https://doi.org/10.1175/JAM-2197.1, 2005.
Sheppard, B. E.: Effect of Rain on Ground-Based Microwave Radiometric Measurements in the 20–90 GHz Range, J. Atmos. Ocean. Technol., 13, 1139–1151, 1996.
Tian, J., Dong, X., Xi, B., Wang, J., Homeyer, C. R., McFarquhar, G. M., and Fan J.: Retrievals of ice cloud microphysical properties of deep convective systems using radar measurements, J. Geophys. Res.-Atmos., 121, 10820–10839, https://doi.org/10.1002/2015JD024686, 2016.
Tian, J., Dong, X., Xi, B., Minnis, P., Smith, W. L., Jr, Sun-Mack, S., Thieman, M., and Wang, J.: Comparisons of ice water path in deep convective systems among ground-based, GOES, and CERES-MODIS retrievals, J. Geophys. Res.-Atmos., 123, 1708–1723, https://doi.org/10.1002/2017JD027498, 2018.
Tridon, F. and Battaglia, A.: Dual-frequency radar Doppler spectral retrieval of rain drop size distributions and entangled dynamics variables, J. Geophys. Res.-Atmos., 120, 5585–5601, https://doi.org/10.1002/2014JD023023, 2015.
Tridon, F., Battaglia, A., and Kollias, P.: Disentangling Mie and attenuation effects in rain using a Ka-W dual-wavelength Doppler spectral ratio technique, Geophys. Res. Lett., 40, 5548–5552, https://doi.org/10.1002/2013GL057454, 2013.
Tridon, F., Battaglia, A., Luke, E., and Kollias, P.: Rain retrieval from dual-frequency radar Doppler spectra: validation and potential for a 25 midlatitude precipitating case-study, Q. J. Roy. Meteor. Soc., 143, 1364–1380, 2017.
Turner, D. D., Clough, S. A., Liljegren, J. C., Clothiaux, E. E., Cady-Pereira, K. E., and Gaustad, K. L.: Retrieving liquid water path and precipitable water vapor from the Atmospheric Radiation Measurement (ARM) microwave radiometers, IEEE Trans. Geosci. Remote Sens., 45, 3680–3690, 2007.
Wentz, F. J. and Spencer, R. W.: SSM/I Rain Retrievals within a Unified All-Weather Ocean Algorithm, J. Atmos. Sci., 55, 1613–1627, 1998.
Williams, C. R.: S-band vertically pointing radar, Atmospheric Radiation Measurement (ARM) Climate Research Facility Data Archive, available at: http://iop.archive.arm.gov/arm-iop/2011/sgp/mc3e/williams-s_band/ (last access: 15 January 2015), 2012.
Williams, C. R.: Reflectivity and liquid water content vertical decomposition diagrams to diagnose vertical evolution of raindrop size distributions, J. Atmos. Ocean. Technol., 33, 579–595, https://doi.org/10.1175/JTECH-D-15-0208.1, 2016.
Williams, C. R., Beauchamp, R. M., and Chandrasekar, V.: Vertical air motions and raindrop size distributions estimated from mean Doppler velocity difference from 3- and 35-GHz vertically pointing radars, IEEE Trans. Geosci. Remote Sens., 54, 6048–6060, https://doi.org/10.1109/TGRS.2016.2580526, 2016.
Xu, W.: Precipitation and convective characteristics of summer deep convection over east Asia observed by TRMM, Mon. Weather Rev., 141, 1577–1592, 2013.
- Abstract
- Introduction
- Data
- Methodology of liquid water path estimation
- Retrieval results and discussions
- Summary and conclusions
- Data availability
- Appendix A: Doppler velocity difference algorithm (“DVD algorithm”)
- Appendix B: CLWP Uncertainty
- Appendix C: Calculations of extinction and brightness temperature in microwave radiometer channels
- Author contributions
- Competing interests
- Acknowledgements
- Financial support
- Review statement
- References


