the Creative Commons Attribution 4.0 License.
the Creative Commons Attribution 4.0 License.
 | 09 Aug 2019
Morphology and Raman spectra of aerodynamically classified soot samples
Alberto Baldelli
Steven Nicholas Rogak
Airborne soot is emitted from combustion processes as aggregates of primary particles. The size of the primary particles and the overall aggregate size control soot transport properties, and prior research shows that these parameters may be related to the soot nanostructure. In this work, a laminar, inverted nonpremixed burner has been used as a source of soot that is almost completely elemental carbon. The inverted burner was connected to an electrical low-pressure impactor, which collected particles on stages according to the aerodynamic diameter, from 0.03 to 10 µm. The morphology was analyzed using a transmission electron microscope followed by image processing to extract projected area and average primary particle size for each aggregate (approximately 1000 aggregates analyzed in total for the nine impactor stages). Carbon nanostructure was analyzed using a Raman spectrometer, and five vibrational bands (D4, D1, D3, G, and D2) were fitted to the spectra to obtain an estimate of the carbon disorder. The average primary particle diameter increases from 15 to 30 nm as the impactor stage aerodynamic diameter increases. The D1, D3, D2, and D4 bands decreased (relative to the G band) with the particle size, suggesting that the larger aggregates have larger graphitic domains.
- Article
(1773 KB) - Full-text XML
-
Supplement
(783 KB) - BibTeX
- EndNote


Many studies on carbonaceous aerosols, their production, properties, and impacts on the environment and human health have been conducted (Pöschl, 2005). Considering the complexity of the soot formation processes, the diversity of sources that produce it, and the variety of measurement approaches used, it is not surprising that the literature contains a wide range of measured values for soot size, optical properties, and chemical reactivity (relevant to toxicity, behavior in the environment, and behavior in engineered systems such as oxidation traps).
Soot is produced through the rapid pyrolysis of fuel molecules followed by nucleation, surface growth, aggregation, and oxidation (Frenklach, 2002). Typically, mature soot is composed of graphene layers held together by weak van der Waals interactions, separated by a distance of approximately 0.335 nm (Frenklach, 2002). However, in addition to this structure, soot can contain both amorphous carbon and crystalline graphite-like carbon (Vander Wal et al., 2010). Amorphous soot consists of short, disconnected, and randomly oriented graphene segments (Jaramillo et al., 2014). The amorphous soot includes polycyclic aromatic hydrocarbons (PAHs) and other components, such as aliphatics, sulfates, and metal oxides. The ratio between the amorphous organic carbon and the crystalline graphite-like carbon relates to the condition of the soot formation process (Sadezky et al., 2005). The processes described here lead to the formation of nearly spherical primary particles of 10–40 nm diameter that join together through Brownian coagulation into aggregates 50–1000 nm long. Apparently, the majority of this coagulation happens over very short length and timescales, because within each aggregate the primary particle size is quite uniform. This is suggestive of uniform conditions present for the formation of each aggregate (Dastanpour and Rogak, 2014), which would imply that the primary particle size might be correlated with soot chemical and optical properties. If this is true, then variations in soot aggregate properties could provide information on variations in flame reaction zones. A correlation between particle size and chemical/optical properties would have implications for the way that soot is measured and how it would behave in the environment. A few references investigate the chemical and morphological properties of soot sampled downstream of a single source operating at constant conditions (Alfè et al., 2009; Haller et al., 2019; Ghazi et al., 2013). However, these studies did not directly correlate the two types of properties, chemical and morphological. The correlation between particle size and chemical/optical properties can be observed by reviewing the results of a few literature references (Saffaripour et al., 2017; Ess et al., 2016). The present work takes a step towards confirming, verifying, and understanding these correlations by applying transmission electron microscopy (TEM) and Raman spectroscopy to soot segregated by aerodynamic diameter.
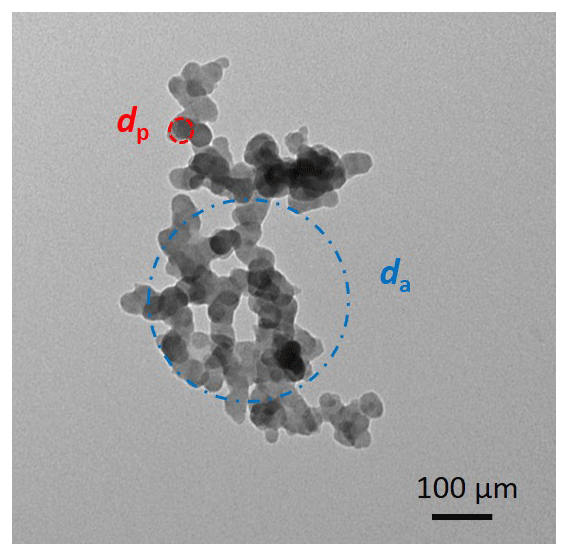
Figure 1Illustration of the terms primary particle diameter (dp, red dashed circle) and projected-area-equivalent diameter (da, blue dotted–dashed circle). The image is from stage 6 of the ELPI for an ethylene flow of 0.13 L min−1.
Laboratory burners are commonly used for studies on the properties of soot. Premixed flame burners, such as the McKenna burner, require globally rich mixtures to produce soot; nonpremixed flame burners, such as the Santoro burner or inverted burner (Stipe et al., 2005), are a better model of practical combustion devices in that they produce soot with globally lean mixtures. Combustion aerosol standard CAST or miniCAST are commonly used since they are easy to operate and allow one to readily adjust the particle size in a large range, typically between 10 and 200 nm (Ess and Vasilatou, 2019). Like CAST burners, inverted burners are advantageous because they produce very steady flames with high soot yields (Ghazi et al., 2013). The miniCAST and the mini inverted burner are considered alternative techniques to produce a steady stream of soot particles. The main difference is the lower cost of the mini inverted burner compared to the most popular miniCAST burner. In this work, we applied the TEM image analysis and Raman spectroscopy to study soot produced by an inverted burner and subsequently segregated by size.
2.1 Soot nanoparticles production and sampling
Soot was produced with a miniature inverted burner (Argonaut Scientific) using ethylene (0.13 L min−1) burning in bottled air (10 L min−1). The inverted burner is sealed during operation to avoid flickering flames. A tee connection at the exhaust of the burner ensures that the burner operates at atmospheric pressure (Fig. 2). A pump is used to supply a dilution line to reduce concentrations at the instruments.
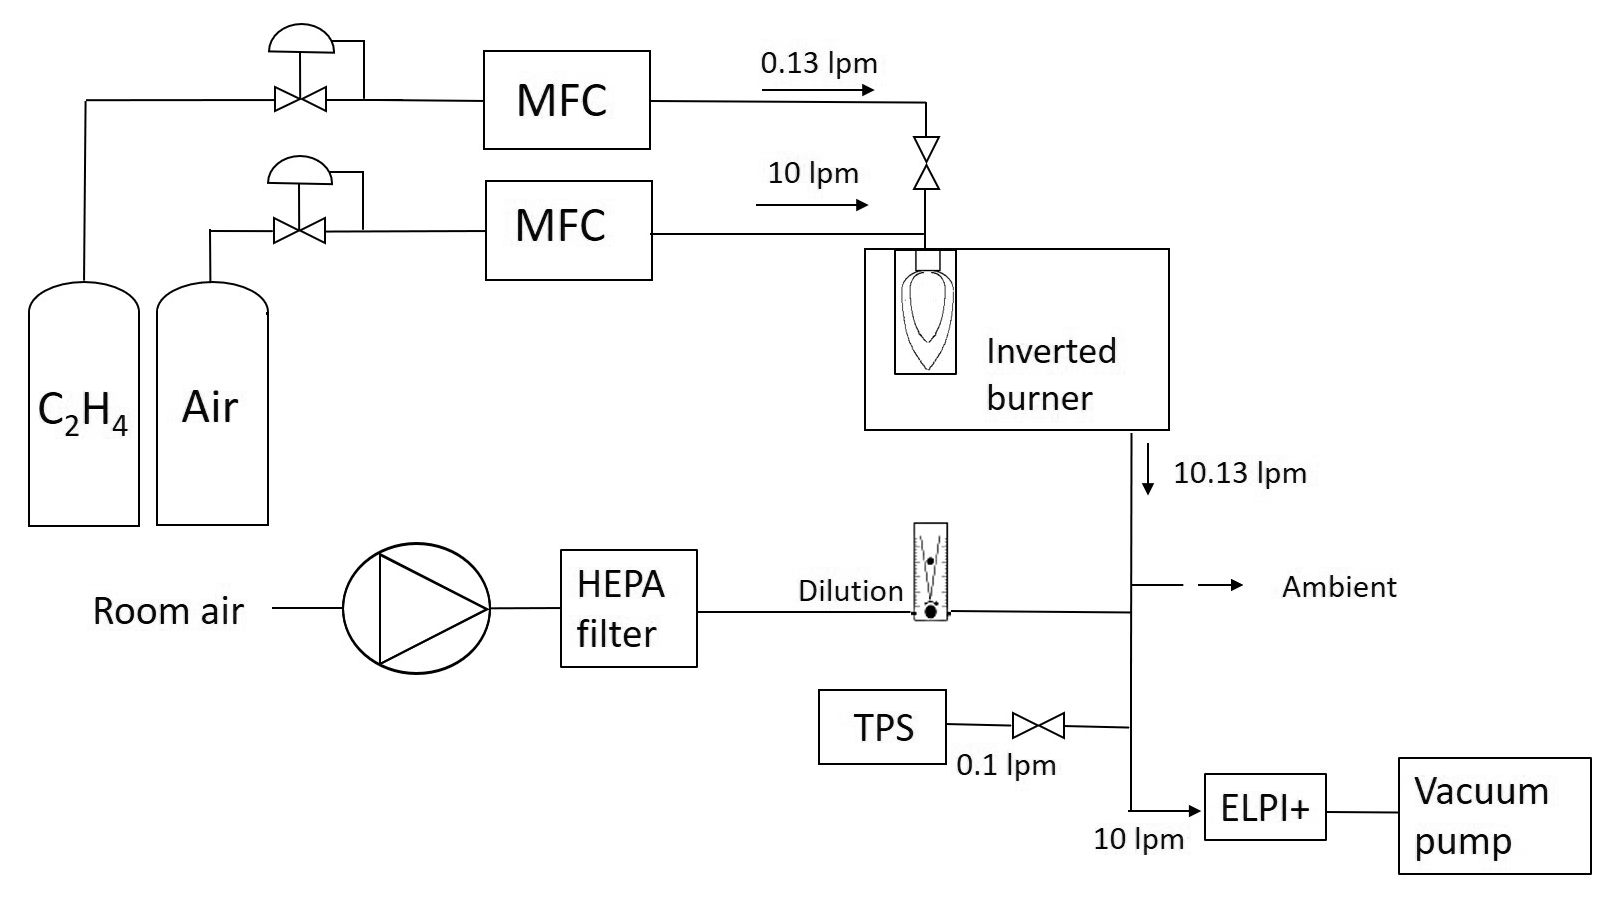
Figure 2Schematic of the setup used for the production and sampling of soot. MFC and TPS refer to mass flow controller and thermophoretic particle sampler, respectively.
An electrical low-pressure impactor (Dekati ELPI+) was used to collect size-segregated samples, as in some earlier work (Kim et al., 2013; Liati et al., 2018). The ELPI+ also provides electrical currents from each stage that are used to recover aerosol size distributions. For determining size distributions from the currents, an acquisition time of 120 s was used, with a dilution flow of 2 L min−1. For collection of samples for TEM (which required a light loading), a sample time of 5 s was used with a dilution flow of 3 L min−1. For the Raman samples on titanium foils, a sample time of 10 s was used with a dilution flow of 3 L min−1. TEM and Raman samples were collected from stages 3 to 11 of the ELPI+. Raman spectra of soot aerosols were collected at least 30 min after burner ignition to ensure flame stability. A carbon type-B 300 mesh (copper, 1813, Ted Pella) has been used as a collection substrate for the TEM analysis, while a titanium foil of 3 mm×3 mm was used for the Raman analysis. Both types of substrates were placed on each stage using a piece of tape applied only at the edges of the grid. Impactor grease was not applied in the area of the collection substrates. The impactor grease reduces the aggregates bouncing from one stage to the following one.
A thermophoretic particle sampler (TPS) was used to collect unsegregated (total) samples from the exhaust of the burner. For samples collected by the TPS and analyzed by Raman microscopy, a sample time of 30 s was used with a dilution flow of 4 L min−1. This sampler heats the aerosol to approximately 200 ∘C in a small capillary (residence time of < 0.1 s) before the sample is deposited on a room-temperature microscope grid (or titanium foil).
2.2 Sample analysis
TEM has been widely used to analyze the morphology of soot nanoparticles. Manual or automatic codes are commonly used to pursue a detailed analysis of TEM images (Wang et al., 2016; Yehliu et al., 2011). Manual sizing is laborious, which makes it difficult to generate statistically adequate measurements. These issues can be solved by using automatic codes, but usually with a loss of accuracy in the measurements for each aggregate (Wang et al., 2016).
A Hitachi H7600 TEM was used to produce at least 50 images per ELPI+ stage. In this work we use the algorithm developed by Dastanpour (2016). The validated code is used in the current work to determine the projected-area-equivalent diameter of the aggregates and the average primary particle diameter for each aggregate (Baldelli et al., 2019) (Fig. 1 shows an example of a primary particle highlighted in red within a complete aggregate). The projected-area-equivalent diameter is the diameter of a sphere with the same projected area as the aggregate. The algorithm determines the average primary particle diameter for each aggregate with an error of less than 14 % relative to manual sizing, for individual aggregates, and a bias of less than 4 % for typical samples.
TEM images are analyzed using two different procedures. TEM images can be defined a “overloaded”, as shown in Fig. 3a, which shows soot aerosols collected on the ELPI stage 6 and generated by an ethylene flow of 0.13 L min−1 using the system shown in Fig. 1. Red dotted–dashed ovals identify overloaded areas where it is impossible to use our image analysis codes. Blue dashed circles identify the areas selected for imaging. Imaging only soot aggregates located in the blue dashed areas may exclude large aggregates that tend to follow the impactor streamlines and to impact onto other large aggregates creating larger clusters. Another possible source of formation of aggregates larger than 2 µm in an inverted burner is the stagnation plane formed at the tip of the inverted flame; here, aggregates can be confined and, with a long residence time, they tend to grow in size (Kazemimanesh, 2019). Thus, we expect these TEM samples to bias the results to smaller sizes than the true mass-averaged size.
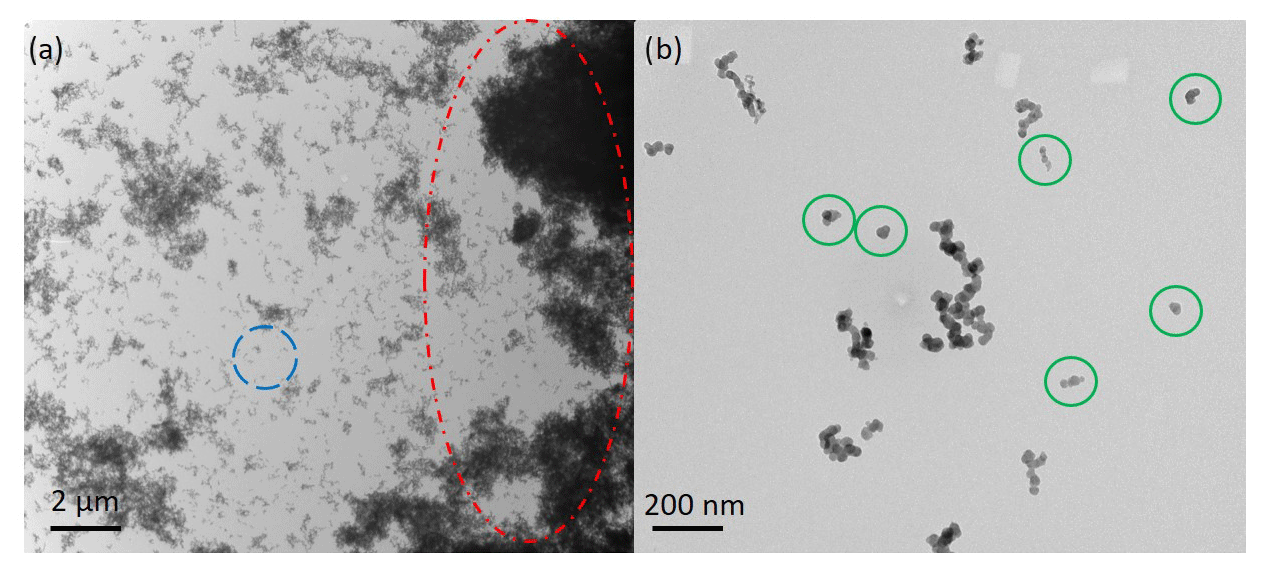
Figure 3TEM images of aerosols collected on stage 6 for (a) low dilution and (b) more diluted sample*. For both cases the ethylene flow was 0.13 L min−1. In (a) red dotted–dashed circles identify overloaded areas, and blue dashed circles identify the area selected for image processing. In (b) green circles identify aggregates composed by less than three soot nanoparticles that are removed by the image analysis. * The diluted samples were created using filtered building compressed air for combustion rather than the bottled air. There were indications that this may have affected Raman spectra, but the overall conclusion (see Supplement) was that the air source has a negligible effect on the soot.
Decreasing the collection time and increasing the dilution rate improved the sampling considerably, producing lightly loaded samples. Figure 3b (for stage 6) has been produced using a dilution rate of 2 L min−1, a purge flow of 2 L min−1, and a collection time of 2 s; for those tests the bottled air was replaced with building air, shown in the SI (Fig. S3). Using this alternative setup system, TEM grids have been placed on stage 4, 6, 8, and 10. TEM images show much less populated samples (Fig. 3b). However, now we noticed the presence of some aggregates much smaller than expected (green circles). For stage 6, the expected mean aerodynamic diameter would be 120 nm; the aggregates contained in the green circles in Fig. 3b are approximately 20 nm. A recent work shows the impaction effect of micro and nanoparticles on impactor stages; large aggregates seem to break into smaller aggregates while impacting onto the stage (Wernet et al., 2017). Conceivably a similar mechanism could apply to the ELPI+ sampling. These small aggregates, although surprising, have little influence on the results for either the TEM (because primary particle sizes are plotted as a function of aggregate size) or Raman analysis (which we expect to reflect mass-averaged characteristics). Given the likelihood of these small particles being artifacts, we have removed them in the reported averages for the stages. Specifically, aggregates lower than the 15 % of the average projected-area-equivalent diameter at each stage and at each operating condition of the inverted burner. The 15 % is an arbitrary cutoff but small differences are encountered if values between 10 % and 20 % are selected.
Raman spectroscopy has been used to find the ratio between the amorphous and the crystalline contents of soot nanoparticles (Sadezky et al., 2005). Raman spectroscopy is sensitive only to short-range order, molecular structures, but due to the symmetry of the observed vibrations also structures and morphologies can be differentiated (Sadezky et al., 2005). Here, we assume that Raman spectra can be taken as an indication of nanostructural features relevant to optical or chemical properties. The Raman spectrum of soot shows clear bands, each one with a specific reference to the chemical properties of soot (Saffaripour et al., 2017). By knowing the fingerprints of soot nanoparticles it may be possible to recognize the influence of the production conditions, such as gas type, flame location, flame velocity, and source type (Patel et al., 2012). Since titanium and titanium oxide exhibit no Raman active vibrations in the area of interest, titanium substrates were selected for the Raman analysis. The titanium foils can be punched to produce disks of 3 mm, which can be substituted for common TEM grids in the TPS.
The Raman spectrometer used was a Renishaw confocal with a digital stage and 785 nm point-focus laser at typical power of 0.2 mW. Three or more Raman spectra were collected for each sample in order to generate a standard deviation (later, the error bars presented on the graphs are from error propagation of these standard deviations). The exposure time was 10 s, and the accumulation time was 1 s. The soot Raman spectra were fitted using Origin Pro software as follows. Spectra were smoothed over the 500 to 2000 cm−1 range selected for fitting of the first-order soot Raman bands. The roughness of the titanium disks and their oxide layer generate a Raman spectrum background, which was used as a baseline in order to eliminate the spectra slopes (Calabrese et al., 2017). By using a long wavelength laser (Grafen et al., 2015) and the titanium substrates Raman signal as baseline subtraction, most of the samples do not show any residual fluorescence. Otherwise, the residual fluorescence was subtracted using a straight line. An approximate location for the peak centers was selected, but a change of the peak centers was allowed within the expected ranges shown below. Blank samples with and without the impactor grease showed a near-linear trend that was removed by the baseline subtraction process described above. The five-peak deconvolution has been used and validated in previous literature references (Lapuerta et al., 2011, 2012; Sadezky et al., 2005; Saffaripour et al., 2017; Seong and Boehman, 2013). The five main peaks in soot (Lapuerta et al., 2011, 2012; Sadezky et al., 2005; Saffaripour et al., 2017) are as follows:
-
D4 (centered 1127 to 1208 cm−1) – caused by curved PAHs layers in graphitic crystallites, carbon atoms in sp3 and intermediate sp2–sp3 hybridization states.
-
D1 (centered 1301 to 1317 cm−1 for a laser wavelength of 780 nm) – induced by defects along graphitic edge planes.
-
D3 (centered around 1489 to 1545 cm−1) – induced from impurity ions (e.g., calcium, fluorine, and potassium) and amorphous carbon mixtures.
-
G (centered around 1571 to 1598 cm−1) – identifies the graphitic content in soot nanoparticles.
-
D2 (centered around 1610 to 1625 cm−1) – related to the disorder in polycyclic aromatic hydrocarbons (PAHs) around the soot boundaries.
The combination of a Gaussian curve for the D3 band and Lorentzian curve for the D4, D1, D2, and G bands, all with floating peak locations, was found here to generate the lowest Chi-squared sums, the highest linear regression coefficients, and very repeatable results from sample to sample. The number of free parameters used in these fits is comparable to those used by Saffaripour et al. (2017) and others that used five bands. Figure 4 shows a typical curve fitting of a Raman spectrum of soot nanoparticles deposited on a stage (stage 4 is used as example). Tables S1, S2, and S3 in the Supplement provide the details of the fits and peaks for the samples.
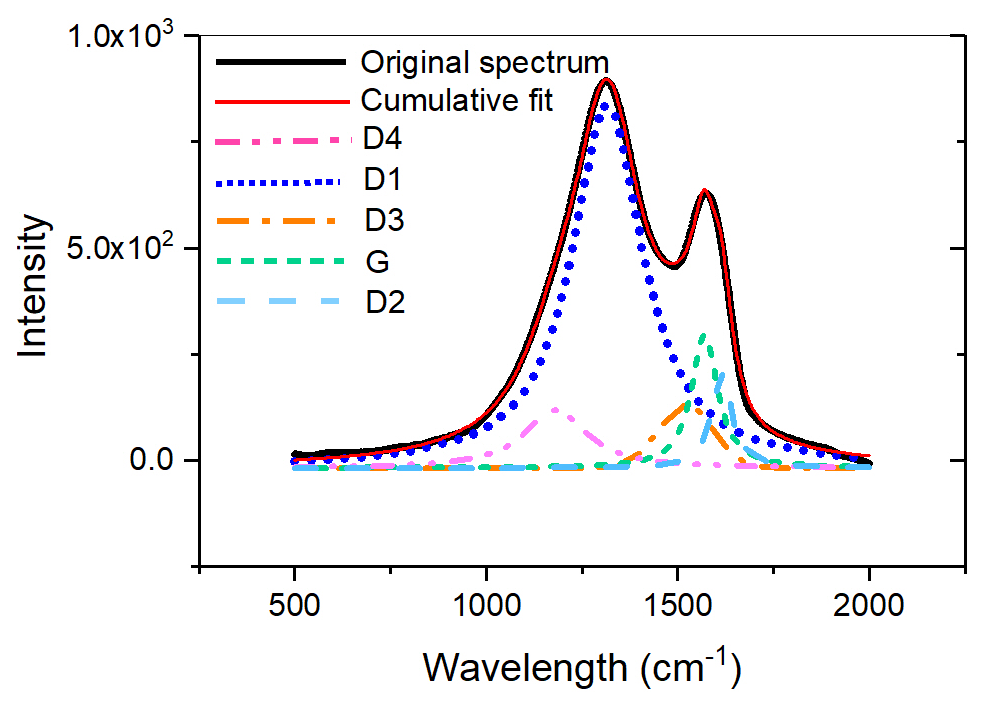
Figure 4Five-band curve fitting of a typical soot Raman spectrum. The D1, D2, D4, and G bands are fitted with a Lorentzian curve, while the D3 band is fitted with a Gaussian curve. The sample is from soot nanoparticles generated by an inverted burner and collected with an ELPI+ (stage 4) with the system shown in Fig. 1.
Soot aerosols were characterized by their aerodynamic size distribution, electron microscopy of samples, and Raman spectroscopy. The results discussed below were obtained using the conditions explained in Sect. 2.1 and the apparatus shown in Fig. 2 and, only for TEM samples, an alternative system shown in Fig. S4 in the Supplement including building air instead of bottled air.
3.1 Aerodynamic size distribution
Figure 5 shows the number distribution as a function of aerodynamic diameter. In Fig. 5, the mean aerodynamic diameters Dae (in microns) are 0.02, 0.04, 0.07, 0.12, 0.2, 0.31, 0.48, 0.76, and 1.25 for the stages 3 to 11 respectively. The particle density used in the ELPI+ data inversion was set to 1.2 g cc−1 based on work in Maricq and Xu (2004). In fact, the effective density of soot decreases with size, but we still expect that most of the mass is on the largest stages. At the burner condition used, the flame tip is open, soot emissions are very high, and super aggregates can form (Ghazi et al., 2013; Saffaripour et al., 2017). Figure 5 shows the distribution of the aerodynamic diameter at each stage of ELPI+. The aerodynamic diameter distribution shows a peak at stages 5 to 7; most aggregates produced by the inverted burner are between 0.1 and about 5 µm. Stages 8, 9, and 10 show the highest mass content, as shown in the Supplement by observing Fig. S1.
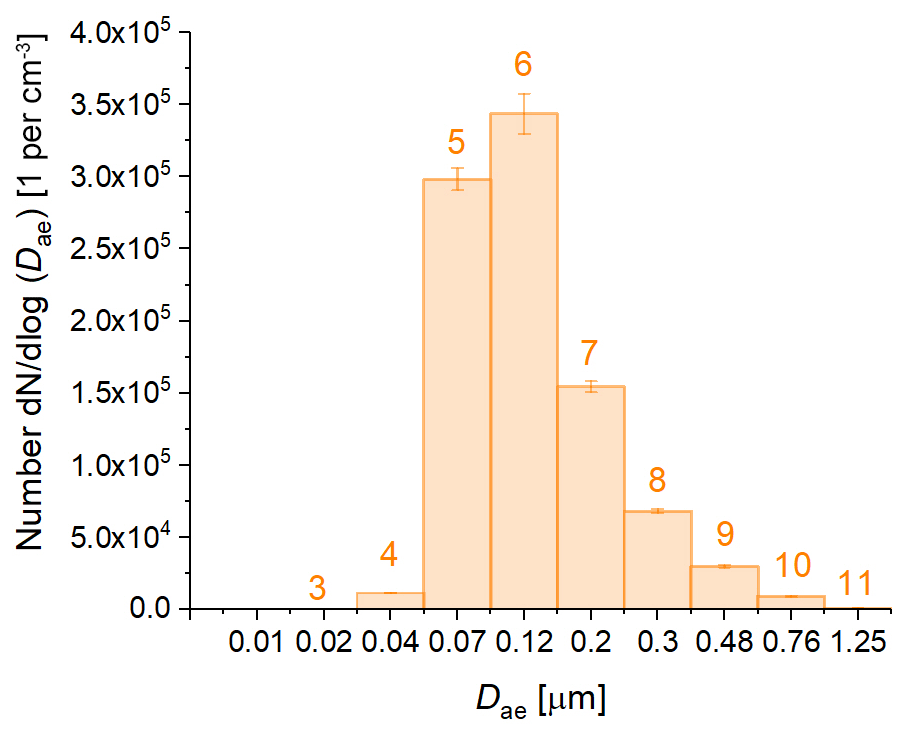
Figure 5Number distribution recorded by ELPI+ for stages 3 to 11, with the stage mean aerodynamic diameter given below each column.
3.2 TEM analysis
In Fig. 6, the relationship between the projected-area-equivalent diameter (da) and the primary particle diameter (dp) is shown. For comparison, we show the universal fit (Olfert and Rogak, 2019) for a wide range of soot sources; the fit equation is
Results from the samples collected here from the ELPI+ are quite close to Eq. (1) (dashed line), but depending on which parts of the impactor deposits are analyzed there are some discrepancies. In Fig. 6, full symbols identify the method and system explained in Fig. 3a and empty symbols in Fig. 3b. In the case of full symbols, the TEM grids were often overloaded, such that imaging needed to be done in areas away from the main deposits on the impactor stages (Fig. 3a). Thus, there could be bias in the choice of particles imaged, but in fact the TEM sizing is reasonably consistent with the impactor stage. For example, the mean area-equivalent diameter for stage 5 is 140 nm. Aggregates of this size should have an effective density of approximately 430 kg m−3 (using the Olfert and Rogak relations), resulting in an aerodynamic behavior equivalent to an 83 nm sphere with a density of 1200 kg m−3 (using the projected-area diameter as a proxy for mobility diameter). Given the uncertainties involved in the effective density and the resolution of the ELPI (and TEM), this appears consistent with the nominal midpoint aerodynamic diameter for this stage: 70 nm. For stage 10, the area-equivalent diameter is 208 nm, which we expect to result in an aerodynamic diameter of 112 nm. This is far lower than the stage midpoint of 760 nm – most likely an indication that the TEM imaging is biased towards unusually small aggregates that deposit on the stage away from the stagnation point by a mixture of inertial effects and diffusion. This interpretation is supported by additional sampling for similar burner operation, but much lower concentrations, as shown in the empty symbols in Fig. 6. In this case, TEM measurements followed Eq. (1) quite closely up to aggregate sizes of a micron – closer to but still smaller than the expected impactor stage cut point. The comparison between the heavily loaded and lightly loaded cases clearly shows that the sizing can be biased, but in either case the primary particle size increases monotonically with the stage number, so differences in Raman spectra with the stage number are plausibly associated with primary particle size.
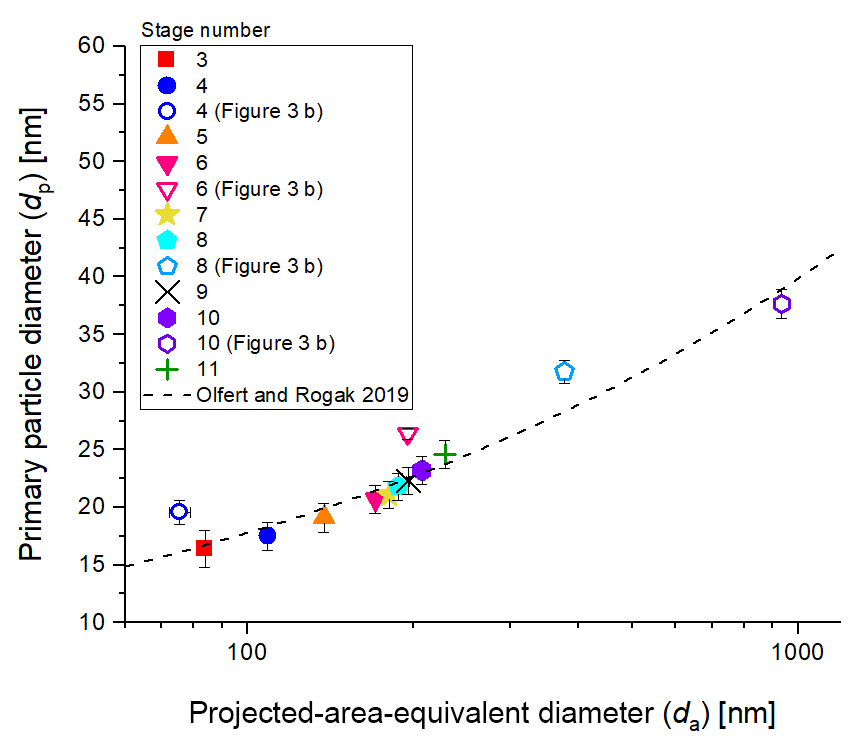
Figure 6The relationship between the primary particle diameter and the projected-area-equivalent diameter from the literature is shown as the dashed line (Olfert and Rogak, 2019) and experimentally here (symbols). Full and empty symbols identify results achieved by analyzing similar images as Fig. 3a and b, respectively.
3.3 Raman spectroscopy
Figure 7 shows the Raman spectra (normalized by the D1 peak) of soot aerosols collected on different stages and from a sample of unclassified soot collected by a thermophoretic sampler (TPS) onto the same type of titanium foil (total). The spectra are very similar, and it is only when ratios are plotted that differences become apparent.
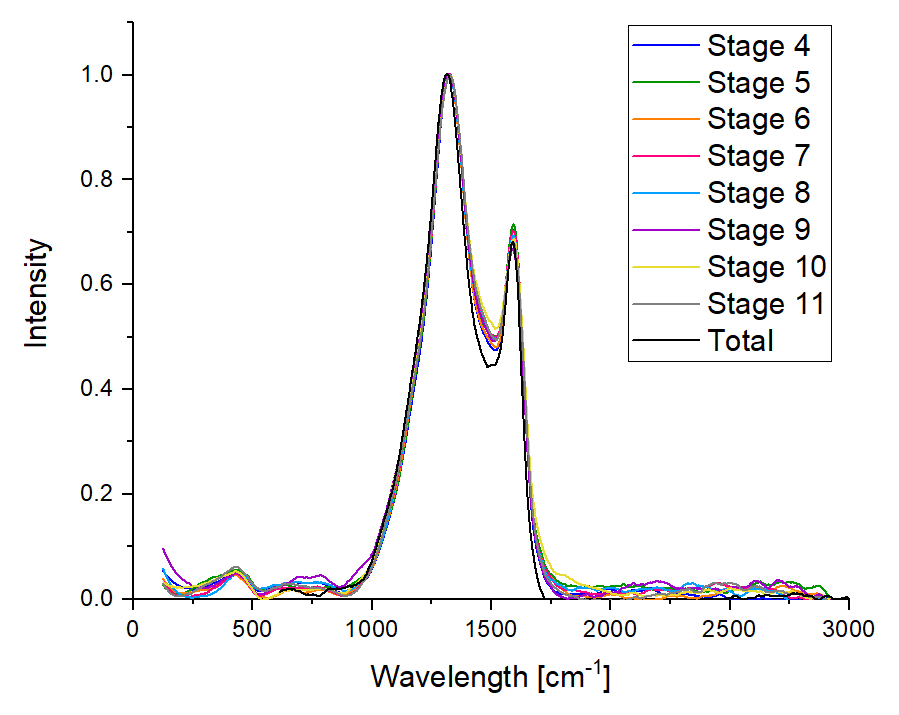
Figure 7Normalized Raman band ratios of soot segregated by a sampling on the stages of the ELPI+ impactor. Raman spectrum of the total exhaust (total) is derived from samples collected by the thermophoretic particle sampler (TPS).
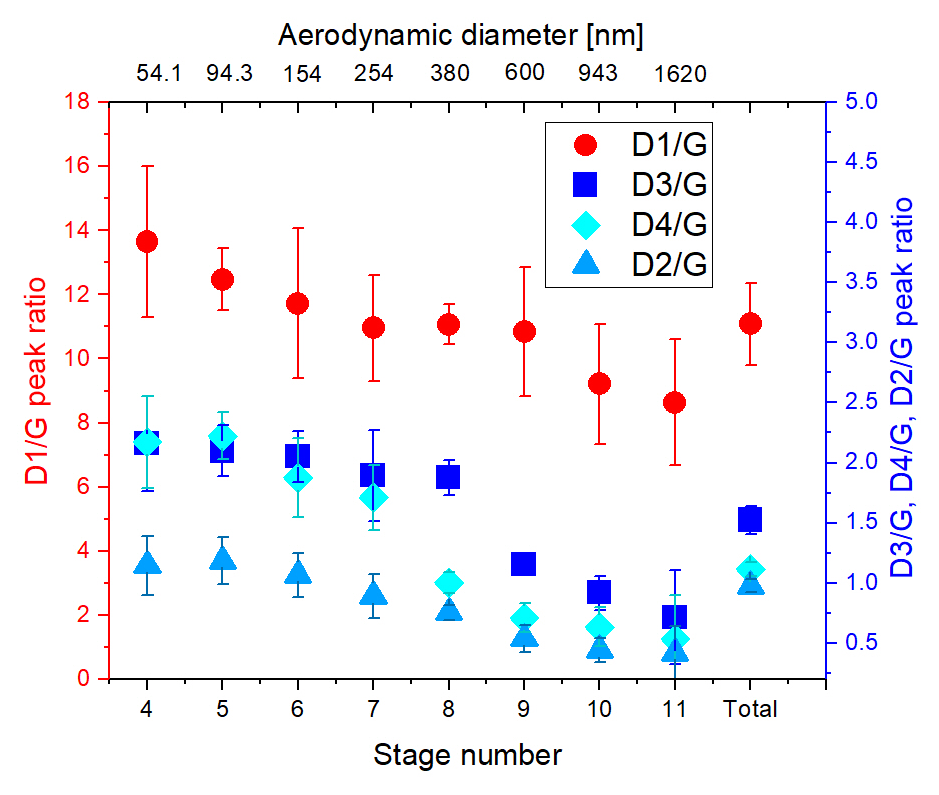
Figure 8Raman peaks ratios of soot segregated by an ELPI+ impactor are shown. Raman peaks ratios of soot produced for ethylene flow 0.13 L min−1 collected on titanium grids on the stages 3 to 11. The Raman band ratios of the total exhaust (total) are reported as well.
Figure 8 shows D1 ∕ G, D3 ∕ G, D2 ∕ G, and D4 ∕ G band ratios based on the areas of the fitted bands; these are generally consistent with the values reported in previous literature references (Patel et al., 2012; Sadezky et al., 2005; Saffaripour et al., 2017). Figure 8 suggests that the D3 ∕ G and D1 ∕ G band ratios decrease with particle size. Other band ratios, such as D2 ∕ G and D4 ∕ G, moderately decrease. A straightforward interpretation of this is that the amorphous carbon content of the soot is smaller for larger particles. This confirms the expectation from Dastanpour (2016) that the larger particles would be more graphitic. Samples were collected for other conditions but are not included here because the burner warmup time was not consistent. However, those samples also show, qualitatively, a similar trend between the Raman band ratios and the particle size (Supplement, Fig. S5). Furthermore, one series of experiments was conducted using compressed building air for the burner supply. Samples from these experiments did not show the same trends with stage number (Supplement Tables S4 and S5), but when the aerosol was run through a thermodenuder the expected falling trend of D1 ∕ G with stage was recovered (Tables S6 and S7). Apparently, contamination in the supply air produced a coating on the particles that affected the Raman spectra. In all cases, the ratios for the unsegregated samples (from TPS, labeled “total”) are close to the average for all stages – as expected.
The ratios shown in Fig. 8 are derived from peak fitting to the average of three Raman spectra. The smoothed average of these three spectra are fitted to the five bands in Origin Pro, using the standard deviation of the triplicates as the weighting in the Levenberg–Marquardt (L–M) algorithm. The error bars for the ratios (typically lower than 20 %) in Fig. 7 are derived from error propagation of the fit uncertainties in the peak areas reported by Origin Pro. These fit uncertainties are the standard errors produced through the L–M algorithm. Actually, the repeatability of the procedure is better than indicated by the error bars. For example, when four samples were reanalyzed after about 5 months and refitted, the D1 ∕ G ratio increased by a mean of 2.6 %.
Raman spectroscopy and TEM analysis were performed on samples of soot classified by aerodynamic diameter. The primary particle diameter increases for larger projected-area diameters; the relationship is in approximate agreement with a correlation developed recently for multiple soot sources (Olfert and Rogak, 2019). The challenge in validating this relationship quantitatively using the impactor sampling is that there are potential artifacts due to overloaded samples and possible fragmentation. However, it is clear that the upper stages (larger aerodynamic diameter) contained aggregates with much larger primary particles. Therefore, the relationship between the soot aggregates aerodynamic diameter and the primary particle diameter can be considered validated.
Raman spectra showed a consistent variation from the bottom (small aerodynamic diameter) to top (large aerodynamic diameter) stages. The spectra for the total (unclassified) soot samples are similar to the spectra for the middle stages, which makes sense given that the middle stages collect most of the aerosol mass. Fitting the Raman spectra to a five-band model results in decreasing D1 ∕ G, D2 ∕ G, D3 ∕ G, and D4 ∕ G ratios with size. This implies that the larger particles contain larger graphitic domains and are more ordered. The most plausible explanation for this shift in the Raman spectra is the associated shift in primary particle size for each stage rather than the changing aggregate size per se.
This work provides evidence that both soot primary particle size and nanostructure depend on the aggregate size. This suggests that samples collected post-flame still carry information about local formation conditions in the flame. It also means that conventional approaches to modelling fractal aggregates are incorrect in assuming that size and soot material properties are independent.
The data are available under the title “AMT_12,1–8, 2019” and accessible using the following link: https://doi.org/10.6084/m9.figshare.9241775.v1 (Baldelli, 2019).
Supplemental material includes additional results on the soot sampling and the repeatability of the experiments. The supplemental material is uploaded in the following link. The supplement related to this article is available online at: https://doi.org/10.5194/amt-12-4339-2019-supplement.
The experiments were conducted by the main author, AB, and supervised by the second author, SNR. The manuscript was written by the first author, AB, and reviewed by the second author, SNR.
The authors declare that they have no conflict of interest.
This paper was edited by Hartmut Herrmann and reviewed by two anonymous referees.
Alfè, M., Apicella, B., Barbella, R., Rouzaud, J. N., Tregrossi, A., and Ciajolo, A.: Structure–property relationship in nanostructures of young and mature soot in premixed flames, P. Combust. Inst., 32, 697–704, 2009.
Baldelli, A.: AMT_12,1-8, https://figshare.com/articles/AMT_12_1, 2019.
Baldelli, A., Trivanovic, U., and Rogak, S. N.: Electron tomography of soot for validation of 2D image processing and observation of new structural features, Aerosol Sci. Technol., 53, 575–582, 2019.
Calabrese, G., Pettersen, S. V., Pfüller, C., Ramsteiner, M., Grepstad, J., Brandt, O., Geelhaar, L., and Fernández-Garrido, S.: Effect of surface roughness, chemical composition, and native oxide crystallinity on the orientation of self-assembled GaN nanowires on Ti foils, Nanotechnology, 28, 425602, https://doi.org/10.1088/1361-6528/aa84a1, 2017.
Dastanpour, R.: Characterization of primary particle size variation and its influence on measurable properties of aerosol soot, University of British Columbia, PhD thesis, Vancouver, 2016.
Dastanpour, R. and Rogak, S. N.: Observations of a correlation between primary particle and aggregate size for soot particles, Aerosol Sci. Technol., 48, 1043–1049, 2014.
Ess, M. N. and Vasilatou, K.: Characterization of a new miniCAST with diffusion flame and premixed flame options: Generation of particles with high EC content in the size range 30 nm to 200 nm, Aerosol Sci. Technol., 53, 29–44, 2019.
Ess, M. N., Ferry, D., Kireeva, E. D., Niessner, R., Ouf, F. X., and Ivleva, N. P.: In situ Raman microspectroscopic analysis of soot samples with different organic carbon content: Structural changes during heating, Carbon, 105, 572–585, 2016.
Frenklach, M.: Reaction mechanism of soot formation in flames, Phys. Chem. Chem. Phys., 4, 2028–2037, 2002.
Ghazi, R., Tjong, H., Soewono, A., Rogak, S. N., and Olfert, J. S.: Mass, mobility, volatility, and morphology of soot particles generated by a McKenna and inverted burner, Aerosol Sci. Technol., 47, 395–405, 2013.
Grafen, M., Nalpantidis, K., Platte, F., Monz, C., and Ostendorf, A.: Multivariate characterization of a continuous soot monitoring system based on Raman spectroscopy, Aerosol Sci. Technol., 49, 997–1008, 2015.
Haller, T., Rentenberger, C., Meyer, J. C., Felgitsch, L., Grothe, H., and Hitzenberger, R.: Structural changes of CAST soot during a thermal-optical measurement protocol, Aerosol Meas. Tech., 12, 3503–3519, 2019
Jaramillo, I. C., Gaddam, C. K., Vander Wal, R. L., Huang, C.-H., Levinthal, J. D., and Lighty, J. S.: Soot oxidation kinetics under pressurized conditions, Combust. Flame, 161, 2951–2965, 2014.
Kazemimanesh, M., Moallemi, A., Thomson, K., Smallwood, G., Lobo, P., and Olfert, J. S.: A novel miniature inverted-flame burner for the generation of soot nanoparticles, Aerosol Sci. Technol., 53, 184–195, 2019.
Kim, B., Lee, J. S., Choi, B.-S., Park, S.-Y., Yoon, J.-H., and Kim, H.: Ultrafine particle characteristics in a rubber manufacturing factory, Ann. Occup. Hyg., 57, 728–739, 2013.
Lapuerta, M., Oliva, F., Agudelo, J. R., and Stitt, J. P.: Optimization of Raman spectroscopy parameters for characterizing soot from different diesel fuels, Combust. Sci. Technol., 183, 1203–1220, 2011.
Lapuerta, M., Oliva, F., Agudelo, J. R., and Boehman, A. L.: Effect of fuel on the soot nanostructure and consequences on loading and regeneration of diesel particulate filters, Combust. Flame, 159, 844–853, 2012.
Liati, A., Schreiber, D., Dasilva, Y. A. R., and Eggenschwiler, P. D.: Ultrafine particle emissions from modern Gasoline and Diesel vehicles: An electron microscopic perspective, Environ. Pollut., 239, 661–669, 2018.
Maricq, M. M. and Xu, N.: The effective density and fractal dimension of soot particles from premixed flames and motor vehicle exhaust, J. Aerosol Sci., 35, 1251–1274, 2004.
Olfert J., and Rogak S. N.: Universal relations between soot effective density and primary particle size for common combustion sources, Aerosol Sci. Tech., 53.5, 485–492, 2019.
Patel, M., Ricardo, C. L. A., Scardi, P., and Aswath, P. B.: Morphology, structure and chemistry of extracted diesel soot – Part I: Transmission electron microscopy, Raman spectroscopy, X-ray photoelectron spectroscopy and synchrotron X-ray diffraction study, Tribol. Int., 52, 29–39, 2012.
Pöschl, U.: Atmospheric aerosols: composition, transformation, climate and health effects, Angewandte Chemie International Edition, 44, 7520–7540, 2005.
Sadezky, A., Muckenhuber, H., Grothe, H., Niessner, R., and Pöschl, U.: Raman microspectroscopy of soot and related carbonaceous materials: spectral analysis and structural information, Carbon, 43, 1731–1742, 2005.
Saffaripour, M., Tay, L. L., Thomson, K. A., Smallwood, G. J., Brem, B. T., Durdina, L., and Johnson, M.: Raman spectroscopy and TEM characterization of solid particulate matter emitted from soot generators and aircraft turbine engines, Aerosol Sci. Technol., 51, 518–531, 2017.
Seong, H. J. and Boehman, A. L.: Evaluation of Raman parameters using visible Raman microscopy for soot oxidative reactivity, Energy Fuels, 27, 1613–1624, 2013.
Stipe, C. B., Higgins, B. S., Lucas, D., Koshland, C. P., and Sawyer, R. F.: Inverted co-flow diffusion flame for producing soot, Rev. Sci. Instrum., 76, 023908, https://doi.org/10.1063/1.1851492, 2005.
Vander Wal, R. L., Bryg, V. M., and Hays, M. D.: Fingerprinting soot (towards source identification): Physical structure and chemical composition, J. Aerosol Sci., 41, 108–117, 2010.
Wang, C., Chan, Q. N., Zhang, R., Kook, S., Hawkes, E. R., Yeoh, G. H., and Medwell, P. R.: Automated determination of size and morphology information from soot transmission electron microscope (TEM)-generated images, J. Nanopart. Res., 18, 127, https://doi.org/10.1007/s11051-016-3434-x, 2016.
Wernet, R., Nazarenus, D., and Seipenbusch, M.: Investigations on the correlations of fragmentation, penetration and charge transfer of Pt and SiO2 particles due to inertial impaction on TEM grids, Cu and Si wafer targets, J. Aerosol Sci., 110, 1–10, 2017
Yehliu, K., Vander Wal, R. L., and Boehman, A. L.: A comparison of soot nanostructure obtained using two high resolution transmission electron microscopy image analysis algorithms, Carbon, 49, 4256–4268, 2011.