the Creative Commons Attribution 4.0 License.
the Creative Commons Attribution 4.0 License.
 | 12 Aug 2019
A study of the morphology and effective density of externally mixed black carbon aerosols in ambient air using a size-resolved single-particle soot photometer (SP2)
Yunjie Xia
Rujin Huang
Zhaoze Deng
Ping Tian
Xiangao Xia
The morphology and effective density of externally mixed black carbon (extBC) aerosols, important factors affecting the radiative forcing of black carbon, were studied using a tandem technique coupling a differential mobility analyzer (DMA) with a single-particle soot photometer (SP2). The study extended the mass–mobility relationship to large extBC particles with a mobility diameter (dmob) larger than 350 nm, a size range seldom included in previous tandem measurements of BC aggregates in the atmosphere. The experiment was conducted at an urban site in Beijing during a 19 d winter period from 23 January to 10 February 2018. Ambient dry particles were selected by the DMA, and the size-resolved extBC particles were distinguished from particles with a thick coating (internally mixed) according to the time delay between the incandescence signal peak and the scattering peak detected by the SP2. The masses of the extBC particles were then quantified. The time differences between the DMA size selection and the SP2 measurement were processed previously. The normalized number size distributions were investigated at the prescribed dmob sizes in the range of 140–750 nm to provide the typical mass of extBC at each dmob. On this basis, the mass–mobility relationship of the ambient extBC was established, inferring a mass–mobility scaling exponent (Dfm) (an important quantity for characterizing the morphology of fractal-like BC aggregates) with a value of 2.34±0.03 in the mobility range investigated in this study. This value is comparable with those of diesel exhaust particles, implying a predominant contribution of vehicle emissions to the ambient extBC in urban Beijing. Compared to the clean period, a higher Dfm value was observed in the polluted episode, indicating a more compact BC aggregate structure than that in the clean period. The effective densities (ρeff) of the extBC in the same dmob range were also derived, with values gradually decreasing from 0.46 g cm−3 at 140 nm mobility to 0.14 g cm−3 at 750 nm mobility. The ρeff values were slightly lower than those measured using the DMA–aerosol particle mass analyzer (APM) system. The difference in ρeff values was likely due to the lower BC masses determined by the SP2 compared to those measured by the APM at the same mobility, since the SP2 measured the refractory BC (rBC) mass instead of the total mass of the BC aggregate, which consists of both rBC and a possible fraction of nonrefractory components measured by the APM. The ρeff values in the 280–350 nm dmob range were much closer to the values for soot aggregates reported in the literature. It might be related to the more compact structure of BC aggregates in this range, resulting from the reconstruction effect by volatile and/or semivolatile components in the atmosphere. The reconstruction effect might also result in a hiatus in the increased dynamic shape factor in the range of 200–350 nm, which presented an overall increase from 2.16 to 2.93 in the 140–750 nm dmob range.
- Article
(1450 KB) - Full-text XML
-
Supplement
(1625 KB) - BibTeX
- EndNote


Black carbon (BC), a by-product of incomplete combustion, is the main light-absorbing component in atmospheric aerosols. BC can lead to positive radiative forcing second only to CO2 in magnitude and thus warming of the earth's atmosphere (IPCC, 2013). However, there remains a large amount of uncertainty regarding the radiative forcing induced by BC due to its complexity and variability in morphology, mixing state and hygroscopicity. Freshly emitted BC particles usually exhibit fractal-like aggregates composed of a number of primary carbon spherules (Park et al., 2004; Sorensen, 2011), which are generally hydrophobic. The condensation of organic and/or inorganic components leads to the collapse of fractal-like aggregates and, in turn, a compact structure of BC particles (Slowik et al., 2007; Zhang et al., 2008). Changes in the morphology of BC particles affect their optical properties. Encasement by organic and/or inorganic coatings also increases the absorption of BC particles through the lensing effect (Shiraiwa et al., 2010; Peng et al., 2016). In addition, water-soluble coatings increase the hydrophilic ability of BC particles (Zhang et al., 2008; McMeeking et al., 2011), indirectly affecting radiative forcing by affecting cloud processes.
Laboratory studies indicate that freshly emitted BC particles can become thickly coated within a few hours in the atmosphere (Pagels et al., 2009; Peng et al., 2016). Thus, many studies have focused on the optical properties and radiative forcing of thickly coated BC particles (Jacobson, 2001; Khalizov et al., 2009; Liu et al., 2017). However, in situ measurements have shown that a great number of uncoated and/or thinly coated BC particles exist in the ambient atmosphere, with a fraction even higher than that of aged BC particles (Schwarz et al., 2008). In general, thickly coated BC particles account for < 50 % of the BC-containing particles in urban areas based on single-particle soot photometer (SP2) measurements (Huang et al., 2012; Wang et al., 2014; Wu et al., 2016). The existence of a large fraction of uncoated and/or thinly coated BC particles is likely due to continuous emission from combustion processes such as vehicle exhaust (Wang et al., 2017). Therefore, studies on the radiative forcing of BC particles without thick coatings are also essential, especially in urban areas. First, the morphologies and sizes of these quasi-bare BC particles, which are the essential quantities for calculating the optical properties of BC particles in numerical models, should be investigated (Scarnato et al., 2013; Bi et al., 2013).
The morphology of fractal-like BC aggregates is generally characterized by a quantity called the fractal dimension (Df), which has been well documented in the review literature (Sorensen, 2011). The ideal diffusion-limited cluster aggregation (DLCA), to which BC aggregates belong, has a Df value of 1.78±0.1. Recent studies have also reported a similar Df value of ∼1.82 for bare soot particles using transmission electron microscopy (TEM) analysis of aerosol samples collected in four different environments (Wang et al., 2017). A significant increase in the Df was observed when the soot particles were partly coated or embedded. In the past 2 decades, the morphologies of BC aggregates have also been widely studied using tandem mobility techniques (Park et al., 2008). Measurements obtained using an impactor (e.g., an electrical low-pressure impactor, ELPI) or a particle mass analyzer (e.g., an aerosol particle mass analyzer, APM, or a centrifugal particle mass analyzer, CPMA) connected in tandem with a differential mobility analyzer (DMA) have revealed the relationship between particle mass and mobility (Park et al., 2003; Maricq and Xu, 2004; Olfert et al., 2007; Rissler et al., 2014; Sorensen, 2011; and associated references therein). The derived mass–mobility scaling exponents (Dfm), which have also been called fractal dimensions in some of these references, varied over a wide range of 2.2–2.8 for diesel exhaust particles. These values were inherently higher than the virtual Df, which is defined as the scaling exponents between the radius of gyration of an aggregate and the radius of primary spherules composing the aggregate, due to the improper interpretation of mobility measurements, as demonstrated in detail in Sorensen (2011). The Df of diesel particles obtained using TEM is ∼1.75, corresponding to a large Dfm value of ∼2.35 based on the mass–mobility relationship (Park et al., 2004). The mobility size-dependent effective densities (ρeff) of BC aggregates were also determined from the DMA–ELPI or DMA–APM (or CPMA) measurements, which were difficult to characterize using TEM techniques.
The previous tandem measurements generally provided the mass–mobility relationship of particles with a mobility diameter (dmob) not exceeding 350 nm due to the system detection limit (Park et al., 2003; Maricq and Xu, 2004; Olfert et al., 2007; Rissler et al., 2014). A condensation particle counter (CPC) is connected next to the DMA–APM system to measure the number concentrations of mobility size-selected particles at various APM voltages. The voltage is proportional to the particle mass, and the voltage resulting in the maximum concentration is in turn considered the typical voltage of the mass of particles with a prescribed mobility size. Because large particles (e.g., dmob > 350 nm) are less abundant in the atmosphere than smaller particles, larger uncertainties exist in the DMA–APM–CPC measurements for the larger particles (Geller et al., 2006). Hence, the extrapolation of the mass–mobility relationship established on the basis of tandem measurements of small mobility diameters (e.g., dmob < 350 nm) to large particles (e.g., dmob > 350 nm) is insufficient.
The SP2 was developed on the basis of the laser-induced incandescence technique and provides advantages in the study of individual BC particle properties, including mass, size and mixing state. The SP2 determines the refractory BC (rBC) mass from particle to particle, thus providing the masses of BC aggregates throughout a wide size range (70–500 nm mass-equivalent diameter according to the manufacturer) with high sensitivity and accuracy (Schwarz et al., 2006). Recently, a tandem system consisting of an SP2 connected to a DMA was developed to study the properties of size-resolved BC aerosols in the atmosphere. The mass distributions and mixing states of the size-selected BC were investigated in northern India using a DMA–SP2 tandem system (Raatikainen et al., 2017). Coupling an SP2 with a volatility tandem DMA (VTDMA), the rBC core size distributions of internally mixed BC and those measured by the VTDMA were compared at the prescribed mobility size ranges. Subsequently, the morphology and effective density of the internally mixed BC particles were studied (Zhang et al., 2016). The hygroscopic properties of BC particles were studied using a hygroscopicity tandem DMA (HTDMA)–SP2 coupling system (McMeeking et al., 2011; Liu et al., 2013). Few studies have been performed on the morphology and effective density of fractal-like BC aggregates that are not coated with other components, especially those in the ambient atmosphere, using DMA–SP2 measurements.
Using the DMA–SP2/CPC system, Gysel et al. (2012) revealed that the SP2 was unable to reliably detect BC particles from a PALAS spark discharge soot generator due to the lower detection limit of the SP2 for loosely packed agglomerates made up of small primary spherules (∼5–10 nm in diameter). However, they also claimed that a well-aligned SP2 was expected to have a detection efficiency adequate to measure BC aggregates (e.g., diesel exhaust soot) in the atmosphere because these BC aggregates have larger primary spherules and substantially higher effective densities than the agglomerates made up of small primary spherules. Therefore, in this study, a DMA–SP2 tandem system was built to examine the mass–mobility relationship (from which the morphology and effective density were further derived) of uncoated BC aggregates, especially in the large particle size range (e.g., dmob > 350 nm), which has seldom been included in previous tandem measurements. Moreover, the uncoated BC aggregates were distinguished from the thickly coated BC particles using SP2, thus allowing the study of the mass–mobility relationship of ambient BC aggregates in different atmospheric environments. Previous DMA–ELPI or APM tandem measurements were mainly conducted in the laboratory or in the source environments (e.g., in a tunnel) where fresh BC aggregates were predominant.
Beijing, the capital of China, has suffered from severe air pollution issues in recent years. Studies have revealed that emissions from coal combustion and/or biomass burning for industry activities and residential heating have played a predominant role in particulate pollution in Beijing, especially during the polluted episodes (Zhang et al., 2013; Huang et al., 2014; Wu et al., 2017; Ma et al., 2017a, b). Thus, the variation in the mass–mobility relationship of uncoated BC aggregates was also compared for a polluted episode and a clean episode to examine the possible influence of a source change on the morphology of these BC aggregates. In addition, a better mobility size resolution (33 logarithmic size bins from 20 to 750 nm) was set for our DMA-SP2 system than was used in previous similar studies, in which only a few mobility diameters in the range of ∼150–350 nm were selected (Zhang et al., 2016; Liu et al., 2013; McMeeking et al., 2011). Similar to the study presented by Raatikainen et al. (2017), the high size resolution is advantageous for calculating the BC mass and number size distribution in the polluted region in our future studies.
2.1 Experimental setup
A tandem system comprising a size selection unit and a measurement section was built and deployed in an ambient experiment that was conducted on the roof of a building (approximately 8 m above the ground) on the campus of the Institute of Atmospheric Physics, Chinese Academy of Sciences (IAP, CAS) during the winter from 23 January to 10 February 2018 (19 d in total). Located in an urban area of Beijing, the site is a few hundred meters from two main roads and thus may be significantly affected by vehicle emissions. More information on the measurement site is described in previous studies (e.g., Wu et al., 2016, 2017).
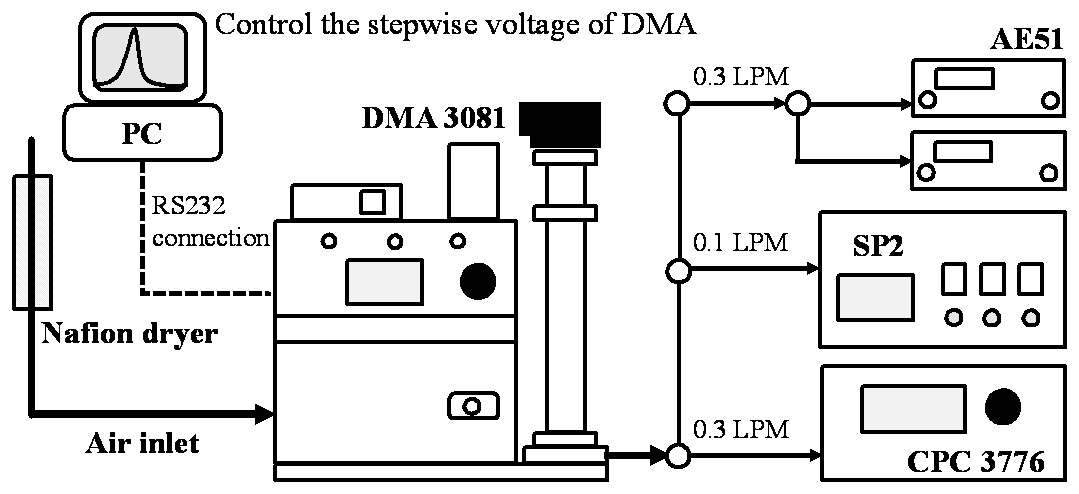
As shown in Fig. 1, polydisperse aerosols in the sample air were drawn through the size selection unit (a model 3087 neutralizer, a model 3080 classifier and a model 3081 DMA, TSI Inc., Shoreview, MN, USA) to generate quasi-monodisperse particles with a certain electrical dmob. Before entering the system, the ambient air was dried by passing through a 30 cm Nafion dryer (model MD-700-12F-3, Perma Pure LLC, Toms River, NJ, USA). A vacuum pump was used to draw the dry sheath air (e.g., particle-free indoor air) opposite to the flow direction of the sample air to provide the appropriate vacuum degree required for the dryer. The size-selected particles were delivered to the measurement section for analysis by various methods, including an SP2 (Droplet Measurement Technologies, Boulder, CO, USA), a CPC (model 3776, TSI Inc., Shoreview, MN, USA) and two microaethalometers (model AE51, AethLabs, San Francisco, CA, USA). The operational flow rates were set to 0.1, 0.3 and 0.15 L min−1 (STP) for the SP2, CPC and two AE51s, respectively. The sheath flow rate was set to 3 L min−1, resulting in a ratio of sheath-to-sample flow rate of 4.3:1 for the DMA. Particles in the range of 15–750 nm in mobility diameter could be selected. The flow rate for each instrument was calibrated using a soap film flowmeter (model Gilian Gilibrator-2, Sensidyne, Petersburg, FL, USA) before the experiment to ensure the accuracy of the selected particle sizes and measurements. The scientific purpose of this experimental setup was to study the mixing states of size-selected BC particles, the mass and number size distribution of BC, and the morphology and effective density of the uncoated BC aggregates that are discussed in the current study. Because only the DMA and SP2 were involved in the measurements presented in this study, the setting and operation of the two instruments are described and discussed in detail.
2.2 Particle size selection
The DMA was connected to an external computer on which a program was run to control the voltage of the DMA, i.e., the particle mobility diameter (dmob). A total of 33 dmob values were set in the program to cyclically control the particles selected by the DMA and gradually increase from 20 to 750 nm on the logarithmic scale. Stepwise size selection was repeated until the operator stopped the program. A short cycle lasting for 18 s for each of the 33 diameters and a long cycle lasting for 36 s for each size were set to alternately operate in this experiment (Fig. S1 in the Supplement). The purpose of these settings was to identify the time difference between the size selection and the subsequent measurement, as described in the following sections.
2.3 Black carbon measurement
The individual particulate rBC mass was measured by the SP2 according to the laser-induced incandescence signal when the particle passed through the intense Nd:YAG intracavity continuous laser beam (Schwardz et al., 2006) with a Gaussian distribution. The rBC mass in the SP2 detection range (∼0.3–250 fg in this study, dependent on the laser intensity of a specific instrument) is proportional to the peak of the incandescence signal independent of the mixing state of the BC particles. If a BC particle is coated with nonrefractory components, the coating will evaporate before the rBC core incandesces, leading to a time lag between the peaks of incandescence and scattering signals that are synchronously detected by the SP2 (Moteki and Kondo, 2007). According to the frequency distribution of the time lag, there was a significant distinction between thickly coated (i.e., internally mixed) BC particles (intBC) and thinly coated or uncoated (i.e., externally mixed) BC particles (extBC) (Fig. S2) with a minimum frequency at ∼2 µs. BC-containing particles with delay times shorter than 2 µs were identified as extBC. The delay time threshold might vary slightly from one SP2 to another; for example, Zhang et al. (2016) reported a short time lag of 1.6 µs. However, the delay time threshold should be constant for a given instrument. In previous measurements using the same SP2 employed in this study, the critical delay time was maintained at 2 µs regardless of the ambient conditions, such as the pollution level (Wu et al., 2016, 2017). A fraction of BC-containing particles with thin or even moderate coatings might also be recognized as extBC using the time delay approach (Laborde et al., 2012). The effects of these thinly or even moderately coated BC particles are discussed in Sect. 3.2 by reducing the delay time threshold from 2 to 1.2 and 0.4 µs, respectively.
The scattering signal of a single particle synchronously detected by the SP2 can be used to estimate the optical size of the particle. The mixing state of a BC-containing particle can be deduced by comparing the optical size of the particle and the mass-equivalent size of the rBC core. Because the nonrefractory coating of a BC-containing particle is evaporated due to the light absorption and heating of the rBC core when it passes through the laser beam, the scattering cross section of this particle, which is proportional to the scattering intensity at a given incident light intensity, is gradually decreased. To estimate the initial optical size of this particle, an approach called leading-edge-only (LEO) fitting was developed (Gao et al., 2007). A small fraction of the measured scattering signal in the initial stage before the particle is perturbed by the laser is employed in the LEO fitting to reconstruct the expected scattering distribution of the initial particle. In this method, the location of the leading edge in the beam is also required, which is determined from a two-element avalanche photodiode (APD) signal. Unfortunately, the notch in the two-element APD of our SP2 failed to fix in an adequate position (e.g., before the peak location of the laser beam) in this experiment. Thus, the optical size and the consequent coating thickness of the BC-containing particle cannot be estimated. However, the coating thickness is not a crucial quantity in our current study on the morphology and density of uncoated BC aggregates. The coating thickness can provide a validation of our discrimination of extBC but should have little influence on our final analysis and the discussion presented in the following sections.
Before the experiment, the incandescence signal was calibrated using DMA-selected monodisperse Aquadag particles. The effective densities of the mobility size-selected Aquadag particles were determined based on the polynomial equation as a function of the dmob reported in Gysel et al. (2011). The incandescence signal is more sensitive to the Aquadag particles than to ambient BC particles because the Aquadag particle induces a higher incandescence signal peak (by a factor of ∼25 %) than fullerene soot or an ambient BC particle with the same mass (Laborde et al., 2012). Thus, the peak intensity of the incandescence signal was reduced by a factor of 25 % when calculating the calibration coefficient. The calculated calibration factor, determined as the slope of the linear regression of rBC masses against the scaled peak heights of SP2's broadband incandescence signal, is consistent with the factor estimated using a single-point scaling procedure (Baumgardner et al., 2012). The same calibration was performed again after the experiment. The calibration factors varied little (< 3 %), indicating the stability of the SP2 measurement during the entire experiment (Fig. S3). The uncertainty in the individual rBC mass determination is estimated to be ∼10 % due to the uncertainties in the rBC mass calibration and the effective density of the calibration material. An additional uncertainty may also arise in the determination of extBC masses when the time delay approach is used to distinguish the mixing state of BC particles. The uncertainty will be further discussed in Sect. 3.2.
3.1 Identifying the time difference between the size selection and the SP2 measurement
There exists a considerable difference between the time recorded by the size selection program and that recorded by the SP2, due to the time cost of the particles transmitting from the DMA to the SP2, as well as the system clock difference between the computer on which the size selection program runs and that for the SP2 data acquisition. As shown in Fig. S1, the SP2 measurement occurs significantly later than the size selection.
We have developed two methods to identify the time difference. The first method involves finding the time difference between the local peak in the particle number concentration (including both scattering and incandescence) detected by the SP2 and the beginning of the corresponding size selection cycle. During the experiment, stepwise size selection was cyclically performed to produce quasi-monodisperse particles with sizes gradually increasing from 20 to 750 nm. Thus, at the beginning of each new cycle, the voltage of the DMA should first drop drastically from a high value to a low one to make the particle size decrease from 750 to 20 nm. As a result, some particles with sizes in an efficiently detectable range of the SP2 (∼100–500 nm) are measured during the descent period, producing a local peak in the number concentration. Because it takes only a few seconds for the descent, identifying the occurrence time of the local peak position based on the SP2 clock and the beginning time of the size selection based on the external computer clock provides the time difference for each cycle.
The other method involves checking the consistency of the number and/or mass size distributions between the short-duration cycle and long-duration cycle. Although the durations of each size in the short cycle and long cycle are different (18 s vs. 36 s), the time difference between the size selection and the measurement should be uniform for adjacent short and long cycles. Setting an initial time difference and calculating the mean number and/or mass concentration of each particle size, the number and/or mass size distributions are obtained. Then, the correlation coefficients between the size distributions during short and long cycles are calculated. Changing the time difference gradually, we can obtain a set of correlation coefficients as functions of the time differences. The time difference resulting in the maximum correlation coefficient is considered the difference between the size selection and the measurement.
Since the detection efficiency of the SP2 decreases dramatically in the small particle range (Fig. S4), the size distributions of the SP2-detected particles are inadequate for further calculation of the correlation coefficients. Therefore, the former method was employed in the current study to identify the time difference between the size selection and the SP2 measurement. The latter method will be used to examine the time difference between the size selection and the AE51 and CPC measurements in our future study on the number and mass size distributions of BC.
3.2 Determination of the typical masses of extBC at prescribed mobility sizes
Particles in a certain size range are selected by the DMA instead of absolutely monodisperse particles in a given mobility size due to the effect of the transfer function. In addition, larger particles with multiple charges are also selected. The frequency and number size distributions of extBC as a function of the mass-equivalent diameter of rBC (dme) at different mobility sizes are presented in Figs. S5 and S6, respectively. Note that the number size distribution has been normalized by the peak value of the corresponding distribution. Since the frequency and number size distributions of extBC are quite insufficient at small particle sizes (dme < 70 nm) due to the low detection efficiency of the SP2 (Fig. S4), only the distributions with a dmob larger than 140 nm are presented. In the following study, we mainly address the morphology and effective density of extBC in the 140–750 nm dmob range. The normalized number size distributions at five representative dmob values (i.e., 140, 225, 350, 500 and 750 nm) are also shown in Fig. 2. The extBC particles with a considerable dme range were observed for a certain dmob, indicating a wide transfer function of the DMA due to the relatively low ratio of sheath-to-sample flow (4.3:1). Multicharged particles also affected the size distribution, especially in the dmob range of 100–400 nm (Ning et al., 2013). As shown in Figs. S6 and 2, a minor peak is obviously observed in the right tail of the major peak at each size distribution for dmob values of < 350 nm.

Figure 2Campaign average number size distribution of the mass-equivalent diameter of the rBC core of extBC normalized by the peak value at five representative mobility diameters (140, 225, 350, 500 and 750 nm) selected by the DMA. Lognormal fitting is performed for the major peak of each distribution.
As mentioned above, a fraction of thinly and/or moderately coated BC particles might also be recognized as extBC according to the time delay between the SP2 incandescence and scattering signal peaks. These particles also have impacts on the size distribution of extBC for a given mobility size. A thinly coated BC particle can be expected to have a larger mass than a bare BC with the same mobility due to the restructuring of the thinly coated BC particle by coating materials. These thinly coated BC particles will increase the size distribution in the right tail when mixed with multicharged particles. It is currently difficult or even impossible to separate the effects of the thinly coated and multicharged particles based on the size distribution of extBC. To examine the possible effect of these thinly coated particles, we tightened the criterion of the delay time for the discrimination of extBC, gradually decreasing from < 2.0 to < 1.2 and < 0.4 µs. As shown in Figs. S5 and S6, a decrease in the delay time threshold results in a significant reduction in the data volume used in the analysis but has few effects on the major peak location of the distribution, which is used as the typical dme of extBC for a given mobility size. The typical dme values, determined as the mode values of the lognormal function that are employed to fit the major peak of the size distribution at a certain mobility size, vary little with the delay time thresholds (Table S1 in the Supplement). The maximum discrepancy in the dme is < 3 % throughout the prescribed mobility size range in this study (140–750 nm). The change caused by the delay time threshold mainly appears in the right tail of the normalized number size distribution. Reducing the delay time threshold to 0.4 µs results in a significant decrease in the fraction of particles with a large dme compared to the 2.0 and 1.2 µs thresholds (Fig. S6). These large particles are likely attributed to thinly and/or even moderately coated BC particles whose structures are relatively more compact than the absolutely bare BC particles. Therefore, we propose that thinly and/or even moderately coated BC and multicharged particles should both have effects on the size distribution of extBC, mainly in its right tail, but have little influence on the typical dme, which is considered the peak dme of the distribution for a given mobility size. The uncertainty in the typical dme due to the time delay approach that was utilized to distinguish the extBC is approximately 3 % at a given dmob, which is in turn ∼10 % of the corresponding mass of extBC. Combining the uncertainty in the rBC mass determined by the SP2 (∼10 %), the total uncertainty in the determined mass of extBC should be ∼20 % in the studied mobility range of 140–700 nm. To achieve an adequate data volume for the analysis, the results and discussion presented in the following sections are based on the database of extBC discriminated as BC-containing particles with delay times of less than 2.0 µs, unless otherwise specified.
3.3 Theoretical calculation of the morphology and effective density
The structure of extBC, agglomerated by primary spherules with diameters of 20–60 nm (Alexander et al., 2008), can be characterized by its mass–mobility relationship, which is approximately expressed as a power-law relationship between the mass of the agglomerate particle (m) and its mobility diameter (dmob), expressed as
where the prefactor k is a constant and Dfm is the mass–mobility scaling exponent, which was sometimes erroneously called the fractal dimension in previous studies (e.g., Park et al., 2003). This quantity corresponds well to the virtual Df and represents the morphology of the BC aggregates (Sorensen, 2011). The Dfm value of a sphere is 3. Thus, the morphology of a particle becomes increasingly closer to that of a sphere as the Dfm increases gradually to 3.
The effective density (ρeff) of the extBC particles is calculated as the ratio of the BC mass (m) measured using the SP2 and the BC volume, which is based on the dmob selected by the DMA, expressed as
Combining Eqs. (1) and (2), ρeff can also be expressed as a function of dmob,
where K is a constant, corresponding to the prefactor k in the mass–mobility relationship.
The dynamic shape factor is also calculated to indicate the morphology of the extBC particles. It is derived from the ratio of the slip-corrected mass-equivalent diameter (dme) and dmob, expressed as
where dme is calculated from the BC mass (m) by assuming the BC particle to be a compact sphere with a density of 1.8 g cm−3 (Taylor et al., 2015), and Cc is the Cunningham slip correction factor parameterized by particle diameter (d)
where λ is the mean free path of the gas molecules, which is set to 65 nm in this study according to Zhang et al. (2016). The values of the three empirical parameters α, β and γ are 1.257, 0.4 and 1.1, respectively (Eq. 9.34 on p. 407 in Seinfeld and Pandis, 2006).
4.1 Mass–mobility relationship of the ambient extBC
A power-law relationship was applied to the dmob-determined extBC mass values, delivering a campaign average mass–mobility scaling exponent (Dfm) of the ambient extBC (Fig. 3). In the dmob range of 140–750 nm, the fitted Dfm is 2.34, with 1 standard deviation of 0.03. The fitted Dfm is close to the lower limit of the Dfm values of diesel exhaust particles presented in the literature, indicating the dominant contribution of diesel exhaust to the extBC in our measurement site in urban Beijing. Depending on the fuel type, engine type and load, the Dfm of diesel exhaust particles measured by the DMA–APM or DMA–ELPI systems ranged between 2.22 and 2.84 (Olfert et al., 2007; Maricq and Xu, 2004; Park et al., 2003, and references therein). The higher Dfm values in the literature are likely attributed to the higher fraction of volatile and/or semivolatile components (e.g., sulfate) in the diesel exhaust (Park et al., 2003; Olfert et al., 2007). The presence of these volatile and/or semivolatile components would result in a more compact structure of the particle, leading to a higher Dfm value for coated particles than for bare BC aggregate. Because the rBC mass instead of the whole particle mass of extBC was measured by the SP2, a relatively low Dfm value was expected and reasonable in this study. In addition, the relatively low Dfm value observed in urban Beijing also likely implies high fuel quality (e.g., low sulfur content) and efficient combustion in vehicle engines, which decrease the organic and/or inorganic fractions in diesel exhaust particles. The Dfm value for the ambient soot agglomerates measured with a DMA–APM system near a diesel-truck-dominated highway was 2.41 (Geller et al., 2006), slightly higher than the value in our study.

Figure 3The mass of extBC particles as a function of the mobility diameter in the range of 140–750 nm (black circles), fitted by a power-law relationship (red line). The power-law functions piecewise fitted in the 140–350 nm mobility range (green line) and in the 350–750 nm mobility range (blue line) are overlaid. The dashed lines represent the uncertainties in the determined extBC masses.
According to Sorensen (2011), the ideal fractal-like DLCA with a virtual Df of approximately 1.78 should have an expected Dfm≈2.2 in the slip flow regime in which the BC aggregates are generally observed. The slightly larger Dfm value of ambient extBC (2.34) in the current study might indicate a more compact structure than the ideal fractal-like DLCA due to the reconstruction effect by other components in the atmosphere. The reconstruction effect appears to be more significant in the smaller particle range than in the larger particle range. The smaller BC particles are more likely to be coated by volatile and/or semivolatile materials, which will be discussed in detail in the next section. We piecewise fitted the mass–mobility relationship using the power-law function in the mobility ranges of 140–350 and 350–750 nm. A Dfm of 2.51±0.04 that was obtained in the smaller mobility range (140–350 nm) was obviously larger than the fitted value in the whole size range (140–750 nm). In contrast, a much lower Dfm with a value of 2.07±0.02 was observed in the larger mobility range (350–750 nm). These results indicate that the ambient extBC particles with larger mobility diameters were likely less influenced by the reconstruction effect than those with smaller mobility diameters.
Table 1The typical mass-equivalent diameters (dme) and corresponding masses of extBC for different mobility sizes (dmob) selected by the DMA in the whole campaign, in a polluted episode and in a clean period. The effective densities (ρeff) and dynamic shape factors (χ) at the dmob selected by the DMA throughout the whole campaign are also presented.

The variation in the morphology of extBC was further examined by comparing the mass–mobility relationship in a polluted episode with that in a subsequent clean period. As shown in Fig. S7, a polluted episode rapidly formed at 14:00 (local time, if not specified) on 26 January and lasted 1.5 d to 00:00 on 28 January 2018. The mean PM2.5 mass concentration was 72.1±23.1 µg m−3 in this polluted episode, 3 times the campaign average value (23.0±26.7 µg m−3). The Dfm value was 2.42±0.09 in the polluted episode, higher than that (2.33±0.06) observed in the subsequent clean period from 01:00 on 28 January to 18:00 on 31 January 2018, during which the average PM2.5 concentration was merely 8.9±2.7 µg m−3 (Fig. S8). The higher Dfm in the polluted episode is mainly due to the increase in the masses of extBC at large mobility sizes (e.g., dmob > 250). As shown in Table 1, the typical masses of extBC in the 280–700 nm dmob range in the polluted episode are ∼7 %–13 % larger than those in the clean period. Although the differences might result from the uncertainty (∼20 %) in the mass determination of extBC, the commonly larger extBC masses (in the 280–700 nm dmob range) to some degree still imply a possibly more compact structure of extBC aggregates in the polluted episode, which might relate to changes in the dominant sources and the ambient environment. Previous studies have revealed that regionally transported pollutants emitted from coal combustion and/or biomass burning played an important or even predominant role in polluted episodes in Beijing (Wu et al., 2017; Ma et al., 2017a). Thus, a considerable fraction of extBC aggregates from these sources is likely to coexist with the local vehicle-emitted BC aggregates in the polluted episode, even though the proportion of extBC in the total BC-containing particles decreased (Fig. S9). These transported BC aggregates originating from coal combustion and/or biomass burning might have a more compact structure than those from vehicle exhaust due to the differences in the combustion environments and efficiencies. In addition, the BC aggregates might also become more compact due to the reconstruction effect by the volatile and/or semivolatile components, which are generally abundant in polluted episodes. Both possible factors are likely to result in the larger Dfm values in the polluted episode.
4.2 Size-resolved effective densities of the ambient extBC
In contrast to the mass of extBC (m), the effective density of the extBC particles (ρeff) showed a significant decreasing trend as the dmob increased from 140 to 750 nm (Fig. 4 and Table 1). The highest ρeff of 0.46 g cm−3 was observed in the 140 nm dmob, likely because the BC aggregates at the smallest size are made up of the fewest primary spherules. When the dmob increased to 750 nm, ρeff decreased to as low as 0.14 g cm−3, approximately one-third of that at 140 nm. The very low ρeff values agree well with the fractal-like nature of the extBC particles.
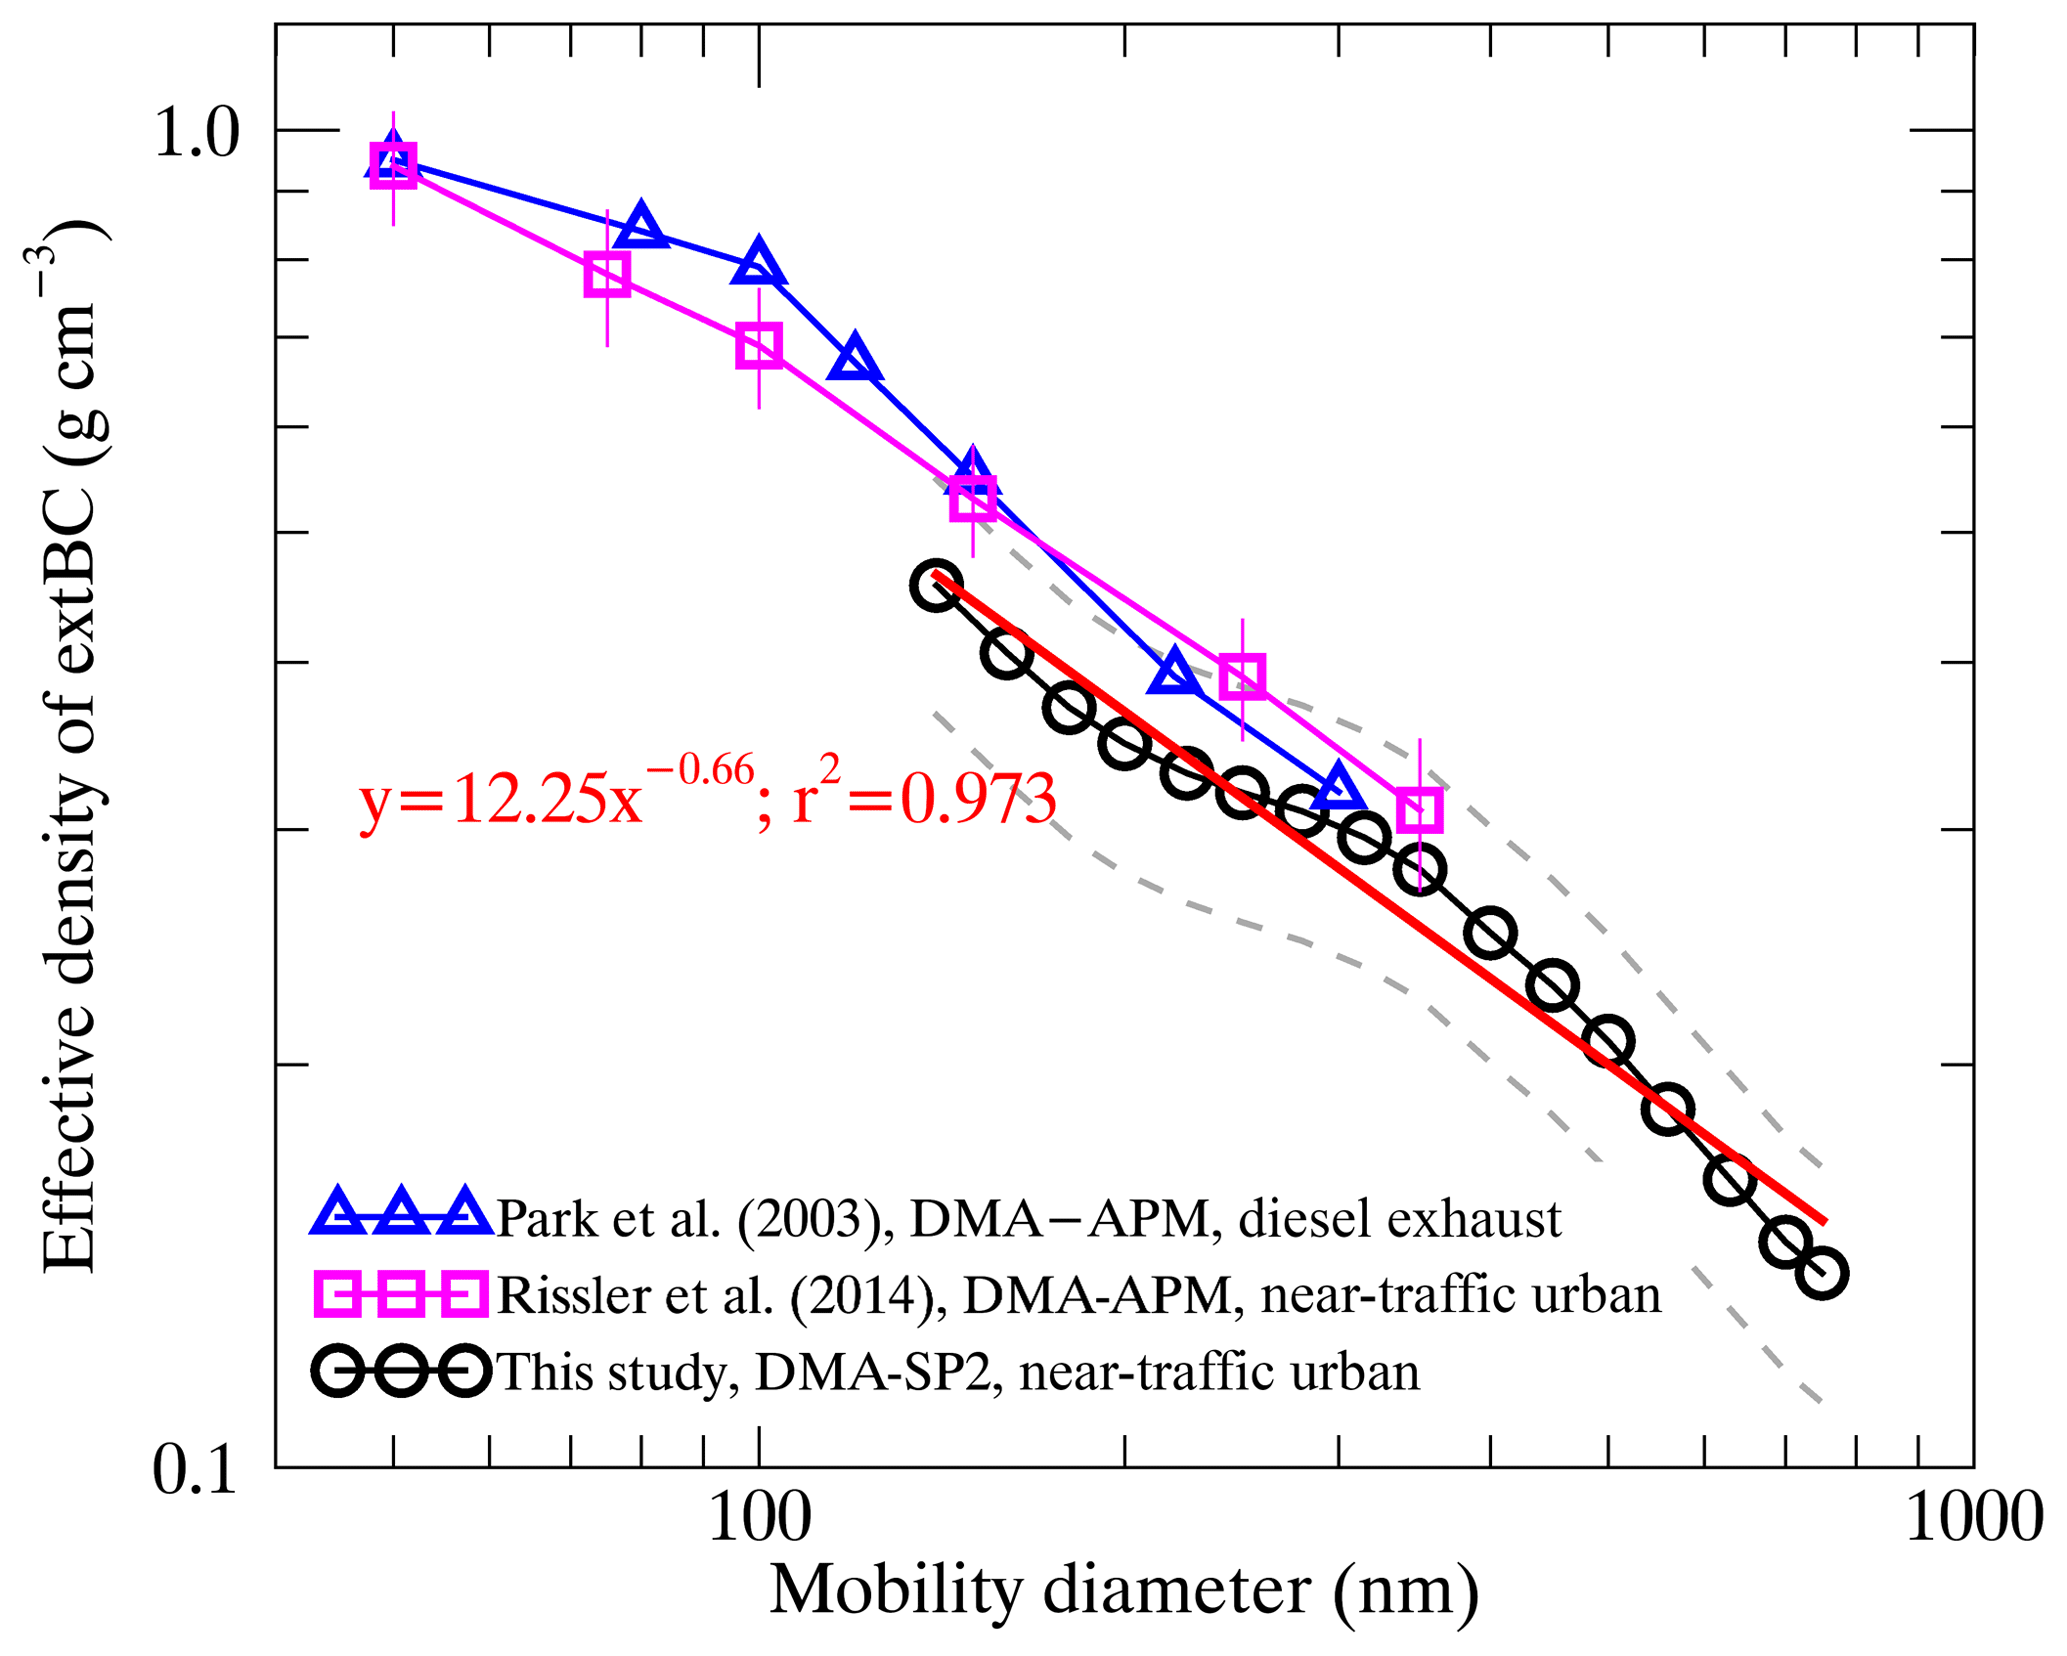
Figure 4The effective density (ρeff) of the extBC particles as a function of the mobility diameter (dmob) (black circles). The red line represents the power-law fitting of ρeff versus dmob. The variations in ρeff with dmob measured for the soot agglomerates from diesel exhaust (Park et al., 2003) and near-traffic urban environments (Rissler et al., 2014) are also presented as blue triangles and red squares, respectively. The dashed lines represent the uncertainties in the determined ρeff.
The ρeff values obtained by the DMA–SP2 measurements are close to those of the lower limits of diesel exhaust particles measured by the DMA–APM (or CPMA) or DMA–ELPI systems. Park et al. (2003) reported a decrease in the ρeff of diesel exhaust particles under a moderate (50 %) engine load from 0.95 to 0.32 g cm−3 as the mobility diameter increased from 50 to 300 nm (Fig. 4). The ρeff values presented in Park et al. (2003) are approximately 1.25, 1.18 and 1.05 times those in our study at ∼150, 220 and 300 nm in mobility diameter, respectively. The differences in ρeff values between our study and the literature are generally within the uncertainty (∼20 %) in the mass determination of extBC at prescribed mobility sizes. However, the commonly lower ρeff values are also likely due to the techniques used to determine the mass of BC aggregates. Some previous studies on the ρeff of diesel exhaust particles using the DMA–APM or DMA–ELPI tandem measurements also showed a slightly larger ρeff throughout the comparable mobility ranges (e.g., ∼150–350 nm) than that measured in this study (Maricq and Xu, 2004; Olfert et al., 2007). The masses of the bare BC particles were determined by the laser-induced incandescence technique of the SP2. In a previous tandem system, the APM (or CPMA) or ELPI was utilized to determine the typical mass of BC aggregates at a given mobility, and the BC aggregates are likely composed of a fraction of volatile and/or semivolatile components in addition to the bare primary particles. These volatile and/or semivolatile components increase the mass of the whole particle, resulting in a larger ρeff value for a certain mobility causing a compact structure of the BC aggregate. For example, Olfert et al. (2007) found that the ρeff of diesel exhaust particles coated with minor sulfate and water contents (∼2 % of the total particle mass) was ∼0.4 g cm−3 at 299 nm, only slightly larger than the value of diesel exhaust particles (0.32 g cm−3) measured in Park et al. (2003) and that of extBC in the urban atmosphere (0.31 g cm−3) in our study at the same mobility size. However, the ρeff value increased significantly to ∼0.71 g cm−3 at a relatively high engine load of 40 % due to the high sulfate levels (∼30 % of the total particle mass) in the diesel exhaust particles (Olfert et al., 2007).
The ρeff values of ambient soot aggregates also showed a similar decreasing trend with increasing dmob based on the DMA–APM system (Geller et al., 2006; Rissler et al., 2014). Rissler et al. (2014) showed a decrease in the average ρeff of BC aggregates from 0.94 to 0.31 g cm−3 in the near-traffic urban environment as the dmob increased from 50 to 350 nm (Fig. 4), similar to that of the freshly emitted diesel exhaust particles presented in Park et al. (2003). However, based on the same method, the ρeff values of the ambient BC aggregates that mostly originated from diesel exhaust (Geller et al., 2006) are substantially different from those presented in Rissler et al. (2014), especially in the large particle size range. The ρeff at ∼350 nm was 0.17 g cm−3 in Geller et al. (2006), approximately half of the value presented in Rissler et al. (2014). The reason for the discrepancy might be related to the large measurement uncertainties of the DMA–APM system for large particles, e.g., with dmob sizes greater than 300 nm, since these large particles are less abundant in the ambient atmosphere (Geller et al., 2006). Compared to the results presented in Rissler et al. (2014), the ρeff values of ambient extBC aggregates in our study are slightly lower, e.g., by ∼17 %, ∼18 % and ∼6 % for dmob values of 150, 250 and 350 nm, respectively. The relatively higher ρeff values are also likely attributed to the effects of volatile and/or semivolatile components in the soot aggregates. Rissler et al. (2014) found that the residual mass fraction of volatile and/or semivolatile materials in the soot aggregates was ∼10 %, even when the sample air was heated to 300 ∘C before entering the system for measurement.
It is interesting to note that the ρeff values appear to be closer to the values presented in the literature using the DMA–APM measurements in the 280–350 nm dmob range (Fig. 4). As shown in Fig. 3, larger typical masses of extBC in this range are also observed beyond the logarithmic scaled linear curve that is fitted to the mass–mobility relationship. The relatively larger masses and ρeff values might imply a more compact structure of extBC aggregates in this range, which likely results from the reconstruction effect by the ambient volatile and/or semivolatile components. As shown in Fig. S9, the size-resolved number fractions of extBC exhibit a minimum in the 280–350 nm dmob range, regardless of whether they are associated with the polluted episode or the clean period. This finding indicates that particles in this mobility range are more likely to be thickly coated by other components than are particles in the smaller or larger mobility ranges. Zhang et al. (2016) also observed an increased coating thickness of the BC-containing particles in the mobility range of 200–350 nm (Table 1 in the literature) using the VTDMA–SP2 measurement at a suburban site ∼70 km away from our observation site, although the variation in the coating thickness in the larger mobility range was not investigated. Notably, the number fraction of extBC at each mobility size presented in Fig. S9 is roughly calculated as the ratio of the extBC number concentration to the sum of extBC and intBC, in which the multiply charged effects were not corrected. Although the extBC particles without coatings and/or with thin coatings are the focus of the current study, the higher fraction of thickly coated BC particles in the 280–350 nm dmob range implies a higher possibility that these extBC particles in the same range were affected by volatile and/or semivolatile materials in the atmosphere, in turn resulting in a more compact structure of these BC aggregates. Further detailed studies of the size distribution of BC (including extBC, intBC and both) and non-BC particles based on the combined measurements of SP2 and CPC are needed in our further work to reveal the potential mechanism for this phenomenon.

Figure 5The dynamic shape factor of the extBC particles as a function of the mobility diameter in the range of 140–750 nm.
Although the ρeff of extBC at small sizes (dmob < 140 nm) cannot be determined due to the lower limit of the DMA–SP2 system, we extended the ρeff of extBC to a large size range (350 < dmob < 750 nm), which was barely investigated in previous studies using tandem measurements. A continuous decrease in ρeff with increasing dmob was observed even in the large size range between 350 and 750 nm (Fig. 4). It is reasonable to infer that the structure of the extBC particles becomes looser when the fractal-like aggregates built up by the primary spherules increase.
4.3 Dynamic shape factors of the ambient extBC
Due to their fractal-like structures, the extBC particles generally have large dynamic shape factors (χ) with values in the range of 2.16 to 2.93 (Table 1), much larger than those of intBC with an average value of ∼1.2 (Zhang et al., 2016). The χ value declined exponentially as a function of coating thickness of BC-containing particles (Zhang et al., 2016). In contrast to the decrease in ρeff, the χ values of extBC generally increase as dmob increases from 140 to 750 nm (Fig. 5). The extBC particles 750 nm in mobility diameter have a mean χ value of 2.93, approximately 1.36 times that for 140 nm dmob particles (Table 1). The larger particles have looser structures, resulting in higher χ values. However, the χ values appear to vary slightly in a narrow range between 2.40 and 2.41 in the size range of 200 to 350 nm (Fig. 5). The hiatus in the gradual increase in χ is also likely related to the more compact structure of extBC particles in the 280–350 nm mobility range, which has been discussed in detail in the previous sections.
The DMA–SP2 system was established to study the morphology and effective density of the ambient extBC particles, especially in the larger mobility size range, i.e., 350 < dmob < 750 nm, which was seldom investigated in previous tandem measurements. Quasi-monodisperse particles in the dmob range of 20–750 nm were stepwise selected using the DMA and then delivered to the SP2 for rBC mass measurement and mixing state discrimination. The time difference between the size selection and the SP2 measurement was previously processed using the local peak approach. The normalized number size distribution of extBC, distinguished as having a delay time between the incandescence signal peak and the scattering peak detected by the SP2 of less than 2 µs, as a function of dme was investigated at each prescribed mobility size in the range of 140–750 nm. The size distributions at smaller mobility sizes were not presented due to the lower limit of the rBC mass determined using the SP2. The peak dme, calculated as the mode value of a lognormal function fitted to the major peak of the size distribution, was determined as the typical dme value at each mobility size. Consequently, the typical mass of extBC at each mobility size was identified. Reducing the time delay threshold employed to discriminate the extBC had few effects on the determined masses of extBC, implying the reliability of our study for extBC particles. The uncertainty in the determined extBC masses was ∼20 %, based on a combination of the uncertainty in the SP2-measured rBC mass and the uncertainty related to the time delay approach. On this basis, the mass–mobility relationship of ambient extBC in urban Beijing was investigated. The campaign-average Dfm value was estimated to be 2.34±0.03 by fitting the derived extBC masses as a power-law function of dmob in the range of 140–750 nm, close to the lower-limit Dfm value of diesel exhaust particles. A relatively larger Df value was observed in the polluted episode than in the clean period (2.42±0.09 vs. 2.33±0.06), implying a more compact structure of BC aggregates in the polluted episode.
A decrease in ρeff with increasing dmob was observed, with the ρeff value decreasing from 0.46 g cm−3 at a dmob value of 140 nm to 0.14 g cm−3 at 700 nm. The ρeff values derived using the DMA–SP2 measurement were slightly lower than those based on the DMA–APM measurement. This difference was most likely due to the bias in the extBC mass determination using the SP2 and APM techniques. The pure rBC mass determined using the SP2 in this study was generally lower than the total mass of the BC aggregate, which comprises both rBC and a possible fraction of nonrefractory components. The ρeff values in the 280–350 nm mobility range appeared to be much closer to the values for soot aggregates reported in the literature by using the DMA–APM tandem measurement. This finding might be related to the more compact structure of BC aggregates in this range, which was likely influenced by the reconstruction effect of volatile and/or semivolatile components in the atmosphere. The reconstruction effect might also result in a hiatus in the gradually increased χ value in the range of 200–350 nm. Large χ values generally increased from 2.16 to 2.93 with increasing dmob, further implying the high fractal structure of extBC particles.
Data used in this study are available from Yunfei Wu (wuyf@mail.iap.ac.cn).
The supplement related to this article is available online at: https://doi.org/10.5194/amt-12-4347-2019-supplement.
RZ led and designed the study; YW designed the study, set up the experiment, analyzed the data, and wrote and drafted the paper. YX and PT collected the field data and contributed to data analysis; ZD provided the size selection procedure and contributed to data analysis; RH and XX finalized the paper. All coauthors provided comments on the paper.
The authors declare that they have no conflict of interest.
This research has been supported by the National Key Research and Development Program of China (grant nos. 2017YFC0209601 and 2017YFC0212701) and the National Natural Science Foundation of China (grant nos. 41575150, 41775155, 91644217, and 91644219).
This paper was edited by Paolo Laj and reviewed by two anonymous referees.
Alexander, D. T., Crozier, P. A., and Anderson, J. R.: Brown carbon spheres in East Asian outflow and their optical properties, Science, 321, 833–836, https://doi.org/10.1126/science.1155296, 2008.
Baumgardner, D., Popovicheva, O., Allan, J., Bernardoni, V., Cao, J., Cavalli, F., Cozic, J., Diapouli, E., Eleftheriadis, K., Genberg, P. J., Gonzalez, C., Gysel, M., John, A., Kirchstetter, T. W., Kuhlbusch, T. A. J., Laborde, M., Lack, D., Müller, T., Niessner, R., Petzold, A., Piazzalunga, A., Putaud, J. P., Schwarz, J., Sheridan, P., Subramanian, R., Swietlicki, E., Valli, G., Vecchi, R., and Viana, M.: Soot reference materials for instrument calibration and intercomparisons: a workshop summary with recommendations, Atmos. Meas. Tech., 5, 1869–1887, https://doi.org/10.5194/amt-5-1869-2012, 2012.
Bi, L., Yang, P., Kattawar, G. W., and Mishchenko, M. I.: Efficient implementation of the invariant imbedding T-matrix method and the separation of variables method applied to large nonspherical inhomogeneous particles, J. Quant. Spectrosc. Ra., 116, 169–183, https://doi.org/10.1016/j.jqsrt.2012.11.014, 2013.
Huang, R. J., Zhang, Y. L., Bozzetti, C., Ho, K.-F., Cao, J. J., Han, Y. M., Daellenbach, K. R., Slowik, J. G., Platt, S. M., Canonaco, F., Zotter, P., Wolf, R., Pieber, S. M., Bruns, E. A., Crippa, M., Ciarelli, G., Piazzalunga, A., Schwikowski, M., Abbaszade, G., Schnelle-Kreis, J., Zimmermann, R., An, Z. S., Szidat, S., Baltensperger, U., El Haddad, I., and Prévôt, A. S. H.: High secondary aerosol contribution to particulate pollution during haze events in China, Nature, 514, 218–222, https://doi.org/10.1038/nature13774, 2014.
Huang, X. F., Sun, T. L., Zeng, L. W., Yu, G. H., and Luan, S. J.: Black carbon aerosol characterization in a coastal city in South China using a single particle soot photometer, Atmos. Environ., 51, 21–28, https://doi.org/10.1016/j.atmosenv.2012.01.056, 2012.
Gao, R. S., Schwarz, J. P., Kelly, K. K., Fahey, D. W., Watts, L. A., Thompson, T. L., Spackman, J. R., Slowik, J. G., Cross, E. S., Han, J.-H., Davidovits, P., Onasch, T. B., and Worsnop, D. R.: A novel method for estimating light-scattering properties of soot aerosols using a modified single-particle soot photometer, Aerosol Sci. Technol., 41, 125–135, https://doi.org/10.1080/02786820601118398, 2007.
Geller, M., Biswas, S., and Sioutas, C.: Determination of particle effective density in urban environments with a differential mobility analyzer and aerosol particle mass analyzer, Aerosol Sci. Technol., 40, 709–723, https://doi.org/10.1080/02786820600803925, 2006.
Gysel, M., Laborde, M., Olfert, J. S., Subramanian, R., and Gröhn, A. J.: Effective density of Aquadag and fullerene soot black carbon reference materials used for SP2 calibration, Atmos. Meas. Tech., 4, 2851–2858, https://doi.org/10.5194/amt-4-2851-2011, 2011.
Gysel, M., Laborde, M., Mensah, A. A., Corbin, J. C., Keller, A., Kim, J., Petzold, A., and Sierau, B.: Technical Note: The single particle soot photometer fails to reliably detect PALAS soot nanoparticles, Atmos. Meas. Tech., 5, 3099–3107, https://doi.org/10.5194/amt-5-3099-2012, 2012.
IPCC: Summary for policymakers, in: Climate Change 2013: The Physical Science Basis. Contribution of Working Group I to the Fifth Assessment Report of the Intergovernmental Panel on Climate Change, edited by: Stocker, T. F., Qin, D., Plattner, G.-K., Tignor, M., Allen, S. K., Boschung, J., Nauels, A., Xia, Y., Bex, V., and Midgley, P. M., Cambridge University Press, Cambridge, United Kingdom and New York, NY, USA, 2013.
Jacobson, M. Z.: Strong radiative heating due to the mixing state of black carbon in atmospheric aerosols, Nature, 409, 695–697, https://doi.org/10.1038/35055518, 2001.
Khalizov, A. F., Xue, H. X., Wang, L., Zheng, J., and Zhang, R. Y.: Enhanced light absorption and scattering by carbon soot aerosol internally mixed with sulfuric acid, J. Phys. Chem. A, 113, 1066–1074, 2009.
Laborde, M., Mertes, P., Zieger, P., Dommen, J., Baltensperger, U., and Gysel, M.: Sensitivity of the Single Particle Soot Photometer to different black carbon types, Atmos. Meas. Tech., 5, 1031–1043, https://doi.org/10.5194/amt-5-1031-2012, 2012.
Liu, D., Allan, J., Whitehead, J., Young, D., Flynn, M., Coe, H., McFiggans, G., Fleming, Z. L., and Bandy, B.: Ambient black carbon particle hygroscopic properties controlled by mixing state and composition, Atmos. Chem. Phys., 13, 2015–2029, https://doi.org/10.5194/acp-13-2015-2013, 2013.
Liu, D. T., Whitehead, J., Alfarra, M. R., Reyes-Villegas, E., Spracklen, D. V., Reddington, C. L., Kong, S. F., Williams. P. I., Ting, Y.-C., Haslett, S., Taylor, J. W., Flynn, M. J., Morgan, W. T., McFiggans, G., Coe, H., and Allan, J. D.: Black-carbon absorption enhancement in the atmosphere determined by particle mixing state, Nat. Geosci., 10, 184–188, https://doi.org/10.1038/NGEO2901, 2017.
Ma, Q. X., Wu, Y. F., Zhang, D. Z., Wang, X. J., Xia, Y. J., Liu, X. Y., Tian, P., Han, Z. W., Xia, X. A., Wang, Y., and Zhang, R. J.: Roles of regional transport and heterogeneous reactions in the PM2.5 increase during winter haze episodes in Beijing, Sci. Total Environ., 599–600, 246–253, https://doi.org/10.1016/j.scitotenv.2017.04.193, 2017a.
Ma, Q. X., Wu, Y. F., Tao, J., Xia, Y. J., Liu, X. Y., Zhang, D. Z., Han, Z. W., Zhang, X. L., and Zhang, R. J.: Variations of chemical composition and source apportionment of PM2.5 during winter haze episodes in Beijing, Aerosol Air Qual. Res., 17, 2791–2803, https://doi.org/10.4209/aaqr.2017.10.0366, 2017b.
Maricq, M. M. and Xu, N.: The effective density and fractal dimension of soot particles from premixed flames and motor vehicle exhaust, J. Aerosol Sci., 35, 1251–1274, https://doi.org/10.1016/j.jaerosci.2004.05.002, 2004.
McMeeking, G. R., Good, N., Petters, M. D., McFiggans, G., and Coe, H.: Influences on the fraction of hydrophobic and hydrophilic black carbon in the atmosphere, Atmos. Chem. Phys., 11, 5099–5112, https://doi.org/10.5194/acp-11-5099-2011, 2011.
Moteki, N. and Kondo, Y.: Effects of mixing state on black carbon measurements by laser-induced incandescence, Aerosol Sci. Technol., 41, 398–417, https://doi.org/10.1080/02786820701199728, 2007.
Ning, Z., Chan, K. L., Wong, K. C., Westerdahl, D., Močnik, G., Zhou, J. H., and Cheung, C. S.: Black carbon mass size distributions of diesel exhaust and urban aerosols measured using differential mobility analyzer in tandem with Aethalometer, Atmos. Environ., 80, 31–40, https://doi.org/10.1016/j.atmosenv.2013.07.037, 2013.
Olfert, J. S., Symonds, J. P. R., and Collings, N.: The effective density and fractal dimension of particles emitted from a light-duty diesel vehicle with a diesel oxidation catalyst, J. Aerosol Sci., 38, 69–82, https://doi.org/10.1016/j.jaerosci.2006.10.002, 2007.
Pagels, J., Khalizov, A. F., McMurry, P. H., and Zhang, R. Y.: Processing of soot by controlled sulphuric acid and water condensation – mass and mobility relationship, Aerosol Sci. Technol., 43, 629–640, https://doi.org/10.1080/02786820902810685, 2009.
Park, K., Cao, F., Kittelson, D. B., and McMurry, P. H.: Relationship between particle mass and mobility for diesel exhaust particles, Environ. Sci. Technol., 37, 577–583, https://doi.org/10.1021/es025960v, 2003.
Park, K., Kittelson, D. B., and McMurry, P. H.: Structural properties of diesel exhaust particles measured by transmission electron microscopy (TEM): relationships to particle mass and mobility, Aerosol Sci. Technol., 38, 881–889, https://doi.org/10.1080/027868290505189, 2004.
Park, K., Dutcher, D., Emery, M., Pagels, J., Sakurai, H., Scheckman, J., Qian, S., Stolzenburg, M. R., Wang, X., Yang, J., and McMurry, P. H.: Tandem measurements of aerosol properties – a review of mobility techniques with extensions, Aerosol Sci. Technol., 42, 801–816, https://doi.org/10.1080/02786820802339561, 2008.
Peng, J. F., Hu, M., Guo, S., Du, Z. F., Zheng, J., Shang, D. J., Zamora, M. L., Zeng, L. M., Shao, M., Wu, Y.-S., Zheng, J., Wang, Y., Glen, C. R., Collins, D. R., Molina, M. J., and Zhang, R. Y.: Markedly enhanced absorption and direct radiative forcing of black carbon under polluted urban environments, P. Natl. Acad. Sci. USA, 113, 4266–4271, https://doi.org/10.1073/pnas.1602310113, 2016.
Raatikainen, T., Brus, D., Hooda, R. K., Hyvärinen, A.-P., Asmi, E., Sharma, V. P., Arola, A., and Lihavainen, H.: Size-selected black carbon mass distributions and mixing state in polluted and clean environments of northern India, Atmos. Chem. Phys., 17, 371–383, https://doi.org/10.5194/acp-17-371-2017, 2017.
Rissler, J., Nordin, E. Z., Eriksson, A. C., Nilsson, P. T., Frosch, M., Sporre, M. K., Wierzbicka, A., Svenningsson, B., Löndahl, J., Messing, M. E., Sjogren, S., Hemmingsen, J. G., Loft, S., Pagels, J. H., and Swietlicki, E.: Effective density and mixing state of aerosol particles in a near-traffic urban environment, Environ. Sci. Technol., 48, 6300–6308, https://doi.org/10.1021/es5000353, 2014.
Seinfeld, J. H. and Pandis, S. N.: Atmospheric chemistry and physics, Chapter 9–Dynamics of single aerosol particles, John Wiley & Sons, Inc., Hoboken, New Jersey, 2006.
Scarnato, B. V., Vahidinia, S., Richard, D. T., and Kirchstetter, T. W.: Effects of internal mixing and aggregate morphology on optical properties of black carbon using a discrete dipole approximation model, Atmos. Chem. Phys., 13, 5089–5101, https://doi.org/10.5194/acp-13-5089-2013, 2013.
Schwarz, J. P., Gao, R. S., Fahey, D. W., Thomson, D. S., Watts, L. A., Wilson, J. C., Reeves, J. M., Darbeheshti, M., Baumgardner, D. G., Kok, G. L., Chung, S. H., Schulz, M., Hendricks, J., Lauer, A., Kärcher, B., Slowik, J. G., Rosenlof, K. H., Thompson, T. L., Langford, A. Q., Loewenstein, M., and Aikin, K. C.: Single-particle measurements of midlatitude black carbon and light-scattering aerosols from the boundary layer to the lower stratosphere, J. Geophys. Res., 111, D16207, https://doi.org/10.1029/2006JD007076, 2006.
Schwarz, J. P., Gao, R. S., Spackman, J. R., Watts, L. A., Thomson, D. S., Fahey, D. W., Ryerson, T. B., Peischl, J., Holloway, J. S., Trainer, M., Frost, G. J., Baynard, T., Lack, D. A., de Gouw, J. A., Warneke, C., and Del Negro, L. A.: Measurement of the mixing state, mass, and optical size of individual black carbon particles in urban and biomass burning emissions, Geophys. Res. Lett., 35, L13810, https://doi.org/10.1029/2008GL033968, 2008.
Shiraiwa, M., Kondo, Y., Iwamoto, T., and Kita, K.: Amplification of light absorption of black carbon by organic coating, Aerosol Sci. Technol., 44, 46–54, https://doi.org/10.1080/02786820903357686, 2010.
Slowik, J. G., Cross, E. S., Han, J. H., Kolucki, J., Davidovits, P., Williams, L. R., Onasch, T. B., Jayne, J. T., Kolb, C. E., and Worsnop, D. R.: Measurements of morphology changes of fractal soot particles using coating and denuding experiments: implications for optical absorption and atmospheric lifetime, Aerosol Sci. Technol., 41, 734–750, https://doi.org/10.1080/02786820701432632, 2007.
Sorensen, C. M.: The mobility of fractal agregates: A review, Aerosol Sci. Technol., 45, 765–779, https://doi.org/10.1080/02786826.2011.560909, 2011.
Taylor, J. W., Allan, J. D., Liu, D., Flynn, M., Weber, R., Zhang, X., Lefer, B. L., Grossberg, N., Flynn, J., and Coe, H.: Assessment of the sensitivity of core/shell parameters derived using the single-particle soot photometer to density and refractive index, Atmos. Meas. Tech., 8, 1701–1718, https://doi.org/10.5194/amt-8-1701-2015, 2015.
Wang, Q. Y., Huang, R. J., Cao, J. J., Han, Y. M., Wang, G. H., Li, G. H., Wang, Y. C., Dai, W. T., Zhang, R. J., and Zhou, Y. Q.: Mixing state of black carbon aerosol in a heavily polluted urban area of China: implications for light absorption enhancement, Aerosol Sci. Technol., 48, 689–697, https://doi.org/10.1080/02786826.2014.917758, 2014.
Wang, Y. Y., Liu, F. S., He, C. L., Bi, L., Cheng, T. H., Wang, Z. L., Zhang, H., Zhang, X. Y., Shi, Z. B., and Li, W. J.: Fractal dimensions and mixing structrures of soot particles during atmospheric processing, Environ. Sci. Tech. Lett., 4, 487–493, https://doi.org/10.1021/acs.estlett.7b00418, 2017.
Wu, Y., Wang, X., Tao, J., Huang, R., Tian, P., Cao, J., Zhang, L., Ho, K.-F., Han, Z., and Zhang, R.: Size distribution and source of black carbon aerosol in urban Beijing during winter haze episodes, Atmos. Chem. Phys., 17, 7965–7975, https://doi.org/10.5194/acp-17-7965-2017, 2017.
Wu, Y. F., Zhang, R. J., Tian, P., Tao, J., Hsu, S.-C., Yan, P., Wang, Q. Y., Cao, J. J., Zhang, X. L., and Xia, X. A.: Effect of ambient humidity on the light absorption amplification of black carbon in Beijing during January 2013, Atmos. Environ., 124, 217–223, https://doi.org/10.1016/j.atmosenv.2015.04.041, 2016.
Zhang, R., Jing, J., Tao, J., Hsu, S.-C., Wang, G., Cao, J., Lee, C. S. L., Zhu, L., Chen, Z., Zhao, Y., and Shen, Z.: Chemical characterization and source apportionment of PM2.5 in Beijing: seasonal perspective, Atmos. Chem. Phys., 13, 7053–7074, https://doi.org/10.5194/acp-13-7053-2013, 2013.
Zhang, R. Y., Khalizov, A. F., Pagels, J., Zhang, D., Xue, H., Chen, J., and McMurry, P. H.: Variability in morphology, hygroscopic and optical properties of soot aerosols during internal mixing in the atmosphere, P. Natl. Acad. Sci. USA, 105, 10291–10296, https://doi.org/10.1073/pnas.0804860105, 2008.
Zhang, Y., Zhang, Q., Cheng, Y., Su, H., Kecorius, S., Wang, Z., Wu, Z., Hu, M., Zhu, T., Wiedensohler, A., and He, K.: Measuring the morphology and density of internally mixed black carbon with SP2 and VTDMA: new insight into the absorption enhancement of black carbon in the atmosphere, Atmos. Meas. Tech., 9, 1833–1843, https://doi.org/10.5194/amt-9-1833-2016, 2016.