the Creative Commons Attribution 4.0 License.
the Creative Commons Attribution 4.0 License.
 | 26 Aug 2019
Inter-comparison of elemental and organic carbon mass measurements from three North American national long-term monitoring networks at a co-located site
Kulbir Banwait
Wendy Zhang
Darrell Ernst
Xiaoliang Wang
John G. Watson
Judith C. Chow
Mark Green
Claudia I. Czimczik
Guaciara M. Santos
Sangeeta Sharma
Keith Jones
Carbonaceous aerosol is a major contributor to the total aerosol load and being monitored by diverse measurement approaches. Here, 10 years (2005–2015) of continuous carbonaceous aerosol measurements collected at the Centre of Atmospheric Research Experiments (CARE) in Egbert, Ontario, Canada, on quartz-fiber filters by three independent networks (Interagency Monitoring of Protected Visual Environments, IMPROVE; Canadian Air and Precipitation Monitoring Network, CAPMoN; and Canadian Aerosol Baseline Measurement, CABM) were compared. Specifically, the study evaluated how differences in sample collection and analysis affected the concentrations of total carbon (TC), organic carbon (OC), and elemental carbon (EC). Results show that different carbonaceous fractions measured by various networks were consistent and comparable in general among the three networks over the 10-year period, even with different sampling systems/frequencies, analytical protocols, and artifact corrections. The CAPMoN TC, OC, and EC obtained from the DRI model 2001 thermal–optical carbon analyzer following the IMPROVE-TOR protocol (denoted as DRI-TOR) method were lower than those determined from the IMPROVE_A TOR method by 17 %, 14 %, and 18 %, respectively. When using transmittance for charring correction, the corresponding carbonaceous fractions obtained from the Sunset-TOT were lower by as much as 30 %, 15 %, and 75 %, respectively. In comparison, the CABM TC, OC, and EC obtained from a thermal method, EnCan-Total-900 (ECT9), were higher than the corresponding fractions from IMPROVE_A TOR by 20 %–30 %, 0 %–15 %, and 60 %–80 %, respectively. Ambient OC and EC concentrations were found to increase when ambient temperature exceeded 10 ∘C. These increased ambient concentrations of OC during summer were possibly attributed to secondary organic aerosol (SOA) formation and forest fire emissions, while elevated EC concentrations were potentially influenced by forest fire emissions and increased vehicle emissions. Results also show that the pyrolyzed organic carbon (POC) obtained from the ECT9 protocol could provide additional information on SOA although more research is still needed.
- Article
(3983 KB) - Full-text XML
-
Supplement
(756 KB) - BibTeX
- EndNote


Carbonaceous aerosols, including elemental carbon (EC), which is often referred to as black carbon (BC) and organic carbon (OC), make up a large fraction of the atmospheric fine particulate matter (PM) mass (Heintzenberg, 1989). Atmospheric OC and BC particles that are emitted directly into the atmosphere have both natural (e.g., biomass burning or forest fires) and anthropogenic (e.g., internal combustion engines) sources. A significant amount of the particulate OC is also formed in the atmosphere through oxidation and condensation of volatile organic compounds (e.g., isoprene and terpenes), which are emitted directly from vegetation. BC is a by-product of incomplete combustion of hydrocarbon fuels, generated mainly from fossil fuel combustion and biomass burning. Atmospheric particles have direct and indirect influences on climate, visibility, air quality, and ecosystems and adverse human health effects (Bond et al., 2013; Japar et al., 1986; Lesins et al., 2002; Watson, 2002). Atmospheric BC absorbs solar radiation while OC primarily scatters it (Schulz et al., 2006). However, BC and OC co-exist in atmospheric particles and the net radiative forcing of the aerosol particles depends on the particle size, composition, and mixing state of the particles, while all of these variables also change as aerosol particles age (Fuller et al., 1999; Lesins et al., 2002).
Black carbon is a generic term in the literature and it is often interchanged with other terms such as EC, soot, refractory BC, light-absorbing carbon, or equivalent BC (Petzold et al., 2013). Although BC is highly relevant to climate research, there is no universally agreed upon and clearly defined terminology concerning the metrics of carbonaceous aerosol. The use of different terminology is linked to the different methodologies used to measure different physical or chemical properties of BC. The scientific community generally accepts that BC particles possess the following properties: (1) strongly absorb in the visual spectrum with an inverse wavelength (λ) dependence (i.e., λ−1) (Bond and Bergstrom 2006), (2) refractory in nature with a vaporization temperature near 4000 K (Schwarz et al., 2006), (3) insoluble in water and common organic solvents (Fung, 1990), (4) fractal-like aggregates of small carbon spherules (Kittelson, 1998), (5) contain a large fraction of graphite-like sp2-bonded carbon atoms (Bond et al., 2013; Petzold et al., 2013), and (6) chemical inertness in the atmosphere (Bond et al., 2013). In this article, the recommendation from Petzold et al. (2013) is adopted as the definition of BC whenever the context of climate effects impacted by strong light-absorption carbonaceous substance is mentioned. EC is referred to as the carbon mass determined from the thermal evolution analysis (TEA) or thermal–optical analysis (TOA) of carbonaceous materials at the highest temperature set point (e.g., >550 ∘C) under an oxygenated environment. It is also assumed that ambient EC and BC concentration time series correlate with each other.
TOA and TEA have been applied in many long-term monitoring networks with various protocols to quantify OC and EC concentrations from aerosol deposits on quartz-fiber filters (Birch and Cary, 1996; Cachier et al., 1989; Cavalli et al., 2010; Chow et al., 1993; Huang et al., 2006; Huntzicker et al., 1982) due to the simplicity in filter sample collection and the analytical procedures. TOA and TEA provide a direct measurement of the carbon mass in the collected PM mass. One of the limitations of TOA and TEA is the need for sufficient sampling time to accumulate enough mass for precise measurements (i.e., ensuring a high signal-to-noise ratio), which constrains the temporal resolution of such samples. In addition, EC and OC are defined differently in different protocols and could affect the absolute mass values measured. Generally, OC is quantified under a pure helium (He) atmosphere at a low heating temperature whereas EC is quantified under an oxygen (O2)∕He atmosphere at high temperatures. Estimates of total carbon (TC = OC + EC) derived from different TOA and TEA methods are generally consistent, whereby the differences in OC and EC estimates could vary from 20 % to 90 %, and often larger differences are found for EC, owing to its smaller contribution to TC (Cavalli et al., 2010; Chow et al., 1993, 2001, 2005; Countess, 1990; Watson et al., 2005; Hand et al., 2012).
During thermal analysis, some of the OC chars to form pyrolyzed organic carbon (POC) when heated in the inert He atmosphere, darkening the filter (Chow et al., 2004; Watson et al., 2005). When O2 is added, POC combusts to EC, resulting in an overestimation of EC of the filter. The formation of POC depends on the nature of the organic materials; amount of the oxygenated compounds in the collected particles; rate, duration, and temperature of the heating; and the supply of O2 in the carrier gas (Cachier et al., 1989; Chan et al., 2010; Han et al., 2007; Yang and Yu, 2002). POC in TOA is estimated by monitoring reflectance and/or transmittance of a 633–650 nm laser beam, which is termed thermal–optical reflectance (TOR) or thermal–optical transmittance (TOT), respectively. When the reflected or transmitted laser signal returns to its initial intensity at the start of the analysis (i.e., at OC ∕ EC split point), it is assumed that artifact POC has left the sample and the remaining carbon belongs to EC. The carbon mass before the split point is defined as OC whereas that after the split point is defined as EC. POC is defined as the mass determined between the time when O2 is introduced and the OC ∕ EC split point. Different from TOA, the TEA used in this study applies a different approach for POC determination (see below).
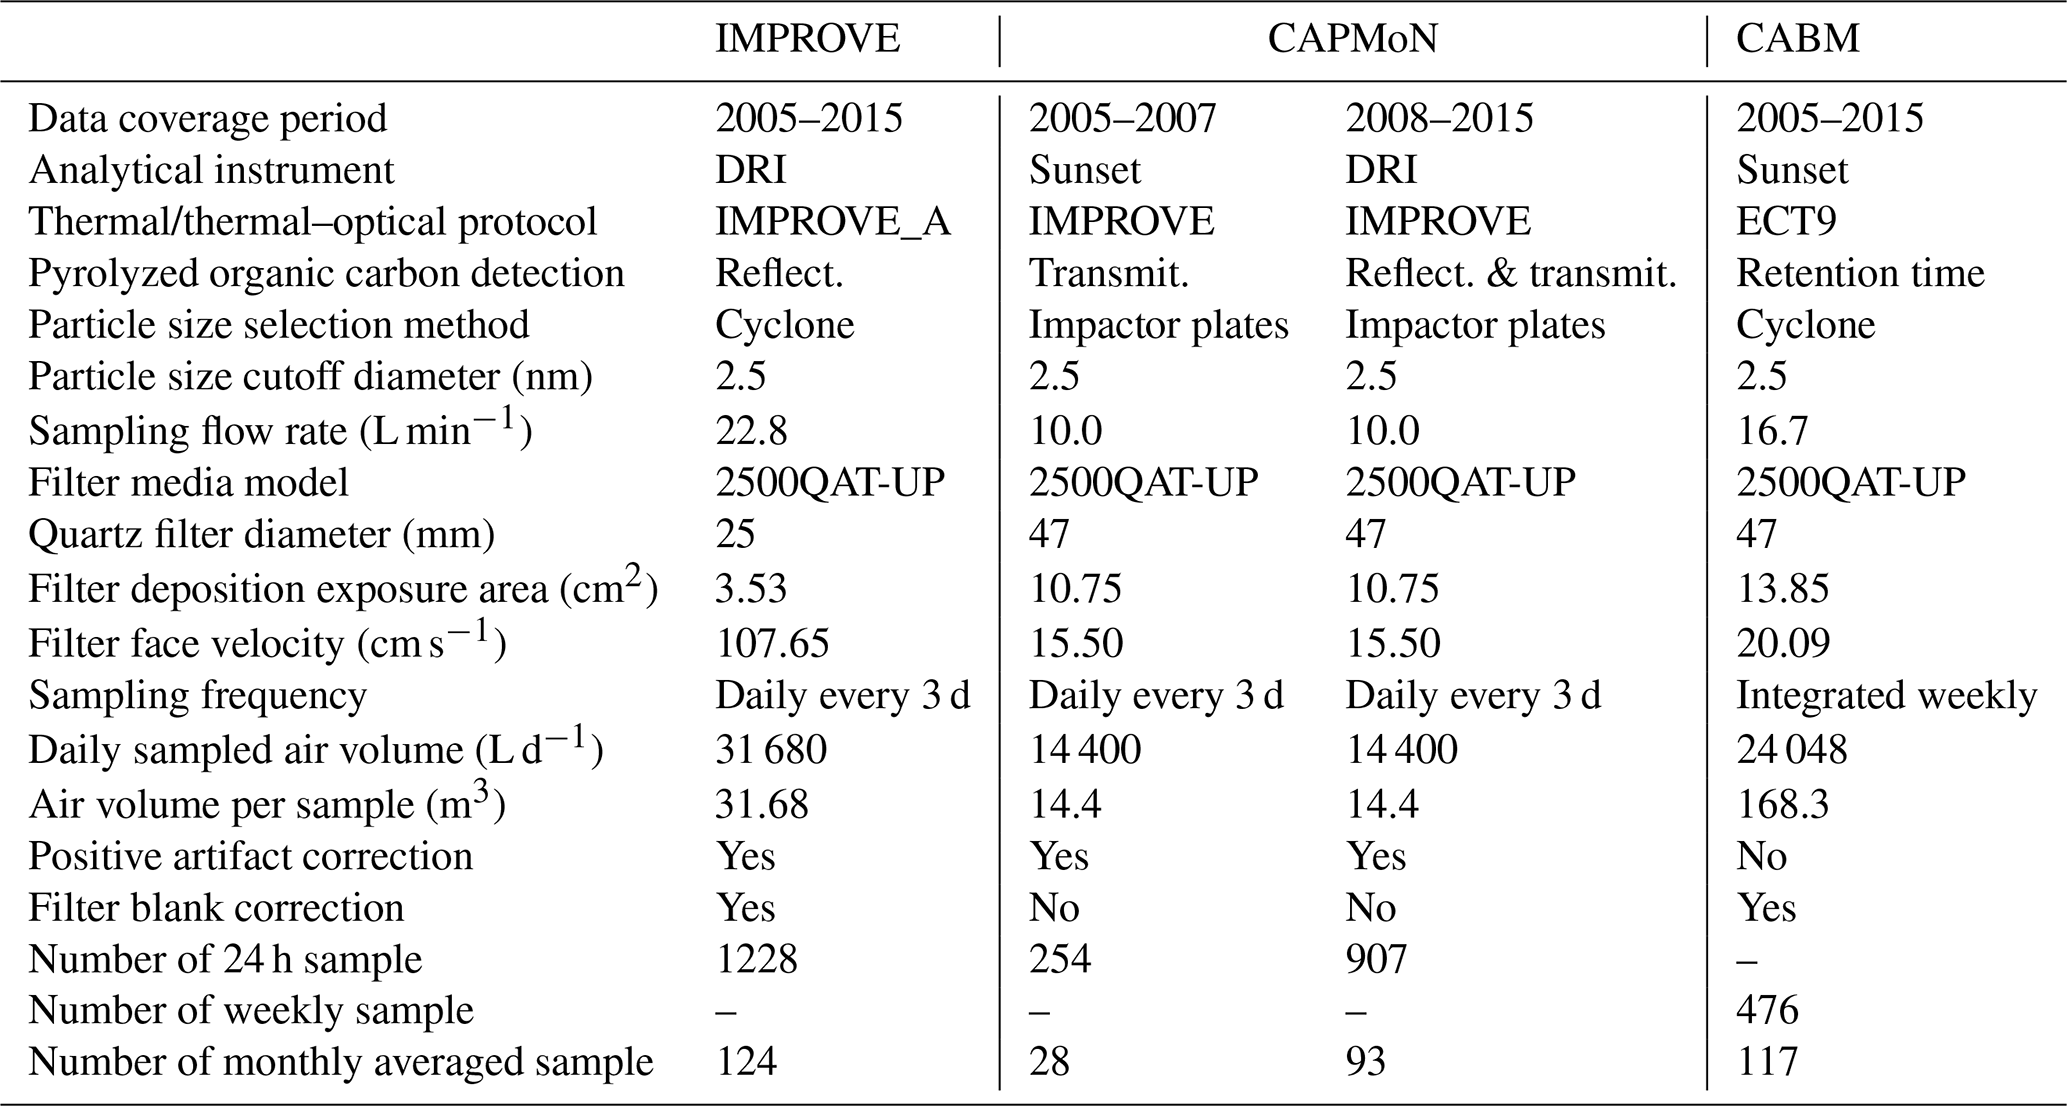
Table 1Specifications for the filter sampling systems and analytical instruments/methods used by the three networks.
Quartz-fiber filters adsorb organic vapours (Chow et al., 2009; Turpin et al., 1994; Viana et al., 2006; Watson et al., 2010), resulting in non-PM contributions to OC and charring enhancement within the filter. These vapours are adsorbed passively when the filter is exposed to air and more so as air is drawn through the filter during PM sampling. Sampling at low filter face velocities for long periods of time could lead to more adsorption (McDow and Huntzicker, 1990), while using high filter face velocities for longer sample durations may result in evaporation of semi-volatile compounds as negative artifacts (Khalek, 2008; Sutter et al., 2010; Yang et al., 2011). The positive OC artifact from adsorption usually exceeds the negative evaporation artifact, especially at low temperatures, resulting in OC overestimation (Watson et al., 2009; WMO, 2016). This can be corrected by subtracting the OC concentration from field blanks or backup filters located downstream of a Teflon-membrane or quartz-fiber filter (Chow et al., 2010; Watson et al., 2005, 2010).
Previous studies further suggested that TOT could over-estimate the POC mass more than TOR, resulting in higher POC (and lower EC) because of the charring of the adsorbed organic vapours within the filter (Chow et al., 2004; Countess, 1990). Since only a portion (0.5–1.5 cm2) of the filter is analyzed, inhomogeneous PM deposits add to measurement uncertainty when OC and EC are normalized to the entire filter deposit area. Deposits that are light or too dark can cause unstable laser signals that affect the OC ∕ EC split (Watson et al., 2005).
The short lifetime of atmospheric aerosols (in days to weeks) and the different chemical and microphysical processing that occur in the atmosphere result in high spatial and temporal variations in aerosol properties. To facilitate the determination of the trends in emission changes and evaluation of the effectiveness of emission mitigation policies (Chen et al., 2012), consistent long-term atmospheric measurements are required, including aerosol carbon fractions. The emission sources of OC and EC at regional and global scales are often constrained through the use of atmospheric transport models in conjunction with long-term OC and EC measurements (Collaud Coen et al., 2013; Huang et al., 2018). Usually an integration of data sets from different networks is necessary for sufficient spatial coverage. The objective of this study is to conduct an inter-comparison study for evaluating the comparability and consistency of 10-year co-located carbonaceous aerosol measurements at Egbert made by three North American networks (Interagency Monitoring of Protected Visual Environments, Canadian Air and Precipitation Monitoring Network, and Canadian Aerosol Baseline Measurement), all of which use different sampling instruments, frequencies, durations, analytical methods, and artifact corrections. This inter-comparison study is also expected to provide some suggestions/recommendations for improving the compatibility and consistency of long-term measurements.
2.1 Sampling site
The sampling station is the Center for Atmospheric Research Experiments (CARE) located near Egbert, Ontario (44∘12′ N, 79∘48′ W, 251 m a.s.l.), Canada. This station is owned and operated by Environment and Climate Change Canada (ECCC), and is located 70 km NNW of the city of Toronto. There are no major local anthropogenic sources within about 10 km of the site. Air that reaches this site from southern Ontario and the northeastern United States typically carries urban or anthropogenic combustion pollutants that were emitted within last 2 d (Rupakheti et al., 2005; Chan and Mozurkewich, 2007; Chan et al., 2010). Air from the north generally contains biogenic emissions and is often accompanied by SOA during summer (Chan et al., 2010; Slowik et al., 2010). Table 1 compares the instrument and analytical specifications among the three networks.
2.2 The Interagency Monitoring of Protected Visual Environment Network
IMPROVE, established in 1987, includes regional-scale monitoring stations for detecting visibility trends, understanding long-term trends, and evaluating atmospheric processes (Malm, 1989; Malm et al., 1994; Yu et al., 2004). IMPROVE operates about 150 sites and provides long-term records of PM10 and PM2.5 (particles with aerodynamic diameter less than 10 and 2.5 µm, respectively) mass as well as PM2.5 composition, including anions (i.e., chloride, nitrate, and sulfate), and carbon (OC and EC). IMPROVE 24 h samples at Egbert were acquired once every third day from 2005 to 2015. The sampling period was from 08:00 to 08:00 LST (local standard time) except for 16 August 2006 through 24 October 2008 (from 00:00 to 00:00 LST). Module C of the IMPROVE sampler uses a modified air-industrial hygiene laboratory (AIHL) cyclone with a 2.5 µm cut point at a flow rate of 22.8 L min−1. PM samples were collected onto a 25 mm diameter quartz-fiber filter (Tissue quartz, Pall Life Sciences, Ann Arbor, MI, USA), which were pre-fired at 900 ∘C for 4 h. Once sampled, filters were stored in a freezer until they were ready to be analyzed in the DRI laboratory in Reno. All samples were analyzed by the IMPROVE_A thermal–optical reflectance protocol (Fig. S1a in the Supplement) (Chow et al., 2007) as shown in Table S1 (Supplement). The IMPROVE data (denoted as IMPROVE_A TOR) were obtained from the Cooperative Institute for Research in the Atmosphere (CIRA) of the Federal Land Manager Environmental Database (FED), Colorado State University, Fort Collins, CO http://views.cira.colostate.edu/fed/ (last access: 13 August 2019) (Malm et al., 1994).
2.3 The Canadian Air and Precipitation Monitoring Network
CAPMoN was established in 1983 to understand the source impacts of acid-rain-related pollutants from long-range transport to the Canadian soil and atmosphere. The network operates 30 regionally representatives sites (as of 2015) across Canada with most located in Ontario and Quebec. Measurements include PM, trace gases, mercury (in both air and precipitation), tropospheric ozone, and multiple inorganic ions in air and precipitation. In addition, a few sites include carbon (OC and EC) measurements (https://www.canada.ca/en/environment-climate-change/services/air-pollution/monitoring-networks-data/canadian-air-precipitation.html, last access: 13 August 2019).
The 24 h samples (08:00 to 08:00 LST) were acquired every third day from 2005 to 2015 using the modified Rupprecht and Patashnick (R&P) model 2300 PM2.5 speciation sampler with ChemComb cartridges and PM2.5 impactor plates with impactor foam to direct particles onto a 47 mm diameter tissue quartz-fiber filter (Thermo Scientific, Waltham, MA, USA) operated at 10 L min−1. Samples were taken on the same date when the IMPROVE samples were collected. A second parallel cartridge was configured with a 47 mm front Teflon-membrane filter and a quartz-fiber backup filter to estimate vapour adsorption artifact. All quartz-fiber filters were pre-fired at either 800 or 900 ∘C for over 2 h and cooled at 105 ∘C overnight and stored in a freezer (−15 ∘C) before loading onto sample cartridges. The loaded cartridges were shipped from the CAPMoN Toronto laboratory to the Egbert site at ambient temperature. After sample collection, filter cartridges were shipped back to the laboratory at ambient temperature where the sampled filters were stored in a freezer until they are ready to be analyzed in the CAPMoN Toronto laboratory.
Carbon was determined using the Sunset laboratory-based carbon analyzer (Sunset Laboratory Inc., OR, USA; http://www.sunlab.com/, last access: 13 August 2019) following the IMPROVE-TOT protocol from 2005 to 2007 (denoted as Sunset-TOT), then by DRI model 2001 thermal–optical carbon analyzer following the IMPROVE-TOR protocol (denoted as DRI-TOR) from 2008 to 2015 (Chow et al., 1993). As shown in Table S1, the temperature settings for the IMPROVE protocol (i.e., DRI-TOR) for CAPMoN samples are lower than those of the IMPROVE_A TOR protocol for IMPROVE samples by 20 to 40 ∘C (Fig. S1b). Overall, Chow et al. (2007) found that the small difference in the temperature ramp between these protocols results in correlated but different OC, EC, and TC mass.
2.4 The Canadian Aerosol Baseline Measurement Network
The Climate Chemistry Measurements and Research (CCMR) section in the Climate Research Division of ECCC has operated the Canadian Aerosol Baseline Measurement (CABM) network since 2005 to acquire data relevant to climate change (https://www.canada.ca/en/environment-climate-change/services/climate-change/science-research-data/greenhouse-gases-aerosols-monitoring/canadian-aerosol-baseline-measurement-program.html, last access: 13 August 2019). The CABM network includes six sites (as of 2016) for aerosol chemical, physical, and optical measurements that cover ecosystems at coastal, interior urban–rural areas, boreal forests, and the Arctic. Measurements are intended to elucidate influences from various emission sources on regional background air, including biogenic emissions, biomass burning, and anthropogenic contributions from industrial/urban areas.
The CABM filter pack system uses a PM2.5 stainless steel cyclone (URG-2000-30EHS) operated at 16.7 L min−1 for sampling from 2006 to 2015 with an operator manually changing the 47 mm quartz-fiber filter on a weekly basis. All quartz-fiber filters were pre-fired at 900 ∘C overnight prior to being sampled. Once sampled, filters were shipped cold and then stored in a freezer until they were ready to be analyzed in the CCMR laboratory in Toronto. A TEA method, EnCan-Total-900 (ECT9), developed by Huang et al. (2006) and refined later (Chan et al., 2010), was used to analyze the OC, POC, and EC on the quartz-fiber filters using a Sunset laboratory-based carbon analyzer. The ECT9 protocol was developed to permit stable carbon isotope (13C) analysis of the OC and EC masses without causing isotope fractionation, as demonstrated by Huang et al. (2006). This method first heats the filter at 550 and 870 ∘C for 600 s each in the He atmosphere to determine OC and POC (including carbonate carbon; CC), respectively, and then combusts the sample at 900 ∘C under 2 % O2 and 98 % He atmosphere for 420 s to determine EC (Fig. S1c and Table S1). The ECT9 POC definition (released as CO2 at 870 ∘C) includes the charred OC and some calcium carbonate (CaCO3) that decomposes at 830 ∘C, as well as any refractory OC that is not combusted at 550 ∘C. Chan et al. (2010) found that POC determined by ECT9 was proportional to the oxygenated compounds (e.g., aged aerosol from atmospheric photochemical reaction) and possibly humic-like materials. Consistent with the IMPROVE_A TOR protocol (Chow et al., 2007), OC is defined as the sum of OC and POC, as CC is usually negligible in PM2.5.
CABM sites are also equipped with particle soot absorption photometers (PSAPs; Radiance Research, Seattle, WA, USA) that continuously monitor aerosol light absorption at 1 min time resolution, as changes in the amount of light transmitted through a quartz-fiber filter. Assuming the mass absorption coefficient (MAC) for aerosol is constant at Egbert, the 1 min PSAP absorption measurements are linearly proportional to the BC or EC concentrations. In this study, 5 years of PSAP data (2010–2015) collected at Egbert were used to assess the impact of different sampling duration on the derived monthly average EC values.
2.5 Differences in sampling and analysis among networks
Depending on the sharpness (i.e., slope) of the inlet sampling effectiveness curve (Watson et al., 1983), different size-selective inlets may introduce measurement uncertainties. CAPMoN uses impactors whereas CABM and IMPROVE use cyclones. An impactor may have larger pressure drops across the inlet that might enhance semi-volatile PM evaporation. Larger solid particles might bounce off when in contact with the impactor and be re-entrained in the PM2.5 samples if the impactor is overloaded (Flagan and Seinfeld, 1998; Hinds, 1999). Atmospheric mass size distributions typically peak at about 10 µm with a minimum near 2.5 µm; therefore, the difference in mass collected with different impactors or cyclones among the three networks is not expected to be large (Watson and Chow, 2011). Analyzing OC and EC content by TEA or TOA is also subject to a number of artifacts, including adsorption of volatile organic compound (VOC) gases by a quartz-fiber filter, leading to positive artifacts, and evaporation of particles, leading to negative artifacts (Malm et al., 2011).
The small filter disc (25 mm diameter) and high flow rate (22.8 L min−1) in the IMPROVE sampler result in a 5- to 7-fold higher filter face velocity (i.e., 107.7 cm s−1) than that for the CAPMoN and CABM samplers (16–20 cm s−1). McDow and Huntzicker (1990) assert that higher filter face velocity may reduce sampling artifacts. However, very high face velocity (>100 cm s−1) may enhance OC volatilization (Khalek, 2008).
Both IMPROVE and CAPMoN correct for vapour adsorption, while the CABM network does not. For CAPMoN measurements, the organic artifact derived from each 24 h backup quartz filter was subtracted from the corresponding OC measurement. For IMPROVE measurements (up until 2015), the monthly median OC value obtained from the backup quartz filters from 13 sites (not including Egbert) was subtracted from all samples collected in the corresponding month. Monthly averaged OC values were then derived from the 24 h artifact corrected measurements.
Multiple studies show that using the same TOA protocol on both DRI and Sunset carbon analyzers can produce comparable TC concentrations (Chow et al., 2005; Watson et al., 2005). However, large differences in EC are found between the reflectance and transmittance POC correction (Chow et al., 2004, 2005; Watson et al., 2005). Difference in OC and EC definitions among different TOA and TEA protocols introduces measurement uncertainties. Among the TOA methods, how POC is determined from the laser signals at different temperatures in the inert He atmosphere introduces uncertainties. Large uncertainties in laser transmittance were found for lightly and heavily loaded samples (Birch and Cary, 1996). For the CABM samples, the POC determined at 870 ∘C by ECT9 represents different OC properties and does not equal the charred OC obtained by Sunset-TOT, DRI-TOR, or IMPROVE_A TOR.
Both IMPROVE and CAPMoN data sets are 24 h measurements made once every third day collected on the same date while the CABM data are weekly integrated samples. A comparison between the integrated weekly samples and 24 h samples has already been performed by Yang et al. (2011) and therefore will not be repeated here. Based on 2 years of Egbert measurements (2005–2007), Yang et al. (2011) suggested that integrated weekly samples might experience reduced vapour adsorption but increased losses of semi-volatile organics leading to lower OC measurements. Weekly EC values were higher than those from 24 h samples, which were attributed to the higher analytical uncertainties for the lower loadings on the 24 h samples (Yang et al., 2011).
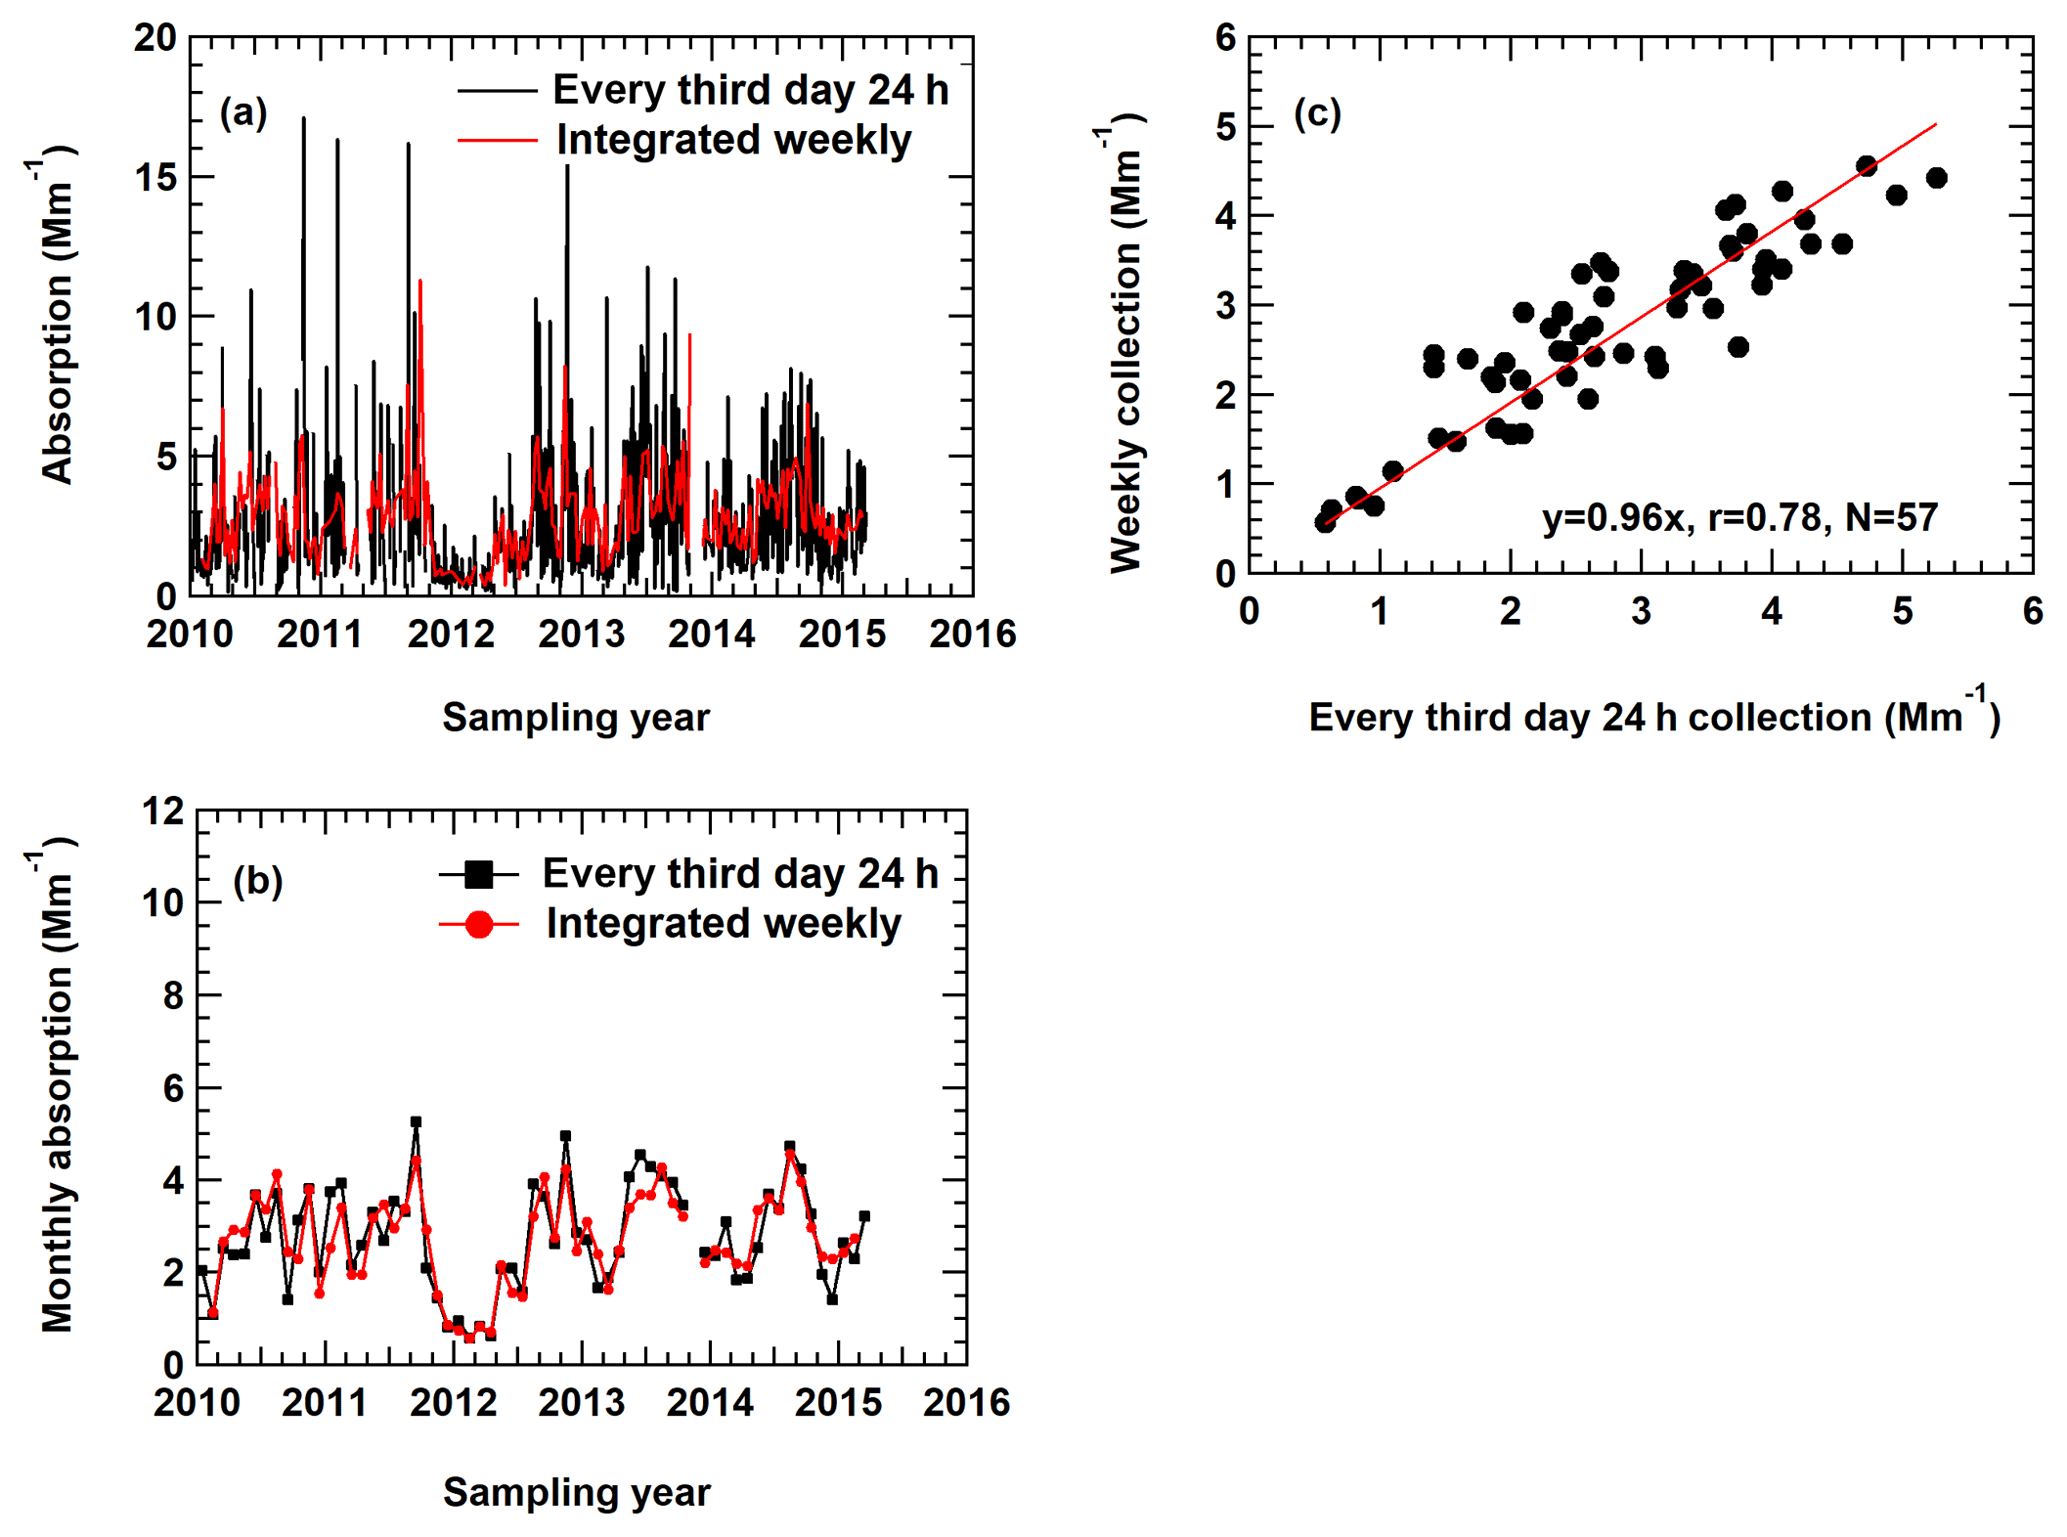
Figure 1(a) Real-time particle soot absorption photometer (PSAP) measurements averaged to match the corresponding sampling frequencies used in different networks. (b) Monthly PSAP measurements derived from (a). (c) Comparison of the different sets of measurements from (b) with the 1:1 line shown in red.
A total of 5 years (2010–2015) of real-time (1 min average) PSAP particle light absorption measurements (at 567 nm) were used here as a proxy common EC data set to assess the effect of different sample duration on monthly average EC concentrations. First, the 1 min PSAP data were averaged to 24 h samples taken once every 3 d and integrated weekly samples, and the comparison of the two data sets is shown in Fig. 1a. The results demonstrate that both data sets capture the variations adequately. Monthly averages derived from the two sets of measurements show highly correlated results (r=0.78; Fig. 1b) and a slope of 0.96 (Fig. 1c). Assuming the variations in light absorption can represent the variations in EC, these results suggest that monthly averaged EC based on integrated weekly sampling is about 4 % lower than the monthly averaged EC based on 24 h sampling.
3.1 NIST urban dust standard comparison
The National Institute of Standards and Technology (NIST) Urban Dust Standard Reference Material (SRM) 8785 air particulate matter on filter media is intended primarily for use to evaluate analytical methods used to characterize the carbon composition of atmospheric fine PM (Cavanagh and Watters, 2005; Klouda et al., 2005). These samples were produced by resuspension of the original SRM 1649a urban dust sample, followed by collection of the fine fraction (PM2.5) on quartz-fiber filters (Klouda et al., 2005; May and Trahey, 2001). Past studies on SRM 1649a and SRM 8785 have shown consistent composition and both samples were supplied with certified values for OC and EC (Currie et al., 2002; Klouda et al., 2005). The consistency between the ECT9 and the IMPROVE_A TOR analytical methods was assessed by analyzing NIST SRM 8785 filters. Four SRM 8785 filters with mass loading of 624–2262 µg were analyzed following the ECT9 method by the ECCC laboratory and the IMPROVE_A TOR protocol by the DRI laboratory during 2009–2010.
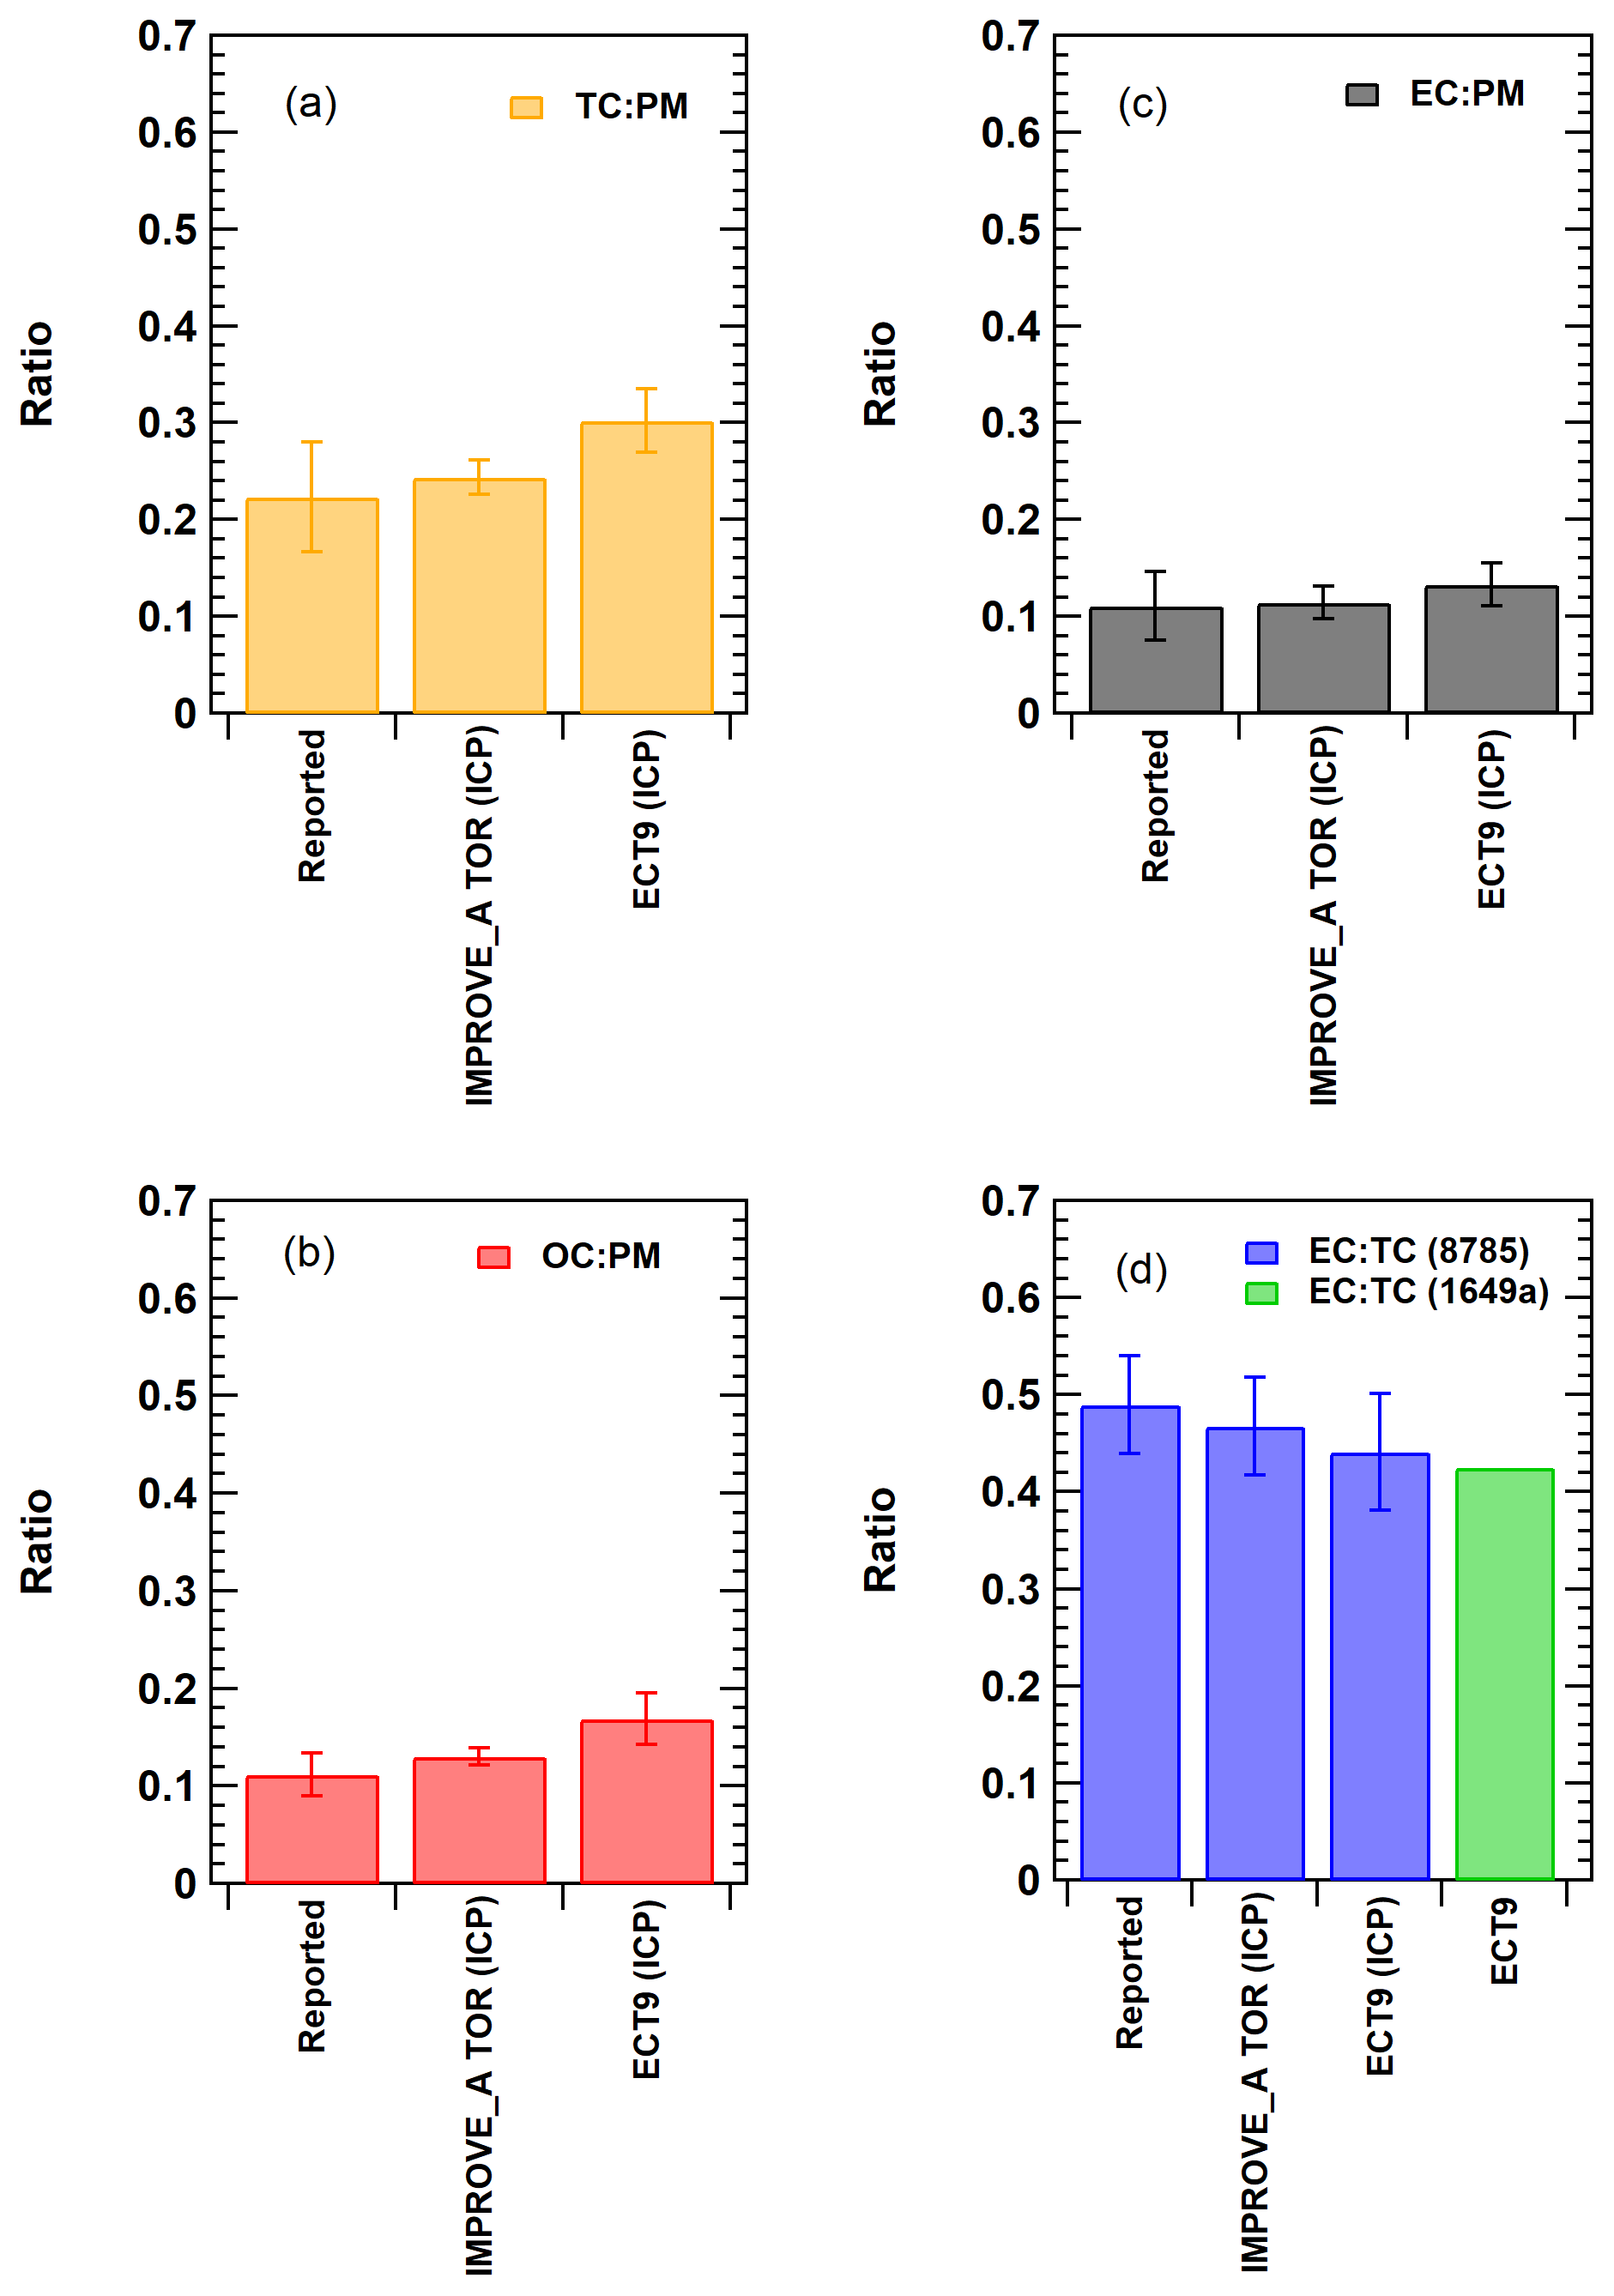
Figure 2Comparison of the TC, OC, and EC measurements of the NIST SRM samples reported by the ECCC and DRI groups during the inter-comparison study (ICP) conducted between 2009 and 2010. “Reported” represents the published value in the NIST SRM certificate (Cavanagh and Watters, 2005). Error bars represent uncertainties covering the 95 % confidence interval. In (d), the ECT9 value (in green) represents the calculated EC ∕ TC ratio determined based on stable carbon isotope measurement obtained from the SRM 1649a sample (Currie et al., 2002).
The values in the SRM 8785 certificate were reported in grams of OC or EC per gram of PM mass, which are average mass ratios based on analysis of a small number of randomly selected samples. Figure 2a–c show that measurements by IMPROVE_A TOR protocol were within uncertainties of the certificate values. Ratios measured with ECT9 were greater, but not significantly different from the certificate values. When fitting the ECT9 measurements to the IMPROVE_A TOR measurements using a linear regression (Fig. 3a–c), good correlations (r=0.9–0.99) were observed with 21 %–25 % higher values by the ECT9 method than IMPROVE_A TOR.
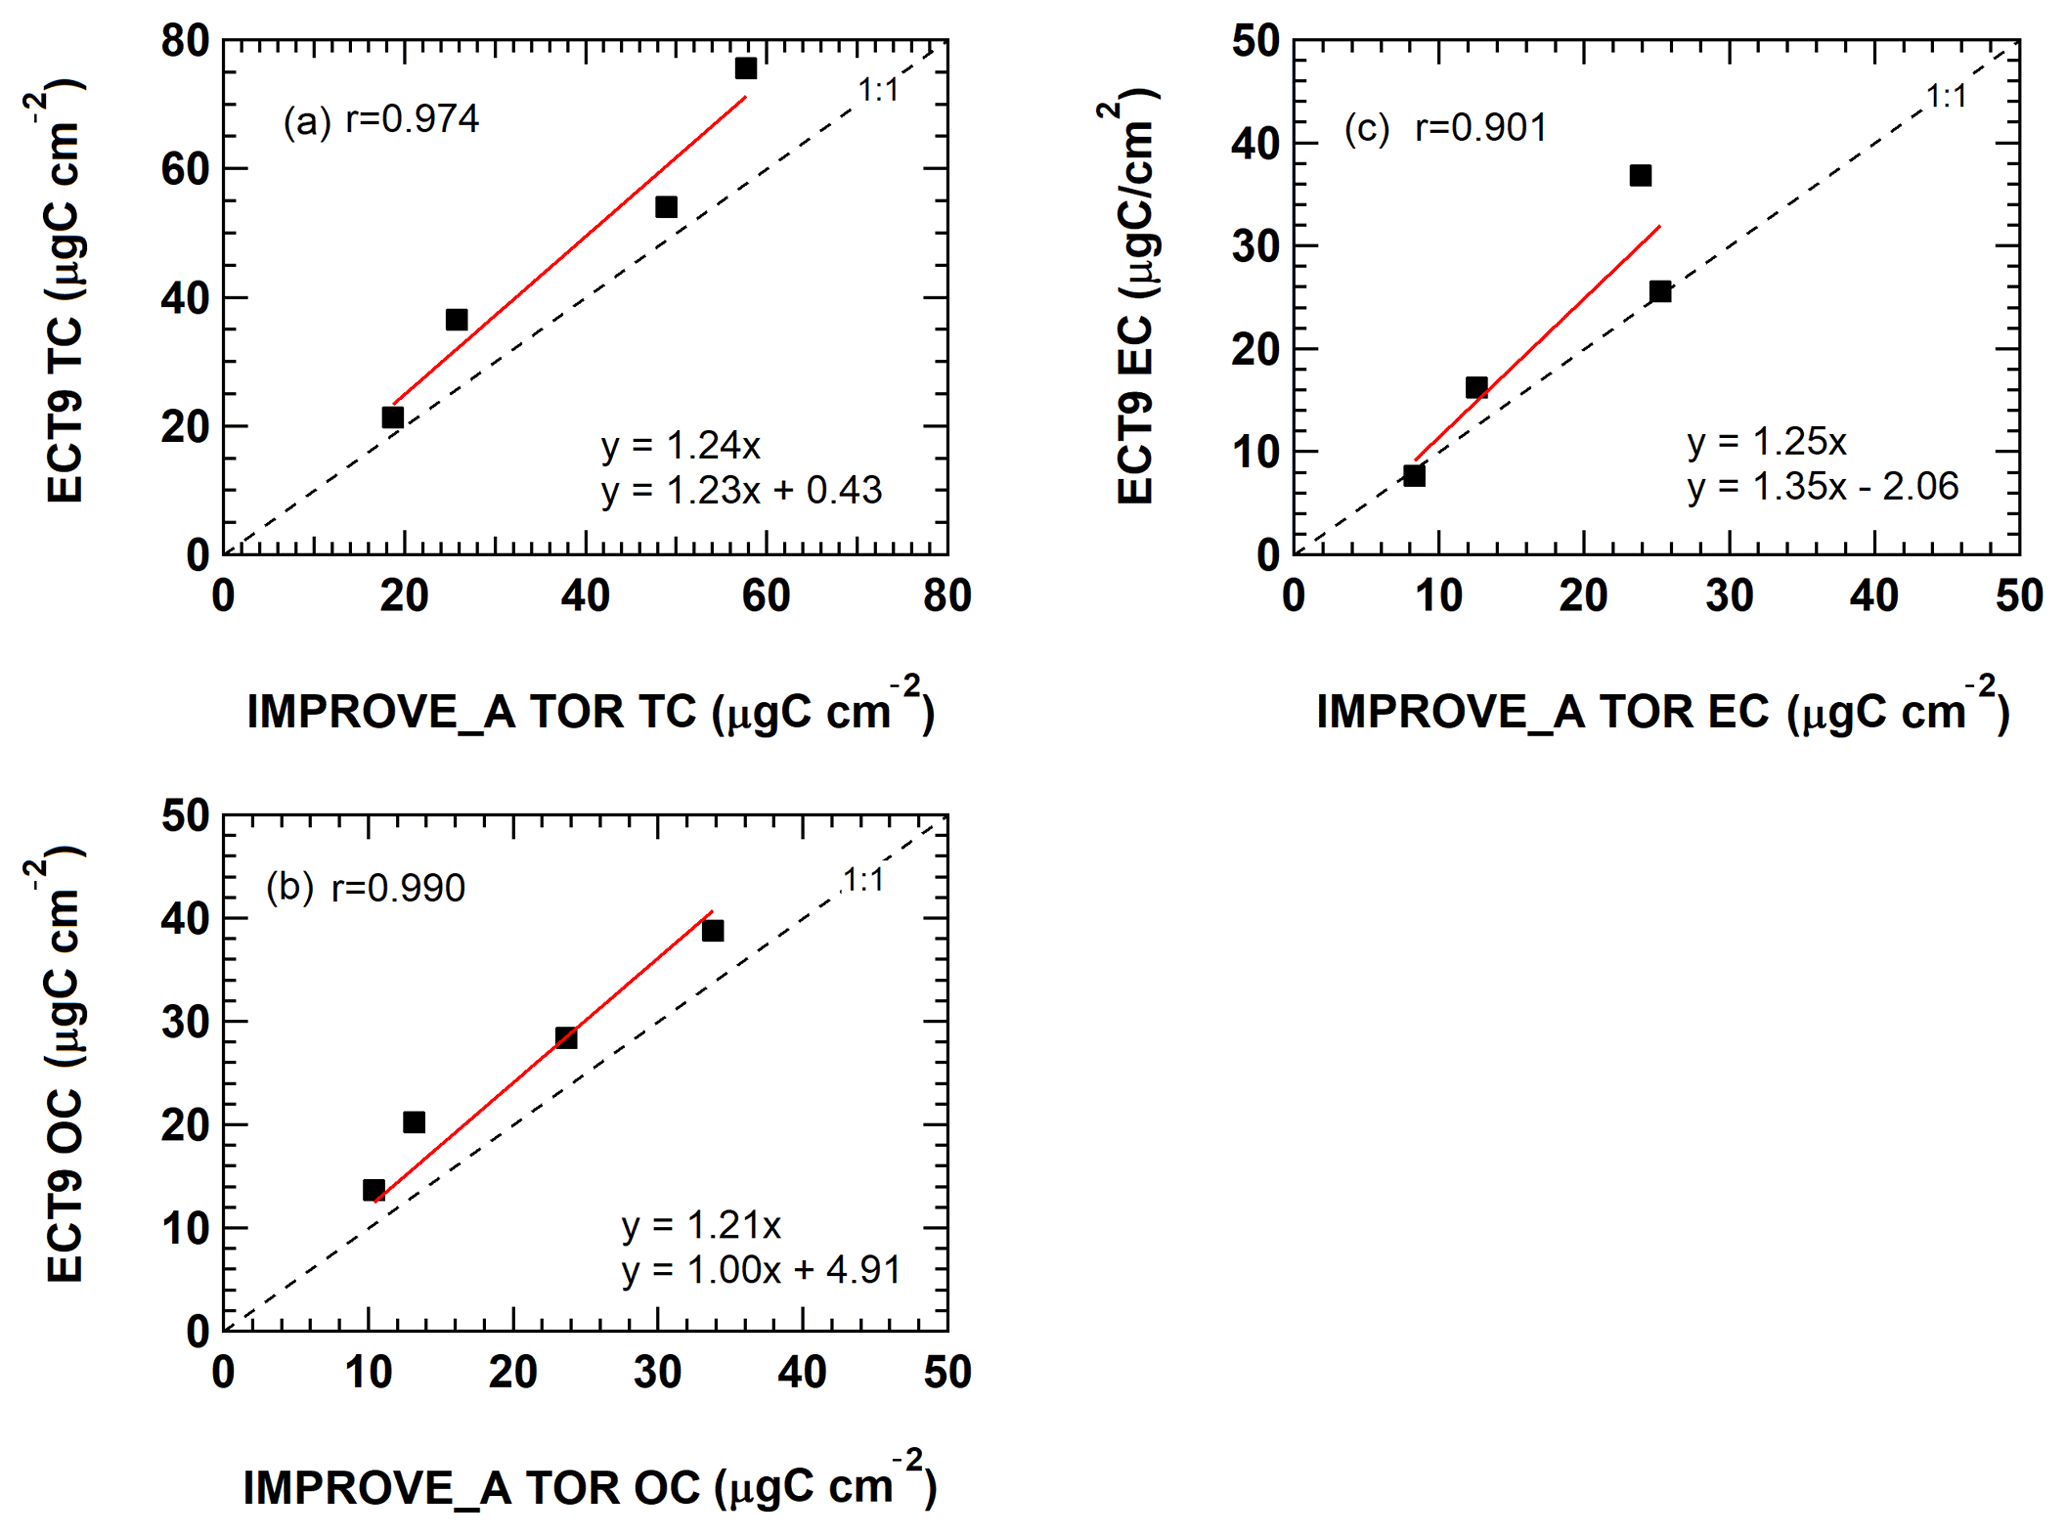
Figure 3Comparison of (a) TC, (b) OC, and (c) EC concentrations obtained from the same NIST SRM 8785 filters reported by ECCC following the TEA (ECT9) method and by DRI following the IMPROVE_A TOR protocol during the inter-comparison study in 2009/2010.
The parameter EC ∕ TC, calculated based on the reported certificate values, was compared with the average EC ∕ TC values determined from the inter-comparison study (ICP) by the DRI group (using IMPROVE_A TOR) and the ECCC group (using ECT9) (Fig. 2d). These results show that EC ∕ TC reported by both analytical methods was statistically the same as the certificate value.
Finally, the EC ∕ TC value was further verified by analyzing SRM 1649a samples with the ECT9 method. The combusted CO2 from OC, EC, and TC was analyzed for the isotope ratios (i.e., 14C∕12C) expressed as a fraction of modern carbon (i.e., FMi is the ratio of 14C∕12C in the sample i, relative to a modern carbon standard) for individual mass fractions (i.e., FMTC, FMOC, and FMEC). Using isotopic mass balance, the EC ∕ TC ratio can be derived from Eq. (1):
The 14C∕12C ratios were determined using the off-line combustion method at the Keck carbon cycle accelerator mass spectrometry (KCCAMS) facility at the University of California Irvine. A FMTC value of 0.512 was obtained, which is close to certificate values that range from 0.505 to 0.61 (Currie et al., 2002). Average measured values of FMOC and FMEC for the SRM 1649a via ECT9 were 0.634 (n=3) and 0.349 (n=3), respectively. This yields an EC ∕ TC ratio of 0.425, which is comparable to the ECT9 value of 0.44, and close to the reported certificate value of 0.49 and the IMPROVE_A TOR value of 0.47 (Fig. 2d), reconfirming a good separation of OC from EC using the ECT9 method. This analysis also confirms the consistency between the IMPROVE_A TOR and ECT9 methods.

Figure 4Monthly averaged CAPMoN (a) OC, (b) EC, and (c) POC mass concentration time series with and without vapour adsorption correction. Note that the y axes in (a), (b), and (c) are on a different scale.
3.2 Vapour adsorption corrections
Figure 4 shows the monthly averaged carbon concentration time series with and without the artifact correction for CAPMoN samples over the period from 2005 to 2015. Vapour adsorption contributes to a large amount of the measured OC (Fig. 4a), but a negligibly amount to EC (Fig. 4b) and POC after 2008 (Fig. 4c). The median vapour adsorption artifact was 0.79 µg m−3 from 2008 to 2015 for DRI-TOR, representing about 50.9 % of the uncorrected OC, compared to 0.92 µg m−3 (43.3 % of uncorrected OC) using the Sunset-TOT before 2008 (Fig. S2). Linear least-square regressions between corrected and uncorrected carbon in Fig. 5 show a slope of 0.52 for OC and 0.56 for TC with good correlations (r=0.93–0.94). Sunset-TOT measurements acquired prior to 2008 are mostly scattered around the regression line, with higher concentrations. On average, about 48 % of the uncorrected OC (0.84 µg m−3) can be attributed to vapour adsorption. The low filter face velocity (15.5 cm s−1) in CAPMoN samples could be one of the contributing factors.
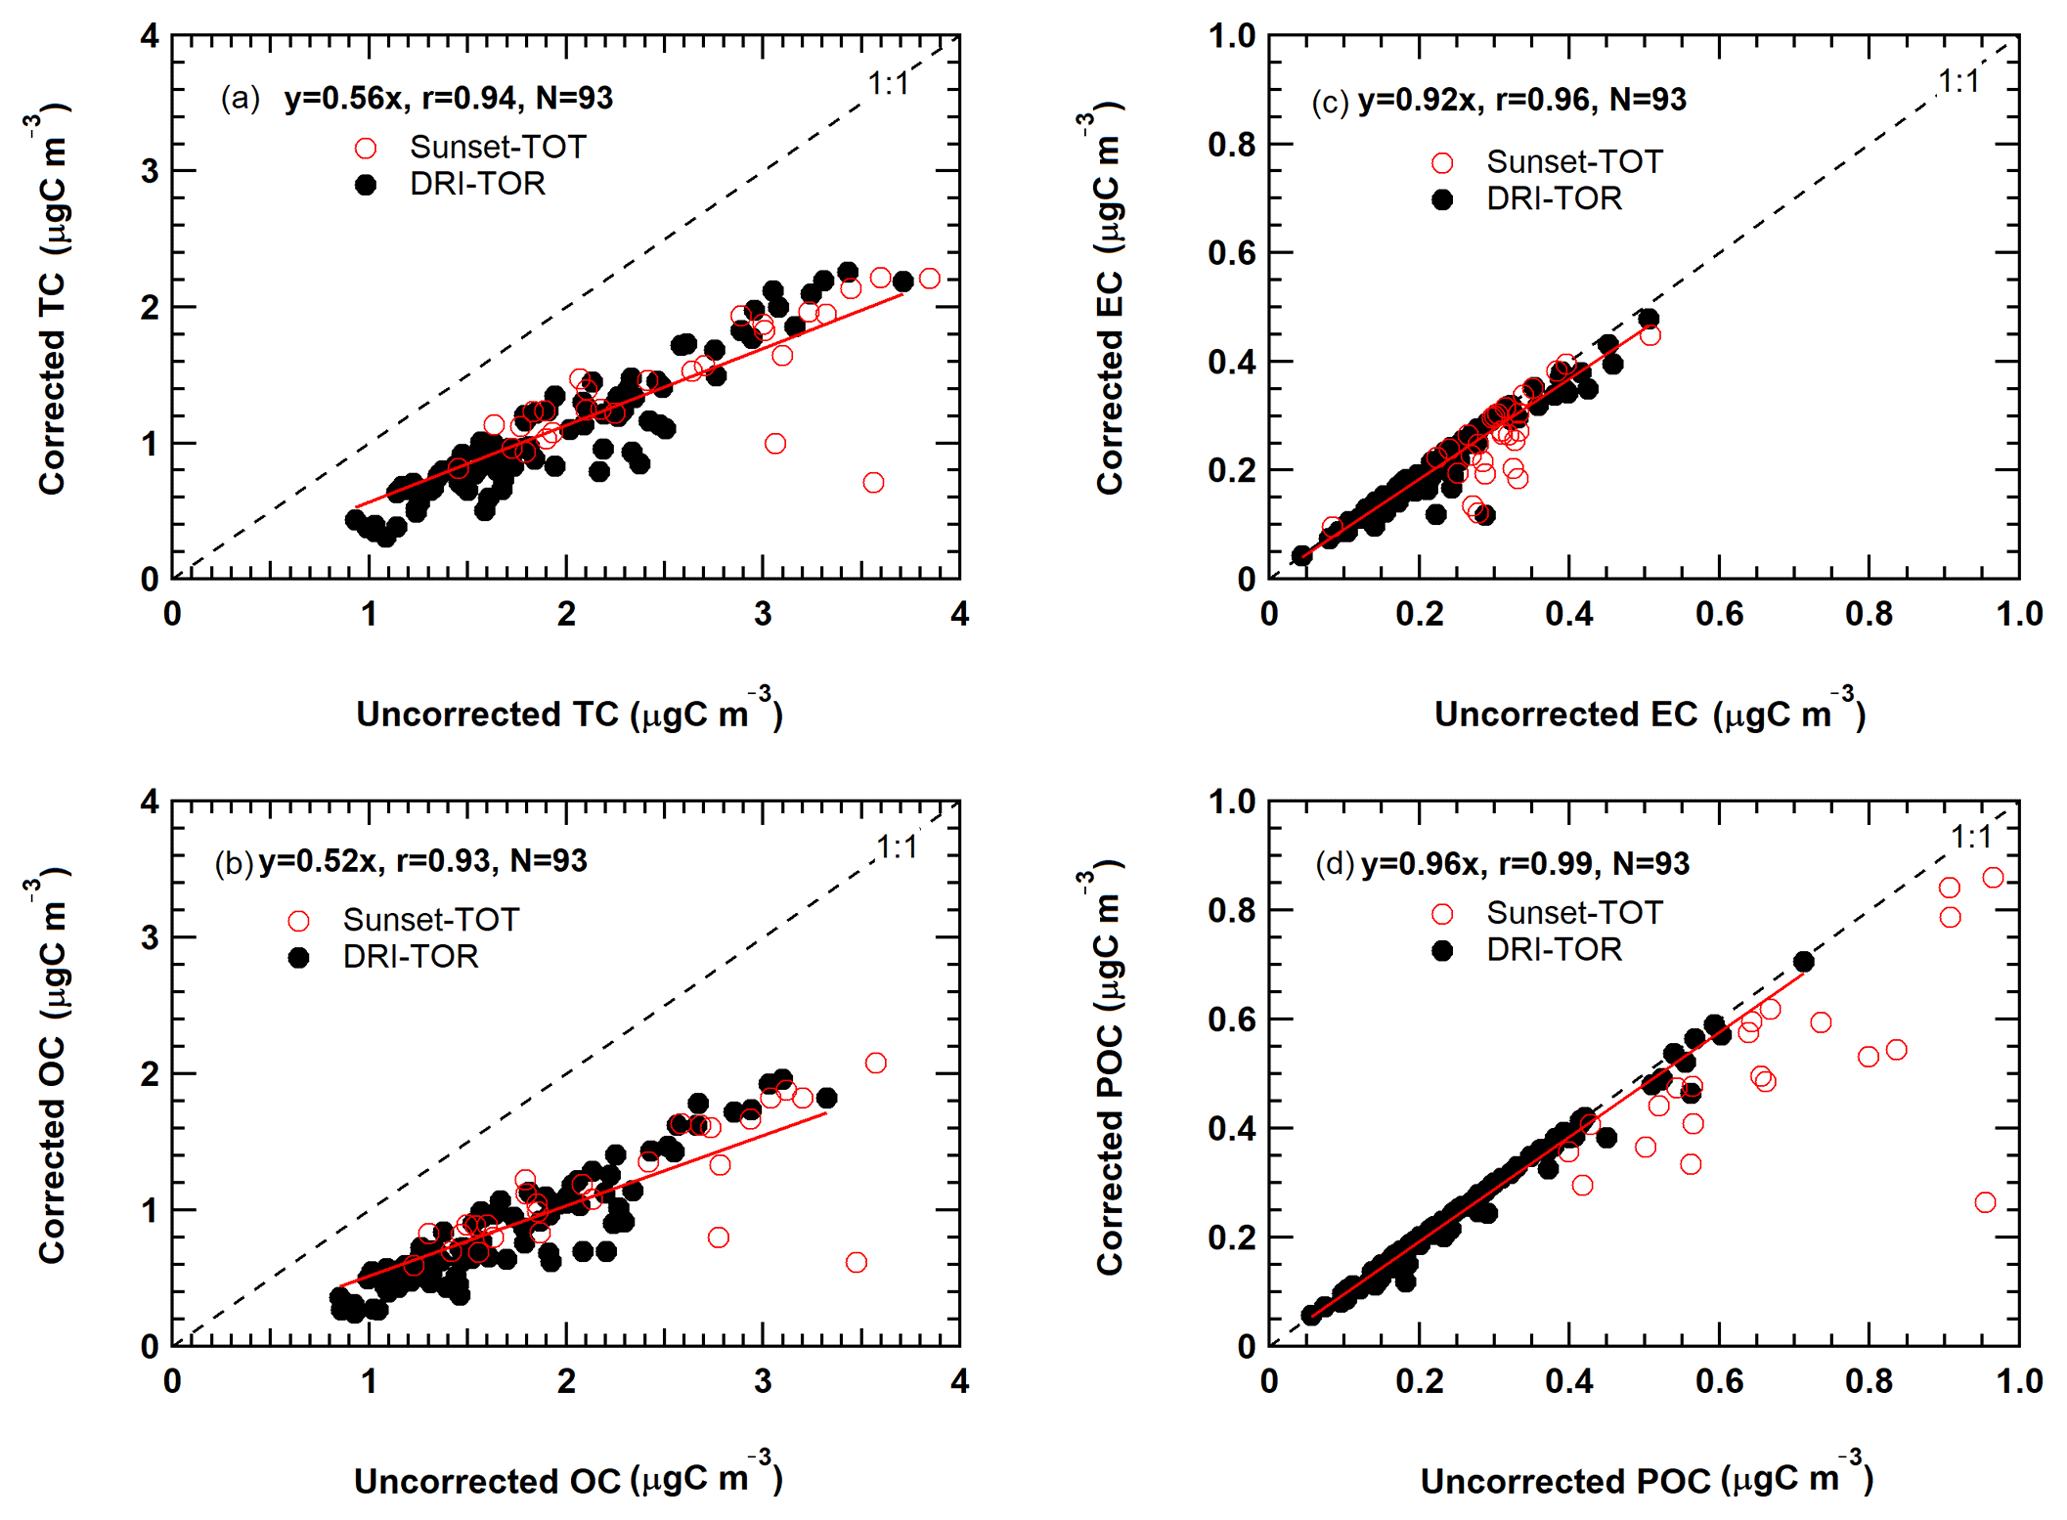
Figure 5Relationship between the monthly averaged CAPMoN vapour adsorption corrected and uncorrected measurements for (a) TC, (b) OC, (c) EC, and (d) POC. Black solid markers represent the TOR measurements (2008–2015) analyzed by the DRI analyzer (i.e., DRI-TOR). Red open markers represent the TOT measurements before 2008 analyzed by the Sunset analyzer (i.e., Sunset-TOT). The red line represents the best-fitted linear regression of all the DRI-TOR measurements through the origin. All the corresponding statistics (i.e., best-fitted slope, correlation coefficient, total number of measurement points) are included in the legend.
Figure 5c indicates that artifact-corrected EC concentrations are 7.8 % (0.02 µg m−3) lower than the uncorrected values. The artifact magnitude is close to the detection limit of 0.022 µg m−3 (0.197 µg m−3) and within analytical uncertainties (Chow et al., 1993). Some Sunset-TOT EC measurements are scattered from the regression line, indicating a more accurate and consistent adsorption correction for DRI-TOR (Fig. 5b). Although not expected to impact EC concentration, vapour adsorption directly affects POC correction and thus influences EC mass determination.
Figure 5d shows that 4.3 % (0.01 µg m−3) of POC was caused by vapour adsorption using the DRI-TOR protocol. For Sunset-TOT, however, up to 21.1 % (0.17 µg m−3) of the POC was detected on the backup filter. Note that POC is part of OC and is a charring correction in the DRI-TOR and Sunset-TOT protocols. Results show that filter transmittance is influenced by both surface and within-filter charring and EC from different sources has been observed to have different filter penetration depths (Chen et al., 2004; Chow et al., 2004). Based on the available information from this study, an optical correction by reflectance appears to be more appropriate and give more consistent results when POC concentration is relatively large compared to EC (Chen et al., 2004). Regardless, the absolute POC and EC concentrations were much lower than OC and the adsorption correction on TC is mostly attributed to the OC artifact.
Since the IMPROVE aerosol samples were acquired at a higher filter face velocity (107.7 cm s−1), it is expected that the magnitude of the vapour adsorption correction would be smaller for the IMPROVE samples. This is supported by the observations from Watson et al. (2009) at six anchor IMPROVE sites (i.e., Mount Rainier National Park, Yosemite National Park, Hance Camp at Grand Canyon National Park, Chiricahua National Monument, Shenandoah National Park, and Okefenokee National Wildlife Refuge), suggesting that vapour adsorption obtained from backup quartz filters represented about 23 % of the uncorrected OC values. Filter fibers are saturated over a long sampling interval (Khalek, 2008; Watson et al., 2009); thus, artifacts for the CABM samples are expected to be relatively lower.
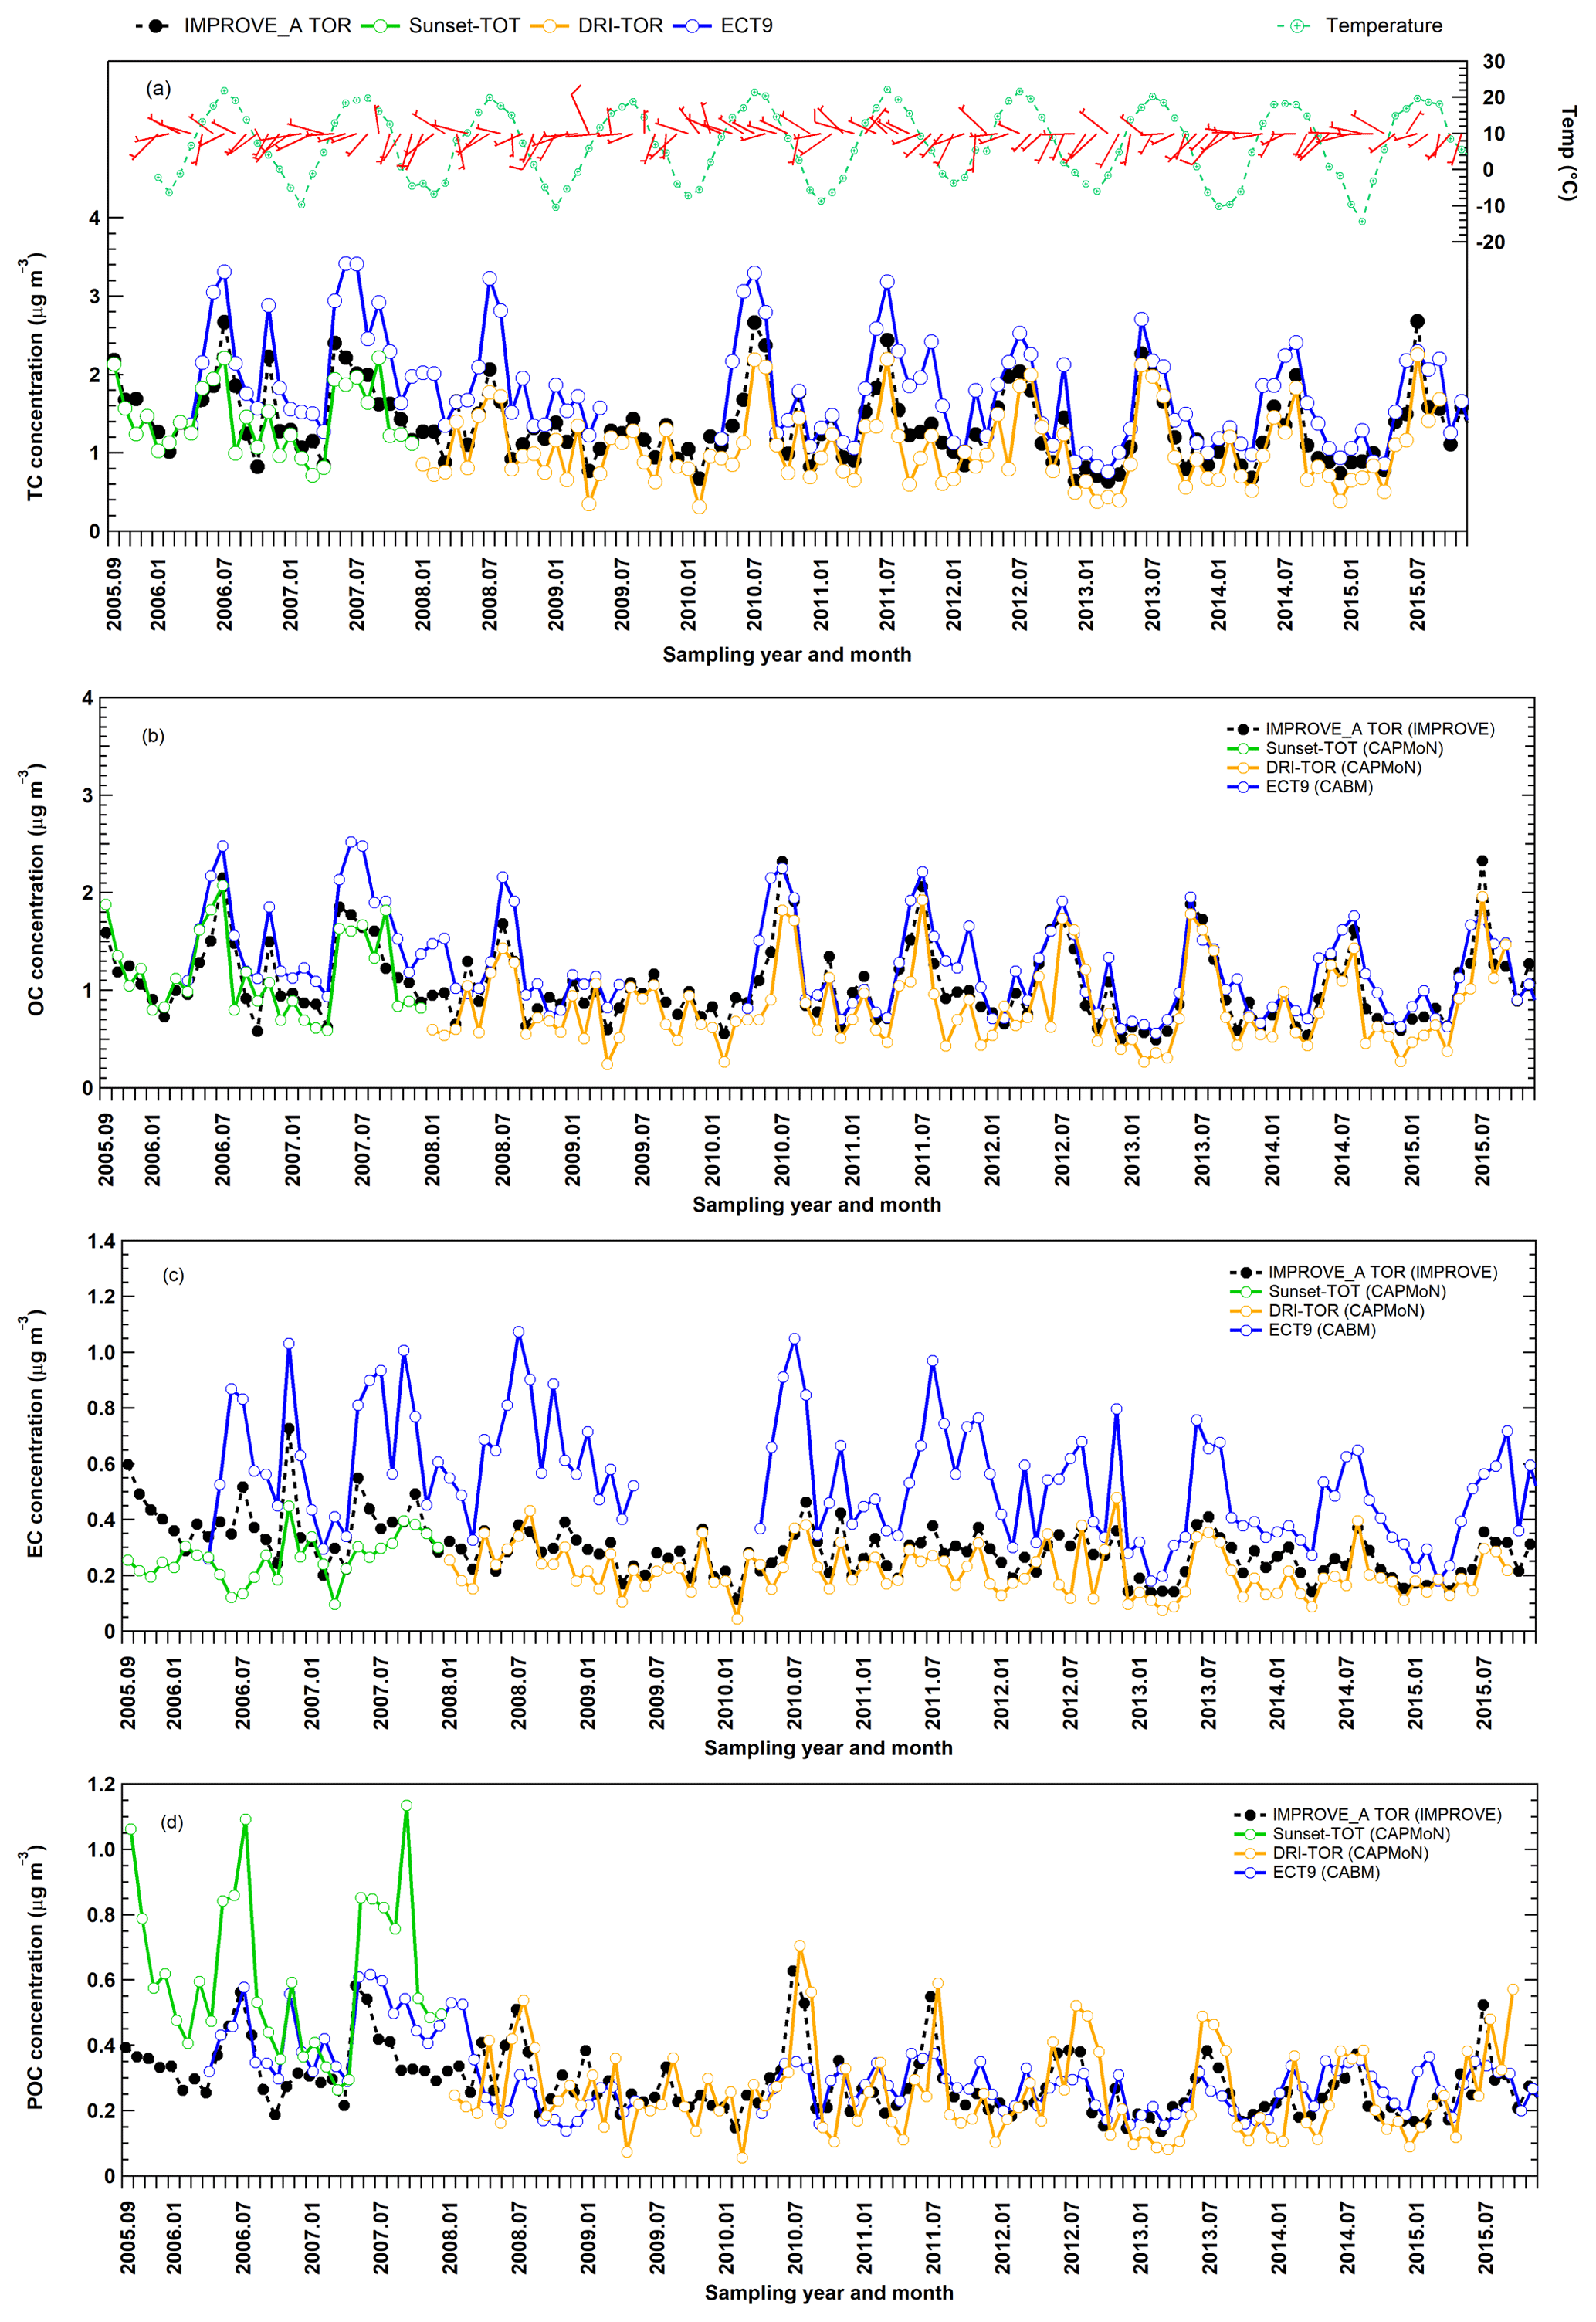
Figure 6Monthly averaged (a) TC, (b) OC, (c) EC, and (d) POC concentration time series obtained from three different networks at Egbert. CAPMoN measurements before 2008 were obtained using the Sunset-TOT method (in green) while measurements starting in 2008 were obtained using the DRI-TOR method (in orange).
Table 2Regression results (slope, correlation coefficient, and total number of points) obtained when fitting various CABM (ECT9) and CAPMoN (Sunset-TOT & DRI-TOR) carbonaceous mass concentration time series against IMPROVE (IMPROVE_A TOR) measurements. IMPROVE_A TOR and ECT9 measurements cover the period from 2005 to 2015. Sunset-TOT and DRI-TOR measurements cover the periods for 2005–2008 and 2008–2015, respectively. Regression 1 indicates the best-fitted slope through the origin. Regression 2 is the best-fitted slope with intercept (in brackets).
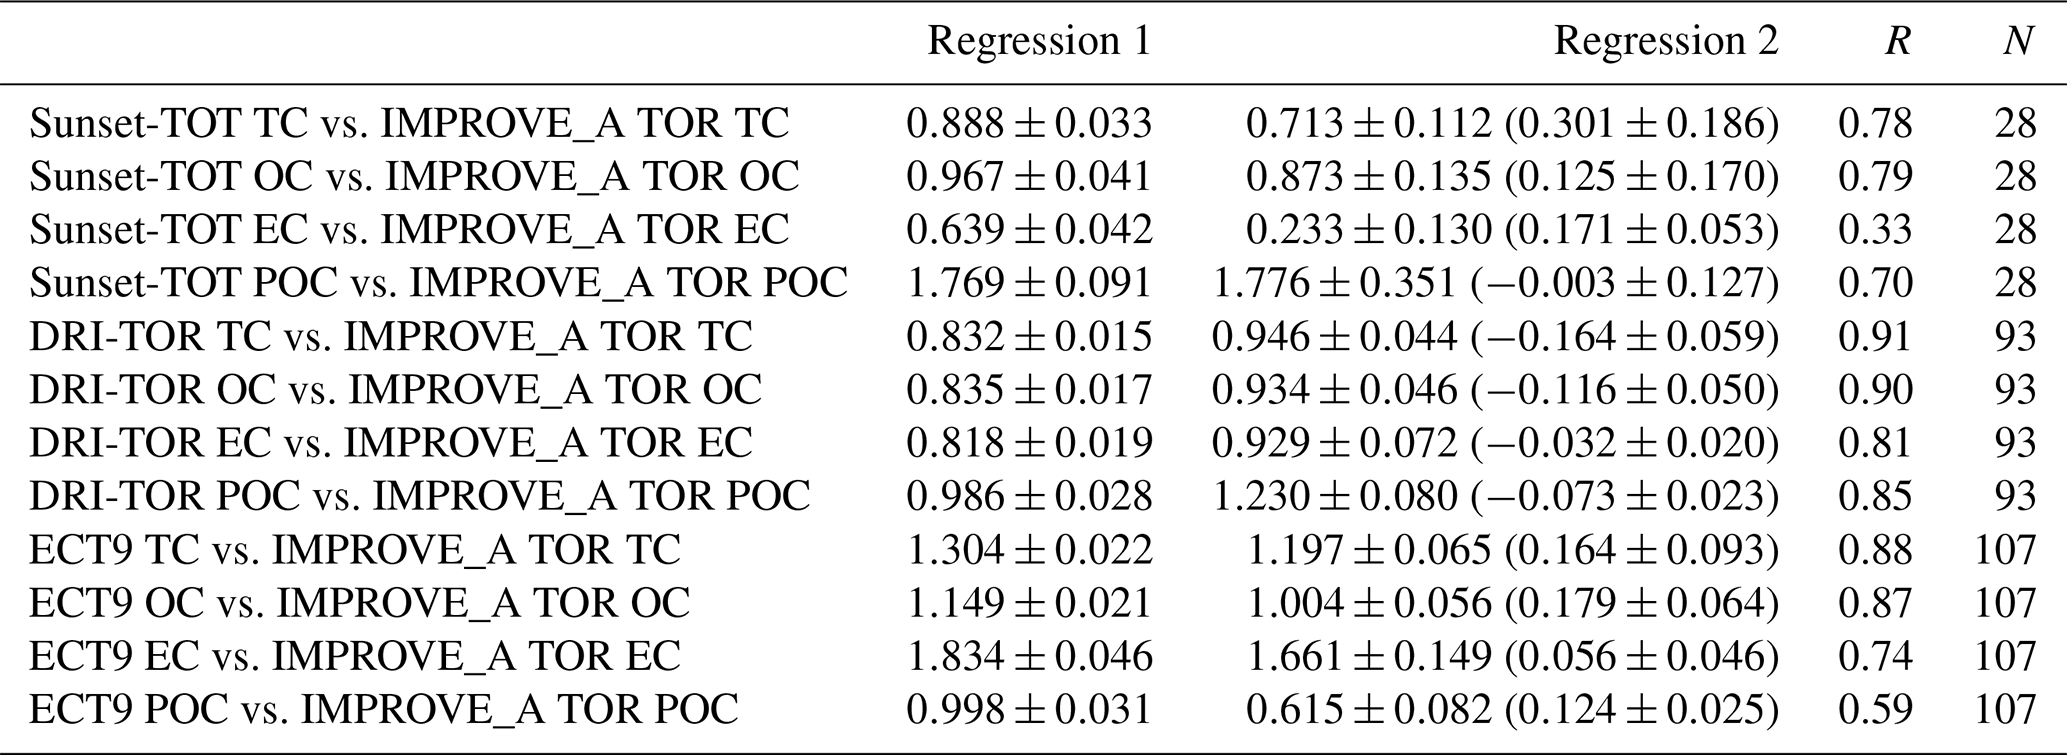
Figure 6 shows the temporal variations in the monthly averaged IMPROVE_A TOR, CAPMoN Sunset-TOT, DRI-TOR, and CABM ECT9 measurements. Also included in the figure are the monthly averaged temperature and the wind direction and speed (expressed in wind barbs). It is evident that better correlations of TC, EC, and OC were found between the protocols that use same POC correction method (DRI-TOR and IMPROVE_A TOR) than between Sunset-TOT (which uses transmittance for POC correction) and IMPROVE_A TOR (Table 2). In particular correlation of EC between Sunset-TOT and IMPROVE_A TOR was poor.
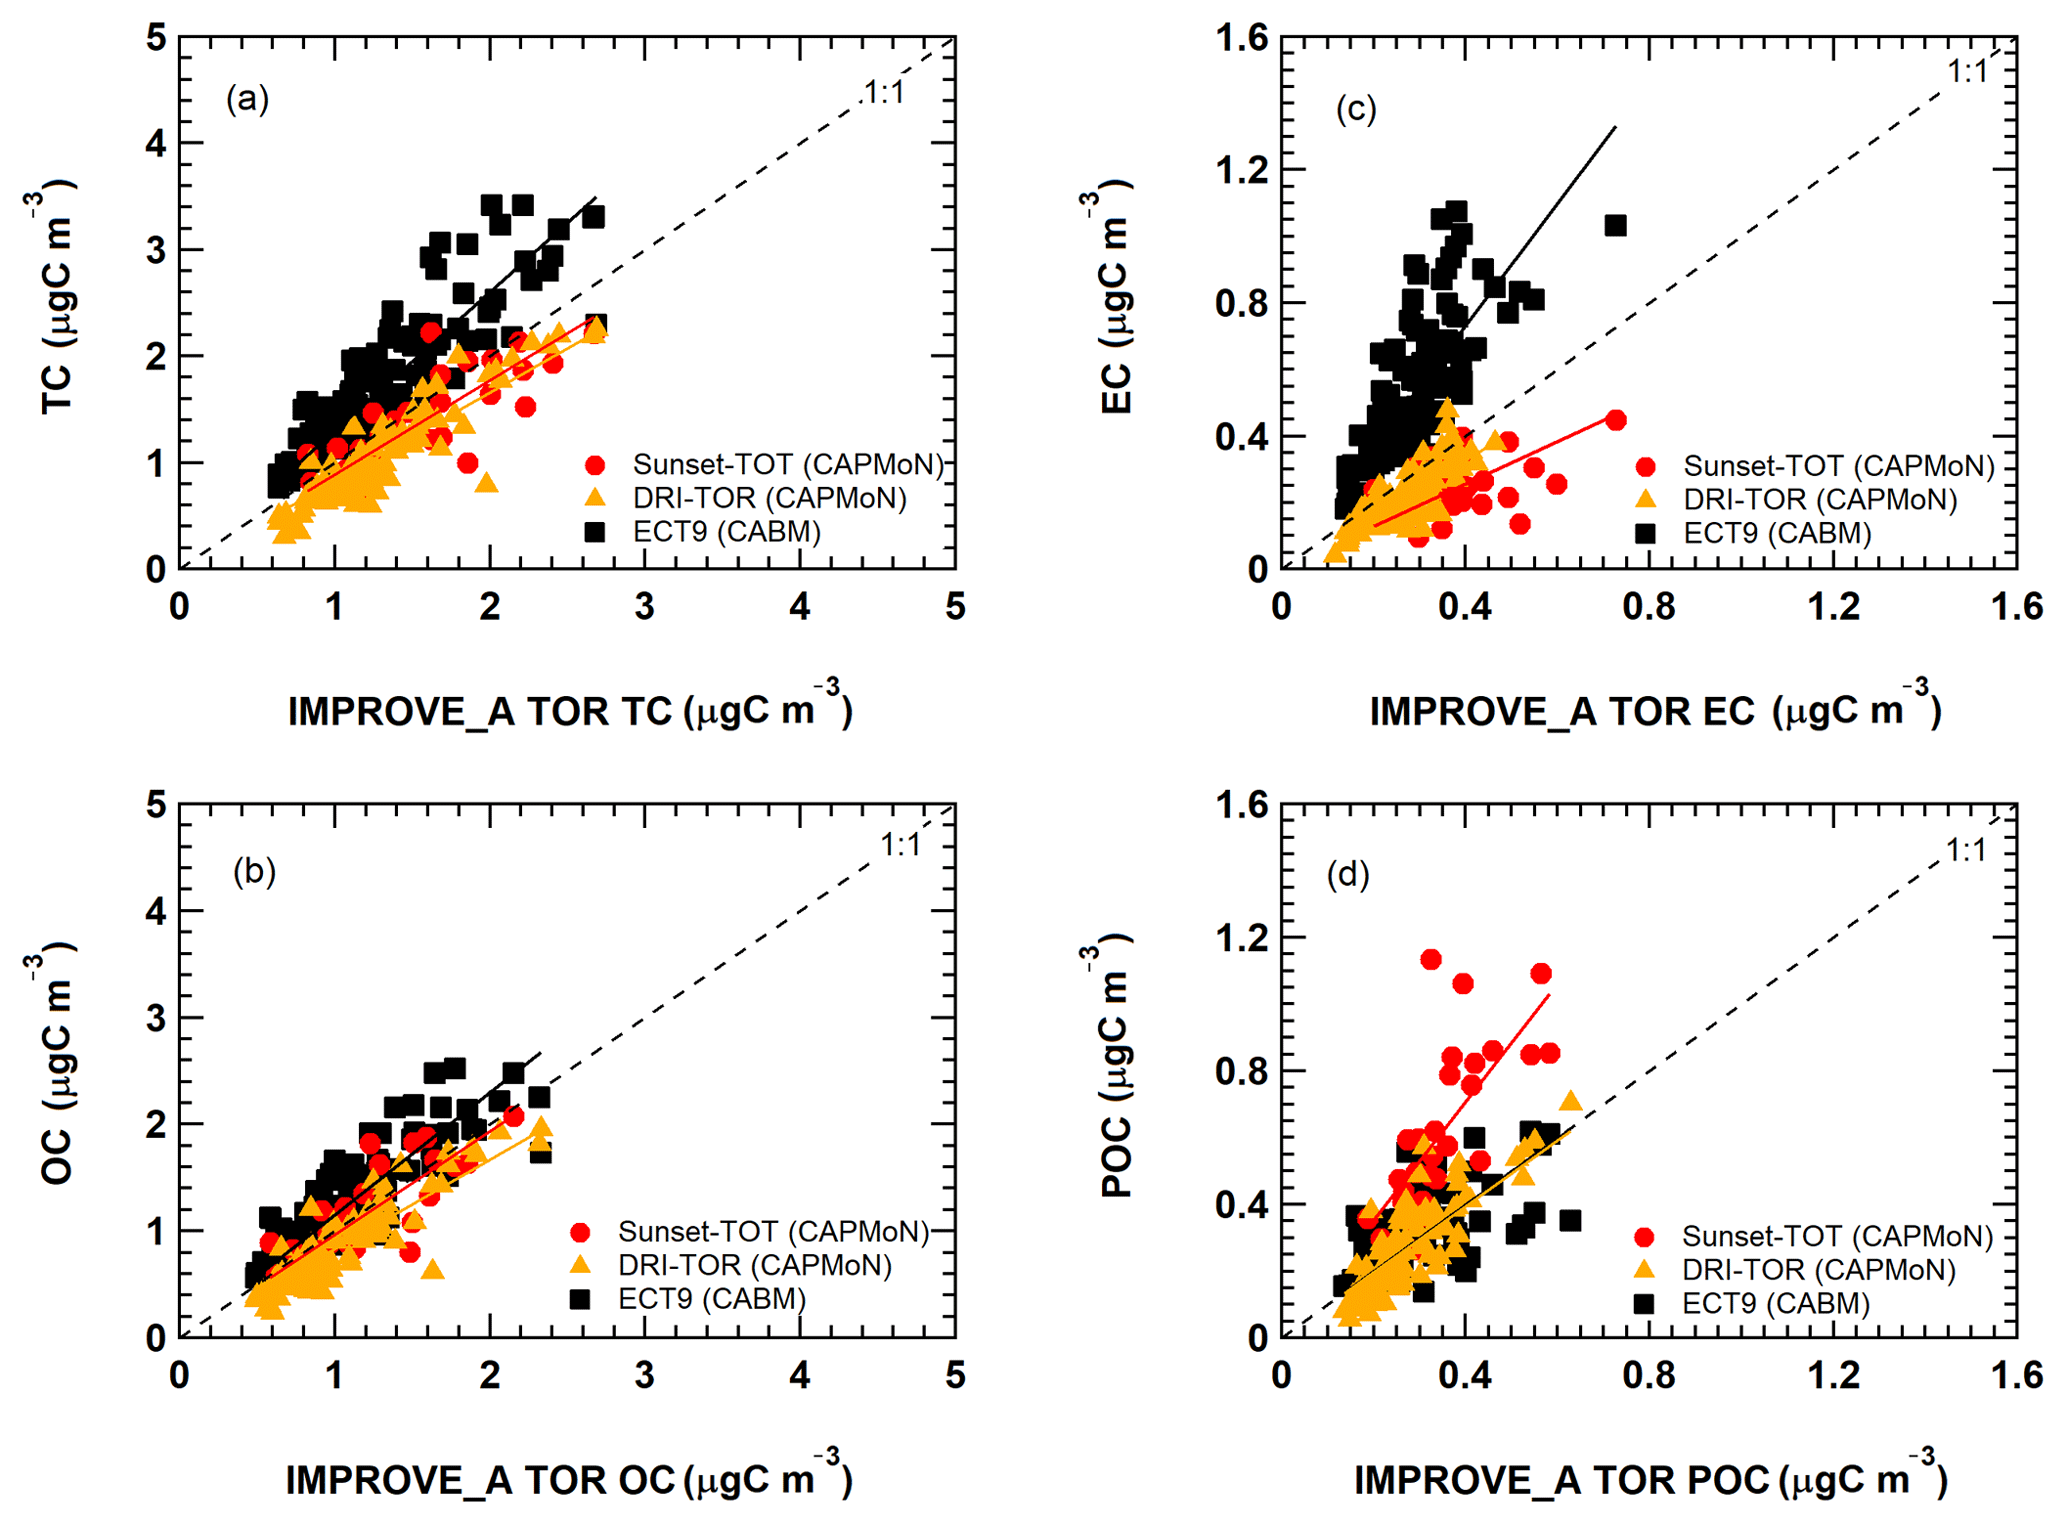
Figure 7Comparison of the monthly averaged carbonaceous mass concentrations from the DRI-TOR (red circles and orange triangles) and ECT9 (black squares) protocols against the IMPROVE_A TOR protocol. The different straight lines represent the linear regression best fitted line through the origin (i.e., Regression 1). The fitted parameters for all corresponding data sets with (Regression 2) and without (Regression 1) the y intercept are summarized in Table 2.
Comparisons of the monthly averaged carbonaceous measurements among different networks are summarized in Fig. 7. When fitting the monthly averaged DRI-TOR and Sunset-TOT measurements to IMPROVE_A TOR measurements using a linear regression fit through the origin, Regression 1 typically yields less than unity slopes (0.64–0.97; Table 2), suggesting that the carbonaceous masses reported by CAPMoN were in general lower than those reported by IMPROVE. Fitting the measurements allowing an intercept, Regression 2 typically yields least-square slopes close to unity (>0.92) with small intercepts.

Figure 8Figure shows the relationship of averaged (a) TC, (b) OC, and (c) EC concentrations from all networks as a function of ambient temperature. Each data point represents the average value of all network measurements within a 3 ∘C temperature range. Uncertainties are standard deviations of the measurements. The red curve represents the best-fitted sigmoid function. Figure 8d shows the seasonality of ECT9 POC compared to the average OC and EC seasonality. The black solid curve represents the best-fitted sigmoid function on all ECT9 POC measurements.
The effect of using transmittance or reflectance for POC determination is apparent. The SunsetTOT POC correction is larger because transmittance is affected by the charred OC within the filter. This is consistent with the larger regression slopes in POC (Regression 1: 1.8) between the Sunset-TOT and IMPROVE_A TOR protocols than the slope in POC (1.0) between the DRI-TOR and IMPROVE_A TOR protocols.
The ECT9 versus IMPROVE_A TOR via Regression 1 slopes are equal to or greater than unity, ranging from 1.0 to 1.8 (Table 2). Linear regression with intercept (i.e., Regression 2) yields lower slopes (0.6–1.7) with positive intercepts (0.06–0.18 µg m−3), signifying higher TC and EC concentrations for ECT9 samples. Higher intercepts (0.12-0.18 µg m−3) for TC, OC, and POC are consistent with ECT9 measurements uncorrected for vapour adsorption. However, the systematically higher TC, OC, and EC by 21 %–25 % via ECT9 relative to those via IMPROVE_A TOR in SRM 8785 could not be simply attributed to the uncorrected vapour adsorption.
Specifically, ECT9 OC concentrations are 15 % higher than the IMPROVE_A TOR measurements (Table 2) with good correlation (r=0.87; Table S2). The ECT9 method yielded 66 %–83 % higher EC than IMPROVE_A TOR, with moderate correlation (r=0.74). Differences in combustion temperatures for OC ∕ EC split determination could contribute to these discrepancies. Heating under an oxidative environment at a constant temperature of 900 ∘C in the ECT9 protocol could combust more highly refractory carbon than the IMPROVE_A TOR protocol, which only heats progressively from 580 to 840 ∘C. Another minor factor could include inhomogeneous deposition of mass loading on the filter spot. When plotted on different scales, Fig. S3 shows that the two EC data sets track well, capturing both long-term trends and seasonal variations.
A slope approaching unity (1.00) was obtained when fitting the ECT9 POC to IMPROVE_A TOR POC through the origin (Fig. 7d). Refitting the data allowing an intercept leads to a slope of 0.62 with a y intercept (0.12; Table 2), comparable in magnitude to the vapour adsorption artifact. The correlation coefficient between ECT9 POC and IMPROVE_A TOR POC is low (r=0.46; Table S3). However, correlation between IMPROVE_A TOR POC and IMPROVE_A TOR OC is much higher (r=0.91), and even to a lesser extent between IMPROVE_A TOR POC and IMPROVE_A TOR EC (r=0.71). In comparison, ECT9 POC has weak correlation with ECT9 OC (r=0.65) and ECT9 EC (r=0.37). These observations show that the POC definition in ECT9 is not dominated by charred OC correction and likely includes the characterization of other oxygenated organic materials as observed in Chan et al. (2010). Additional research is needed to verify if ECT9 POC is proportional to SOA formation.
Figure 6 shows elevated carbon during summer, consistent with the observations from Yang et al. (2011) and Healy et al. (2017). A sigmoid function was applied here to characterize the relationship between ambient carbon concentration and ambient temperature. The sigmoid function has a characteristic “S” shape and represents an integral of a Gaussian function. Relationships between carbon concentrations and ambient temperatures are illustrated in Fig. S5. Apparent increases in OC and TC concentrations are found when ambient temperatures exceed about 10 ∘C, a phenomenon not as apparent in EC. EC from the week-long CABM samples is more scattered.
The TC, OC, and EC from all measurements are averaged and shown in Fig. 8 with the following best-fitted sigmoid functions.
Equations (2)–(4) show that lower limits of the observed TC, OC, and EC concentrations are 1.05, 0.78, and 0.24 µg m−3, with the midpoint of the maximum growth curve occurring at about 23, 20, and 35 ∘C, respectively. The predicted maximum concentrations for TC, OC, and EC are 4.61, 2.62, and 1.69 µg m−3, respectively.
Preliminary analysis based on simple wind roses and a Lagrangian particle dispersion transport model (FLEXible PARTicle dispersion model) (Stohl et al., 2005) was conducted (see the Supplement). Results from the analysis appear to suggest that human activities (e.g., local transportation, residential heating, and industrial activities), biogenic emissions (e.g., monoterpenes) from the boreal forest, SOA formation, biomass burning, and transboundary transport could contribute to the variations in OC and EC at Egbert in a complicated way (Ding et al., 2014; Chan et al., 2010; Leaitch et al., 2011; Passonen et al., 2013; Tunved et al., 2006; Lavoué et al., 2000; Healy et al., 2017), which requires additional research to confirm. At Egbert, increasing ambient temperature from 10 to 20 ∘C leads to higher OC concentrations from 0.84 to 1.61 µg m−3 (91.7 % increase) and EC concentration from 0.31 to 0.45 µg m−3 (45.2 % increase). The temperature dependency of OC and EC suggests a potential climate feedback mechanism consistent with the observations from Leaitch at al. (2011) and Passonen et al. (2013).
Chan et al. (2010) showed that ECT9 POC possesses a positive relationship with oxygenated organics and aged aerosol particles. The seasonality in ECT9 POC is compared with the average OC and EC seasonality observed at Egbert (Fig. 8d). Interestingly, the ECT9 POC concentration does not show a gradual exponential shape of function as for OC and EC. Instead, it shows a small but obvious two-step function when plotted against ambient temperature. The ECT9 POC temperature-dependent results (Fig. 8d) suggest constant sources of background emissions of possible oxygenated organic compounds that are independent of the measured OC, with additional secondary organic compound (SOA) formation at higher temperatures (e.g., >15 ∘C). Future studies are needed to verify this.
A total of 10 years of OC and EC measurements at Egbert were obtained from three independent networks (IMPROVE, CAPMoN, CABM) and observable differences in carbon concentrations were attributed to different sampling methods, analytical protocols, sampling time, and filter artifact corrections. Vapour adsorption did not affect EC values but contributed 20 %–50 % of the measured OC, depending on the sampling filter face velocity. The higher TC and OC concentration of the CABM measurements by 20 %–30 % and 15 %, respectively, compared to the IMPROVE measurements could be partially due to the absence of vapour adsorption correction. These results are consistent with other inter-comparison studies before data adjustments (Hand et al., 2012). The differences in analytical protocol also play a role in causing higher carbon values, supported by the higher TC, OC, and EC values from the SRM8785 analysis obtained by the ECT9 method compared to those by the IMPROVE_A TOR method. Pyrolyzed OC (POC) from ECT9 is shown to be more than a charring correction and more research is needed to develop its relationship with SOA.
Important observations from the inter-comparison study are as follows. (1) CAPMoN DRI-TOR TC, OC, and EC are 5 %–17 %, 7 %–16 %, and 7 %–18 % lower than the corresponding masses from IMPROVE_A TOR. (2) CAPMoN Sunset-TOT TC, OC, and EC are lower than the IMPROVE_A TOR values by up to 30 %, 15 %, and 75 %. (3) CABM TC, OC, and EC by ECT9 are higher than the IMPROVE_A TOR values by 20 %–30 %, 0 %–15 %, and 60 %–80 %, respectively.
Carbon concentrations observed from all three networks exhibited a non-linear positive dependency with ambient temperature, which can be characterized by a sigmoid function. Although further research is needed, preliminary observations suggested that increased anthropogenic activities, urban emissions, SOA formation, forest fire emissions, and long-range transport could have an impact on the observed OC and EC at Egbert. The increase in OC concentration with temperature is consistent with the climate feedback mechanisms reported from various studies. The different characteristic temperature dependency of the ECT9 POC suggests the need for future investigation, which could provide additional insights into SOA formation from acquired carbonaceous measurements.
Long-term measurements play important roles for detecting the trends in atmospheric compositions, constraining their emission changes, and allowing for assessment of the effectiveness of emission mitigation policies at regional scales (WMO, 2016, 2003), provided that the measurements are consistent and comparable across different networks. Recognizing the absence of a universally accepted carbonaceous standard, long-term inter-comparison studies become challenging and even more important. Echoing the recommendations from the World Meteorological Organization (WMO) guidelines and recommendations for long-term aerosol measurements (WMO, 2016, 2003), this study illustrates the importance of measurement consistency (e.g., sampling method–procedures, analytical instrument–method–protocols and data processing, quality assurance and quality control protocols) within a network over a long period of time. As indicated in the guidelines, regular inter-comparison of filter samples should be encouraged. These activities include analyzing exchanged common filter samples and co-located filter samples. In addition, there is a need to develop proper reference materials for assessing comparability and consistency and incorporating the use of such a reference as part of the inter-comparison effort.
The original IMPROVE raw data can be obtained from the Cooperative Institute for Research in the Atmosphere (CIRA) of the Federal Land Manager Environmental Database (FED), Colorado State University, Fort Collins, CO http://views.cira.colostate.edu/fed/ (last access: 13 August 2019). The original CAPMoN raw data can be provided upon request through ec.rcepa-capmon.ec@canada.ca. The original CABM raw data can be provided upon request through lin.huang@canada.ca. Monthly averaged measurements from all networks used in this study are summarized and available in Excel format as part of the Supplement of this paper.
| AIHL | Air-industrial hygiene laboratory |
| AMS | Accelerator mass spectrometry |
| BC | Black carbon |
| CABM | Canadian Aerosol Baseline Measurement |
| CAPMoN | Canadian Air and Precipitation Monitoring Network |
| CARE | Center for Atmospheric Research Experiment |
| CCMR | Climate Chemistry Measurements and Research |
| DRI | Desert Research Institute |
| DRI-TOR | CAPMoN measurements using IMPROVE on DRI analyzer with TOR correction |
| EC | Elemental carbon |
| ECCC | Environment and Climate Change Canada |
| ECT9 | EnCan-Total-900 protocol |
| FID | Flame ionization detector |
| FLEXPART | FLEXible PARTicle dispersion model |
| ICP | Inter-comparison study |
| IMPROVE | Interagency Monitoring Protected Visual Environments |
| IMPROVE_A TOR | IMPROVE_A TOR protocol on DRI analyzer |
| KCCAMS | Keck carbon cycle accelerator mass spectrometry |
| MAC | Mass absorption coefficient |
| NIST | National Institute of Standard and Technology |
| OC | Organic carbon |
| PM | Particulate matter |
| POC | Pyrolyzed organic carbon |
| PSAP | Particle soot absorption photometer |
| SOA | Secondary organic aerosol |
| SRM | Standard Reference Material |
| Sunset-TOT | IMPROVE TOT protocol on Sunset analyzer |
| TC | Total carbon |
| TEA | Thermal evolution analysis |
| TOA | Thermal–optical analysis |
| TOR | Thermal–optical reflectance |
| TOT | Thermal–optical transmittance |
| UCI | University of California Irvine |
| WMO | World Meteorological Organization |
The supplement related to this article is available online at: https://doi.org/10.5194/amt-12-4543-2019-supplement.
TWC and LH designed the study and wrote the paper, with contributions from KB, JCC, XLW, JGW, CIC, GMS, and KJ. KB was responsible for CAPMoN’s data measurements. JCC, JGW, and XLW were responsible for IMPROVE data. LH was responsible for CABM data with technical assistance from WZ and DE. CIC, GMS, and LH were responsible for 14C measurements. SS was responsible for the PSAP data. TWC conducted the data processing. All authors commented on the paper.
The authors declare that they have no conflict of interest.
Authors would like to acknowledge Elton Chan and Douglas Chan of ECCC for providing the FLEXPART model results and providing technical advice. The authors acknowledge Environment and Climate Change Canada's Canadian Aerosol Baseline Measurement, and Canadian Air and Precipitation Monitoring Networks and the United States Interagency Monitoring of Protected Visual Environments for the provision of their elemental and organic carbon mass measurement data. IMPROVE measurements were obtained directly from the IMPROVE website (http://vista.cira.colostate.edu/IMPROVE/Data/QA_QC/Advisory.htm, last access: 13 August 2019). IMPROVE is a collaborative association of state, tribal, and federal agencies and international partners. The U.S. Environmental Protection Agency is the primary funding source, with contracting and research support from the National Park Service. IMPROVE carbon analysis was provided by the Desert Research Institute under the contract number P16PC00229. Funding of this study was initiated by the Climate Change Technology and Innovation Initiative (CCTI) program, operated through Natural Resources Canada (NRCan), and supported by the Clean Air Regulatory Agenda (CARA) initiative and ECCC internal federal funding.
This paper was edited by Pierre Herckes and reviewed by two anonymous referees.
Birch, M. E. and Cary, R. A.: Elemental carbon-based method for monitoring occupational exposures to particulate diesel exhaust, Aerosol Sci. Tech., 25, 221-241, 1996.
Bond, T. C. and Bergstrom, R. W.: Light absorption by carbonaceous particles: An investigative review, Aerosol Sci. Tech., 40, 27–67, 2006.
Bond, T. C., Doherty, S. J., Fahey, D. W., Forster, P. M., Berntsen, T., DeAngelo, B. J., Flanner, M. G., Ghan, S., Karcher, B., Koch, D., Kinne, S., Kondo, Y., Quinn, P. K., Sarofim, M. C., Schultz, M. G., Schulz, M., Venkataraman, C., Zhang, H., Zhang, S., Bellouin, N., Guttikunda, S. K., Hopke, P. K., Jacobson, M. Z., Kaiser, J. W., Klimont, Z., Lohmann, U., Schwarz, J. P., Shindell, D., Storelvmo, T., Warren, S. G., and Zender, C. S.: Bounding the role of black carbon in the climate system: A scientific assessment, J. Geophys. Res.-Atmos., 118, 5380–5552, 2013.
Cachier, H., Bremond, M. P., and Buat-Ménard, P.: Thermal separation of soot carbon, Aerosol Sci. Tech., 10, 358–364, 1989.
Cavalli, F., Viana, M., Yttri, K. E., Genberg, J., and Putaud, J.-P.: Toward a standardised thermal-optical protocol for measuring atmospheric organic and elemental carbon: the EUSAAR protocol, Atmos. Meas. Tech., 3, 79–89, https://doi.org/10.5194/amt-3-79-2010, 2010.
Cavanagh, R. R. and Watters Jr., R. L.: National Institute of Standards and Technology: Report of Investigation Reference Material 8785: Air particulate matter on filter media, A fine fraction of SRM 1649a urban dust on quartz-fiber filter, 2005.
Chan, T. W. and Mozurkewich, M.: Application of absolute principal component analysis to size distribution data: identification of particle origins, Atmos. Chem. Phys., 7, 887–897, https://doi.org/10.5194/acp-7-887-2007, 2007.
Chan, T. W., Huang, L., Leaitch, W. R., Sharma, S., Brook, J. R., Slowik, J. G., Abbatt, J. P. D., Brickell, P. C., Liggio, J., Li, S.-M., and Moosmüller, H.: Observations of OM ∕ OC and specific attenuation coefficients (SAC) in ambient fine PM at a rural site in central Ontario, Canada, Atmos. Chem. Phys., 10, 2393–2411, https://doi.org/10.5194/acp-10-2393-2010, 2010.
Chen, L.-W. A., Chow, J. C., Watson, J. G., Moosmüller, H., and Arnott, W. P.: Modeling reflectance and transmittance of quartz-fiber filter samples containing elemental carbon particles: Implications for thermal/optical analysis, J. Aerosol Sci., 35, 765–780, 2004.
Chen, L.-W. A., Chow, J. C., Watson, J. G., and Schichtel, B. A.: Consistency of long-term elemental carbon trends from thermal and optical measurements in the IMPROVE network, Atmos. Meas. Tech., 5, 2329–2338, https://doi.org/10.5194/amt-5-2329-2012, 2012.
Chow, J. C., Watson, J. G., Pritchett, L. C., Pierson, W. R., Frazier, C. A., and Purcell, R. G.: The DRI Thermal/Optical Reflectance carbon analysis system: Description, evaluation and applications in U.S. air quality studies, Atmos. Environ., 27, 1185–1201, 1993.
Chow, J. C., Watson, J. G., Crow, D., Lowenthal, D. H., and Merrifield, T. M.: Comparison of IMPROVE and NIOSH carbon measurements, Aerosol Sci. Tech., 34, 23–34, 2001.
Chow, J. C., Watson, J. G., Chen, L.-W. A., Arnott, W. P., Moosmüller, H., and Fung, K. K.: Equivalence of elemental carbon by Thermal/Optical Reflectance and Transmittance with different temperature protocols, Environ. Sci. Technol., 38, 4414–4422, 2004.
Chow, J. C., Watson, J. G., Louie, P. K. K., Chen, L.-W. A., and Sin, D.: Comparison of PM2.5 carbon measurement methods in Hong Kong, China, Environ. Poll., 137, 334–344, 2005.
Chow, J. C., Watson, J. G., Chen, L.-W. A., Chang, M.-C. O., Robinson, N. F., Trimble, D. L., and Kohl, S. D.: The IMPROVE_A temperature protocol for thermal/optical carbon analysis: Maintaining consistency with a long-term database, J. Air Waste Manage. Assoc., 57, 1014–1023, 2007.
Chow, J. C., Watson, J. G., Lowenthal, D. H., and Chen, L.-W. A.: Climate change – Characterization of black carbon and organic carbon air pollution emissions and evaluation of measurement methods Phase II: Characterization of black carbon and organic carbon source emissions, Desert Research Institute, Reno, NVDRI 04-307, 2009.
Chow, J. C., Bachmann, J. D., Kinsman, J. D., Legge, A. H., Watson, J. G., Hidy, G. M., and Pennell, W. R.: Multipollutant air quality management: Critical review discussion, J. Air Waste Manage. Assoc., 60, 1151–1164, 2010.
Collaud Coen, M., Andrews, E., Asmi, A., Baltensperger, U., Bukowiecki, N., Day, D., Fiebig, M., Fjaeraa, A. M., Flentje, H., Hyvärinen, A., Jefferson, A., Jennings, S. G., Kouvarakis, G., Lihavainen, H., Lund Myhre, C., Malm, W. C., Mihapopoulos, N., Molenar, J. V., O'Dowd, C., Ogren, J. A., Schichtel, B. A., Sheridan, P., Virkkula, A., Weingartner, E., Weller, R., and Laj, P.: Aerosol decadal trends – Part 1: In-situ optical measurements at GAW and IMPROVE stations, Atmos. Chem. Phys., 13, 869–894, https://doi.org/10.5194/acp-13-869-2013, 2013.
Countess, R. J.: Interlaboratory analyses of carbonaceous aerosol samples, Aerosol Sci. Tech., 12, 114–121, 1990.
Currie, L. A., Benner, B. A., Jr., Cachier, H., Cary, R., Chow, J. C., Druffel, E. R. M., Eglinton, T. I., Gustafsson, Ö., Hartmann, P. C., Hedges, J. I., Kessler, J. D., Kirchstetter, T. W., Klinedinst, D. B., Klouda, G. A., Marolf, J. V., Masiello, C. A., Novakov, T., Pearson, A., Prentice, K. M., Puxbaum, H., Quinn, J. G., Reddy, C. M., Schmid, H., Slater, J. F., Watson, J. G., and Wise, S. A.: A critical evaluation of interlaboratory data on total, elemental, and isotopic carbon in the carbonaceous particle reference material, NIST SRM 1649a, J. Res. Natl. Inst. Stan., 107, 279–298, 2002.
Ding, L., Chan, T. W., Ke, F. and Wang, D. K. W.: Characterization of chemical composition and concentration of fine particulate matter during a transit strike in Ottawa, Canada, Atmos. Environ., 89, 433–442, 2014.
Flagan, R. C. and Seinfeld, J. H.: Fundamentals of Air Pollution Engineering, Prentice Hall, Englewood Cliffs, NJ, 391–478, 1988.
Fuller, K. A., Malm, W. C., and Kreidenweis, S. M.: Effects of mixing on extinction by carbonaceous particles, J. Geophys. Res., 104, 15941–15954, 1999.
Fung, K. K.: Particulate carbon speciation by MnO2 oxidation, Aerosol Sci. Tech., 12, 122–127, 1990.
Han, Y. M., Cao, J. J., An, Z., Chow, J. C., Watson, J. G., Jin, Z. D., Fung, K. K., and Liu, S.: Evaluation of the thermal/optical reflectance method for quantification of elemental carbon in sediments, Chemosphere, 69, 526–533, 2007.
Hand, J. L., Schichtel, B. A., Pitchford, M., Malm, W. C., and Frank, N. H.: Seasonal composition of remote and urban fine particulate matter in the United States, J. Geophys. Res., 117, D05209, https://doi.org/10.1029/2011JD017122, 2012.
Healy, R. M., Sofowote, U., Su, Y., Debosz, J., Noble, M., Jeong, C. H., Wang, J. M., Hilker, N., Evans, G. J., Doerksen, G., Jones, K., and Munoz, A.: Ambient measurements and source apportionment of fossil fuel and biomass burning black carbon in Ontario, Atmos. Environ., 161, 34–47, 2017.
Heintzenberg, J.: Fine particles in the global troposphere: A review, Tellus, 41, 149–160, 1989.
Hinds, W. C.: Straight-line acceleration and curvilinear particle motion, in: Aerosol Technology, Properties, Behavior, and Measurement of airborne Particles, 2 Edn., John Wiley & Sons, Inc., New York, 111–140, 1999.
Huang, L., Brook, J. R., Zhang, W., Li, S. M., Graham, L., Ernst, D., Chivulescu, A., and Lu, G.: Stable isotope measurements of carbon fractions (OC ∕ EC) in airborne particulate: A new dimension for source characterization and apportionment, Atmos. Environ., 40, 2690–2705, 2006.
Huang, L.: The issue of harmonizing the methodologies for emission inventories of GHGs with those of SLCFs (in terms of measurement perspective), IPCC Expert Meeting on Short Lived Climate Forcers, Geneva, 28–31 May 2019, available at: https://www.ipcc-nggip.iges.or.jp/public/mtdocs/1805_Geneva.html (last access: 13 August 2019), 2018.
Huntzicker, J. J., Johnson, R. L., Shah, J. J., and Cary, R. A.: Analysis of organic and elemental carbon in ambient aerosols by a thermal-optical method, in: Particulate Carbon: Atmospheric Life Cycle, edited by: Wolff, G. T. and Klimisch, R. L., Plenum Press, New York, NY, 79–88, 1982.
Japar, S. M., Brachaczek, W. W., Gorse, R. A., Norbeck, J. H., and Pierson, W. R.: The contribution of elemental carbon to the optical properties of rural atmospheric aerosols, Atmos. Environ., 20, 1281–1289, 1986.
Khalek, I. A.: 2007 diesel particulate measurement research, Coordinating Research Council, Alpharetta, GA, Report #E-66, 1–21, 2008.
Kittelson, D. B.: Engines and nanoparticles: A review, J. Aerosol Sci., 29, 575–588, 1998.
Klouda, G. A., Filliben, J. J., Parish, H. J., Chow, J. C., Watson, J. G., and Cary, R. A.: Reference material 8785: Air particulate matter on filter media, Aerosol Sci. Tech., 39, 173–183, 2005.
Lavoué, D., Liousse, C., Cachier, H., Stocks, B. J., and Goldammer, J. G.: Modeling of carbonaceous particles emitted by boreal and temperate wildfires at northern latitudes, J. Geophys. Res.-Atmos., 105, 26871–26890, 2000.
Leaitch, W. R., MacDonald, A. M., Brickell, P. C., Liggio, J., Sjostedt, S. J., Vlasenko, A., Bottenheim, J. W., Huang, L., Li, S. M., Liu, P. S. K., Toom-Sauntry, D., Hayden, K. A., Sharma, S., Shantz, N. C., Wiebe, H. A., Zhang, W., Abbatt, J. P. D., Slowik, J. G., Chang, R. Y. W., Russell, L. M., Schwartz, R. E., Takahama, S., Jayne, J. T., and Ng, N. L.: Temperature response of the submicron organic aerosol from temperate forests, Atmos. Environ., 45, 6696–6704, 2011.
Lesins, G., Chylek, P., and Lohmann, U.: A study of internal and external mixing scenarios and its effect on aerosol optical properties and direct radiative forcing, J. Geophys. Res., 107, 4904, https://doi.org/10.1029/2001JD000973, 2002.
Malm, W. C.: Atmospheric haze: Its sources and effects on visibility in rural areas of the continental United States, Env. Mon. Ass., 12, 203–225, 1989.
Malm, W. C., Sisler, J. F., Huffman, D., Eldred, R. A., and Cahill, T. A.: Spatial and seasonal trends in particle concentration and optical extinction in the United States, J. Geophys. Res., 99, 1347–1370, 1994.
Malm, W. C., Schichtel, B. A., and Pitchford, M. L.: Uncertainties in PM2.5 gravimetric and speciation measurements and what we can learn from them, J. Air Waste Manage., 61, 1131–1149, 2011.
May, W. E. and Trahey, N. M.: National Institute of Standards and Technology: Certificate of Analysis Standard Reference Material 1649a: Urban dust, 1–21, 2001.
McDow, S. R. and Huntzicker, J. J.: Vapor adsorption artifact in the sampling of organic aerosol: Face velocity effects, Atmos. Environ., 24, 2563–2571, 1990.
Paasonen, P., Asmi, A., Petäjä, T., Kajos, M. K., Äijälä, M., Junninen, H., Holst, T., Abbatt, J. P. D., Arneth, A., Birmili, W., van der Gon, H. D., Hamed, A., Hoffer, A., Laakso, L., Laaksonen, A., Leaitch, W. R., Plass-Dülmer, C., Pryor, S. C., Räisänen, P., Swietlicki, E., Wiedensohler, A., Worsnop, D. R., Kerminen, V. M., and Kulmala, M.: Warming-induced increase in aerosol number concentration likely to moderate climate change, Nat. Geosci., 6, 438–442, 2013.
Petzold, A., Ogren, J. A., Fiebig, M., Laj, P., Li, S.-M., Baltensperger, U., Holzer-Popp, T., Kinne, S., Pappalardo, G., Sugimoto, N., Wehrli, C., Wiedensohler, A., and Zhang, X.-Y.: Recommendations for reporting “black carbon” measurements, Atmos. Chem. Phys., 13, 8365–8379, https://doi.org/10.5194/acp-13-8365-2013, 2013.
Rupakheti, M., Leaitch, W. R., Lohmann, U., Hayden, K., Brickell, P., Lu, G., Li, S. M., Toom-Sauntry, D., Bottenheim, J. W., Brook, J. R., Vet, R., Jayne, J. T., and Worsnop, D. R.: An intensive study of the size and composition of submicron atmospheric aerosols at a rural site in Ontario, Canada, Aerosol Sci. Tech., 39, 722–736, 2005.
Santos, G. M., Moore, R., Southon, J., Griffin, S., Hinger, E., and Zhang, D.: AMS 14C preparation at the KCCAMS/UCI Facility: Status report and performance of small samples, Radiocarbon, 49, 255–269, 2007.
Schulz, M., Textor, C., Kinne, S., Balkanski, Y., Bauer, S., Berntsen, T., Berglen, T., Boucher, O., Dentener, F., Guibert, S., Isaksen, I. S. A., Iversen, T., Koch, D., Kirkevåg, A., Liu, X., Montanaro, V., Myhre, G., Penner, J. E., Pitari, G., Reddy, S., Seland, Ø., Stier, P., and Takemura, T.: Radiative forcing by aerosols as derived from the AeroCom present-day and pre-industrial simulations, Atmos. Chem. Phys., 6, 5225–5246, https://doi.org/10.5194/acp-6-5225-2006, 2006.
Schwarz, J. P., Gao, R. S., Fahey, D. W., Thomson, D. S., Watts, L. A., Wilson, J. C., Reeves, J. M., Darbeheshti, M., Baumgardner, D. G., Kok, G. L., Chung, S. H., Schulz, M., Hendricks, J., Lauer, A., Kärcher, B., Slowik, J. G., Rosenlof, K. H., Thompson, T. L., Langford, A. O., Loewenstein, M., and Aikin, K. C.: Single-particle measurements of midlatitude black carbon and light-scattering aerosols from the boundary layer to the lower stratosphere, J. Geophys. Res., 111, D16207, https://doi.org/10.1029/2006JD007076, 2006.
Slowik, J. G., Stroud, C., Bottenheim, J. W., Brickell, P. C., Chang, R. Y.-W., Liggio, J., Makar, P. A., Martin, R. V., Moran, M. D., Shantz, N. C., Sjostedt, S. J., van Donkelaar, A., Vlasenko, A., Wiebe, H. A., Xia, A. G., Zhang, J., Leaitch, W. R., and Abbatt, J. P. D.: Characterization of a large biogenic secondary organic aerosol event from eastern Canadian forests, Atmos. Chem. Phys., 10, 2825–2845, https://doi.org/10.5194/acp-10-2825-2010, 2010.
Stohl, A., Forster, C., Frank, A., Seibert, P., and Wotawa, G.: Technical note: The Lagrangian particle dispersion model FLEXPART version 6.2, Atmos. Chem. Phys., 5, 2461–2474, https://doi.org/10.5194/acp-5-2461-2005, 2005.
Sutter, B., Bemer, D., Appert-Collin, J. C., Thomas, D., and Midoux, N.: Evaporation of liquid semi-volatile aerosols collected on fibrous filters, Aerosol Sci. Tech., 44, 395–404, 2010.
Tunved, P., Hansson, H. C., Kerminen, V. M., Strom, J., Dal Maso, M., Lihavainen, H., Viisanen, Y., Aalto, P. P., Komppula, M., and Kulmala, M.: High natural aerosol loading over boreal forests, Science, 312, 261–263, 2006.
Turpin, B. J., Huntzicker, J. J., and Hering, S. V.: Investigation of organic aerosol sampling artifacts in the Los Angeles Basin, Atmos. Environ., 28, 3061–3071, 1994.
Viana, M., Chi, X., Maenhaut, W., Cafmeyer, J., Querol, X., Alastuey, A., Mikuska, P., and Vecera, Z.: Influence of sampling artefacts on measured PM, OC, and EC levels in carbonaceous aerosols in an urban area, Aerosol Sci. Tech., 40, 107–117, 2006.
Watson, J. G., Chow, J. C., Shah, J. J., and Pace, T. G.: The effect of sampling inlets on the PM10 and PM15 to TSP concentration ratios, J. Air Pollut. Control Assoc., 33, 114–119, 1983.
Watson, J. G.: Critical review: Visibility: Science and regulation, J. Air Waste Manage., 52, 628–713, 2002.
Watson, J. G., Chow, J. C., and Chen, L.-W. A.: Summary of organic and elemental carbon/black carbon analysis methods and intercomparisons, Aerosol Air Qual. Res., 5, 65–102, 2005.
Watson, J. G., Chow, J. C., Chen, L. W. A., and Frank, N. H.: Methods to assess carbonaceous aerosol sampling artifacts for IMPROVE and other long-term networks, J. Air Waste Manage., 59, 898–911, 2009.
Watson, J. G., Chow, J. C., Chen, L.-W. A., and Wang, X. L.: Measurement system evaluation for fugitive dust emissions detection and quantification, Desert Research Institute, Reno, NV, 1–92, 2010.
Watson, J. G. and Chow, J. C.: Ambient aerosol sampling in: Aerosol Measurement: Principles, techniques and applications, 3 Edn., edited by: Kulkarni, P., Baron, P. A., and Willeke, K., 591–614, Hoboken, NJ, USA, Wiley, 2011.
WMO/GAW aerosol measurement procedure: Guidelines and recommendations, WMO TD No. 1178, 8–21, 2003.
WMO/GAW aerosol measurement procedures: Guidelines and recommendations, 2 Edn., WMO-No. 1177, 15–30, 2016.
Yang, F., Huang, L., Sharma, S., Brook, J. R., Zhang, W., Li, S. M., and Tan, J. H.: Two-year observations of fine carbonaceous particles in variable sampling intervals, Atmos. Environ., 45, 2418–2426, 2011.
Yang, H. and Yu, J. Z.: Uncertainties in charring correction in the analysis of elemental and organic carbon in atmospheric particles by thermal/optical methods, Environ. Sci. Technol., 36, 5199–5204, 2002.
Yu, S. C., Dennis, R. L., Bhave, P. V., and Eder, B. K.: Primary and secondary organic aerosols over the United States: Estimates on the basis of observed organic carbon (OC) and elemental carbon (EC), and air quality modeled primary OC ∕ EC ratios, Atmos. Environ., 38, 5257–5268, 2004.
- Abstract
- Introduction
- Sampling and measurements
- Results and discussions
- Comparison among IMPROVE, CAPMoN, and CABM measurements
- Seasonality in carbon concentration and possible origination
- Summary of the inter-comparison study
- Suggestions going forward
- Data availability
- Appendix A: Nomenclature
- Author contributions
- Competing interests
- Acknowledgements
- Review statement
- References
- Supplement