the Creative Commons Attribution 4.0 License.
the Creative Commons Attribution 4.0 License.
 | 06 Sep 2019
Determination of n-alkanes, polycyclic aromatic hydrocarbons and hopanes in atmospheric aerosol: evaluation and comparison of thermal desorption GC-MS and solvent extraction GC-MS approaches
Meng Wang
Ru-Jin Huang
Junji Cao
Wenting Dai
Jiamao Zhou
Chunshui Lin
Haiyan Ni
Jing Duan
Ting Wang
Yang Chen
Yongjie Li
Imad El Haddad
Thorsten Hoffmann
Organic aerosol (OA) constitutes a large fraction of fine particulate matter (PM) in the urban air. However, the chemical nature and sources of OA are not well constrained. Quantitative analysis of OA is essential for understanding the sources and atmospheric evolution of fine PM, which requires accurate quantification of some organic compounds (e.g., markers). In this study, two analytical approaches, i.e., thermal desorption (TD) gas chromatography mass spectrometry (GC-MS) and solvent extract (SE) GC-MS, were evaluated for the determination of n-alkanes, polycyclic aromatic hydrocarbons (PAHs) and hopanes in ambient aerosol. For the SE approach, the recovery obtained is 89.3 %–101.5 %, the limits of detection (LODs) are 0.05–1.1 ng (1.5–33.9 ng m−3), repeatability is 3.5 %–14.5 % and reproducibility is 1.2 %–10.9 %. For the TD approach, the recovery is 57.2 %–109.8 %, the LODs are 0.1–1.9 ng (0.04–0.9 ng m−3), repeatability is 2.1 %–19.4 % and reproducibility is 1.1 %–12.9 %. Ambient aerosol samples were collected from Beijing, Chengdu, Shanghai and Guangzhou during the winter of 2013 and were analyzed by the two methods. After considering the recoveries, the two methods show a good agreement with a high correlation coefficient (R2 > 0.98) and a slope close to unity. The concentrations of n-alkanes, PAHs and hopanes are found to be much higher in Beijing than those in Chengdu, Shanghai and Guangzhou, most likely due to emissions from traffic and/or coal combustion for wintertime heating in Beijing.
- Article
(2065 KB) - Full-text XML
-
Supplement
(215 KB) - BibTeX
- EndNote


Fine particulate matter (with aerodynamic diameters ≤2.5 µm, PM2.5) has significant impacts on human health (Cao et al., 2012; Lelieveld et al., 2015; Zheng et al., 2015; Cohen et al., 2017), visibility (Lin et al., 2014; Shen et al., 2015) and climate (Kanakidou et al., 2005; Gustafson et al., 2011; IPCC, 2014). It is composed of a large variety of inorganic and organic compounds, in which the organic composition is much more complicated because of a very large chemical space with respect to molecular weight, functional groups and polarity (Zhang et al., 2007; Jimenez et al., 2009; Huang et al., 2014; Wang et al., 2018). Molecular-level characterization of the organic compounds in PM2.5 is therefore essential for better understanding of the chemical nature, sources, atmospheric processes and impacts of PM2.5 (Surratt et al., 2008; Chan et al., 2011; Fu et al., 2016). Various efforts have been committed to studying the composition of organic aerosol in different environments, including urban areas (Chan et al., 2013) and forested areas, such as the Amazon (Hu et al., 2015) and the southeastern United States (Zhang et al., 2018). However, in many environments, only 10 %–30 % of the particulate organic matter has been identified as specific compounds despite years of effort and the use of the most sophisticated techniques available (Hoffmann et al., 2011).
The conventional approach for molecular analysis of organic compounds often requires the extraction of aerosol collected on filter into solvents followed by evaporation, separation and detection by, e.g., gas chromatography mass spectrometry (GC-MS) (Kourtchev et al., 2009; Nozière et al., 2015; Maenhaut et al., 2017; Yu et al., 2017). However, the solvent extraction (SE) method is prone to contamination and/or analyte lost during sample pre-treatment and is environmentally unfriendly because of the use of a large amount of solvent (Samy et al., 2010; Giri et al., 2013; Urban et al., 2014; Yang et al., 2017). In addition, the SE method is often time consuming. Thermal desorption (TD) is an alternative approach, which uses an elevated temperature to evaporate organic analytes from the filter for subsequent GC-MS detection (Ho and Yu, 2004; Chow et al., 2007; Xu et al., 2013). Compared to SE, the TD method is convenient and solvent free (Graham et al., 2010; Lambe et al., 2010; Ramírez et al., 2010; Kim et al., 2016). The application of TD-GC-MS on the qualitative and quantitative analysis of ambient organic compounds such as polycyclic aromatic hydrocarbons (PAHs) in PM2.5 samples has demonstrated its analytical potential (Orecchio, 2011; Cheruiyot et al., 2015; Wang et al., 2015; Yang et al., 2017). Also, Ho and Yu (2004) compared the TD and SE methods for n-alkanes and PAHs with 16 ambient filter samples from Hong Kong; and Ho et al. (2008) compared these two methods for alkanes, PAHs, cyclohexanes, steranes, phthalates and hopanes with 14 ambient samples from Hong Kong and for PAHs with 19 ambient samples from Tongliang. However, the evaluation and comparison of TD-GC-MS with the well-established SE-GC-MS are still needed to test its capability of measuring ambient samples of low-to-high concentrations and different emission sources. Particulate air pollution has become a serious environmental problem in China over the past decades (Chan and Yao, 2008; Zhao et al., 2009; Zhang et al., 2012; Jiang et al., 2015). Understanding the chemical composition and sources of fine particles is therefore essential for mitigating particulate air pollution. This is particularly true for organic aerosol (OA), which often constitutes more than 50 % of fine PM mass in urban areas during haze pollution events (Takegawa et al., 2006; Srivastava et al., 2018) and is much less constrained compared to the inorganic fraction. In this study, we evaluated and compared the TD-GC-MS and SE-GC-MS methods in terms of their analytical performance including sensitivity, recovery, limit of detection (LOD), repeatability and reproducibility. Then the two methods were applied for the determination of alkanes, PAHs and hopanes in ambient aerosol samples collected in four Chinese megacities, including Beijing, Shanghai, Chengdu and Guangzhou, representing northern, eastern, western and southern China, respectively, where the sources of these organics are different. The mass loadings of PM in those four cities were also quite different. The main objective was to show that the TD-GC-MS method can be used to measure samples of different concentrations and different emission sources.
2.1 Sampling
The 24 h integrated PM2.5 samples were collected on pre-baked (780 ∘C, 3 h) quartz fiber filters (20.3 cm × 25.4 cm) using a high-volume sampler at a flow rate of 1.05 m3 min−1 from December 2013 to January 2014 in four megacities in China (Table S1 in the Supplement). A total of 11 to 12 filters were collected from each sampling site, including 2 field blanks. The filters were wrapped in aluminum foil and stored at −20 ∘C until laboratory analysis.
2.2 SE-GC-MS analysis
A portion (4.34 cm2) of the sample (i.e., blank) filter was cut with a clean stainless steel punch, then extracted with a mixture (15 mL) of dichloromethane (DCM) (99.9 %, LC grade, Mallinckrodt Laboratory Chemicals, Phillipsburg, NJ, USA) and methanol (99.9 %, LC grade, Mallinckrodt Laboratory Chemicals, Phillipsburg, NJ, USA) (3:1, v∕v) under ultra-sonication for 15 min and filtered through quartz wool packed in a Pasteur pipette (Fujii et al., 2016; Mohseni Bandpi et al., 2017). The extraction procedure was repeated three times. Then, the extracts were concentrated using a rotary evaporator under a vacuum condition and blown to < 0.5 mL with a gentle stream of pure nitrogen. The remaining solution was transferred to a 1.5 mL brown vial. Finally, 25 µL n-C24D50 (20 µg mL−1) and 25 µL fluoranthene-d10 (20 µg mL−1) were added as co-injection internal standards to correct for the recovery during GC-MS measurements. Note that the suspended particles (if any) were removed during the filtration between extraction steps which, however, has little influence on the extraction efficiencies of the measured organics because the extraction solvents cover a large range of polarities and can efficiently dissolve n-alkane, PAHs and hopanes measured here, as demonstrated in previous studies (Fujii et al., 2016). The high extraction efficiencies are further supported by the good recoveries (89.4 %–98.6 %), which are considered to be very satisfactory given additional sources of error (e.g., from GC-MS detection). The final volume of the solution was fixed at 1.0 mL. For the analysis of standards, a mixture of standards was spiked onto the pre-cleaned blank filters and then followed the same procedure as for ambient samples. The extracts were kept in a refrigerator until the GC-MS analysis, and 1 µL was injected into the GC-MS system.
The GC-MS analysis was performed using an Agilent 7890 GC coupled with an Agilent 5975C mass spectrometer detector (MSD). The GC oven program was set at an initial value of 50 ∘C, held at this temperature for 1 min, programmed at a rate of 25 ∘C min−1 to 140 ∘C and 10 ∘C min−1 to 300 ∘C, and then held at the final temperature of 300 ∘C for 5 min. The column was an HP-5MS (5 % diphenyl/95 % dimethylsiloxane, 30 m × 0.25 mm × 0.25 µm). The carrier gas was helium, which was held at a constant pressure of 53.1 kPa. The MSD was operated at 280 ∘C and 70 eV for electron ionization. The scan range of mass-to-charge ratio (m∕z) was from 50 to 650 atomic mass unit (Da).
2.3 TD-GC-MS analysis
The filter punch of 0.53 cm2 was cut with the stainless steel punch. Two internal standards 25 µL n-C24D50 (20 µg mL−1) and 25 µL fluoranthene-d10 (20 µg mL−1) with dichloromethane were spiked onto the filter punch. After air-drying for a few seconds, the punch was divided into four roughly equal portions with a razor blade, then loaded into the TD tube. The TD tube is a Pyrex glass tube and is cleaned following a standard procedure: it was cleaned with methanol under ultra-sonication for more than 30 min, then baked at 550 ∘C for at least 10 h before use (Ho and Yu, 2004; Ho et al., 2008; Xu et al., 2013; Wang et al., 2015). A small amount of pre-baked glass wool (baked at 550 ∘C for at least 5 h) was used to make two plugs for holding the filter pieces in the middle of the tube. After the loaded TD tube was placed in the injector port, the septum cap was closed and the injector port temperature was raised from 50 to 280 ∘C for desorption (about 8–9 min). During this period, the GC oven temperature was initially at 30 ∘C, held at this temperature for 2 min, programmed at a rate of 20 ∘C min−1 to 120 ∘C and 10 ∘C min−1 to 300 ∘C, and then held at the final temperature of 300 ∘C for 10 min. The analysis time of each sample was about 52 min. The injector port temperature was optimized by testing a set of temperature programs (see below). The injector was set in the splitless mode for the first 2 min in the GC temperature program, then switched to the split mode and returned to the splitless mode at the end of the GC run. When the analysis was finished, the cooling program automatically started, which took about 35 min. When the injection temperature was down to 50 ∘C, the next sample was put into the injector. A new TD tube was used for each analysis to avoid any potential contamination carry-over to the next analysis. The standard calibration curves were established for individual compounds by spiking standards of targeted compounds onto pre-cleaned filters, which were then measured following the same procedure as for ambient samples. The GC column was an HP-5MS (5 % diphenyl/95 % dimethylsiloxane, 30 m × 0.25 mm × 0.25 µm). The carrier gas was ultra-high-purity helium (99.9999 %), which was held at a constant pressure of 53.1 kPa and flow of 1.0 mL min−1 (Ho and Yu, 2004; Ho et al., 2008). The MSD was operated at 280 ∘C and 70 eV for electron ionization. The mass scan range (m∕z) was the same as the SE method (50–650 amu).
2.4 Quality assurance and control (QA and QC)
A total of 24 n-alkanes (C14–C37) (99 %, Aldrich, Milwaukee, WI, USA); 12 PAHs (99 %, Aldrich, Milwaukee, WI, USA), i.e., Acenaphthene (Ace), Fluorene (Fl), Phenanthrene (Phe), Anthracene (Ant), Fluoranthene (Fla), Pyrene (Pyr), Benz(a)anthracene (BaA), Chrysene (Chry), Benzo(b)fluoranthene (BbF), Benzo(k)fluoranthene (BkF), Benzo(a)pyrene (BaP), Indeno(1,2,3-cd)pyrene (IcdP), Dibenz(a,h)anthracene (DahA), Benzo(g,h,i)perylene (BghiP), and 8 hopanes (99 %, Supelco, Bellefonte, PA, USA), i.e., 22,29,30-Trisnorphopane (TH), C29αβ-hopane (C29αβH), C29αα-+βα-hopane (C29αα-+βαH), C30αβ-hopane (C30αβH), C30αα-hopane (C30ααH), C30βα-hopane (C30βαH), C31αβS-hopane (C31αβSH), C31αβR-hopane (C31αβRH), were quantified using both the TD and SE methods. Internal standards (n-C24D50 (98 %, Aldrich, Milwaukee, WI, USA) and fluoranthene-d10 (98 %, Aldrich, Milwaukee, WI, USA) were added during the pre-treatment process for two methods. Direct injection of a mixture of liquid standards with different concentrations into the SE-GC-MS system was utilized to establish a calibration curve, while a mixture of standards with different concentrations were spiked onto the pre-cleaned filters and then used to establish the calibration curves for the TD-GC-MS system. Table S2 shows the slope and the correlation coefficients (R2) for linear regressions of the calibration curves, which were mostly > 0.99. To determine the recovery of the SE method, a mixture of standards was spiked onto the pre-cleaned blank filters, which were then measured following the same procedure as for ambient samples. The recovery of the TD method was calculated based on the response signal of liquid standards and its known amount spiked onto the blank filter. Repeatability and reproducibility were also investigated for both methods. Repeatability refers to the variation in repeat measurements made under identical conditions, e.g., by the same method and the same individual, while reproducibility refers to the variation in measurements made by same method but by different individuals (Bartlett and Frost, 2008). In this study, seven repeat measurements were made on n-alkane (1000 ng mL−1), PAH (1000 ng mL−1) and hopane (1000 ng mL−1) standards spiked on pre-baked quartz fiber filter blank for both repeatability and reproducibility studies. The volume of these mix standards was 1 µL for the TD method and 25 µL in the SE method.
For every 10 samples, one replicate analysis was performed; and for every 5 samples, one backup filter was analyzed to check any potential contamination and the results show < 5 % contribution. In addition, ambient samples spiked with known amounts of internal and external standards were analyzed to check the potential interference. All data reported here were corrected for the blanks.
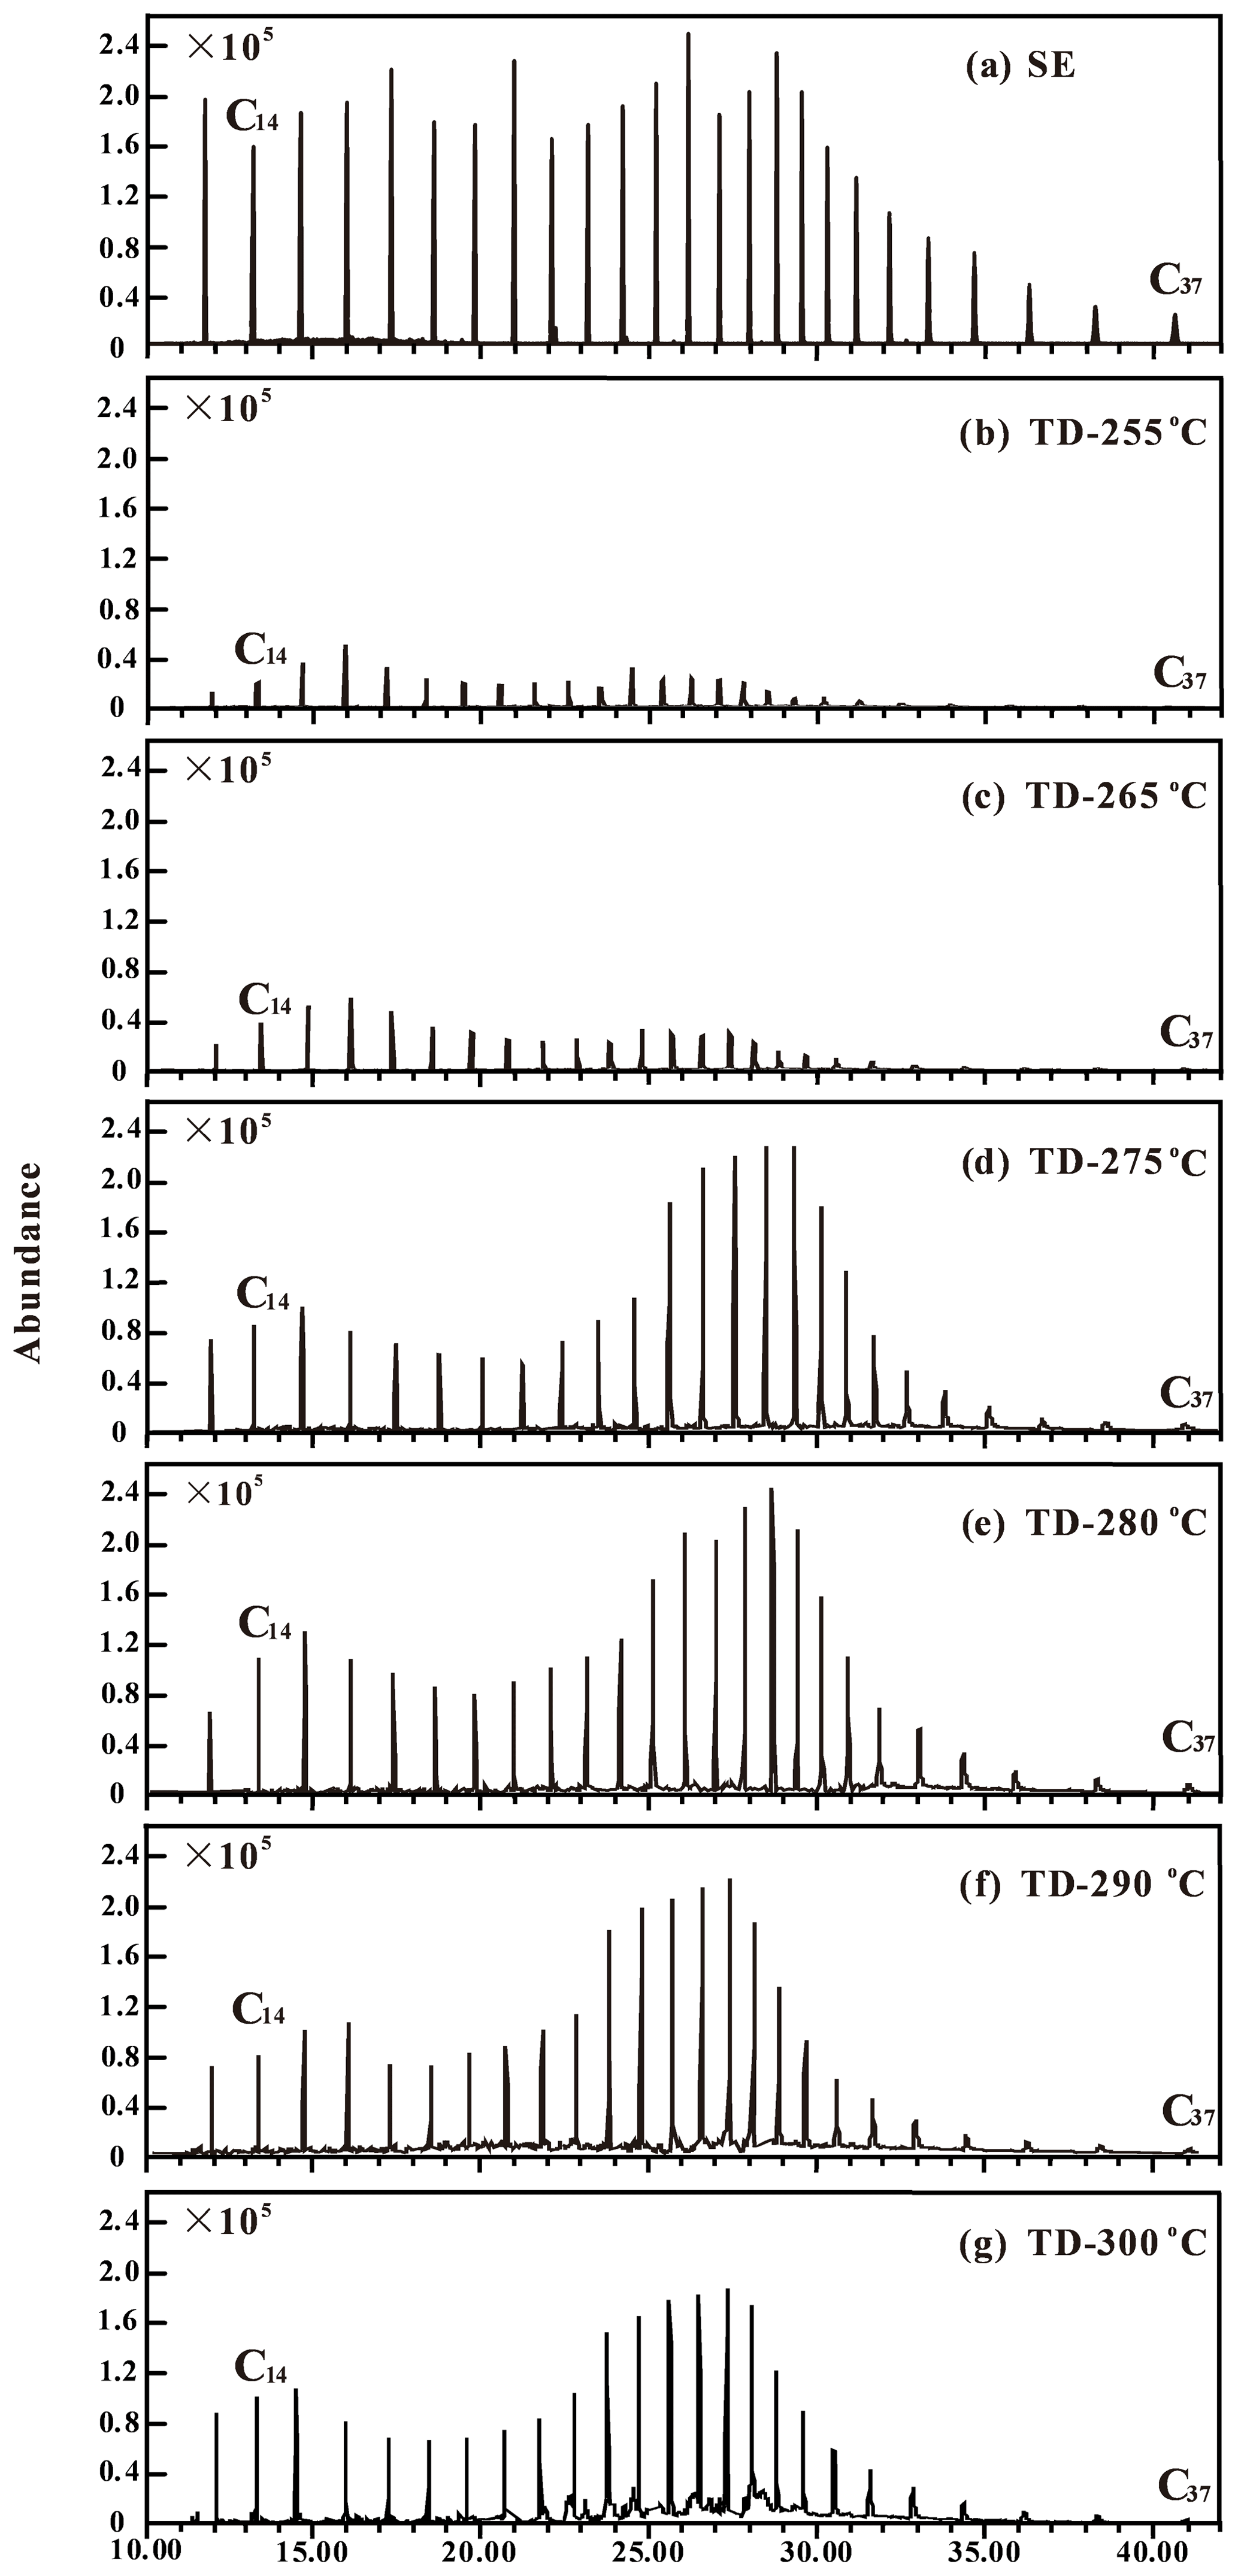
Figure 1Comparison of GC-MS chromatograms from solvent extraction (SE, a) and thermal desorption (TD) at different injector port temperatures of 255 ∘C (b), 265 ∘C (c), 275 ∘C (d), 280 ∘C (e), 290 ∘C (f) and 300 ∘C (g).
3.1 Temperature effect on thermal desorption
The effect of temperature in the injector port on thermal desorption is investigated by analyzing a mixture of n-alkane standards (C14−C37) with TD-GC-MS and compared with SE-GC-MS. The vapor pressure of these n-alkanes (molecular weight, MW, 198–520) at 275 ∘C ranges from 0.5 to 177.6 kPa, covering the vapor pressure of PAHs (0.7–97.3 kPa, MW 154–278) and hopanes (0.2–2.4 kPa, MW 370–426) investigated here. Therefore, only n-alkanes were tested to investigate the temperature effect. A range of temperature in the injector port (from 255 to 300 ∘C) were studied and the results are compared with those from the SE method (see Fig. 1). It can be seen from the figure that at lower TD temperatures (255 and 260 ∘C; see Fig. 1b and c), lighter n-alkanes have higher signal abundances than heavier ones, with the abundance of C16 being the highest. However, the abundances of individual n-alkanes measured at these lower TD temperatures are only approximately 20 % of those from the SE method, likely due to incomplete thermal desorption (Ho and Yu, 2004). With increased TD temperature (275 ∘C, Fig. 1d), the signal abundances for all n-alkane species increase by 2–5 times, indicating a better thermal desorption efficiency. When the TD temperature increases further to 280 ∘C, the signal abundances increase slightly, particularly for those lighter n-alkanes (C14−C19). It should be noted that the signal abundance patterns change with the TD temperature (Fig. 1b–e), with those mid-chain n-alkanes being more abundant at 275 and 280 ∘C. However, as the TD temperature further increased to 290 and 300 ∘C (Fig. 1f and g), the signal abundances show a decreasing trend, for example, a > 30 % decrease in abundance for mid-chain n-alkanes at 300 ∘C was observed. The decrease in signal abundances at higher temperatures (e.g., 290 and 300 ∘C) is likely associated with pyrolysis. Therefore, 280 ∘C was selected as the optimized TD temperature to compromise for the thermal desorption efficiency and pyrolysis effect. It is noted that analytes with different molecular structures, such as PAHs and hopanes, may undergo different levels of pyrolysis at 280 ∘C when compared to n-alkanes and may require higher or lower temperatures to get the optimized thermal desorption efficiency. However, the optimized TD temperature (i.e., 280 ∘C) based on the n-alkane test was supposed to be sufficient to analyze PAHs and hopanes because a similar temperature (275 ∘C) was used in the studies by Ho et al. (Ho and Yu, 2004; Ho et al., 2008). Also note that even at the optimized TD temperature, the abundances of individual n-alkanes (Fig. 1e) show some differences from the SE method. In particular, the abundances of lighter n-alkanes (C14−C19) from the TD method are about 50 % lower than those from SE method, and for heavier n-alkanes (C31−C37) the decreases are more than 50 %. However, the abundances for mid-chain n-alkanes are very similar between TD and SE methods.
3.2 Comparison of the analytical performance
Table 1 shows the comparison of repeatability, reproducibility, recovery, and LODs of SE-GC-MS and TD-GC-MS for n-alkanes, PAHs and hopanes. Repeatability and reproducibility are two measures of the precision of the analytical methods. Repeatability is determined by the relative standard deviation (RSD) through measuring the identical samples (n=7) with the same procedure while reproducibility represents the consistency between the repeated measurements by different individuals. The repeatability of SE-GC-MS is 3.5 %–14.5 %, 4.4 %–10.6 % and 3.5 %–7.7 % for n-alkanes, PAHs and hopanes, respectively, which are similar to those obtained from TD-GC-MS (3.2 %–19.3 %, 2.7 %–9.5 % and 2.1 %–8.4 %, respectively). The reproducibility is also consistent for these two methods (1.2 %–10.9 % for SE versus 1.1 %–12.9 % for TD). In general, the precision of both SE-GC-MS and TD-GC-MS methods are satisfactory (RSD < 20 %) considering the multiple sources of the errors (e.g., the error of sample pre-treatment and error from GC-MS detection).
Table 1Analytical performance of SE-GC-MS and TD-GC-MS methods for determination of n-alkanes, PAHs and hopanes.

* For analyzing a 0.526 cm2 (TD) and 4.34 cm2 (SE) punch of filters collected with high-volume samplers (sampling at 1.1 m3 min−1 or 24 h on 20.3 cm × 25.4 cm filters).
The recoveries for the two methods were determined by analyzing backup filters spiked with known amounts of n-alkane (1000 ng mL−1), PAH (1000 ng mL−1) and hopane (1000 ng mL−1) standards, respectively. The recoveries of SE-GC-MS are in the range of 89.4 %–98.6 % for n-alkanes (Table 1), which are better than those obtained from TD-GC-MS (57.2 %–109.8 %). The good recoveries provided by SE-GC-MS indicate a good extraction efficiency and low sample matrix effect. For the TD-GC-MS method, only lighter n-alkanes (C14–C18) and heavier n-alkanes (C32–C37) show relatively lower recoveries (57.2 %–80.6 %) (see Fig. 2), likely due to insufficient thermal desorption efficiency and/or pyrolysis effect, as discussed above. The recoveries of PAHs and hopanes in TD-GC-MS method are 89.4 %–106.1 % and 90.4 %–99.8 %, respectively, which are as good as those obtained from SE-GC-MS method (89.7 %–101.5 % and 90.3 %–97.2 %, respectively).
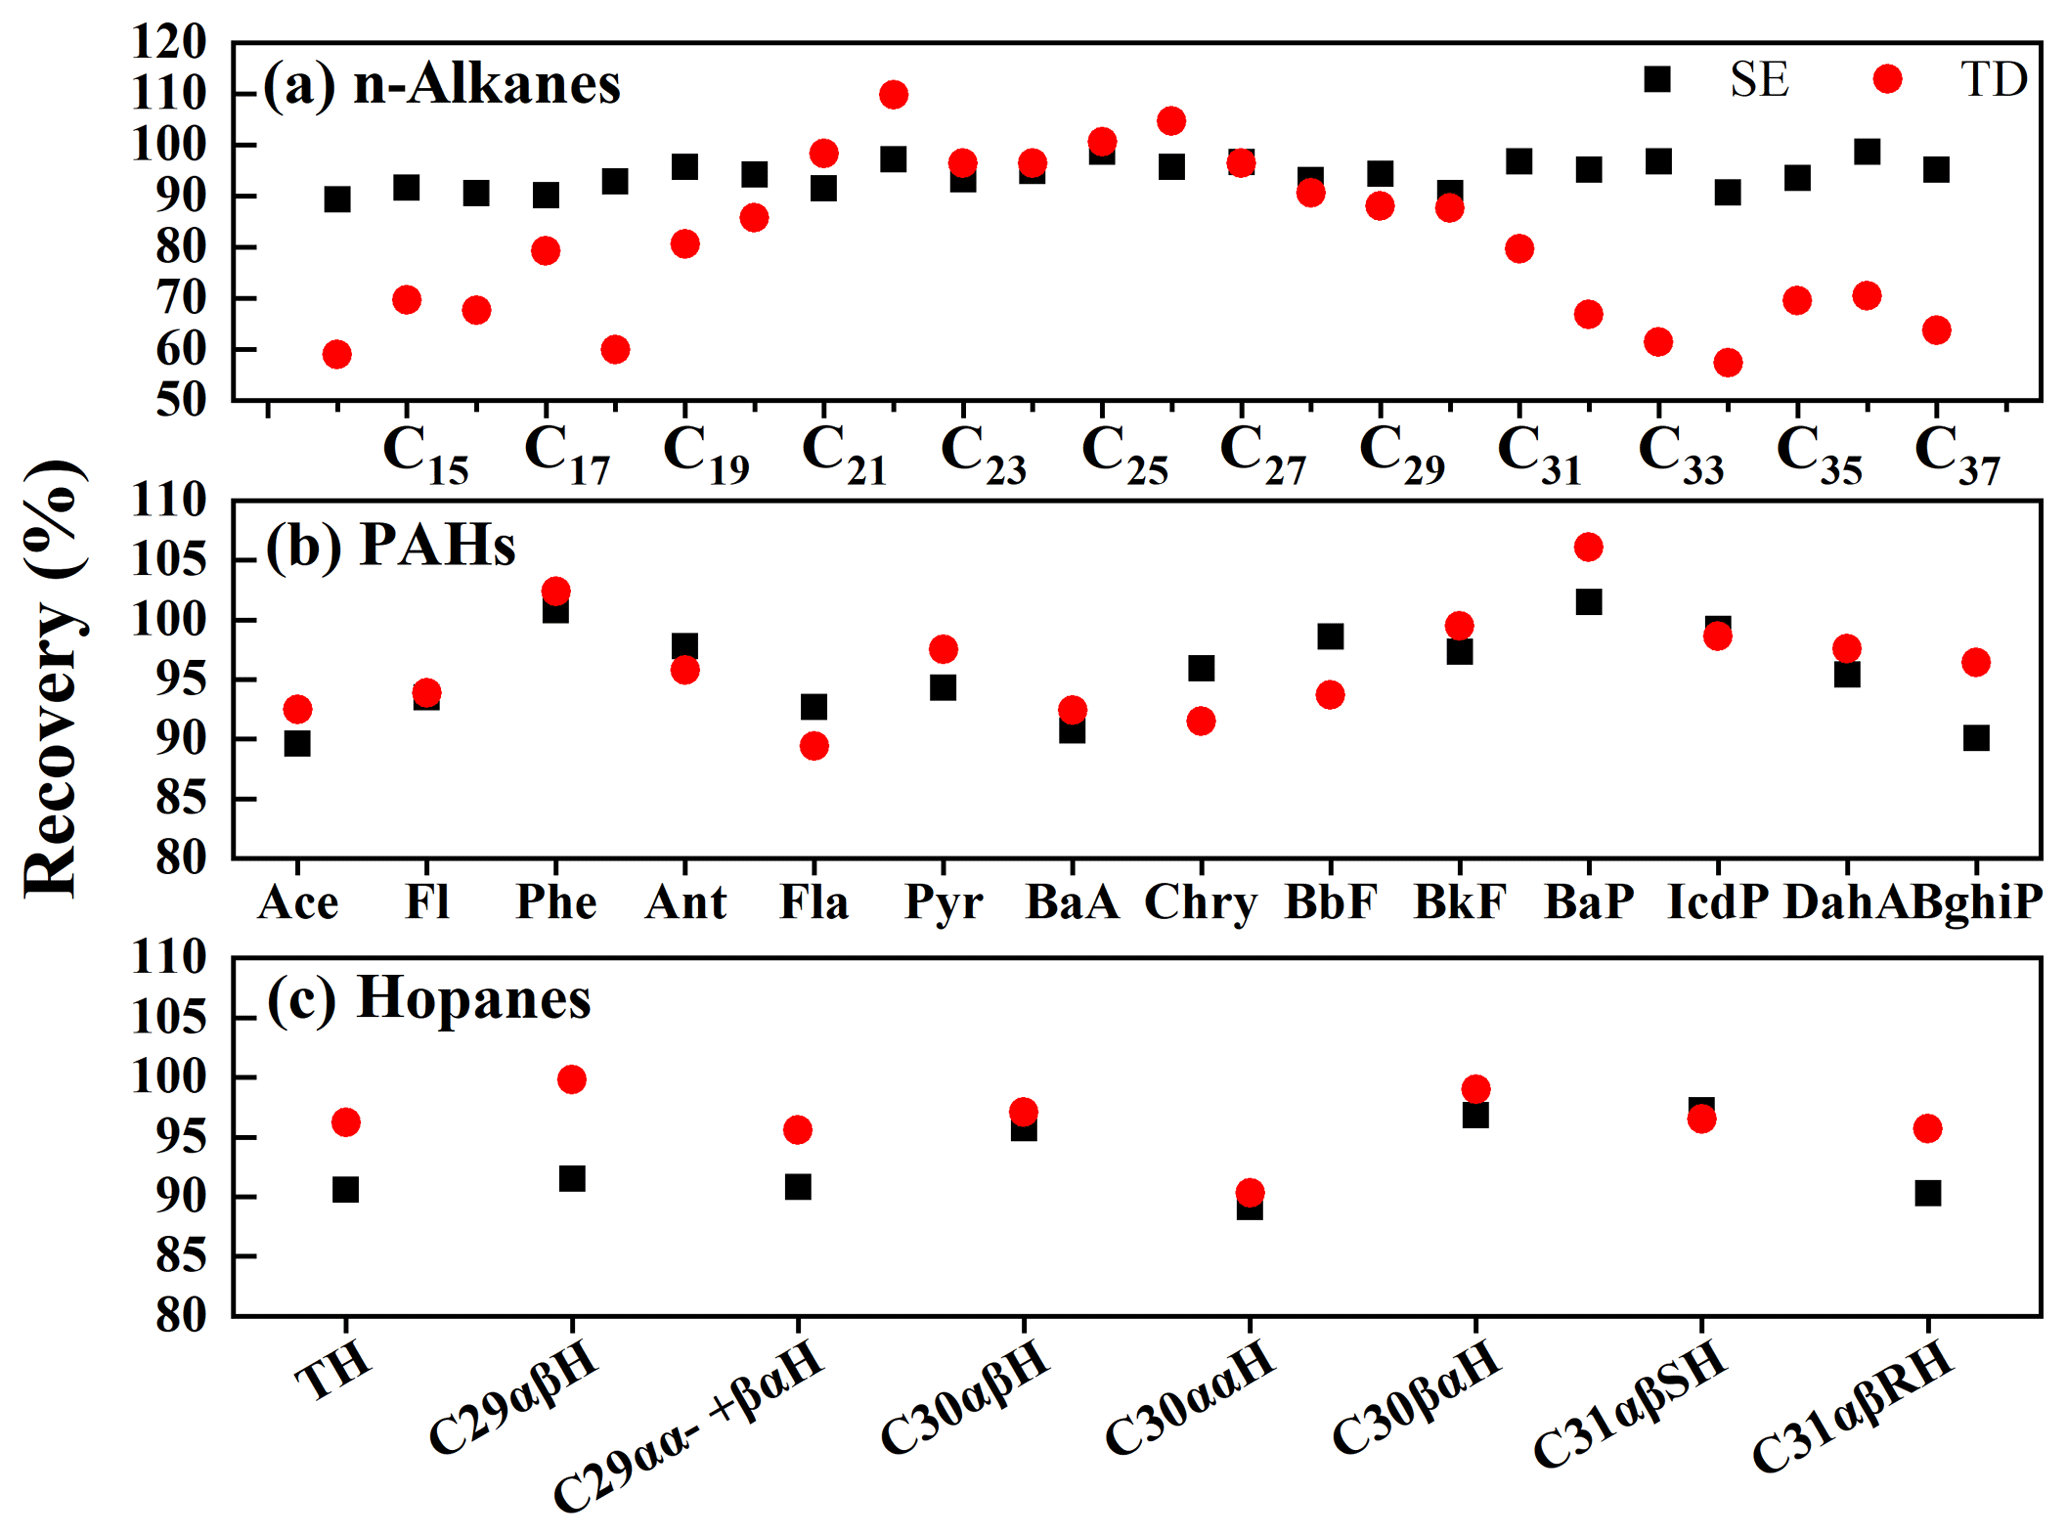
Figure 2The recoveries of n-alkanes (a) (Cn is the straight-chain n-alkanes with carbon numbers from 14–37), PAHs (b) and hopanes (c) by SE-GC-MS and TD-GC-MS. The full names of individual abbreviations are shown in the Supplement.
The LODs (the concentration with a signal to noise ratio of three) of the SE method are 0.05–0.9 ng for n-alkanes, 0.3–1.1 ng for PAHs and 0.3–1.0 ng for hopanes (Table S3). These LODs are very similar to those from the TD method, i.e., 0.09–0.8 ng for n-alkanes, 0.1–1.9 ng for PAHs and 0.2–0.7 ng for hopanes.
3.3 Comparison based on ambient aerosol samples
The comparison between TD and SE methods discussed above are made based on standard compounds. When analyzing ambient samples, however, the analytical performance may be affected by, e.g., the matrix effect. We evaluate these potential effects by analyzing 45 ambient PM2.5 samples collected in Beijing, Chengdu, Shanghai and Guangzhou. Figure 3 shows the correlation of quantitative results between SE and TD methods for n-alkanes (Fig. 3a), PAHs (Fig. 3b) and hopanes (Fig. 3c). Note that the data shown in Fig. 3 are corrected for individual recoveries. The good correlations between these two methods for n-alkanes (R2=0.99), PAHs (R2=0.98) and hopanes (R2=0.98) with the slopes close to unity (0.94–0.98) suggest that both TD and SE methods can be used for quantitative measurements of ambient aerosol samples.
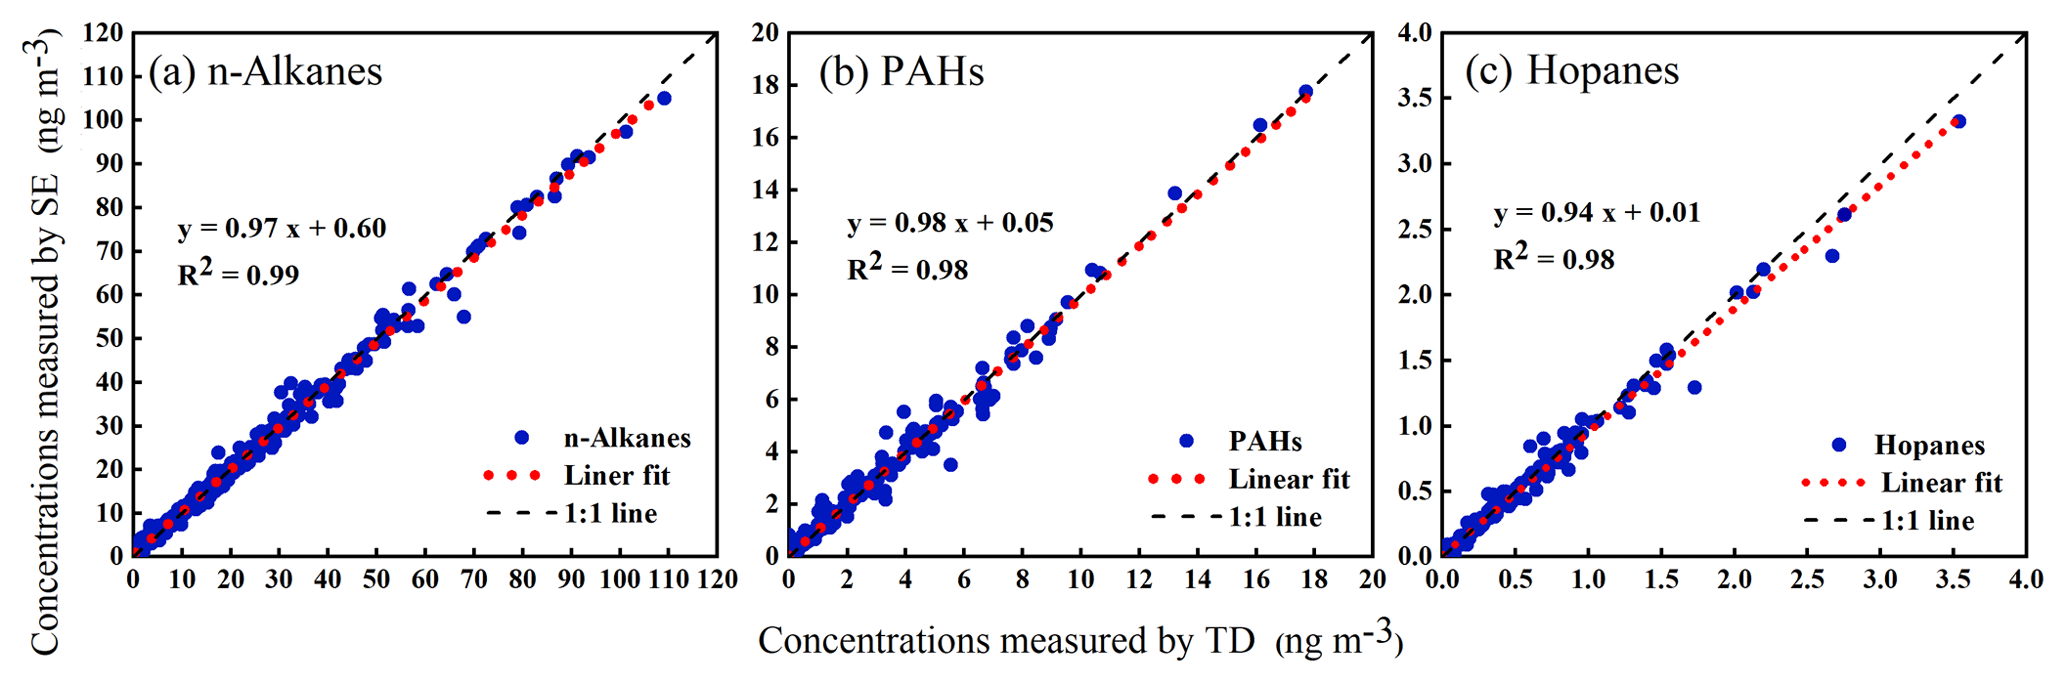
Figure 3Comparisons of n-alkanes (a), PAHs (b) and hopanes (c) determined by SE-GC-MS and TD-GC-MS methods for the ambient PM2.5 samples collected simultaneously from Beijing, Shanghai, Guangzhou and Chengdu during the winter of 2013.
The LODs of a method are very important for ambient measurements, particularly in regions with low concentrations or sampling with low-volume samplers. Our results show that, for example, for samples collected with a high-volume sampler at 1.1 m3 min−1 for 24 h on 20.3 cm × 25.4 cm filters, 0.53 cm2 filter punch (TD method) is required to reach LODs of 0.04–0.4 ng m−3 for n-alkanes, 0.06–0.9 ng m−3 for PAHs, and 0.09–0.4 ng m−3 for hopanes, and 4.3 cm2 filter punch (SE method) is required to reach LODs of 1.5–27.4 ng m−3 for n-alkanes, 9.8–33.9 ng m−3 for PAHs, and 8.1–29.8 ng m−3 for hopanes. In this regard, the TD method is superior to the SE method because the LODs of the TD method are about 2 orders of magnitude lower than the SE method and meanwhile it requires about a 10 times lower amount of sample material.
3.4 n-alkanes, PAHs and hopanes in wintertime PM2.5 in Chinese megacities
Figure 4 shows the average concentrations of individual n-alkanes species (C14−C37) during the wintertime in Beijing, Chengdu, Shanghai and Guangzhou. Short-chain n-alkanes (Cn ≤ C26) are mainly derived from anthropogenic emissions, while long-chain n-alkanes (Cn > C26) are typical of the biogenic source (Xu et al., 2013). Overall, the short-chain n-alkanes account for 72.2 % (262.0 ng m−3) of total n-alkanes in Beijing, 68.4 % (246.7 ng m−3) in Chengdu, 64.6 % (111.6 ng m−3) in Shanghai and 55.8 % (102.6 ng m−3) in Guangzhou, indicating the major contribution of anthropogenic emissions to n-alkanes in these four cities in winter. The relatively low contribution of short-chain n-alkanes in Guangzhou is likely due to more biogenic emissions of long-chain n-alkanes in southern China than in northern China during winter. The large anthropogenic contribution is supported by the Cmax of n-alkane (i.e., the carbon number with maximum concentration), an indicator often used to distinguish anthropogenic from biogenic sources. N-alkanes with Cmax ≤ C26 are mainly from anthropogenic sources, while those with Cmax > C26 are typically from biogenic sources (Xu et al., 2013). In this study, C25 exhibits the highest concentration (66.1 ng m−3) in Beijing, while C24 (48.0 ng m−3) is the highest in Chengdu, C22 (19.8 ng m−3) is the highest in Shanghai and C26 is the highest (19.3 ng m−3) in Guangzhou. We have also investigated the carbon preference index (CPI) of n-alkanes, which was calculated using the following equation:
The values of CPI ≤ 1 (or ∼1) indicate that n-alkanes are from anthropogenic sources while values of CPI > 1 indicate biogenic emissions (Mancilla et al., 2016b). The CPI values of these four cities are all close to 1 (Beijing 0.9, Chengdu 0.9, Shanghai 0.8, Guangzhou 1.0), indicating that n-alkanes are mostly from anthropogenic sources (Alves et al., 2001; Mancilla et al., 2016a). It should be noted that the above discussion of anthropogenic versus biogenic sources is empirical evidence and may be subjected to relatively large uncertainties. For example, recent studies show that vehicular emissions also contain n-alkanes > C26 (Worton et al., 2014). Moreover, the short-chain n-alkanes concentrations are 1.1–2.6 times higher in Beijing than in the other three cities, further supporting the higher anthropogenic emissions in Beijing. This is consistent with the higher traffic fleets and larger coal usage in Beijing than in the other three cities studied here (Huang et al., 2014). In fact, Beijing is the only city equipped with residential heating in the four cities studied here. However, biogenic sources are also important especially in southern city of Guangzhou, as indicated by the relatively low short-chain concentration and fraction compared to the other three cities (Fig. 4). This is consistent with the higher vegetation coverage and temperature even during wintertime (Xu et al., 2013).
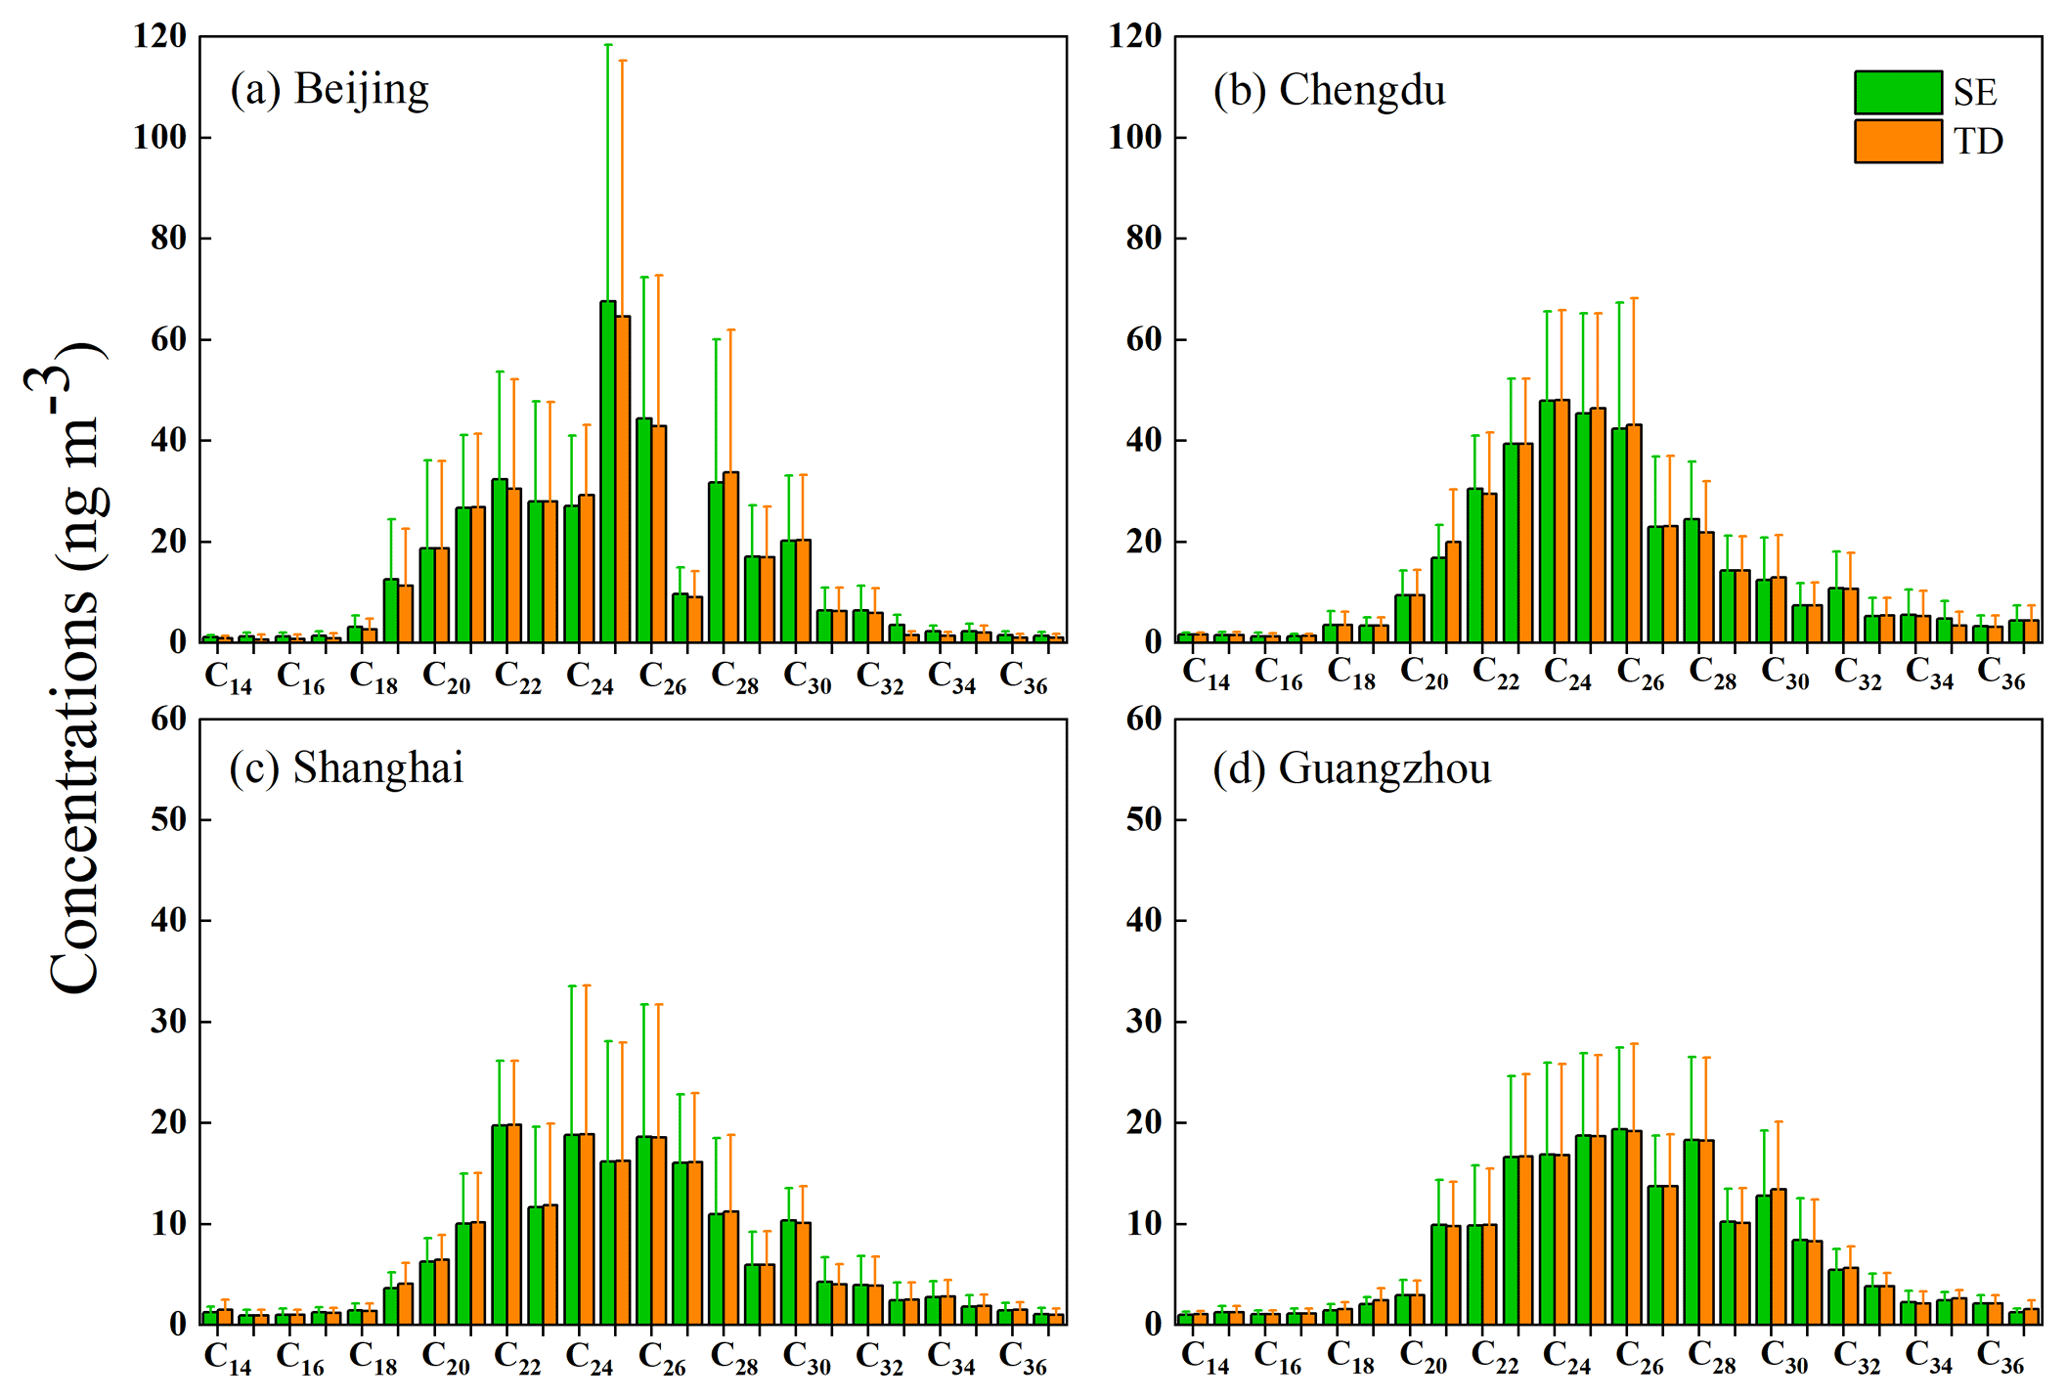
Figure 4Average concentration of n-alkanes (n-C14–n-C37) determined by SE-GC-MS and TD-GC-MS methods during wintertime from December 2013 to January 2014 in Beijing (a), Chengdu (b), Shanghai (c) and Guangzhou (d). Error bar is one standard deviation of individual n-alkanes.
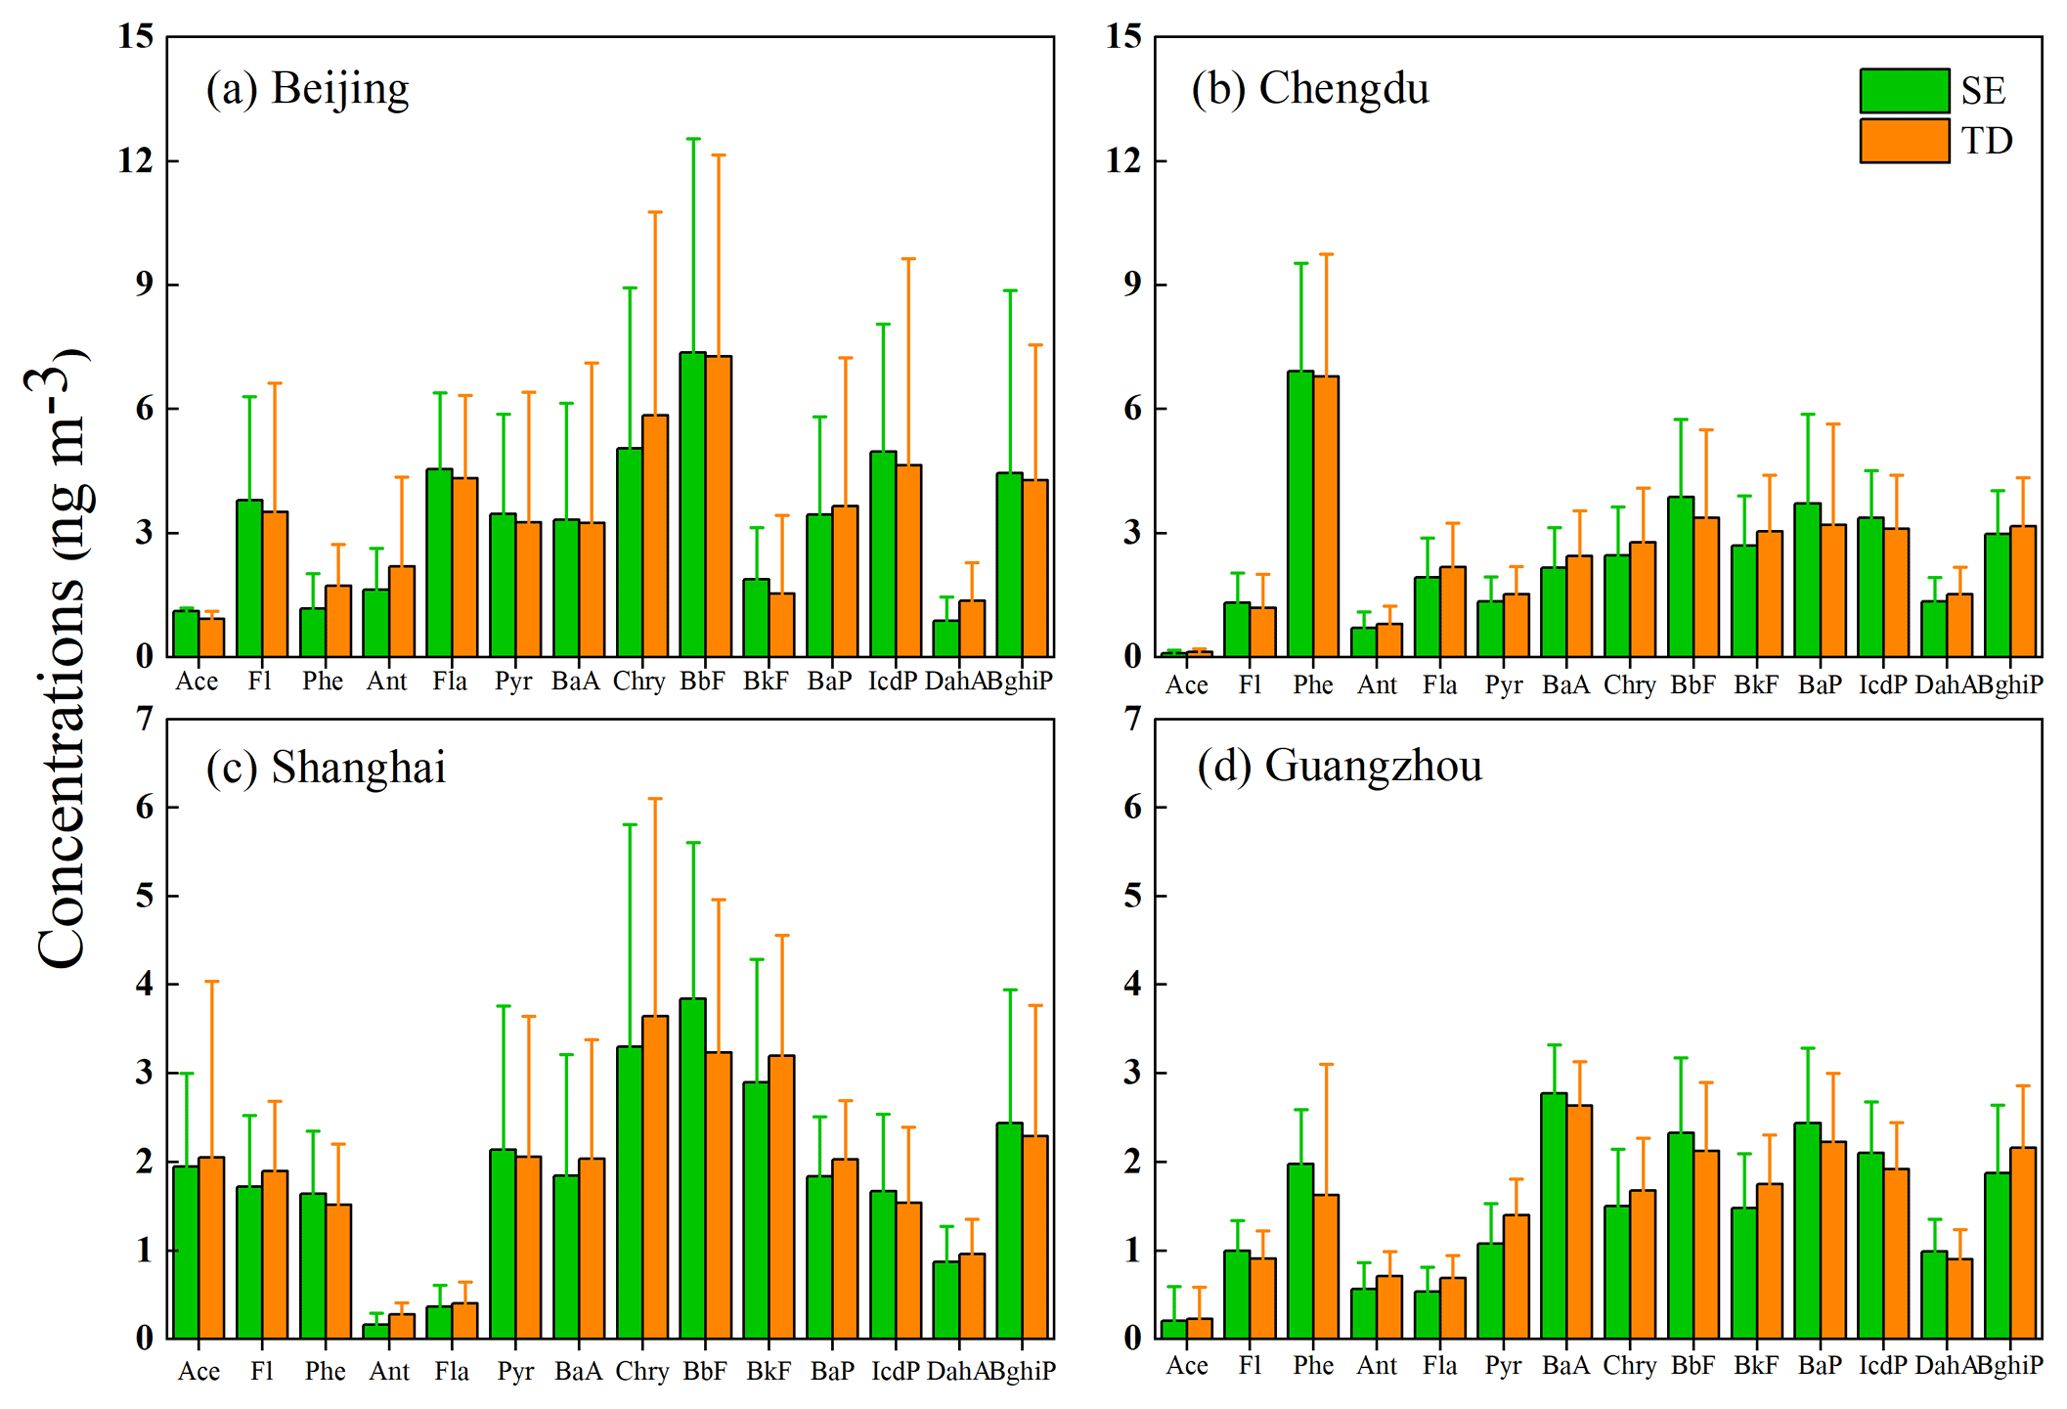
Figure 5Average concentration of individual PAHs determined by SE-GC-MS and TD-GC-MS methods during wintertime from December 2013 to January 2014 in Beijing (a), Chengdu (b), Shanghai (c) and Guangzhou (d). Error bar is one standard deviation of individual PAHs.
The average concentrations of individual PAH species in the four cities are shown in Fig. 5. The contributions of PAH are site-dependent, indicating different sources in different cities (Okuda et al., 2006; Dockery and Stone, 2007). For example, BbF is the most abundant PAH in Beijing, with an average concentration of 7.3 ng m−3, Phe (6.9 ng m−3) exhibits the highest concentration in Chengdu, BbF (3.5 ng m−3) is the highest in Shanghai and BaA (3.0 ng m−3) is the highest in Guangzhou. BbF is mainly emitted from coal combustion with high emission factor while BghiP is mainly derived from traffic emissions (Katsoyiannis et al., 2011; Tobiszewski and Namieśnik, 2012). The BbF concentration (7.3 ng m−3) in Beijing is 2–3 times as high as that in the other three cities (Chengdu 3.6 ng m−3, Shanghai 3.5 ng m−3 and Guangzhou 2.2 ng m−3), supporting its large emissions from residential coal combustion in Beijing. The BghiP concentrations Beijing and Chengdu (3–4 ng m−3) are rather similar, indicating similar levels of traffic emissions in the two cities. In addition, the BaP concentrations are similar in Beijing and Chengdu (3–4 ng m−3) and similar in Shanghai and Guangzhou (2.0–2.5 ng m−3). They all exceed the guidelines from the World Health Organization (WHO) by a factor of 2–4, indicating a potential health risk, as BaP is a carcinogenic indicator.
Hopanes are pentacyclic hydrocarbons with a triterpene grouping and can be from both coal and traffic emissions (Oros and Simoneit, 2000; Schauer et al., 2002; Zhang et al., 2008). As shown in Fig. 6, Beijing exhibits the highest concentrations of hopanes among the four cities studied. C30αβH is the most abundant hopane species in the four cities, with the highest concentration in Beijing (2.0 ng m−3) and similar concentrations in Chengdu, Shanghai and Guangzhou (∼0.6 ng m−3). Note that the vehicular fleets in 2014 are 5.4 million in Beijing, about 1.6–2.0 times higher than those in the other three cities (i.e., 3.4 million in Chengdu, 2.7 million in Shanghai and 2.7 million in Guangzhou; Chinese Statistical Yearbook 2015), while the concentration of C30αβH is >3 times higher in Beijing than in the other three cities. Such a large difference could be attributed to additional emission sources besides vehicles, that is, emissions from coal combustion for wintertime residential heating in Beijing, which is unique among the four cities we studied (Huang et al., 2014; Elser et al., 2016).
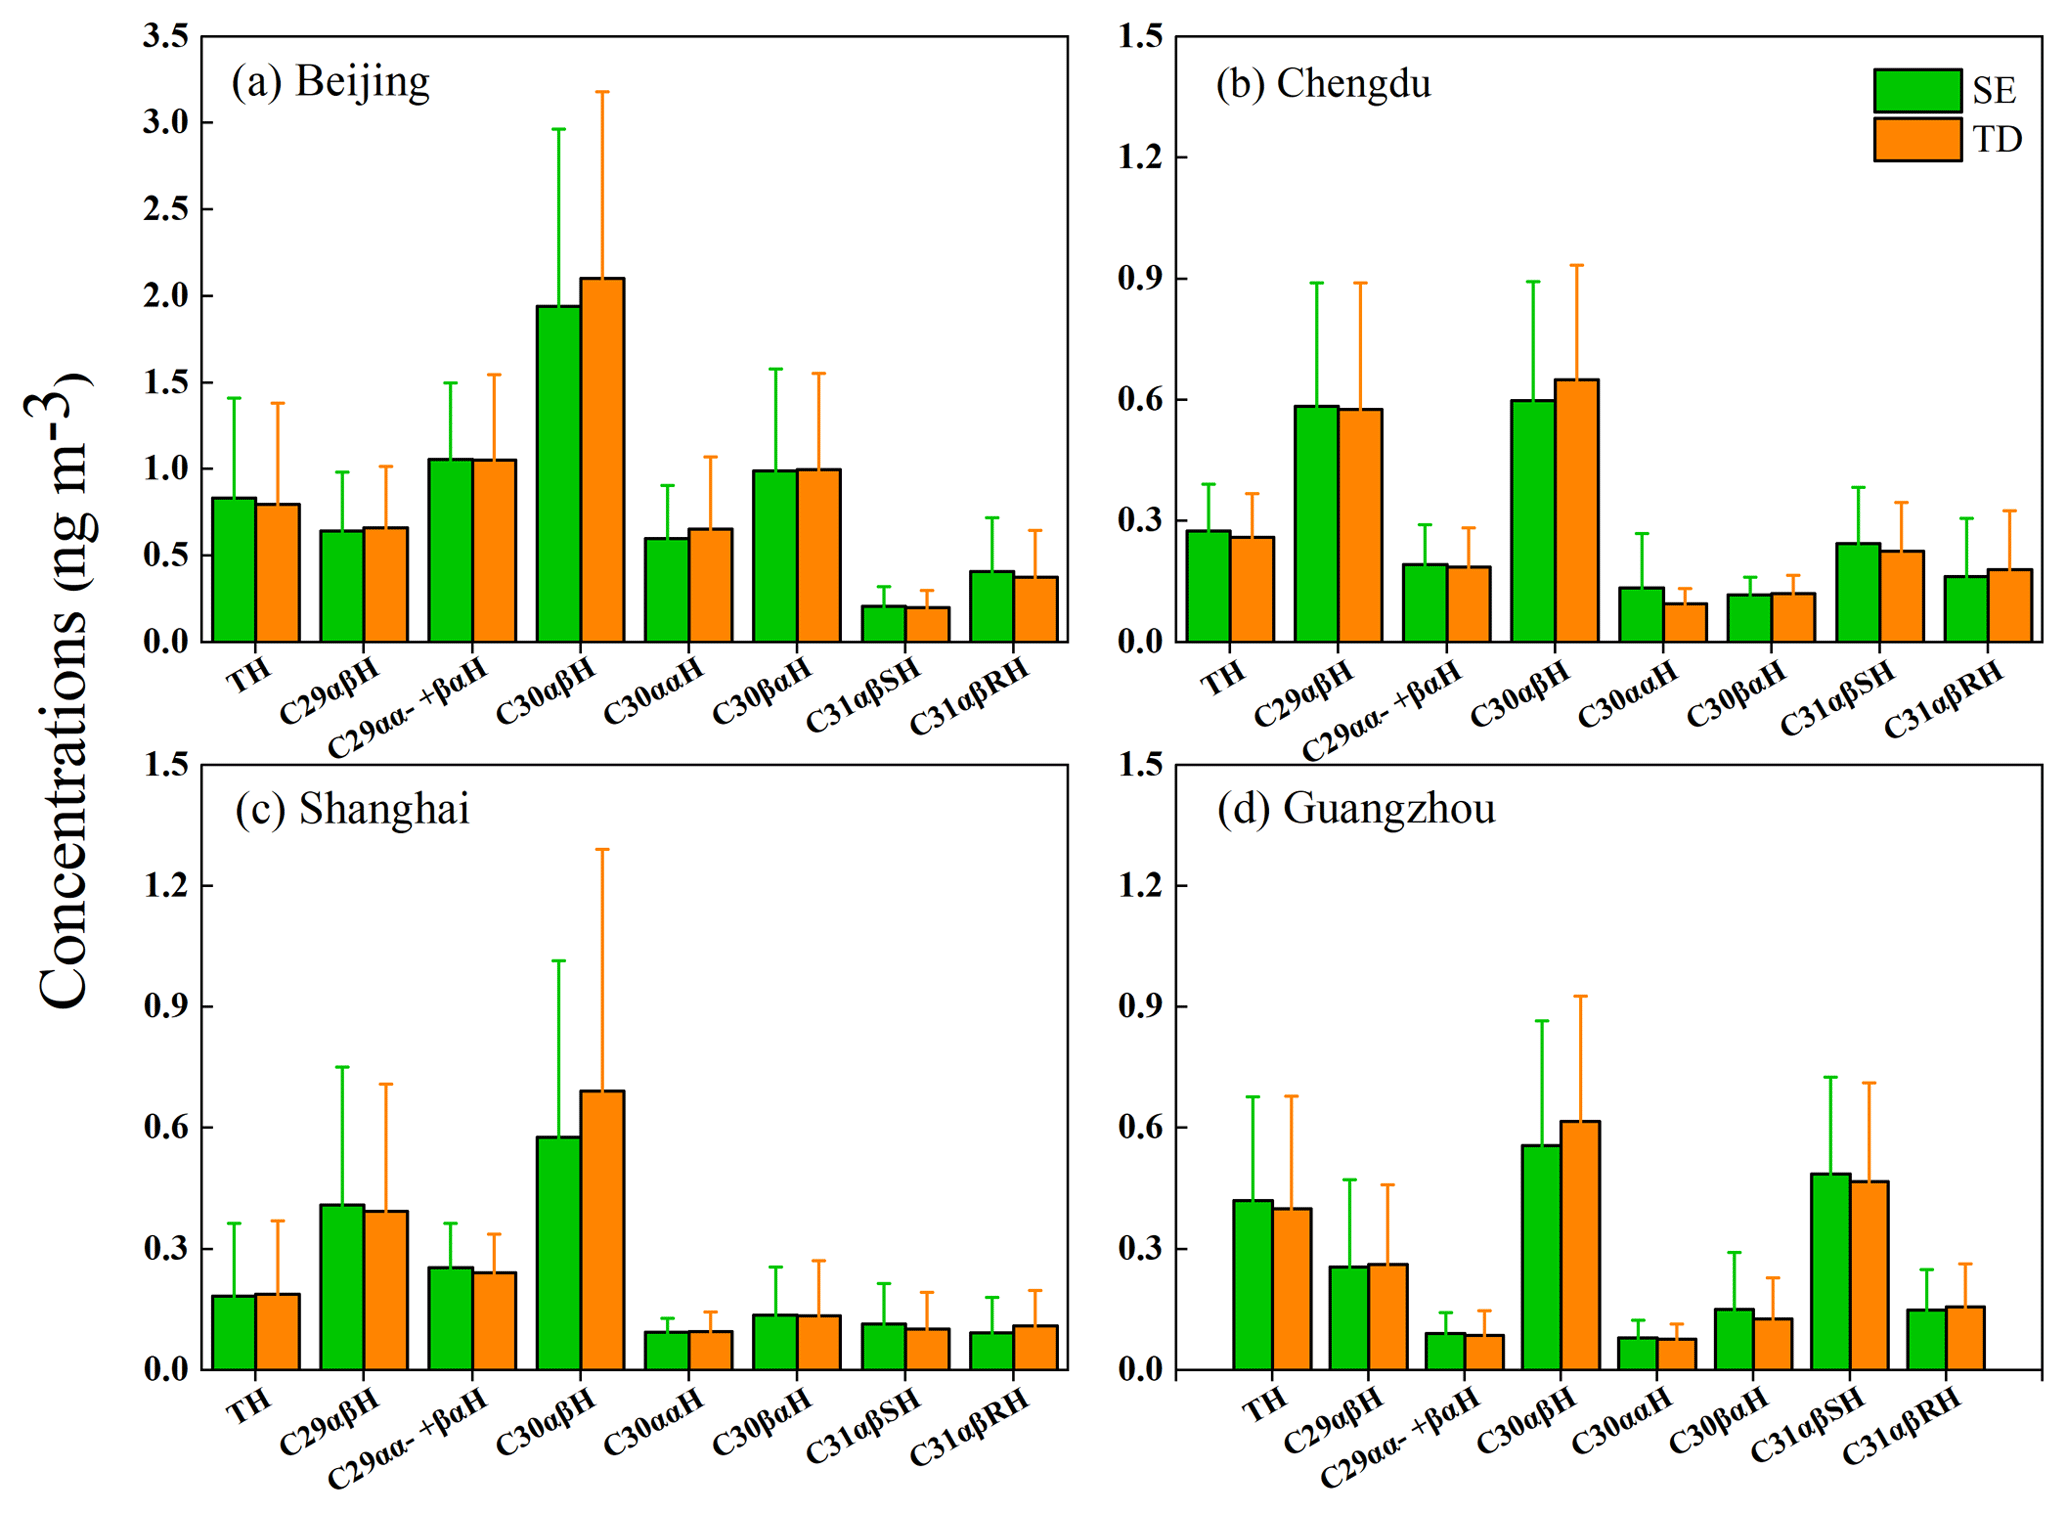
Figure 6Average concentration of individual hopanes determined by SE-GC-MS and TD-GC-MS methods during wintertime from December 2013 to January 2014 in Beijing (a), Chengdu (b), Shanghai (c) and Guangzhou (d). Error bar is one standard deviation of individual hopanes.
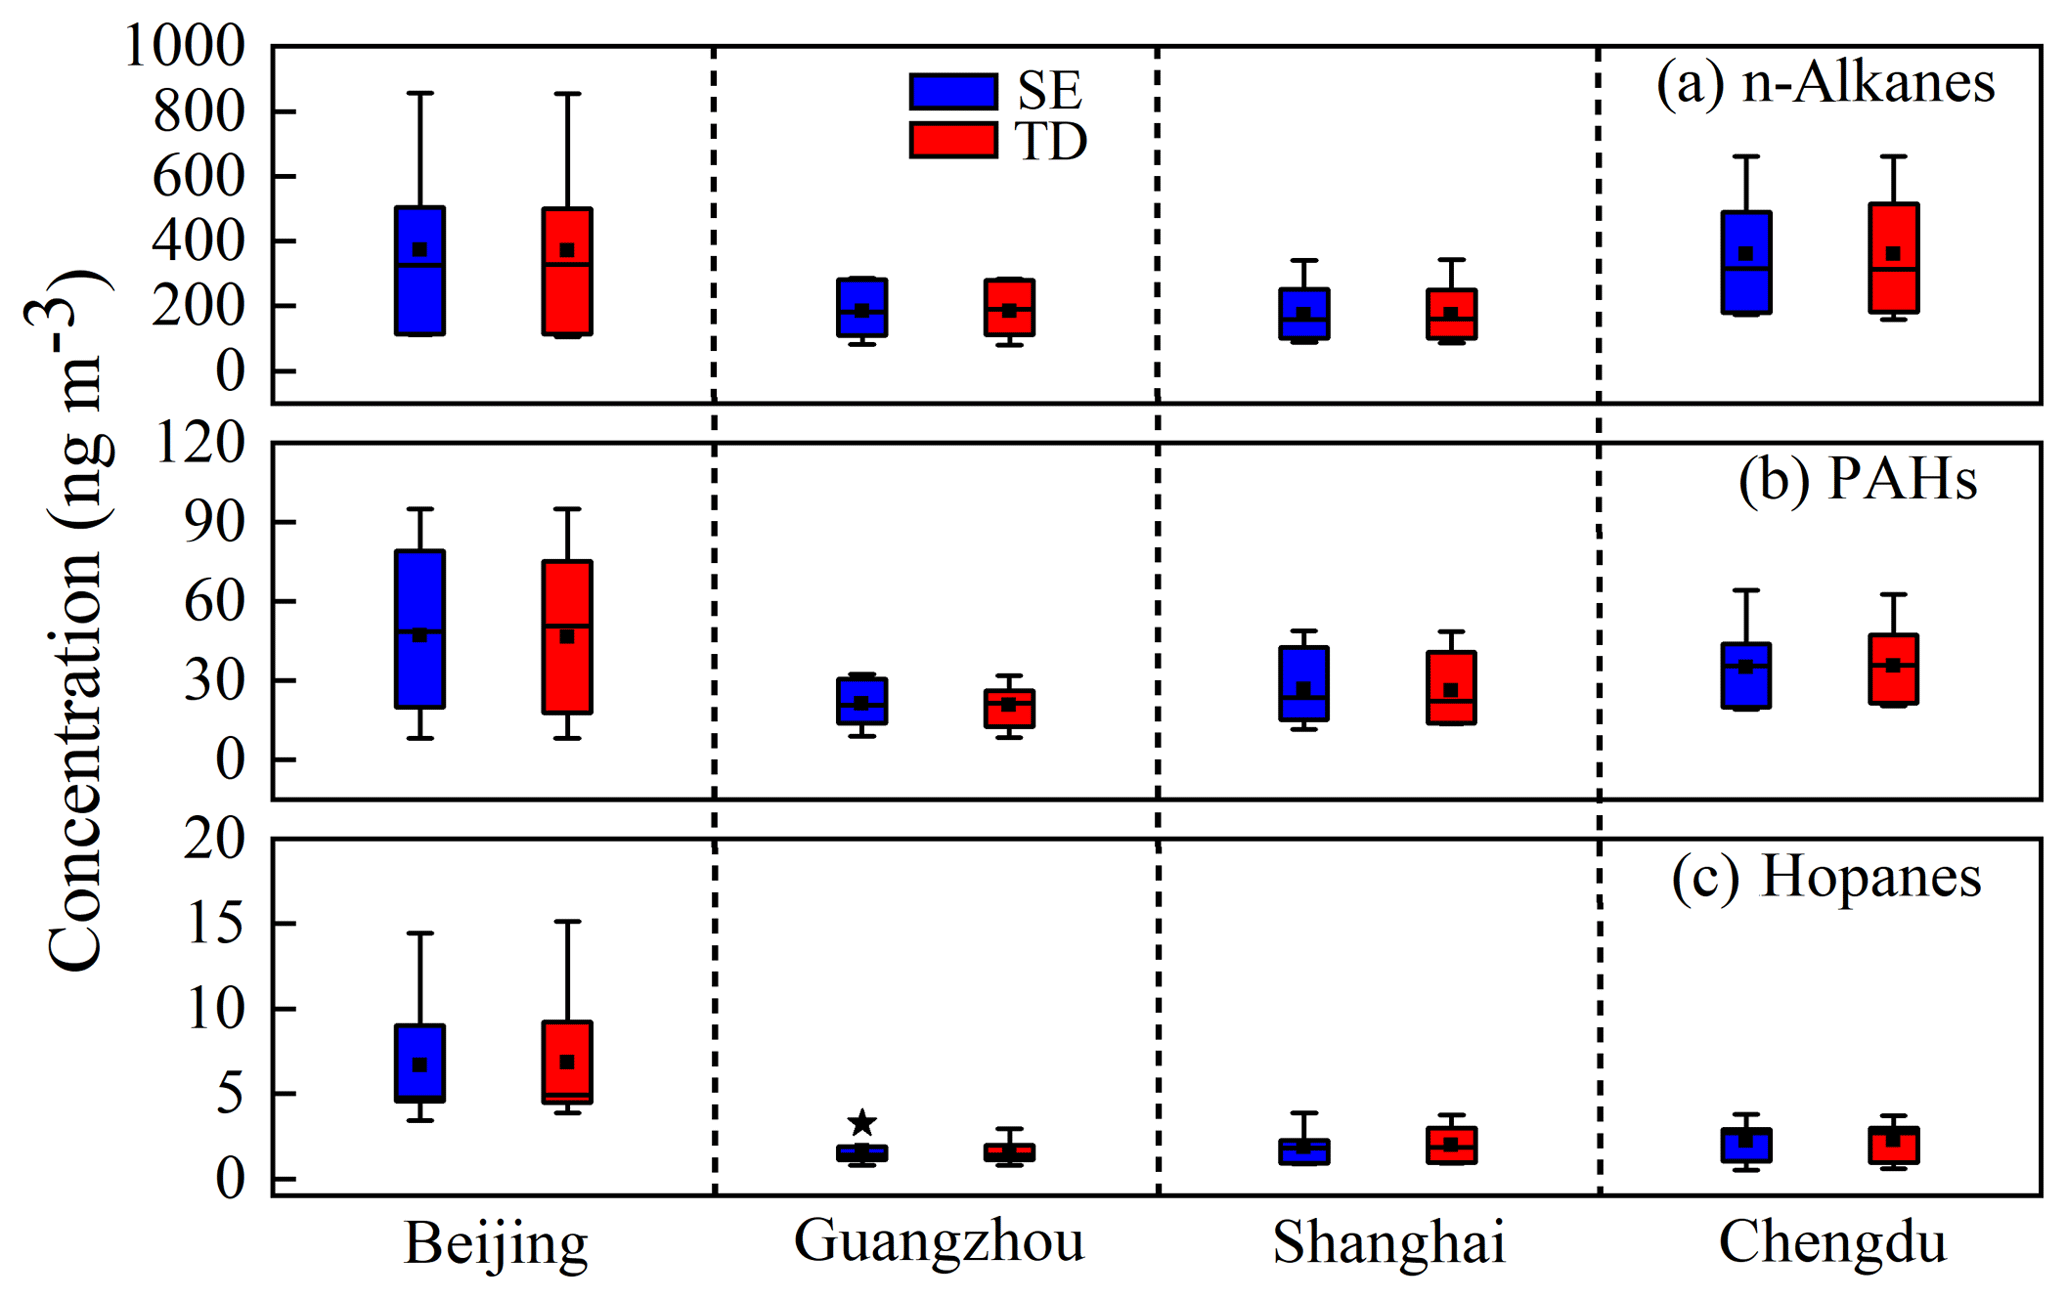
Figure 7Box plots of n-alkanes (a), PAHs (b) and hopanes (c) concentrations (ng m−3) in Beijing, Guangzhou, Shanghai and Chengdu during winter 2013. The boxes represent the 25th percentile (lower edge), median (solid line), mean (cube mark) and 75th percentile (higher edge). The whiskers represent the minimum and maximum. The star mark represented one outlier for the samples collected in Guangzhou.
Generally, the total n-alkane concentrations rank in the order Shanghai < Guangzhou < Chengdu < Beijing, but PAHs and hopanes concentrations are in the order of Guangzhou < Shanghai < Chengdu < Beijing (Fig. 7). The average n-alkane concentration in Beijing and Chengdu (∼ 400 ng m−3) are 2 times that of Guangzhou and Shanghai (∼200 ng m−3). The average concentrations of PAHs (the total of 14 PAHs) in Beijing are 46.4–47.1 ng m−3, which are nearly 2 times higher than those in Guangzhou (20.8–21.3 ng m−3), 1.7 times higher than those in Shanghai (26.2–26.7 ng m−3) and 1.3 times higher than those in Chengdu (35.0–35.6 ng m−3). For hopanes, the concentrations in Beijing (∼6 ng m−3) are 3 times higher than those in Chengdu, around 4 times higher than those in Shanghai and Guangzhou. As discussed above, the reasons for the higher concentrations of n-alkanes, PAHs and hopanes observed in Beijing were attributed to emissions from traffic and/or coal combustion for wintertime heating.
This study evaluated and compared the analytical performances of SE-GC-MS and TD-GC-MS for the determination of n-alkanes, PAHs and hopanes by analyzing both standards and ambient PM2.5 samples from four Chinese megacities. For the SE method, the recovery obtained is 89.4 %–101.5 %, the limits of detection (LODs) are 0.05–1.1 ng (1.5–33.9 ng m−3), repeatability is 3.5 %–14.5 % and reproducibility is 1.2 %–10.9 %, while for the TD approach, the recovery is 57.2 %–109.8 %, the limits of detection are 0.09–1.9 ng (0.04–0.9 ng m−3), repeatability is 2.1 %–19.4 % and reproducibility is 1.1 %–12.9 %. Ambient aerosol samples were simultaneously collected from Beijing, Chengdu, Shanghai and Guangzhou during the winter of 2013 and were analyzed by the two methods. Although TD-GC-MS exhibit relatively lower recoveries for lighter n-alkanes and heavier n-alkanes, after correction the two methods show a good agreement with a high correlation efficient (R2>0.98) and a slope close to unity. Moreover, n-alkane, PAH and hopane concentrations in wintertime are found to be much higher in Beijing than those in Chengdu, Shanghai and Guangzhou, likely due to vehicular emissions and/or coal combustion for heating in Beijing.
Raw data used in this study are archived at the Institute of Earth Environment, Chinese Academy of Sciences, and are available on request by contacting the corresponding author.
The supplement related to this article is available online at: https://doi.org/10.5194/amt-12-4779-2019-supplement.
RJH designed the study. MW and HYN performed the sampling. MW did the GC-MS analyses. MW and RJH interpreted the data, prepared the display items and wrote the paper. All authors commented on the paper.
The authors declare that they have no conflict of interest.
This work was supported by the National Natural Science Foundation of China (NSFC; grant nos. 91644219, 41877408 and 4171101096), the National Key Research and Development Program of China (grant no. 2017YFC0212701), State Key Laboratory of Loess and Quaternary Geology (SKLLQG) (grant no. SKLLQG1531) and the Cross Innovative Team fund from the SKLLQG (grant no. SKLLQGTD1801).
This research has been supported by the National Natural Science Foundation of China (NSFC) (grant nos. 91644219, 41877408 and 4171101096), the National Key Research and Development Program of China (grant no. 2017YFC0212701), State Key Laboratory of Loess and Quaternary Geology (SKLLQG) (grant no. SKLLQG1531) and the Cross Innovative Team fund from the SKLLQG (grant no. SKLLQGTD1801).
This paper was edited by Pierre Herckes and reviewed by four anonymous referees.
Alves, C., Pio, C., and Duarte, A.: Composition of extractable organic matter of air particles from rural and urban Portuguese areas, Atmos. Environ., 35, 5485–5496, 2001.
Bartlett, J. W. and Frost, C.: Reliability, repeatability and reproducibility: analysis of measurement errors in continuous variables, Ultrasound. Obst. Gyn., 31, 466–475, https://doi.org/10.1002/uog.5256, 2008.
Cao, J., Xu, H., Xu, Q., Chen, B., and Kan, H.: Fine particulate matter constituents and cardiopulmonary mortality in a heavily polluted Chinese city, Environ. Health Perspect., 120, 373–378, https://doi.org/10.1289/ehp.1103671, 2012.
Chan, A. W. H., Isaacman, G., Wilson, K. R., Worton, D. R., Ruehl, C. R., Nah, T., Gentner, D. R., Dallmann, T. R., Kirchstetter, T. W., Harley, R. A., Gilman, J. B., Kuster, W. C., de Gouw, J. A., Offenberg, J. H., Kleindienst, T. E., Lin, Y. H., Rubitschun, C. L., Surratt, J. D., Hayes, P. L., Jimenez, J. L., and Goldstein, A. H.: Detailed chemical characterization of unresolved complex mixtures in atmospheric organics: Insights into emission sources, atmospheric processing, and secondary organic aerosol formation, J. Geophys. Res.-Atmos., 118, 6783–6796, https://doi.org/10.1002/jgrd.50533, 2013.
Chan, C. K. and Yao, X.: Air pollution in mega cities in China, Atmos. Environ., 42, 1–42, https://doi.org/10.1016/j.atmosenv.2007.09.003, 2008.
Chan, M. N., Surratt, J. D., Chan, A. W. H., Schilling, K., Offenberg, J. H., Lewandowski, M., Edney, E. O., Kleindienst, T. E., Jaoui, M., Edgerton, E. S., Tanner, R. L., Shaw, S. L., Zheng, M., Knipping, E. M., and Seinfeld, J. H.: Influence of aerosol acidity on the chemical composition of secondary organic aerosol from β-caryophyllene, Atmos. Chem. Phys., 11, 1735–1751, https://doi.org/10.5194/acp-11-1735-2011, 2011.
Cheruiyot, N. K., Lee, W. J., Mwangi, J. K., Wang, L. C., Lin, N. H., Lin, Y. C., Cao, J., Zhang, R., and Guo-Ping, C. C.: An Overview: Polycyclic Aromatic Hydrocarbon Emissions from the Stationary and Mobile Sources and in the Ambient Air, Aerosol Air Qual. Res., 15, 2730–2762, https://doi.org/10.4209/aaqr.2015.11.0627, 2015.
Chow, J. C., Yu, J. Z., Watson, J. G., Hang Ho, S. S., Bohannan, T. L., Hays, M. D., and Fung, K. K.: The application of thermal methods for determining chemical composition of carbonaceous aerosols: A review, J. Environ. Sci. Health A, 42, 1521–1541, https://doi.org/10.1080/10934520701513365, 2007.
Cohen, A. J., Brauer, M., Burnett, R., Anderson, H. R., Frostad, J., Estep, K., Balakrishnan, K., Brunekreef, B., Dandona, L., Dandona, R., Feigin, V., Freedman, G., Hubbell, B., Jobling, A., Kan, H., Knibbs, L., Liu, Y., Martin, R., Morawska, L., Pope, C. A., Shin, H., Straif, K., Shaddick, G., Thomas, M., van Dingenen, R., van Donkelaar, A., Vos, T., Murray, C. J. L., and Forouzanfar, M. H.: Estimates and 25-year trends of the global burden of disease attributable to ambient air pollution: an analysis of data from the Global Burden of Diseases Study 2015, Lancet, 389, 1907–1918, https://doi.org/10.1016/S0140-6736(17)30505-6, 2017.
Dockery, D. W. and Stone, P. H.: Cardiovascular Risks from Fine Particulate Air Pollution, N. Engl. J. Med., 356, 511–513, https://doi.org/10.1056/NEJMe068274, 2007.
Elser, M., Huang, R.-J., Wolf, R., Slowik, J. G., Wang, Q., Canonaco, F., Li, G., Bozzetti, C., Daellenbach, K. R., Huang, Y., Zhang, R., Li, Z., Cao, J., Baltensperger, U., El-Haddad, I., and Prévôt, A. S. H.: New insights into PM2.5 chemical composition and sources in two major cities in China during extreme haze events using aerosol mass spectrometry, Atmos. Chem. Phys., 16, 3207–3225, https://doi.org/10.5194/acp-16-3207-2016, 2016.
Fu, P., Aggarwal, S. G., Chen, J., Li, J., Sun, Y., Wang, Z., Chen, H., Liao, H., Ding, A., Umarji, G. S., Patil, R. S., Chen, Q., and Kawamura, K.: Molecular Markers of Secondary Organic Aerosol in Mumbai, India, Environ. Sci. Technol., 50, 4659–4667, https://doi.org/10.1021/acs.est.6b00372, 2016.
Fujii, Y., Mahmud, M., Oda, M., Tohno, S., Matsumoto, J., and Mizohata, A.: A Key Indicator of Transboundary Particulate Matter Pollution Derived from Indonesian Peatland Fires in Malaysia, Aerosol Air Qual. Res., 16, 69–78, https://doi.org/10.4209/aaqr.2015.04.0215, 2016.
Giri, B., Patel, K. S., Jaiswal, N. K., Sharma, S., Ambade, B., Wang, W., Simonich, S. L. M., and Simoneit, B. R.: Composition and sources of organic tracers in aerosol particles of industrial central India, Atmos. Res., 120, 312–324, 2013.
Graham, L. A., Tong, A., Poole, G., Ding, L., Ke, F., Wang, D., Caravaggio, G., Charland, J.-P., MacDonald, P., and Hall, A.: A comparison of direct thermal desorption with solvent extraction for gas chromatography-mass spectrometry analysis of semivolatile organic compounds in diesel particulate matter, Int. J. Environ. Anal. Chem., 90, 511–534, https://doi.org/10.1080/03067310903108352, 2010.
Gustafson, W. I., Qian, Y., and Fast, J. D.: Downscaling aerosols and the impact of neglected subgrid processes on direct aerosol radiative forcing for a representative global climate model grid spacing, J. Geophys. Res.-Atmos., 116, 69–78, https://doi.org/10.1029/2010JD015480, 2011.
Ho, S. S. H. and Yu, J. Z.: In-injection port thermal desorption and subsequent gas chromatography–mass spectrometric analysis of polycyclic aromatic hydrocarbons and n-alkanes in atmospheric aerosol samples, J. Chromatogr. A, 1059, 121–129, https://doi.org/10.1016/j.chroma.2004.10.013, 2004.
Ho, S. S. H., Yu, J. Z., Chow, J. C., Zielinska, B., Watson, J. G., Sit, E. H. L., and Schauer, J. J.: Evaluation of an in-injection port thermal desorption-gas chromatography/mass spectrometry method for analysis of non-polar organic compounds in ambient aerosol samples, J. Chromatogr. A, 1200, 217–227, https://doi.org/10.1016/j.chroma.2008.05.056, 2008.
Hoffmann, T., Huang, R.-J., and Kalberer, M.: Atmospheric Analytical Chemistry, Anal. Chem., 83, 4649–4664, https://doi.org/10.1021/ac2010718, 2011.
Hu, W. W., Campuzano-Jost, P., Palm, B. B., Day, D. A., Ortega, A. M., Hayes, P. L., Krechmer, J. E., Chen, Q., Kuwata, M., Liu, Y. J., de Sá, S. S., McKinney, K., Martin, S. T., Hu, M., Budisulistiorini, S. H., Riva, M., Surratt, J. D., St. Clair, J. M., Isaacman-Van Wertz, G., Yee, L. D., Goldstein, A. H., Carbone, S., Brito, J., Artaxo, P., de Gouw, J. A., Koss, A., Wisthaler, A., Mikoviny, T., Karl, T., Kaser, L., Jud, W., Hansel, A., Docherty, K. S., Alexander, M. L., Robinson, N. H., Coe, H., Allan, J. D., Canagaratna, M. R., Paulot, F., and Jimenez, J. L.: Characterization of a real-time tracer for isoprene epoxydiols-derived secondary organic aerosol (IEPOX-SOA) from aerosol mass spectrometer measurements, Atmos. Chem. Phys., 15, 11807–11833, https://doi.org/10.5194/acp-15-11807-2015, 2015.
Huang, R. J., Zhang, Y., Bozzetti, C., Ho, K. F., Cao, J. J., Han, Y., Daellenbach, K. R., Slowik, J. G., Platt, S. M., Canonaco, F., Zotter, P., Wolf, R., Pieber, S. M., Bruns, E. A., Crippa, M., Ciarelli, G., Piazzalunga, A., Schwikowski, M., Abbaszade, G., Schnelle-Kreis, J., Zimmermann, R., An, Z., Szidat, S., Baltensperger, U., Haddad, I. E., and Prévôt, A. S. H.: High secondary aerosol contribution to particulate pollution during haze events in China, Nature, 514, 218–222, https://doi.org/10.1038/nature13774, 2014.
IPCC: Climate change 2013: the physical science basis: Working Group I contribution to the Fifth assessment report of the Intergovernmental Panel on Climate Change, Cambridge University Press, Cambridge, 2014.
Jiang, Q., Sun, Y. L., Wang, Z., and Yin, Y.: Aerosol composition and sources during the Chinese Spring Festival: fireworks, secondary aerosol, and holiday effects, Atmos. Chem. Phys., 15, 6023–6034, https://doi.org/10.5194/acp-15-6023-2015, 2015.
Jimenez, J. L., Canagaratna, M. R., Donahue, N. M., Prevot, A. S. H., Zhang, Q., Kroll, J. H., DeCarlo, P. F., Allan, J. D., Coe, H., Ng, N. L., Aiken, A. C., Docherty, K. S., Ulbrich, I. M., Grieshop, A. P., Robinson, A. L., Duplissy, J., Smith, J. D., Wilson, K. R., Lanz, V. A., Hueglin, C., Sun, Y. L., Tian, J., Laaksonen, A., Raatikainen, T., Rautiainen, J., Vaattovaara, P., Ehn, M., Kulmala, M., Tomlinson, J. M., Collins, D. R., Cubison, M. J., Dunlea, J., Huffman, J. A., Onasch, T. B., Alfarra, M. R., Williams, P. I., Bower, K., Kondo, Y., Schneider, J., Drewnick, F., Borrmann, S., Weimer, S., Demerjian, K., Salcedo, D., Cottrell, L., Griffin, R., Takami, A., Miyoshi, T., Hatakeyama, S., Shimono, A., Sun, J. Y., Zhang, Y. M., Dzepina, K., Kimmel, J. R., Sueper, D., Jayne, J. T., Herndon, S. C., Trimborn, A. M., Williams, L. R., Wood, E. C., Middlebrook, A. M., Kolb, C. E., Baltensperger, U., and Worsnop, D. R.: Evolution of Organic Aerosols in the Atmosphere, Science, 326, 1525–1529, https://doi.org/10.1126/science.1180353, 2009.
Kanakidou, M., Seinfeld, J. H., Pandis, S. N., Barnes, I., Dentener, F. J., Facchini, M. C., Van Dingenen, R., Ervens, B., Nenes, A., Nielsen, C. J., Swietlicki, E., Putaud, J. P., Balkanski, Y., Fuzzi, S., Horth, J., Moortgat, G. K., Winterhalter, R., Myhre, C. E. L., Tsigaridis, K., Vignati, E., Stephanou, E. G., and Wilson, J.: Organic aerosol and global climate modelling: a review, Atmos. Chem. Phys., 5, 1053–1123, https://doi.org/10.5194/acp-5-1053-2005, 2005.
Katsoyiannis, A., Sweetman, A. J., and Jones, K. C.: PAH Molecular Diagnostic Ratios Applied to Atmospheric Sources: A Critical Evaluation Using Two Decades of Source Inventory and Air Concentration Data from the UK, Environ. Sci. Technol., 45, 8897–8906, https://doi.org/10.1021/es202277u, 2011.
Kim, J. W., Kim, Y.-M., Moon, H. M., Hosaka, A., Watanabe, C., Teramae, N., Choe, E. K., and Myung, S.-W.: Comparative study of thermal desorption and solvent extraction-gas chromatography–mass spectrometric analysis for the quantification of phthalates in polymers, J. Chromatogr. A, 1451, 33–40, https://doi.org/10.1016/j.chroma.2016.05.014, 2016.
Kourtchev, I., Copolovici, L., Claeys, M., and Maenhaut, W.: Characterization of Atmospheric Aerosols at a Forested Site in Central Europe, 43, Environ. Sci. Technol., 4665–4671, https://doi.org/10.1021/es803055w, 2009.
Lambe, A. T., Chacon-Madrid, H. J., Nguyen, N. T., Weitkamp, E. A., Kreisberg, N. M., Hering, S. V., Goldstein, A. H., Donahue, N. M., and Robinson, A. L.: Organic aerosol speciation: Intercomparison of thermal desorption aerosol GC/MS (TAG) and filter-based techniques, Aerosol Sci. Technol., 44, 141–151, https://doi.org/10.1080/02786820903447206, 2010.
Lelieveld, J., Evans, J. S., Fnais, M., Giannadaki, D., and Pozzer, A.: The contribution of outdoor air pollution sources to premature mortality on a global scale, 525, 367–371, https://doi.org/10.1038/nature15371, 2015.
Lin, Y., Huang, K., Zhuang, G., Fu, J. S., Wang, Q., Liu, T., Deng, C., and Fu, Q.: A multi-year evolution of aerosol chemistry impacting visibility and haze formation over an Eastern Asia megacity, Shanghai, Atmos. Environ., 92, 76–86, https://doi.org/10.1016/j.atmosenv.2014.04.007, 2014.
Maenhaut, W., Chi, X., Wang, W., Cafmeyer, J., Yasmeen, F., Vermeylen, R., Szmigielska, K., Janssens, I. A., and Claeys, M.: Contribution from Selected Organic Species to PM2.5 Aerosol during a Summer Field Campaign at K-Puszta, Hungary, Atmosphere, 8, 221–234, https://doi.org/10.3390/atmos8110221, 2017.
Mancilla, Y., Mendoza, A., Fraser, M. P., and Herckes, P.: Organic composition and source apportionment of fine aerosol at Monterrey, Mexico, based on organic markers, Atmos. Chem. Phys., 16, 953–970, https://doi.org/10.5194/acp-16-953-2016, 2016a.
Mancilla, Y., Mendoza, A., Fraser, M. P., and Herckes, P.: Organic composition and source apportionment of fine aerosol at Monterrey, Mexico, based on organic markers, Atmos. Chem. Phys., 16, 953–970, https://doi.org/10.5194/acp-16-953-2016, 2016b.
Mohseni Bandpi, A., Eslami, A., Shahsavani, A., Khodagholi, F., Aliaghaei, A., and Alinejad, A.: Water-soluble and organic extracts of ambient PM2.5 in Tehran air: assessment of genotoxic effects on human lung epithelial cells (A549) by the Comet assay, Toxin Rev., 36, 116–124, https://doi.org/10.1080/15569543.2016.1259634, 2017.
Nozière, B., Kalberer, M., Claeys, M., Allan, J., D'Anna, B., Decesari, S., Finessi, E., Glasius, M., Grgić, I., Hamilton, J. F., Hoffmann, T., Iinuma, Y., Jaoui, M., Kahnt, A., Kampf, C. J., Kourtchev, I., Maenhaut, W., Marsden, N., Saarikoski, S., Schnelle-Kreis, J., Surratt, J. D., Szidat, S., Szmigielski, R., and Wisthaler, A.: The Molecular Identification of Organic Compounds in the Atmosphere: State of the Art and Challenges, Chem. Rev., 115, 3919–3983, https://doi.org/10.1021/cr5003485, 2015.
Okuda, T., Naoi, D., Tenmoku, M., Tanaka, S., He, K., Ma, Y., Yang, F., Lei, Y., Jia, Y., and Zhang, D.: Polycyclic aromatic hydrocarbons (PAHs) in the aerosol in Beijing, China, measured by aminopropylsilane chemically-bonded stationary-phase column chromatography and HPLC/fluorescence detection, Chemosphere, 65, 427–435, https://doi.org/10.1016/j.chemosphere.2006.01.064, 2006.
Orecchio, S.: Polycyclic aromatic hydrocarbons (PAHs) in indoor emission from decorative candles, Atmos. Environ., 45, 1888–1895, https://doi.org/10.1016/j.atmosenv.2010.12.024, 2011.
Oros, D. R. and Simoneit, B. R. T.: Identification and emission rates of molecular tracers in coal smoke particulate matter, Fuel, 79, 515–536, https://doi.org/10.1016/S0016-2361(99)00153-2, 2000.
Ramírez, N., Cuadras, A., Rovira, E., Borrull, F., and Marcé, R. M.: Comparative study of solvent extraction and thermal desorption methods for determining a wide range of volatile organic compounds in ambient air, Talanta, 82, 719–727, https://doi.org/10.1016/j.talanta.2010.05.038, 2010.
Samy, S., Mazzoleni, L. R., Mishra, S., Zielinska, B., and Hallar, A. G.: Water-soluble organic compounds at a mountain-top site in Colorado, USA, Atmos. Environ., 44, 1663–1671, https://doi.org/10.1016/j.atmosenv.2010.01.033, 2010.
Schauer, J. J., Kleeman, M. J., Cass, G. R., and Simoneit, B. R. T.: Measurement of Emissions from Air Pollution Sources, 5, C1-C32 Organic Compounds from Gasoline-Powered Motor Vehicles, Environ. Sci. Technol., 36, 1169–1180, https://doi.org/10.1021/es0108077, 2002.
Shen, X. J., Sun, J. Y., Zhang, X. Y., Zhang, Y. M., Zhang, L., Che, H. C., Ma, Q. L., Yu, X. M., Yue, Y., and Zhang, Y. W.: Characterization of submicron aerosols and effect on visibility during a severe haze-fog episode in Yangtze River Delta, China, Atmos. Environ., 120, 307–316, https://doi.org/10.1016/j.atmosenv.2015.09.011, 2015.
Srivastava, D., Favez, O., Perraudin, E., Villenave, E., and Albinet, A.: Comparison of measurement-based methodologies to apportion secondary organic carbon (SOC) in PM2.5: a review of recent studies, Atmosphere, 9, 452–507, https://doi.org/10.3390/atmos9110452, 2018.
Surratt, J. D., Gómez-González, Y., Chan, A. W. H., Vermeylen, R., Shahgholi, M., Kleindienst, T. E., Edney, E. O., Offenberg, J. H., Lewandowski, M., Jaoui, M., Maenhaut, W., Claeys, M., Flagan, R. C., and Seinfeld, J. H.: Organosulfate Formation in Biogenic Secondary Organic Aerosol, J. Phys. Chem. A, 112, 8345–8378, https://doi.org/10.1021/jp802310p, 2008.
Takegawa, N., Miyakawa, T., Kondo, Y., Jimenez, J., Zhang, Q., Worsnop, D., and Fukuda, M.: Seasonal and diurnal variations of submicron organic aerosol in Tokyo observed using the Aerodyne aerosol mass spectrometer, J. Geophys. Res.-Atmos., 111, D11206, https://doi.org/10.1029/2005JD006515, 2006.
Tobiszewski, M. and Namieśnik, J.: PAH diagnostic ratios for the identification of pollution emission sources, Environ. Pollut., 162, 110–119, https://doi.org/10.1016/j.envpol.2011.10.025, 2012.
Urban, R., Alves, C., Allen, A. G., Cardoso, A. A., Queiroz, M., and Campos, M.: Sugar markers in aerosol particles from an agro-industrial region in Brazil, Atmos. Environ., 90, 106–112, 2014.
Wang, J., Ho, S. S. H., Cao, J., Huang, R., Zhou, J., Zhao, Y., Xu, H., Liu, S., Wang, G., and Shen, Z.: Characteristics and major sources of carbonaceous aerosols in PM2.5 from Sanya, China, Sci. Total Environ., 530, 110–119, https://doi.org/10.1016/j.scitotenv.2015.05.005, 2015.
Wang, K., Zhang, Y., Huang, R.-J., Cao, J., and Hoffmann, T.: UHPLC-Orbitrap mass spectrometric characterization of organic aerosol from a central European city (Mainz, Germany) and a Chinese megacity (Beijing), 189, 22–29, https://doi.org/10.1016/j.atmosenv.2018.06.036, 2018.
Worton, D. R., Isaacman, G., Gentner, D. R., Dallmann, T. R., Chan, A. W. H., Ruehl, C., Kirchstetter, T. W., Wilson, K. R., Harley, R. A., and Goldstein, A. H.: Lubricating Oil Dominates Primary Organic Aerosol Emissions from Motor Vehicles, 48, 3698–3706, https://doi.org/10.1021/es405375j, 2014.
Xu, H. M., Tao, J., Ho, S. S. H., Ho, K. F., Cao, J. J., Li, N., Chow, J. C., Wang, G. H., Han, Y. M., Zhang, R. J., Watson, J. G., and Zhang, J. Q.: Characteristics of fine particulate non-polar organic compounds in Guangzhou during the 16th Asian Games: Effectiveness of air pollution controls, Atmos. Environ., 76, 94–101, https://doi.org/10.1016/j.atmosenv.2012.12.037, 2013.
Yang, T.-T., Hsu, C.-Y., Chen, Y.-C., Young, L.-H., Huang, C.-H., and Ku, C.-H.: Characteristics, sources, and health risks of atmospheric PM2.5-bound polycyclic aromatic hydrocarbons in Hsinchu, Taiwan, Aerosol Air Qual. Res, 17, 563–573, https://doi.org/10.4209/aaqr.2016.06.0283, 2017.
Yu, R., Duan, L., Jiang, J., and Hao, J.: An optimized two-step derivatization method for analyzing diethylene glycol ozonation products using gas chromatography and mass spectrometry, J. Environ. Sci., 53, 313–321, https://doi.org/10.1016/j.jes.2016.02.021, 2017.
Zhang, H., Yee, L. D., Lee, B. H., Curtis, M. P., Worton, D. R., Isaacman-VanWertz, G., Offenberg, J. H., Lewandowski, M., Kleindienst, T. E., Beaver, M. R., Holder, A. L., Lonneman, W. A., Docherty, K. S., Jaoui, M., Pye, H. O. T., Hu, W., Day, D. A., Campuzano-Jost, P., Jimenez, J. L., Guo, H., Weber, R. J., de Gouw, J., Koss, A. R., Edgerton, E. S., Brune, W., Mohr, C., Lopez-Hilfiker, F. D., Lutz, A., Kreisberg, N. M., Spielman, S. R., Hering, S. V., Wilson, K. R., Thornton, J. A., and Goldstein, A. H.: Monoterpenes are the largest source of summertime organic aerosol in the southeastern United States, P. Natl. Acad. Sci. USA, 115, 2038–2043, https://doi.org/10.1073/pnas.1717513115, 2018.
Zhang, Q., Jimenez, J. L., Canagaratna, M., Allan, J., Coe, H., Ulbrich, I., Alfarra, M., Takami, A., Middlebrook, A., and Sun, Y.: Ubiquity and dominance of oxygenated species in organic aerosols in anthropogenically-influenced Northern Hemisphere midlatitudes, Geophys. Res. Lett., 34, L13801, https://doi.org/10.1029/2007GL029979, 2007.
Zhang, Q., He, K., and Huo, H.: Cleaning China's air, 484, 161–162, https://doi.org/10.1038/484161a, 2012.
Zhang, Y., Schauer, J. J., Zhang, Y., Zeng, L., Wei, Y., Liu, Y., and Shao, M.: Characteristics of Particulate Carbon Emissions from Real-World Chinese Coal Combustion, Environ. Sci. Technol., 42, 5068–5073, https://doi.org/10.1021/es7022576, 2008.
Zhao, X., Zhang, X., Xu, X., Xu, J., Meng, W., and Pu, W.: Seasonal and diurnal variations of ambient PM2.5 concentration in urban and rural environments in Beijing, Atmos. Environ., 43, 2893–2900, https://doi.org/10.1016/j.atmosenv.2009.03.009, 2009.
Zheng, S., Pozzer, A., Cao, C. X., and Lelieveld, J.: Long-term (2001–2012) concentrations of fine particulate matter (PM2.5) and the impact on human health in Beijing, China, Atmos. Chem. Phys., 15, 5715–5725, https://doi.org/10.5194/acp-15-5715-2015, 2015.