the Creative Commons Attribution 4.0 License.
the Creative Commons Attribution 4.0 License.
 | 20 Sep 2019
Evaluation of GPM-DPR precipitation estimates with WegenerNet gauge data
Martin Lasser
Sungmin O
Ulrich Foelsche
The core satellite of the Global Precipitation Measurement (GPM) mission provides precipitation observations measured with the Dual-frequency Precipitation Radar (DPR). The precipitation can only be estimated from the radar data, and therefore independent validations using direct precipitation measurements on the ground as a true reference need to be performed. Moreover, the quality and the accuracy of satellite observational data depend on various influencing factors, such as altitude, topography and rainfall type. In this way, a validation may help to minimise those uncertainties. The DPR Level 2 algorithms provide three different sets of radar rain rate estimates: Ku-band-only rain rates, Ka-band-only rain rates, and a product using both the Ku and Ka band. This study presents an evaluation of the three GPM-DPR surface precipitation estimates based on the gridded precipitation data of the WegenerNet, a local-scale terrestrial network of 153 meteorological stations in southeastern Austria.
The validation is based on graphical and statistical approaches, using only data where both Ku- and Ka-band measurements are available. The focus lies on the resemblance of the rainfall variability within the whole network and the over- and underestimation of the precipitation through the GPM-DPR. The analysis rests upon 15 rainfall events observed by the GPM-DPR over the WegenerNet in the last 4 years; the meteorological winter is excluded due to technical challenges of snow measurements. The WegenerNet provides between 8 and 12 gauges within each GPM-DPR footprint. Its biases are well studied and corrected; thus, it can be taken as a robust ground reference. This work also includes considerations on the limits of such comparisons between small terrestrial networks with a high density of stations and precipitation observations from a satellite.
Our results show that the GPM-DPR estimates basically match with the WegenerNet measurements, but absolute quantities are biased. The three types of radar estimates deliver similar results, where Ku-band and dual-frequency estimates are very close to each other. On a general level, Ka-band precipitation estimates deliver better results due to their greater sensitivity to low rainfall rates.
- Article
(1365 KB) - Full-text XML
- BibTeX
- EndNote


The Global Precipitation Measurement (GPM) mission aims to give consistent and comprehensive information about Earth's global precipitation. The mission is led by the National Aeronautics and Space Administration (NASA) and the Japan Aerospace and Exploration Agency (JAXA). It is the successor mission of the Tropical Rainfall Measuring Mission (TRMM) and aims to provide advanced information on rain and snow characteristics from multi-satellites. It measures fundamental quantities of the global water cycle, such as the precipitation amount, on a global level. The results are utilised in weather forecasts, flood predictions, river managements and studies on climate variations as well as the assessment of the global water cycle (Skofronick-Jackson et al., 2016; Hou et al., 2014; JAXA, 2017).
The GPM Core Observatory (GPM-CO) is equipped with an active Dual-frequency Precipitation Radar (DPR) and a passive microwave imager (GPM microwave imager – GMI). Together with a constellation of partner satellites from international space and weather agencies, it provides global-scale precipitation data with high temporal resolution. The GPM-CO was launched in 2014 and flies at an altitude of 407 km in a non-Sun-synchronous orbit that covers the Earth from 65∘ S to 65∘ N. Next to its own measurements, it serves as a reference for unifying the data from the partner satellites (Skofronick-Jackson et al., 2016). The main instrument is in principle a weather surveillance radar operating on two frequencies to map weather events across its swath. The two frequencies allow one to estimate the sizes of precipitation particles and detect a wider range of precipitation rates. The GMI completes the core satellite, enables a high temporal resolution for global precipitation maps and serves as a calibrator for the other radiometers in the constellation.
In this study the surface rain rate estimates derived from the DPR are evaluated and compared to the rain-gauge-based gridded data from the WegenerNet. It consists of 153 meteorological stations, constructed in an area of roughly 20 km×15 km, forming a structured grid with a cell area of about 2 km2 for each station (see Fig. 1). Each station measures meteorological quantities such as temperature, humidity and precipitation (see Kirchengast et al., 2014, for further details). In all stations a tipping-bucket rain gauge instrument with a volume of 0.1 mm equivalent is used; however, only 12 contain a heating device, and therefore we excluded the winter precipitation from the evaluation to use a more robust ground reference.
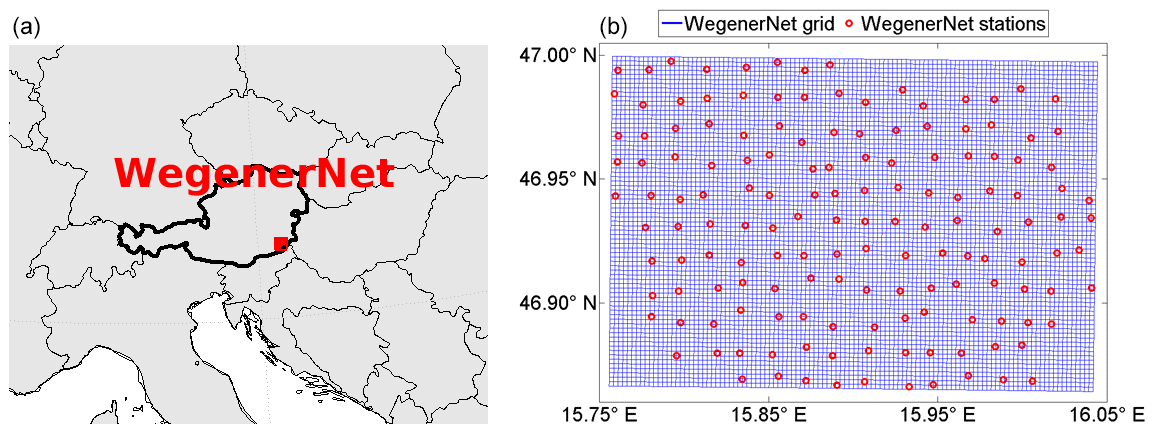
Figure 1(a) Location of the WegenerNet in southeastern Austria. (b) Geometry of the WegenerNet: red circles indicate the meteorological stations, and blue displays the 200 m grid; the area is roughly 20 km×15 km.
Gauge data as ground reference are widely used in many existing validation studies (e.g. Amitai et al., 2015; O et al., 2017; Speirs et al., 2017; Tan et al., 2018; Petracca et al., 2018). Since satellite estimates provide instantaneous precipitation rates and not accumulations, one prerequisite for evaluating with terrestrial gauge data is that the accumulations are as short as possible but still provide high quality information. Even though the WegenerNet is of a very small scale, it delivers in its 5 min accumulations a considerable amount information, especially because of the high spatial resolution in the covered area. Additionally, the biases of the network are known and corrected (see O et al., 2018). Therefore, it is possible to evaluate every DPR footprint based on the information of 8–10 or even more stations. The drawback is the small number of overpasses with actual precipitation, which allows only an event-based analysis.
The paper is structured in four sections. Section 2 gives a description of the data, i.e. rain gauge measurements from the WegenerNet and quantitative precipitation estimates from the GPM-DPR. Section 3 introduces the focus and the methodology of validating GPM-DPR based on a small terrestrial network. Section 4 deals with the results of the validation. Finally, concluding remarks are pointed out in Sect. 5.
2.1 WegenerNet
The WegenerNet is a network of high spatial resolution for weather and climate studies, located in the Feldbach region in southeastern Austria. The region is characterised by moderate hilly landscape in the alpine foreland with altitudes between 260 and 600 m and the valley of the river Raab. The orography and vegetation has no significant influence on the accuracy of the rain gauge measurements, which makes the WegenerNet a reliable reference to obtain areal rainfall from point measurements. Furthermore, a tendency in the GPM-DPR estimates to capture precipitation over flat terrain better than in orographic landscape is observed, e.g. by Speirs et al. (2017) and Watters et al. (2018). The network incorporates 153 weather stations in an area of about 300 km2, employing tipping-bucket gauges. The general user data products are station time series, as well as a 200 m×200 m gridded data set, calculated by applying an inverse-distance-weighted interpolation method. The data products are available online at the WegenerNet web portal (https://wegenernet.org/portal/, last access: 26 August 2019) within 2 h latency. The WegenerNet provides a robust ground reference, its data bias is well studied (O et al., 2018) and it has been used in several other studies for satellite data validation (e.g. O et al., 2017; Kidd et al., 2017). Furthermore, the spatial uncertainties of rainfall over the WegenerNet were investigated, e.g. by O and Foelsche (2019), Kann et al. (2015) and Schroeer et al. (2018). More information on the WegenerNet and its data products can be found in Kirchengast et al. (2014). The tipping-bucket rain gauge instruments collect water up to 0.1 mm equivalent, which is the minimum resolution of the WegenerNet precipitation measurements. Since only a small number of stations are heated, the meteorological winter, i.e. 1 December to the end of February, is excluded from the evaluation. The data from the tipping-bucket gauges are accumulated to 5 min samples, which is the basic data product of the WegenerNet. Consequently, it refers to an interval in time (in contrast to the GPM-DPR estimates, which refer to a point in time).
The high spatial resolution of the WegenerNet enables an investigation of each GPM-DPR footprint based on multiple gauges; thus, it delivers reliable measurements over all amounts of rain. However, due to its small extent and the low sampling frequency of the GPM-DPR, the number of rainfall data samples is limited.
The gridded precipitation and the station-wise precipitation provide very similar information (see Figs. A1 and A2 in the Appendix A). For the evaluation mainly the gridded gauge data were taken into account because of their higher resolution and, therefore, more information on extensive parts of the WegenerNet (such as the area covered by one footprint of the satellite's radar). Furthermore, the gridded data can include rainfall information from gauges that are located outside of DPR footprints but still within a radius of influence.
2.2 GPM-DPR
The GPM-DPR provides rain rate estimations on a global level. The DPR instrument measures on two different channels (Ka band at 35.5 GHz and Ku band at 13.6 GHz) to obtain the three-dimensional structure of precipitation, including heavy and light rainfall.
In general, the strength of the radar echoes is affected by attenuation due to precipitation. The amount of attenuation depends on the number and the size of the hydrometeors. The precipitation radar matches the transmission pulse timings and the radar beam position with the attenuated echo to estimate the size of a raindrop (see JAXA, 2017). The amount of rain is obtained in further processing based on various algorithms (see Iguchi et al., 2015; Seto and Iguchi, 2014). The Ku-band precipitation radar (KuPR) has an observation swath of 245 km with 49 beams (normal scan – NS), each resulting in a circular footprint of 5.2 km diameter. The KuPR is more sensitive to heavy and moderate rainfall. The KaPR (Ka-band precipitation radar), on the other hand, has a swath size of 120 km, where 25 beams between KuPR and KaPR are overlapping, i.e. KaPR matched scan (MS). KaPR shall provide better information on light rainfall and snow. In the high sensitivity scan of KaPR, which is not employed in this evaluation, the beams are interlaced within the scan pattern of the matched beams (Iguchi et al., 2015). The range resolution is 250 m for KuPR and 250/500 m for KaPR. The dual-frequency (DF) rain rate estimation combines Ka- and Ku-band information for the DPR product.
In order to acquire as many rain rate estimates as possible over the WegenerNet, we used KuPR-NS, KuPR-MS and DPR-MS products. The minimum resolution is given by the documents (JAXA, 2017, or sketched by Hou et al., 2014) with 0.2 mm h−1 for the Ka band and the merged product. The Ku-band estimates resolve a minimum 0.5 mm h−1 of rainfall. However, recent evaluations assign to the KuPR estimates the same quality as the Ka band delivers (Tan et al., 2018; Hamada and Takayabu, 2016; Toyoshima et al., 2015).
In contrast to the observations taken by the terrestrial stations, the radar measurements resemble only one point in time and are converted through algorithms (e.g. Iguchi et al., 2015) into a rain rate per hour. This, however, implies that the matching between observation time and location of the rainfall is crucial to the quality of the product.
2.3 Selected data
In order to compare the two kinds of data sets, two requirements have to be met: first, the radar observations must cover the area of the terrestrial network; and, second, precipitation must occur during this short time interval.
To evaluate the GPM-DPR rain rate estimates with the WegenerNet, every event in the DPR data was sought after, where the satellite's swath of all three data types (NS for KuPR and MS for the other two) passes the WegenerNet and rain is detected in at least one of the three GPM-DPR products.
For the study period of 4 years, this yields
-
426 visits of the GPM core satellite over the WegenerNet,
-
with >4000 footprints and
-
24 events with rain detected.
This gives an average of 10 footprints per overpass. Each footprint covers approximately 8–12 stations.
Table 1Evaluated rainfall events. Note that the four highlighted events are analysed in detail.
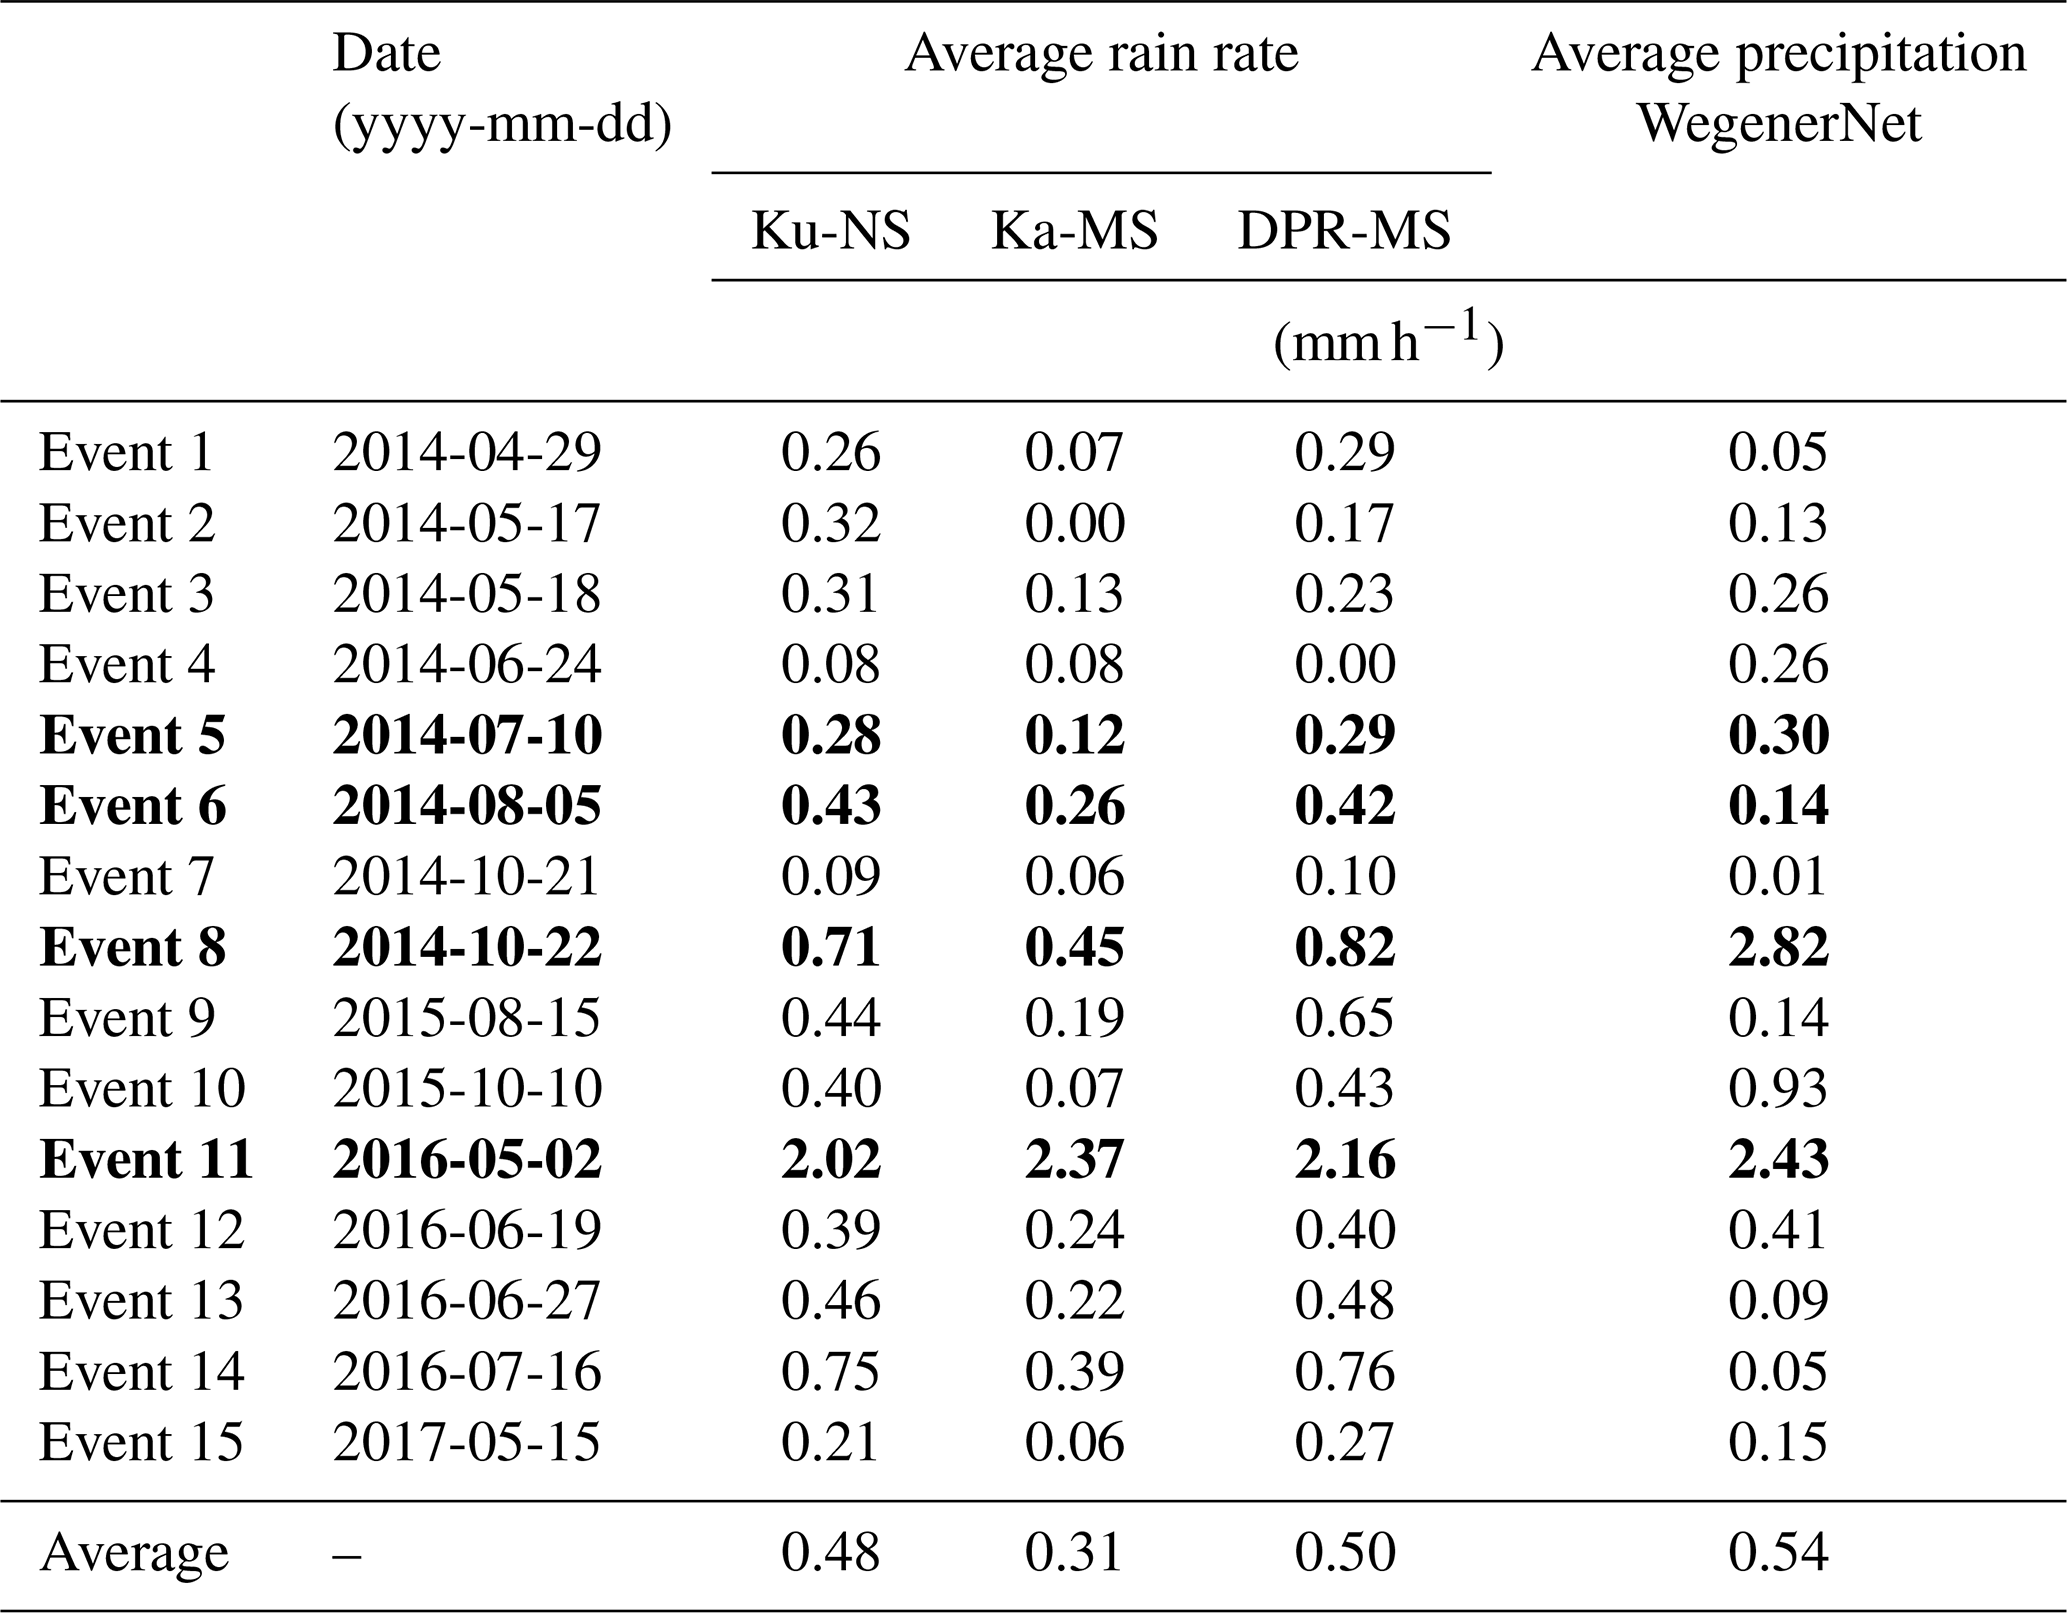
Since the WegenerNet is of a local scale, the satellite's ground track crosses the area only up to 10 times a month. With an average of around 800 mm of rain per year, the region of Feldbach, where the WegenerNet is located, is not the rainiest. Therefore, nine events had to be excluded because of rainfall only slightly outside the WegenerNet. This leaves 15 events with 179 footprints for the evaluation. Table 1 lists the rainfall events considered in this study.
Generally, the events show very light rain, and only two of them feature an average of more than 1 mm h−1. The events in bold lettering are analysed in more detail: two with light rainfall (nos. 5 and 6) and two with heavier rain (nos. 8 and 11).
In order to compare the instantaneous rain rates from the DPR with the gauge accumulations, the shortest possible accumulation time from the WegenerNet, which is 5 min, is taken into account (see Tan et al., 2018; Amitai et al., 2015). Since GPM estimates are given in millimetres per hour (mm h−1), the WegenerNet data are converted from millimetres per 5 min to millimetres per hour.
The data can be easily visualised (see Fig. 2 for event no. 11). Note that the circular footprint is distorted into an ellipse due to the meridian convergence. The GPM-DPR estimates provide one rain rate per footprint and the footprints do not overlap. In contrast to that, the WegenerNet has about 8 to 12 stations per footprint and one cell of the gridded rain gauges covers roughly an area of 200 m×200 m, which sums up to around 500 grid box values per footprint. As one can see in Fig. 2, every footprint contains a large range of rainfall and a lot of variability, which must be approximated with a single GPM-DPR value. For the comparison in this study, the average of the gridded data within the footprint is taken as the most representative value for the WegenerNet, and in a least squares sense it is the best estimation. The kind reader may keep in mind that the GPM-DPR footprint rain rate estimates are treated as mean areal rainfall, thus also averaging intra-footprint rainfall. The DPR misses spatial information of highly variable rainfall events (inter-pixel rainfall variability) within a certain area (see bottom-right plot in Fig. 2). The fact that the WegenerNet captures this inter-pixel rainfall variability and intra-footprint rainfall variability (bottom-left graph of Fig. 2) makes it a robust ground reference.
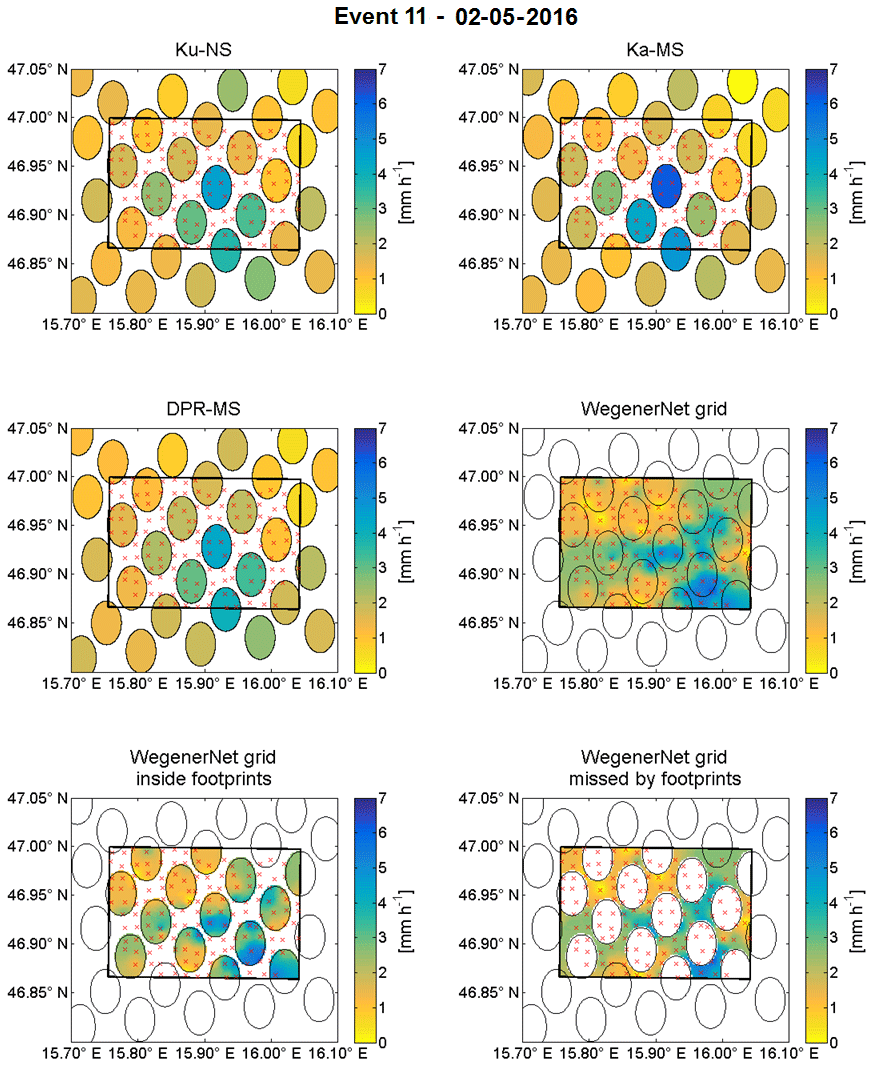
Figure 2Measurements from the GPM-core satellite (Ku-NS, Ka-MS, DPR-MS) in and around the WegenerNet compared to WegenerNet grid data for 2 May 2016 including what is detected by the satellite and what is missed (lower graphs).
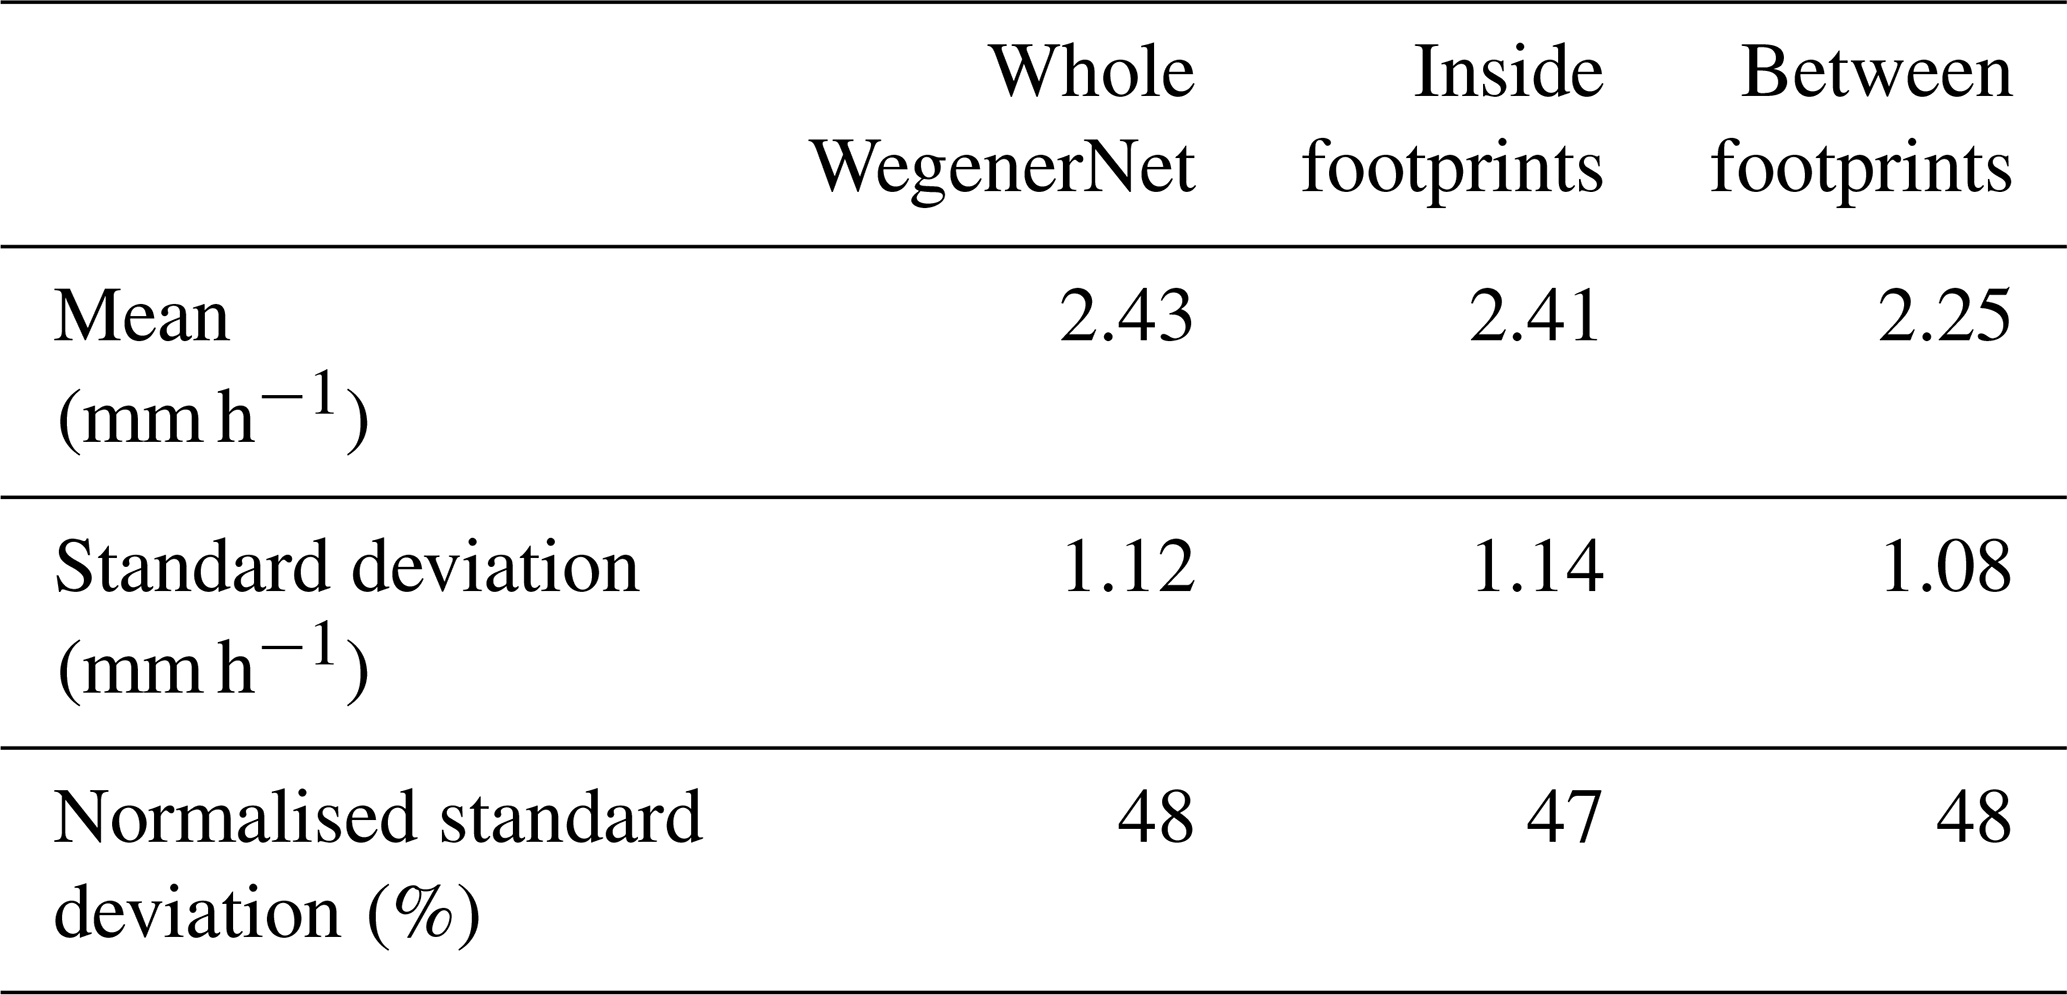
The most important statistical measures on the WegenerNet for 2 May 2016 are provided in Table 2. The large normalised standard deviation implies big variations within the whole area.
Table 2Statistical properties for the WegenerNet on 2 May 2016 (event 11).
The evaluation in this study is based on an interpretation of 15 events using graphical support (such as scatter plots) and mathematical tools: we adopt a correlation, a bias, and a normalised bias between the GPM-DPR and the WegenerNet and statistics based on a contingency table. The statistical items are frequency bias index (FBI), probability of detection (POD), false alarm ratio (FAR), critical success index (CSI), equitable threat score (ETS) and Heidke skill score (HSS). The events are not interrelated, and no time series analysis can be applied. Therefore, the interpretation is event-based.
The GPM-DPR delivers one rain rate value per footprint. The WegenerNet gridded gauge data are mapped to each footprint. All grid cells inside one circular footprint and the grid cells that are intersected by the footprint's border are accounted for as the WegenerNet's equivalent to the footprint. As the WegenerNet provides multiple gauges per footprint, the arithmetic mean is taken as the most representative value. Even if the gauge observations within the footprint do not follow a Gaussian distribution, the mean value delivers a clear message about the regarded area.
In the following equations, G denotes the GPM-DPR estimates and W the WegenerNet. The correlation used is the Pearson correlation coefficient, Eq. (1).
The bias (Eq. 2) is calculated as the average of the deviation between the GPM-DPR estimates and the WegenerNet. For the normalised bias (Eq. 3) the bias is divided by Wmean.
For the contingency table, the estimates are compared to the ground reference and divided into the following four groups.
-
Hits: both systems detect rain.
-
False alarms: only the GPM-DPR shows rain.
-
Misses: the GPM-DPR does not deliver rain, whereas the WegenerNet does.
-
Correct negatives: both systems give no rain.
As these binary indicators depend on the rain/no-rain discrimination, tests with different thresholds were conducted. Since a threshold deletes non-zero rainfall information, it should be as low as possible. It turned out that the selection of thresholds did not change the results significantly; thus, all positive rain rates were accounted for in our evaluation.
The FBI (Eq. 4) gives an impression of whether over- or underestimation in the whole area occurs. It describes the ratio between the number of footprints that are detected by the GPM-DPR to feature precipitation and the number of footprints that show precipitation according to the WegenerNet. The FBI has a perfect score of 1. An FBI larger than 1 means overestimation of rain occurrences and <1 is an underestimation.
The probability of detection (POD) is
The POD ranges from 0 to 1, with 1 indicating that all rain events were detected correctly (no miss). It is only sensitive to missed events; this means that it can be (artificially) improved by overestimation, which leads to a reduction of misses. The increase in false alarms does not influence the POD.
The FAR is taken into account to cross-check with the POD (Eq. 5).
Again the range lies between 0 and 1, but now with 0 as perfect score, which means that there is no event where the GPM-DPR sees rain and the WegenerNet does not. The FAR is not sensitive to misses but to false alarms. Therefore, it can be improved by underestimation (reducing the possible amount of false alarms but also increasing the possible amount of misses). POD and FAR together provide information on the rainfall detection accuracy of the GPM-DPR.
The critical success index combines the information from the POD and the FAR to indicate how well the events, where rain was detected, match between the DPR and the WegenerNet. It ranges between 0 and 1, with 1 as perfect score.
The ETS synthesises the information from POD and FAR, like the CSI, but removes the hits that were accounted for by chance. Therefore, its value is always lower than the CSI.
where holds. In case an event contains only hits, the ETS is not defined.
The HSS means the number of correct rain detection relative to detection that would be made due to random chance. A perfect score is indicated by 1, 0 means no skill and negative values indicate that the random chance is more likely to score correctly than the DPR estimate. If an event contains only hits, the HSS is not defined.
where
holds. For more information on the statistical scores, we refer to Wilks (2011).
4.1 Evaluation of all rainfall events
The series of footprints of all events and the correlation and bias within one event is displayed in Fig. 3. There is no clear indication of which GPM-DPR product catches the precipitation variations inside the WegenerNet better. Some events, e.g. no. 8, are not correlated. There is no anti-correlated event, which shows that the GPM-DPR estimates for one event are not completely shifted compared to the WegenerNet variations. The correlation over all footprints is r=0.56 for Ku-NS and r=0.57 for Ka-MS and r=0.60 for DPR-MS.
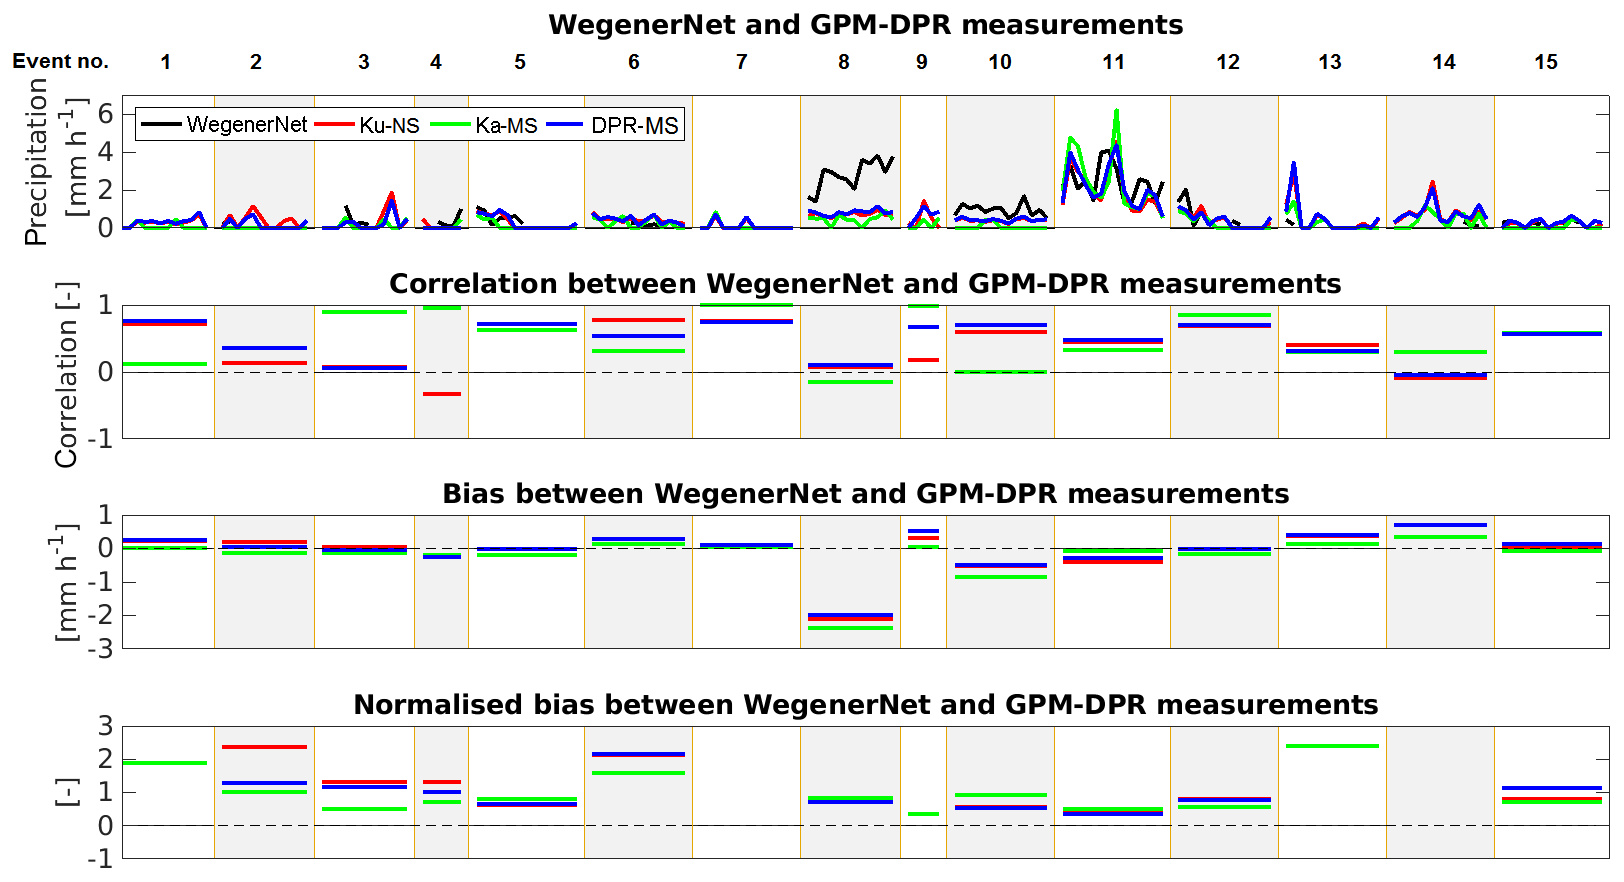
Figure 3GPM-CO estimates over the WegenerNet (average of WegenerNet 5 min accumulation in the respective footprint) for the events listed in Table A1 and which occurred in the years 2014–2017. Only events with precipitation detected in either Ku-NS, Ka-MS or DPR-MS were taken into account. Each box shows precipitation at a same time (one event per box) but different locations, correlation and bias between GPM estimates and the WegenerNet within all detected events. The topmost graph gives the precipitation of the events.
The normalised bias for event nos. 7 and 14 is not depicted in Fig. 3, because of its large magnitude (>10). This is caused by the very low mean of the WegenerNet. Even though the bias can be high, there is no connection to the correlation. Considering the bias and the correlation, one can derive that the DPR-MS is closer to Ku-NS than to Ka-MS. Ka band estimates have in general a lower bias than the others; this again may be explained with the high number of light-rainfall events. More than 84 % of the GPM-DPR precipitation rates are within the mean ± standard deviation of the respective WegenerNet gauges inside each footprint (not taking zeros into account). For KaPR it is a little lower with 72 %. See Fig. A3 in the Appendix A for a graphical representation.
Comparing the GPM-DPR estimates directly against the WegenerNet precipitation leads to a scatter plot (Fig. 4). It shows that the DPR tends to underestimate the WegenerNet gauges, as more estimations can be found below the one-to-one line.

Figure 4Average of GPM-DPR observations as a function of WegenerNet measurements inside the respective footprints. The diagonal denotes the line where the satellite measures the same as the terrestrial network.
A point of interest is when the DPR provides the information of zero rain and the WegenerNet detects very light precipitation. Since the mean of the gridded gauge data inside the footprint is taken into account, the WegenerNet represents more detailed information on areal rainfall within the area of footprints. GPM-DPR probably observed a part of the WegenerNet grid boxes in its footprint area, where there was no rainfall, even though it rained in the other part of the WegenerNet grid boxes. This over-/underestimation of satellite precipitation estimates due to the subpixel-scale rainfall variability was also found by O et al. (2017), where they used the WegenerNet to evaluate GPM Level 3 gridded precipitation data.
In order to quantify the impact of the subpixel-scale rainfall variability on data discrepancy between WegenerNet and DPR, Fig. 5 depicts in the left graph the relative error, i. e. the absolute value of the difference between the DPR and the WegenerNet normalised with the average of the WegenerNet, as a function of the coefficient of variation within the respective footprint. This characterises the intra-footprint variability. It proves that a large error in the DPR estimates is not always connected to a large variation within a footprint; thus a simple implication is that the intra-footprint variability is not explicitly related with the magnitude of estimate errors. The three different products show similar results.

Figure 5Coefficient of variation of the WegenerNet, either inside each footprint (a) or over the whole network (b) in comparison with the coefficient of variation between the DPR and the WegenerNet.
The graph on the right tells the same story for each event, showing radar errors in terms of inter-footprint variability. We could not find any clear signal showing that inter-footprint rainfall variability yields larger errors of the radar rainfall estimates. Other possible error sources (e.g. incomplete rain rate retrieval algorithm) may have a larger impact on the estimates.
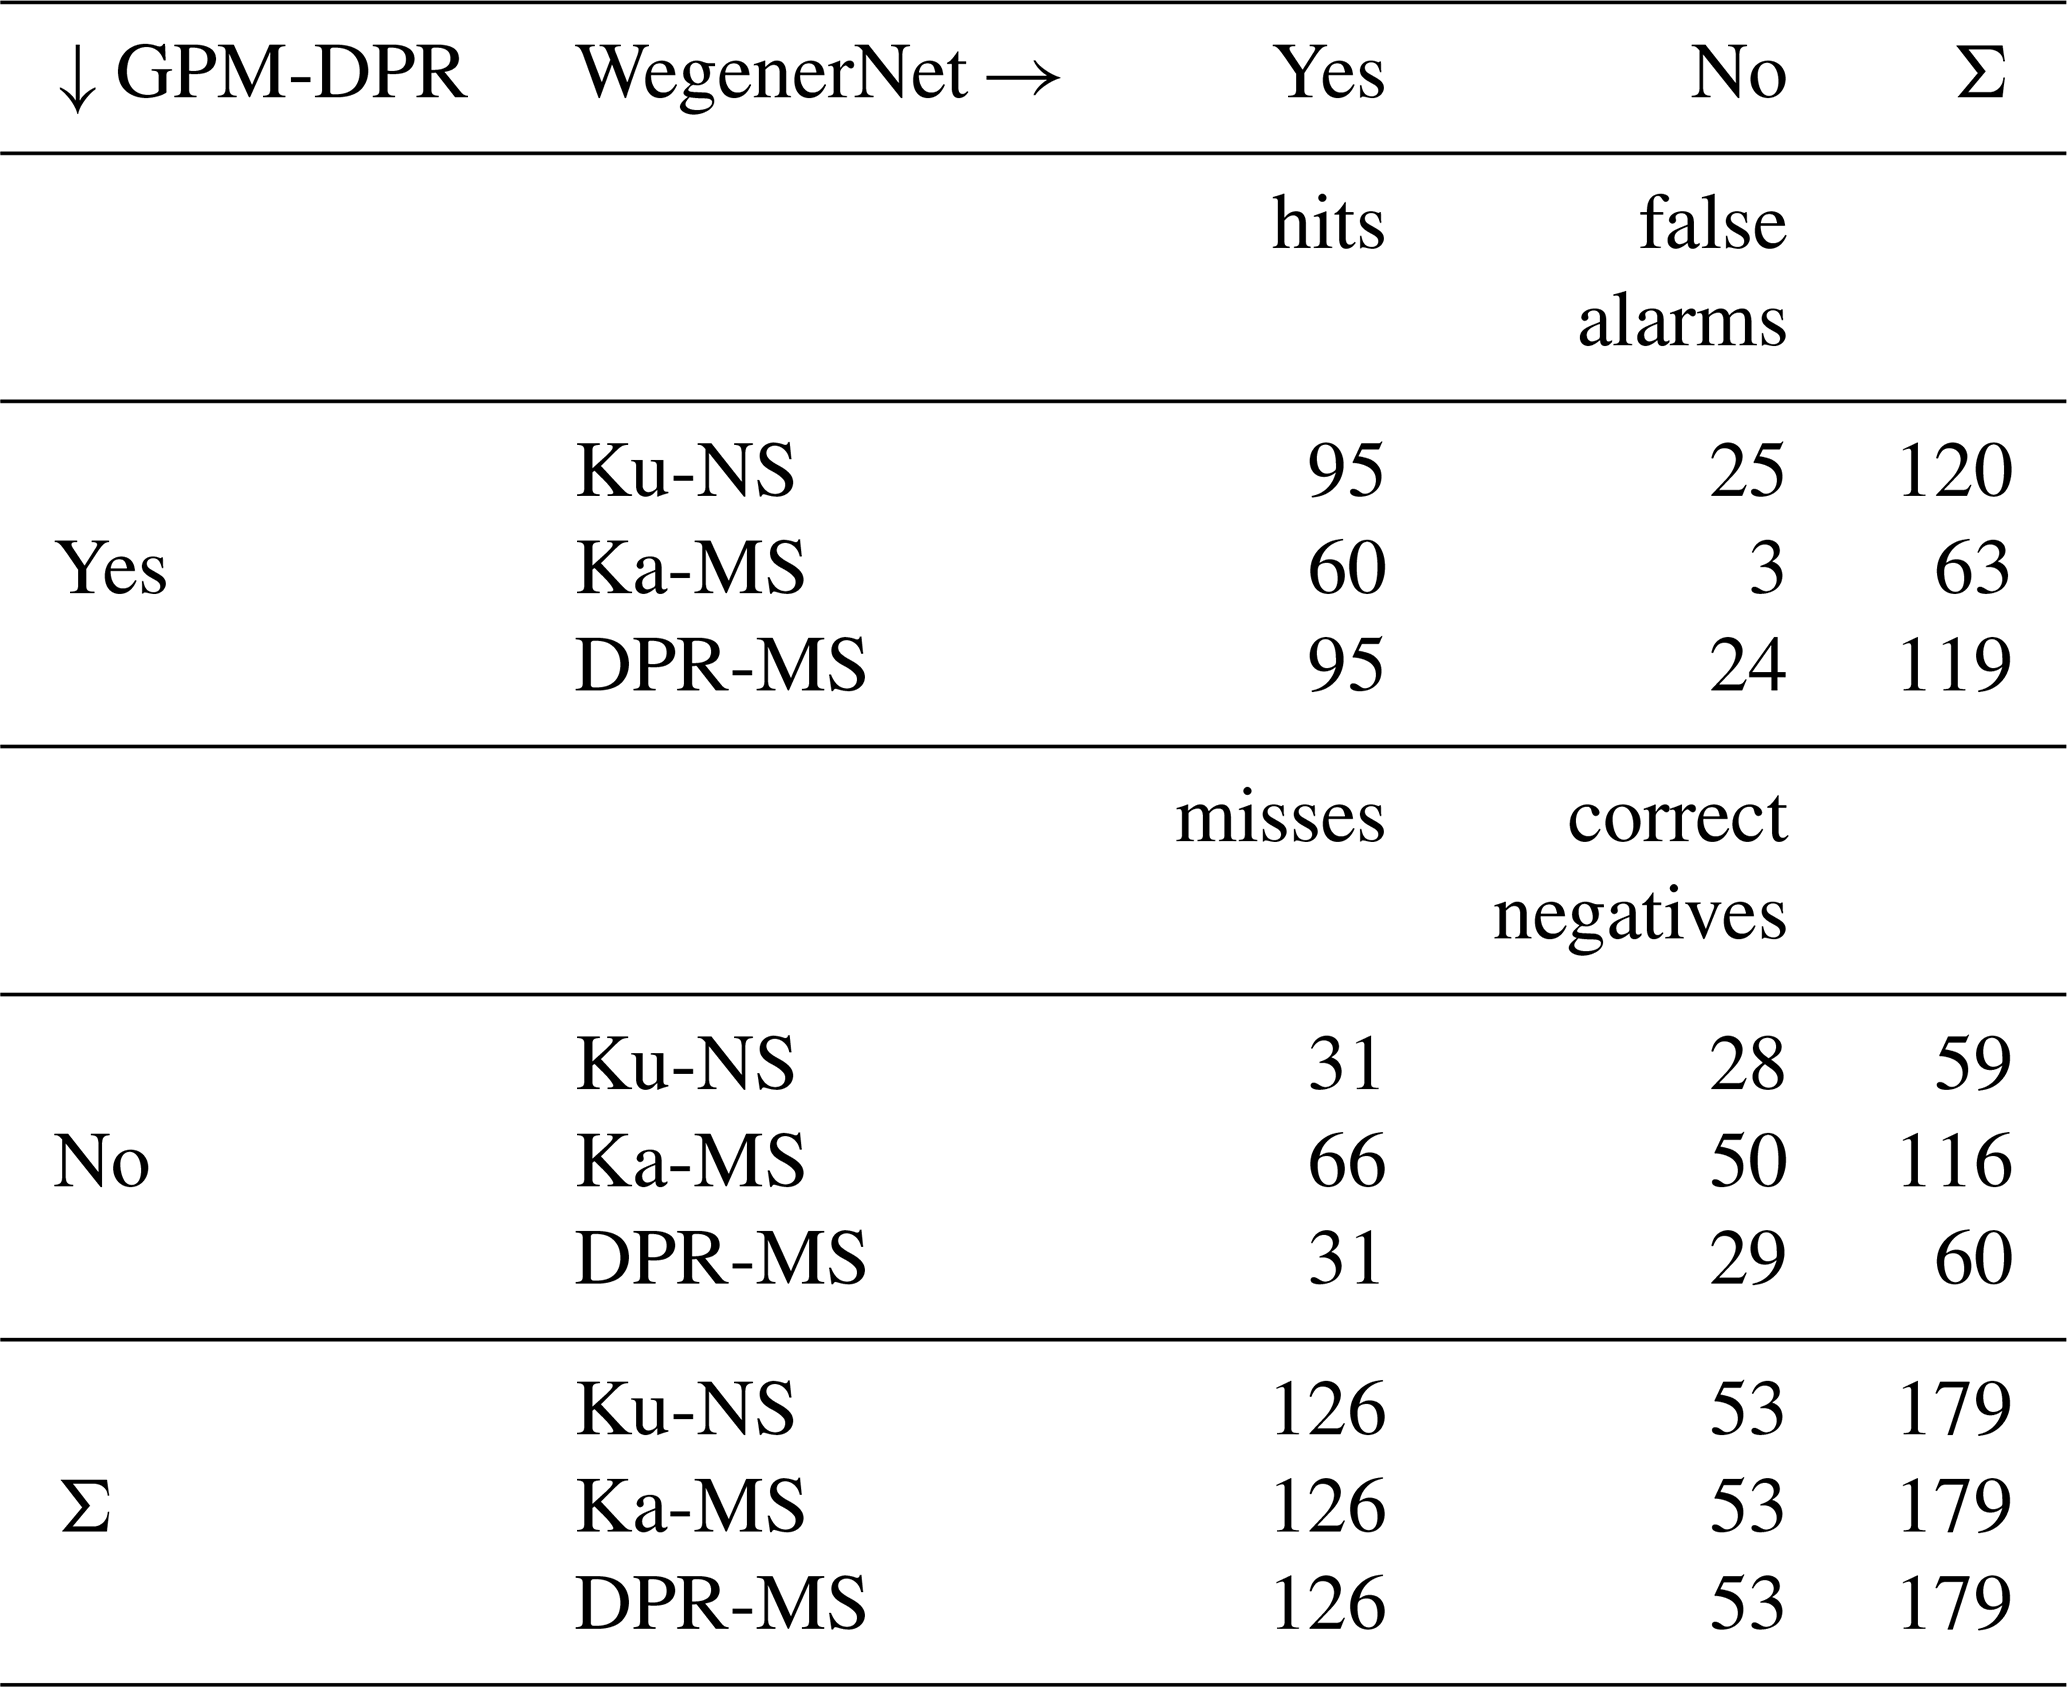
Next, we analyse the performance of the DPR by setting up a contingency table and counting the number of hits, misses, false alarms and correct negatives (Table 3). According to the ground reference, rain was detected within 126 footprints, but no rain was detected for the other 53 footprints. The Ku-NS product and the DPR-MS score very close to each other and show a better performance than Ka-MS in terms of hits. The Ka-MS misses more than twice as much as the Ku-NS and hits only two-thirds of the Ku-NS. However, only three false alarms are given by Ka-MS. Even though the Ka-MS scores more misses than hits, it performs well in terms of false alarms (few false alarms).
Table 3Contingency table: the number of hits, misses, false alarms, and correct negatives between WegenerNet and GPM-DPR for all rain events.
The FBI, POD, FAR, CSI, ETS and HSS are items derived from the contingency table; they are given in Table 4.
Table 4Statistics derived from the contingency table for all events.

The FBI gives an impression about the wet area for a certain number of events. It does not take into account whether a single footprint was subject to misestimation or not. The correct negatives do not influence the FBI. The Ku-NS and the DPR-MS tend to slightly underestimate the wet area (FBI =0.95 and 0.94), whereas the Ka-MS underestimates the precipitation heavily (FBI =0.52). The inclination of the DPR towards underestimation was also reported by Speirs et al. (2017).
The POD has a value of 0.75 for Ku-NS and DPR-MS and 0.48 for the Ka-MS; thus, the former shows a better performance. According to Skofronick-Jackson et al. (2016) the POD on a global level is >0.64, which shows that our results are similar to the numbers from other studies. The good POD of Ku-NS and DPR-MS is supported by the FBI being close to 1. The probability of detection in each event, however, shows more discrepancies for the POD (see Table A1). Since the POD can be increased by overestimation (false alarms do not contribute to the POD), the FAR is considered as well. It shows that the rate is around 0.20 for Ku-NS and DPR-MS, whereas the Ka-MS has a FAR of only 0.05, thus delivering very few false alarms. The FAR can be improved by underestimation, which closes the circle to the FBI. The underestimation through Ka-MS improves the FAR. To score the yes pixel, the CSI states that the DPR and WegenerNet match at a level of 0.6 for Ku-NS and DPR-MS and a bit lower for Ka-MS. Taking into account that some hits actually occur by chance, the ETS condenses the statistical information. It scores slightly less than 0.2, with the highest skill in Ka-MS. Consequently, it is easier for Ku-NS and DPR-MS to score by chance. The HSS is given to denote the accuracy of the DPR estimates in comparison to that of a random estimate. Again, Ka-MS slightly exceeds the other two.
Very light rainfall events are better detected by the Ka-band frequency, whereas heavier rainfall can be seen in the Ku band (as expected) and the Ka band. The dual-frequency product features a strong tendency of giving more weight to Ku-band than Ka-band data.
4.2 Analysis of example rainfall events
The example events were chosen based on the rainfall intensity measured by the WegenerNet. Two with light rain (nos. 5 and 6) and two with moderate rain up to 6 mm h−1 in a certain footprint (nos. 8 and 11) were selected. According to the rain type specified by the GPM-DPR data, all events are stratiform phenomena, when Ku- or Ka-band data are considered; however, dual-frequency estimates state convective rainfall. A look at WegenerNet reveals that the moderate-rain events are more of a convective nature and the other two show stratiform behaviour. The events with light precipitation are in the hot season (July and August), the other ones are in spring and autumn.
The first event to investigate is event no. 5 on 10 July 2014, where the GPM-CO passed the WegenerNet at 11:40 UTC and detected light precipitation. The precipitation comparison at each footprint is given in Fig. 6: gauge station precipitation is indicated by black dots and grid precipitation by grey lines.
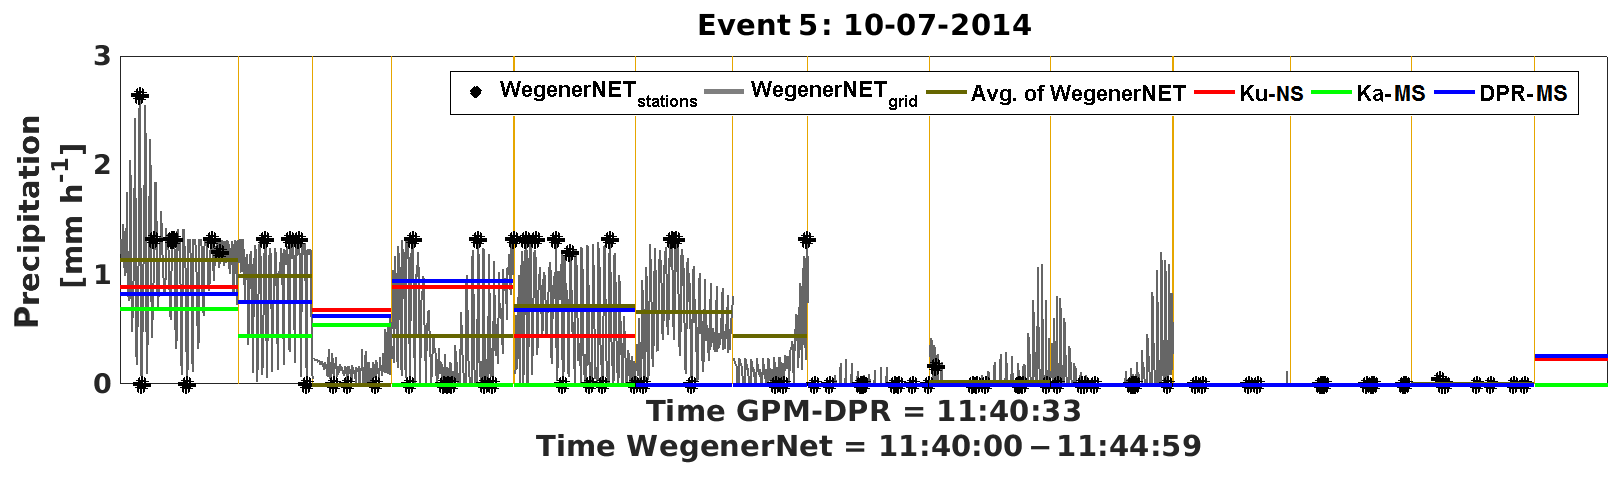
Figure 6Series of footprints for event 5 (10 July 2014); WegenerNet station and gridded data versus DPR estimates.
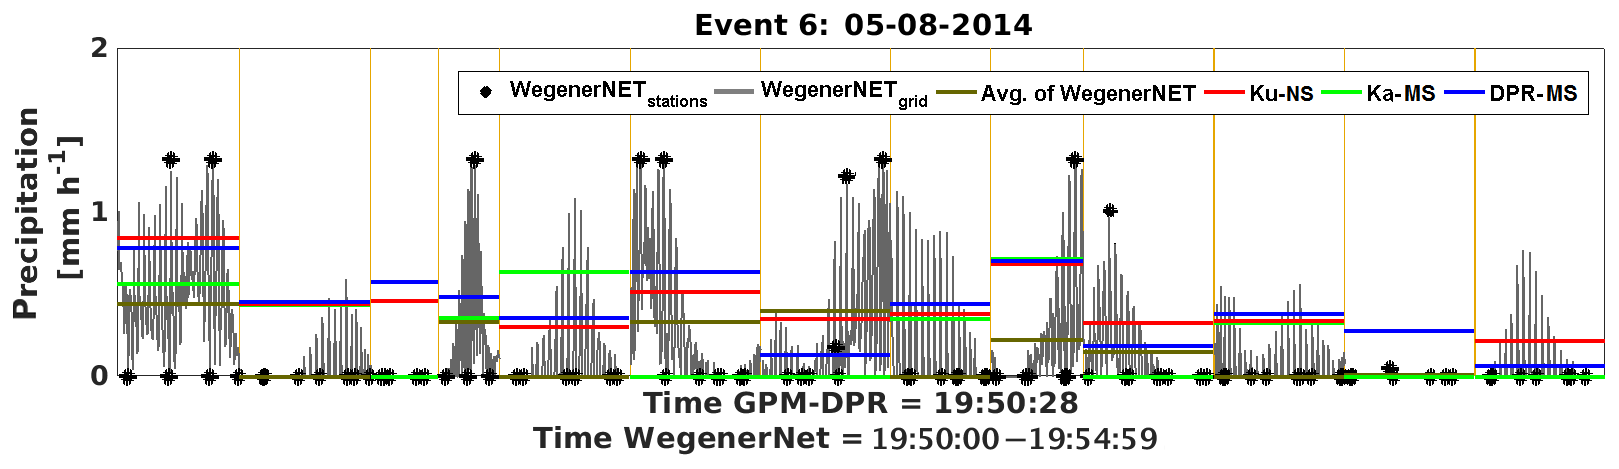
Figure 7Series of footprints for event 6 (8 May 2014); WegenerNet station and gridded data versus DPR estimates.
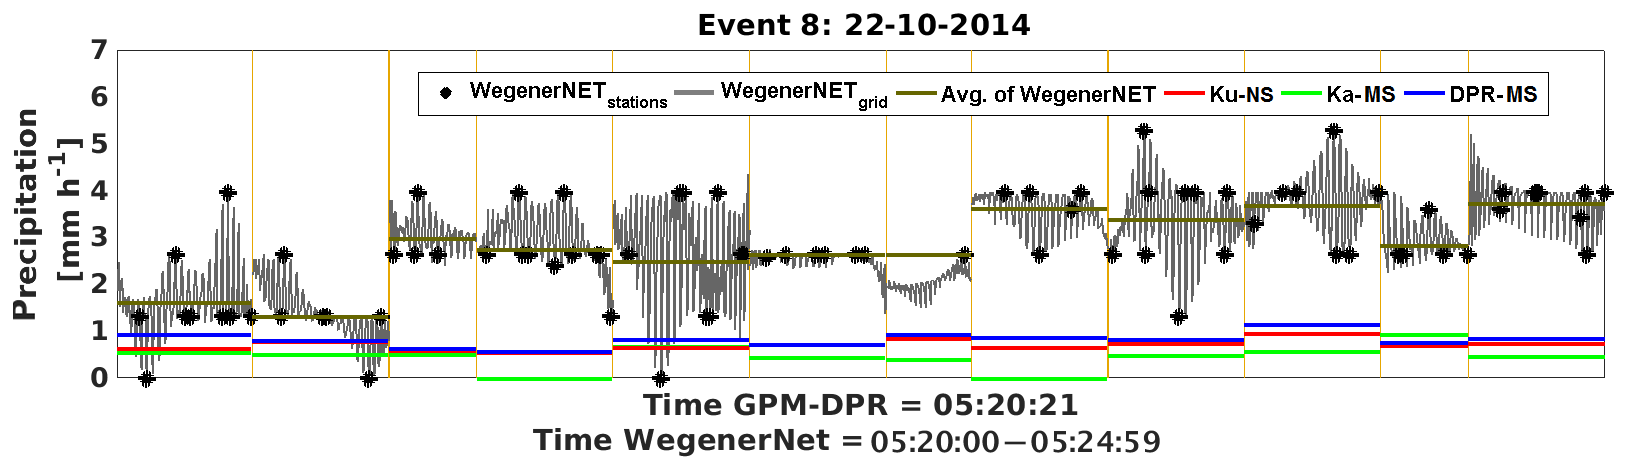
Figure 8Series of footprints for event 8 (22 October 2014); WegenerNet station and gridded data versus DPR estimates.
More than half of the footprints do not feature any rain, which is correctly detected by the radar estimates. Within the other footprints, especially the ones in the middle of the graph, some information is added in the gridded gauge data compared to station alone because gridded WegenerNet data include rainfall information from gauges outside the footprint area due to the inverse-distance-weighted interpolation. All radar estimates are within the range of the respective WegenerNet footprint and close to the mean of the gauges. Thus a small bias is expected. The correlation between the terrestrial and the satellite data is close to one, which emphasises the quality of DPR estimates during this event (see event no. 5 in Fig. 3). The proportion between over- and underestimation is balanced inside the footprints. For the whole event the FBI supports a strong underestimation (see Table A1). Interestingly, the Ka-MS estimates, which should provide more accurate information in case of light precipitation, are not as accurate as the Ku-NS and the DPR-MS. The POD reaches only 0.45 in Ku-NS and DPR-MS, and Ka-MS is even worse, because of the zero rain estimation where the grid states very light rain. ETS and HSS are slightly above zero for all three products, showing that the DPR estimates are only a little better than a random estimation. Indeed, not considering the gridded gauge data, but stations-only precipitation, would improve this result.
The second event (no. 6 on 8 May 2014) has even lighter rainfall than the first with a maximum of less than 1.5 mm h−1. The series of footprints is given in Fig. 7. Nearly all stations inside the footprints indicate that no precipitation was measured. The gridded WegenerNet precipitation however, shows some rainfall. Probably this light-rainfall event with high spatial variability is not well observed by the satellite.
In contrast to event no. 5, the GPM-DPR reflects the gridded gauge data better than stations only inside the footprint. The POD is at 1 for Ku-NS and DPR-MS, whereas the Ka-MS has a POD of only 0.64. The FBI suggests slight overestimation for the event; however, the FAR is very low (between 0 and 0.15). The Ka band seems to be least sensitive to over-/underestimations. The correlation (Fig. 3) shows high discrepancies between the Ku band, Ka band and DPR-MS, with the Ka-MS being least accurate. A closer look at the event in the WegenerNet points out that the event is hard to detect, since the precipitation occurs quite spotty over the whole area. Therefore, the satellite misses a lot of information that can only be provided by the gridded gauge data.
For event no. 8, represented in Fig. 8, all three GPM-DPR products show a relatively poor performance. Every footprint is heavily underestimated, and the radar estimates are within the range only in 3 out of 12 footprints. An underperformance of the DPR in moderate-to-heavy precipitation was for instance stated by Biswas and Chandrasekar (2018).
The event contains uniformly distributed moderate rainfall, with hardly any station observing no rain. The FBI and POD are very high (between 0.83 and 1.00); thus the fact that it was rainy is detected. Ka-MS performs worst in terms of bias and correlation. As Ku-NS and DPR-MS score only hits, no skill can be stated, but the CSI is very high for all products.
The opposite happens in event no. 11, (2 May 2016, Fig. 9), featuring moderate-to-heavy precipitation, up to almost 6 mm h−1.
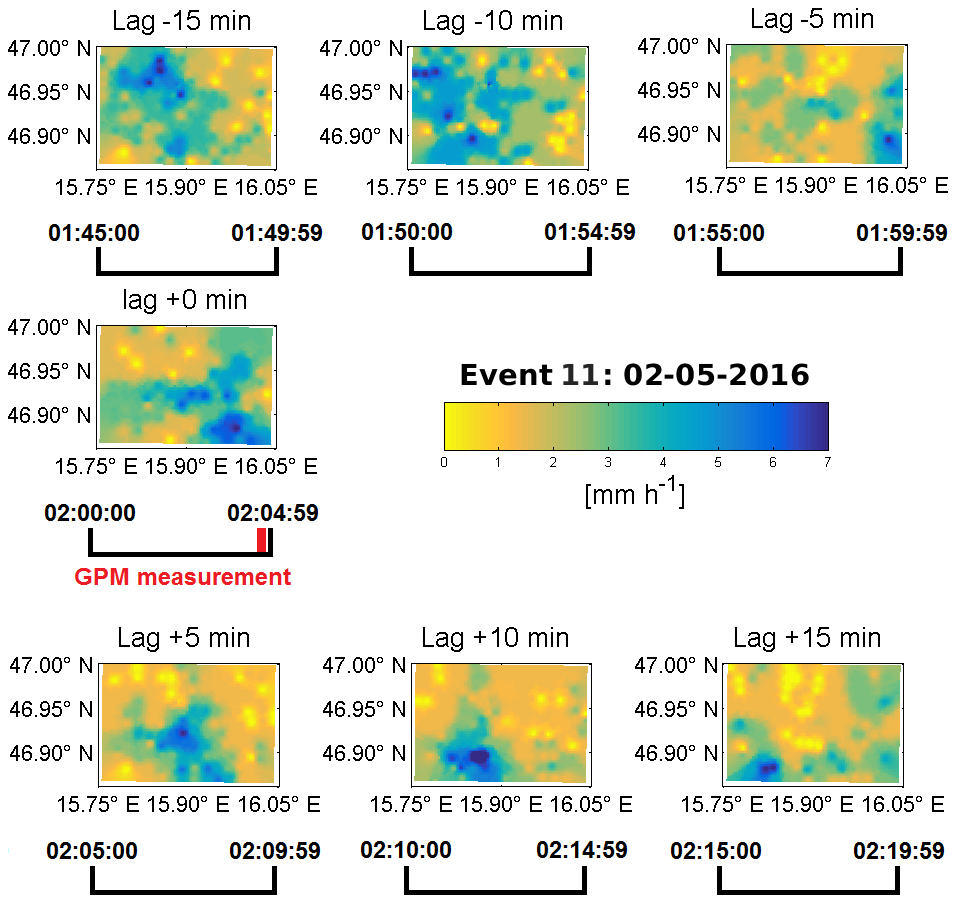
The event shows a lot of variability (see Fig. 11 for 35 min of the rainfall) and is at a first glance almost perfectly mirrored by the radar estimates. The FBI and POD is 1.00 for all products, the FAR is zero and no skill can be stated because only hits are scored. The bias itself is quite low (highest for Ka-MS) and the correlation is close to 0.5. There are no large-scale variations within many footprints. The FBI and CSI state a perfect estimation.
Remote sensing data may show a time lag error between rain drops from clouds and the surface rainfall. In order to investigate this effect, whether the GPM-DPR estimation was matched to the correct point in time for the rainfall event, a lag of ±15 min is applied and the correlation and the bias are determined. This is displayed in Fig. 10.

Figure 9Series of footprints for event 11 (2 May 2016); WegenerNet station and gridded data versus DPR estimates.
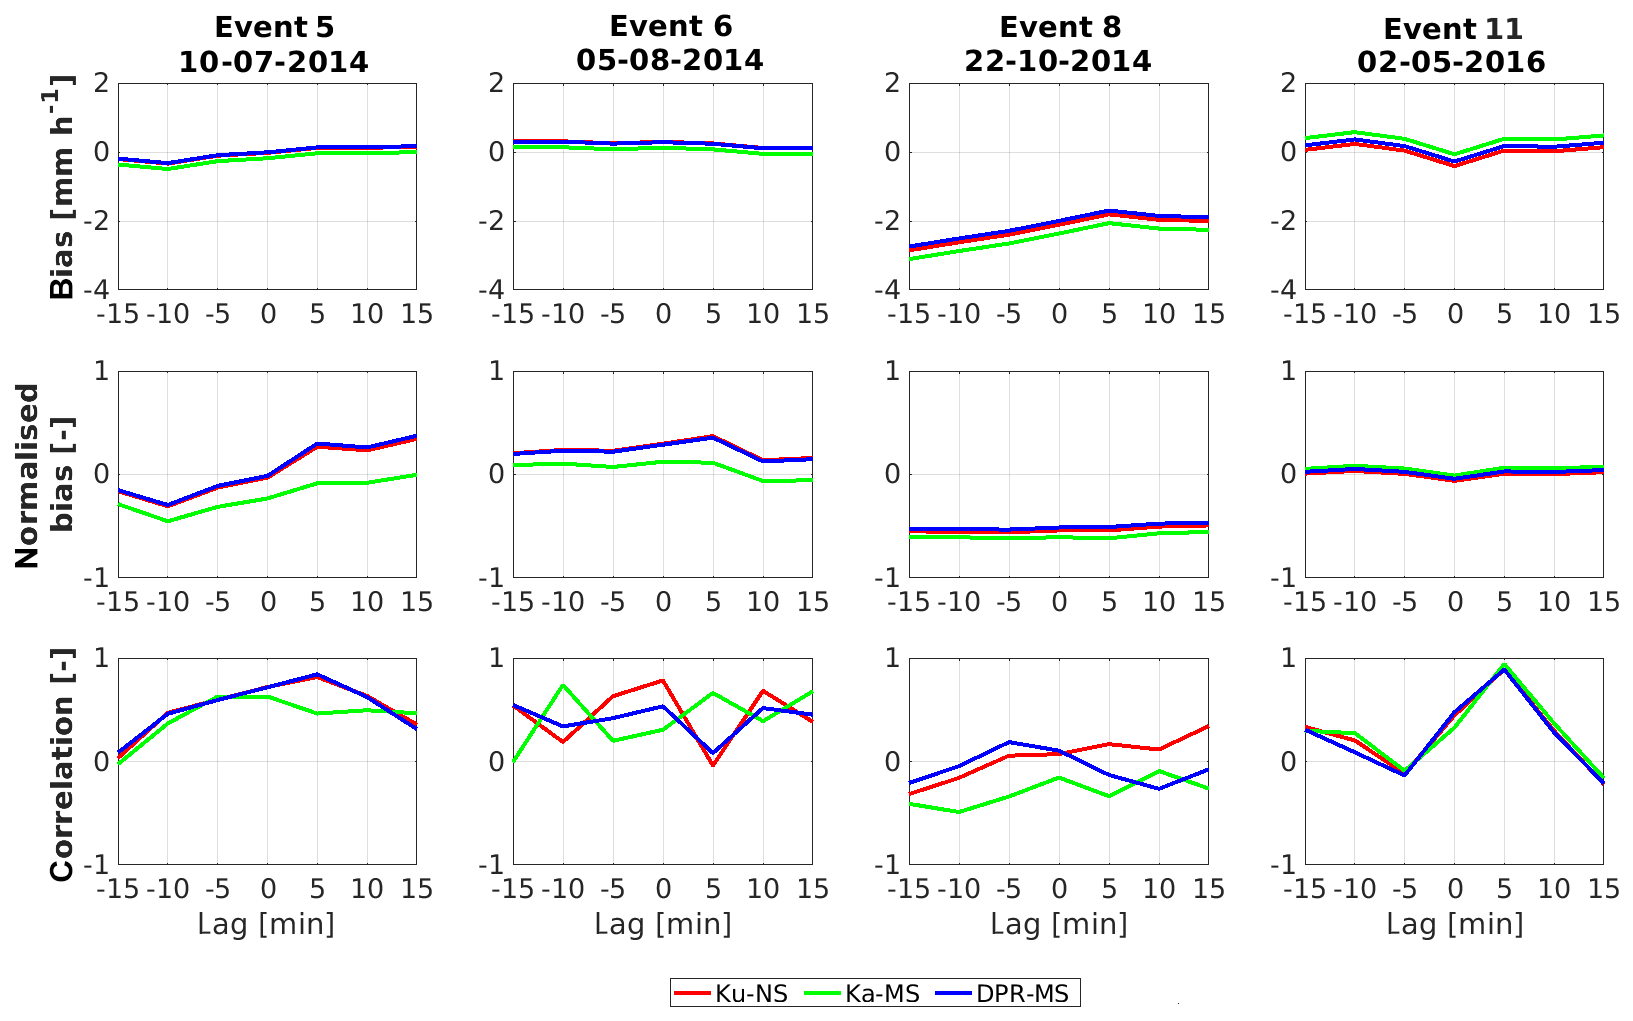
For a perfectly matching event, the bias should be as close as possible to zero and the correlation should tend towards one; both occur for example for the Ku-NS at a lag of +5 min in event no. 11. But one cannot conclude that the lag with the smallest bias shows also the highest correlation.
Events 5 and 6 have a very small bias due to their light and non-extensive rainfall. When shifting the WegenerNet ±15 min the bias stays at the same level, with its closest point to zero at a lag of 0 min. From that point of view, a perfect matching in time is achieved. In the case of event 6 the correlation shows a lot of variation between the three products; nevertheless, the Ku-NS has its peak at 0 min. Since there is a lot of information missed by the satellite, this event is hard to detect. In case of event 5, the GPM-DPR footprints got exactly the characteristics of the WegenerNet at a lag of +5 min. A look at the lag 0 and +5 min shows that these two lags are very similar to each other. The fast decreasing correlation around the peak implies a fast-moving precipitation event.
Event no. 8 is almost not correlated for the whole lag, and also the bias is very high with only underestimated precipitation rates.
For event 11 a clear peak in the correlation is at a lag of +5 min, whereas −5 and +15 min is almost not correlated. Thus, it was a quite fast-moving rainfall, which underlines the importance of a correct tagging of rain rate estimates in time. The peak at +5 min lag can be explained by the GPM-DPR measurement time at the very end of the WegenerNet's accumulation interval.
In this study the radar estimates on both frequencies of the GPM-CO were evaluated using gauge measurement data from the WegenerNet network in southeastern Austria for the period of March–November of 2014 until 2017. The dense network provides the opportunity of evaluating not only amount-based radar estimates, but also radar estimates on a level where the satellite can observe small-scale variability of rainfall events. Our results show that the evaluation using gridded gauge data provides more information than stations only. This surplus of information helps to evaluate the GPM-DPR estimates and supports the quality of the satellite measurements in most cases. However, exceptions to that assumption can be found as well, especially in the case of light and spotty rainfall. One cannot infer the quality of the estimates from the amount of rainfall. In this study Ka-MS estimates perform best, probably due to the higher number of light-rain events. All DPR estimates tend to underestimation and Ka-MS features the strongest inclination on this. Considering the inter-footprint variability, all three products tend towards an under-representation of the precipitation. However, taking the standard deviation as a reference for variability, the error is not significant. Concerning intra-footprint variability, the pixel-wise error does not match with high variations within a footprint. The correlation peak between the GPM-DPR and the WegenerNet is shifted in some events; however, this could be explained by the distribution of the rainfall event and which parts of the network's area the DPR cannot see. The probability of detection is greater than 0.70 for Ku-NS and DPR-MS but only about 0.50 for Ka-MS.
The intra-event variations are captured by the satellite without clear characteristics; some events are resembled with a correlation close to one and some are almost not correlated. But there is no completely anti-correlated event. Any systematic shifts (by moving the WegenerNet ±15 min) could be explained by the gaps between the footprints.
WegenerNet data are available at the WegenerNet data portal (https://doi.org/10.25364/WEGC/WPS7.1:2019.1, Fuchsberger et al., 2019) in NetCDF format. GPM-CO radar data sets are available at the PMM server (https://pmm.nasa.gov/data-access/; last access: 26 August 2019) and delivered in HDF5 format.
Ku band: https://doi.org/10.5067/GPM/DPR/Ku/2A/06 (Iguchi and Meneghini, 2016a).
Ka band: https://doi.org/10.5067/GPM/DPR/Ka/2A/06 (Iguchi and Meneghini, 2016b).
DPR: https://doi.org/10.5067/GPM/DPR/GPM/2A/06 (Iguchi and Meneghini, 2017).
Table A1 lists the statistical items derived from the contingency table for each event. In Figs. A1 and A2 a graphical representation of the WegenerNet gauge observations that compares the station-wise mean to the grid mean inside the GPM-DPR footprints is given. They contain the same information. Figure A3 depicts the series of footprints containing the range of the grid in each footprint (inter-footprint variability, marked by the blue line), the standard deviation of the WegenerNet in each footprint and the difference to the respective GPM-DPR estimation. Ideally, the difference should be less than the standard deviation, which itself is less than the range.
Table A1Statistics derived from the contingency table for each event. Note that the four events highlighted in bold are analysed in detail.

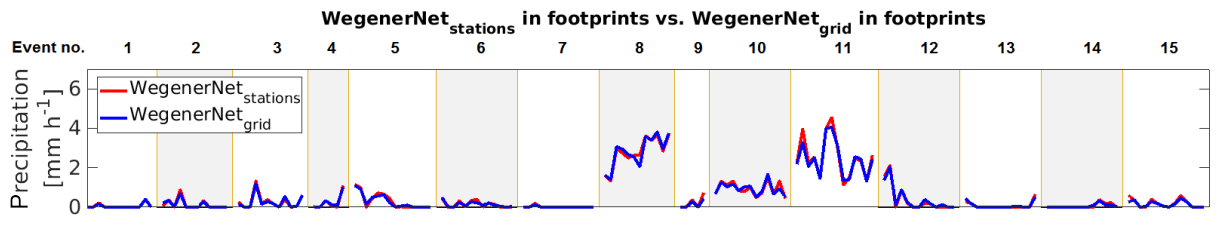
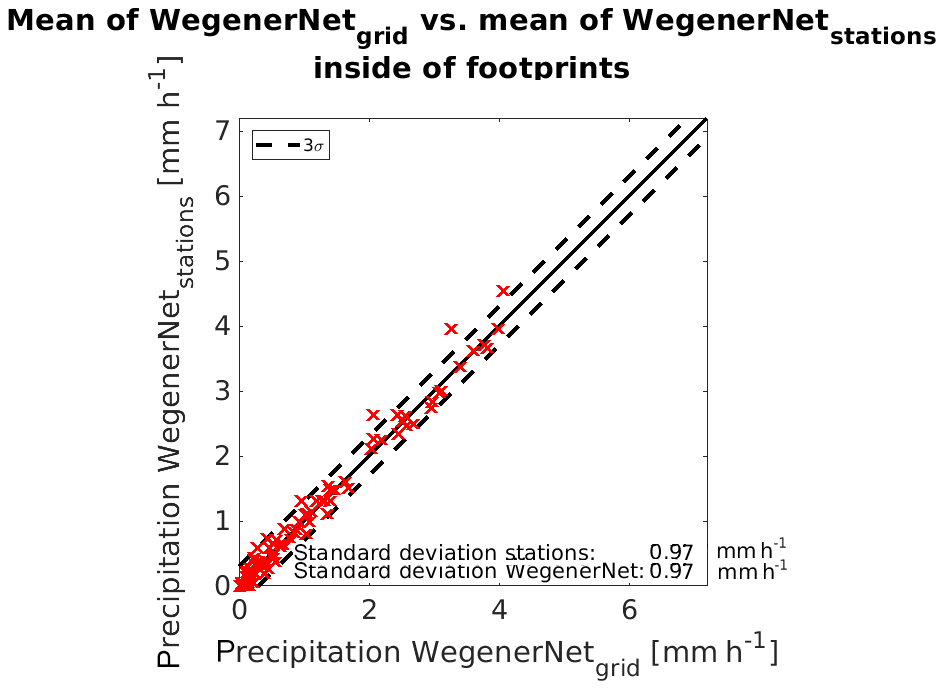
Figure A2WegenerNet station observations as a function of the WegenerNet grid data, with both only taking precipitation inside footprints of the GPM-DPR. The dashed line denotes 3 times the standard deviation of the measurements.
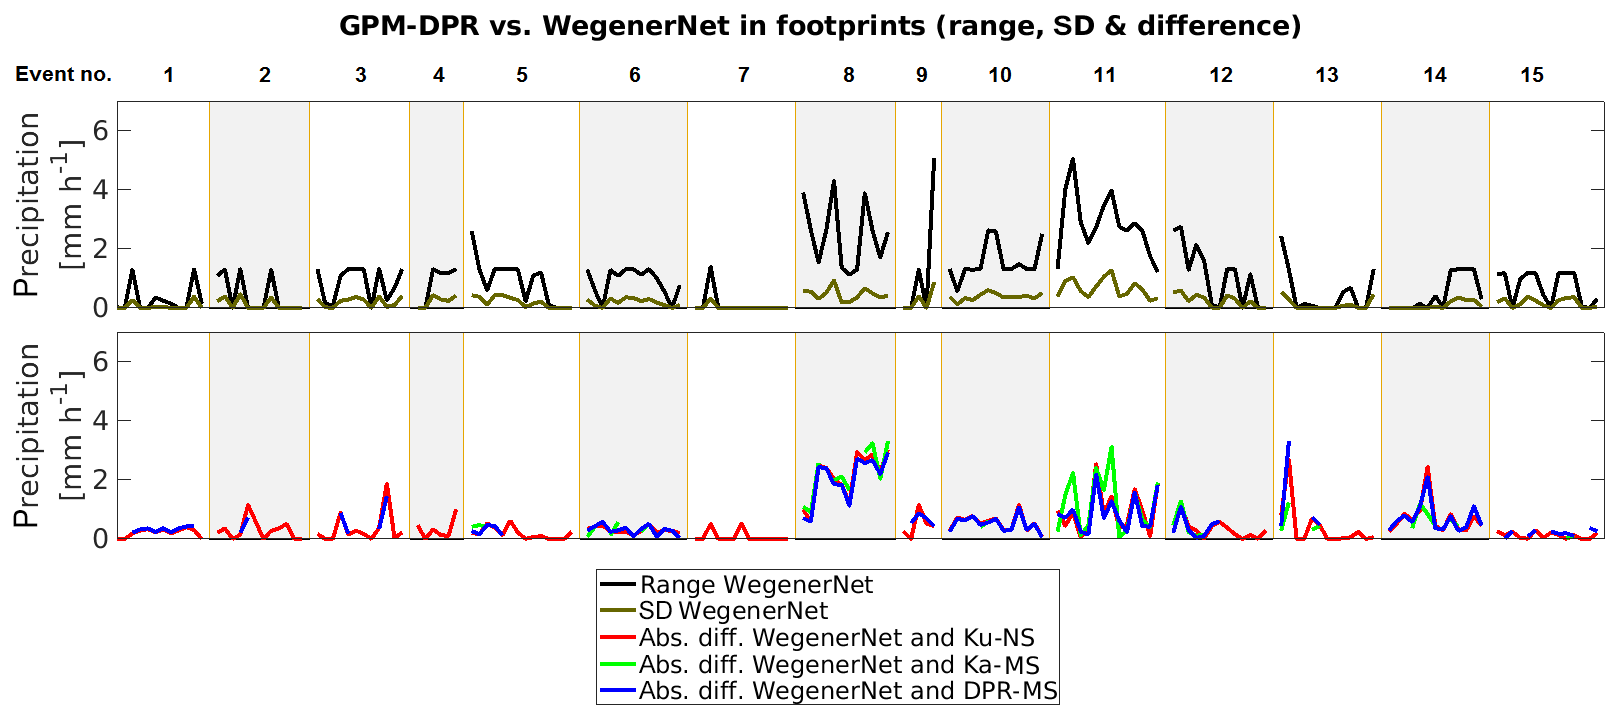
Figure A3Range and standard deviation of the WegenerNet in the respective footprints and absolute difference between the GPM-DPR measurements and the average of the WegenerNet in the footprints.
ML performed the computational work, the other authors contributed to result interpretation.
The authors declare that they have no conflict of interest.
The study was funded by Austrian Science Fund (FWF) under research grant W 1256-G15 (Doctoral Programme Climate Change Uncertainties, Thresholds and Coping Strategies).
WegenerNet funding is provided by the Austrian Ministry for Science and Research, the University of Graz, the state of Styria (which also included European Union regional development funds), and the city of Graz; detailed information is found at https://wegcenter.uni-graz.at/de/wegenernet/wegenernet-home/ and the data are available through the WegenerNet data portal (https://wegenernet.org/portal/). We would like to thank Gottfried Kirchengast and Jürgen Fuchsberger from the WegenrNet team for fruitful discussions.
The work was performed at Wegener Center as part of the PMM ground validation team collaboration of the Wegener Center with NASA; we thank in particular Walt A. Peterson and Jackson Tan for the excellent cooperation in this field.
This research has been supported by the Austrian Science Fund (FWF) (grant no. W 1256-G15).
This paper was edited by Gianfranco Vulpiani and reviewed by three anonymous referees.
Amitai, E., Unkrich, C. L., Goodrich, D. C., Habib, E., and Thill, B.: Assessing Satellite-Based Rainfall Estimates in Semiarid Watersheds Using the USDA-ARS Walnut Gulch Gauge Network and TRMM PR, J. Hydrometeorol., 13, 1579–1588, https://doi.org/10.1175/JHM-D-12-016.1, 2015. a, b
Biswas, S. K. and Chandrasekar V.: Cross-Validation of Observations between the GPM Dual-Frequency Precipitation Radar and Ground Based Dual-Polarization Radars, Remote Sens., 10, 1773, https://doi.org/10.3390/rs10111773, 2018. a
Fuchsberger, J., Kirchengast, G., Bichler, C., Leuprecht, A., and Kabas, T.: WegenerNet climate station network Level 2 data version 7.1 (2007–2018), Wegener Center for Climate and Global Change, University of Graz, Austria, https://doi.org/10.25364/WEGC/WPS7.1:2019.1, 2019. a
Hamada, A. and Takayabu, Y. N.: Improvements in Detection of Light Precipitation with the Global Precipitation Measurement Dual-Frequency Precipitation Radar (GPM DPR), J. Atmos. Ocean. Tech., 33, 653–667, https://doi.org/10.1175/JTECH-D-15-0097.1, 2016. a
Hou, A. Y., Kakar, R. K., Neeck, A. A., Azarbarzin, A., Kummerow, C. D., Kojima, M., Oki, R., Nakamura, K., and Iguchi, T.: The Global Precipitation Measurement Mission, B. Am. Meteorol. Soc., 95, 701–722, https://doi.org/10.1175/BAMS-D-13-00164.1, 2014. a, b
Iguchi, T. and Meneghini, R.: GPM DPR Ku Precipitation Profile 2A 1.5 hours 5 km V06, Greenbelt, MD, Goddard Earth Sciences Data and Information Services Center (GES DISC), https://doi.org/10.5067/GPM/DPR/Ku/2A/06, 2016a. a
Iguchi, T. and Meneghini, R.: GPM DPR Ka Precipitation Profile 2A 1.5 hours 5 km V06, Greenbelt, MD, Goddard Earth Sciences Data and Information Services Center (GES DISC), https://doi.org/10.5067/GPM/DPR/Ka/2A/06, 2016b. a
Iguchi, T. and Meneghini, R.: GPM DPR Precipitation Profile L2A 1.5 hours 5 km V06, Greenbelt, MD, Goddard Earth Sciences Data and Information Services Center (GES DISC), https://doi.org/10.5067/GPM/DPR/GPM/2A/06, 2017. a
Iguchi, T., Seto, S., Meneghini, R., Yoshida, N., Awaka, J., Le, M., Chandrasekar, V., and Kubota, T.: GPM/DPR Level-2 Algorithm Theoretical Basis Document, NASA/JAXA, 68 pp., 2015. a, b, c
JAXA (Japan Aerospace Exploration Agency): GPM Data Utilization Handbook, GPM Data Utilization Handbook, 2017. a, b, c
Kann, A., Meirold-Mautner, I., Schmid, F., Kirchengast, G., Fuchsberger, J., Meyer, V., Tüchler, L., and Bica, B.: Evaluation of high-resolution precipitation analyses using a dense station network, Hydrol. Earth Syst. Sci., 19, 1547–1559, https://doi.org/10.5194/hess-19-1547-2015, 2015. a
Kidd, C., Tan, J., Kirstetter, P.-E., and Petersen, W. A.: Validation of the Version 05 Level 2 precipitation products from the GPM Core Observatory and constellation satellite sensors, Q. J. Roy. Meteorol. Soc., 313–328, https://doi.org/10.1002/qj.3175, 2017. a
Kirchengast, G., Kabas, T., Leuprecht, A., Bichler, C., and Truhetz, H.: WegenerNet: A pioneering high-resolution network for monitoring weather and climate, B. Am. Meteorol. Soc., 95, 227–242, https://doi.org/10.1175/BAMS-D-11-00161.1, 2014. a, b
O, S. and Foelsche, U.: Assessment of spatial uncertainty of heavy rainfall at catchment scale using a dense gauge network, Hydrol. Earth Syst. Sci., 23, 2863–2875, https://doi.org/10.5194/hess-23-2863-2019, 2019. a
O, S., Foelsche, U., Kirchengast, G., Fuchsberger, J., Tan, J., and Petersen, W. A.: Evaluation of GPM IMERG Early, Late, and Final rainfall estimates using WegenerNet gauge data in southeastern Austria, Hydrol. Earth Syst. Sci., 21, 6559–6572, https://doi.org/10.5194/hess-21-6559-2017, 2017. a, b, c
O, S., Foelsche, U., Kirchengast, G., and Fuchsberger, J.: Validation and correction of rainfall data from the WegenerNet high density network in southeast Austria, J. Hydrol., 556, 1110–1122, https://doi.org/10.1016/j.jhydrol.2016.11.049, 2018. a, b
Petracca, M., D'Adderio, L. P., Porcù, F., Vulpiani, G., Sebastianelli, S., and Puca, S.: Validation of GPM Dual-Frequency Precipitation Radar (DPR) Rainfall Products over Italy, J. Hydrometeorol., 19, 907–925, https://doi.org/10.1175/JHM-D-17-0144.1, 2018. a
Schroeer, K., Kirchengast, G., and Sungmin, O.: Strong Dependence of Extreme Convective Precipitation Intensities on Gauge Network Density, Geophys. Res. Lett., 45, 8253–8263, https://doi.org/10.1029/2018GL077994, 2018. a
Seto, I. and Iguchi, T.: Intercomparison of Attenuation Correction Methods for the GPM Dual-Frequency Precipitation Radar, J. Atmos. Ocean. Tech., 32, 915–926, https://doi.org/10.1175/JTECH-D-14-00065.1, 2014. a
Skofronick-Jackson, G.: NASA's Global Precipitation Measurement (GPM) Mission: Observing Rain and Snow for Science and Society, Talk at EUMETRAIN, 25 November 2015, 40 pp., avaiable at: http://www.eumetrain.org/data/3/391/391.pdf (last access: 26 August 2019), 2015.
Skofronick-Jackson, G., Petersen, W. A., Berg, W., Kidd, C., Stocker, E. F., Kirschbaum, D. B., Kakar, R., Braun, S. A., Huffman, G. J., Iguchi, T., Kirstetter, P.-E., Kummerow, C., Meneghini, Oki, R., Olson, W. S., Takayabu, Y. N., Furukawa, K., and Wilheit, T.: The Global Precipitation Measurement (GPM) Mission for Science and Society, B. Am. Meteorol. Soc., 98, https://doi.org/10.1175/BAMS-D-15-00306.1, 2016. a, b, c
Speirs, P., Gabella, M., and Berne, A.: A comparison between the GPM dual-frequency precipitation radar and ground-based radar precipitation rate estimates in the Swiss Alps and Plateau, J. Hydrometeorol., 18, 1247–1269, https://doi.org/10.1175/JHM-D-16-0085.1, 2017. a, b, c
Tan, J., Petersen, W. A., Kirchengast, G., Goodrich, D. C., and Wolff, D. B.: Evaluation of Global Precipitation Measurement Rainfall Estimates against Three Dense Gauge Networks, J. Hydrometeorol., 19, 517–532, https://doi.org/10.1175/JHM-D-17-0174.1, 2018. a, b, c
Toyoshima, K., Masunaga, H., and Furuzawa, F. A.: Early evaluation of Ku- and Ka-Band Sensitives for the Global Precipitation Measurement (GPM) Dual-Frequency Radar (DPR), SOLA, 11, 14–17, https://doi.org/10.2151/sola.2015-004, 2015. a
Watters, D., Battaglia, A., Mroz, K., and Tridon, F.: Validation of the GPM Version-5 Surface Rainfall Products over Great Britain, J. Hydrometeorol., 19, 1617–1636, https://doi.org/10.1175/JHM-D-18-0051.1, 2018. a
Wilks, D. S.: Statistical Methods in the Atmospheric Sciences, Vol. 100, 3rd edn., International Geophysics Series, Elsevier, 2011. a