the Creative Commons Attribution 4.0 License.
the Creative Commons Attribution 4.0 License.
 | 17 Oct 2019
Changes in PM2.5 peat combustion source profiles with atmospheric aging in an oxidation flow reactor
Judith C. Chow
Junji Cao
L.-W. Antony Chen
Xiaoliang Wang
Qiyuan Wang
Jie Tian
Steven Sai Hang Ho
Adam C. Watts
Tessa B. Carlson
Steven D. Kohl
John G. Watson
Smoke from laboratory chamber burning of peat fuels from Russia, Siberia, the USA (Alaska and Florida), and Malaysia representing boreal, temperate, subtropical, and tropical regions was sampled before and after passing through a potential-aerosol-mass oxidation flow reactor (PAM-OFR) to simulate intermediately aged (∼2 d) and well-aged (∼7 d) source profiles. Species abundances in PM2.5 between aged and fresh profiles varied by several orders of magnitude with two distinguishable clusters, centered around 0.1 % for reactive and ionic species and centered around 10 % for carbon.
Organic carbon (OC) accounted for 58 %–85 % of PM2.5 mass in fresh profiles with low elemental carbon (EC) abundances (0.67 %–4.4 %). OC abundances decreased by 20 %–33 % for well-aged profiles, with reductions of 3 %–14 % for the volatile OC fractions (e.g., OC1 and OC2, thermally evolved at 140 and 280 ∘C). Ratios of organic matter (OM) to OC abundances increased by 12 %–19 % from intermediately aged to well-aged smoke. Ratios of ammonia (NH3) to PM2.5 decreased after intermediate aging.
Well-aged and abundances increased to 7 %–8 % of PM2.5 mass, associated with decreases in NH3, low-temperature OC, and levoglucosan abundances for Siberia, Alaska, and Everglades (Florida) peats. Elevated levoglucosan was found for Russian peats, accounting for 35 %–39 % and 20 %–25 % of PM2.5 mass for fresh and aged profiles, respectively. The water-soluble organic carbon (WSOC) fractions of PM2.5 were over 2-fold higher in fresh Russian peat (37.0±2.7 %) than in Malaysian (14.6±0.9 %) peat. While Russian peat OC emissions were largely water-soluble, Malaysian peat emissions were mostly water-insoluble, with WSOC ∕ OC ratios of 0.59–0.71 and 0.18–0.40, respectively.
This study shows significant differences between fresh and aged peat combustion profiles among the four biomes that can be used to establish speciated emission inventories for atmospheric modeling and receptor model source apportionment. A sufficient aging time (∼7 d) is needed to allow gas-to-particle partitioning of semi-volatilized species, gas-phase oxidation, and particle volatilization to achieve representative source profiles for regional-scale source apportionment.
- Article
(7527 KB) - Full-text XML
-
Supplement
(777 KB) - BibTeX
- EndNote


Receptor-oriented source-apportionment models have played a major role in establishing the weight of evidence (U.S.EPA, 2007) for pollution control decisions. These models, particularly the different solutions (Watson et al., 2016) to the chemical mass balance (CMB) equations (Hidy and Friedlander, 1971), rely on patterns of chemical abundances in different source types that can be separated from each other when superimposed in ambient samples of volatile organic compounds (VOCs) and suspended particulate matter (PM). These patterns, termed “source profiles,” have been measured in diluted exhaust emissions and resuspended mineral dusts for a variety of representative emitters. Many of these source profiles are compiled in country-specific source profile data bases (Cao, 2018; CARB, 2019; Liu et al., 2017; Mo et al., 2016; Pernigotti et al., 2016; U.S.EPA, 2019) and have been widely used for source apportionment and speciated emission inventories.
Chemical profiles measured at the source have been sufficient to identify and quantify nearby, and reasonably fresh, source contributions. These source types include gasoline- and diesel-engine exhaust, biomass burning, cooking, industrial processes, and fugitive dust. Ambient VOC and PM concentrations have been reduced as a result of control measures applied to these sources, and additional reductions have been implemented for toxic materials such as lead, nickel, vanadium, arsenic, diesel particulate matter, and several organic compounds. As these fresh emission contributions in neighborhood- and urban-scale environments (Chow et al., 2002) decrease, regional-scale contributions that may have aged for intermediate (∼2 d) or long (∼7 d) periods prior to arrival at a receptor gain in importance. These profiles experience augmentation and depletion of chemical abundances owing to photochemical reactions among their gases and particles, as well as interactions upon mixing with other source emissions.
Peatland fires produce long-lasting thick smoke that leads to adverse atmospheric, climate, ecological, and health impacts. Smoke from Indonesian and Malaysian peatlands is a major concern in the countries of southeastern Asia (Wiggins et al., 2018) and elsewhere; it is transported over long distances. Aged peat smoke profiles are likely to differ from fresh emissions, as well as among the different types of peat in other parts of the world.
Ground-based, aircraft, shipboard, and laboratory peat combustion experiments have been carried out to better represent global peat fire emissions and estimate their environmental impacts (e.g., Akagi et al., 2011; Iinuma et al., 2007; Nara et al., 2017; Stockwell et al., 2014, 2016). Most peat fire studies report emission factors (EFs) for pyrogenic gases (e.g., methane, carbon monoxide, and carbon dioxide) and fine particle (PM2.5, particles with aerodynamic diameter <2.5 µm) mass, with a few studies reporting EFs for organic and elemental carbon (OC and EC) (Hu et al., 2018).
Despite this lack of peat-specific fresh and aged source profiles, results have been published for source apportionment in Indonesia (See et al., 2007), Malaysia (Fujii et al., 2017), Singapore (Budisulistiorini et al., 2018), and Ireland (Dall'Osto et al., 2013; Kourtchev et al., 2011; Lin et al., 2019). These have involved sampling under environments dominated by near-source and far-from-source emissions, such as the 2015 Indonesia burning episode, to determine changes in thermally derived carbon fractions with aging (Tham et al., 2019) and inference of aged peat burning profiles from positive matrix factorization (PMF) application to chemically speciated ambient PM samples (Fujii et al., 2017). Budisulistiorini et al. (2018) observe that “… atmospheric processing of aerosol particles in haze from Indonesian wildfires has scarcely been investigated. This lack of study inhibits a detailed treatment of atmospheric processes in the models, including aerosol aging and secondary aerosol formation.”
Changes in source profiles have been demonstrated in large smog chambers (Pratap et al., 2019), wherein gas–particle mixtures are illuminated with ultraviolet (UV) light for several hours and their end products are measured. Such chambers are specially constructed and limited to laboratory testing. A more recent method for simulating such aging is the oxidation flow reactor (OFR), based on the early studies of Kang et al. (2007), revised and improved by several researchers (e.g., Jimenez, 2018; Lambe et al., 2011), and commercially available from Aerodyne (2019a, b). Although the Aerodyne potential aerosol mass (PAM)-OFR has many limitations, as explained in the Supplement (Sect. S1), it is a practical method for understanding how profiles might change with different degrees of atmospheric aging. A growing users group (PAMWiki, 2019) provides increasing knowledge of its characteristics and operations.
Laboratory peat combustion EFs for gaseous carbon and nitrogen species corresponding with the profiles described here, as well as PM2.5 mass and major chemical species (e.g., carbon and ions), are reported by Watson et al. (2019). The PM2.5 speciated source profiles derive from six peat fuels collected from Odintsovo, Russia; Pskov, Siberia; northern Alaska and Florida, USA; and Borneo, Malaysia, representing boreal, temperate, subtropical, and tropical climate regions. Comparisons between fresh (diluted and unaged) and aged (representing intermediately aged (∼2 d) and well-aged (∼7 d) laboratory-simulated oxidation with an OFR) PM2.5 speciated profiles are made to highlight chemical abundance changes with photochemical aging. The objectives of this study are to (1) evaluate similarities and differences among the peat source profiles from four biomes; (2) examine the extent of gas-to-particle oxidation and volatilization between 2 and 7 d of simulated atmospheric aging; and (3) characterize carbon and nitrogen properties in peat combustion emissions.
The Supplement describes the sampling configuration shown in Fig. S1 and OFR operation. Briefly, peat smoke generated in a laboratory combustion chamber (Tian et al., 2015) was diluted with clean air (by factors of 3 to 5) to allow for nucleation and condensation at ambient temperatures (Watson et al., 2012). These diluted emissions were then passed through an unmodified Aerodyne PAM-OFR in the OFR185 mode without ozone (O3) injection. Hydroxyl radical (OH) production as a function of UV lamp voltage was estimated by inference from sulfur dioxide (SO2) decay using well-established rate constants. UV lamps were operated at 2 and 3.5 V with a flow rate of 10 L min−1 and a plug-flow residence time of ∼80 s in the 13.3 L anodyne-coated reactor, which translates to OH exposures (OHexp) of and molecules s cm−3 at 2 and 3.5 V, respectively.
Transport times between source and receptor of 1 to 10 d are typical of peat burning plumes, and the two OHexp estimates were selected to examine intermediate (∼2 d) and long-term (∼7 d) atmospheric aging. Other emissions aging experiments (e.g., Lambe et al., 2011) cite Mao et al. (2009) for a 24 h average atmospheric OH concentration (OHatm) of 1.5×10⁶ molecules cm−3. This number appears nowhere in the text of Mao et al. (2009), but it corresponds to the ground-level median value in Mao's Fig. 8 plot of OH vs. altitude for Asian outflows over the Pacific Ocean. The individual measurements in the plot range from OHatm near zero to 5.3×10⁶ molecules cm−3. Altshuller (1989) concluded that “the literature contains reports of atmospheric OH radical concentrations measured during daylight hours ranging from 105 to over 108 molecule cm−3, but almost all of the values reported are below 5×10⁷ molecules cm−3.” Stone et al. (2012) report atmospheric values ranging from 1.1×10⁵ molecules cm−3 in polar environments to 1.5×10⁷ molecules cm−3 in a vegetated forest. Uncertainties in OHexp within the OFR are, therefore, not the controlling uncertainty in estimating profile aging times. Added to this uncertainty are reactions among emission constituents that are not embodied in the OFR185 mode that tend to suppress OHexp with respect to that estimated by the SO2 calibration (Li et al., 2015; Peng et al., 2015, 2016, 2018; Peng and Jimenez, 2017). The “OFR Exposure Estimator” available from the PAMWiki (2019) intends to estimate this OHexp, but detailed VOCs from these experiments are insufficient to apply it. The nominal 2 and 7 d aging times determined by dividing OHexp by Mao's 1.5×10⁶ molecules cm−3 are subject to these uncertainties, which may increase or decrease the aging time estimates. However, these uncertainties, along with other uncertainties related to peat sample selection, moisture content, and laboratory burning conditions, do not negate the value of the measurements reported here. There are distinct differences in the fresh, intermediately aged, and well-aged profiles that address the concerns expressed by Budisulistiorini et al. (2018).
A total of 40 smoldering-dominated peat combustion tests were conducted that included three to six tests for each type of peat fuel (Table S1). The following analysis uses time-integrated (∼40–60 min) gaseous and PM2.5 filter pack samples collected upstream and downstream of the OFR, representing fresh and aged peat combustion emissions, respectively.
2.1 PM2.5 mass and chemical analyses
Measured chemical abundances included PM2.5 precursor gases (i.e., nitric acid (HNO3) and ammonia (NH3)) as well as PM2.5 mass and major components (e.g., elements, ions, and carbon). Water-soluble organic carbon (WSOC), carbohydrates, and organic acids that are commonly used as markers in source apportionment for biomass burning were also quantified (Chow and Watson, 2013; Watson et al., 2016).
Figure 1Filter pack sampling configurations for upstream and downstream channels of the oxidation flow reactor. a The filter types are (1) Teflon-membrane filter (Teflon©, 2 µm pore size, R2PJ047, Pall Life Sciences, Port Washington, NY, USA); (2) quartz-fiber filters (Tissuquartz, 2500 QAT-UP, Pall Life Sciences); and (3) citric-acid- and sodium-chloride-impregnated cellulose-fiber filters (31ET, Whatman Labware Products, St. Louis, MO, USA). b Analyses include (1) mass by gravimetry (model XP6 microbalance, Mettler-Toledo, Columbus, OH, USA); (2) light reflectance–transmittance by UV-vis spectrometry (Lambda35, PerkinElmer, Waltham, MA, USA); (3) multiple elements by energy-dispersive X-ray fluorescence (XRF) (Epsilon 5 PANalytical, now Malvern PANalytical Instruments, Westborough, MA, USA); (4) four anions (chloride, Cl−; nitrite, ; nitrate, ; and sulfate, ); three cations (water-soluble sodium, Na+; potassium, K+; and ammonium, ) and 10 organic acids (i.e., formic acid, acetic acid, lactic acid, methanesulfonic acid, oxalic acid, propionic acid, succinic acid, maleic acid, malonic acid, and glutaric acid) by ion chromatography (IC) with a conductivity detector (Dionex model ICS-5000+, Thermo Scientific, Waltham, MA, USA); (5) 17 carbohydrates (i.e., levoglucosan, mannosan, galactosan, glycerol, 2-methylerythritol, arabitol, mannitol, xylitol, erythritol, adonitol, inositol, glucose, galactose, arabinose, fructose, sucrose, and trehalose) by IC with a pulsed amperometric detector (Dionex model ICS3000, Thermo Scientific, Waltham, MA, USA); (6) water-soluble organic carbon (WSOC) by a total organic carbon analyzer with a non-dispersive infrared (NDIR) detector (Shimadzu Corporation, Kyoto, Japan); (7) organic functional groups by using a Fourier transform infrared (FTIR) spectrometer (VERTEX 70, Bruker, Billerica, MA, USA); and (8) organic, elemental, and brown carbon (OC, EC, and BrC) by a multiwavelength thermal–optical carbon analyzer (DRI model 2015, Magee Scientific, Berkeley, CA, USA). c Teflon-membrane filter samples from Channel 3 are to be analyzed for additional organic nitrogen species using Fourier transform ion cyclotron resonance mass spectrometry (FT-ICR-MS) at the Michigan Technological University. Quartz-fiber filter samples from Channel 4 are to be analyzed for polar and nonpolar organics at the Hong Kong Premium Services and Research Laboratory.
The filter pack sampling configurations for the four upstream and two downstream channels along with filter types and analytical instrument specifications are shown in Fig. 1. Multiple sampling channels accommodate different filter substrates that allow for comprehensive chemical speciation. Additional upstream Teflon-membrane and quartz-fiber filters were taken for more specific nitrogen and organic compound analyses that are not reported here. The limited flow through the OFR precludes additional downstream sampling.
Teflon-membrane filters (i.e., channels one and five in Fig. 1) were submitted for (1) gravimetric analysis by microbalance with ±1 µg sensitivity before and after sampling to acquire PM2.5 mass concentrations (Watson et al., 2017); (2) filter light reflectance and transmittance by an ultraviolet–visible (UV-vis) spectrometer (200–900 nm) equipped with an integrating sphere that measures transmitted/reflected light at 1 nm intervals (Johnson, 2015); (3) 51 elements (i.e., sodium, Na, to uranium, U) by energy-dispersive X-ray fluorescence (XRF) analysis (Watson et al., 1999); and (4) organic functional groups by Fourier transform infrared (FTIR) spectrometry. Results from UV-vis and FTIR spectrometry will be reported elsewhere.
Half of the quartz-fiber filter (i.e., channels two and six) was analyzed for (1) four anions (i.e., chloride, Cl−; nitrite, ; nitrate, ; and sulfate, ), three cations (i.e., water-soluble sodium, Na+; potassium, K+; and ammonium, ), and nine organic acids (including four mono- and five dicarboxylic acids) by ion chromatography (IC) with a conductivity detector (CD) (Chow and Watson, 2017); (2) 17 carbohydrates including levoglucosan and its isomers by IC with a pulsed amperometric detector (PAD); and (3) WSOC by combustion and nondispersive infrared (NDIR) detection. A portion (0.5 cm2) of the other half quartz-fiber filter was analyzed for OC, EC, and brown carbon (BrC) by the IMPROVE_A multiwavelength thermal–optical reflectance–transmittance method (Chen et al., 2015; Chow et al., 2007, 2015b); the IMPROVE_A protocol (Chow et al., 2007) reports eight operationally defined thermal fractions (i.e., OC1 to OC4 evolved at 140, 280, 480, and 580 ∘C in helium atmosphere; EC1 to EC3 evolved at 580, 740, and 840 ∘C in helium–oxygen atmosphere; and pyrolyzed carbon, OP) that further characterize carbon properties under different combustion and aging conditions. Citric acid- and sodium chloride-impregnated cellulose-fiber filters placed behind the Teflon-membrane and quartz-fiber filters, respectively, acquired NH3 as and HNO3 as volatilized nitrate, respectively, with analysis by an IC-CD.
Detailed chemical analyses along with quality assurance–quality control (QA–QC) measures are documented in Chow and Watson (2013). For each analysis, a minimum of 10 % of the samples were submitted for replicate analysis to estimate precisions. Precisions associated with each concentration were calculated based on error propagation (Bevington, 1969) of the analytical and sampling volume precisions (Watson et al., 2001).
Table 1Average fresh and aged peat combustion source profiles (as a percentage of PM2.5 mass) for six types of peats.
a Analytical uncertainties are used for species below the minimum detection limit, mostly for carbohydrate species and elements with an average concentration of 0.00. b Only one sample was analyzed for elements by X-ray fluorescence with abundance and measurement uncertainty. c Peat ID code, detailed operation parameters are reported in Watson et al. (2019). d Data not available; water-soluble K+ data were contaminated for aged samples due to the use of potassium iodide denuder downstream of the oxidation flow reactor. e WSOC measures from peat sample ID PEAT028 were invalidated due to a crack in the test tube. Therefore, only two measurements are used to calculate the average and standard deviation. f Data not available due to the invalidated citric-acid-impregnated filter sample. g The carbon analysis follows the IMPROVE_A thermal–optical reflectance protocol (Chow et al., 2007) that is applied in long-term US non-urban IMPROVE and urban Chemical Speciation Network. Organic carbon (OC) is the sum of OC1 + OC2 + OC3 + OC4 plus pyrolyzed carbon (OP). Elemental carbon (EC) is the sum of EC1 + EC2 + EC3 minus OP. Total carbon is the sum of OC and EC. Since a large fraction of OP (7 %–13 %) is found in smoldering peat combustion emissions – indicative of higher-molecular-weight compounds that are likely to char – the resulting EC fractions are lower than the individual EC fraction after OP correction.
2.2 PM2.5 source profiles
Concentrations of two gases (i.e., NH3 and HNO3) and 125 chemical species acquired from each sample pair (fresh vs. aged) were normalized by the PM2.5 gravimetric mass to obtain source profiles with species-specific fractional abundances. The following analyses are based on the average of 24 paired profiles (shown in Table 1), grouped by upstream (fresh) and downstream (aged) samples for 2 and 7 d aging (i.e., denoted as Fresh 2 vs. Aged 2 and Fresh 7 vs. Aged 7) for each of the six peats with 25 % fuel moisture. Composite profiles are calculated based on the average of individual abundances and the standard deviation of the average within each group (Chow et al., 2002). Although the standard deviation is termed the source profile abundance uncertainty, it is really an estimate of the profile variability for the same fuels and burning conditions, which exceeds the propagated measurement precision.
To assess changes with fuel moisture content, tests of three sets of Putnam (FL1) peats at 60 % fuel moisture were conducted with the resulting profiles shown in Table S2. A few samples were voided due to filter damage or sampling abnormality, which produced five unpaired (either fresh or aged) individual profiles (Table S3). These profiles are reported as they might be useful for future source apportionment studies.
2.3 Equivalence measures
The Student's t test is commonly used to estimate the statistical significance of differences between chemical abundances. Two additional measures are used to determine the similarities and differences between profiles: (1) the correlation coefficient (r) between the source profile abundances (Fij, the fraction of species i in peat j) divided by the source profile variabilities (σij) that quantifies the strength of association between profiles, and (2) the distribution of weighted differences (residual [R]/uncertainty [U] = [Fi1−Fi2] ∕ []0.5) for –2σ,2σ–3σ, and >3σ. The percent distribution of R∕U ratios is used to understand how many of the chemical species differ by multiples of the uncertainty of the difference. These measures are also used in the effective variance chemical mass balance (EV-CMB) receptor model solution that uses the variance (r2) and the R∕U ratio to quantify agreement between measured receptor concentrations and those produced by the source profiles and source contribution estimates (Watson, 2004).
3.1 Similarities and differences among peat profiles
The equivalence measures are used to provide guidance in compositing and comparing the 40 sets of fresh vs. aged profiles. The first comparison is made between two Florida samples from locations separated by ∼485 km (i.e., Putnam County lake bed, FL1; and Everglades National Park, FL2), representing different geological areas and land uses. Panel A of Table S4 shows that the two profiles yield high correlations (r>0.994), but are statistically different (P<0.002), with over 93 % of the chemical abundance differences within ±3σ. However, when combining both fresh Florida profiles (i.e., all Fresh 2 vs. all Fresh 7 in Panel B), statistical differences are not found, with over 98 % of abundance differences within ±1σ and P>0.5. Notice that statistical differences are found between the two fresh Florida profiles (i.e., FL1 Fresh 2 vs. FL2 Fresh 2 and FL1 Fresh 7 vs. FL2 Fresh 7 in Panel A) with few (<0.81 % and 5.6 %) R∕U ratios exceeding 3σ; combining the two Florida profiles may cancel out some of the differences. However, paired comparisons of other combined profiles show statistical differences with low P values (P<0.002). To further demonstrate the differences, these two Florida profiles are classified as Subtropical 1 and Subtropical 2 to compare with other biomes.
Table 2Equivalence measuresa for comparison of PM2.5 peat source profiles.
a For the t test, a cutoff probability level of 5 % is selected; if P<0.05, there is a 95 % probability that the two profiles are different. For correlations, r>0.8 suggests similar profiles, indicates a moderate similarity, and r<0.5 denotes little or no similarity. The R∕U ratio indicates the percentage of the >93 reported chemical abundances differ by more than an expected number of uncertainty intervals. The normal probability density function of 68 %, 95.5 %, and 99.7 % for ±1σ, ±2σ, and ±3σ, respectively, is used to evaluate the R∕U ratios. The two profiles are considered to be similar, within the uncertainties of the chemical abundances when 80 % of the R∕U ratios are within ±3σ, with r>0.8 and P>0.05. Species with R∕U ratios >3σ are further examined as these may be markers that further allow source contributions to be distinguished by receptor measurements. They may also reflect the sampling and analysis artifacts that are not representative of the larger population of source profiles. b Unless otherwise noted, boreal represents Russia and Siberia regions, temperate represents the northern Alaska region, subtropical is divided into Subtropical 1 for Putnam (FL1) and Subtropical 2 for Everglades (FL2) peats, and tropical represents the island of Borneo, Malaysia, region. c n1 and n2 denote number of samples in comparison. d Student's t test P values.
Similarities and differences in peat profiles by biome are summarized in Table 2. Comparisons are made for (1) paired fresh vs. aged profiles (i.e., All Fresh vs. All Aged; Fresh 2 vs. Aged 2; and Fresh 7 vs. Aged 7), (2) different experimental tests (i.e., Fresh 2 vs. Fresh 7), and (3) two aging times (i.e., aged 2 vs. aged 7). Equivalence measures show that most of these profiles are highly correlated (r>0.97, mostly >0.99) but statistically different (P<0.05), with a few exceptions.
Group comparisons between fresh and aged samples (Panel A of Table 2) show statistical differences for all but Putnam (FL1) peat (P>0.94). This is consistent with Watson et al (2019) where atmospheric aging (7 d) reduced organic carbon EFs (i.e., EFOC) by ∼20 %–33 % for all but Putnam (FL1) peats (EFOC remained within ±0.5 %). As OC is a major component of PM2.5, no apparent changes in OC and carbon fraction abundances may dictate the lack of statistical differences between the fresh and aged profiles.
Paired comparisons for 2 d aging (Panel B of Table 2) show no statistical differences between the Fresh 2 vs. Aged 2 Putnam (FL1) and Malaysian profiles (P>0.30 and 0.95), which may be due to the low number of samples (n=2) in the comparison; this results in no statistical differences for combined Putnam (FL1) and Malaysian peat comparison (P>0.62). Similar to the findings of combining both fresh Florida profiles (i.e., all Fresh2 vs. all Fresh 7 in Table S4), the two fresh Alaskan profiles (Fresh 2 vs. Fresh 7 in Panel D of Table 2) do not show statistical differences (P>0.12).
Compositing profiles by averaging each of the measured abundances may disguise some useful information. For receptor model source apportionment, region-specific profiles are most accurate for estimating source contributions.
Student's t tests for the gravimetric PM2.5 mass concentrations (µg m−3) measured upstream and downstream of the OFR (Table S5) show statistically significant differences (P<0.05) between fresh vs. aged PM2.5 (i.e., Fresh 2 vs. Aged 2 and Fresh 7 vs. Aged 7). Fresh 2 and Fresh 7 PM2.5 mass concentrations are similar, as expected from replicate tests for the same conditions. Increases in some species abundances offset decreases on other abundances, resulting in similar PM2.5 levels for the “all fresh vs. all aged” comparison.
3.2 Ratios of sum of species to PM2.5 mass
The sum of the major PM chemical abundances should be less than unity since oxygen, hydrogen, and liquid water content are not measured (Chow et al., 1994, 1996). As shown in Table S6, the sums of elements, ions, and carbon explain averages of ∼70 %–90 % of PM2.5 mass for fresh profiles except for Russian peat (62 %–64 %). The “sum of species” decreased by an average of 6 % and 11 % after 2 and 7 d, respectively. These differences are consistent with loss of semi-volatile organic compounds (SVOCs) in the low-temperature carbon fractions, although they are offset by formation of oxygenated compounds during aging. This is true for all but Putnam (FL1) peat, for which the sum of species explains nearly the same fraction of PM2.5 for the fresh and aged profiles.
Figure 2Comparison between fresh and aged profile chemical abundances for each of the six types of peat with 2 and 7 d aging times. Standard deviations associated with averages for x and y variables are also shown. Vertical dashed lines (red) at 1 % on the x axis delineate the two distinguishable clusters: centered around 0.1 % for reactive and ionic species and centered around 10 % for carbon compounds.
3.3 Comparison between fresh and aged profiles
Fresh and aged chemical abundances are compared in Fig. 2. Species abundances vary by several orders of magnitude but exhibit two distinguishable clusters: centered around 0.1 % for reactive and secondary ionic species (e.g., , , and ) and centered around 10 % for carbon compounds (e.g., OC fractions and WSOC). While most gaseous NH3∕PM2.5 ratios exceed 10 %, HNO3∕PM2.5 ratios are well below 1 % in fresh emissions. Reactive–ionic species and carbon components are mostly above and below the 1:1 line, respectively, implying particle formation and evaporation after atmospheric aging. Large variabilities are found for individual species as noted by the standard deviations associated with each average.

Figure 3Ratios of average aged (A) to fresh (F) chemical species for 2 d (A2/F2) and 7 d (A7/F7) of atmospheric aging for six types of peats. Error bars represent the standard deviations associated with each ratio. Note that different scales were used for the two Y axes, with 0.001 to 10 000 on the left axis and 0.1 to 100 on the right axis (species abbreviations are shown in Table 1; OM is organic mass).
Figure 3 shows the ratio of averages between aged and fresh profiles. Atmospheric aging increased oxalic acid, , , and abundances (likely due to conversion of nitrogen and sulfur gases (e.g., NH3, NO, NO2, and SO2) to particles), but decreased NH3, levoglucosan, and low-temperature OC1 and OC2 abundances in most cases. Large variations are found among measured species (left panels in Fig. 3) as ratios range several orders of magnitude for mineral and ionic species. Consistent with Fig. 2 where most carbon compounds are close to but below the 1:1 line, the right panels in Fig. 3 show the reduction of carbonaceous abundances with aged ∕ fresh ratios between 0.1 and 1. Higher aged ∕ fresh ratios in low-temperature OC1 and OC2 after 7 d aging are consistent with additional volatilization with longer aging time.
Atmospheric aging should not change the abundances of mineral species (e.g., Al, Si, Ca, Ti, and Fe), except to the extent that the PM2.5 mass (to which all species are normalized) increases or decreases with aging. Large standard deviations associated with the ratio of averages for mineral species in the left panels of Fig. 3 illustrate variabilities among different combustion tests for the less abundant species.
3.4 Carbon abundances
3.4.1 Organic carbon and thermally evolved carbon fractions
Total carbon (TC, sum of OC and EC) constitutes the largest fraction of PM2.5 (Table 1), accounting for 59 %–87 % and 43 %–77 % of the PM2.5 mass for the fresh and aged profiles, respectively. OC dominates TC with low EC abundances (0.67 %–4.4 %), as commonly found in smoldering-dominated biomass combustion (Chakrabarty et al., 2006; Chen et al., 2007). The largest OC fractions are high-temperature OC3 (15 %–30 % of PM2.5), consistent with past studies for biomass burning emissions (Chen et al., 2007; Chow et al., 2004).
OC abundances decreased with aging time. As shown in Fig. S2, upstream (Fresh 2 and Fresh 7) OC abundances ranged from 58 % to 85 % and decreased by 4 %–12 % and 20 %–33 % after 2 and 7 d aging, respectively. The exception is for Putnam (FL1) peat, where the OC abundances were similar (changed by ∼0.5 to 1.5 %) between fresh and aged profiles. Part, but not all of this reduction is due to increasing abundances of non-carbon components, particularly nitrogen-containing species that add to PM2.5 mass. OC abundance decreases after aging for other profiles may have contributed to the statistical differences found between fresh and aged PM2.5 mass (Table S5). With the exception of Putnam (FL1) peat, the additional 7 %–22 % OC degradation from 2 to 7 d aging implies that much of the OC changes require about a week of aging time.
The Student's t test for fresh and aged profiles shows statistical differences (P<0.05) for TC, OC, and low-temperature OC1 and OC2, but similarities for OC3 and OC4. High-temperature OC3 and OC4 contain more polar and/or high-molecular-weight organic components (Chen et al., 2007) that are less likely to photochemically degrade. Large fractions of pyrolyzed carbon (OP of 7 %–13 %) are also found, indicative of higher-molecular-weight compounds that are likely to char (Chow et al., 2001, 2004, 2018).
Reduction in OC abundances after atmospheric aging is attributed mostly to decreases in low-temperature OC1 and OC2 abundances in the OFR as shown in the fresh vs. aged ratios of average abundances (Fig. 3). Figure S3a shows reductions in OC1 abundances after 2 and 7 d of atmospheric aging are apparent but at a similar level: ranging from 2 % to 10 % and 3 % to 14 %, respectively. Additional OC1 reductions from 2 to 7 d are most apparent for Russia and Everglades (FL2) peats at the 6 %–10 % level. Similar reductions are found for OC2 (Fig. S3b): ranging from 3 % to 11 % and 3 % to 12 % after the 2 and 7 d of aging, respectively. Prolonged aging times resulted in additional 4 %–8 % OC2 reduction for all but Russian and Putnam (FL1) peats. As oxidation of organic compounds with OH radicals is an efficient chemical aging process (Chim et al., 2018), some of the VOCs and SVOCs may have been liberated (Smith et al., 2009).
3.4.2 Organic mass (OM) and OM∕OC ratios
Reduction of the sum of species and OC abundances from fresh to aged profiles can be offset by the formation of oxygenated organic compounds as the profiles age. Different assumptions have been used to transform OC to organic mass (OM) to account for unmeasured H, O, N, and S in organic compounds (Cao, 2018; Chow et al., 2015a; Riggio et al., 2018). As single multipliers for OC cannot capture changes by oxidation in the OFR, OM is calculated by subtracting mineral components (using the IMPROVE soil formula by Malm et al., 1994), major ions (i.e., , , and ), and EC from PM2.5 mass to account for unmeasured mass in organic compounds (Chow et al., 2015a; Frank, 2006). This approach assumes that no major chemical species are unmeasured and that the remaining mass consists of H, O, N, and S associated with OC in forming OM.
Table 3 shows that OM ∕ OC ratios ranged from 1.1 to 1.7 and 1.3 to 2.2 for fresh and aged profiles, respectively. The lower OM ∕ OC ratios in fresh emissions are consistent with those reported for other types of biomass burning (Chen et al., 2007; Reid et al., 2005). Figure S4 shows a general upward trend in OM ∕ OC ratios after atmospheric aging with additional 14 %–21 % increases from 2 to 7 d for all but Putnam (FL1) peat. The increase in OM ∕ OC ratios with aging is likely due to an increase in oxygenated organics. The OM ∕ OC ratio of 1.20 ± 0.05 for fresh Borneo, Malaysia, peat is consistent with the 1.26 ± 0.04 ratio for fresh peat burning emissions in Central Kalimantan, Indonesia (Jayarathne et al., 2018), both located on the island of Borneo.
The highest OM ∕ OC ratios are found for Russian peat, ranging from 1.6 to 1.7 for fresh profiles and increasing to 2.1–2.2 for aged profiles, consistent with formation of low-vapor-pressure oxygenated compounds in the OFR. Watson et al. (2019) report that the Russian peat fuel contains the lowest carbon (44.20±1.01 %) and highest oxygen (38.64±0.78 %) contents among the six peats. The low carbon contents in peat fuel and source profiles are consistent with the lowest sum of species found in Russian peat, with 62 %–64 % and 50 %–52 % of PM2.5 mass for the fresh and aged profiles, respectively. After 7 d aging for Siberian peat, the increasing OM ∕ OC ratios from 1.2±0.14 to 1.5±0.18 are similar to the increase from 1.22 to 1.42 reported by Bhattarai et al. (2018).
Table 3Organic carbon diagnostic ratios for different peat samples.
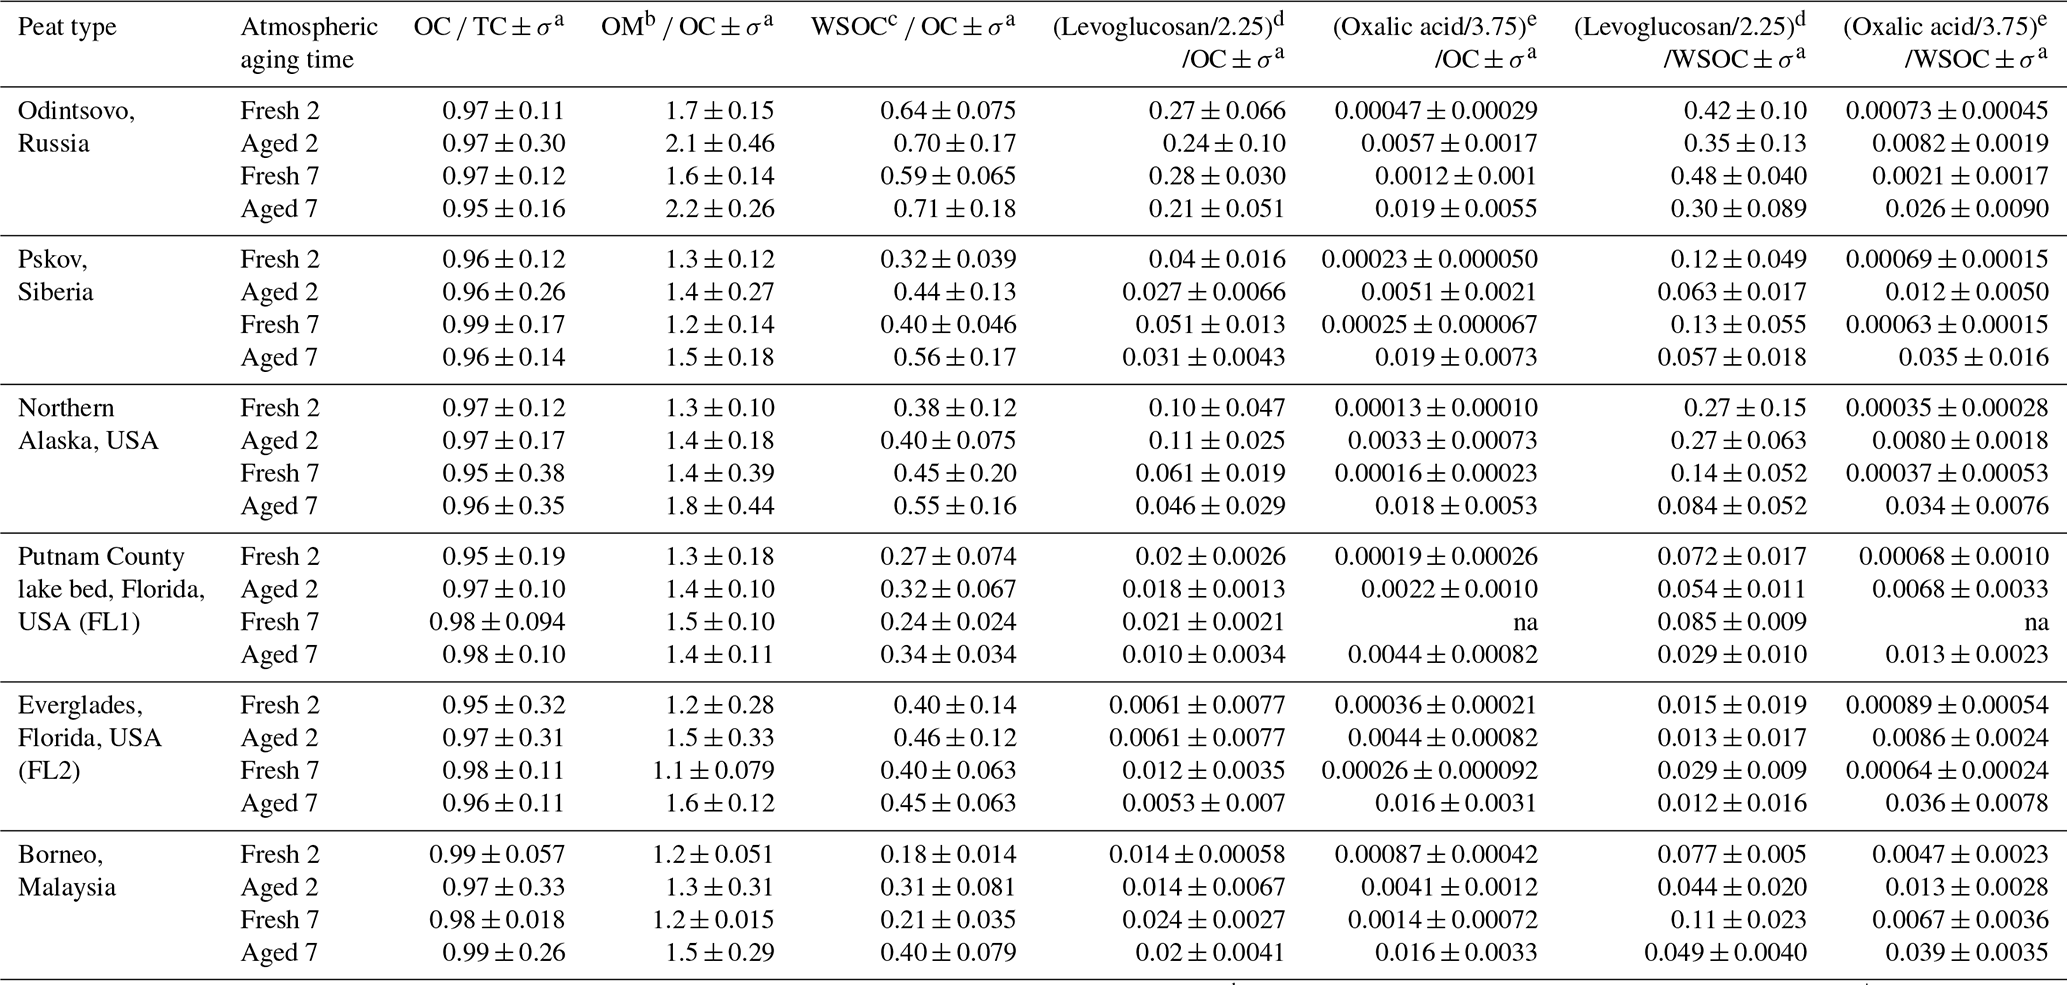
a Uncertainty associated with each ratio is calculated based on the square root of the individual uncertainties multiplied by the ratio (Bevington, 1969). b OM (organic mass) is calculated by subtracting major ions (i.e., sum of , , and ), crustal components (2.2 Al + 2.49 Si + 1.63 Ca + 1.94 Ti + 2.42 Fe), and elemental carbon from PM2.5 mass. c WSOC: water-soluble organic carbon. d Levoglucosan/2.25 represents carbon content in levoglucosan, based on the chemical composition C6H10O5. e Oxalic acid/3.75 represents carbon content in oxalic acid based on the chemical composition C2H2O4.
3.4.3 Water-soluble organic carbon (WSOC)
WSOC abundances in PM2.5 were over 2-fold higher in fresh Russian peat (36 %–37 %) than Malaysian (15 %–17 %) peat. The 15 %–17 % WSOC in PM2.5 for fresh Borneo, Malaysia, peat (Table 1) is consistent with the 16±11 % from Central Kalimantan, Indonesia, peat (Jayarathne et al., 2018). However, the WSOC ∕ PM2.5 ratio is not a good indicator of changes in WSOC abundances during atmospheric aging as PM2.5 also contains non-water-soluble and non-carbonaceous aerosol. Table S7 shows large variabilities associated with the differences (i.e., aged minus fresh), suggesting that no differences exist within ±3 standard deviations. The only exceptions are for the 7 d Putnam (FL1) peat and 2 d Malaysian peat, where aging resulted in 7 %–8 % increases in WSOC abundances in PM2.5.
As WSOC is part of the OC, the WSOC ∕ OC ratio is a better indicator of atmospheric aging. WSOC ∕ OC ratios (Table 3) vary between fresh (0.18–0.64) and aged (0.31–0.71) profiles. Figure S5 shows a general increase in WSOC ∕ OC ratios from fresh to aged profiles. Longer aging time from 2 to 7 d results in 5 %–10 % higher WSOC ∕ OC ratios for all but the two Florida peats. OC water solubility also varies by peat type. Russian peat OC emissions are largely water-soluble, whereas Malaysian peat emissions are mostly water-insoluble, with WSOC ∕ OC ratios of 0.59–0.71 and 0.18–0.40, respectively.
3.4.4 Carbohydrates
Bates et al. (1991) found that peat from Sumatra, Indonesia, consisted of 18 %–46 % carbohydrate (mainly levoglucosan) relative to total carbon based on nuclear magnetic resonance spectroscopy. Levoglucosan and its isomers (mannosan and galactosan) are saccharide derivatives formed from incomplete combustion of cellulose and hemicellulose (Kuo et al., 2008; Louchouarn et al., 2009) and have been used as markers for biomass burning in receptor model source apportionment (Bates et al., 1991; Watson et al., 2016). These carbohydrate-derived pyrolysis products undergo heterogeneous oxidation when exposed to OH radicals in the OFR (Hennigan et al., 2010; Kessler et al., 2010).
Only five of the 17 carbohydrates (Table 1) were detected, with noticeable variations (e.g., >2 orders of magnitude) in levoglucosan for boreal and temperate peats. Levoglucosan abundances account for 35 %–39 % and 20 %–25 % of PM2.5 mass for fresh and aged Russian profiles, respectively. On a carbon basis, Table 3 shows that levoglucosan carbon (with an OM ∕ OC ratio of 2.25) accounts for 42 %–48 % and 30 %–35 % of WSOC and 27 %–28 % and 21 %–24 % of OC for fresh and aged Russian profiles, respectively. These levels are less than the 96±3.8 % levoglucosan or ∼42.7 % of levoglucosan carbon in OC reported for German and Indonesian peats (Iinuma et al., 2007). Elevated levoglucosan is also found for Siberian and Alaskan peats, ranging from 4 % to 18 % in PM2.5. However, the levoglucosan abundances are low (1 %–4 %) for the subtropical and tropical peats. An aging time of 7 d resulted in an additional 1 %–4 % levoglucosan degradation relative to 2 d aging with the exception of an additional 9 % reduction for Russian peat.

Figure 4Abundances of fresh and aged carbon-containing components in PM2.5. Levoglucosan (C6H10O5) is divided by 2.25 and oxalic acid (C2H2O4) is divided by 3.75 to obtain the carbon content. These levels are subtracted from the water-soluble organic carbon (WSOC) to obtain the remainder, and WSOC is subtracted from organic carbon (OC) to obtain non-soluble carbon. Elemental carbon (EC) is unaltered.
The extent of levoglucosan degradation depends on organic aerosol composition, OH exposure in the OFR, and vapor wall losses (Bertrand et al., 2018a, b; Pratap et al., 2019). Figure 4 shows the presence of levoglucosan carbon for the Russian and Alaskan peats after 2 and 7 d aging, at the levels of 8 %–11 % and 2 %–9 %, respectively, in line with a chemical lifetime longer than 2 d. This is consistent with the estimated 1.2–3.9 d of levoglucosan lifetimes under different environments reported by Lai et al. (2014). However, other studies (Hennigan et al., 2010; May et al., 2012; Pratap et al., 2019) found that levoglucosan experiences rapid gas-phase oxidation, resulting in ∼1–2 d lifetimes at ambient temperatures.
Among the carbohydrates, Jayarathne et al. (2018) reported 4.6±4.0 % of levoglucosan in OC for fresh Indonesian peat. Converting to levoglucosan carbon in Jayarathne et al. (2018) yields a fraction of 2 %, consistent with findings for Malaysian peat (1.4 %–2.4 %) in this study.
While the presence of levoglucosan in peat smoke is apparent, its isomer galactosan was not detectable. Mannosan is detectable in cold climate peats with 1 %–5 % of PM2.5 for the Russian and Alaskan peats and up to 1.3 % for Siberian peat. Apparent degradations from 3.9 % to 2.5 % and from 5.0 % to 2.1 % in mannosan abundances are found for Russian peat (Table 1) after 2 and 7 d, respectively. A 2- to 3-fold reduction in mannosan is also evident after 7 d aging for the Siberian and Alaskan peats. Similar observations apply to glycerol in Russian peat, ranging from 1.9 % to 3.5 % and 1.3 % to 1.7 % of PM2.5 for fresh and aged profiles, respectively. Other detectable carbohydrates are galactose and mannitol, typically present at <5 % of the levoglucosan abundance.
3.4.5 Organic acids
Organic acids have been associated with many anthropogenic sources, including engine exhaust, biomass burning, meat cooking, bioaerosol, and biogenic emissions. Past studies show the presence of low-molecular-weight dicarboxylic acids in biomass burning emissions (e.g., Falkovich et al., 2005; Veres et al., 2010).
Only four of the 10 measured organic acids (Table 1) (i.e., formic acid, acetic acid, oxalic acid, and propionic acid) were detected with variable abundances (<0.02 %–3.9 %). The largest changes between fresh and aged profiles are found for oxalic acid, ranging from <0.02 % to 0.43 % of PM2.5 for fresh profiles, with an ∼10- to 20-fold increase after 2 d (0.6 %–1.3 %) and with 1 to 2 orders of magnitude increases after 7 d (1.1 %–3.9 %). With the exception of Putnam (FL1) peat (1.1±0.19 %), oxalic acid accounts for ≥2.9 % of PM2.5 mass after 7 d.
Acetic acid abundances are stable between fresh and aged profiles, mostly in the range of 0.2 %–0.5 % except for a 6-fold increase from 0.23±0.15 % (Fresh 7) to 1.5±2.0 % (Aged 7) for Siberian peat with large variability among the tests. Formic acid and propionic acid abundances are low (<0.5 % and <0.02 %, respectively), but increase with aging. Extending the aging time from 2 to 7 d resulted in a notable increase in organic acid abundances, consistent with the increases in WSOC ∕ OC ratios (Table 3). By biome, the highest abundances for organic acids in PM2.5 are found for aged (Aged 7) Siberian peat, with 3.9±1.4 % oxalic acid, 1.5±2.0 % acetic acid, and 0.44±0.28 % formic acid (Table 1).
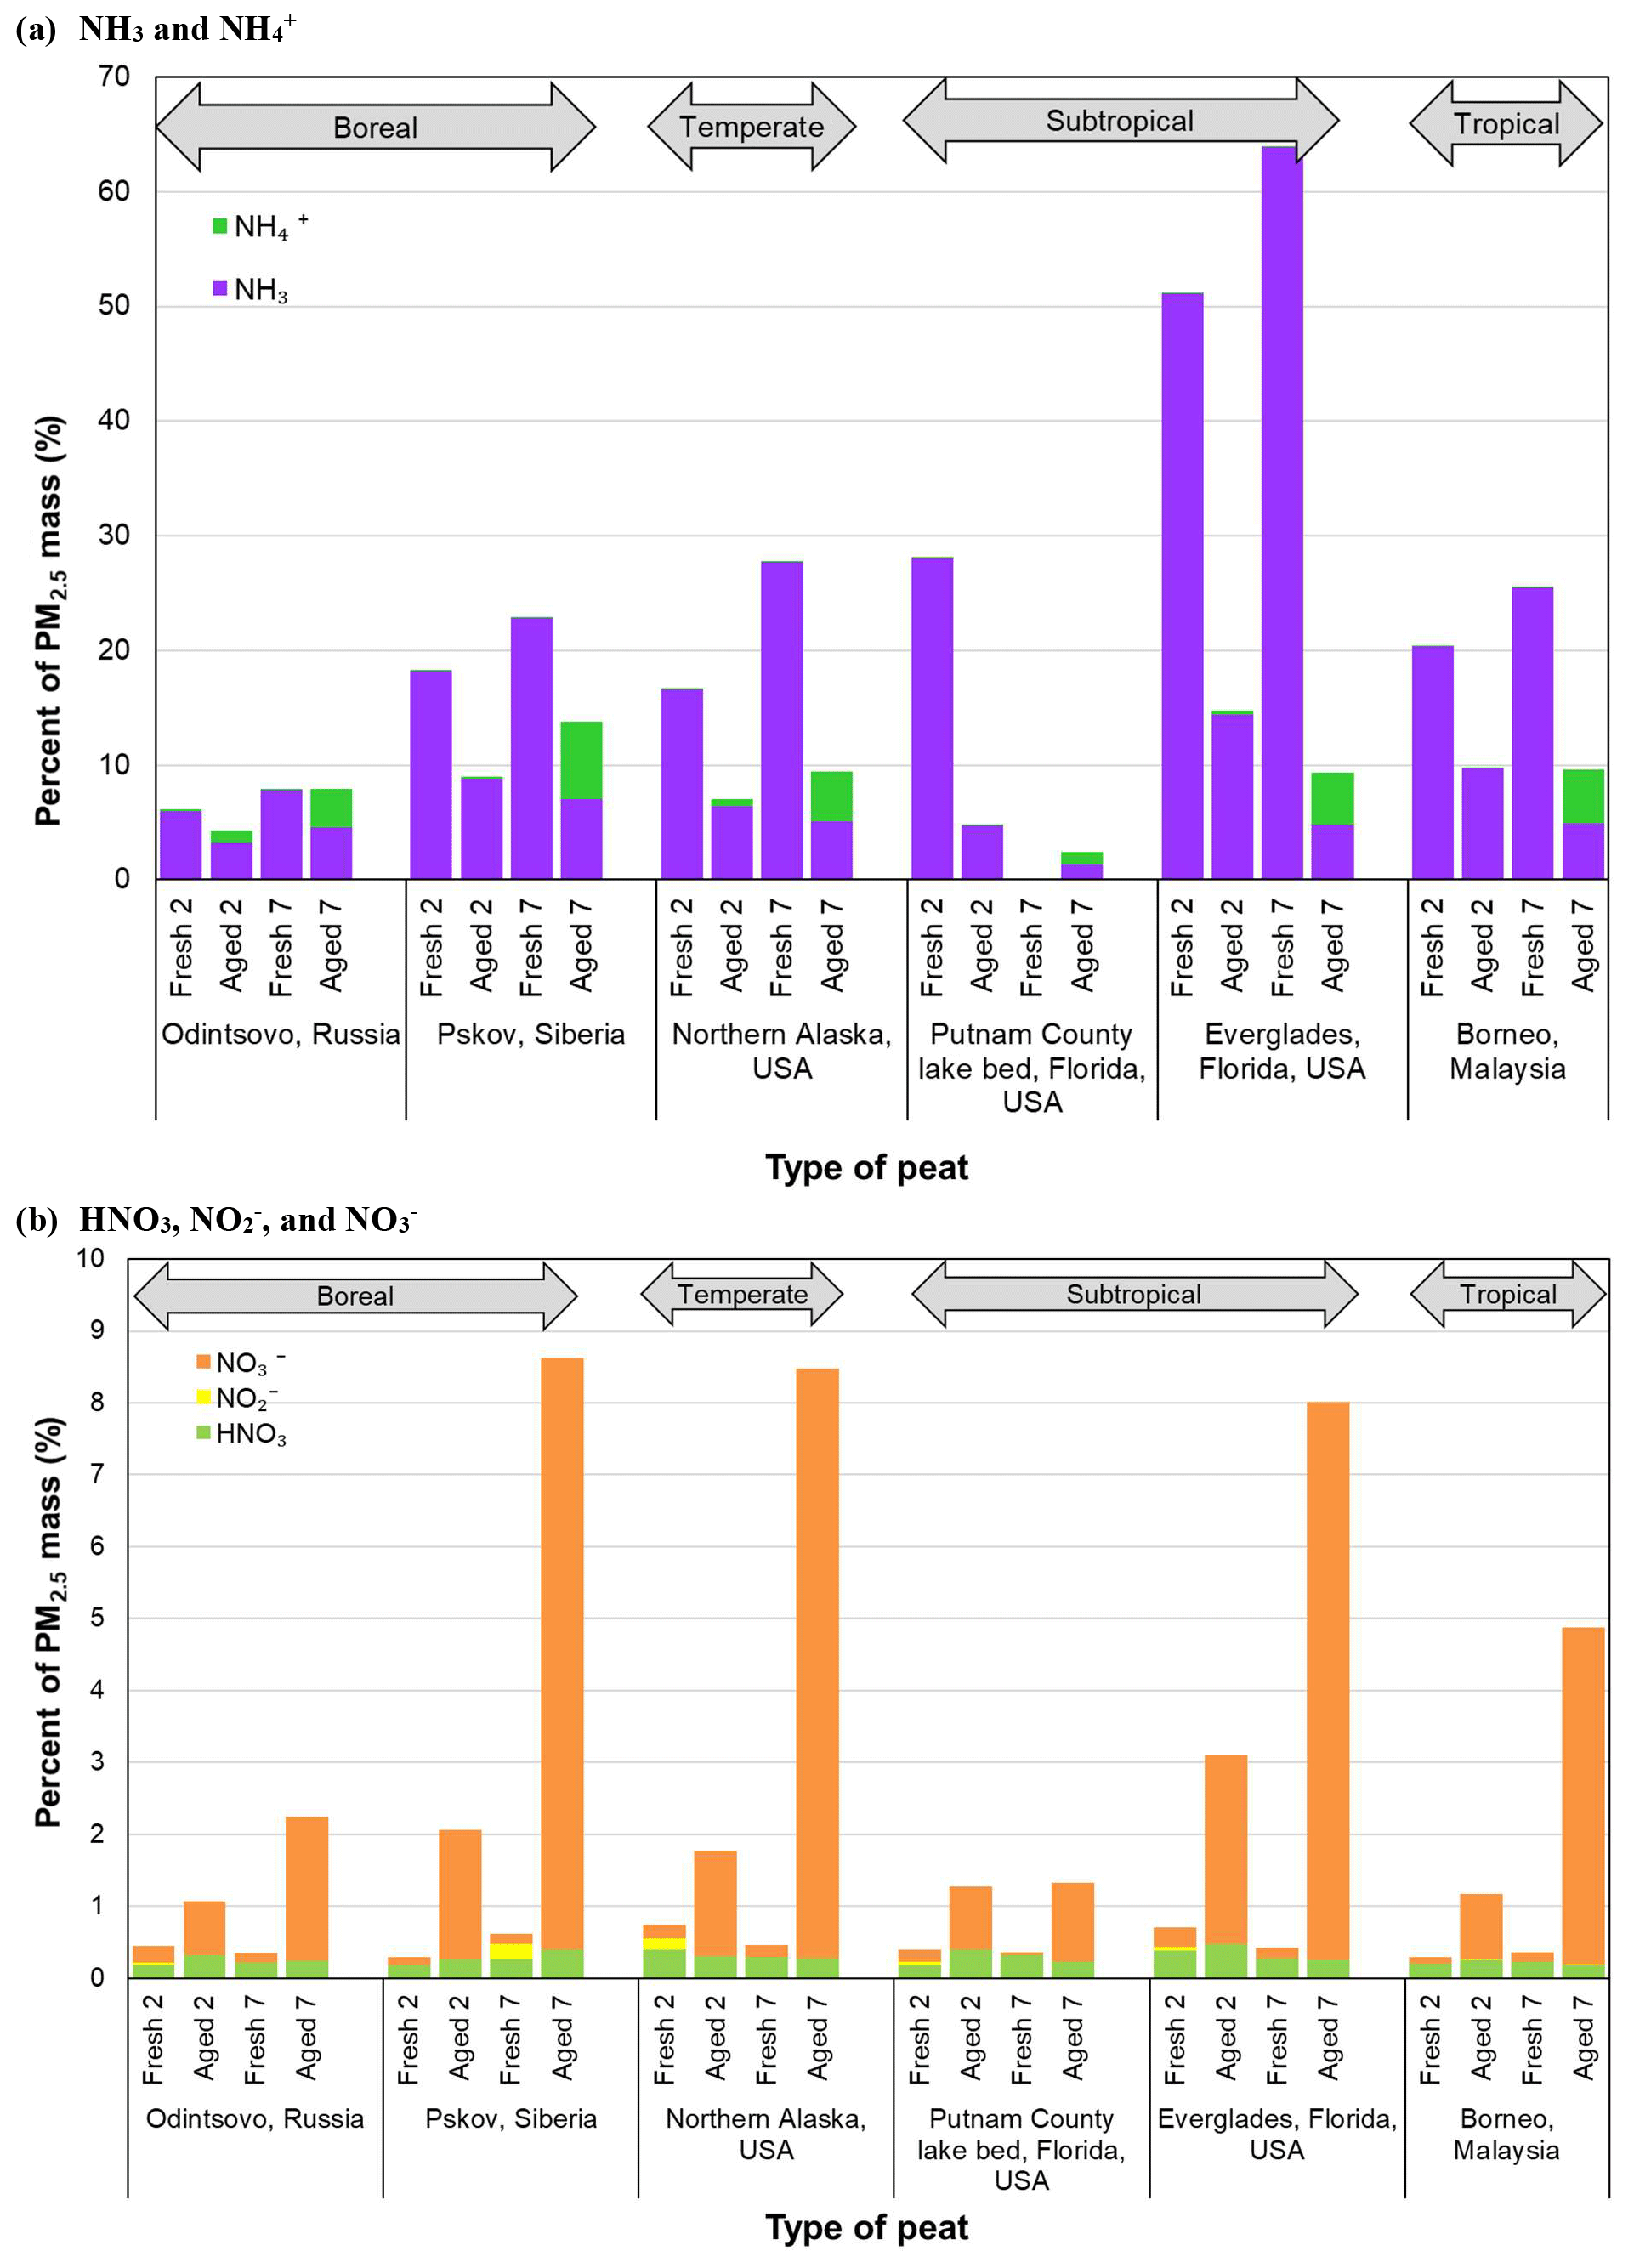
Figure 5Comparison of nitrogen species for (a) NH3 and and (b) HNO3, , and between fresh and aged profiles for six types of peats.
3.5 Nitrogen species, sulfate, and chloride abundances
Ammonia normalized to PM2.5 mass is high for fresh profiles, ranging from 17 % to 64 %, except for the low NH3 content in Russian peat (6 %–8 %). These abundances are reduced to 3 %–14 % and 1 %–7 % after 2 and 7 d aging, respectively. As shown in Fig. 5, most of the NH3 rapidly diminished after 2 d, with increasing particle-phase and after 7 d. The highest NH3-to-PM2.5 ratios are found for fresh Everglades (FL2) peat profiles (51 %–64 %), ∼2–8-fold higher than other peats. These high and low NH3∕PM2.5 ratios are consistent with the nitrogen contents in peat fuel: 3.93±0.08 % for Everglades and 1.50±0.52 % for Russian peats (Watson et al., 2019).
Ionic abundances are typically <0.5 %, especially in fresh profiles. Abundances of in PM2.5 are low (0.0005 %–0.13 %) for fresh emissions, but increase to 0.05 %–1.0 % after 2 d and 3.4 %–6.7 % after 7 d, with the exception of Putnam (FL1) peat (1.01±0.05 % ). Extending the aging time from 2 to 7 d results in an additional increase of ∼1 %–7 % abundances, in contrast to NH3 that is largely depleted after 2 d.
Figure 5b shows increasing abundances with aging, 0.04 %–0.23 % for fresh profiles, increasing to 0.74 %–2.64 % after 2 d, and to 2.0 %–8.2 % after 7 d with the exception of Putnam (FL1) peat (1.10±0.18 % ). After 7 d, and account for ∼4 %–7 % and ∼8 % of PM2.5 mass, respectively, for Siberian, Alaskan, and Everglades (FL2) peats. No specific trend is evident for , mostly <0.002 %, with ∼0.2 % for some fresh Siberian and Alaskan peats. The ratio of gaseous HNO3 to PM2.5 is low, in the range of 0.2 %–0.5 % without much change between fresh and aged profiles. HNO3 created through photochemistry is largely neutralized by the abundant NH3 in the emissions, resulting in the increasing and to PM2.5 in aged profiles.
The reaction of NH3 with HNO3 to form ammonium nitrate (NH4NO3) is the main pathway for inorganic aerosol formation, owing to low sulfur content in the peat fuels (Watson et al., 2019). abundances are low in fresh profiles (0.13 %–1.4 %), but they increase 2–3-fold after 2 d aging except for the Alaskan (0.35 %–0.46 %) and Everglades (FL2) (1.3 %–1.4 %) profiles. More apparent changes are found for 7 d with the largest increase in from 0.13 % to 1.96 % for the Malaysian peats – indicating formation of ammonium sulfate ((NH4)2SO4). The ion balance shows more than needed to completely neutralize and (Chow et al., 1994). Some may be present as ammonium chloride (NH4Cl); however, the abundance of chloride (Cl−) is low (<0.3 %). The large increase in and after 7 d implies that a 2 d aging time is not sufficient to allow the full formation of secondary NH4NO3 and (NH4)2SO4.
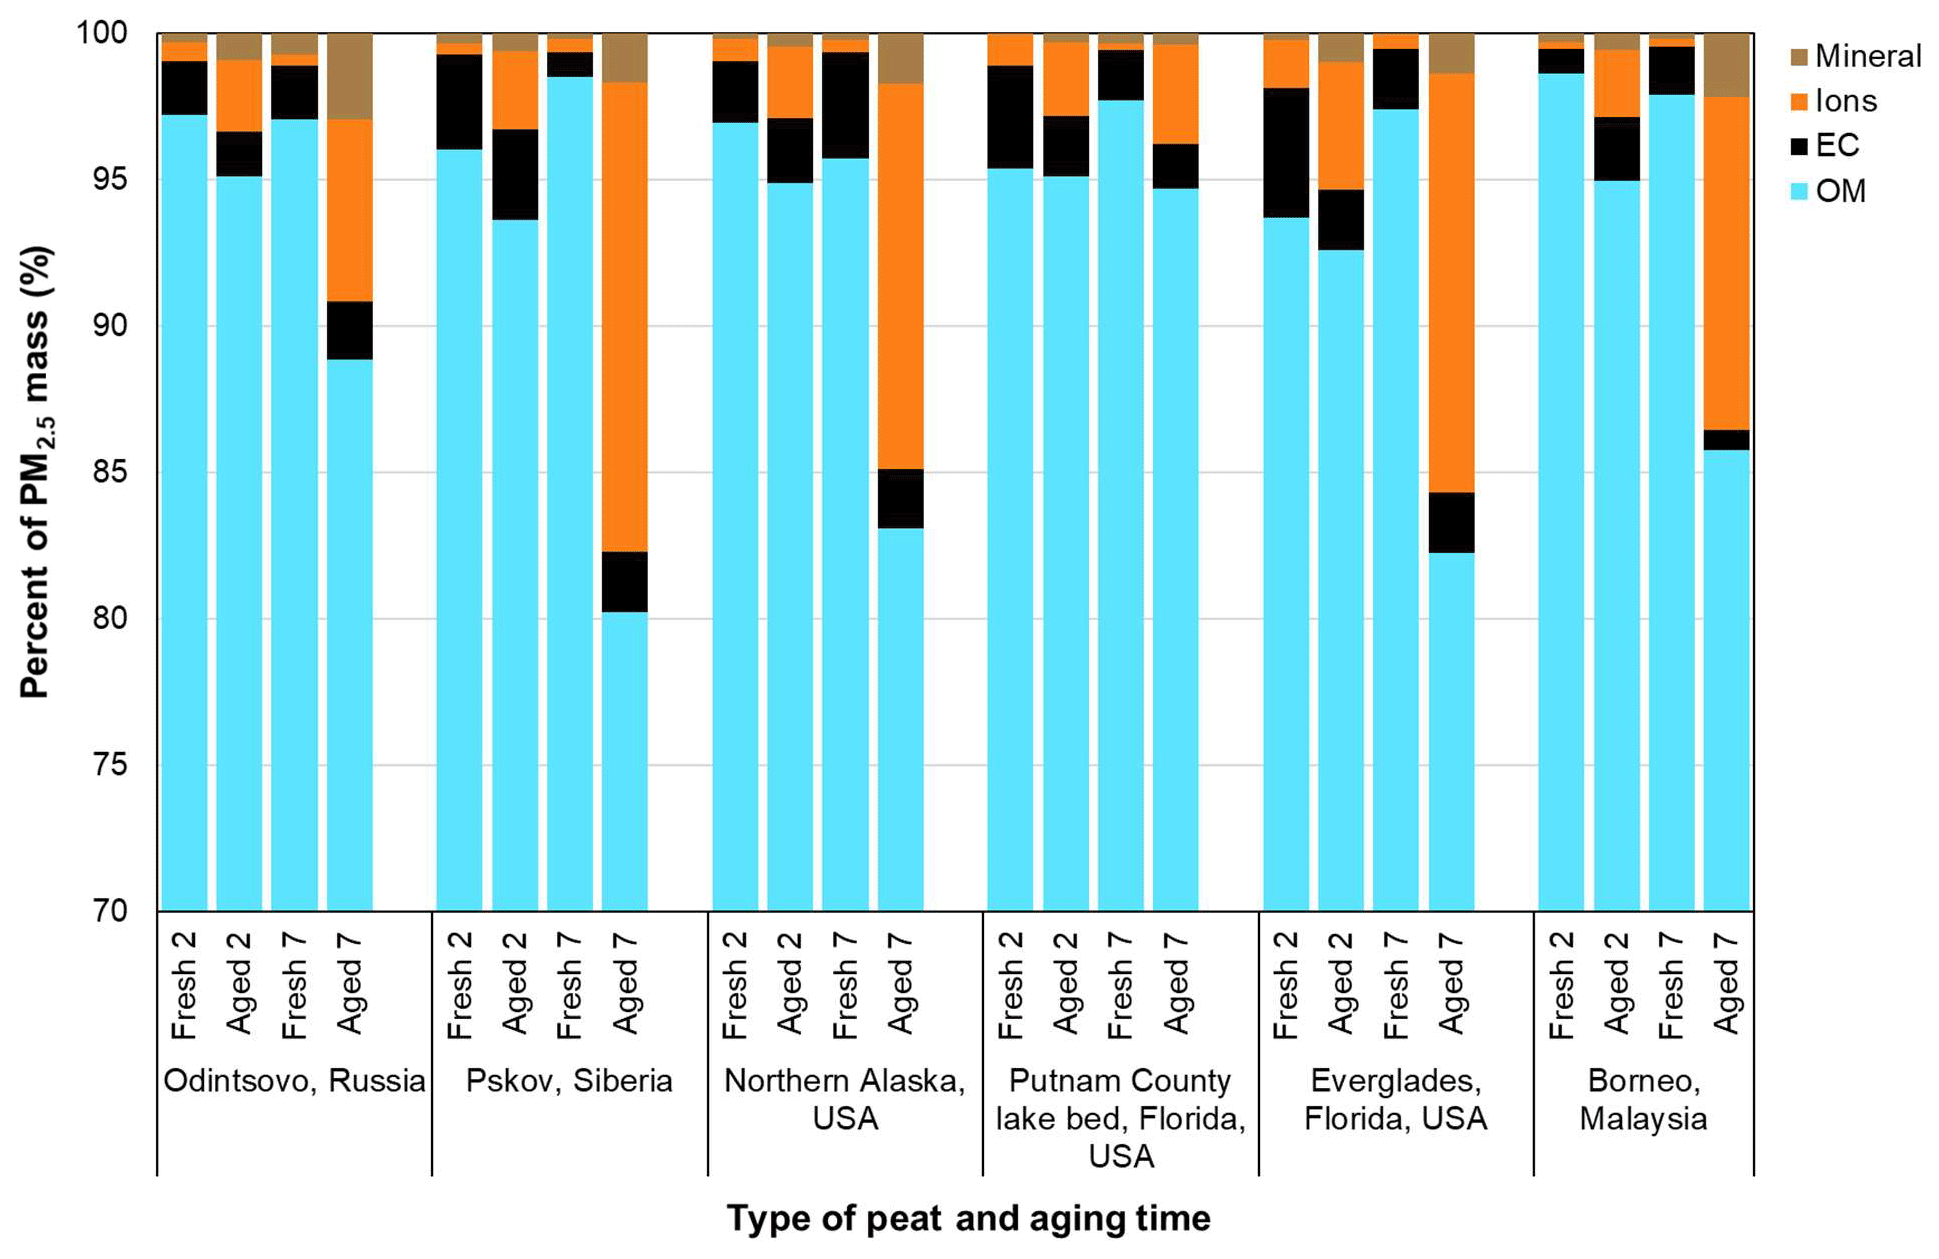
Figure 6Reconstruction of PM2.5 mass with organic mass (OM, see Table 3 for OM ∕ OC ratios), elemental carbon (EC), major ions (i.e., sum of , , and ), and mineral component (= 2.2 Al + 2.49 Si + 1.63 Ca + 1.94 Ti + 2.42 Fe) for six types of peat between fresh and aged profiles.
3.6 Mass reconstruction
Mass reconstruction is applied to understand the changes in major chemical composition between the fresh and aged profiles. As shown in Fig. 6, the largest component of PM2.5 is OM, accounting for 94 %–99 % and 80 %–95 % of PM2.5 mass for fresh and aged profiles, respectively. Although the 7 d aging time increased the OM ∕ OC ratios (by 12 %–19 %), the abundances of OM in PM2.5 are reduced (3 %–18 %). This can be attributed to the combined effects of increased oxygenated organics, SVOC volatilization (Smith et al., 2009), and an increase in ionic species as shown in the average aged ∕ fresh ratios in Fig. 3. Figure 6 shows increases in ionic species (i.e., sum of , , and ), with low abundances (0.3 %–1.7 %) in fresh profiles, increasing 3 %–16 % after aging. The sum of ionic species accounts for 11 %–16 % of PM2.5 mass for the Siberian, Alaskan, Everglades (FL2), and Malaysian peats after 7 d, mainly due to the increase in and as shown in Fig. 5.
Elemental abundances are low (<0.0001 %), mostly below the lower quantifiable limits. Table 1 only lists 34 of the 51 elements (Na to U) detected by XRF. Using the IMPROVE soil formula (assuming metal oxides of major mineral species; Malm et al., 1994) yielded 0.07 %–2.9 % of mineral components. The IMPROVE soil formula has been applied in many other studies (e.g., Chan et al., 1997; Pant et al., 2015; Rogula-Kozlowska et al., 2012), which provides an adequate estimate of geological mineral in reconstructed mass. Since geological minerals are not a major component of PM2.5, variations in the assumption regarding metal oxides or multipliers do not contribute to large variations in reconstructed mass (Chow et al., 2015a).
This study indicates that an aging time of ∼2 d represents the intermediately aged source profile, whereas ∼7 d represents the profile with adequate residence time to complete the atmospheric process.
3.7 Changes in source profiles by fuel moisture content
The effect of fuel moisture content on source profiles is mostly unknown. The 25 % fuel moisture content selected for this study intends to better simulate the conditions of moderate to severe droughts where most peat fires occur. Increasing fuel moisture content from ∼25 % to 60 % for the three Putnam (FL1) peat fuels yielded 12 % higher EFs for CO2 (EF), but 12 %–20 % lower EFs for CO, NO, NO2, and PM2.5 mass (Watson et al., 2019). Tests of fuel moisture content on profile changes are available for only 2 d aging. Equivalence measures (Table S8) show statistical differences (P<0.001) between 25 % and 60 % moisture profiles for either fresh or aged profiles with high correlations (r>0.997), and over 93 % of species abundance falls within ±3σ. While OC abundances in PM2.5 are comparable for the fresh and aged profiles (70 %–72 %) for 25 % fuel moisture, a reduction of 18 % OC in PM2.5 is found for 60 % fuel moisture (from 82 % to 64 %) after aging (Table S2). The higher fuel moisture content also reduced WSOC by 6 % and levoglucosan by 1.3 % with <1 % increases for and organic acids. After aging, the NH3-to-PM2.5 ratios decreased from 28 % to 5 % and from 20 % to 8 % for the 25 % and 60 % fuel moisture, respectively. These results are not conclusive as most measurements are associated with high variabilities.
Fresh and aged peat fire emission profiles from laboratory combustion chamber and potential aerosol mass-oxidation flow reactor (PAM-OFR) for six types of peats representing boreal (Odintsovo, Russia, and Pskov, Siberia), temperate (northern Alaska, USA), subtropical (Putnam County lake bed and Everglades National Park, Florida, USA), and tropical (Borneo, Malaysia) biomes are compared. Analyses are focused on the average of 24 paired profiles grouped by six peats and by fresh vs. aged profiles for 2 and 7 d of simulated atmospheric aging that represent intermediately aged and well-aged source profiles, respectively.
Equivalence measures show that these profiles are highly correlated (r>0.97, mostly >0.99) but statistically different (P<0.05) between different biomes, suggesting that these profiles should be used independently for receptor model source apportionment studies in different climate regions.
The sum of chemical species (i.e., elements, ions, and carbon) explains an average of ∼70 %–90 % of PM2.5 mass for fresh profiles except for Russian peat (62 %–64 %), confirming that major PM2.5 chemical species are measured. Aging times of 2 and 7 d resulted in an average mass depletion of 6 % and 11 %, respectively. These differences are caused by (1) loss of SVOCs with aging, as indicated by lower abundances of OC1 and OC2 (evolved at 140 and 280 ∘C) in the aged profiles and (2) replacement of the lost OC mass with unmeasured oxygen associated with secondary organic aerosol formation in the OFR.
Species abundances in PM2.5 between aged and fresh profiles varied by several orders of magnitude but exhibited two distinguishable clusters, with reactive–ionic species (e.g., , , oxalic acid, and HNO3) constituting 0.1 %–1 % and carbon compounds (e.g., OC, organic carbon fractions (OC1–OC4), and WSOC) constituting >1 % (mostly >10 %) of PM2.5 mass. Most NH3∕PM2.5 ratios are >10 % whereas HNO3∕PM2.5 ratios are <1 % in fresh profiles.
Total carbon (TC, sum of OC and EC) is the largest component, accounting for 59 %–87 % and 43 %–77 % of the PM2.5 mass for the fresh and aged profiles, respectively. With predominantly smoldering combustion, the majority of the TC is OC, with low EC abundances (0.67 %–4.4 %). Further degradation in OC abundances (7 %–22 %) from 2 to 7 d aging implies an incomplete transformation with short aging time. Different thermal carbon fractions are used to characterize combustion and aging conditions. While most of the OC thermally evolved at high temperatures (OC3 at 480 ∘C), losses of low-temperature OC1 and OC2 are found, indicating a shift of gas–particle partitioning of SVOC to gas phase, where particle volatilization outweighed gas-to-particle conversion.
Formation of oxygenated compounds is pronounced after aging, with ratios of organic mass (OM) to OC increasing by 14 %–21 % from 2 to 7 d aging. The WSOC abundance in PM2.5 varies 15 %–17 % and 36 %–37 % for fresh Malaysian and Russian peats, respectively. While levoglucosan accounts for ∼1 %–4 % of PM2.5 mass for fresh subtropical and tropical peats, elevated levels (6 %–39 %) are found for boreal and temperate peats. Increasing the atmospheric aging time from 2 to 7 d results in additional formation of organic acid and ionic species (e.g., oxalic acid, , , and ), but enhances losses of NH3, levoglucosan, and low-temperature OC1 and OC2.
Among the four climate regions, Russian peat with the lowest carbon (44 %) and highest oxygen (39 %) content resulted in ∼59 %–71 % of WSOC in OC along with the highest levoglucosan (20 %–39 % of PM2.5) and lowest NH3∕PM2.5 ratios (3 %–8 %). It also yielded the highest oxygenated compounds after aging with OM ∕ OC ratios of 2.1–2.2. This contrasts with Malaysian peats that are mostly water-insoluble (WSOC ∕ OC of 0.18–0.40) with low oxygenated compounds after aging (OM ∕ OC ratios of 1.2–1.5). Large increases are found for oxalic acid abundances from fresh (<0.02 %–0.43 %) to 7 d aging (1 %–4%).
With the exception of Russian peats, fresh profiles contain high NH3∕PM2.5 ratios (17 %–64 %) with low abundances after aging (3 %–14 % for 2 d and 1 %–7 % for 7 d). Extending the aging time from 2 to 7 d results in an increase to ∼7 %–8 % and abundances. Although the week-long aging time increased the OM ∕ OC ratios, abundances of OM in PM2.5 were reduced by 3 %–18 %.
Source profiles can change with aging during transport from source to receptor. This study shows significant differences between fresh and aged peat combustion profiles among the four biomes that can be used to establish speciated emission inventories for air quality modeling. A sufficient aging time (∼7 d) is needed to allow gas-to-particle partitioning of semi-volatilized species, gas-phase oxidation, and volatilization to achieve representative source profiles for receptor-oriented source apportionment.
All required measured data are presented in the article and the supplement.
The supplement related to this article is available online at: https://doi.org/10.5194/amt-12-5475-2019-supplement.
JCC, JGW, JC, L-WAC, and XW jointly designed the study, performed the data analyses, and prepared the paper. ACW collected the peat fuels and provided technical advice. QW, JT, and SSHH carried out the peat combustion experiments. TBC and SDK assembled the database and performed the similarity and difference tests between the fresh and aged profiles.
The authors declare that they have no conflict of interest.
The authors would like to thank the supporting staff from both the Desert Research Institute, Reno, NV, USA, and Institute of Earth Environment, Chinese Academy of Sciences, Xi'an, China.
This research has been supported by the U.S. National Science Foundation (grant nos. AGS1464501 and CHE-1214163) and the National Science Foundation of China (grant no. 21661132005), .
This paper was edited by Yoshiteru Iinuma and reviewed by two anonymous referees.
Aerodyne: PAM users manual, Aerodyne Research Inc., Billerica, MA, available at: https://pamusersmanual.jimdo.com/ (last access: 24 September 2019), 2019a.
Aerodyne: Potential Aerosol Mass (PAM) oxidation flow reactor, Aerodyne Research Inc., Billerica, MA, available at: http://www.aerodyne.com/sites/default/files/u17/PAM20Potential20Aerosol20Mass20Reactor.pdf, last access: 24 September 2019), 2019b.
Akagi, S. K., Yokelson, R. J., Wiedinmyer, C., Alvarado, M. J., Reid, J. S., Karl, T., Crounse, J. D., and Wennberg, P. O.: Emission factors for open and domestic biomass burning for use in atmospheric models, Atmos. Chem. Phys., 11, 4039–4072, https://doi.org/10.5194/acp-11-4039-2011, 2011.
Altshuller, A. P.: Ambient air hydroxyl radical concentrations: Measurements and model predictions, J. Air Pollut. Control Assoc., 39, 704–708, 1989.
Bates, A. L., Hatcher, P. G., Lerch, H. E., Cecil, C. B., Neuzil, S. G., and Supardi: Studies of a petrified angiosperm log cross-section from Indonesia by nuclear-magnetic resonance spectroscopy and analytical pyrolysis, Org. Geochem., 17, 37–45, 1991.
Bertrand, A., Stefenelli, G., Jen, C. N., Pieber, S. M., Bruns, E. A., Ni, H., Temime-Roussel, B., Slowik, J. G., Goldstein, A. H., El Haddad, I., Baltensperger, U., Prévôt, A. S. H., Wortham, H., and Marchand, N.: Evolution of the chemical fingerprint of biomass burning organic aerosol during aging, Atmos. Chem. Phys., 18, 7607–7624, https://doi.org/10.5194/acp-18-7607-2018, 2018a.
Bertrand, A., Stefenelli, G., Pieber, S. M., Bruns, E. A., Temime-Roussel, B., Slowik, J. G., Wortham, H., Prévôt, A. S. H., El Haddad, I., and Marchand, N.: Influence of the vapor wall loss on the degradation rate constants in chamber experiments of levoglucosan and other biomass burning markers, Atmos. Chem. Phys., 18, 10915–10930, https://doi.org/10.5194/acp-18-10915-2018, 2018b.
Bevington, P. R.: Data Reduction and Error Analysis for the Physical Sciences, McGraw Hill, New York, NY, 336 pp., 1969.
Bhattarai, C., Samburova, V., Sengupta, D., Iaukea-Lum, M., Watts, A. C., Moosmuller, H., and Khlystov, A. Y.: Physical and chemical characterization of aerosol in fresh and aged emissions from open combustion of biomass fuels, Aerosol Sci. Technol., 52, 1266–1282, 2018.
Budisulistiorini, S. H., Riva, M., Williams, M., Miyakawa, T., Chen, J., Itoh, M., Surratt, J. D., and Kuwata, M.: Dominant contribution of oxygenated organic aerosol to haze particles from real-time observation in Singapore during an Indonesian wildfire event in 2015, Atmos. Chem. Phys., 18, 16481–16498, https://doi.org/10.5194/acp-18-16481-2018, 2018.
Cao, J. J.: A brief introduction and progress summary of the PM2.5 source profile compilation project in China, Aerosol Sci. Eng., 2, 43–50, 2018.
CARB: Speciation profiles used in ARB modeling, California Air Resources Board, Sacramento, CA, available at: http://arb.ca.gov/ei/speciate/speciate.htm, last access: 24 September 2019.
Chakrabarty, R. K., Moosmüller, H., Garro, M. A., Arnott, W. P., Walker, J., Susott, R. A., Babbitt, R. E., Wold, C. E., Lincoln, E. N., and Hao, W. M.: Emissions from the laboratory combustion of wildland fuels: Particle morphology and size, J. Geophys. Res.-Atmos., 111, 1–16, https://doi.org/10.1029/2005JD006659, 2006.
Chan, Y. C., Simpson, R. W., McTainsh, G. H., Vowles, P. D., Cohen, D. D., and Bailey, G. M.: Characterisation of chemical species in PM2.5 PM10 aerosols in Brisbane, Australia, Atmos. Environ., 31, 3773–3785, 1997.
Chen, L.-W. A., Moosmüller, H., Arnott, W. P., Chow, J. C., Watson, J. G., Susott, R. A., Babbitt, R. E., Wold, C. E., Lincoln, E. N., and Hao, W. M.: Emissions from laboratory combustion of wildland fuels: Emission factors and source profiles, Environ. Sci. Technol., 41, 4317–4325, 2007.
Chen, L.-W. A., Chow, J. C., Wang, X. L., Robles, J. A., Sumlin, B. J., Lowenthal, D. H., Zimmermann, R., and Watson, J. G.: Multi-wavelength optical measurement to enhance thermal/optical analysis for carbonaceous aerosol, Atmos. Meas. Tech., 8, 451–461, https://doi.org/10.5194/amt-8-451-2015, 2015.
Chim, M. M., Lim, C. Y., Kroll, J. H., and Chan, M. N.: Evolution in the reactivity of citric acid toward heterogeneous oxidation by gas-phase OH radicals, ACS Earth and Space Chemistry, 2, 1323–1329, 2018.
Chow, J. C. and Watson, J. G.: Chemical analyses of particle filter deposits, in: Aerosols Handbook: Measurement, Dosimetry, and Health Effects, edited by: Ruzer, L. and Harley, N. H., CRC Press/Taylor & Francis, New York, NY, 2013.
Chow, J. C. and Watson, J. G.: Enhanced ion chromatographic speciation of water-soluble PM2.5 to improve aerosol source apportionment, Aerosol Sci. Eng., 1, 7–24, 2017.
Chow, J. C., Fujita, E. M., Watson, J. G., Lu, Z., Lawson, D. R., and Ashbaugh, L. L.: Evaluation of filter-based aerosol measurements during the 1987 Southern California Air Quality Study, Environ. Mon. Assess, 30, 49–80, 1994.
Chow, J. C., Watson, J. G., Lu, Z., Lowenthal, D. H., Frazier, C. A., Solomon, P. A., Thuillier, R. H., and Magliano, K. L.: Descriptive analysis of PM2.5 and PM10 at regionally representative locations during SJVAQS/AUSPEX, Atmos. Environ., 30, 2079–2112, 1996.
Chow, J. C., Watson, J. G., Crow, D., Lowenthal, D. H., and Merrifield, T. M.: Comparison of IMPROVE and NIOSH carbon measurements, Aerosol Sci. Technol., 34, 23–34, 2001.
Chow, J. C., Engelbrecht, J. P., Watson, J. G., Wilson, W. E., Frank, N. H., and Zhu, T.: Designing monitoring networks to represent outdoor human exposure, Chemosphere, 49, 961–978, 2002.
Chow, J. C., Watson, J. G., Chen, L.-W. A., Arnott, W. P., Moosmüller, H., and Fung, K. K.: Equivalence of elemental carbon by Thermal/Optical Reflectance and Transmittance with different temperature protocols, Environ. Sci. Technol., 38, 4414–4422, 2004.
Chow, J. C., Watson, J. G., Chen, L.-W. A., Chang, M.-C. O., Robinson, N. F., Trimble, D. L., and Kohl, S. D.: The IMPROVE_A temperature protocol for thermal/optical carbon analysis: Maintaining consistency with a long-term database, J. Air Waste Manage. Assoc., 57, 1014–1023, 2007.
Chow, J. C., Lowenthal, D. H., Chen, L.-W. A., Wang, X. L., and Watson, J. G.: Mass reconstruction methods for PM2.5: A review, Air Qual. Atmos. Health, 8, 243–263, 2015a.
Chow, J. C., Wang, X. L., Sumlin, B. J., Gronstal, S. B., Chen, L.-W. A., Trimble, D. L., Kohl, S. D., Mayorga, S. R., Riggio, G. M., Hurbain, P. R., Johnson, M., Zimmermann, R., and Watson, J. G.: Optical calibration and equivalence of a multiwavelength thermal/optical carbon analyzer, Aerosol Air Qual. Res., 15, 1145–1159, 2015b.
Chow, J. C., Riggio, G. M., Wang, X. L., Chen, L.-W. A., and Watson, J. G.: Measuring the organic carbon to organic matter multiplier with thermal/optical carbon mass spectrometer analyses, Aerosol Sci. Eng., 2, 165–172, 2018.
Dall'Osto, M., Ovadnevaite, J., Ceburnis, D., Martin, D., Healy, R. M., O'Connor, I. P., Kourtchev, I., Sodeau, J. R., Wenger, J. C., and O'Dowd, C.: Characterization of urban aerosol in Cork city (Ireland) using aerosol mass spectrometry, Atmos. Chem. Phys., 13, 4997–5015, https://doi.org/10.5194/acp-13-4997-2013, 2013.
Falkovich, A. H., Graber, E. R., Schkolnik, G., Rudich, Y., Maenhaut, W., and Artaxo, P.: Low molecular weight organic acids in aerosol particles from Rondônia, Brazil, during the biomass-burning, transition and wet periods, Atmos. Chem. Phys., 5, 781–797, https://doi.org/10.5194/acp-5-781-2005, 2005
Frank, N. H.: Retained nitrate, hydrated sulfates, and carbonaceous mass in Federal Reference Method fine particulate matter for six eastern cities, J. Air Waste Manage. Assoc., 56, 500–511, 2006.
Fujii, Y., Tohno, S., Amil, N., and Latif, M. T.: Quantitative assessment of source contributions to PM2.5 on the west coast of Peninsular Malaysia to determine the burden of Indonesian peatland fire, Atmos. Environ., 171, 111–117, 2017.
Hennigan, C. J., Sullivan, A. P., Collett Jr., J. L., and Ronbinson, A. L.: Levoglucosan stability in biomass burning particles exposed to hydroxyl radicals, Geophys. Res. Lett., 37, 1–4, 2010.
Hidy, G. M. and Friedlander, S. K.: The nature of the Los Angeles aerosol, in: Proceedings, Second International Clean Air Congress, edited by: Englund, H. M. and Beery, W. T., Academic Press, New York, 1971.
Hu, Y. Q., Fernandez-Anez, N., Smith, T. E. L., and Rein, G.: Review of emissions from smouldering peat fires and their contribution to regional haze episodes, Int. J. Wildland Fire, 27, 293–312, 2018.
Iinuma, Y., Bruggemann, E., Gnauk, T., Muller, K., Andreae, M. O., Helas, G., Parmar, R., and Herrmann, H.: Source characterization of biomass burning particles: The combustion of selected European conifers, African hardwood, savanna grass, and German and Indonesian peat, J. Geophys. Res.-Atmos., 112, 1–26, doi:10.1029/2006JD007120, 2007.
Jayarathne, T., Stockwell, C. E., Gilbert, A. A., Daugherty, K., Cochrane, M. A., Ryan, K. C., Putra, E. I., Saharjo, B. H., Nurhayati, A. D., Albar, I., Yokelson, R. J., and Stone, E. A.: Chemical characterization of fine particulate matter emitted by peat fires in Central Kalimantan, Indonesia, during the 2015 El Niño, Atmos. Chem. Phys., 18, 2585–2600, https://doi.org/10.5194/acp-18-2585-2018, 2018.
Jimenez, J. L.: Oxidation flow reactors (including PAM): Principles and best practices for applications in aerosol research, 2018 International Aerosol Conference Tutorial, St. Louis, MO, 2018.
Johnson, M. M.: Evaluation of a multiwavelength characterization of brown and black carbon from filter samples, M.S. Thesis, University of Nevada, Reno, Reno, NV, 2015.
Kang, E., Root, M. J., Toohey, D. W., and Brune, W. H.: Introducing the concept of Potential Aerosol Mass (PAM), Atmos. Chem. Phys., 7, 5727–5744, https://doi.org/10.5194/acp-7-5727-2007, 2007.
Kessler, S. H., Smith, J. D., Che, D. L., Worsnop, D. R., Wilson, K. R., and Kroll, J. H.: Chemical sinks of organic aerosol: Kinetics and products of the heterogeneous oxidation of erythritol and levoglucosan, Environ. Sci. Technol., 44, 7005–7010, 2010.
Kourtchev, I., Hellebust, S., Bell, J. M., O'Connor, I. P., Healy, R. M., Allanic, A., Healy, D., Wenger, J. C., and Sodeau, J. R.: The use of polar organic compounds to estimate the contribution of domestic solid fuel combustion and biogenic sources to ambient levels of organic carbon and PM2.5 in Cork Harbour, Ireland, Sci. Total Environ, 409, 2143–2155, 2011.
Kuo, L. J., Herbert, B. E., and Louchouarn, P.: Can levoglucosan be used to characterize and quantify char/charcoal black carbon in environmental media, Org. Geochem., 39, 1466–1478, 2008.
Lai, C. Y., Liu, Y. C., Ma, J. Z., Ma, Q. X., and He, H.: Degradation kinetics of levoglucosan initiated by hydroxyl radical under different environmental conditions, Atmos. Environ., 91, 32–39, 2014.
Lambe, A. T., Ahern, A. T., Williams, L. R., Slowik, J. G., Wong, J. P. S., Abbatt, J. P. D., Brune, W. H., Ng, N. L., Wright, J. P., Croasdale, D. R., Worsnop, D. R., Davidovits, P., and Onasch, T. B.: Characterization of aerosol photooxidation flow reactors: heterogeneous oxidation, secondary organic aerosol formation and cloud condensation nuclei activity measurements, Atmos. Meas. Tech., 4, 445–461, https://doi.org/10.5194/amt-4-445-2011, 2011.
Li, R., Palm, B. B., Ortega, A. M., Hlywiak, J., Hu, W. W., Peng, Z., Day, D. A., Knote, C., Brune, W. H., de Gouw, J. A., and Jimenez, J. L.: Modeling the radical chemistry in an oxidation flow reactor: Radical formation and recycling, sensitivities, and the OH exposure estimation equation, J. Phys. Chem. A, 119, 4418–4432, 2015.
Lin, C. S., Ceburnis, D., Huang, R. J., Canonaco, F., Prevot, A. S. H., O'Dowd, C., and Ovadnevaite, J.: Summertime aerosol over the west of Ireland dominated by secondary aerosol during long-range transport, Atmosphere, 10, 59, https://doi.org/10.3390/atmos10020059, 2019.
Liu, Y. Y., Zhang, W. J., Bai, Z. P., Yang, W., Zhao, X. Y., Han, B., and Wang, X. H.: China Source Profile Shared Service (CSPSS): The Chinese PM2.5 database for source profiles, Aerosol Air Qual. Res., 17, 1501–1514, 2017.
Louchouarn, P., Kuo, L. J., Wade, T. L., and Schantz, M.: Determination of levoglucosan and its isomers in size fractions of aerosol standard reference materials, Atmos. Environ., 43, 5630–5636, 2009.
Malm, W. C., Trijonis, J. C., Sisler, J. F., Pitchford, M. L., and Dennis, R. L.: Assessing the effect of SO2 emission changes on visibility, Atmos. Environ., 28, 1023–1034, 1994.
Mao, J., Ren, X., Brune, W. H., Olson, J. R., Crawford, J. H., Fried, A., Huey, L. G., Cohen, R. C., Heikes, B., Singh, H. B., Blake, D. R., Sachse, G. W., Diskin, G. S., Hall, S. R., and Shetter, R. E.: Airborne measurement of OH reactivity during INTEX-B, Atmos. Chem. Phys., 9, 163–173, https://doi.org/10.5194/acp-9-163-2009, 2009.
May, A. A., Saleh, R., Hennigan, C. J., Donahue, N. M., and Robinson, A. L.: Volatility of organic molecular markers used for source apportionment analysis: Measurements and implications for atmospheric lifetime, Environ. Sci. Technol., 46, 12435–12444, 2012.
Mo, Z. W., Shao, M., and Lu, S. H.: Compilation of a source profile database for hydrocarbon and OVOC emissions in China, Atmos. Environ., 143, 209–217, 2016.
Nara, H., Tanimoto, H., Tohjima, Y., Mukai, H., Nojiri, Y., and Machida, T.: Emission factors of CO2, CO and CH4 from Sumatran peatland fires in 2013 based on shipboard measurements, Tellus B, 69, https://doi.org/10.1080/16000889.2017.1399047, 2017.
PAMWiki: PAMWiki, available at: https://sites.google.com/site/pamwiki/, last access: 24 September 2019.
Pant, P., Shukla, A., Kohl, S. D., Chow, J. C., Watson, J. G., and Harrison, R. M.: Characterization of ambient PM2.5 at a pollution hotspot in New Delhi, India and inference of sources, Atmos. Environ., 109, 178–189, 2015.
Peng, Z. and Jimenez, J. L.: Modeling of the chemistry in oxidation flow reactors with high initial NO, Atmos. Chem. Phys., 17, 11991–12010, https://doi.org/10.5194/acp-17-11991-2017, 2017.
Peng, Z., Day, D. A., Stark, H., Li, R., Lee-Taylor, J., Palm, B. B., Brune, W. H., and Jimenez, J. L.: HOx radical chemistry in oxidation flow reactors with low-pressure mercury lamps systematically examined by modeling, Atmos. Meas. Tech., 8, 4863–4890, https://doi.org/10.5194/amt-8-4863-2015, 2015.
Peng, Z., Day, D. A., Ortega, A. M., Palm, B. B., Hu, W., Stark, H., Li, R., Tsigaridis, K., Brune, W. H., and Jimenez, J. L.: Non-OH chemistry in oxidation flow reactors for the study of atmospheric chemistry systematically examined by modeling, Atmos. Chem. Phys., 16, 4283–4305, https://doi.org/10.5194/acp-16-4283-2016, 2016.
Peng, Z., Palm, B. B., Day, D. A., Talukdar, R. K., Hu, W. W., Lambe, A. T., Brune, W. H., and Jimenez, J. L.: Model evaluation of new techniques for maintaining high-NO conditions in oxidation flow reactors for the study of OH-initiated atmospheric chemistry, Acs Earth and Space Chemistry, 2, 72–86, 2018.
Pernigotti, D., Belis, C. A., and Spanò, L.: SPECIEUROPE: The European data base for PM source profiles, Atmos. Pollut. Res., 7, 307–314, 2016.
Pratap, V., Bian, Q. J., Kiran, S. A., Hopke, P. K., Pierce, J. R., and Nakao, S.: Investigation of levoglucosan decay in wood smoke smog-chamber experiments: The importance of aerosol loading, temperature, and vapor wall losses in interpreting results, Atmos. Environ., 199, 224–232, 2019.
Reid, J. S., Eck, T. F., Christopher, S. A., Koppmann, R., Dubovik, O., Eleuterio, D. P., Holben, B. N., Reid, E. A., and Zhang, J.: A review of biomass burning emissions part III: intensive optical properties of biomass burning particles, Atmos. Chem. Phys., 5, 827–849, https://doi.org/10.5194/acp-5-827-2005, 2005.
Riggio, G. M., Chow, J. C., Cropper, P. M., Wang, X. L., Yatavelli, R. L. N., Yang, X. F., and Watson, J. G.: Feasibility of coupling a thermal/optical carbon analyzer to a quadrupole mass spectrometer for enhanced PM2.5 speciation, J. Air Waste Manage. Assoc., 68, 463–476, 2018.
Rogula-Kozlowska, W., Klejnowski, K., Rogula-Kopiec, P., Mathews, B., and Szopa, S.: A study on the seasonal mass closure of ambient fine and coarse dusts in Zabrze, Poland, B. Environ. Contam. Tox., 88, 722–729, 2012.
See, S. W., Balasubramanian, R., Rianawati, E., Karthikeyan, S., and Streets, D. G.: Characterization and source apportionment of particulate matter µm in Sumatra, Indonesia, during a recent peat fire episode, Environ. Sci. Technol., 41, 3488–3494, 2007.
Smith, J. D., Kroll, J. H., Cappa, C. D., Che, D. L., Liu, C. L., Ahmed, M., Leone, S. R., Worsnop, D. R., and Wilson, K. R.: The heterogeneous reaction of hydroxyl radicals with sub-micron squalane particles: a model system for understanding the oxidative aging of ambient aerosols, Atmos. Chem. Phys., 9, 3209–3222, https://doi.org/10.5194/acp-9-3209-2009, 2009.
Stockwell, C. E., Yokelson, R. J., Kreidenweis, S. M., Robinson, A. L., DeMott, P. J., Sullivan, R. C., Reardon, J., Ryan, K. C., Griffith, D. W. T., and Stevens, L.: Trace gas emissions from combustion of peat, crop residue, domestic biofuels, grasses, and other fuels: configuration and Fourier transform infrared (FTIR) component of the fourth Fire Lab at Missoula Experiment (FLAME-4), Atmos. Chem. Phys., 14, 9727–9754, https://doi.org/10.5194/acp-14-9727-2014, 2014.
Stockwell, C. E., Jayarathne, T., Cochrane, M. A., Ryan, K. C., Putra, E. I., Saharjo, B. H., Nurhayati, A. D., Albar, I., Blake, D. R., Simpson, I. J., Stone, E. A., and Yokelson, R. J.: Field measurements of trace gases and aerosols emitted by peat fires in Central Kalimantan, Indonesia, during the 2015 El Niño, Atmos. Chem. Phys., 16, 11711–11732, https://doi.org/10.5194/acp-16-11711-2016, 2016.
Stone, D., Whalley, L. K., and Heard, D. E.: Tropospheric OH and HO2 radicals: field measurements and model comparisons, Chem. Soc. Rev., 41, 6348–6404, 2012.
Tham, J., Sarkar, S., Jia, S. G., Reid, J. S., Mishra, S., Sudiana, I. M., Swarup, S., Ong, C. N., and Yu, L. Y. E.: Impacts of peat-forest smoke on urban PM2.5 in the Maritime Continent during 2012–2015: Carbonaceous profiles and indicators, Environ. Pollut., 248, 496–505, 2019.
Tian, J., Chow, J. C., Cao, J. J., Han, Y. M., Ni, H. Y., Chen, L.-W. A., Wang, X. L., Huang, R. J., Moosmüller, H., and Watson, J. G.: A biomass combustion chamber: Design, evaluation, and a case study of wheat straw combustion emission tests, Aerosol Air Qual. Res., 15, 2104–2114, 2015.
U.S.EPA: Guidance on the use of models and other analyses for demonstrating attainment of air quality goals for ozone, PM2.5, and regional haze, U.S. Environmental Protection Agency, Research Triangle Park, NC, available at: http://www.epa.gov/ttn/scram/guidance/guide/final-03-pm-rh-guidance.pdf (last access: 24 September 2019), 2007.
U.S.EPA: SPECIATE Version 5.0, U.S. Environmental Protection Agency, Research Triangle Park, NC, available at: https://www.epa.gov/air-emissions-modeling/speciate-version-45-through-40, last access: 24 September 2019.
Veres, P., Roberts, J. M., Burling, I. R., Warneke, C., de Gouw, J., and Yokelson, R. J.: Measurements of gas-phase inorganic and organic acids from biomass fires by negative-ion proton-transfer chemical-ionization mass spectrometry, J. Geophys. Res. Atmos., 115, https://doi.org/10.1029/2010JD014033, 2010.
Watson, J. G.: Protocol for applying and validating the CMB model for PM2.5 and VOC, U.S. Environmental Protection Agency, Research Triangle Park, NC, available at: https://www.epa.gov/scram001/models/receptor/CMB_Protocol.pdf (last access: 24 September 2009), 2004.
Watson, J. G., Chow, J. C., and Frazier, C. A.: X-ray fluorescence analysis of ambient air samples, in: Elemental Analysis of Airborne Particles, Vol. 1, edited by: Landsberger, S. and Creatchman, M., Advances in Environmental, Industrial and Process Control Technologies, Gordon and Breach Science, Amsterdam, The Netherlands, 67–96, 1999.
Watson, J. G., Turpin, B. J., and Chow, J. C.: The measurement process: Precision, accuracy, and validity, in: Air Sampling Instruments for Evaluation of Atmospheric Contaminants, Ninth Edition, edited by: Cohen, B. S. and McCammon Jr, C. S., American Conference of Governmental Industrial Hygienists, Cincinnati, OH, 2001.
Watson, J. G., Chow, J. C., Wang, X. L., Kohl, S. D., Chen, L.-W. A., and Etyemezian, V. R.: Overview of real-world emission characterization methods, in: Alberta Oil Sands: Energy, Industry, and the Environment, edited by: Percy, K. E., Developments in Environmental Science, Elsevier Press, Amsterdam, The Netherlands, 2012.
Watson, J. G., Chow, J. C., Engling, G., Chen, L.-W. A., and Wang, X. L.: Source apportionment: Principles and methods, in: Airborne Particulate Matter: Sources, Atmospheric Processes and Health, edited by: Harrison, R. M., Royal Society of Chemistry, London, UK, 72–125, 2016.
Watson, J. G., Tropp, R. J., Kohl, S. D., Wang, X. L., and Chow, J. C.: Filter processing and gravimetric analysis for suspended particulate matter samples, Aerosol Sci. Eng., 1, 193–205, 2017.
Watson, J. G., Cao, J., Chen, L. W. A., Wang, Q., Tian, J., Wang, X., Gronstal, S., Ho, S. S. H., Watts, A. C., and Chow, J. C.: Gaseous, PM2.5 Mass, and Speciated Emission Factors from Laboratory Chamber Peat Combustion, Atmos. Chem. Phys., https://doi.org/10.5194/acp-2019-456, accepted, 2019.
Wiggins, E. B., Czimczik, C. I., Santos, G. M., Chen, Y., Xu, X. M., Holden, S. R., Randerson, J. T., Harvey, C. F., Kai, F. M., and Yu, L. E.: Smoke radiocarbon measurements from Indonesian fires provide evidence for burning of millennia-aged peat, P. Natl. Acad. Sci. USA, 115, 12419–12424, 2018.