the Creative Commons Attribution 4.0 License.
the Creative Commons Attribution 4.0 License.
 | 21 Nov 2019
Retrieval of cloud properties from spectral zenith radiances observed by sky radiometers
Pradeep Khatri
Hironobu Iwabuchi
Tadahiro Hayasaka
Hitoshi Irie
Tamio Takamura
Akihiro Yamazaki
Alessandro Damiani
Husi Letu
An optimal estimation algorithm to retrieve the cloud optical depth (COD) and cloud particle effective radius (CER) from spectral zenith radiances observed by narrow field-of-view (FOV) ground-based sky radiometers was developed. To further address the filter degradation problem while analyzing long-term observation data, an on-site calibration procedure is proposed, which has good accuracy compared with the standard calibration transfer method. An error evaluation study conducted by assuming errors in observed transmittances and ancillary data for water vapor concentration and surface albedo suggests that the errors in input data affect retrieved CER more than COD. Except for some narrow domains that fall within a COD of < 15, the retrieval errors are small for both COD and CER. The retrieved cloud properties reproduce the broadband radiances observed by a narrow FOV radiometer more precisely than broadband irradiances observed by a wide-FOV pyranometer, justifying the quality of the retrieved product (at least of COD) and indicating the important effect of the instrument FOV in cloud remote sensing. Furthermore, CODs (CERs) from sky radiometer and satellite observations show good (poor) agreement.
- Article
(2570 KB) - Full-text XML
- BibTeX
- EndNote


Clouds play an important role in driving the climate system and hydrological cycle (Rosenfeld et al., 2014). The accurate representation of clouds in the global climate model remains one of the largest uncertainties (Forster et al., 2007). Clouds are observed from space with various sensors onboard satellites, and the observations are vital in understanding more about cloud characteristics and their roles in the climate system and hydrological cycle. The quality assurance of cloud properties from satellite observations is an important task in cloud remote sensing, although it is challenging, primarily due to the lack of standard data representing different atmospheric conditions. Compared with the routine observation of aerosols through surface networks, such as AERONET (Aerosol Robotic Network; https://aeronet.gsfc.nasa.gov/, last access: 15 November 2019) and SKYNET (http://atmos3.cr.chiba-u.jp/skynet/, last access: 15 November 2019), the observation of clouds from the surface is performed at a limited number of stations, and most of the observation data are not easily accessible. As the recent instruments belonging to AERONET and SKYNET can be used for cloud remote sensing along with aerosol remote sensing, it is important to develop innovative techniques to retrieve cloud properties by using data observed by those instruments. This can help the satellite remote-sensing community to validate cloud products and help the whole cloud research community to study clouds in more detail by using high-resolution surface data.
Clouds have been studied from the surface by using zenith radiances observed by radiometers belonging to AERONET (e.g., Chiu et al., 2010, 2012) and SKYNET (e.g., Kikuchi et al., 2006). In accordance with the literature, the AERONET and SKYNET radiometers are referred to as sun photometers and sky radiometers, respectively. Similar to space-based cloud remote sensing using reflected signals (e.g., Nakajima and King, 1990), studies using sun photometer and sky radiometer data use a lookup table (LUT). The fundamental idea is to compare the observed signals with LUT data corresponding to priorly known cloud optical depths (CODs) and cloud particle effective radii (CERs) while finding a plausible solution for the COD and CER combination. This signal can be the zenith radiance or transmittance. Chiu et al. (2010) retrieved COD from a LUT of zenith radiances of non-water-absorbing wavelengths constructed by assuming a fixed CER, and Chiu et al. (2012) and Kikuchi et al. (2006) used a LUT of transmittances of non-water-absorbing and water-absorbing wavelengths to infer COD and CER simultaneously. The reflected signals for non-water-absorbing and water-absorbing wavelengths can have nearly one-to-one relationships with COD and CER, respectively. On the other hand, transmitted signals do not behave in this manner, making the retrieval process difficult for a LUT approach using transmitted signals. In addition, unlike reflected signals, transmitted signals are weakly sensitive to changes in CER. This makes retrieval using transmitted signals more complex. Furthermore, the shape of the LUT can change depending on the solar position, making the retrieval process even more cumbersome if LUTs developed for a limited number of specific solar positions are used. To overcome these difficulties, some innovative techniques have been proposed. For example, McBride et al. (2011) developed a spectral method by using the slope of the transmittances of 13 wavelengths between 1565 and 1634 nm and the transmittance at the visible wavelength of 515 nm to retrieve COD and CER simultaneously. LeBlanc et al. (2015) derived 15 parameters to quantify the spectral variations in shortwave transmittances due to the absorption and scattering of liquid water and ice clouds, manifested by shifts in spectral slopes, curvatures, maxima, and minima, to discriminate the cloud phase and retrieve COD and CER. However, these techniques were developed for radiometers with a high spectral resolution and are less suitable for sun photometers and sky radiometers because they have a limited number of channels.
Here, we develop a retrieval algorithm based on an optimal estimation method, namely, a maximum a posteriori method (Rodgers, 2000). We use three carefully selected wavelengths to retrieve COD and CER simultaneously. An on-site calibration method is proposed to address the filter degradation problem while analyzing long-term observation data. Although the algorithm is developed using sky radiometer data, it is equally applicable for sun photometer data. The paper begins with a brief description of the sky radiometer in Sect. 2. The methodology, retrieval error, and quality assessment of retrieved products are discussed in Sects. 3–5, respectively. Finally, the conclusion is presented in Sect. 6.
The sky radiometer (POM-02, PREDE Co. Ltd., Japan) can make observations of direct intensity, angular sky radiance (both almucantar and principle plane scans), and zenith sky radiance at 11 wavelengths at specified time intervals. The field of view (FOV) is 1∘. The most commonly used wavelengths by SKYNET are 0.315, 0.34, 0.38, 0.4, 0.5, 0.675, 0.87, 0.94, 1.02, 1.627, and 2.2 µm. The direct and angular sky radiances at the wavelengths of 0.34, 0.38, 0.4, 0.5, 0.675, 0.87, and 1.02 µm, at which the absorptions by atmospheric gases and water and/or ice are negligible, are used for aerosol remote sensing (Nakajima et al., 1996; Hashimoto et al., 2012). The direct intensities observed at the wavelengths of 0.315 and 0.94 µm are used for the remote sensing of ozone (Khatri et al., 2014) and water vapor (e.g., Campanelli et al., 2014), respectively. The zenith sky radiances have different potential applications. The zenith sky radiances of cloudy skies have been used for cloud remote sensing (e.g., Kikuchi et al., 2006). The calibration constant terms for sky radiance (angular and zenith) and direct intensity are required while deriving physical data from observation signals via retrieval algorithms. One of the largest benefits of the PREDE sky radiometer is that these calibration constants can be obtained from field observation data, as outlined by Nakajima et al. (1996). In brief, an improved Langley (IL) method (Nakajima et al., 1996; Campanelli et al., 2004), which is an alternative to the normal Langley (NL) method, can be used to obtain calibration constants for direct intensities. Similarly, the solar disk scan method, which is an alternative to integrating the sphere method, can be used to determine the calibration constant for sky radiances. A more detailed study about sky radiometers and their calibrations can be found in Khatri et al. (2016).

A schematic of the study method is shown in Fig. 1. We use sky radiances (E) observed at three longer wavelengths (0.87, 1.02, and 1.627 µm), excluding 2.2 µm, which is not used for two main reasons. First, our statistical analysis suggests that the number of unphysical data (observation data recorded as 0) for 2.2 µm is high; thus, 2.2 µm is excluded to increase the retrieval number. Second, the longest wavelength used by AERONET is 1.64 µm; so the proposed algorithm could be easily used for sun-photometer-observed data as well. Wavelengths shorter than 0.87 µm are not used to avoid the effect of aerosols as far as possible. Observed E can be converted to the transmittance (T) by
where μ0 is the cosine of the solar zenith angle, ΔΩ is the calibration constant for sky radiance, which is also called the solid view angle by the SKYNET community, F0 is the calibration constant for direct intensity, and λ is the wavelength. ΔΩ for 0.87, 1.02, and 1.627 µm can be determined from the solar disk scan during very-clear-sky days (Nakajima et al., 1996). Although the current IL method can be used to determine temporal F0 for the first two wavelengths (0.87 and 1.02 µm), it is less suitable for water-absorbing wavelengths, such as 1.627 µm. For 1.627 µm, F0 derived from the NL method can be used, but the NL is less practical to implement routinely in short time intervals (e.g., each month) to derive temporal F0. We prefer to use temporal F0 for all wavelengths to include filter degradation with time (e.g., Khatri et al., 2014). To derive temporal F0 at 1.627 µm, we use an alternative IL method, as proposed by Khatri et al. (2014). In brief, aerosol data (refractive index and volume size distribution) and the direct intensity observed at 1.627 µm (F1.627) are used. The aerosol optical thickness (τaer) depends primarily on the aerosol size distribution, and the refractive index makes a small contribution to τaer (King et al., 1978; Khatri and Ishizaka, 2007). Thus, the refractive index at 1.02 µm, which is the highest wavelength for routine aerosol retrieval, is assumed to be the same as for 1.627 µm while calculating τaer at 1.627 µm from the volume size distribution using a Mie calculation. The optical air mass (m) and sun–earth distance (R) are calculated from the latitude and longitude of the observation site and time. Similarly, the Rayleigh scattering optical depth at 1.627 µm (τRay,1.627), though small in magnitude, is calculated from the atmospheric pressure of the observation site. Finally, the Beer–Lambert law, is used to determine ln F0,1.627, which is the natural logarithm of the calibration constant of the direct intensity at 1.627 µm. This is calculated using data for all clear-sky periods of each month to correlate ln (F1.627R2) with (τaer+τRayleigh)m. The outlier that decreases the correlation most is detected and removed in each iteration until the condition of the correlation coefficient (r≥0.997) is satisfied. To understand the quality of the ln F0,1.627 values calculated with this method, we compare them with data from an independent standard method. In the standard method, a calibration constant is derived by performing collocated observations with field and master instruments. Figure 2 compares ln F0,1.627 for three different sky radiometers at the observation sites of Hedo-misaki (26.87∘ N, 128.25∘ E), Fukue-jima (32.75∘ N, 128.68∘ E), and Sendai (38.26∘ N,140.84∘ E). There is good agreement between our method and the standard method for all three sky radiometers. The relative difference (as a percentage), defined as the difference between our method and the standard method normalized by the value of the standard method and then multiplied by 100, is also shown and is less than 0.05 % for all sky radiometers. This confirms the validity of our proposed method, which is inexpensive and easy. Thus, the proposed method can be used to determine the temporal variation of ln F0,1.627, which is useful for analyzing long-term observation data by mitigating the filter degradation problem. By using the volume size distribution and refractive indices of the wavelengths, the proposed method can be used for 0.87 and 1.02 µm as well. There is a negligible difference in the values obtained by the IL method and this method for the first two wavelengths. This study uses the values obtained from the proposed method for all wavelengths to avoid the difficulty of reading ln F0 from different files.
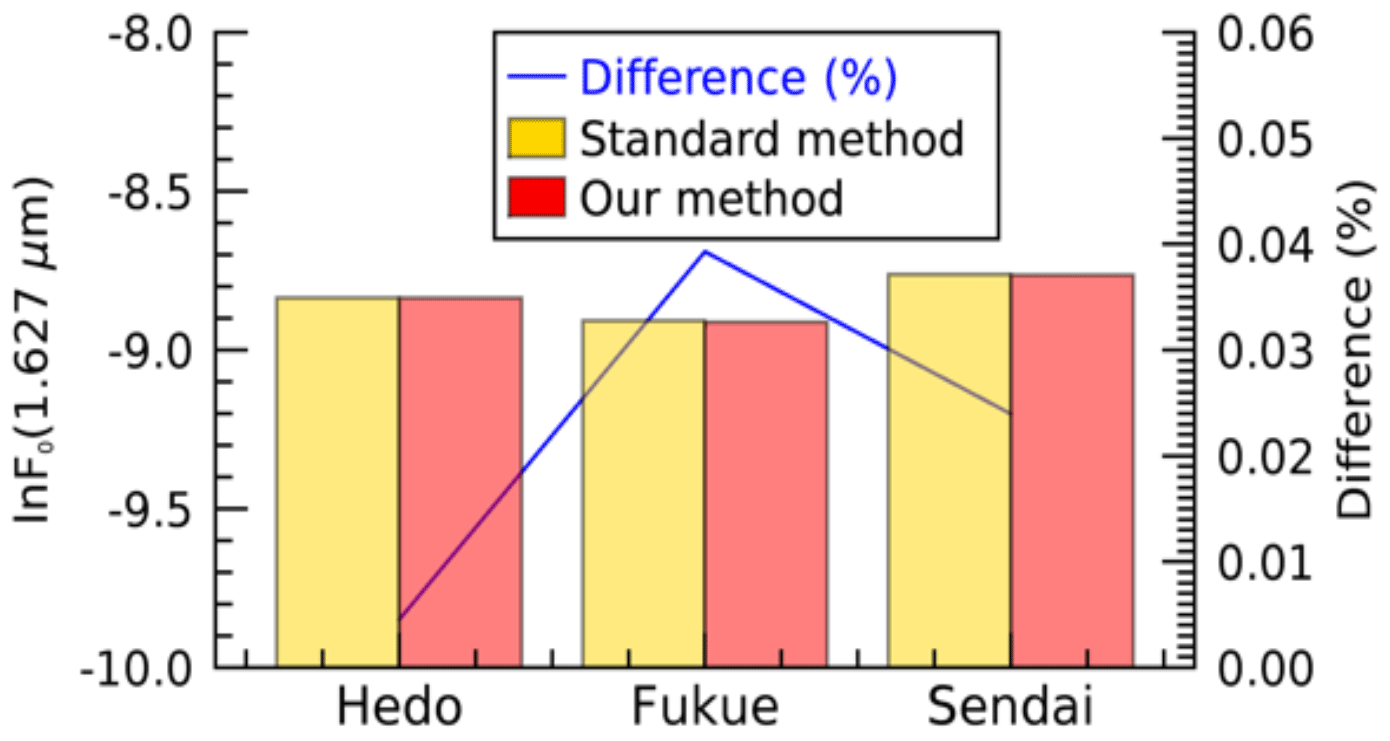
Figure 2Comparison of the direct intensity calibration constant (ln F0) values at the water-absorbing wavelength of 1.627 µm for the standard method (calibration using the master instrument) and our on-site method for sky radiometers at Hedo-misaki (26.87∘ N, 128.25∘ E), Fukue-jima (32.75∘ N, 128.68∘ E), and Sendai (38.26∘ N, 140.84∘ E). The difference is also shown, which is the difference (as a percentage) between the proposed method and the standard method normalized by the value of the standard method and multiplied by 100.
Along with the T values of three wavelengths obtained from Eq. (1), we use precipitable water content (PWC) and spectral surface albedo data, which are obtained from radiosonde observations (http://weather.uwyo.edu/upperair/sounding.html, last access: 15 November 2019) and MODIS observations (product MCD43A4), respectively. Finally, COD and CER are retrieved simultaneously by minimizing the cost function (J).
where x is a state vector, xa is an a priori vector, Sa and Sy are error covariance matrices for the a priori and measurement, respectively, y is the measurement vector, F is the forward model, and b is the model parameter vector (ancillary data). The terms x, y, and b are defined as
where τ and re are COD and CER, respectively, and W and Aλ are the PWC and surface albedo at wavelength λ, respectively. Both Sa and Sy are assumed to be diagonal matrices. xa and the diagonal elements of Sa are determined from 1-year data for water cloud properties observed over Japanese SKYNET sites by the Advanced Himawari Imager (AHI) sensor onboard Himawari-8, a Japanese geostationary satellite. The diagonal terms for Sy are determined based on a simulation of perturbations in T(λ) generated from 300 random Gaussian noises of error sources, as discussed in Sect. 4. SBDART (Santa Barbara DISORT Atmospheric Radiative Transfer model; Ricchiazzi et al., 1998) is used for forward modeling, and the Levenberg–Marquardt method is used to minimize the cost function. The total number of iterations is set as 50. If the solution does not converge within 50 iterations, the analysis is discarded. As highlighted in Sects. 1 and 4, transmittance signals may not always be characterized by unique COD or CER values. Consequently, the initial values of COD and CER used for iteration can be important when searching the plausible set of COD and CER values. To address this important issue, we first approximate the initial COD and CER values to start the iteration. The approximation is done by searching a set of COD and CER values by comparing observed T1.627∕T1.02 and T1.02 with the LUT of corresponding values modeled for COD values of 1–64 and CER values of 2–32 µm in steps of 1 µm. T1.627∕T1.02 generally decreases with the increase of COD; whereas when COD increases, T1.02 increases first until reaching the peak value, and then it starts to decrease. Thus, T1.627∕T1.02 and T1.02 can be used simultaneously to determine the range of COD and CER values in which the true values are likely to fall. A set of COD and CER values that generate the smallest root mean square difference between the observed and modeled values is used for the initial values in the iteration.
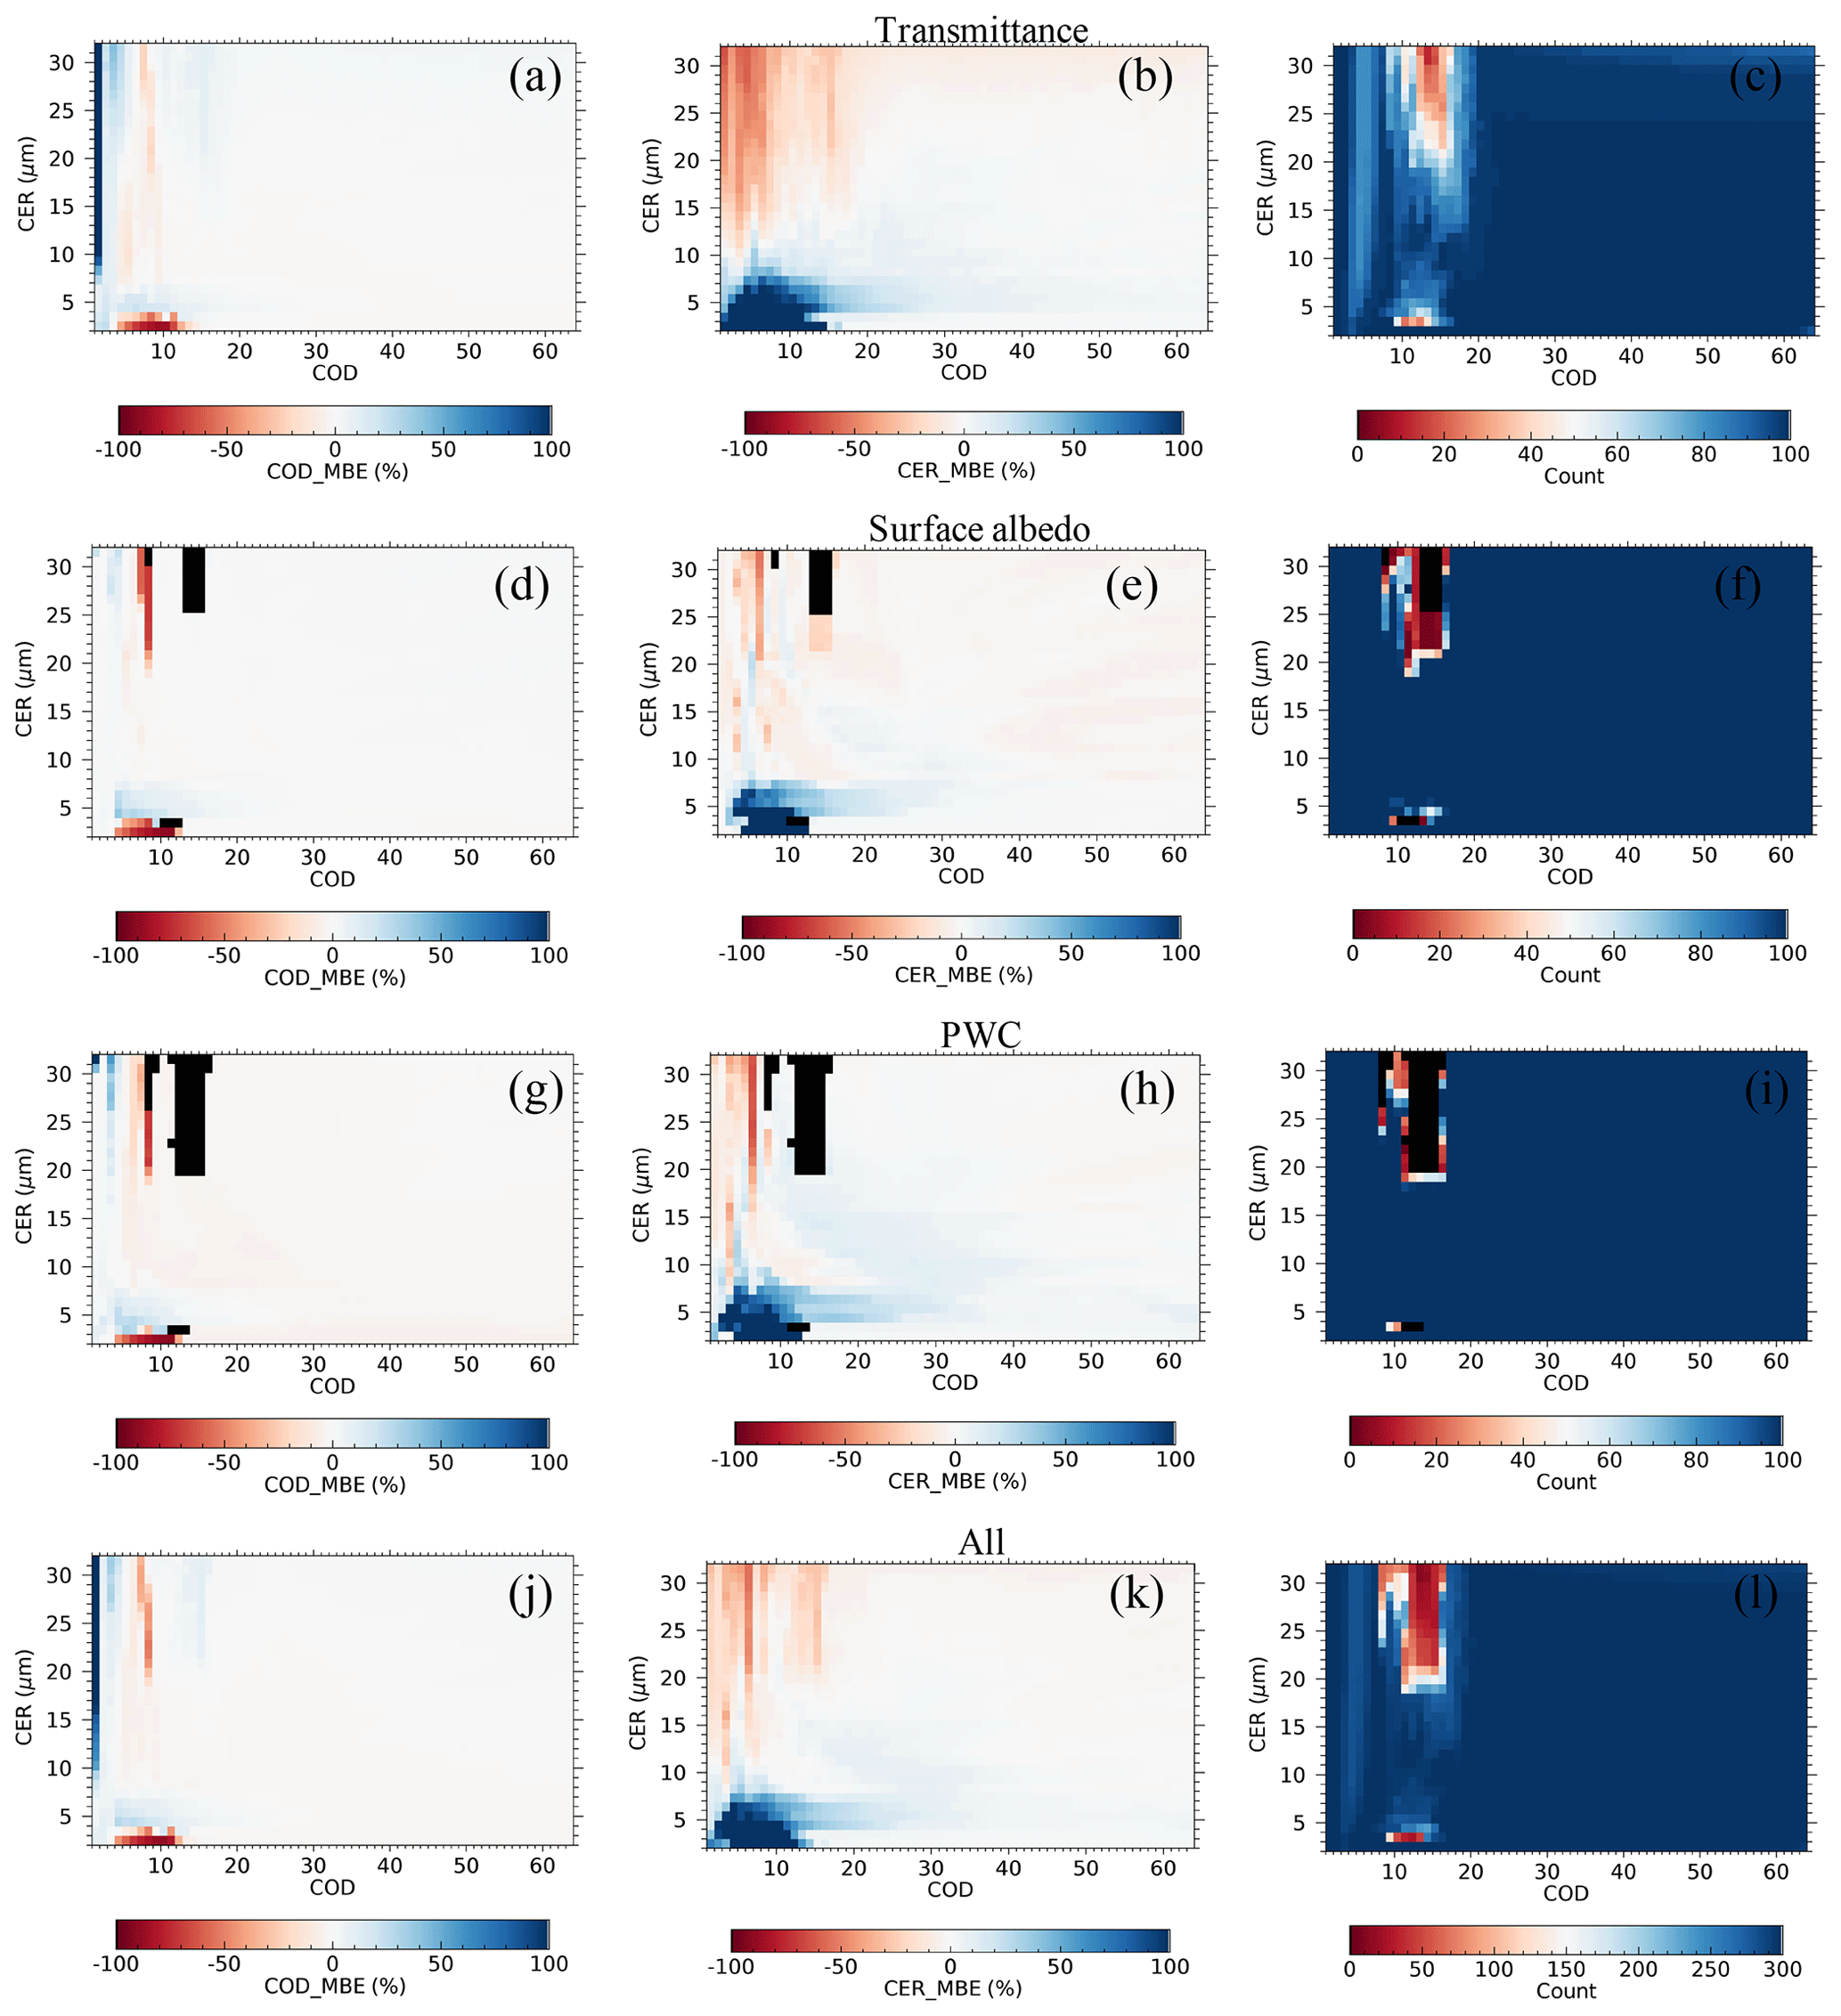
Figure 3Mean bias error (MBE) values for the retrieved (a) cloud optical depth (COD) and (b) cloud particle effective radius (CER) and (c) the total number of successful retrievals for the assumed error in transmittance; (d)–(f) same as (a)–(c) but for the assumed error in surface albedo; (g)–(i) same as (a)–(c) but for the assumed error in precipitable water content; (j)–(l) same as (a)–(c) but for all error sources. The 100 % unsuccessful retrieval is shown in black.
To understand the performance of the proposed algorithm for different types of input data (transmittance and ancillary data), retrieval errors are calculated by assuming errors on them. The retrieval errors are calculated for COD and CER values in the ranges of 1–64 and 2–32 µm, respectively, in steps of 1 µm. The simulations are performed for solar zenith and azimuth angles of 30 and 0∘, respectively, by assuming that the cloud phase is a water cloud. We assume 1 % error in ln F0(λ), which is significantly larger than the maximum error in ln F0(λ) shown in Fig. 2 and discussed in Sect. 3. This large error in ln F0(λ) is assumed to incorporate errors in T(λ) generated from other possible sources, such as radiance measurement and ΔΩ(λ) estimation. Similarly, we assume a surface albedo of 0.15 for all three wavelengths and a PWC of 1.5 cm by assuming errors of ±0.025 and ±1.0 cm, respectively. F0(λ) in an actual data analysis is the instrument signal equivalent to the measurement performed at the top of the atmosphere (TOA); however, the incident irradiance at TOA (W m−2 nm−1) calculated from the radiative transfer model is used as F0(λ) for error evaluation simulations discussed in this section. For each set of known COD and CER values, 100 random Gaussian noises for each error source are added in the retrieval to simulate 300 sets of COD and CER values. The successful retrievals (J≤3) are used to calculate the mean bias error (MBE) as
Si and Tr are the ith simulated and true values, respectively, and n is the total sample number. Only the MBE is discussed here because the error map evaluated in other forms, such as the root mean square error (RMSE), contains the same qualitative information. Figure 3 shows the MBE for COD (first column), MBE for CER (second column), and total number of successful retrievals (third column) for each type of error separately and in combination. Figure 3a–c, d–f, g–i, and j–l correspond to the errors in the transmittance, surface albedo, PWC, and all sources, respectively. The 100 % unsuccessful retrieval is shown in black. The retrieval is more uncertain mainly when COD is less than ∼15. Regardless of the error source, the retrieval error is high, especially for small (CER < ∼7 µm) and large (CER > ∼13 µm) cloud droplets. In general, the error domains of CER are expanded by overlapping the error domains of COD. This suggests that the error in input data affects CER retrieval more than COD retrieval. Among the three error sources, the error in transmittance can dominate the effect of the remaining two error sources. The successful retrieval number corresponding to each error source suggests that in the domains of ∼8 < COD < ∼16 with CER > ∼13 and CER < ∼7 µm, the algorithm has difficulty fitting the measured transmittances with modeled values. These domains have high retrieval errors (first and second columns). The high errors in COD and CER are extended further for COD < ∼8 despite the sufficient number of successful retrievals. The contour lines for T(λ) in Fig. 4a, b, and c for wavelengths of 0.87, 1.02, and 1.627 µm, respectively, can help to understand these domains. The T(λ) values in Fig. 4a–c correspond to no error in the input data.
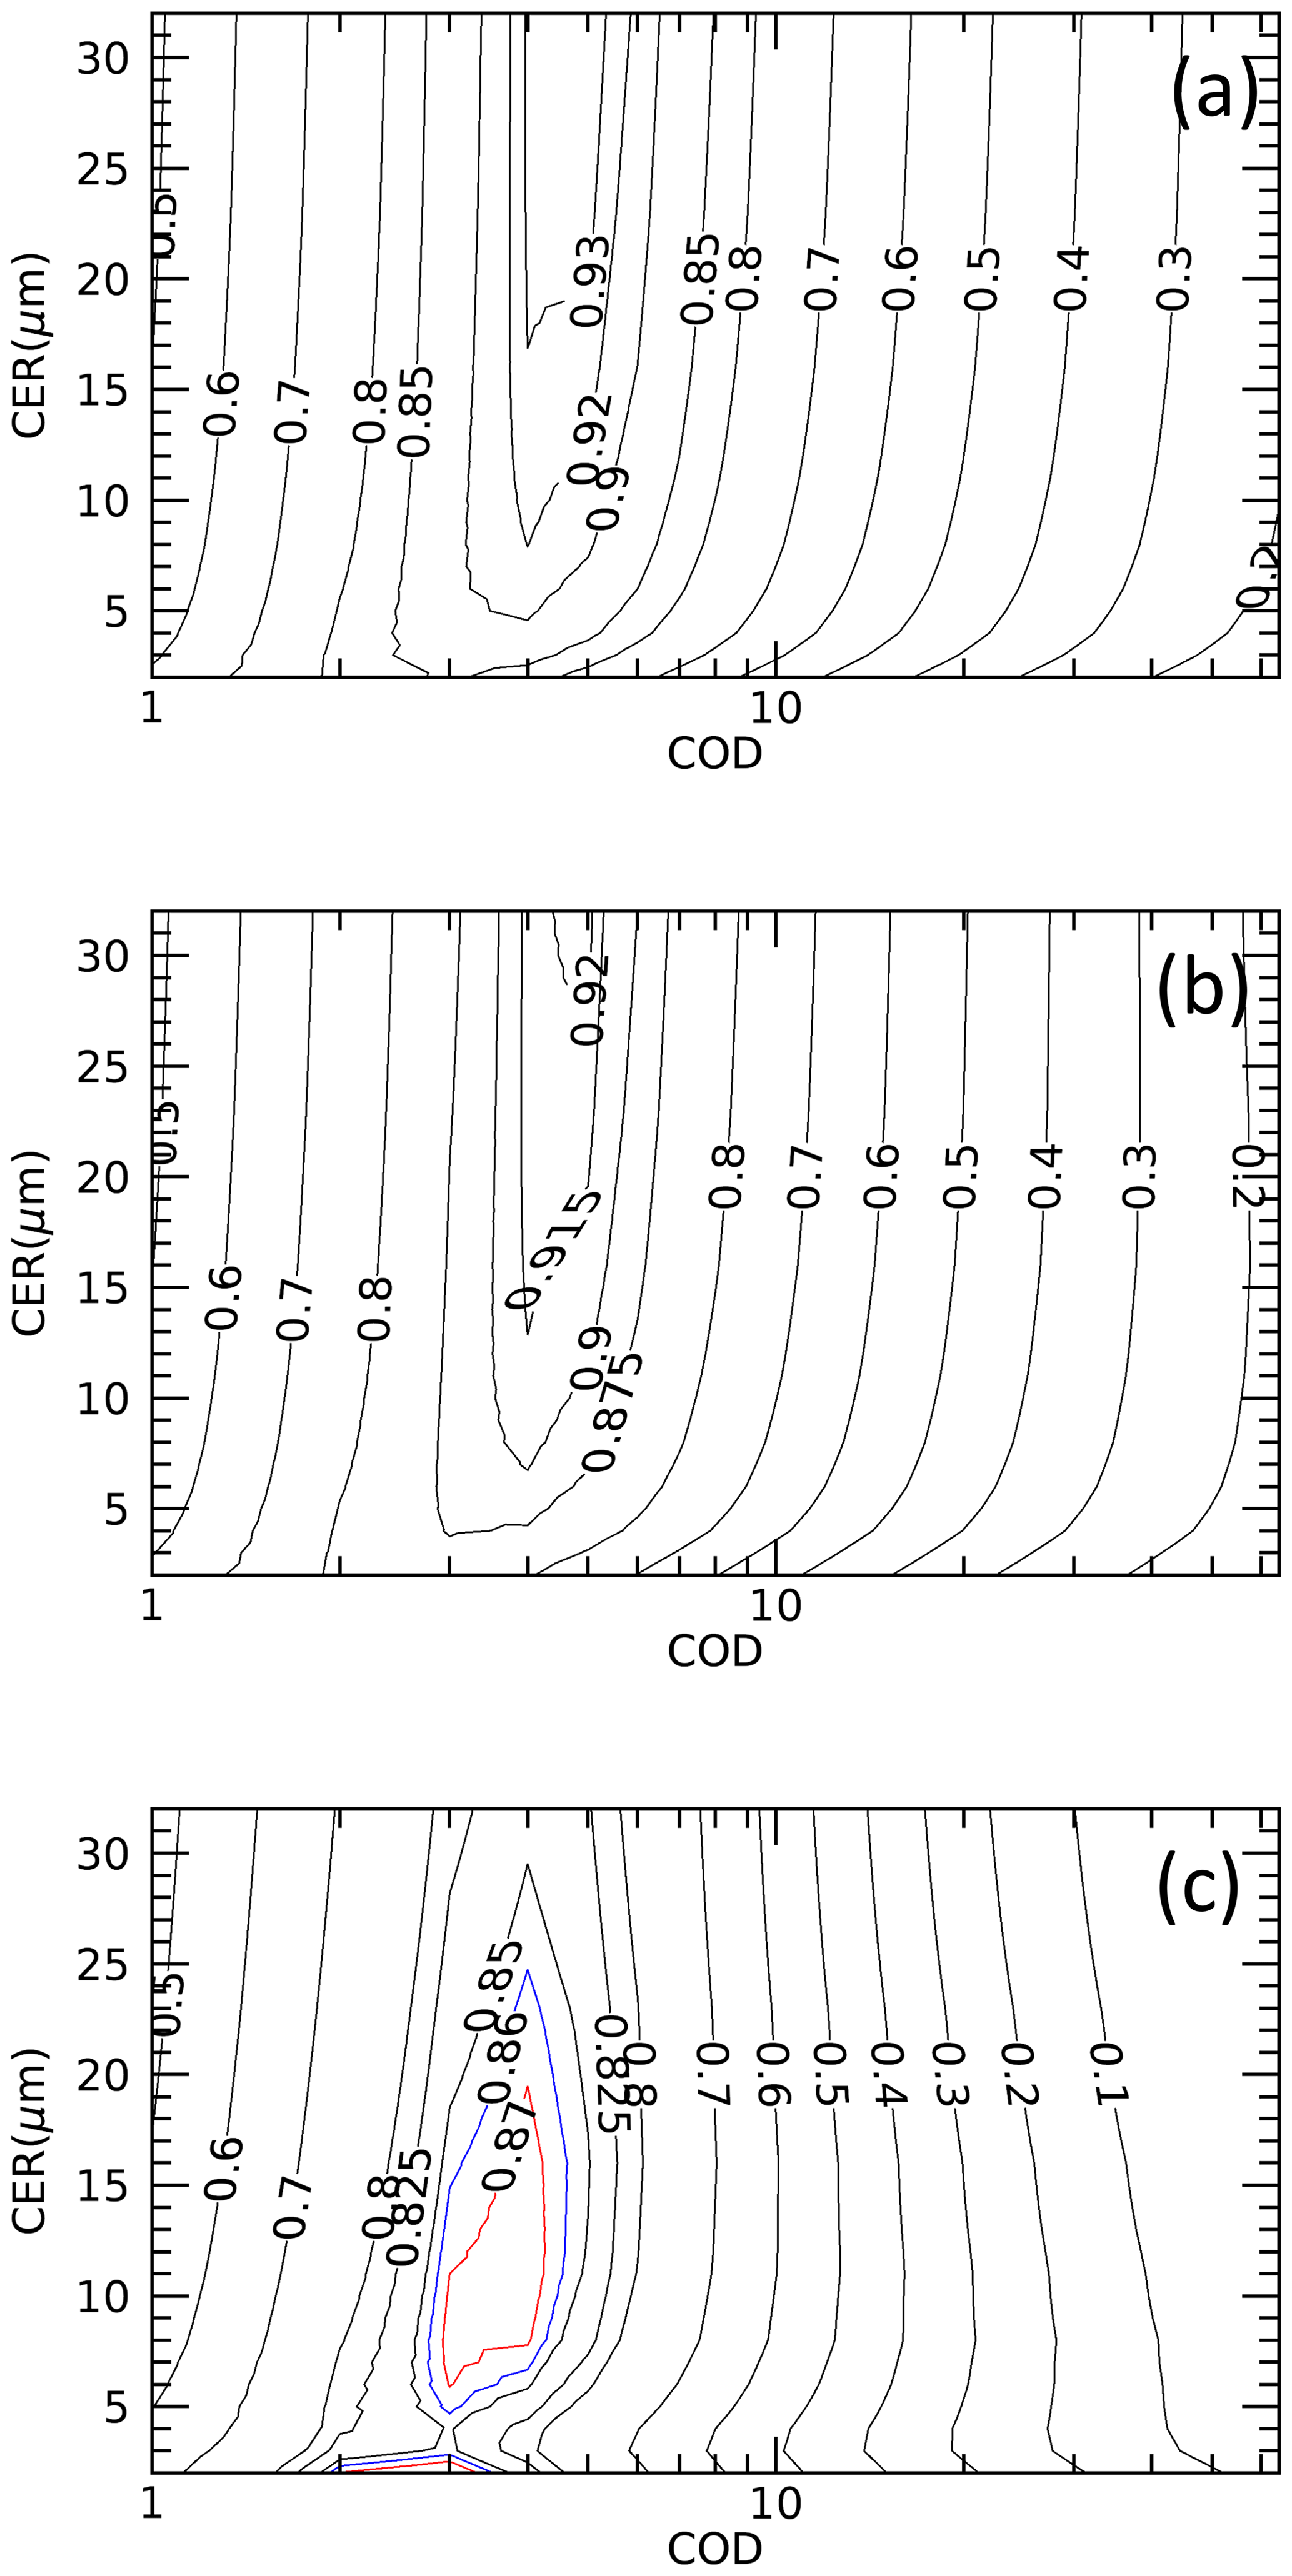
Figure 4Contour plots of transmittances at the wavelengths of (a) 0.87, (b) 1.02, and (c) 1.627 µm for the solar zenith and azimuth angles of 30 and 0∘, respectively. The transmittance values are given within the contour lines. Different colors are used for 1.627 µm to make it easy to distinguish. COD is the cloud optical depth; CER is the cloud particle effective radius.
First talking about unsuccessful retrievals noted for the ∼8 < COD < ∼16 and CER > ∼13 µm domain, the T(λ) values hardly change as CER increases above ∼13 µm (Fig. 4a–c). As a result, the CER retrieval above ∼13 µm is uncertain, and the retrieved CER is generally underestimated. T(λ) contour lines falling within ∼8 < COD < ∼16 appear again for COD < ∼2. Therefore, to search for the best set of COD and CER values by trying to fit the inputted T(λ) values with the modeled values, the algorithm can mistakenly search for a plausible solution in this small COD domain. If this happens, the retrieval may not be confined within J≤3. The algorithm is likely to compensate for such underestimated CERs by overestimating CODs (Fig. 3a and b and j and k).
Similarly, for failed retrievals for CER < ∼7 µm, a non-uniform change in T(1.627 µm) associated with the change in CER (Fig. 4c) can be an important factor. The non-uniform response of CER to the change of T(1.627 µm) can mislead the algorithm, while searching for the best set of COD and CER may force the algorithm to shift wrongly to the COD < ∼2 domain to search for a plausible solution. Both CER and COD may be overestimated for CER > ∼7 µm. Despite a sufficient number of successful retrievals, there are high errors in the retrieved values for COD < ∼8. Similar to the error domains discussed above, the retrieval errors are mainly confined to large and small values of CER. The peak values of T(λ) generally fall within COD . Both the forward scattering and absorption can increase with the increase of COD along with the increase in multiple scattering; the increase in T(λ) before the peak value is due to the dominance of forward scattering over absorption, and the opposite is true for the decrease in T(λ) after the peak value. In other words, the competition between forward scattering and absorption is at its maximum to increase or decrease T(λ) within this COD range. CER is as important as COD in the increase or decrease of T(λ), and the algorithm must consider changes in COD and CER while searching for a plausible set of COD and CER. Thus, there is a high probability for the ambiguous solution of COD and CER within this COD range. Therefore, even a small degree of error in input data can change both COD and CER considerably from their true values. Though weak, this phenomenon can be still active in the vicinity of this COD range to bring error in retrieved values, even for COD < ∼3. The weak CER response towards T(λ) for large CERs plays an important role in introducing errors in retrieved values for large CERs. A very complicated distribution of T(1.627 µm) for CER < ∼7 µm, as discussed above, can be an important factor for errors noted for relatively small CERs. Further, the appearance of same T(λ) values for larger CODs, as discussed above, can be the next important factor for errors noted within COD < ∼2.
Overall, the retrieval error in COD is smaller than that in CER, suggesting that the transmittance-based cloud remote sensing is better for COD retrieval than for CER retrieval. Except for those error domains, the magnitudes of the retrieval errors are small. For example, for COD > 15 and all types of errors, the 5th, 50th, and 95th percentile values of the MBE for retrieved COD values are −2.0 %, −0.6 %, and 0.82 %, respectively, and for retrieved CER values they are −4.1 %, −0.51 %, and 7.2 %, respectively. For reference, the maximum (minimum) retrieval errors for COD ≥20 and CER =10 µm for a spectral method proposed by McBride et al. (2011) are ∼7 % (∼2 %) and ∼52 % (∼14 %) for COD and CER, respectively. In Sect. 5, we examine the quality of the retrieved cloud properties based on a comparison with standard data obtained from independent sources.
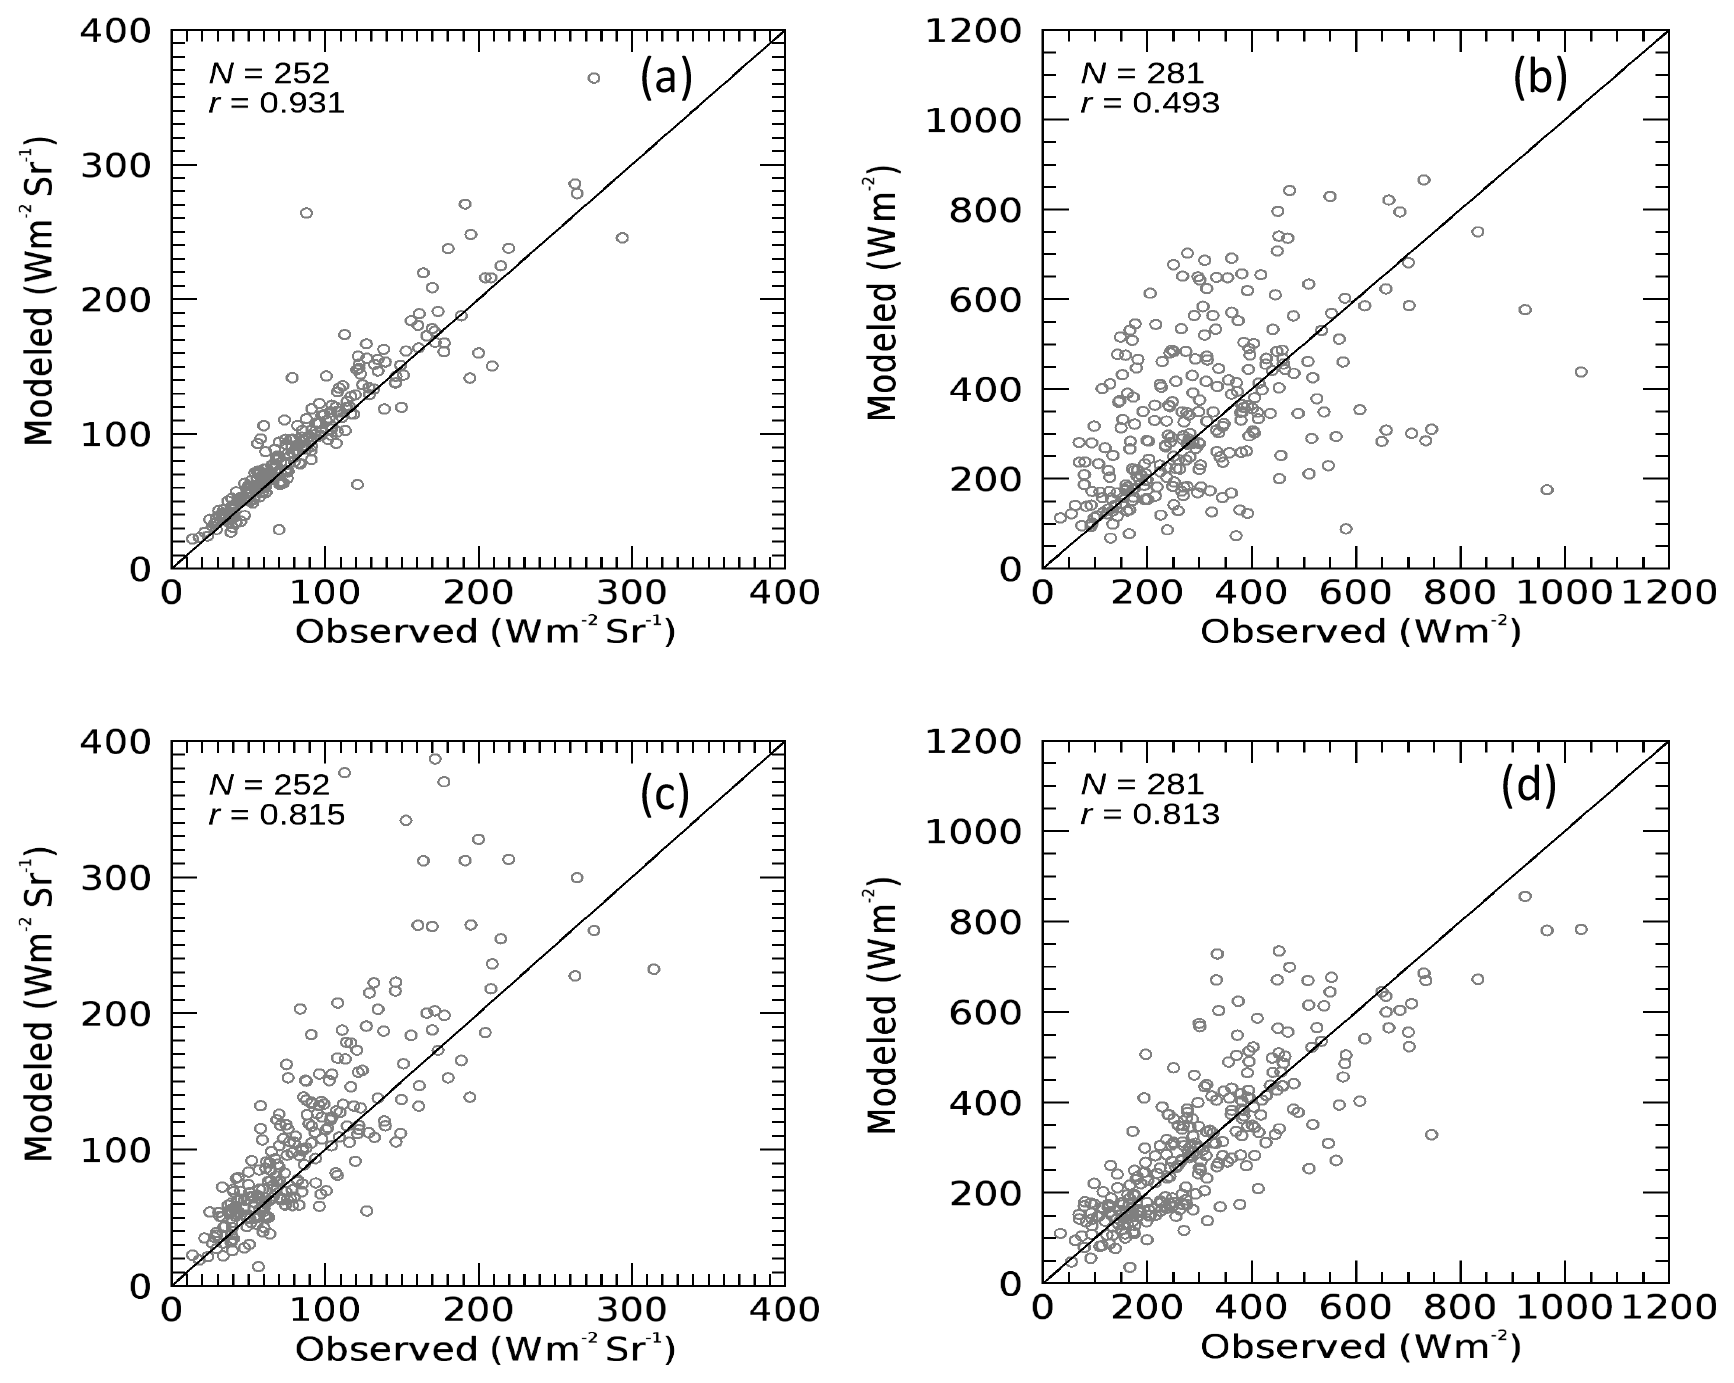
Figure 5Comparison of modeled and observed broadband (a) radiances and (b) irradiances for modeled values using sky radiometer cloud proprieties for the observation site at Chiba (35.62∘ N, 140.10∘ E) for 2016. Comparison results for broadband radiances (c) and (d) the irradiance for modeled cloud properties corresponding to the Advanced Himawari Imager.
5.1 Solar radiation data
The broadband radiance and irradiance of the shortwave spectral range (0.3–2.8 µm) observed using a narrow-angle radiometer (EKO Instruments Co., Ltd., Japan; FOV of 5∘) and a pyranometer (Kipp & Zonen, Netherlands; FOV of 180∘), respectively, at Chiba (35.62∘ N, 140.10∘ E) every 20 s from December 2015 to December 2016 are used to evaluate the cloud properties observed by the sky radiometer. The narrow-angle radiometer observes the downwelling irradiance signals as voltage in a narrow FOV. The instrument was calibrated by the manufacturer in the laboratory, and the observed signals are converted into radiance (W m−2 sr−1) by using the company-provided calibration constant value. Because the narrow-angle radiometer faces upward, obtained radiance is from the zenith. The cloud properties from the sky radiometer are combined with the surface albedo observed by MODIS and the PWC observed by radiosonde to calculate the corresponding observations. A comparison is performed for an average of 5 min observations of solar radiation that center the sky radiometer observation time. Figure 5a and b compare the broadband radiance and irradiance, respectively. For reference, a comparison is also performed for modeled values using cloud properties from the AHI instead of the sky radiometer for broadband radiance and irradiance (Fig. 5c and d).
For cloud properties from the sky radiometer, there is a strong (weak) correlation between modeled and observed values for broadband radiance (irradiance). In contrast, for AHI cloud properties, the correlation between the modeled and observed values for broadband radiance (irradiance) is weak (strong). Compared with data from the pyranometer, the observed data from the narrow-angle radiometer best describe the quality of the sky radiometer cloud properties because of the narrow FOV. The good agreement in Fig. 5a with a correlation coefficient (r) of up to 0.93 suggests that sky radiometer cloud properties (at least for COD) are qualitative enough. Because the contribution of COD is greater than that of CER to broadband solar radiation (Khatri et al., 2018), Fig. 5a alone cannot explain the quality of the retrieved CER. The poor agreement for irradiance comparison in Fig. 5b can be explained by the large difference in FOV of the sky radiometer and pyranometer; the surface-observed solar radiation varies drastically depending on the instrument FOV. For example, in the scatter plot for broadband irradiance observed by the pyranometer and radiance observed by a narrow-angle radiometer at Chiba during January–March 2016, the correlation is poor (Fig. 6). An important factor in decreasing the correlation between these measurements is the cloud horizontal inhomogeneity, which can explain the poor agreement in Fig. 5b plausibly, despite the accurate retrieval from the sky radiometer (Fig. 5a). In contrast, the AHI cloud properties are an average or representative values of specific coverage, for instance, a pixel (e.g., 1×1 km). As a result, the irradiances modeled with the AHI cloud properties are closer to the observed irradiance than those modeled with the sky radiometer cloud properties. This is because the cloud observed by the sky radiometer can be a small portion of a pixel containing horizontally inhomogeneous clouds.
5.2 Satellite cloud products
As part of validating the water cloud products of MODIS and the AHI using surface radiation data, Khatri et al. (2018) compared water cloud properties retrieved from sky radiometers at the SKYNET observation sites of Chiba, Hedo-misaki, and Fukue-jima with those of MODIS and AHI observations for October 2016 to December 2017. They used surface irradiance data, and the validation results using sky radiometer and surface irradiance data were qualitatively similar. A good (poor) agreement was shown for COD (CER) between sky radiometer and satellite products in Khatri et al. (2018). They compared sky radiometer results with results of collocated satellite pixels by selecting samples with a time difference of less than 1.25 min, which is half the temporal resolution of the AHI observations over Japan. The distance between the pixel center and the observation site was less than 1 km, and they performed parallax correction for satellite products.
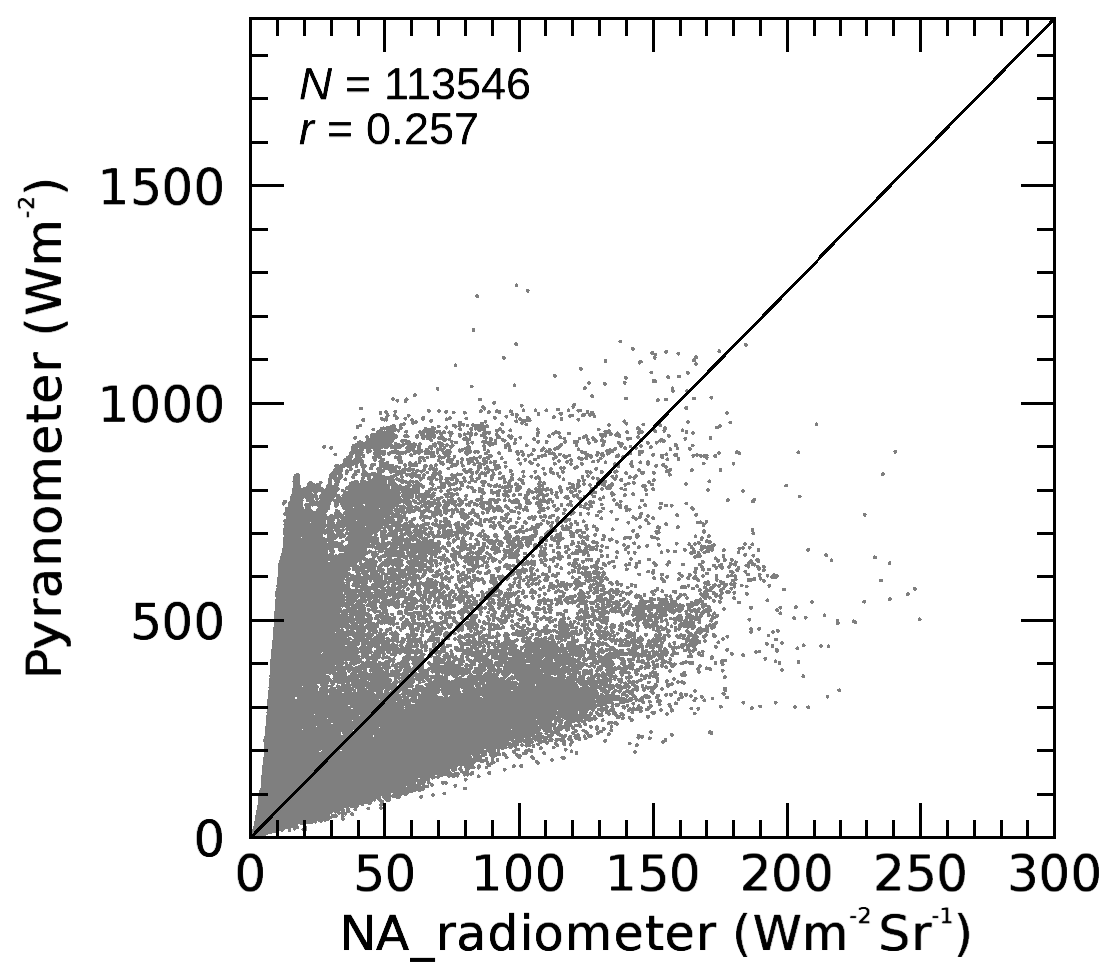
Figure 6Scatterplot of broadband radiances and irradiances observed with a narrow-angle radiometer and a wide-angle pyranometer at Chiba (35.62∘ N, 140.10∘ E) during January–March 2016. The solid line represents y=2πx.

Figure 7Comparison of sky radiometer cloud optical depths (CODs) with the (a) MODIS and (b) Advanced Himawari Imager CODs for observation sites at Chiba (35.62∘ N, 140.10∘ E), Hedo-misaki (26.87∘ N, 128.25∘ E), and Fukue-jima (32.75∘ N, 128.68∘ E) from October 2015 to December 2016.
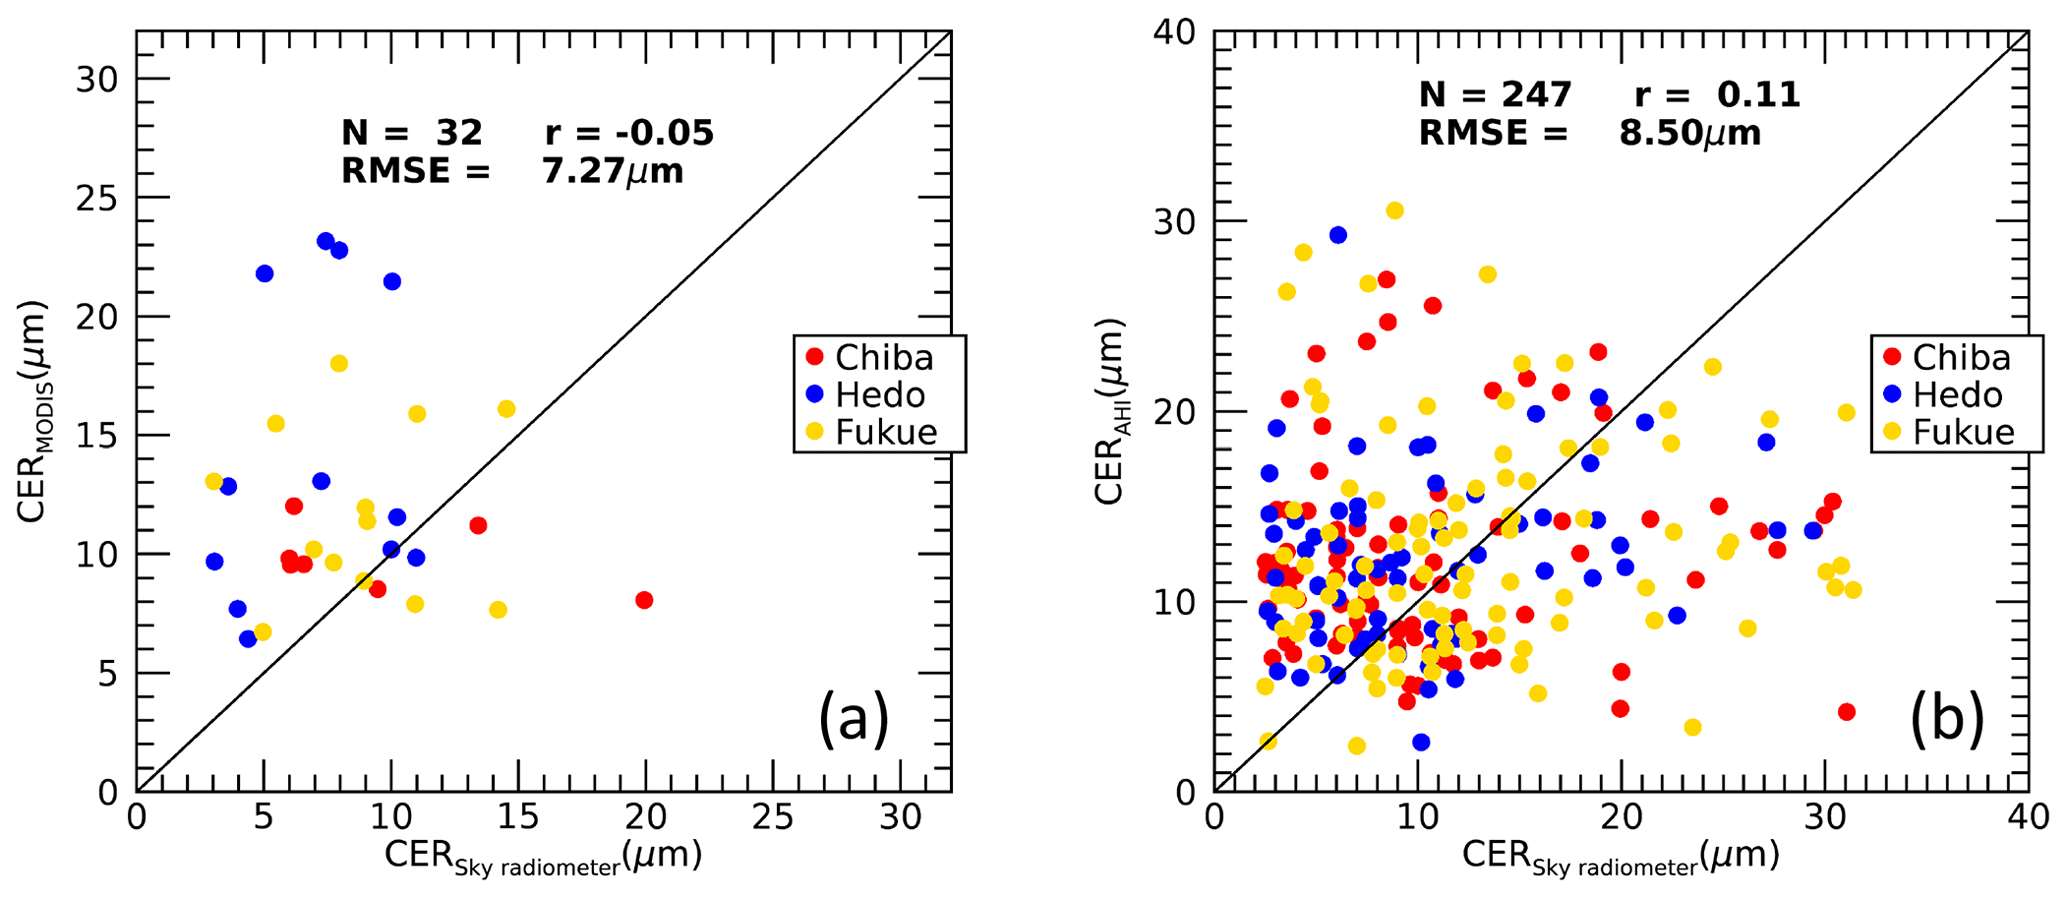
In Sect. 5.1, we identified inhomogeneous clouds and broken clouds in the satellite pixels as major obstacles in assessing the quality of satellite products using the sky radiometer results and vice versa. Here, we examine the quality of sky radiometer products by using satellite products. We prepare samples for comparison by addressing the cloud inhomogeneity problem in a logical way with the available information. If the surface irradiance calculated from the sky radiometer cloud properties agrees well with that observed at the surface, the effective COD of the actual inhomogeneous clouds may be represented by a sky radiometer COD. The effective COD refers to the COD of the assumed plane-parallel homogenous cloud layers, which can produce irradiance equivalent to that produced by actual inhomogeneous clouds, that is, the measured irradiance. The satellite cloud properties retrieved from reflected signals assume clouds are plane-parallel homogenous layers. The sky radiometer cloud properties that generate surface irradiances equivalent to observed values by differing by not more than 1 % are compared with the satellite cloud properties. Figure 7a and b compare the sky radiometer CODs with MODIS and AHI values, respectively, for the same sites and period as Khatri et al. (2018). The COD agreement is good. The results are qualitatively the same for both MODIS and the AHI, with r values of ∼0.6 and ∼0.7 and RMSE values of ∼13 and ∼10 for MODIS and AHI, respectively. Despite several differences between the sky radiometer and satellite products from observation and retrieval, their good agreement indicates that they have a similar response towards thin and thick clouds. Similarly, Fig. 8a and b compare the sky radiometer CERs with MODIS and AHI values, respectively. The water-absorbing wavelengths corresponding to MODIS and the AHI are 2.1 and 3.79 µm, respectively. The CERs between the sky radiometer and satellite sensors are poorly correlated, with r values less than 0.12 and an RMSE of ∼7 µm for both satellite sensors. This poor correlation may be mainly due to the high sensitivity toward cloud top layers of the satellite sensors using reflected signals (Platnick, 2000), whereas sky radiometers are sensitive to all the cloud layers.
Although the qualitative information reported by Khatri et al. (2018) and the comparisons in Figs. 7 and 8 of this study are similar, there are differences in Figs. 7 and 8 compared to the comparison plots shown in Khatri et al. (2018). The application of data screening criteria in this study generally screened out data with large differences between the sky radiometer and satellite sensors. These large differences in the previous comparison probably arose from the different FOVs of the satellite sensor and sky radiometer while observing inhomogeneous clouds. Thus, the comparison results presented in this study by addressing the cloud inhomogeneity problem more logically should give more accurate and refined information than those presented in Khatri et al. (2018).
To make cloud observations from the surface more common and convenient, we developed an algorithm to retrieve cloud properties (COD and CER) from spectral zenith radiances measured by a sky radiometer. By considering a priori information of the state vector and errors related to observed transmittance and using ancillary data (PWC and surface albedo), an optimal estimation approach was proposed by fitting the observed transmittances at the wavelengths of 0.87, 1.02, and 1.627 µm with modeled values. To ease data analysis of long-term observations further by overcoming the filter degradation problem, an on-site method of calibrating for direct intensity was proposed by using aerosol data for clear-sky days. The calibration constants derived from the proposed method agree well with values determined by collocating the field instruments with the master instrument. The retrieval error analyses performed by considering known ranges of errors in the observed transmittances and ancillary data suggested that the algorithm performed well, except for in narrow bands of small COD and CER values. In general, the errors in input information affected CER retrieval more strongly than COD retrieval, and the retrieved CER had large errors when clouds were optically thin (COD < ∼15) and cloud droplets were small (CER < ∼7 µm) or large (CER > ∼13 µm). As part of the quality assessment, cloud properties retrieved from the proposed algorithm were compared indirectly with surface-observed radiance and irradiance data and directly with observed cloud properties from MODIS and the AHI. The retrieved cloud properties produced broadband shortwave radiances similar to those observed by a narrow-angle radiometer, confirming the good quality of the retrieved products (at least of COD) from the sky radiometer. However, the agreement was poor when broadband shortwave irradiances observed by a pyranometer with a wide FOV were compared with the modeled values. This discrepancy was probably caused by the large difference in FOVs between the sky radiometer and pyranometer, suggesting that the instrument's FOV has a large effect on cloud remote sensing. COD agreed well between the sky radiometer and satellite sensors; however, the agreement was poor for CER.
Data and retrieval code are available from the corresponding author upon request.
PK, HI, and TH developed the study framework and code. HI, TT, AY, and AD generated data. HL and QK helped in advancing the study's framework and writing the paper. All co-authors read the paper and provided suggestions and comments.
The authors declare that they have no conflict of interest.
This article is part of the special issue “SKYNET – the international network for aerosol, clouds, and solar radiation studies and their applications (AMT/ACP inter-journal SI)”. It is not associated with a conference.
This research is supported by the 2nd Research Announcement on the Earth Observations of the Japan Aerospace Exploration Agency (JAXA) (PI no. ER2GCF211, contract no. 19RT000370), a Grant-in-Aid for Scientific Research (C) (no. 17K05650) from the Japan Society for the Promotion of Science (JSPS), the “virtual laboratory for diagnosing the earth's climate system” program of MEXT, Japan, and the CREST/JST research fund (grant no. JPMJCR15K4).
This research has been supported by the Japan Aerospace Exploration Agency (PI no. ER2GCF211, contract no. 19RT000370), the Japan Society for the Promotion of Science (JSPS) (grant no. 17K05650), and the CREST/JST (grant no. JPMJCR15K4).
This paper was edited by Teruyuki Nakajima and reviewed by two anonymous referees.
Campanelli, M., Nakajima,T., and Olivieri, B.: Determination of the solar calibration constant for a sun-sky radiometer: Proposal of an in situ procedure, Appl. Optics, 43, 651–659, https://doi.org/10.1364/AO.43.000651, 2004.
Campanelli, M., Nakajima, T., Khatri, P., Takamura, T., Uchiyama, A., Estelles, V., Liberti, G. L., and Malvestuto, V.: Retrieval of characteristic parameters for water vapour transmittance in the development of ground-based sun–sky radiometric measurements of columnar water vapour, Atmos. Meas. Tech., 7, 1075–1087, https://doi.org/10.5194/amt-7-1075-2014, 2014.
Chiu, J. C., Huang, C.-H., Marshak, A., Slutsker, I., Giles, D. M., Holben, B. N., Knyazikhin, Y., and Wiscombe, W. J: Cloud optical depth retrievals from the Aerosol Robotic Network (AERONET) cloud mode observations, J. Geophys. Res., 115, D14202, https://doi.org/10.1029/2009JD013121, 2010.
Chiu, J. C., Marshak, A., Huang, C.-H., Várnai, T., Hogan, R. J., Giles, D. M., Holben, B. N., O'Connor, E. J., Knyazikhin, Y., and Wiscombe, W. J.: Cloud droplet size and liquid water path retrievals from zenith radiance measurements: examples from the Atmospheric Radiation Measurement Program and the Aerosol Robotic Network, Atmos. Chem. Phys., 12, 10313–10329, https://doi.org/10.5194/acp-12-10313-2012, 2012.
Forster, P., Ramaswamy, V., Artaxo, P., Berntsen, T., Betts, R., Fa- hey, D. W., Haywood, J., Lean, J., Lowe, D. C., Myhre, G., Nganga, J., Prinn, R., Raga, G., Schulz, M., and Van Dorland, R.: Changes in Atmospheric Constituents and in Radiative Forc- ing, in: Climate Change 2007: The Physical Science Basis, con- tribution of Working Group I to the Fourth Assessment Report of the Intergovernmental Panel on Climate Change, edited by: Solomon, S. D., Qin, M., Manning, Z., Chen, M., Marquis, K. B., Averyt, M. T., and Miller, H. L., Cambridge University Press, Cambridge, United Kingdom and New York, NY, USA, 129–134, 2007.
Hashimoto, M., Nakajima, T., Dubovik, O., Campanelli, M., Che, H., Khatri, P., Takamura, T., and Pandithurai, G.: Development of a new data-processing method for SKYNET sky radiometer observations, Atmos. Meas. Tech., 5, 2723–2737, https://doi.org/10.5194/amt-5-2723-2012, 2012.
Khatri, P. and Ishizaka,Y.: Effects of Continentally Polluted Air Mass on Aerosol Optical Properties over the East China Sea, J. Meteorol. Soc. Jpn., 85, 47–68, https://doi.org/10.2151/jmsj.85.47, 2007.
Khatri, P., Takamura, T., Yamazaki, A., and Uchiyama, A.: Use of 315nm channel data of sky radiometer to estimate columnar ozone concentration: A preliminary study, J. Meteorol. Soc. Jpn., 92A, 185–194, https://doi.org/10.2151/jmsj.2014-A12, 2014.
Khatri, P., Takamura, T., Estellés, V., Irie, H., Kuze, H., Campanelli, M., Sinyuk, A., Lee, S.-M., Sohn, B. J., Pandithurai, G., Kim, S.-W., Yoon, S. C., Martinez-Lozano, J. A., Hashimoto, M., Devara, P. C. S., and Manago, N.: Factors for inconsistent aerosol single scattering albedo between SKYNET and AERONET, J. Geophys. Res., 121, 1859–1877, https:/doi.org/10.1002/20159JD023976, 2016.
Khatri, P., Hayasaka, T., Iwabuchi, H., Takamura, T., Irie, H., and Nakajima, T. Y.: Validation of MODIS and AHI observed water cloud properties using surface radiation data, J. Meteorol. Soc. Jpn., 96B, 151–172, https:/doi.org/10.2151/jmsj.2018-036, 2018.
Kikuchi, N., Nakajima, T., Kumagai, H., Kuroiwa, H., Kamei, A., Nakamura, R., and Nakajima, T. Y.: Cloud optical thickness and effective particle radius derived from transmitted solar radiation measurements: Comparison with cloud radar observations, J. Geophys. Res., 111, D07205, https://doi.org/10.1029/2005JD006363, 2006.
King, M. D., Byrne, D. M., Herman, B. M., and Reagan, J. A.: Aerosol Size Distributions Obtained by Inversion of Spectral Optical Depth Measurements, J. Atmos. Sci., 35, 2153–2167, https://doi.org/10.1175/1520-0469(1978)035<2153:ASDOBI>2.0.CO;2, 1978.
LeBlanc, S. E., Pilewskie, P., Schmidt, K. S., and Coddington, O.: A spectral method for discriminating thermodynamic phase and retrieving cloud optical thickness and effective radius using transmitted solar radiance spectra, Atmos. Meas. Tech., 8, 1361–1383, https://doi.org/10.5194/amt-8-1361-2015, 2015.
McBride, P. J., Schmidt, K. S., Pilewskie, P., Kittelman, A. S., and Wolfe, D. E.: A spectral method for retrieving cloud optical thickness and effective radius from surface-based transmittance measurements, Atmos. Chem. Phys., 11, 7235–7252, https://doi.org/10.5194/acp-11-7235-2011, 2011.
Nakajima, T. and King, M. D.: Determination of the optical thickness and effective particle radius of clouds from reflected solar radiation measurements. Part I: Theory, J. Atmos. Sci., 47, 1878–1893, https://doi.org/10.1175/1520-0469(1990)047<1878:DOTOTA>2.0.CO;2, 1990.
Nakajima, T., Tonna, G., Rao, R., Kaufman, Y., and Holben, B. N.: Use of sky brightness measurements from ground for remote sensing of particulate polydispersions, Appl. Optics, 35, 2672–2686, https://doi.org/10.1364/AO.35.002672, 1996.
Platnick, S.: Vertical photon transport in cloud remote sensing problems, J. Geophys. Res., 105, 22919–22935, https://doi.org/10.1029/2000JD900333, 2000.
Ricchiazzi, P., Yang, S., Gautier, C., and Sowle, D.: SBDART: A research and teaching software tool for plane-parallel radiative transfer in the Earth's atmosphere, B. Am. Meteorol. Soc., 79, 2101–2114, https://doi.org/10.1175/1520-0477(1998)079<2101:SARATS>2.0.CO;2, 1998.
Rodgers, C. D.: Inverse Methods for Atmospheric Sounding: Theory and Practice (Vol. 2), Ser. Atmos. Oceanic Planet. Phys., 2, World Sci., Hackensack, NJ, 2000.
Rosenfeld, D., Andreae, M. O., Asmi, A., Chin, M., de Leeuw, G., Donovan, D., Kahn, R., Kinne, S., Kivekäs, N., Kul- mala, M., Lau, W., Schmidt, S., Suni, T., Wagner, T., Wild, M., and Quaas, J.: Global observations of aerosol-cloud- precipitation-climate interactions, Rev. Geophys., 52, 750–808, https://doi.org/10.1002/2013RG000441, 2014.