the Creative Commons Attribution 4.0 License.
the Creative Commons Attribution 4.0 License.
A decade of CH4, CO and N2O in situ measurements at Lauder, New Zealand: assessing the long-term performance of a Fourier transform infrared trace gas and isotope analyser
Vanessa Sherlock
David W. T. Griffith
Rowena Moss
Gordon Brailsford
Sylvia Nichol
Michael Kotkamp
We present a 10-year (January 2007–December 2016) time series of continuous in situ measurements of methane (CH4), carbon monoxide (CO) and nitrous oxide (N2O) made by an in situ Fourier transform infrared trace gas and isotope analyser (FTIR) operated at Lauder, New Zealand (45.04 S, 169.68 E, 370 m a. m. s. l.). Being the longest continuous deployed operational FTIR system of this type, we are in an ideal position to perform a practical evaluation of the multi-year performance of the analyser. The operational methodology, measurement precision, reproducibility, accuracy and instrument reliability are reported.
We find the FTIR has a measurement repeatability of the order of 0.37 ppb (1σ standard deviation) for CH4, 0.31 ppb for CO and 0.12 ppb for N2O. Regular target cylinder measurements provide a reproducibility estimate of 1.19 ppb for CH4, 0.74 ppb for CO and 0.27 ppb for N2O. FTIR measurements are compared to co-located ambient air flask samples acquired at Lauder since May 2009, which allows a long-term assessment of the FTIR data set across annual and seasonal composition changes. Comparing FTIR and co-located flask measurements show that the bias (FTIR minus flask) for CH4 of −1.02 ± 2.61 ppb and CO of −0.43 ± 1.60 ppb are within the Global Atmospheric Watch (GAW)-recommended compatibility goals of 2 ppb. The N2O FTIR flask bias of −0.01 ± 0.77 ppb is within the GAW-recommended compatibility goals of 0.1 ppb and should be viewed as a serendipitous result due to the large standard deviation along with known systematic differences in the measurement sets. Uncertainty budgets for each gas are also constructed based on instrument precision, reproducibility and accuracy. In the case of CH4, systematic uncertainty dominates, whilst for CO and N2O it is comparable to the random uncertainty component.
The long-term instrument stability, precision estimates and flask comparison results indicate the FTIR CH4 and CO time series meet the GAW compatibility recommendations across multiple years of operation (and instrument changes) and are sufficient to capture annual trends and seasonal cycles observed at Lauder. The differences between FTIR and flask N2O measurements need to be reconciled. Trend analysis of the 10-year time series captures seasonal cycles and the secular upward trend of CH4 and N2O. The CH4 and CO time series have the required precision and accuracy at a high enough temporal resolution to be used in inversion models in a data-sparse region of the world.
- Article
(16372 KB) - Full-text XML
- BibTeX
- EndNote
With the ubiquitous upward trend in anthropogenic greenhouse gas emissions (Stocker et al., 2013), there is increasing environmental and political impetus to respond. Under Annex 1 of the United Nations Framework Convention on Climate Change, participating governments are required to report annual greenhouse gas emission inventories. There is an increasing need to verify this bottom-up emission inventory approach with top-down approaches (Weiss and Prinn, 2011; Leip et al., 2018). A top-down approach is achieved by combining atmospheric greenhouse gas concentration (mole fraction) measurements and numerical atmospheric transport modelling, so that surface flux estimates can be inferred. Top-down approaches have already been undertaken to quantify national surface flux inventories of the main greenhouse gases (CO2, CH4 and N2O) via national surface in situ networks as in Peters et al. (2007), Ganesan et al. (2015) and Henne et al. (2016), or pan-national inventories using international greenhouse gas monitoring network databases (e.g. Cressot et al., 2016; Bergamaschi et al., 2015, 2018; Pison et al., 2018). There is also a need for increased coverage in the Southern Hemisphere (Thompson et al., 2014; Wells et al., 2015), which is relatively data sparse compared to the Northern Hemisphere.
The National Institute of Water and Atmosphere (NIWA) Lauder atmospheric research station was established in 1961 for photometric observations of aurora airglow emission. The site was selected due to its relatively cloudless skies unaffected by light pollution and a lack of air pollution. These conditions also make it an ideal site for clean-air trace gas observations. Atmospheric trace gas time series measurements started in the 1980s. The current research focuses are on greenhouse gases, ozone depletion and UV/visible radiation. Lauder is a founding station in the Network for the Detection of Atmospheric Composition Change (NDACC), Total Carbon Column Observing Network (TCCON) and GCOS (Global Climate Observing System) Reference Upper Air Network (GRUAN) networks. It is also part of the Baseline Surface Radiation Network (BSRN) and is the primary New Zealand GAW station (GAW site ID: LAU).
The original reason for the establishment of greenhouse gas in situ measurements at Lauder were two-fold. First, with the establishment of a TCCON site at Lauder in 2004 (Wunch et al., 2011; Pollard et al., 2017) it was an initial requirement that sites have co-located continuous high-precision surface in situ measurements of CO2 and CH4. This was to provide a priori surface concentration constraints for the TCCON total column dry mole fraction retrievals and provide an independent estimate of boundary layer CO2 and CH4. Second, it was to provide a complementary in situ measurement site to that at Baring Head, New Zealand (41.41 S, 174.87 E, 85 m a. m. s. l.) (Brailsford et al., 2012) as a first step in a New Zealand carbon monitoring network. Measurements from these two sites have been used in a regional atmospheric inversion method determining CO2 sinks and sources across New Zealand (Steinkamp et al., 2017).
A continuous in situ sampling system based on closed-cell Fourier transform mid-infrared spectroscopy (Griffiths and de Haseth, 2007) was chosen. The system selected was designed and built at the University of Wollongong (UoW) (Griffith et al., 2012; called G12 from now on). The FTIR can measure CO2 (including isotopologues 12C-CO2 13C-CO2 and 18O-CO2 independently), CH4, N2O and CO dry mole fractions simultaneously with precision approaching and/or exceeding the GAW-recommended compatibility goals (GAW, 2016). Measurements of N2O, CO and 13C-CO2, in addition to CO2 and CH4, have several benefits as 13C-CO2 and CO provide additional information concerning carbon cycle source and sink attribution (van der Velde et al., 2018; Oney et al., 2017). N2O measurements in conjunction with CO2 measurements allow estimation of surface N2O flux emissions (Kelliher et al., 2002; Laubach et al., 2016), which is pertinent given New Zealand's greenhouse gas emissions profile (MfE, 2017).
The Lauder FTIR was one of the first generation of UoW FTIR systems using the Bruker IRcube FTIR spectrometer (Bruker Optics, Germany). The Lauder FTIR is of the same vintage as those deployed at the Darwin TCCON site (Deutscher et al., 2010a), Cape Grim (Griffith et al., 2011), University of Wollongong (Buchholz et al., 2016), and is similar to the system operated at the University of Heidelberg Institut für Umweltphysik (IUP, Hammer et al., 2013a, called H13 from now on). In 2013 the UoW FTIR system was commercialised in a joint venture between UoW and Ecotech (Australia) and marketed under the name Spectronus.
Previous work has characterised the performance and data quality of the UoW FTIR systems on timescales ranging from short-lived field campaigns and up to 4 years. H13 provided an extensive performance evaluation of the IUP FTIR in laboratory- and campaign-based studies over a period of 8 months. Comparison of the FTIR performance to other in situ instrumentation has also been conducted in Griffith et al. (2011), Hammer et al. (2013b), Vardag et al. (2014) and Lebegue et al. (2016). CO performance has only been evaluated by Griffith et al. (2011), with inconclusive results due to variable CO amounts in the calibration tank, resulting in poor accuracy. In all these studies, CH4 mean differences were within the GAW compatibility recommendations, whereas for CO2 and N2O differences were overall marginally higher than the recommendations. Only in Lebegue et al. (2016) was the FTIR operated for longer than a year. The Lauder FTIR was part of a GAW quality assurance strategy performance audit using travelling standards (Zellweger et al., 2016) in which it was the only FTIR. The audit results show the FTIR CO2 and CH4 measurements to be comparable to other measurement types (N2O and CO were not assessed). Other studies have shown the durability and reliability of the FTIR during field campaigns (Deutscher et al., 2010b; Laubach et al., 2016; Sonderfeld et al., 2017).
Despite this promising work, questions remain concerning FTIR performance and stability over longer time periods, such as multiple years to decades. Proven reliability over such periods is required if the FTIR is to be deployed as part of long-term monitoring networks. Studies by Buchholz et al. (2016) and Té et al. (2016) both use data from the two FTIRs operated at UoW with a combined duration of 3.3 years. The longest continuous FTIR temporal data set published to date is 4 years in length (Vardag et al., 2016).
In this study we investigate the Lauder FTIR CH4, CO and N2O precision, repeatability and accuracy over 10 years of operation. We also comment on the reliability of the FTIR, looking at more day-to-day operational issues than previous studies, such as regular maintenance, instrument failures and areas for potential improvement.
The FTIR measurements are then compared to co-located flask air-sample measurements, which were initiated to provide a cost-effective independent data set. Simplistic time series analysis is performed to provide an estimate of the annual trend and seasonal cycles and to ascertain if the FTIR can observe such atmospheric change on such timescales. Investigation into the FTIR CO2 and δ13C-CO2 measurement performance along with comparisons to co-located independent CO2 (Steinkamp et al., 2017) and δ13C-CO2 measurements will be reported in a separate study.
In Sects. 2 and 3 we describe the Lauder atmospheric research station and the in situ instrumentation at the site. Section 4 details the air inlet sampling system, common to all in situ sampling instruments. In Sect. 5 we introduce the FTIR, describe significant upgrades to the instrument and issues associated with its operation. We assess the long-term stability of precision and accuracy, along with calibration methods. Uncertainty budgets are also constructed. In Sect. 6 we detail the Lauder flask sampling programme and then compare the FTIR to flask measurements in Sect. 7. In Sect. 8 we perform a simple trend analysis on calibrated FTIR air-sample data taken in baseline conditions and deduce annual trends and seasonal cycle for each species. In Sect. 9 we offer a concise summary of the work undertaken.
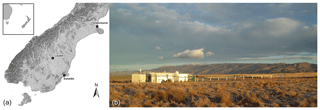
The Lauder atmospheric research station (45.038∘ S, 169.684∘ E, 370 m a. s. l.) is in Central Otago, South Island of New Zealand (see Fig. 1). A description of the geography of the site and surrounding region is given in Steinkamp et al. (2017) and Pollard et al. (2017). The station is located in a broad valley surrounded by pastoral farmland with low stock density, with no nearby industrial emission sources. Clear skies, low viewing horizon geometry and lack of air pollution were the original reasons for the site selection. The nearest town, Alexandra, is 35 km to the south and has a population of approximately 5300. The climate is considered semi-arid and continental. Westerly winds dominate the wind flow over the South Island of New Zealand. At Lauder, predominant moderate breezes (greater than 5 m s−1) are from the west, whilst nocturnal light breezes are mainly from the north-east, downvalley. Lauder air history maps calculated from back-trajectory analysis (Steinkamp et al., 2017) show that much of the sampled air originates (since last boundary layer contact) from the western coast of the South Island, a heavily native forested region. All these conditions make Lauder an ideal site to take baseline measurements (baseline conditions are defined in Appendix D).
In situ ground-level greenhouse gas measurements started at Lauder in August 2006 with the installation and commissioning of the FTIR. This was followed by installation of a NDIR Licor-7000 instrument in June 2008 to provide CO2 comparison measurements (Steinkamp et al., 2017). A flask sampling system was added in May 2009. Flask air-sample analysis provides cost-effective independent measurements of CH4, CO and N2O and additionally provides another independent in situ CO2 and δ13C-CO2 data set. It is planned that all three measurement systems continue to operate in parallel into the foreseeable future. A description of the air inlet system, FTIR and the flask sampling system will be given in the next three sections. A set of meteorological sensors were added to the in situ sampling mast in September 2008 to provide wind, temperature and humidity measurements at different heights. Prior to this, meteorological data from the Lauder NIWA climate station were used, located 90 m from the mast. The in situ sampling instruments are housed in a temperature-controlled building (see Fig. 1b). The 10 m high in situ sampling mast is located 33 m to the north of the building to minimise the impact of southerly wind flow disturbance.
A detailed description of the current air inlet system and meteorological sensors can be found in Appendix A of Steinkamp et al. (2017). The original air-sampling system consisted of 60 m of 3∕8 inch copper tubing, 30 m of which was underground. The inlet on top of the sampling mast was connected directly to the FTIR. A moisture trap was located at the base of the sampling mast. With the installation of the Licor-7000 in June 2008, a 4-port manifold and roughing pump were added; thus both instruments use a common sampling line. With this system air is drawn from the 10 m inlet height at a rate of 10–15 L min−1. Residence time is approx. 35 s. Manifold pressure is typically 40 hPa below atmospheric pressure. Manifold pressure is monitored with an analogue mechanical vacuum gauge. Four 1∕4 inch stainless steel (SS) tubes are welded perpendicular to the main body of the manifold, providing connection points for sampling systems, each with a terminating ball joint valve. Swagelok components and joins are used throughout. Short lengths of polytetrafluoroethylene (PTFE, a.k.a. Teflon) tubing are used to connect instruments to the manifold to electrically isolate them from the mast to minimise potential lightning strike damage. The copper tubing was replaced with 3∕8 in SS tubing in November 2012. This tubing is all above ground. It should be noted that the air inlet delivery system does not dry the air; this is done on an instrument-by-instrument basis. A flask sampling system was installed in May 2009. With all three in situ instruments connected to the manifold the total maximum draw is 8.1 L min−1 (3.5 L min−1 FTIR, 2.6 L min−1 Licor-7000 and 2.0 L min−1 flask sampling). This combined instrument draw is less than the manifold flow. Instrument cross sampling is not a concern.
In this section we outline how the FTIR works, routine operation, calibration procedures and detail instrument upgrades over time. Long-term FTIR performance is evaluated, i.e. reliability, accuracy, precision and repeatability.
The Lauder FTIR is based on FTIR systems described in Griffith et al. (2011), G12 and H13. A complete description can be found in these references. It was the second FTIR built at the University of Wollongong (UoW) chemistry department using the Bruker IRcube, with a thermoelectrically cooled mercury cadmium telluride (HgCdTe) detector. These components supplanted a previous FTIR system based on a Bomem MB100 (ABB Bomem, Canada) interferometer and a HgCdTe detector cooled with liquid nitrogen (Esler et al., 2000). These changes made the FTIR more reliable, with less operator intervention and with greater measurement precision. Many significant changes to hardware, data acquisition and spectral processing have happened during instrument deployment at Lauder, and these are described in detail in the following sections.
5.1 Hardware
The FTIR analyser was originally installed in late August 2006 followed by a 4-month commissioning phase in which acceptance testing was performed along with training in instrument operation and data analysis. Continuous air-sample measurements started in January 2007. Since installation, the FTIR has undergone several improvements in both hardware and software since that time. We first describe the original configuration and those components which have not changed, then incremental improvements over the 10 years of operation (January 2007–December 2016).
The unchanging core of the FTIR analyser consists of a Bruker IRcube interferometer (CaF2 beam splitter, resolution 1.0 cm−1) coupled to a 3.5 L glass White multi-pass cell (PA-24, Infrared Analysis, USA). The IRcube has an internal globar, mid-infrared radiation, which passes through the cell, traversing an optical path of 24 m. A thermoelectrically cooled HgCdTe detector (Teledyne Judson Technologies, USA) measures mid-IR radiation over the wave number range 1750–6750 cm−1. Interferogram acquisition and spectrum calculation is performed through Bruker's proprietary acquisition software, OPUS and the analyser's data acquisition software (described below). The IRcube and cell transfer optics are continually purged with dry nitrogen (100 mL min−1) to displace the relatively humid room air and prevent build-up of CO in the optical path outside the cell.
The FTIR enclosure is thermostatically controlled, with a manual set point at 34.0 ∘C. Cell temperature was originally monitored with a LM335 integrated circuit sensor attached to the outside of the cell (resolution 0.1 ∘C), later replaced with more precise in-cell temperature sensors as described further below. The cell pressure is measured with a piezo transducer (model series 902, MKS Instruments, USA, resolution 0.13 hPa). The measured cell temperature and pressure are used in quantitative spectral analysis and in the subsequent conversion of the retrieved concentrations to mole fractions.
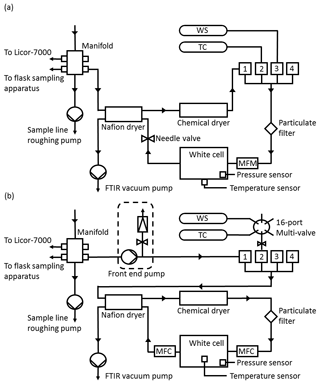
Figure 2(a) Simplified Lauder FTIR gas schematic prior to upgrades. WS is the working standard, TC is the target cylinder and MFM is the mass flow metre. (b) Schematic of FTIR gas handling after the September 2013 upgrades. MFC is the mass flow controller.
A schematic of the initial FTIR gas handling system is presented in Fig. 2a. The gas handling system delivers gas to the cell from one of four software-selectable inlet valves, two of which were passed through a drying system as described below and two of which were undried by the analyser. Originally, there were two air inputs, the air-sample line and a working standard (WS), which is used as part of the calibration procedure. A target cylinder (TC) was later added to provide a means with which to monitor FTIR reproducibility and accuracy. Air samples passed through the drying system, whilst WS and TC tank air remained undried by the analyser (both WS and TC are dried at the point of collection). Dual-stage scientific regulators (model 1-SS30-590-D4T, Scott Marrin Inc., USA) provide a step down from the cylinder pressure of 2000 psig to a stable low side pressure in the range of 5–20 psig.
Electronically actuated solenoid valves (models 6013 and 6014, Burkert, Germany) controlled by the FTIR data acquisition software allow manipulation of gas flow and delivery. Air samples are dried using a 24-inch Nafion dryer (model MD-070, Permapure, USA) in series with the chemical desiccant anhydrous magnesium perchlorate (Mg(ClO4)2). The backflush for the Nafion dryer was provided by the (dried) sample air exiting from the measurement cell at reduced pressure. Air samples are dehydrated to less than 20 ppm. Cylinder gases were not dried. All gases pass through a 7 µm particulate filter prior to reaching the White cell. A vacuum pump (model MV2NT, Vacuubrand, Germany) at the exit to the cell and Nafion backflush provides the required pressure gradient to allow gas flow, to evacuate the cell for spectrum background measurement and to provide the Nafion dryer backflush.
Measurements are taken in two modes of operation: static mode and flow mode. In static mode, the cell is evacuated, then filled with gas to a defined pressure. The cell is then closed, and spectral measurements are made. In flow mode, gas is continually drawn through the cell at a set flow rate, whilst spectral measurements are made. In the initial instrument configuration, in flow mode the flow rate was controlled by a manual set needle valve located downstream of the cell and the flow rate was monitored by a mass flow metre (model 820 series, Sierra instruments, USA). In flow mode the cell pressure and flow are not independent. Reducing the flow increased cell pressure and vice versa. The cell pressure was also proportional to the input delivery pressure. In addition, the magnesium perchlorate solidifies over time as the desiccant dehumidifies gas, reducing both flow and pressure in the cell. There is a slow constant change in cell pressure and flow. Due to the air-sampling configuration at Lauder sample air is measured in flow mode. Cell pressure is in direct proportion to the inlet manifold pressure, which in turn is proportional to atmospheric pressure. Cylinder gas measurements are conducted in static mode to reduce gas consumption. The static mode cell pressure set point is altered at regular intervals to be similar to cell pressure during sample air measurements. This is done to reduce residual pressure sensitivity (RPS) (detailed in Sect. 5.6.1).
The data acquisition system is the same as that described in G12. The entire analyser is controlled by the custom coded software (Oscar, V9.1.8) developed at the UoW. Oscar is written in Visual Basic 6. It schedules the measurements, gas input selection, operates the gas handling valves, logs instrument parameters (pressure, temperature and flow) and interacts with OPUS. Oscar also actuates the spectral retrieval analysis software to perform real-time processing after each measurement. Details about the spectral retrieval software are given in Sect. 5.5.
5.2 Significant instrument changes
There have been continual improvements to the FTIR and air inlet systems over the working lifetime of the instrument at Lauder, some of which have been incorporated into the current commercial design. The upgrades have all led to an improvement in cell temperature and pressure stability. The main improvements were replacing the external cell temperature sensor with a high-resolution sensor located inside the cell, independent control of cell pressure and flow rate, rerouting of internal tubing, so that cylinder gas and air samples are all treated equally and dried, and lastly, there is a front-end pump to deliver sample air at a constant pressure.
5.2.1 Monitoring cell temperature
Cell temperature was originally monitored using a sensor based on a generic LM335 integrated circuit attached to the outside of the cell. It had a resolution of 0.1 ∘C. This approach assumes that the external cell wall temperature is the same as the gas in the cell, and the cell wall is unaffected by the temperature of the FTIR enclosure. Alone, the coarse resolution of the LM335 introduces a non-insignificant uncertainty in the retrieved N2O dry mole fraction of approx. 0.1 ppb at 320 ppb (at typical cell pressure and temperature) but less significant for CO (approx. 0.02 ppb at 60 ppb) and CH4 (approx. 0.6 ppb at 1800 ppb). In September 2010, a PT100 (tolerance class F0.15) resistance thermometer detector was inserted into the cell to measure gas temperature in vitro. The PT100 is coupled to a PR4114 universal transmitter (PR Electronics, Denmark), providing a temperature resolution of 0.002 ∘C. This allows a more precise and responsive direct measurement of the gas temperature in the cell.
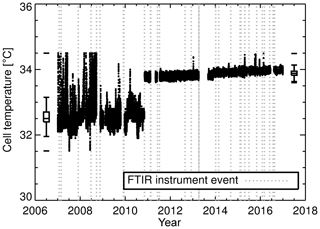
Figure 3Cell temperature measurements. From January 2007 to September 2010 cell temperature measurements were made with an LM335 integrated circuit sensor attached to the outside of the cell. The in vitro PT100 temperature measurements started in September 2010 and then were replaced with a Type-J thermocouple in April 2013 (measurements outside the range 31–35 ∘C were filtered out). Box plots provide a statistical summary prior to and post the LM335 temperature sensor change. The box spans the interquartile range. The median is marked by a horizontal line inside the box. The whiskers are the two horizontal lines joined to the outside of the box and represent 1.5 times the interquartile range added to (subtracted from) the median. The unconnected horizontal line above (below) the whisker is the maximum (minimum) observation. Vertical grey dashed lines indicate an event in which changes to FTIR hardware, operating conditions or analysis were made (FTIR instrument events explained in Sect. 5.10).
Figure 3 clearly shows a change in recorded cell temperature when the sensors were swapped in September 2010. There is a significant bias (approx. 1.3 ∘C) between the two temperature measurements. This is not of concern as the bias is systematic and compensated for during the calibration process. The 1σ standard deviation (1σ) in the PT100 is 0.05 compared to 0.3 ∘C for the LM335. The PT100 is more stable and less susceptible to changes to FTIR enclosure temperature fluctuations and more indicative of cell gas temperature. As part of the April 2013 upgrade, the in vitro PT100 was replaced with a Type-J thermocouple. Even though the thermocouple has a faster response time, no significant changes in temperature precision were seen.
5.2.2 Independent control of cell pressure and flow rate
In the initial instrument configuration, in flow mode cell pressure and gas rate flow are coupled so that adjusting one affects the other. Control of either was by manual adjustment of the needle valve located downstream of the cell (Fig. 2a). The cell pressure during sample air measurements is dependent on the air inlet system manifold pressure which in turn is proportional to atmospheric pressure. As the desiccant solidified, it also caused a reduction in both cell pressure and flow. Continual adjustment was required to keep both cell pressure and flow within a given range. More importantly, since the WS is measured in static mode, and the cell is filled to a defined pressure, there was always a difference between sample air and calibration gas pressures. Differences up to 50 hPa were common.
The solution to decoupling cell pressure and flow and providing cell pressure stability was to replace the needle valve and mass flow metre with two mass flow controllers (MFC, model 3660, Kofloc, Japan). One MFC was installed upstream of the cell and the other downstream, as shown in Fig. 2b. The upstream MFC controls the flow rate through the cell, whilst the downstream MFC is constantly adjusted via a proportional–integral–differential control loop to maintain constant cell pressure. The upgrades also correct for the reduction in flow and pressure due to the desiccant solidifying. Cell pressure and flow rate can be set independent of each other. The upgrade was done in April 2013. The effect of this change is seen in Fig. 4a. Prior to the upgrade the standard deviations in cell pressure and flow were 36 hPa and 0.03 L min−1 respectively. After the upgrade cell pressure and flow standard deviations were 0.001 hPa and 0.005 L min−1. There is also a significant reduction in sample air cell pressure and calibration gas cell pressure bias (Fig. 4b). The bias reduces to 0.02 hPa, resulting in a negligible pressure residual cross-sensitivity correction (see Sect. 5.6 for more details).
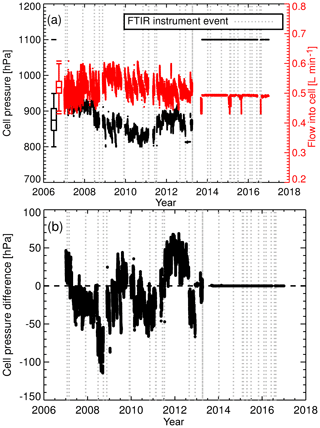
Figure 4(a) Cell pressure (black) and cell flow rate in flow mode (red) during air-sample measurements. After the April 2013 upgrade, the flow rate is set to 0.5 L min−1 and cell pressure is set to 1100 hPa. The sudden drop in flow rate on three occasions (post upgrade) are due to MFC power supply faults. Data taken during such faults are filtered out. Overlaid are box plot statistical summaries for cell pressure and flow rate prior to the April 2013 upgrade. (b) Difference between air sample and WS cell pressure.
5.2.3 Inlet port reconfiguration
During the April 2013 upgrade the inlet port lines were reconfigured so that all four inlet lines are equivalent and pass through the internal drying system (Fig. 2b). This allows cylinder gas to be dehydrated to a level equal to that of the air samples. Prior to this change, it was assumed that the cylinder gas was pre-dried, or an external drying system was required. Differences in water content can introduce measurement biases, such as those encountered in Zellweger et al. (2010).
5.2.4 Addition of a front-end pump to provide a stable inlet pressure
A FTIR front-end pump (model N86KNE, KNF Neuberger, Germany) was added in September 2013. It is placed between the air-sampling inlet manifold and the FTIR inlet ports (Fig. 2b). The purpose of the front-end pump is two-fold: to provide additional sample delivery pressure stability and to increase cell pressure above that deliverable by the air inlet sampling system. With the new front-end system, cell pressure is set to 1100 hPa for air-sample measurements (standard operation conditions will be described in the next section). Operating with a cell pressure above atmospheric pressure provides positive pressure, making leak detection easier and minimising the effects of any leaks. The signal-to-noise ratio (SNR) also increases due to increased absorption.
5.3 Standard operating conditions
Overall, routine operation of the FTIR has remained very much unchanged since measurements started. Whilst upgrades have contributed to changes in operating procedures, the underlying instrument set-up has been stable. The FTIR is configured to continuously measure air samples interspersed with regular cylinder measurements for calibration and quality assurance. This is one of the simplest FTIR configurations the FTIR can be deployed in (other deployment configurations are described in G12).
Air sample measurements are taken in flow mode. Air is drawn into the White cell at 0.5 L min−1 at the defined pressure (originally 870 hPa, then 1100 hPa after the April 2013 upgrades). At a rate of 0.5 L min−1 and with the White cell volume of 3.5 L, the e-folding time (Winderlich et al., 2010) is approx. 7 min, meaning sequential flow mode sample measurements (10 min averages) are not completely independent of each other. FTIR temperature is stabilised at 34.0 ∘C ± 0.2. The heater unit has a duty cycle of approx. 40 %.
The spectra acquisition settings have remained unaltered over the entire period. Spectra acquisition consists of 721 co-added scans averaged over 9.5 min. All spectra are taken with a resolution of 1.0 cm−1 and with an aperture of 1.5 mm. The effective field of view is 21.7 mrad (full angle). The Happ–Genzel apodisation function is applied to the collected interferogram with a Mertz phase correction. The spectra also exhibit minor etalon channelling of approx. 0.005 % signal strength with a period of approx. 5 cm−1. The channelling is stable in both period and amplitude and is inconsequential but is a noted feature that should be diagnosed in each FTIR. The resulting spectra have an SNR of the order of 15 000–20 000.
Real-time quantitative spectral analysis occurs after each spectrum collection (details in Sect. 5.5). This takes approx. 30 s, giving an overall collection and processing time of just under 10 min, resulting in 144 measurements per day (if no calibrations are performed). Scheduling is organised into 30 min cycles, with three 10 min sample measurements per cycle. Each spectrum is saved with a unique file name and the results of the spectral analysis are added to a daily summary file. The results are also displayed in real time (updated every 10 min). Whilst the displayed results of the spectral analysis are not calibrated, they are an extremely useful diagnostic.
Up until February 2014 calibrations were performed daily. The calibration procedure consists of two parts, background spectrum collection followed by WS measurements. WS spectra acquisition parameters are identical to those used in sample air measurements. A background spectrum is measured after evacuating the cell to approx. 1 hPa, or until 180 s has passed, whichever is reached first. The background spectrum is then stripped of remnant water absorption features (explained in Appendix B). During the 9.5 min background spectrum acquisition sample air is continuously drawn through the FTIR system via bypass tubing. This flow keeps the sample desiccated and at a stable temperature. The acquired background spectrum is subsequently used to produce both sample and calibration transmission spectra.
On completion of a background spectrum measurement, the WS tank is measured in static mode. Static mode is used to reduce gas consumption, as each cell fill uses approx. 3.5 L of gas. Prior to WS tank measurement, the cell is flushed with 200 hPa of WS gas, then the cell is re-evacuated to 1 hPa and filled to the prescribed pressure set point. In this double stage evacuation, the prior sample memory effect is less than 0.001 %. Filling takes approx. 60 s. A latency period of 60 s after filling allows the cell pressure and temperature to stabilise, reducing the effects of thermodynamic disequilibrium (H13) after which spectra are acquired, saved, analysed and results are written to a daily file. A single 10 min WS spectrum is acquired and analysed. The resulting data are then used in post-processing calibration procedures. The entire calibration cycle (background and WS measurements) takes approx. 25 min, fitting into the 30 min cycle block.
Sample measurements resume after the calibration. The cell is evacuated, flushed with sample air, then filled to the prescribed pressure set point and allowed to settle using the same procedure as in the WS measurements. Flow mode is then activated and sample spectra are acquired. The first spectrum acquired after calibration is filtered out of the final processed data set as the water content is greater than normal due to the cell still not reaching moisture equilibrium.
TC measurements are conducted in the same manner as WS measurements, except a background spectrum is not taken. When daily TC measurements started there was a reduction in sample collection time by another 30 min. Overall, in each 24 h period, 1.5 h were used in calibrations activities. Calibrations were scheduled to be performed at 02:00 to avoid interfering with the daytime sample collection. Under this calibration regime it took approx. 1.5 years before the WS and TC tanks reached a pressure of 500 psig. At 500 psig, the tanks are replaced.
The FTIR upgrade in April 2013 allowed significant changes in the calibration procedure. In February 2014, a new calibration procedure was constructed to allow flow mode calibration and TC measurements every week. The change from daily to weekly calibrations is within the recommendations of H13. Flow mode calibrations align the tank measurement procedure with that of air-sample measurements. Background spectrum acquisition remains unaltered, after which the evacuated cell is filled with tank gas to 1100 mb over a period of 420 s. A latency period of 300 s follows. The combined slower fill rate and longer settling time allow cell temperature and pressure to stabilise with a significant reduction in thermodynamic disequilibrium. The effect of thermodynamic disequilibrium has a minimal impact on CH4, CO and N2O spectral analysis but is significant for CO2. Additionally, during the change from static to flow calibrations, there were no statistically significant differences in CO and N2O WT measurements. There were statistically significant differences in CH4 WT measurements. Tests conducted showed static-flow biases ranging from −0.3 to 0.45 ppb. The reasons for the spread in the bias are unknown. We have included an additional random uncertainty term of 0.5 ppb prior to February 2014 in the CH4 WT uncertainty budget calculation to account for the fact that measurements were taken in flow mode, whilst calibrations were conducted in static mode.
Once the cell is filled, tank gas flows at a rate of 0.5 L min−1 during which spectra measurements are taken. Four 10 min spectra are collected. The first is not used, effectively allowing another 10 min for the FTIR to stabilise. The entire calibration process takes 1.5 h using approx. 24 L of WS gas, which is equivalent usage to a week of daily static mode calibration measurements. Also, a collection of three sequential WS tank measurements (compared to the previous single static mode measurement) allows calibration reproducibility to be assessed. TC measurements are also conducted every week in flow mode. This takes an additional 1 h, making a total of 2.5 h per week for calibration and quality assurance checks.
In this configuration the FTIR can operate autonomously for a week. User intervention is required each week to start the combined WS and TC calibration measurement schedule and, once that is completed, to restart routine air-sample line measurements. Extended periods of automation are possible (such as at remote unmanned sites) with different measurement schedules, but given that the FTIR is located on-site and is accessible, regular checks and intervention are not an issue. Details on routine maintenance can be found in Appendix E.
5.4 Interferometer performance
There has been no published long-term performance evaluation of the Bruker IRcube as part of the FTIR system. Assessing the quality of the acquired interferograms and associated spectra assists in diagnosis of instrument issues. Changes in spectral SNR and/or instrument line shape (ILS) degradation will propagate through to spectral analysis; hence they retrieved cell gas dry mole fractions. Since changes in the IRcube will equally affect both sample and calibration spectra acquisition, the calibration procedure will mitigate such effects, but will also mask them; thus only by looking at the raw data will we be able to assess instrument spectral acquisition performance.

Figure 5(a) Bruker IRcube interferogram ZPD signal and the mean signal level of the associated spectra calculated over the range 2450–2550 cm−1. (b) Spectra SNR over the range 2450–2550 cm−1. The 2450–2550 cm−1 region was selected due to a lack of absorption features and is representative of the spectrum continuum level. (c) Fitted spectra phase and FOV.
For diagnostic purposes, WS tank interferogram and spectra signal levels, SNR and ILS parameters are calculated. These are displayed in Fig. 5. Over the 10 years of operation, the interferogram zero-path difference (ZPD) intensity has been dropping, interspersed with periods of stepwise gains. The stepwise gains are associated with laser replacements and resetting of the ZPD reference position. The cause of the continual decline in ZPD intensity is unknown, but to speculate, it could be degradation in the mid-infrared (MIR) global intensity, internal optic transmittance or CaF2 beam splitter transmittance. As expected, the associated interferogram spectrum mean signal level is also declining but does not have piecewise steps as the spectrum is normalised in the Fourier transform. Both SNR and spectrum signal level vary slowly, indicating good reproducibility and stability. Considering that the mean signal level decreased over time it is interesting that the SNR increased, indicating that the reduction in noise was greater than signal degradation with an unknown cause.
The field of view (FOV) and spectrum phase are fitted to monitoring of linewidth and asymmetry. The ILS modulation efficiency is not retrieved. The FOV is fitted instead, as this gives more consistent and lower fit residuals whilst effectively acting as an ILS diagnostic, i.e. changes in the fitted FOV are indicative of an ILS alignment, acquisition or analysis issue. The fitted FOV and phase are displayed in Fig. 5c. There is a gradual decline in phase, but the overall phase is very small (< 0.01 rad), indicating a stable near-symmetric ILS. The small step changes in phase are related to a change in the cell temperature sensor, laser replacement and operation of the FTIR with a different FOV. The theoretical FOV of the IRcube is unvarying at 21.73 mrad (apart from a brief testing period in mid-2011). Prior to September 2011 the calculated FOV was lower than expected but still stable. This was because the background spectra acquisition aperture setting (3 mm) differed from the sample spectra acquisition aperture setting (1.5 mm). The background aperture size was set to 1.5 mm in September 2011. After this change, the fitted FOV agrees well with the physical FOV.
A decade of IRcube diagnostics illustrates the stability of the interferometer. To date, replacing the internal metrology laser (detailed in Appendix E4) is the only regular maintenance required. The IRcube failed once due to a burnt-out resistor in the 24 VDC detector power supply rail. Apart from this, no other components have needed replacing.
5.5 Quantitative spectral analysis
Only a summary of the FTIR quantitative spectral analysis method is given as a succinct introduction and is provided in G12 with detailed descriptions in Griffith (1996) and Griffith et al. (2003). Details specifically related to the Lauder FTIR spectral analysis will be covered.
Cell gas column concentrations (mol m−3) are calculated from the spectra by iterative non-linear least squares fitting of the measured spectrum with that of the forward-modelled theoretical spectrum. The code used to perform this analysis is called MALT (Multiple Atmospheric Layer Transmission) (Griffith, 1996). Input parameters to MALT include the instrument line shape function (ILS), cell optical path length, cell pressure and temperature, an a priori estimate of gas mole fractions and absorption line parameters sourced from the HITRAN 2004 database (Rothman et al., 2005). On a spectrum by spectrum basis, all inputs and a priori values to MALT remain constant except for cell pressure and temperature (which are specified, not fitted). Broad spectral regions of 100–200 cm−1 are analysed. The selected spectral analysis regions are optimised per species. The retrieval strategies used at Lauder are the same as in G12. The retrieved cell gas species concentrations are converted to mole fractions using the ideal gas law (G12 Eq. 1), then to dry air mole faction (χdry) using Eq. (2). in G12. All subsequent analyses are conducted using χdry unless otherwise stated.
Successive versions of MALT (from V5.3 to the current V5.5) have been used as part of the Lauder FTIR system. MALT input files are edited to match the Lauder FTIR physical parameters (i.e. field of view, spectral resolution, cell optical path length). There have been two main changes to the retrieval strategy: (1) a reduction in CO and N2O residual cross sensitivity to 12CO2 by fitting CO and N2O in a different spectral region. This also has the fortuitous effect of reducing N2O non-linear cross sensitivity to cell pressure and (2) improved spectral fitting of water vapour in background spectra. Details of these two changes are found in Appendices A and B.
5.6 Residual cross sensitivities
As detailed in G12 and H13, the calculated raw (pre-calibrated) species dry mole fractions have a small non-trivial residual dependence on the input parameters used in the quantitative spectral analysis. These empirical residual cross sensitivities (RCSs) are attributed to imperfections in the measured spectra, systematic uncertainties in the spectroscopic database, the spectral analysis procedure and uncertainties (systematic and random) in temperature and pressure measurements.
For each species, the RCS for each parameter, i.e. cell pressure, cell temperature, cell flow and water vapour, as well as species cross-sensitivity, need to be experimentally derived. From these experiments a simple linear regression is sufficient to parameterise the RCS (H13). The calculated RCS is then used to calculate a correction to be applied to the measured dry mole fraction, as in Eq. (1). Where χrcs_corr is the corrected dry air mole fraction, χdry is the raw spectra dry mole fraction, RCSz is the residual cross-sensitivity term between χdry and parameter Z. Zo is the reference parameter amount. In our application, we use the most recent calibration parameters as Zo; thus all corrections are relative to the conditions calibrations were taken in.
Results from extensive tests by H13 (Table 1 in H13) give an indication of expected RCS values. Caution should be taken as such RCS values are not generic and should only be applied to FTIR systems of the same model and analysis software. This is because RCSs differ depending on sensor placement (H13), cell wall effects introducing water vapour hysteresis and a dependence on the spectroscopic database used. The Lauder FTIR has sufficient differences to that used by H13 to warrant the need for experimental derivation of RCSs. In all instances it is best to minimise RCS corrections by making sure standard operating conditions are as stable and similar as possible across both sample and calibration measurements.
For the Lauder FTIR, only cell pressure RCS is used. All water and cell temperature RCS experiments were inconclusive due to the demanding nature of the tests, which could not be resolved. In both cases uncertainty in the results were too large, the main issues being time lag and water vapour hysteresis. Given inconclusive results we decided to omit temperature and H2O RCS corrections. This is not uncommon: both H13 and Lebegue et al. (2016) also found such experiments challenging. With strict data quality assurance and quality control (QA–QC), based on cell temperature and retrieved water absolute amounts, along with the relative difference between sample and calibration amounts, the associated RCS corrections are minimised (QA–QC filtering detailed in Sect. 5.10). The difference between sample and calibration-retrieved H2O mole fractions (after QA–QC filtering) is −0.99 ppm ± 0.80. The difference in measured cell temperature between sample and calibration measurements is, prior to cell temperature sensor replacement, 0.04 ∘C ± 0.23, and after replacement, 0.08 ∘C ± 0.09.
We also decided to neglect flow rate RCS, more on theoretical grounds, as it induces a second-order temperature effect. Changes in flow rate affect the measured cell temperature if the flowing gas is of a different temperature to the cell equilibrium temperature. Temperature distribution in the glass cell is also flow dependent (turbulent mixing). Prior to the decoupling of the cell pressure and flow, the flow was 0.53±0.03 L min−1. After the introduction of the duel MFCs, it was 0.50±0.005 L min−1; thus any potential flow RCS correction is minimal.
5.6.1 Pressure residual cross sensitivity
Pressure RCS (RCSp) corrections need to be applied as cell pressure during sampling and calibration measurements differ up to 100 hPa prior to cell pressure and flow decoupling (Fig. 4a). Experimental determination of RCSp is performed by taking repeated measurements of dry cylinder air (usually the TC or WS) at different cell pressures and at stepped pressure increments, spanning the cell pressure operational range (see Table 1). Other factors such as cell flow rate and cell temperature are held as constant as possible. Multiple measurements per pressure step are taken and averaged. The RCSp is the gradient from a simple linear regression of the retrieved dry mole fraction (response) to the cell pressure (predictor). The linear regression includes errors in the measured pressure and dry mole fraction measurement spread. For example, Fig. A1b displays the retrieved N2O dry mole fraction as a function of cell pressure from tests conducted in December 2013. The resulting RCSp is 0.005±0.0008 ppb hPa−1 (from Table 1).
Table 1CH4, N2O and CO RCSp including values from H13 (1σ uncertainty in brackets). The dates of the experiments are given in the first column. In the second column are the pressure ranges and steps (bracketed) the experiments were conducted at. The experiment measurement modes are listed in the last column.

Experiments were repeated to assess the long-term stability of the RCSp in both modes of operation (static and flow) from 2009 to 2014. Table 1 lists the calculated RCSp for CH4, CO and N2O. The derived values are consistent over a 5-year time span, over differing pressure ranges, sampling modes and pressure sensor calibrations. We expected RCSp to remain relatively constant as the pressure sensor has not been changed or relocated in the cell. In any such change, RCSp needs to be revaluated. Experimentally derived RCSp are in good agreement with H13, except for CO values, which are of a magnitude less – this remains unexplained.
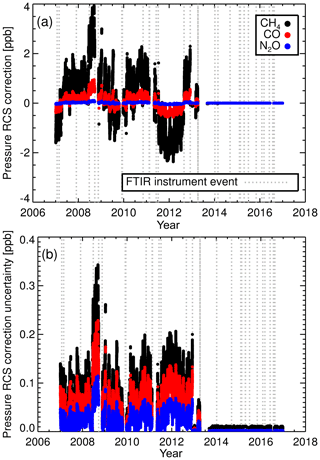
Figure 6(a) RCSp corrections applied to the calculated CH4, CO and N2O dry mole fractions and (b) associated correction uncertainties.
Figure 6a illustrates the calculated RCSp corrections applied to sample air dry mole fractions when using RCSp values of 0.034, 0.0009 and 0.005 ppb hPa−1 for CH4, CO and N2O. After the decoupling of cell pressure and flow in April 2013 the sample and calibration cell pressures are effectively the same; thus RCSp corrections are very small. The RCSp correction uncertainty is calculated by employing the ubiquitous propagation of error formulas (Ku, 1966) using the uncertainty of the calculated RCSp and the resolution of the pressure sensor. The associated uncertainties are displayed in Fig. 6b. The dominant component in the uncertainty is the RCSp uncertainty, not the pressure sensor uncertainty. We see that calculated CH4 RCSp correction uncertainty is of an order of magnitude less than the correction factor, but comparable for N2O and CO.
5.7 Measurement repeatability
As in G12 and H13 we quantify the precision of the FTIR in terms of measurement repeatability (GAW, 2011). Successive repeatability tests over time are used to observe and assess changes in instrument precision. Such tests are an indication of measurement short-term stability. Repeatability, over a given averaging time, is calculated as the standard deviation of duplicate measurements of a gas sample of unaltering composition taken under constant conditions (i.e. cell pressure, cell temperature and cell flow rate).
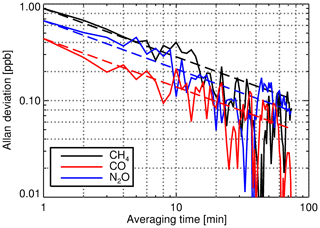
Figure 7CH4, CO and N2O Allan deviations calculated from the February 2015 repeatability experiment. The data set consists of 170 consecutive 1 min spectra acquired during measurement of the TC under standard operating conditions (cell pressure is 1100 hPa, cell temperature is 33.85 ∘C and flow rate is 0.5 L min−1). The dashed lines represent the Gaussian-noise-limited Allan deviation using the derived Allan deviation of the smallest temporal increment (1 min) as the basis.
Lauder FTIR repeatability experiments were performed by taking repeated 1 min measurements of the TC under nominally standard unvarying operating conditions. Spectral analysis was conducted offline to minimise the redundant time between measurements. The resultant species dry mole fraction time series were then analysed using the Allan variance technique (Allan, 1966) to characterise precision over differing temporal ranges. Figure 7 shows an example of the Allan deviations calculated from a repeatability experiment conducted in February 2015. For all three species, the Allan deviation (the square root of the Allan variance) reduces with the square root of averaging time, consistent with being limited by Gaussian noise.
Table 2CH4, CO and N2O 10 min Allan deviation estimates measured at Lauder along with estimates from Griffith 2011 and G12. The GAW recommend compatibility goals are also listed for comparative purposes. The measurement mode and number of 1 min data points (N) used in each Allan variance analysis experiment are listed.
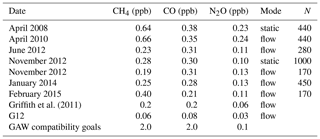
The base period for all sample and calibration measurements is 10 min; hence the 10 min Allan deviation is taken as the operational instrument precision. The 10 min Allan deviation per species from experiments conducted over 7 years of operation are listed in Table 2. CH4 and CO 10 min precision estimates of the Lauder FTIR are comparable to that reported in Griffith et al. (2011) but was significantly less precise than that reported in G12, especially N2O. The design and operation of the Lauder FTIR is more comparable to the instrument used by Griffith et al. (2011), whilst the data used in G12 were acquired from a FTIR system (IUP, H13) more akin to the newer Spectronus design. The precision estimates are relatively stable over time for both measurement mode types. CH4 and CO precision is well within the GAW-recommended compatibility goals, whereas the N2O precision is also close but does not meet the recommendation. For all three species, the precision could be increased by extending the averaging time and/or replacement of the mid-IR detector with a more sensitive version. In the case of extending the averaging time, a balance must be found between a potential increase in precision and a small enough averaging time to capture short-term atmospheric variability.
5.8 Accuracy and calibration
The spectroscopic retrievals and subsequent conversion to dry mole fractions are only as accurate as the underlying uncertainties associated with the retrieval (i.e. forward-model accuracy, spectroscopic line list uncertainties) and inherent uncertainties of measured parameters (i.e. pressure and temperature sensor accuracy). Furthermore, the calculated dry mole fraction is not traceable to an absolute reference scale. MALT absolute accuracy is estimated to be approx. 2 % (Griffith, 1996). This accuracy is not sufficient to meet the intended purpose. Greater accuracy is achieved, along with mapping of the FTIR mole fractions to a known reference scale, by the ubiquitous method of measuring gases of known composition to derive an instrument response function (IRF). These gases are independently assigned, have high accuracy and are traceable to a defined international scale. When this method is applied, the overall accuracy of the FTIR is reliant on the calibration gas uncertainty, whereas precision is inherent in the FTIR itself.
From the measurements of the calibration gas an IRF is constructed to map the retrieved dry mole fractions to that of the assigned value. Such transfer functions are required for each species. The FTIR has been shown to have a linear response (H13); thus the IRF can be approximated by a first-degree (linear) polynomial, as in Eq. (2). χref_meas is the calibration gas dry mole fraction measured by the FTIR and χref is the assigned calibration gas dry mole fraction. The IRF linear coefficients (Ac and Bc) are derived using simple linear regression (using the ordinary least squares approach).
The air sample can then be calibrated as in Eq. (3), where χcal is the calibrated sample amount, and χrcs_corr is the air-sample dry mole fraction after cross-sensitivity correction. We see that, when calculating the calibrated sample uncertainty, uncertainties need to be included that are associated with RCS corrections, WS assignment uncertainties, and to a lesser extent the derived IRF uncertainty.
The IRF linear coefficients are derived using a calibration suite with a minimum of two calibration tanks (of differing mole fractions), but ideally three or more. The calibration suite composition should also span the range of expected atmospheric compositions. Unfortunately, the initial deployment of the FTIR at Lauder employed a single WS and continues to this day. This is suboptimal, allowing only derivation of either the gradient or the intercept but not both simultaneously. To proceed, it is assumed that the IRF intercept (Bc) is zero, and the gradient (Ac) is to be calculated. This effectively reduces the IRF to a scale factor (Asf). This approach will introduce a concentration-dependent bias, this being the difference in χcal calculated using a scale factor (single point) calibration approach to that calculated using a full linear IRF parameterisation.
The magnitude of the concentration-dependent bias can be estimated by taking measurements of a multi-tank calibration suite. First, the IRF is calculated from the multi-tank suite, in which both linear coefficients are calculated. We call this the Complete-IRF. Next, the IRF is derived using a single calibration tank (within the multi-tank suite). This is called the scale factor. By combining Eqs. (2) and (3), we can define the concentration-dependent bias in terms of the air-sample dry mole fraction when calibrated using a single scale factor as in Eq. (4), where the concentration-dependent bias is χc−χsf. χc is the calibrated sample using the complete IRF and χsf is the calibrated sample using the scale factor.
Even given this limitation, the use of a single scale factor for calibration still provides sufficient accuracy when calibration gas and air-sample dry mole fractions are comparable (as shown in Sect. 5.8.3). The deficiencies in using single-point calibrations are also encountered by Verhulst et al. (2017), in which concentration-dependent bias is accounted for using a similar, but slightly different, methodology called extrapolation uncertainty.
The FTIR WS is dried ambient air collected at Baring Head during prevailing southerly winds, which is of comparable composition to Lauder baseline conditions (Saad et al., 2014). Due to the concentration-dependent bias, only measurements taken in baseline conditions are currently used. Care should be taken in using the data in conditions that are vastly different to the baseline conditions, such as night-time inversion events.
5.8.1 Working standards
The working standards set by the FTIR are prepared and assigned at NIWA's greenhouse gas and isotopic analysis laboratory (NIWA-Gaslab) at Greta Point, Wellington. High-pressure 30 L aluminium cylinders (model 150A, Scott Marrin Inc., USA) are filled to approx. 2000 psig at Baring Head using a modified oil-free compressor. During the filling process the air is also dried (< 5 ppb) (Brailsford et al., 2012). WS assignment is then performed, using scale transfer reference gases on the current World Meteorological Organization (WMO) reference scales.
Table 3Working standards consumed by the FTIR. WS CH4, CO and N2O dry mole fraction assignment with 1σ uncertainty bracketed. Working standard tank date of attachment to the FTIR, tank identifier and calculated CO drift rates are given. The CH4, CO and N2O assignments are traceable to the WMOx2004A (Dlugokencky et al., 2005), WMOx2014A (Novelli et al., 1991) and WMO2006A (Hall et al., 2007) reference scales respectively.
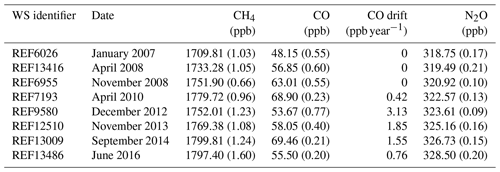
The composition and uncertainty of the WS used by the FTIR are listed in Table 3. One limiting factor of FTIR accuracy is the uncertainty in the WS assignment. It is assumed that the tanks have a constant composition but in the majority of Lauder FTIR WSs there is significant drift in the CO concentration. It is vital that such drift be considered when scale factors are calculated.
5.8.2 Scale factor time series
As part of the standard operating conditions the WS was measured daily up until February 2014. After February 2014 weekly measurements were instigated. Figure 8 displays the calculated 7-day running mean scale factor for each species and associated uncertainties. A 7-day running mean was used to minimise short-term scale factor variability and provide a scale factor reproducibility estimate. The scale factors show that the inherent accuracy of MALT retrievals prior to calibration are better than 2 % for CH4 and 1 % for N2O but up to 8 % for CO.
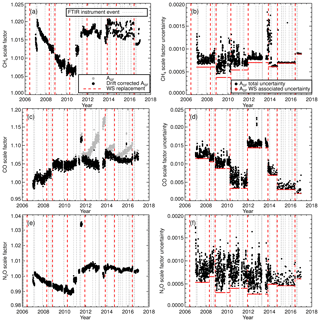
Figure 8(a) CH4 7-day running mean calibration scale factor (Asf). Black data points are the drift-corrected calibration scale factors. Uncorrected calibration scale factors are shown as grey data points. The vertical dashed red line indicates the WS replacement and (b), CH4 scale factor uncertainty. Panels (c) and (d) show the same as (a) and (b) but for CO. Panels (e) and (f) show the same as (a) and (b) but for N2O.
Changes in the scale factor need to be accounted for. A step change is an indication of an acute incident in the FTIR, FTIR acquisition procedure or a WS change. A gradual change indicates a change in FTIR performance or WS composition drift. A change in the 7-day running mean scale factor standard deviation indicates a stability issue. A step change in the scale factor can be seen in WS change. This indicates a relative offset between the WSs, for example, the CO scale factor step change at the end of 2009 (Fig. 8c) indicates a possible mis-assignment of the WS and needs to be rectified. Any step change should be correlated with an instrument event (vertical dashed grey lines). For example, in mid-2011 there was an approximate 3 % increase in the N2O scale factor for a short period. This is associated with FTIR spectra acquisition using an input aperture of 3.0 mm instead of 1.5 mm. The two significant step changes in CH4 and N2O in the 2010–2012 period are related the replacement of the temperature sensor and replacement of the FTIR internal metrology laser. There is an increase in the CH4 scale factor variability after 2014. This has been attributed to an error in the background spectrum H2O stripping procedure. This affects both sample and calibration measurements equally; hence the calibrated sample measurements remain unaffected. Conversely, there was a reduction in CH4 scale factor uncertainty variability after 2014 due to changes in standard operating conditions. Longer-term gradual scale factor changes are harder to diagnose. The reason for the gradual decline in the CH4 and N2O scale factors from 2007 to 2010 is unclear. Hypotheses include MIR globar intensity deterioration, cell wall effects and pressure/temperature sensor drift. The decline spans multiple WSs and instrument changes.
Drift in WS CO composition (Novelli et al., 1991; Andrews et al., 2014) is also a cause for concern and manifests itself in scale factor drift. If left uncorrected, incorrect calibration of sample measurements occurs. Drift can be identified, whilst the WS is in current use by a gradual increase in the scale factor, but only confirmed and quantified once the tank is returned to the calibration centre and remeasured. Thus, a final-sample calibration can only be achieved after WS re-measurement; hence in the interim all results are regarded as provisional. CO drift calculated after tank recalibration is listed in Table 3. CO drift is linearly parameterised and accounted for in the scale factor calculation. Figure 8c contrasts the scale factor calculated without drift correction (grey data points) and after drift correction (black data points). If drift correction is not taken into account, there will be an artificial downward trend in the calibrated sample CO measurements.
The scale factor uncertainty is calculated by combining the standard deviation of the 7-day running mean and the WS-assigned uncertainty in quadrature. These can be viewed as the random and systematic components respectively. The total combined scale factor uncertainty is shown as black data points in Fig. 8b, d, f and the uncertainty associated with WS assignment is the red data points. For CH4 and CO, the WS assignment uncertainty is a significant component of the total scale factor uncertainty. With the instrument upgrade in April 2013 and changes in standard operating conditions in February 2014, there is substantial reduction in the random uncertainty component, resulting in total uncertainty being dominated by systematic uncertainty. Whilst there is a reduction in the overall N2O scale factor uncertainty due to the instrument and calibration procedure changes, the uncertainty-related N2O measurement precision is still comparable to the WS assignment uncertainty. The spike in the CH4 scale factor uncertainty starting in late 2013 coincidences with a reduction in the latency time within the calibration procedure. The abrupt uncertainty reduction in early 2014 is when the weekly flow mode calibration procedure started.
5.8.3 Multi-tank calibration suite measurements
A four-tank travelling set of scale transfer reference gases (collectively known as the Aniwaniwa suite) was purchased in 2014. The suite composition matrix was designed with the FTIR in mind. Details of the Aniwaniwa suite can be found in Appendix C. Primarily, the Aniwaniwa suite is to provide independent travelling standards for the New Zealand carbon monitoring network to assess site-to-site bias. It is also used as an independent assessment of the FTIR Complete-IRF. This is done by comparing uncalibrated (but cross sensitivity and water corrected) FTIR measurements of the suite against the suite assignments. From this, the Complete-IRF can be calculated. Conversely, by calibrating the suite measurements using the single scale factor (the same method used to calibrate sample data) and then comparing them to the suite assigned values, WS bias can be diagnosed. Aniwaniwa measurements also allow investigation into the concentration-dependent bias arising from using a single calibration tank.
The Aniwaniwa suite is intended to be measured at Lauder at regular intervals, but has so far only been measured twice, once in November 2014 (N14) and again in November 2015 (N15). The FTIR measurements are made using the same procedure as that of regular WS and TC measurements. The Aniwaniwa suite, WS and TC tanks are each measured in turn for 10 min and in flow mode for 1 h. This is then repeated. Overall, 60 L of gas per tank is consumed.
In addition, in April 2010 a GAW performance audit of Lauder was conducted by the World Calibration Centre at the Swiss Federal Laboratories for Materials Science and Technology (WCC-EMPA, Zellweger et al., 2010). As part of the audit activity, the six-tank WCC-EMPA travelling standard suite was measured by the FTIR. Measurements of this additional multi-tank suite are also used to assess the FTIR IRF stability in an earlier period of the FTIR operation prior to the Aniwaniwa suite purchase. The measurements were made with a methodology similar to that used to measure the Aniwaniwa suite.
Table 4The Complete-IRF gradient and intercept coefficients for each species calculated from three suite measurements sets (1σ uncertainty in brackets). W10 is the WCC-EMPA travelling standard suite measured in 2010. N14 and N15 are the measurements of the Aniwaniwa suite in 2014 and 2015 respectively. The coefficient of determination (r2) of each fit is supplied.

Table 4 lists the Complete-IRF coefficients calculated from the three-suite measurement sets and Fig. 9 shows the residual fits of the Complete-IRF per species. Since only three multi-tank sets have been measured in the past 8 years, conclusive results cannot be drawn, but given the time span, they still offer an indication of the FTIR IRF stability and linearity. Across all species, the coefficients calculated from the N14 and N15 measurements are in close agreement, indicating good stability over a year of operation. The coefficients derived from the WCC measurements in 2010 (W10) have less agreement with the N14 and N15 values. One reason for this difference is that the W10 measurements were taken prior to the April 2013 upgrade. Prior to the upgrade, tank gas was not dried by the FTIR system; hence water vapour varied between tank measurements of up to 20 ppm.
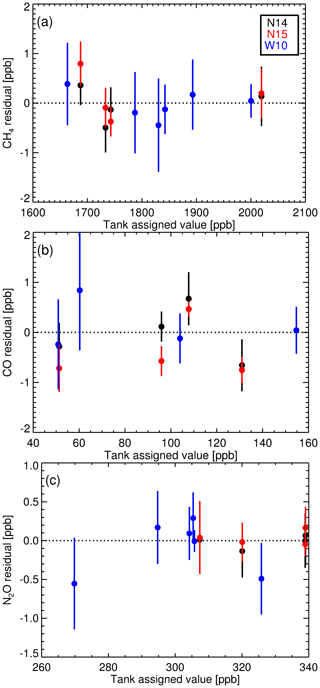
Figure 9Complete-IRF linear fit residuals (with 1σ uncertainty bars) from measurements of multi-tank suites, N14, N15 and W10.
As in the calculation of the WS scale factors, we expect to see changes in the Complete-IRF with changes in the instrumentation. In any implementation of a Complete-IRF in routine sample calibration will still require regular measurements of a multi-tank calibration suite, either by employing external scale transfer reference gas suites or a suite of multiple WSs (of differing composition). The latter option is preferable. Also of note is that the associated uncertainties in all sets (N14, N15 and W10) are similar, which is another indication that instrument precision has not degraded over time.
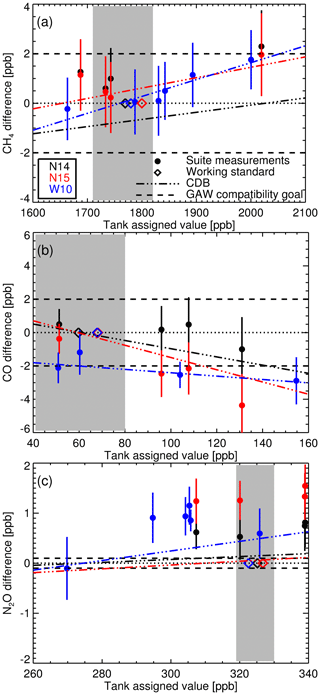
Figure 10(a) The difference between calibrated CH4 measurements of the three multi-tank suites (N14 black, N15 red and W10 blue) against assigned tank values with 1σ uncertainty bars. The coloured diamonds are the assigned WS dry mole fraction used to calibrate each respective set of suite measurements using the scale factor method. The dashed-dotted lines are the estimated concentration-dependent biases (CDB) arising from applying the scale factor method, for each measurement suite. The grey shaded area indicates the typical baseline concentration range at Lauder. Panels (b) and (c) show the same as (a) but for CO and N2O.
In the next application, we calibrate the suite measurements in the same manner as sample data, by applying a recent calculated scale factor. Comparing the assigned W10, N14 and N15 suite tank values to the difference between the calibrated measurement and assigned values (Fig. 10) gives an insight into the magnitude of the concentration-dependent bias arising from the use of a single WS calibration procedure. The dashed-dotted lines in Fig. 10 are the calculated concentration-dependent biases for each suite measurement set. For all three species the calculated concentration-dependent bias gradient and measurement-assigned difference gradients are similar, indicating that concentration-dependent bias is the main cause of the increasing discrepancy between calibrated measurements and assigned amounts with increasing concentration. The offset between the concentration-dependent bias and the measurement-assigned difference is a result of bias between the FTIR WS and the tank suite assignments. The concentration-dependent bias is minimal for all species over the baseline range (grey shaded area in Fig. 10) and comparable to GAW compatibility goals at higher mole fractions. The concentration-dependent bias is also smaller than the seasonal cycles and annual trends seen at Lauder (see Sect. 8 for trend analysis) so we have confidence that the concentration-dependent bias introduced using the scale factor calibration method will not affect baseline data analysis.
Of more concern is the large positive bias of the calibrated N2O FTIR measurements. The probable cause is that for N2O NIWA-Gaslab use synthetic composition scale transfer references gases. A 0.65 ppb bias was observed in WCC-N2O travelling standard measurements at NIWA-Gaslab during an audit of the Baring Head GAW station in 2009 (Scheel, 2012). This is a similar bias to what is seen in N14 and N15 measurements. Even if this offset is taken into account, a bias will remain (in the region of 0.35–0.7 ppb). This offset will not introduce a bias between the FTIR and flask sample measurements as both data sets are calibrated using WSs made and assigned at NIWA-Gaslab. The bias will need to be addressed before the Lauder N2O FTIR (and flask) measurements can be used in conjunction with other institutes' data sets, apart from trend analysis comparison.
The consistency of the CH4 measurements across all three sets indicate a stable IRF and consistent WS assignment. For CO concentration-dependent bias is evident, but only significant outside baseline conditions. N14 and N15 concentration-dependent bias have comparable gradients, but offset, indicating a small relative mis-assignment between consecutive FTIR WSs. The N2O concentration-dependent bias is relatively small compared to the overall bias.
5.9 Measurement reproducibility
The series of repeatability experiments over 2008–2015 provide snapshots of instrument short-term stability. Assessing instrument reproducibility over longer timescales requires a different approach.
Our approach is to take regular measurements of a target cylinder. Theoretically, repeated measurements taken in the same conditions should give the same results. Measurement spread allows us to quantify instrument reproducibility and assist diagnosis of instrument changes or faults.
Target cylinders are prepared and assigned at NIWA-Gaslab in the same manner as WSs. We found composition assignment advantageous (but not critical) in that we can also quantify the measurement bias; hence accuracy can also be regularly ascertained. Without knowing the composition then only the reproducibility can be assessed.
Table 5For each interval (and total data set) in Fig. 11, the measured-to-assigned TC bias is listed. Interval reproducibility (1σ standard deviation) is bracketed. N is the total number of TC measurements per interval.
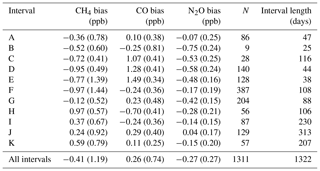
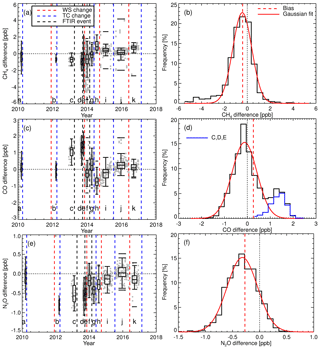
Figure 11(a) The grey data points show the difference between TC CH4 measurements and that of the TC assigned values (FTIR-TC). The blue dashed vertical lines indicate TC change. The red dashed vertical lines indicate the WS change. Black dashed vertical lines indicate a significant instrument event. The intervals between changes have alphameric labels. Box plots display interval summary statistics. (b) Histogram of FTIR-TC flask differences over all intervals. The dashed vertical red line is the mean difference (bias). The red line is a Gaussian fit to the histogram to illustrate the deviation of the differences from that of a theoretical random Gaussian statistical distribution based on the given data set. Panels (c) and (d) show the same as (a) and (b) but for CO. In (d), the additional blue histogram relates to intervals C, D and E. Panels (e) and (f) show the same as (a) and (b) but for N2O.
Routine TC measurements started in August 2013, with sporadic measurements prior to that. A single TC is measured in the same manner as that of the WS. A total of 1322 days of TC measurements were taken (2010–2017). Daily static mode TC measurements were taken up to February 2014. When calibrations switched to weekly flow mode measurements so did the TC measurements. Figure 11 shows the difference between the TC dry mole fractions measured by the FTIR and that of the TC assigned values. Vertical dashed lines indicate a change in tanks (WS or TC) or major instrument change. Within these stable intervals, the standard deviation of the TC measurements is an indication of instrument reproducibility whilst inter-interval difference indicates a systematic bias attributed to the event causing an interval change. TC measurement bias and standard deviation in each interval, and for the total data set, are listed in Table 5. For all three species reproducibility estimates are of greater value then precision estimates indicating small changes in standard operating conditions affect measurements. CH4 and CO reproducibility is within the GAW-recommended compatibility goals, whilst N2O is nearly double. Across all intervals, the measured to assigned differences are remarkably Gaussian in distribution given the intra-interval systematic differences. The exception is CO, in which interval C, D and E biases dominate (Fig. 13d), indicating possible issues in WS assignment. In all intervals, for all species, reproducibility estimates are within the GAW compatibility recommendations and are small enough to allow statistically significant annual trend and seasonal cycle analysis.
The interval TC differences can be used to assess the effects of instrument changes and identify possible issues with both TC and WS assignments. For example, after a WS change, intervals E and F have a CO bias of approx. 1.7 ppb, which is greater than the combined reproducibility of both intervals. Given that TC measurements in intervals C, D and E are all high, this indicates that the WS assignment used in these periods need to be scrutinised. Conversely, during the change of the TC over intervals H to I, the bias is approx. 0.5 ppb, indicating possible TC assignment issues. Considering that both the TC and WS are prepared in the same laboratory, using the same method, there should be no systematic differences between tank assignments. Furthermore, WS and TC compositions are similar as both tanks are handled, measured and analysed in the same way on the FTIR.
H13 assessed the reproducibility of the IUP FTIR over a period of 6 months and reported values of 0.28, 0.45 and 0.1 ppb for CH4, CO and N2O. On an interval-by-interval basis the Lauder FTIR reproducibility is comparable to H13 for CO, but near double that for CH4 and N2O. The greater variance cannot be explained by WS or TC assignment uncertainty as the analysis is within each interval, and the interval span is similar in length to the 6-month measurement period in H13. This indicates that there still is room for improvement in the measurements at Lauder, such as mid-IR detector (better SNR) and White cell upgrades (better thermal stability and cell gas mixing).
5.10 Data quality assurance and quality control
Very little has been explicitly published on FTIR QA–QC schemes. At Lauder, two filtering methods are used to exclude questionable data from the data set. The first method is an objective diagnostic filtering scheme in which data are rejected based on spectral processing diagnostics and cell state parameters. No filtering is performed on species dry mole fractions – only H2O is filtered upon. Table 6 presents the list of the diagnostics that are filtered upon and threshold limits. The threshold limits are empirically set, based on standard operating conditions at Lauder. The threshold limits have been set to exclude outliers (approx. 3σ). Acquisition software upgrades in April 2013 enabled the recording of cell pressure, cell flow and cell temperature standard deviations within a single-measurement averaging period. These were added to the list of diagnostics and allow filtering FTIR stability within a single measurement. The difference between successive measurement diagnostics (rate of change) such as H2O concentration, cell pressure and cell temperature are used to filter out any short-term instrument changes (e.g. on chemical desiccant change or instrument restart).
Table 6Objective filtering diagnostics and accompanying threshold limits.
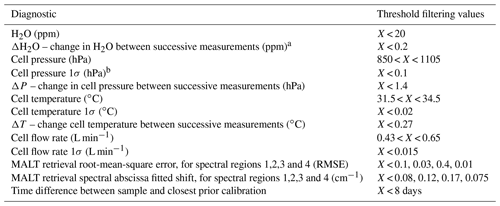
a During standard operation conditions measurement duration is 10 min. b Additional diagnostics available after the FTIR upgrade in April 2013.
Objective filtering cannot capture all instances and a second method is based on user-defined date/time periods to omit data. Such manual filtering is subjective and reliant on the operator to identify and record these periods. Examples of such are data taken during instrument testing, instrument component failure and leaks, and external events that could influence measurements such as farm machinery operating close to the sampling inlet (i.e. enhanced CO). An event log is kept and updated at regular intervals. Changes to FTIR hardware, operating conditions or analysis are recorded. Step changes in instrument performance or analysis should align with these recorded events and can be used to set up manual filtering to omit data.
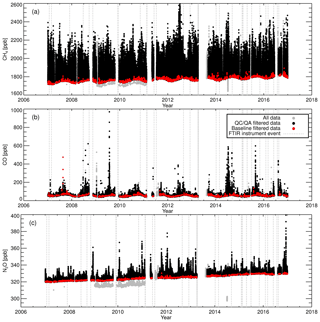
Figure 12(a) Calibrated time series of CH4, (b) CO and (c) N2O for all processed data (grey data points), quality-controlled data (black data points) and quality-controlled data during baseline conditions (red data points).
Overall, between 2007 and 2017 approx. 423 000 10 min atmospheric sample measurements had been taken, 88 % of which pass the objective filtering threshold limits. They then reduce to 80 % after manual filtering (there were 93 specific manual filtering intervals). The main causes of manual filtering omission are instrument repairs, testing and instrument upgrades. There was a prolonged period (2009.0–2011.2) in which there was increased data rejection (Fig. 12). The reason was incomplete filling of the cell during the first sample measurement after the daily calibration cycle. A blockage in the chemical desiccant cartridge reduced the cell fill rate.
5.11 Calibrated CH4, N2O and CO air-sample time series
Figure 12 displays the entire filtered time series of calibrated CH4, CO and N2O dry mole fractions at Lauder. Measurements taken in baseline conditions are highlighted in red. From this we see that large enhancements are outside baseline conditions, primarily at night, where build up is seen in the nocturnal boundary layer. The isolated large spikes of CO are due to local farmland-prescribed burns.
The calibrated sample measurement uncertainty is calculated by combining the sample measurement precision (Table 2), scale factor uncertainties (Fig. 8) and RCSp correction uncertainties (Fig. 6a) using standard error propagation methodology (Ku, 1966) in a manner similar to that used by Verhulst et al. (2017). Furthermore, the uncertainties can be grouped into systematic (RCSp corrections, WS uncertainties) and random (scale factor 7-day running mean standard deviation and sample measurement precision) components.
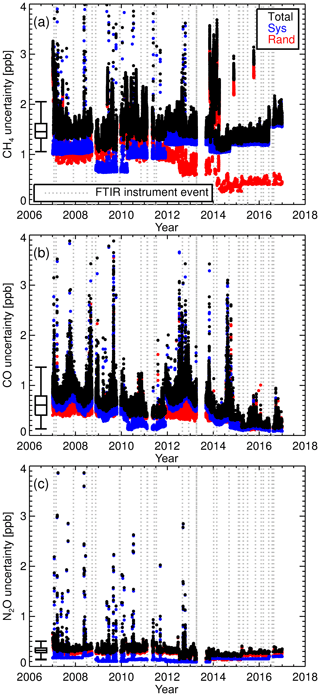
Figure 13(a) CH4 measurement uncertainties: total, systematic (Sys) and random (Rand). A box plot statistical summary for total uncertainty is overlaid. Panels (b) and (c) show the same as (a) but for CO and N2O.
Figure 13 displays the total, systematic and random uncertainties of the calibrated time series for each species. The average uncertainty is approx. 1.5, 0.6 and 0.3 ppb for CH4, CO and N2O, with uncertainty proportional to measurement concentration (due to error propagation). The large short-duration spikes in uncertainty are related to instances of high sample measurement concentrations in which uncertainties propagate. For two instances in the CH4 record (at the start of 2007 and 2014), the large uncertainty is due to a larger than usual scale factor uncertainty. The reduction in CH4 random uncertainty after February 2014 is due a switch from static to flow mode calibrations. Since the upgrade in April 2013 RCSp corrections for all species have been negligible; hence there is a reduction in associated uncertainty. Overall, the CH4 total uncertainty has remained constant across the time series, with total uncertainty dominated by the WS uncertainty. The reduction in the CH4 random uncertainty at the end of 2012 is due to revised precision estimates, and further reduction in random uncertainty after 2014 is due to the combination of the April 2013 upgrades and the change to flow mode calibration measurements. For CO, random and systematic uncertainty components are similar in magnitude. From 2007 to 2010, there was a small downtrend in the CO random uncertainty component (approx. 0.1 ppb over 7 years), which cannot be fully explained by application of revised precision estimates (Table 2). A revision of estimates can explain the stepwise reduction in early 2015. There is a pronounced seasonal cycle in the CO systematic uncertainty, more so than for CH4 and N2O, as there is a approx. 20 % seasonal cycle in atmospheric CO observed at Lauder. For N2O, up until the April 2013 upgrade, the random component of the total uncertainty was greater than the systematic component, indicating that instrument precision was a limiting factor. After the upgrade, there was a reduction in the scale factor uncertainty with systematic and random components now being comparable in magnitude.
Routine (weekly) in situ flask air-sample collection at Lauder started in May 2009 as a robust proven cost-effective approach to provide independent measurements of CH4, CO, N2O, CO2 and δ13C-CO2 for comparison against FTIR measurements. Flask samples will also assist in identifying any issues or artefacts arising from the air-sampling system. TC measurements cannot do this. We have also used FTIR measurements to help identify issues in flask measurement and analysis; hence such comparisons provide a two-way check. One drawback of flask sampling is that measurements are not continuous, offering only a sparse temporal data set. We decided to only collect air samples in baseline conditions as this is when atmospheric composition varies least. This assists in reducing concentration differences arising from differences in instrument sampling time and duration.
NIWA has a long-term in situ flask sampling programme at Baring Head and Arrival Heights, Antarctica (77.82 S, 166.65 E, 220 m a. m. s. l.) (Lowe et al., 1994). The samples collected at Lauder follow the same collection methods and laboratory analysis. In brief, air is drawn from the air-sampling manifold at a rate of 2.0 L min−1 through 5 m of nylon tubing (model N12-04 series 1200 Ledalon, New Zealand) with a diaphragm pump (model N86KTE, KNF Neuberger, Germany). An inline magnesium perchlorate cartridge is used to dry the sample air (effective dew point of approx. −60.0 ∘C) before reaching two evacuated glass 2.2 L sampling flasks (Glasscraft Scientific Glass-blowing Limited, New Zealand). These two flasks are attached in parallel. The flasks are flushed 5 times with sample air to a pressure of 20 psig, after which the flask is filled to 20 psig. Final filling time is approx. 5–8 min. The magnesium perchlorate cartridge is replenished after 12 sample collections. Over the 2009–2017 period there have been no alterations in either the collection procedure or flask sampling system.
Analysis of the flask air is performed at NIWA-Gaslab. Gas chromatography (GC) flame ionisation detector, GC cold vapour atomic fluorescence spectrometry and GC electron capture detector laboratory techniques are used to determine the dry mole fraction content of flask samples for CH4, CO and N2O. The WMO reference scale used to assign the FTIR WS and TC is used in the analysis of the flask samples. The paired flask samples are a quality assurance measure. Samples with intra-flask differences greater than the combined uncertainty in each sample pair are rejected or if flask differences exceed 2.0, 1.0 and 0.4 ppb for CH4, CO and N2O. These limits are based on the GC technique measurement uncertainty. Rejected samples indicate either a failure in collection or GC analysis. The mean value of the flask pair, along with the combined individual flask uncertainties, is used in comparisons with FTIR measurements.
Comparisons between FTIR measurements and flask samples are conducted on a regular basis. This achieves two objectives, assessing flask data quality and checking whether there is any change in the bias between the two measurements. A change in bias indicates either a fault (or drift) in one (or both) of the measurements, which needs to be investigated and accounted for.
Flask sample filling time is 5–8 min, offering only a snapshot of atmospheric composition, whereas the FTIR 10 min measurements are continual, with an e-folding time of approx. 7 min. Since the FTIR individual measurements are not independent of each other, comparing a single FTIR measurement with a flask sample measurement is not straightforward. To minimise such temporal effects, flask measurements are taken in baseline conditions and compared to 1 h FTIR averages, which consists of six measurements. This also provides an estimate of baseline variability. The integrating effect of the different measurement sample volumes, as applied by Winderlich et al. (2010), has not been employed in this analysis due to minimal baseline variability. This approach would be needed when comparing the measurements taken in conditions of high variability (i.e. during nocturnal boundary layer inversion events).
Table 7FTIR flask comparison results per species. FTIR flask data set biases are listed with the 1σ standard deviation in brackets. Linear regression fitting parameters and uncertainties (bracketed) are listed in the middle columns. The final column has the Pearson correlation coefficient (r) of the fitted scatter plot data.
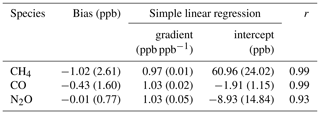
Figure 14 displays the FTIR flask comparison results for CH4, CO and N2O. Table 7 lists measurement data set biases along with the results from simple linear regression (using the ordinary least squares approach) of the FTIR against the flask. The total uncertainty in the FTIR flask difference is the uncertainty in the flask measurement added in quadrature with the FTIR measurement uncertainty. The recommended GAW compatibility goals are also displayed to assist in the interpretation (and add perspective) of the differences against an international standard. As illustrated in all time series (Fig. 14a, d, g), there is a gap in comparison sample points between mid-2009 and mid-2010. This is due to two factors, mainly flask samples being taken outside the defined baseline criteria and, to a lesser extent, flask samples not passing quality assurance checks. It was only in mid-2010 that we decided to focus on taking all samples during baseline conditions; thus the effective comparison period is better defined as mid-2010 to mid-2015.
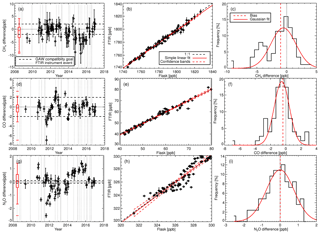
Figure 14(a) CH4 FTIR flask comparison. A time series of differences between FTIR and flask measurements (FTIR minus flask). Error bars are the uncertainty in the flask measurements added in quadrature with the FTIR 1 h variability. The horizontal dashed line is the GAW-recommended compatibility goal. A box plot statistical summary of the FTIR flask differences is overlaid in red. (b) CH4 FTIR flask correlation plot. The simple linear regression line is over plotted in red. The red dashed lines are the Working–Hotelling 90 % confidence bands. For reference, the 1:1 correlation line is indicated the black dashed line. (c) Histogram of FTIR flask differences. The dashed vertical red line is the mean difference (bias). The red line is a Gaussian fit to the histogram to illustrate the deviation of the differences from that of a theoretical random Gaussian statistical distribution based on the given data set. Panels (d)–(f) are the same as (a)–(c) but for CO. Panels (g)–(i) are the same as (a)–(c) but for N2O.
The CH4 FTIR flask comparison results show good agreement between the two measurement data sets with a bias of −1.02 ± 2.61 ppb. Differences are not concentration dependent, show a tight linearity and are not seasonally dependent. The larger differences seen in the period June 2014 to June 2015 are not accounted for, requiring further investigation. The CH4 bias and standard deviation are comparable to other FTIR comparison activities (Griffith et al., 2011; Vardag et al., 2014) and comparable to other continuous CH4 measurement techniques in comparison to co-located flask measurements (Winderlich et al., 2010; Popa et al., 2010).
The CO FTIR flask comparison results show a tight linearity and are not seasonally dependent. The bias of ppb indicates an overall good agreement between measurements and are within the GAW-recommended compatibility target of 2 ppb. The CO bias and standard deviation are akin to results from other continuous CO instruments compared to co-located flask measurements (Thompson et al., 2009; Popa et al., 2010).
For N2O, a bias of ppb is within the GAW-recommended compatibility goal of 0.1 ppb, but this is more serendipitous when the FTIR flask time series and correlation scatter plots are viewed (Fig. 14g, h). Any comparison of bias to that of the GAW-recommended compatibility goal also must take into consideration the FTIR and flask measurement uncertainties. In each N2O FTIR flask comparison, the uncertainties (error bars in Fig. 16a, d, g) are greater than the GAW-recommended compatibility goal of 0.1 ppb. Achieving combined uncertainty estimates less that the compatibility goal may be unobtainable given the current FTIR and flask sampling N2O systematic and random uncertainty components. Care must also be taken in interpretation as systematic differences dominate in different time periods, but as an ensemble, produce statistical results that could convey a large Gaussian spread (Fig. 14i). For instance, there is an increased bias over the time interval September 2014 to January 2016. So far, the causes are unknown. There is no explicit correlation between the bias with any FTIR instrument or flask sample events. We suspect the issue is with the FTIR measurement as the elevated level of N2O is greater than what simple trend analysis would indicate, as seen in the baseline time series (see Fig. 15c). There is also a sudden (step) decrease in N2O at the start of 2016 that is not seen in the N2O flask samples.
N2O FTIR comparison measurements carried out by Griffith et al. (2011) show much better results. A bias of −0.12 ppb was also reported but with a standard deviation of 0.22 ppb. N2O FTIR comparisons conducted by Vardag et al. (2014), also report a much smaller standard deviation (0.22 ppb) than our results. A comprehensive investigation of five continuous N2O analysers (including the FTIR) by Lebegue et al. (2016), showed FTIR performance comparable to the other instruments. These findings point to a specific but as yet unidentified issue with the Lauder FTIR N2O measurements. Internal FTIR QA–QC did not identify any issues over the September 2014–January 2016 period. Overall, for N2O, such independent validation via flask sampling comparisons may not be of sufficiently low uncertainty or high enough temporal resolution to address issues. Comparisons at a greater temporal resolution, such as another high-precision in-situ continuous system operating in parallel, may assist in resolving disparities encountered and reduce combined uncertainty estimates.
Flask sampling will continue at Lauder. The next step is to collect flask samples outside baseline conditions allowing an independent check against FTIR measurements taken in conditions with higher mole fractions and variability, such as during nocturnal boundary layer conditions. Such data will also provide an independent data set to assist in assessment of concentration-dependent bias, arising from the use of a single WS for calibration.
Here we perform and present baseline time series trend analysis. We focus on baseline measurements as they are representative of the regional atmosphere, minimally affected by local emissions and conditions, simpler to interpret and give a better indication of any instrument fault or change. We want to see if the FTIR measurements are sufficiently accurate, precise, stable and reliable enough to capture annual and seasonal changes. These are the most trying conditions to measure over the longer term. Analysis and commentary on diurnal cycles and night-time measurements are outside the scope of this work.
The trend analysis technique used by Gardiner et al. (2008) was applied to the FTIR baseline data sets. Residual resampling (bootstrapping) using 5000 iterations was performed. A linear fit (a broad simplification) and single Fourier pair were used in trend analysis for CH4, CO and N2O. A single Fourier pair was sufficient to capture the seasonal cycle. There was no substantial reduction in the goodness of fit with additional Fourier components. Additional Fourier terms also complicate physical attribution interpretation. This simplistic linear and single Fourier pair approach is sufficient for the objectives we are trying to achieve in this analysis.
Table 8Trend analysis results (N=737) and bootstrap 1σ uncertainties (bracketed) for the period 2007–2017. The annual trend expressed as a percentage uses the time series mean dry mole fraction (1768.91, 55.16 and 324.29 ppb for CH4, CO and N2O).
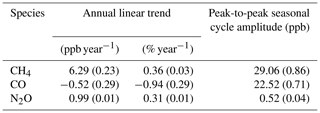
Figure 15 displays the baseline time series of all three species. Qualitatively, CH4 and N2O measurements exhibit an increase over time, whereas CO shows a minimal decrease. As expected, the baseline flask samples also display similar patterns. The detrended seasonal cycles are displayed in Fig. 16. Table 8 lists the trend analysis results, peak-to-peak seasonal cycle amplitudes and associated uncertainties. The bootstrap bias correction index (Efron and Tibshirani, 1993; Gardiner et al., 2008) of 0.47, 0.49 and 0.52 (for CH4, CO and N2O) indicates that the analysis method does not introduce a significant bias.
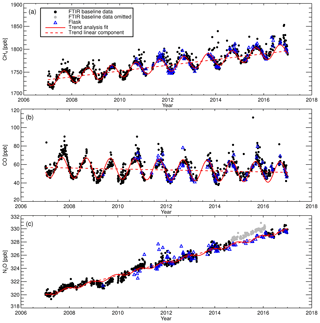
Figure 15(a) Baseline CH4, (b) CO and (c) N2O FTIR measurements and flask samples. The FTIR trend analysis fit and the trend analysis linear fit component are plotted over in red.
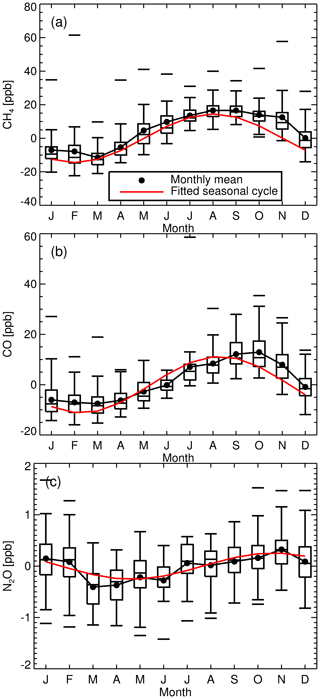
Figure 16Box plot statistical summaries of detrended monthly baseline measurements of CH4 (a), CO (b) and N2O (c) over the period 2007–2017. The fitted seasonal cycle (1 Fourier pair) is overlaid as a solid red line.
The annual linear trend in methane of 6.29 ppb year−1 since 2007 is consistent with other Southern Hemisphere midlatitude in situ measurement studies (Nisbet et al., 2016; Dalsøren et al., 2016.). The observed peak-to-peak seasonal cycle amplitude of approx. 29 ppb (peaking in wintertime) is dominated by OH oxidation and is consistent with current understanding (Dlugokencky et al., 1997). There is greater variability and elevated amounts in the spring- and summertime measurements with evidence of possible local horticulture and agriculture emissions and/or seasonal transport of enriched CH4 air from other regions. The explanation of the causes is outside the scope of this work.
CO has a linear annual trend since 2007 of −0.52 ppb year−1. The measurements agree with other Southern Hemisphere in situ measurements (Zeng et al., 2015) and the observed trend is like that derived from remote sensing measurements of CO at Lauder (Zeng et al., 2012). The seasonal cycle is also in agreement with measurements made at Cape Grim, Australia (40.68 S, 144.68 E, 91 m a. m. s. l.) (Fisher et al., 2015). This is not surprising, as both sites are in the southern midlatitudes and described as remote clean-air stations.
Baseline N2O data over the period September 2014–January 2016 are not used in the seasonal cycle and trend analysis due to possible FTIR instrument issues (see Sect. 7 for details). To check, the annual trend calculated with inclusion of the flagged erroneous data was estimated at 1.06 ppb year−1 (±0.01) compared to 0.99 ppb year−1, demonstrating that inclusion alters the trend estimate by approx. 6 %. The linear annual trend of approx. 1 ppb year−1 (0.3 % year−1) is similar to annual growth rates deduced from measurements over 2008–2012 made at Baring Head (0.17 %–0.32 % year−1) and Cape Grim (0.3 %–0.36 % year−1) (Ye et al., 2016). The reduction in N2O concentration in 2009 is thought to be real, not an instrument artefact, as a decline is also seen in these other site measurements (Ye et al., 2016). The bootstrap analysis technique indicates there is a small but statistically detectable peak-to-peak seasonal cycle amplitude of 0.52 ppb, approximately double that of the instrument reproducibility (0.27 ppb).
Operation of the FTIR over 10 years has shown the instrument repeatability and reproducibility to be stable over the long term, even across significant instrument and analysis upgrades. The Bruker IRcube has been shown to be reliable with a stable ILS, producing spectra with a high SNR. Neither ILS stability nor SNR are limiting factors in measurement uncertainty. The FTIR is of high reliability. Component failure is rare. Consumables (i.e. dry nitrogen, desiccant and the metrology HeNe laser) are easily replaced. Operator intervention (to perform tests and upgrades) along with desiccant replacement are the main causes of data collection interruption.
Changes in the cell temperature sensor placement and type have increased temperature monitoring precision and are now more responsive and representative of cell gas temperature. The instrument upgrades in April 2013 decoupled and increased control over cell pressure and cell flow rate, resulting in a significant reduction in pressure residual cross-sensitivity corrections. Pressure residual cross-sensitivity experiments spanning approx. 5 years are in good agreement, again indicating FTIR measurement stability across multiple upgrades and changes.
Introducing a new CO and N2O MALT retrieval strategy has significantly reduced CO and N2O cross-sensitivity to 12CO2. There is also an added benefit in that the N2O pressure cross sensitivity can now be represented as a linear function. The addition of the background spectrum water stripping procedure produces a transmission spectrum that can be more realistically modelled, reducing retrieval uncertainty (hence there is an increase in reproducibility).
Instrument precision experiments spanning multiple years are within GAW recommended compatibility goals for CH4 and CO and comparable for N2O. Instigation of target cylinder measurements allows diagnosis of medium-term (months to years) reproducibly and, if the tank has an assigned value, it can be used to investigate calibration accuracy.
By using a single WS to calibrate samples, concentration-dependent bias is introduced but the effect is minimised when the WS composition is akin to that of sample air. A multi-tank reference suite with a custom composition matrix tailored for the FTIR was constructed. Annual measurements of the Aniwaniwa suite, along with the WCC-EMPA audit suite show that the FTIR instrument response function is stable and the concentration-dependent bias (arising from single WS calibrations) is minimal. Measurements of the Aniwaniwa suite also allow inference of WS accuracy. This cannot be deduced solely from the FTIR flask comparisons as FTIR WS assignments are measured using the same laboratory techniques and scale transfer standards as that used in flask analysis.
An uncertainty budget for calibrated sample measurements was constructed and decomposed into random and systematic constituents. The April 2013 instrument upgrades reduced CH4 random uncertainty so that systematic uncertainty now dominates the CH4 total error. The upgrades also reduced CO and N2O random uncertainty but are still comparable to that of systematic uncertainty.
Comparison of FTIR and co-located flask measurements show good agreement for CH4 and CO. Whilst the bias of N2O FTIR flask comparisons is within GAW-recommended compatibility goals, this is serendipitous and dominated by systematic differences. A comparison campaign at Lauder using another high-precision continuous N2O in situ instrument would be advantageous. Simplistic baseline time series trend analysis was conducted with a calculation of linear annual trends and seasonal cycles. The deduced trends and seasonal cycles align with estimates from other Southern Hemisphere in situ measurements.
Apart from one inconclusive study, there is a lack of FTIR CO comparison activities with other co-located measurements. Whilst the results of this study indicate that FTIR CO measurements meet GAW reproducibility and compatibility recommendations, we recommend additional comparisons especially against other continuous in situ instruments.
Improvements can be made in many areas of operation. Upgrading the mid-IR detector and White cell to those used in the commercially available Spectronus FTIR systems would increase spectra SNR and cell thermal stability respectively. These two changes will ultimately lead to an overall improvement in measurement repeatability (and reproducibility). A more sophisticated desiccant replacement system would reduce measurement downtime, or pre-flushing the newly refilled trap with dry air or nitrogen from a tank before installing it inline. Using multiple WSs (of differing composition) would eliminate concentration-dependent bias; hence it provides increased accuracy of measurements outside baseline conditions. Multiple WSs would also allow more timely analysis of drift in tank composition (especially CO). Flask samples should also be taken outside baseline conditions over a greater composition comparison range. This would help diagnose the extent of the concentration-dependent bias when using a single WS for calibration.
As the Aniwaniwa and WCC-EMPA measurements show, the large positive bias of calibrated N2O measurements needs to be reconciled before the data can be used in conjunction with other institutes' data sets. Despite these misgivings, the current FTIR system employing single WS calibrations is sufficient to capture CH4, CO and N2O seasonal and annual trends in Southern Hemisphere midlatitude baseline atmospheric composition within GAW reproducibly guidelines. Calibrated and quality-controlled CH4 data have already been submitted to the GAW World Data Centre for Greenhouse Gases database (GAW, 2009) and submission of CO data are planned.
Calibrated baseline CH4 FTIR and CH4 flask sample measurements are archived in the World Data Centre for Greenhouse Gases database (https://gaw.kishou.go.jp, last access: 28 March 2018). Other data in this publication can be obtained from the corresponding author on request.
Reduction of CO and N2O residual cross sensitivity to 12CO2
In the original spectral analysis strategy employed at Lauder three broad spectral regions were analysed (R1–R3 in Table A1). H13 found a significant non-linear cross sensitivity between CO and N2O to 12CO2. To minimise these cross sensitives an additional spectral region was added, R4 at 2097–2242 cm−1. Spectral region absorption examples are found in G12 Fig. 3. Experiments show that R4 CO and N2O retrievals have 12CO2 linear cross sensitivities of the order −0.002 and 0.0001 ppb ppm−1 respectively, which are relatively inconsequential. There was no substantial change in CO and N2O precision. An additional benefit is a reduction in the MALT CO retrieval sensitivity to temperature and pressure measurement errors (listed in Table A2). For N2O, pressure sensitivity in R4 retrievals is similar to that in R1 along with an (undesirable) increase in temperature sensitivity. The CO and N2O retrieval sensitivity to the CO2 forward-model error (dX∕dCO2) is also listed. R4 CO and N2O retrievals are far less susceptible to a forward-model CO2 error: this is more theoretical than practical, as CO2 is also retrieved, but provides an indication of the need to fit CO2 correctly and indicates an overall robustness of the retrieval strategy. R1 retrievals are still required for 13C–CO2, in which CO and N2O are regarded as interfering species.
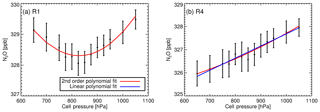
Figure A1Retrieved N2O dry mole fractions as a function of cell pressure from tests conducted in December 2013. (a) Region 1 (2150–2320 cm−1) N2O spectral analysis (with 1σ uncertainty bars). (b) Same as (a) but for Region 4 (2097–2242 cm−1) N2O spectral analysis.
The entire Lauder FTIR CO and N2O data set was reanalysed with the R4 CO and N2O retrieval strategy and is now part of the routine MALT analysis. Comparing MALT CO retrievals from spectral regions R1 and R4 over a 3-month period gives a bias of 3.6±0.38 ppb (R4 higher). Over the same period there is a bias of ppb between MALT N2O R1 and R4 retrievals. Such biases are not significant as they are cancelled out during the calibration process.
Elimination of N2O non-linear pressure residual cross sensitivity
A serendipitous consequence of adopting the new R4 region for N2O spectral analysis is the elimination of significant N2O RCSp non-linearity observed in R1 spectral retrievals. R1 N2O RCSp parameterisation required a second-order polynomial fit. The N2O RCSp derived from R4 spectral analysis can be approximated as a linear function. An example of N2O RCSp calculated using spectral regions R1 and R4 is illustrated in Fig. A1. The difference in the retrieved dry mole fractions is not of concern as calibration procedures will determine the absolute accuracy.
Table A2MALT CO and N2O retrieval sensitivity to pressure (dX∕dP) and temperature (dX∕dT) measurement errors, in the two spectral regions R1 and R4. The CO and N2O retrieval sensitivity to CO2 forward-model error (dX∕dCO2) is also listed. These were derived in a theoretical MALT study using perturbed pressure (1, 10 hPa), temperature (0.1, 1.0 ∘C) and CO2 (1, 10 ppm) using a typical air sample composition (CO2: 390 ppm, CH4: 1800 ppb, N2O: 320 ppb and CO: 50 ppb) in standard conditions (P=972 hPa, T=32 ∘C).

Spectral analysis is performed on transmission spectra, not the actual collected raw sample spectra. Sample transmission spectra are generated by the ratio of the measured spectra to that of a reference background spectrum. Reference background spectra are collected under the same experimental set-up as that of measurements but taken when the cell is evacuated. Using transmission spectra rather than raw sample spectra eliminates instrument artefacts such as continuum-level curvature and the spectrometer's spectral response.
It was initially observed that retrieved species dry mole fractions were dependent on the background spectrum. When a transmission spectrum is calculated there is imperfect spectral cancellation of residual water absorption lines between raw sample spectra and collected background spectra. Species absorptions of interest (e.g. CO2, CH4, CO and N2O), which are heavily overlapped by water vapour absorptions are most affected. This primarily effects the retrieval of CO2 in the broad spectral region 3520–3775 cm−1, whilst retrieved CH4, N2O and CO are mostly unaffected. Water vapour absorption does not “ratio out” simply or linearly when calculating a transmission spectrum, for two reasons: first, because the sample and background spectra are recorded and apodized by the FTIR to 1 cm−1 before being divided to calculate transmission spectra, in which cancellation is not complete (this is a consequence of the break-down of Beer's law at low resolution; Griffith, 1996). Second, the background water vapour spectrum has two components, water vapour at approx. 1hPa (evacuated cell pressure) and residual water vapour at atmospheric pressure (approx. 1300 hPa) in the IRcube transfer optics compartment, which is purged with dry nitrogen. Since the low-pressure spectral absorption lines are narrower, the spectral line shapes are not identical and do not provide a clean subtraction of water vapour in the sample spectrum (approx. 1100 hPa). The result is that the transmission spectrum calculated has three water vapour components, of which there is not full cancellation. To account for this behaviour, one method is to remove the water vapour absorption from the background spectrum.
A water-absorption-free background spectrum is constructed by fitting a small region of the measured background spectrum with a two-layer MALT model, with one layer at 1 hPa and the other at 1300 hPa, to retrieve the water vapour amount in the background spectrum. The concentrations and ILS parameters from this fit are used as input to MALT, in simulation mode, to simulate the transmission spectrum of water vapour in two layers at the levels in the selected background spectrum. The measured background spectrum is then divided by the simulated water transmission spectrum. The result is a water-absorption free background spectrum. This desiccated (or stripped) simulated background spectrum is used when constructing transmission spectra from air samples. The retrieved water vapour from sample transmission spectra is now only that attributed to the water vapour in the sample spectra, and the fits are generally good with very small residuals. As illustrated in Fig. B1, the stripped background in the R2 and R4 spectral regions are unaffected by the removal of the water absorption features. CO2 retrieved in region R3 along with 12CO2 and 13CO2 in region R1 are the most affected.
A similar stripping procedure is used to remove residual CO2 absorption in the background spectrum due to incomplete purging of the IRcube and evacuation of the cell.
Experiments were conducted to investigate and quantify the effect of using stripped background spectra in CO2 retrievals. Sample spectra were taken of a single ambient air tank. The tank air was pre-conditioned with variable amounts of water vapour (10–250 ppm) prior to delivery to the FTIR. Four background spectra were also taken, with differing amount of water vapour (spanning 0.01–0.47 ppm). For each background spectrum, a simulated stripped background spectrum was made. Each sample spectra was then ratioed to these eight background spectra to make transmission spectra. The transmission spectra were then analysed with MALT in the standard way.
As illustrated in Fig. B2 there is a CO2 concentration dependence on both the amount of water vapour in the sample and background spectra water vapour content when using unstripped backgrounds (red data points). For stripped backgrounds, all four CO2 retrievals agree to within 0.5 ppm (for CO, N2O and CH4 the difference was 10 times less than instrument precision). The dependence of CO2 on sample water vapour is reduced by more than a factor of 10 relative to the wet backgrounds. These results indicate that it is an inaccurate fitting of the composite water vapour spectrum when using unstripped backgrounds that leads to the sample water vapour dependence of CO2 retrieval. With only sample water vapour to be fitted, MALT can fit well and there is little cross sensitivity. The differences between the four stripped backgrounds reflect small changes in the overall response of the FTIR spectrometer, with the probable cause being temperature stability.
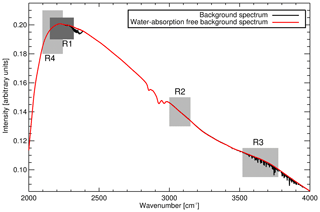
Figure B1A typical background spectrum (black line) taken on 8 August 2014 (cell pressure of 1.6 hPa) and corresponding background spectrum (red line) with water absorption spectral features removed. MALT spectral fit regions are shaded in grey.
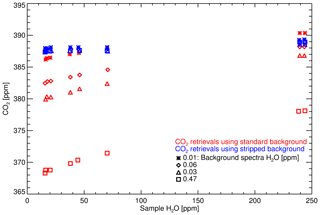
Figure B2Retrievals of CO2 dry mole fractions from a standard cylinder that has been preconditioned with water vapour of differing amounts using unaltered background spectra (red) and stripped background spectra (blue). The legend displays the amount of retrieved water vapour in the four background spectra. All background spectra were taken with the cell evacuated to approx. 1 hPa.
A bespoke FTIR scale transfer reference gas four tank suite (referred to as the Aniwaniwa suite) was designed by NIWA and prepared at the National Oceanic and Atmospheric Administration Earth System Research Laboratory Global Monitoring Division (NOAA ESRL GMD; Kitzis, 2017). NOAA ESRL GMD acts as the WMO-GAW Central Calibration Laboratory for CO2, CH4, N2O and CO. The suite has a customised trace gas composition matrix consisting of prescribed CO2, CH4, N2O and CO dry mole fractions calibrated on the respective WMO reference scale. The prescribed dry mole fractions span the typical sample air trace gas dry mole fractions measured at Lauder. The δ13C–CO2 isotopic composition of the Aniwaniwa suite was assigned at NIWA-Gaslab employing GC isotope ratio mass spectrometry using VPDB scale transfer reference gases.
The composition matrix (listed in Table C1) was designed to minimise species cross sensitivity/covariance in the MALT retrieval algorithm. Preference for species concentration orthogonality is given to species retrieved in the same spectral region (for example, CO and N2O). There is insignificant covariance between species retrievals in differing spectral regions. The MALT retrieval code performs spectral fitting in four independent spectral regions (listed in Appendix A). The original retrieval strategy only used three spectral regions: R1, R2 and R3. This was expanded to four to minimise N2O residual cross sensitivity to CO2. The Aniwaniwa suite was constructed prior to the retrieval strategy update change; hence the suite composition matrix is based around minimizing species concentration correlation for each tank based on retrievals in spectral regions R1, R2 and R3. This is not of major concern as spectral region R4 has a large overlap with R1.
Table C1Aniwaniwa suite composition with assignment uncertainty bracketed (1σ). δ13C–CO2 was not assigned at NOAA ESRL GMD, but measured at NIWA-Gaslab. The current WMO reference scales are given along with the spectral analysis region that retrievals are performed in.

Tanks CB09978 and CB10202 have the same N2O dry mole fractions within uncertainty limits (0.08 pbb difference). Tanks CB09978 and CB10248 also have similar CH4 dry mole fractions (9.58 ppb difference). For these species, the effective suite tank span reduces from 4 to 3 tanks, but is still important as overall tank composition differs. NOAA ESRL GMD keep a full audit history of tank preparation and scale propagation. Tank assignment changes and/or reference scale changes are accessed via the public accessible site: https://www.esrl.noaa.gov/gmd/ccl/refgas.html (last access: 12 August 2013). All four tanks were delivered with an approx. pressure of 2000 psig.
We define baseline measurements as those taken in conditions that are representative of a well-mixed boundary layer devoid of any local source emissions. A simple physical-based approach is taken in defining what baseline conditions are at Lauder: this is when the wind speed is greater than 5 m s−1, between 15:00 and 16:00 NZST, and there are more than five samples taken within this hour. This last criterion allows baseline measurement variability to be quantified. We also found that wind direction did not need to be considered for baseline filtering. Such filtering is applied to all three species. Due to the lack of consistent local emission sources the current baseline definition is sufficient for our needs. A more sophisticated approach in defining baseline conditions is possible (e.g. Stephens et al., 2013; Yuan et al., 2018). Identifying local emission spikes using methods like that proposed by El Yazidi et al. (2018) could also be used.

Figure D1(a) CH4 hourly standard deviation (minimum of five samples) as a function of wind speed, and data filtered by time of day (red) and full baseline criteria (blue). (b) Box plot statistical summary of hourly wind speed. (c) Box plot statistical summary of CH4 hourly standard deviation. Note that some of the upper outliers of the box plots are truncated.
Figure D1 shows the CH4 hourly standard deviation as a function of wind speed and time of day. From these figures, we see reduced CH4 variability with higher wind speeds with wind speed greatest (but also with highest variability) in the mid-afternoon through to early evening. Greater wind speeds produce more regional mixing, creating a more homogenous atmosphere. The CH4 hourly standard deviation diurnal cycle is at a minimum in the early to mid-afternoon. Such local afternoon minima are also seen in CO, N2O (not shown) and CO2 (Steinkamp et al., 2017). The large variability at night-time is due to the formation of a nocturnal boundary layer during certain meteorological conditions.
Like all instruments, regular maintenance is required and is essential for optimum performance. We have found that regular maintenance is minimal and have had only one component failure over the decade of operation. The most common interruption to measurements is replenishing consumables. In this appendix we describe routine maintenance tasks.
E1 Nitrogen purge
Dry nitrogen is used to purge the IRcube and cell transfer optics at a rate of approx. 100 mL min−1. The dry nitrogen cylinders (2000 psig) last 6–8 weeks. Cylinder changeover takes less than 5 min and can be completed without the need to interrupt measurements. In the original configuration, N2 flow was controlled with a needle valve and monitored with a rotameter (model FR-2000, Brooks Instrument, USA), giving coarse flow control. An MFC (model 80SD-5, McMillan, USA) was then installed in February 2015, providing better flow control and gas management.
E2 Chemical desiccant replenishment
Symptoms of reduced moisture absorption by the desiccant is an increase in H2O in the cell and prior to the decoupling of cell flow and pressure, a reduction in both flow and pressure as the desiccant solidifies. In standard operating conditions, H2O in the cell is less than 10 ppm (Fig. E1a). A rise of 5 ppm (or greater) over the course of a week is an indication that the desiccant needs replacing. The chemical desiccant is replaced every 3 months. The initial desiccant cartridge consisted of Drierite (calcium sulphate impregnated with cobalt chloride, 60 g) and granular magnesium perchlorate (60 g) in series separated by glass wool. The upstream Drierite was to provide a visual indicator of when to replenish the desiccant. We found that the H2O concentration from the spectral analysis was a considerably better indicator. Magnesium perchlorate is now the sole chemical desiccant used and 60 g is still sufficient. Doubling the amount of desiccant did not increase the cartridge lifetime, as one of the limiting factors is the cartridge cross-sectional area.
Changing the desiccant requires removal of the cartridge from the FTIR. The cartridge is attached to the FTIR via quick release fittings (model QC-4, Swagelok, USA). After cartridge replenishment and reinstallation moisture levels of 50 ppm (or greater) are present due to inherent moisture in the replenished cartridge (due to being exposed to humid laboratory air) and associated tubing. It takes approx. 5 days for the cell to dry to less than 10 ppm (Fig. E1b). As the cell dries out we filter out data where calibration and sample measurements have a difference in H2O content greater than 10 ppm. This is a conservative approach with approx. 5 days of data every 3 months not used. As a technical aid, it should be noted that the downstream cartridge filter sinter element accumulates powdered magnesium perchlorate, which over time solidifies and reduces flow. The sinter element is cleaned each time the cartridge is replaced.
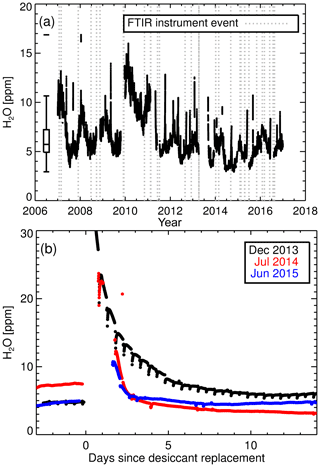
Figure E1(a) Retrieved H2O during air-sample measurements. The near-vertical spikes in H2O relate to desiccant cartridge replenishment and subsequent drying out of the cell. All measurements with H2O > 20 ppm are filtered out prior to calibration and analysis. The elevated level of H2O (approx. 2 ppm) over 2010–2011 is unexplained. (b) Three examples of cell H2O after desiccant cartridge replacement. The twice daily small reductions in H2O in the Dec2013 data are due to daily calibration and target cylinder measurements.
E3 Pressure sensor calibration
Every 3 months (to coincide with chemical desiccant replenishment) the cell pressure sensor is tested, and if needed it is recalibrated. We found this necessary as during the initial installation and commissioning period (August–December 2006) the sensor was 3.6 hPa too high. Whilst a pressure offset would be common to both calibration and sample measurements and would be effectively cancelled out during the calibration process, an accurate cell pressure reading is preferable. Routine checks did not start until mid-2012: up until then it was (wrongly) assumed that sensor calibration would hold, and only sporadic checks were performed. The routine pressure sensor checks show that sensor drift can be up to 2 hPa over a 2-month period and as high as 4 hPa over a 3-year period (Fig. E2). We do not know the cause of the drift.
Both the pressure sensor span and offset are checked using independent pressure sensors. To check the FTIR pressure sensor offset, a capacitance manometer (model 222BA Baratron®, MKS instruments, USA) is connected to the exit port of the cell, then the cell is evacuated to < 1 hPa. The FTIR pressure sensor offset is adjusted to get agreement. To check the span, the cell is then filled and allowed to equalise at atmospheric pressure. The cell pressure is then compared to an external independent pressure sensor (model PTB110, Vaisala, Finland) located next to the FTIR. The FTIR pressure sensor span is adjusted to get agreement. Both external pressure sensors have traceability records to the NIWA metrology standards. For the majority of comparisons, the offset was the only adjustment required. We recommend that FTIR systems using the MKS Series 902 pressure sensor are checked regularly.
E4 IRcube metrology laser replacement and internal globar
The IRcube has an internal single mode 0.84 mW 633 nm helium-neon (HeNe) laser to provide an accurate measurement of scanner arm displacement crucial for interferogram acquisition. The HeNe laser is classified as a consumable as it has a finite lifetime; hence replacement is regarded as a routine but infrequent maintenance issue. There have been three laser replacements over the 10-year period due to laser failure, in October 2009, April 2011 and July 2013. In all three cases, the replacement laser was a Melles Griot 05-LHP-211 but other compatible products could be used (e.g. Lasos LGK-7604P, Lumentum 1107P). A proactive approach is possible by replacing the laser before it fails. This is the recommended approach but must be balanced with the incurred extra expense.
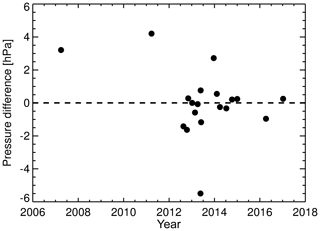
Figure E2Difference between the FTIR MKS 902 cell pressure sensor and external PTB110 pressure sensor prior to any calibration adjustments. Comparisons are conducted at a cell pressure of approx. 960 hPa (atmospheric pressure).
Installation of a new laser is straightforward. Laser pointing is adjusted to maximise laser signal strength whilst also maximising interferogram signal strength and minimising interferogram asymmetry. Diagnostic tools for laser alignment are provided as part of the OPUS software. Installation and alignment take less than 3 h.
The internal MIR globar (12 V, 20 W) has a designated factory lifetime of approx. 5 years (44 000 h). After 10 years of continual operation the globar has not been replaced. The reduction in signal level (Fig. 5a) could be a sign of a diminishing globar output, but as we see no degradation in spectra SNR we have decided not to replace it.
E5 Air-sampling line maintenance
The air-sampling line is checked for leaks every 6 months, taking approx. 2 h. During this time, measurements are suspended. The line is visually inspected then capped and pressurised with dry nitrogen to 300 psig to help locate any leaks. The moisture trap at the base of the mast is emptied (approx. 1–5 mL). The mast is lowered and the inlet coarse filter is cleaned. The meteorological sensors are also attended to. The front-end and sample line roughing pumps are tested weekly and pump diaphragms are visually inspected every 6 months. A torn diaphragm is the most common cause of failure.
DS is responsible for FTIR operation, data management, data QA–QC and data calibration. DWTG developed the FTIR analyser and MALT retrieval code. DS, DWTG, GB and MK initially installed the FTIR at Lauder. DS developed the air-sampling system. DS, VS and DWTG designed experiments and associated analysis techniques. WS and TC construction and assignments were conducted by GB, RM and SN. Flask measurements were taken by MK and DS with subsequent analysis conducted by GB, RM and SN. DS prepared the manuscript with contributions from DWTG, SN and RM.
The Lauder FTIR analyser was built at UoW in 2006 before the involvement of Ecotech P/L in the further development of the analyser as Spectronus (from 2011). Since 2011 David W. T. Griffith has operated as a consultant to Ecotech.
This article is part of the special issue “The 10th International Carbon Dioxide Conference (ICDC10) and the 19th WMO/IAEA Meeting on Carbon Dioxide, other Greenhouse Gases and Related Measurement Techniques (GGMT-2017) (AMT/ACP/BG/CP/ESD inter-journal SI)”. It is a result of the 19th WMO/IAEA Meeting on Carbon Dioxide, Other Greenhouse Gases, and Related Measurement Techniques (GGMT-2017), Empa Dübendorf, Switzerland, 27–31 August 2017.
The Lauder in situ greenhouse gas monitoring project is supported by NIWA
core funding through funding from New Zealand's Ministry for Business,
Innovation and Employment. We would like to thank to Nicholas Deutscher,
Stephen Parkes, Martin Riggenbach, Sam Hammer and Graeme Kettlewell for
invaluable technical advice and support. We would also like to thank Duane
Kitzis at NOAA ESRL GMD for the Aniwaniwa suite construction and Christoph
Zellweger for the WCC-EMPA 2010 Lauder station audit. Finally, we give a big thanks
to Sara Mikaloff-Fletcher and the two reviewers for helpful comments and advice.
Edited by: Martin Steinbacher
Reviewed by: two anonymous referees
Allan, D. W.: Statistics of atomic frequency standards, IEEE Proc., 54, 221–230, 1966.
Andrews, A. E., Kofler, J. D., Trudeau, M. E., Williams, J. C., Neff, D. H., Masarie, K. A., Chao, D. Y., Kitzis, D. R., Novelli, P. C., Zhao, C. L., Dlugokencky, E. J., Lang, P. M., Crotwell, M. J., Fischer, M. L., Parker, M. J., Lee, J. T., Baumann, D. D., Desai, A. R., Stanier, C. O., De Wekker, S. F. J., Wolfe, D. E., Munger, J. W., and Tans, P. P.: CO2, CO, and CH4 measurements from tall towers in the NOAA Earth System Research Laboratory's Global Greenhouse Gas Reference Network: instrumentation, uncertainty analysis, and recommendations for future high-accuracy greenhouse gas monitoring efforts, Atmos. Meas. Tech., 7, 647–687, https://doi.org/10.5194/amt-7-647-2014, 2014.
Bergamaschi, P., Corazza, M., Karstens, U., Athanassiadou, M., Thompson, R. L., Pison, I., Manning, A. J., Bousquet, P., Segers, A., Vermeulen, A. T., Janssens-Maenhout, G., Schmidt, M., Ramonet, M., Meinhardt, F., Aalto, T., Haszpra, L., Moncrieff, J., Popa, M. E., Lowry, D., Steinbacher, M., Jordan, A., O'Doherty, S., Piacentino, S., and Dlugokencky, E.: Top-down estimates of European CH4 and N2O emissions based on four different inverse models, Atmos. Chem. Phys., 15, 715–736, https://doi.org/10.5194/acp-15-715-2015, 2015.
Bergamaschi, P., Karstens, U., Manning, A. J., Saunois, M., Tsuruta, A., Berchet, A., Vermeulen, A. T., Arnold, T., Janssens-Maenhout, G., Hammer, S., Levin, I., Schmidt, M., Ramonet, M., Lopez, M., Lavric, J., Aalto, T., Chen, H., Feist, D. G., Gerbig, C., Haszpra, L., Hermansen, O., Manca, G., Moncrieff, J., Meinhardt, F., Necki, J., Galkowski, M., O'Doherty, S., Paramonova, N., Scheeren, H. A., Steinbacher, M., and Dlugokencky, E.: Inverse modelling of European CH4 emissions during 2006–2012 using different inverse models and reassessed atmospheric observations, Atmos. Chem. Phys., 18, 901–920, https://doi.org/10.5194/acp-18-901-2018, 2018.
Brailsford, G. W., Stephens, B. B., Gomez, A. J., Riedel, K., Mikaloff Fletcher, S. E., Nichol, S. E., and Manning, M. R.: Long-term continuous atmospheric CO2 measurements at Baring Head, New Zealand, Atmos. Meas. Tech., 5, 3109–3117, https://doi.org/10.5194/amt-5-3109-2012, 2012.
Buchholz, R., Paton-Walsh, C., Griffith, D., Kubistin, D., Caldow, C., Fisher, J., Deutscher, N., Kettlewell, G., Riggenbach, M., Macatangay, R., Krummel, P., and Langenfelds, R.: Source and meteorological influences on air quality (CO, CH4 & CO2) at a Southern Hemisphere urban site, Atmos. Environ, 126, 274–289, https://doi.org/10.1016/j.atmosenv.2015.11.041, 2016.
Cressot, C., Pison, I., Rayner, P. J., Bousquet, P., Fortems-Cheiney, A., and Chevallier, F.: Can we detect regional methane anomalies? A comparison between three observing systems, Atmos. Chem. Phys., 16, 9089–9108, https://doi.org/10.5194/acp-16-9089-2016, 2016.
Dalsøren, S. B., Myhre, C. L., Myhre, G., Gomez-Pelaez, A. J., Søvde, O. A., Isaksen, I. S. A., Weiss, R. F., and Harth, C. M.: Atmospheric methane evolution the last 40 years, Atmos. Chem. Phys., 16, 3099–3126, https://doi.org/10.5194/acp-16-3099-2016, 2016.
Deutscher, N. M., Griffith, D. W. T., Bryant, G. W., Wennberg, P. O., Toon, G. C., Washenfelder, R. A., Keppel-Aleks, G., Wunch, D., Yavin, Y., Allen, N. T., Blavier, J.-F., Jiménez, R., Daube, B. C., Bright, A. V., Matross, D. M., Wofsy, S. C., and Park, S.: Total column CO2 measurements at Darwin, Australia – site description and calibration against in situ aircraft profiles, Atmos. Meas. Tech., 3, 947–958, https://doi.org/10.5194/amt-3-947-2010, 2010a.
Deutscher, N. M., Griffith, D. W. T., Paton-Walsh, C., and Borah, R.: Train-borne measurements of tropical methane enhancements from ephemeral wetlands in Australia., J. Geophys. Res., 115, D15304, https://doi.org/10.11029/12009JD013151, 2010b.
Dlugokencky, E. J., Masarie, K. A., Tans, P. P., Conway, T. J., and Xiong, X.: Is the amplitude of the methane seasonal cycle changing?, Atmos. Environ., 31, 21–26, 1997.
Dlugokencky, E. J., Myers, R. C., Lang, P. M., Masarie, K. A., Crotwell, A. M., Thoning, K. W., Hall, B. D., Elkins, J. W., and Steele, L. P.: Conversion of NOAA atmospheric dry air CH4 mole fractions to a gravimetrically prepared standard scale, J. Geophys. Res., 110, D18306, https://doi.org/10.1029/2005JD006035, 2005.
Efron, B. and Tibshirani, R.: An introduction to the Bootstrap, Monographs on Statistics and Applied Probability, Chapman and Hall, New York, 1993.
El Yazidi, A., Ramonet, M., Ciais, P., Broquet, G., Pison, I., Abbaris, A., Brunner, D., Conil, S., Delmotte, M., Gheusi, F., Guerin, F., Hazan, L., Kachroudi, N., Kouvarakis, G., Mihalopoulos, N., Rivier, L., and Serça, D.: Identification of spikes associated with local sources in continuous time series of atmospheric CO, CO2 and CH4, Atmos. Meas. Tech., 11, 1599–1614, https://doi.org/10.5194/amt-11-1599-2018, 2018.
Esler, M. B., Griffith, D. W. T., Wilson, S. R., and Steele, L. P.: Precision trace gas analysis by FT-IR spectroscopy 1. Simultaneous analysis of CO2, CH4, N2O and CO in air, Anal. Chem., 72, 206–215, 2000.
Fisher, J. A., Wilson, S. R., Zeng, G., Williams, J. E., Emmons, L. K., Langenfelds, R. L., Krummel, P. B., and Steele, L. P.: Seasonal changes in the tropospheric carbon monoxide profile over the remote Southern Hemisphere evaluated using multi-model simulations and aircraft observations, Atmos. Chem. Phys., 15, 3217–3239, https://doi.org/10.5194/acp-15-3217-2015, 2015.
Gardiner, T., Forbes, A., de Mazière, M., Vigouroux, C., Mahieu, E., Demoulin, P., Velazco, V., Notholt, J., Blumenstock, T., Hase, F., Kramer, I., Sussmann, R., Stremme, W., Mellqvist, J., Strandberg, A., Ellingsen, K., and Gauss, M.: Trend analysis of greenhouse gases over Europe measured by a network of ground-based remote FTIR instruments, Atmos. Chem. Phys., 8, 6719–6727, https://doi.org/10.5194/acp-8-6719-2008, 2008.
Ganesan, A. L., Manning, A. J., Grant, A., Young, D., Oram, D. E., Sturges, W. T., Moncrieff, J. B., and O'Doherty, S.: Quantifying methane and nitrous oxide emissions from the UK and Ireland using a national-scale monitoring network, Atmos. Chem. Phys., 15, 6393–6406, https://doi.org/10.5194/acp-15-6393-2015, 2015.
GAW: Report no. 188, Revision of the World Data Centre for Greenhouse Gases Data Submission and Dissemination Guide, Geneva, WMO/TD-No. 1507, 2009.
GAW: Report no. 194, 15th WMO/IAEA Meeting of Experts on Carbon Dioxide, Other Greenhouse Gases and Related Tracers Measurement Techniques, Geneva, WMO/TD-No. 1553, 2011.
GAW: Report no. 229, 18th WMO/IAEA Meeting of Experts on Carbon Dioxide, Other Greenhouse Gases and Related Tracers Measurement Techniques (GGMT-2015), La Jolla, CA, USA, 13–17 September 2015, WMO, Geneva, Switzerland, 2016.
Griffith, D. W. T.: Synthetic calibration and quantitative analysis of gas phase infrared spectra, Appl. Spectrosc., 50, 59–70, 1996.
Griffith, D. W. T., Esler, M. B., Steele, L. P., and Reisinger, A.: Non-linear least squares: high precision quantitative analysis of gas phase FTIR spectra, in: 2nd International Conference on Advanced Vibrational Spectroscopy, Nottingham, 2003.
Griffith, D. W. T., Deutscher, N., Krummel, P., Fraser, P., Steele, P., Schoot, M. V. D., and Allison, C.: The UoW FTIR trace gas analyser: comparison with LoFlo, AGAGE and tank measurements at Cape Grim and GASLAB, in: Baseline Atmospheric Program (Australia) 2007–2008, edited by: Derek, P. K. a. N., CSIRO, Melbourne, available at: http://www.bom.gov.au/inside/cgbaps/baseline.shtml (last access: 21 August 2018), 2011.
Griffith, D. W. T., Deutscher, N. M., Caldow, C., Kettlewell, G., Riggenbach, M., and Hammer, S.: A Fourier transform infrared trace gas and isotope analyser for atmospheric applications, Atmos. Meas. Tech., 5, 2481–2498, https://doi.org/10.5194/amt-5-2481-2012, 2012.
Griffiths, P. R. and de Haseth, J. A.: Fourier Transform Infrared Spectrometry, 2nd Edn., Wiley, Hoboken, New Jersey, USA, 2007.
Hall, B. D., Dutton, G. S., and Elkins, J. W.: The NOAA nitrous oxide standard scale for atmospheric observations, J. Geophys. Res., 112, D09305, https://doi.org/10.1029/2006JD007954, 2007.
Hammer, S., Griffith, D. W. T., Konrad, G., Vardag, S., Caldow, C., and Levin, I.: Assessment of a multi-species in situ FTIR for precise atmospheric greenhouse gas observations, Atmos. Meas. Tech., 6, 1153–1170, https://doi.org/10.5194/amt-6-1153-2013, 2013a.
Hammer, S., Konrad, G., Vermeulen, A. T., Laurent, O., Delmotte, M., Jordan, A., Hazan, L., Conil, S., and Levin, I.: Feasibility study of using a “travelling” CO2 and CH4 instrument to validate continuous in situ measurement stations, Atmos. Meas. Tech., 6, 1201–1216, https://doi.org/10.5194/amt-6-1201-2013, 2013b.
Henne, S., Brunner, D., Oney, B., Leuenberger, M., Eugster, W., Bamberger, I., Meinhardt, F., Steinbacher, M., and Emmenegger, L.: Validation of the Swiss methane emission inventory by atmospheric observations and inverse modelling, Atmos. Chem. Phys., 16, 3683–3710, https://doi.org/10.5194/acp-16-3683-2016, 2016.
Kelliher, F. M., Reisinger, A. R., Martin, R. J., Harvey, M. J., Price, S. J., and Sherlock, R. R.: Measuring nitrous oxide emission rate from grazed pasture using Fourier-transform infrared spec- troscopy in the nocturnal boundary layer, Agr. Forest Meteorol., 111, 29–38, https://doi.org/10.1016/S0168-1923(02)00007-2, 2002.
Kitzis, D.: Preparation and stability of standard reference air mixtures, available at http://www.esrl.noaa.gov/gmd/ccl/airstandard.html (last access: 1 January 2017).
Ku, H.: Notes on the use of propagation of error formulas, J. Res. NBS. C. Eng. Inst, 70, 263–273, available at: https://archive.org/details/jresv70Cn4p263 (last access 21 August 2018), 1966.
Laubach, J., Barthel, M., Fraser, A., Hunt, J. E., and Griffith, D. W. T.: Combining two complementary micrometeorological methods to measure CH4 and N2O fluxes over pasture, Biogeosciences, 13, 1309–1327, https://doi.org/10.5194/bg-13-1309-2016, 2016.
Lebegue, B., Schmidt, M., Ramonet, M., Wastine, B., Yver Kwok, C., Laurent, O., Belviso, S., Guemri, A., Philippon, C., Smith, J., and Conil, S.: Comparison of nitrous oxide (N2O) analyzers for high-precision measurements of atmospheric mole fractions, Atmos. Meas. Tech., 9, 1221–1238, https://doi.org/10.5194/amt-9-1221-2016, 2016.
Leip, A., Skiba, U., Vermeulen, A., and Thompson, R. L.: A complete rethink is needed on how greenhouse gas emissions are quantified for national reporting, Atmos. Environ., 174, 237–240, https://doi.org/10.1016/j.atmosenv.2017.12.006, 2018.
Lowe, D. C., Brenninkmeijer, C. A. M., Brailsford, G. W., Lassey, K. R., and Gomez, A. J.: Concentration and 13C records of atmospheric methane in New Zealand and Antarctica: Evidence for changes in methane sources, J. Geophys. Res., 99, 16913–16925, 1994.
MfE: New Zealand's Greenhouse Gas Inventory 1990–2015: NZ Ministry of the Environment Report, http://www.mfe.govt.nz/climate-change/reporting-greenhouse-gas-emissions/nzs-greenhouse-gas-inventory (last access: 21 August 2018), 2017.
Nisbet, E. G., Dlugokencky, E. J., Manning, M. R., Lowry, D., Fisher, R. E., France, J. L., Michel, S. E., Miller, J. B., White, J. W. C., Vaughn, B., Bousquet, P., Pyle, J. A., Warwick, N. J., Cain, M., Brownlow, R., Zazzeri, G., Lanoisellé, M., Manning, A. C., Gloor, E., Worthy, D. E. J., Brunke, E.-G., Labuschagne, C., Wolff, E. W., and Ganesan, A. L.: Rising atmospheric methane: 2007–2014 growth and isotopic shift, Global Biogeochem. Cy., 30, 1356–1370, https://doi.org/10.1002/2016GB005406, 2016.
Novelli, P., Elkins, J., and Steele, L.: The development and evaluation of a gravimetric reference scale for measurements of atmospheric carbon monoxide, J. Geophys. Res.-Atmos., 96, 13109–13121, 1991.
Oney, B., Gruber, N., Henne, S., Leuenberger, M., and Brunner, D.: A CO-based method to determine the regional biospheric signal in atmospheric, Tellus B, 69, 1353388, https://doi.org/10.1080/16000889.2017.1353388, 2017.
Peters, W., Jacobson, A., Sweeney, C., Andrews, A., Conway, T., Masarie, K., Miller, J., Bruhwiler, L., Petron, G., Hirsch, A., Worthy, D. E. J., van der Werf, G. R., Randerson, J. T., Wennberg, P. O., Krol, M. C., and Tans, P. P.: An atmospheric perspective on North American carbon dioxide exchange: CarbonTracker, P. Natl. Acad. Sci. USA, 104, 18925–18930, 2007.
Pison, I., Berchet, A., Saunois, M., Bousquet, P., Broquet, G., Conil, S., Delmotte, M., Ganesan, A., Laurent, O., Martin, D., O'Doherty, S., Ramonet, M., Spain, T. G., Vermeulen, A., and Yver Kwok, C.: How a European network may help with estimating methane emissions on the French national scale, Atmos. Chem. Phys., 18, 3779–3798, https://doi.org/10.5194/acp-18-3779-2018, 2018.
Pollard, D. F., Sherlock, V., Robinson, J., Deutscher, N. M., Connor, B., and Shiona, H.: The Total Carbon Column Observing Network site description for Lauder, New Zealand, Earth Syst. Sci. Data, 9, 977–992, https://doi.org/10.5194/essd-9-977-2017, 2017.
Popa, M. E., Gloor, M., Manning, A. C., Jordan, A., Schultz, U., Haensel, F., Seifert, T., and Heimann, M.: Measurements of greenhouse gases and related tracers at Bialystok tall tower station in Poland, Atmos. Meas. Tech., 3, 407–427, https://doi.org/10.5194/amt-3-407-2010, 2010.
Rothman, L. S., Jacquemart, D., Barbe, A., Chris Benner, D., Birk, M., Brown, L. R., Carleer, M. R., Chackerian Jr., C., Chance, K., Couderth, L. H., Dana, V., Devi, V. M., Flaud, J.-M., Gamache, R. R., Goldman, A., Hartmann, J.-M., Jucks, K.W., Maki, A. G., Mandin, J.-Y., Massie, S. T., Orphal, J., Perrin, A., Rinsland, C. P., Smith, M. A. H., Tennyson, J., Tolchenov, R. N., Toth, R. A., Vander Auwera, J., Varanasi, P., and Wagner, G.: The HITRAN 2004 molecular spectroscopic database, J. Quant. Spectrosc. Ra., 96, 139–204, 2005.
Saad, K. M., Wunch, D., Toon, G. C., Bernath, P., Boone, C., Connor, B., Deutscher, N. M., Griffith, D. W. T., Kivi, R., Notholt, J., Roehl, C., Schneider, M., Sherlock, V., and Wennberg, P. O.: Derivation of tropospheric methane from TCCON CH4 and HF total column observations, Atmos. Meas. Tech., 7, 2907–2918, https://doi.org/10.5194/amt-7-2907-2014, 2014.
Scheel, H.: GAW World Calibration Centre for Nitrous Oxide (WCC-N2O) Report 2009–2011 FZK: 351 01 069, https://www.imk-ifu.kit.edu/wcc-n2o/docs/WCC-N2O_Report_2009-2011.pdf (21 August 2018), 2012.
Sonderfeld, H., Bösch, H., Jeanjean, A. P. R., Riddick, S. N., Allen, G., Ars, S., Davies, S., Harris, N., Humpage, N., Leigh, R., and Pitt, J.: CH4 emission estimates from an active landfill site inferred from a combined approach of CFD modelling and in situ FTIR measurements, Atmos. Meas. Tech., 10, 3931–3946, https://doi.org/10.5194/amt-10-3931-2017, 2017.
Steinkamp, K., Mikaloff Fletcher, S. E., Brailsford, G., Smale, D., Moore, S., Keller, E. D., Baisden, W. T., Mukai, H., and Stephens, B. B.: Atmospheric CO2 observations and models suggest strong carbon uptake by forests in New Zealand, Atmos. Chem. Phys., 17, 47–76, https://doi.org/10.5194/acp-17-47-2017, 2017.
Stephens, B. B., Brailsford, G. W., Gomez, A. J., Riedel, K., Mikaloff Fletcher, S. E., Nichol, S., and Manning, M.: Analysis of a 39-year continuous atmospheric CO2 record from Baring Head, New Zealand, Biogeosciences, 10, 2683–2697, https://doi.org/10.5194/bg-10-2683-2013, 2013.
Stocker, T. F., Qin, D., Plattner, G.-K., Tignor, M., Allen, S. K., Boschung, J., Nauels, A., Xia, Y., Bex, V., and Midgley, P. M.: IPCC, 2013: Climate Change 2013: The Physical Science Basis, in: Contribution of Working Group I to the Fifth Assessment Report of the Intergovernmental Panel on Climate Change, Cambridge University Press, Cambridge, UK and New York, NY, USA, 2013.
Té, Y., Jeseck, P., Franco, B., Mahieu, E., Jones, N., Paton-Walsh, C., Griffith, D. W. T., Buchholz, R. R., Hadji-Lazaro, J., Hurtmans, D., and Janssen, C.: Seasonal variability of surface and column carbon monoxide over the megacity Paris, high-altitude Jungfraujoch and Southern Hemispheric Wollongong stations, Atmos. Chem. Phys., 16, 10911–10925, https://doi.org/10.5194/acp-16-10911-2016, 2016.
Thompson, R. L., Manning, A. C., Gloor, E., Schultz, U., Seifert, T., Hänsel, F., Jordan, A., and Heimann, M.: In-situ measurements of oxygen, carbon monoxide and greenhouse gases from Ochsenkopf tall tower in Germany, Atmos. Meas. Tech., 2, 573–591, https://doi.org/10.5194/amt-2-573-2009, 2009.
Thompson, R. L., Ishijima, K., Saikawa, E., Corazza, M., Karstens, U., Patra, P. K., Bergamaschi, P., Chevallier, F., Dlugokencky, E., Prinn, R. G., Weiss, R. F., O'Doherty, S., Fraser, P. J., Steele, L. P., Krummel, P. B., Vermeulen, A., Tohjima, Y., Jordan, A., Haszpra, L., Steinbacher, M., Van der Laan, S., Aalto, T., Meinhardt, F., Popa, M. E., Moncrieff, J., and Bousquet, P.: TransCom N2O model inter-comparison – Part 2: Atmospheric inversion estimates of N2O emissions, Atmos. Chem. Phys., 14, 6177–6194, https://doi.org/10.5194/acp-14-6177-2014, 2014.
van der Velde, I. R., Miller, J. B., van der Molen, M. K., Tans, P. P., Vaughn, B. H., White, J. W. C., Schaefer, K., and Peters, W.: The CarbonTracker Data Assimilation System for CO2 and δ13C (CTDAS-C13 v1.0): retrieving information on land–atmosphere exchange processes, Geosci. Model Dev., 11, 283–304, https://doi.org/10.5194/gmd-11-283-2018, 2018.
Vardag, S. N., Hammer, S., O'Doherty, S., Spain, T. G., Wastine, B., Jordan, A., and Levin, I.: Comparisons of continuous atmospheric CH4, CO2 and N2O measurements – results from a travelling instrument campaign at Mace Head, Atmos. Chem. Phys., 14, 8403–8418, https://doi.org/10.5194/acp-14-8403-2014, 2014.
Vardag, S. N., Hammer, S., and Levin, I.: Evaluation of 4 years of continuous δ13C(CO2) data using a moving Keeling plot method, Biogeosciences, 13, 4237–4251, https://doi.org/10.5194/bg-13-4237-2016, 2016.
Verhulst, K. R., Karion, A., Kim, J., Salameh, P. K., Keeling, R. F., Newman, S., Miller, J., Sloop, C., Pongetti, T., Rao, P., Wong, C., Hopkins, F. M., Yadav, V., Weiss, R. F., Duren, R. M., and Miller, C. E.: Carbon dioxide and methane measurements from the Los Angeles Megacity Carbon Project – Part 1: calibration, urban enhancements, and uncertainty estimates, Atmos. Chem. Phys., 17, 8313–8341, https://doi.org/10.5194/acp-17-8313-2017, 2017.
Weiss, R. F. and Prinn, R. G.: Quantifying greenhouse-gas emissions from atmospheric measurements: a critical reality check for climate legislation, Phil. Trans. R. Soc. A, 369, 1925–1942, https://doi.org/10.1098/rsta.2011.0006, 2011.
Wells, K. C., Millet, D. B., Bousserez, N., Henze, D. K., Chaliyakunnel, S., Griffis, T. J., Luan, Y., Dlugokencky, E. J., Prinn, R. G., O'Doherty, S., Weiss, R. F., Dutton, G. S., Elkins, J. W., Krummel, P. B., Langenfelds, R., Steele, L. P., Kort, E. A., Wofsy, S. C., and Umezawa, T.: Simulation of atmospheric N2O with GEOS-Chem and its adjoint: evaluation of observational constraints, Geosci. Model Dev., 8, 3179–3198, https://doi.org/10.5194/gmd-8-3179-2015, 2015.
Winderlich, J., Chen, H., Gerbig, C., Seifert, T., Kolle, O., Lavric, J. V., Kaiser, C., Höfer, A., and Heimann, M.: Continuous low-maintenance CO2/CH4/H2O measurements at the Zotino Tall Tower Observatory (ZOTTO) in Central Siberia, Atmos. Meas. Tech., 3, 1113–1128, https://doi.org/10.5194/amt-3-1113-2010, 2010.
Wunch, D., Toon, G. C., Blavier, J.-F. L., Washenfelder, R., Notholt, J., Connor, B. J., Griffith, D. W. T., Sherlock, V., and Wennberg, P. O.: The Total Carbon Column Observing Network, Philos. T. Roy. Soc. A, 369, 2087–2112, https://doi.org/10.1098/rsta.2010.0240, 2011.
Ye, W., Bian, L., Wang, C., Zhu, R., Zheng, X., and Ding, M.: Monitoring atmospheric nitrous oxide background concentrations at Zhongshan Station, east Antarctica, J. Environ. Sci., 47, 193–200, https://doi.org/10.1016/j.jes.2015.12.038, 2016.
Yuan, Y., Ries, L., Petermeier, H., Steinbacher, M., Gómez-Peláez, A. J., Leuenberger, M. C., Schumacher, M., Trickl, T., Couret, C., Meinhardt, F., and Menzel, A.: Adaptive selection of diurnal minimum variation: a statistical strategy to obtain representative atmospheric CO2 data and its application to European elevated mountain stations, Atmos. Meas. Tech., 11, 1501–1514, https://doi.org/10.5194/amt-11-1501-2018, 2018.
Zellweger, C., Steinbacher, M., Buchmann, B., and Scheel, H. E.: System and Performance Audit of Surface Ozone, Methane, Carbon Dioxide, Nitrous Oxide and Carbon Monoxide at the Global GAW Station Lauder, New Zealand, March 2010, WCC-Empa Report 10/3, Dübendorf, Switzerland, 2010.
Zellweger, C., Emmenegger, L., Firdaus, M., Hatakka, J., Heimann, M., Kozlova, E., Spain, T. G., Steinbacher, M., van der Schoot, M. V., and Buchmann, B.: Assessment of recent advances in measurement techniques for atmospheric carbon dioxide and methane observations, Atmos. Meas. Tech., 9, 4737–4757, https://doi.org/10.5194/amt-9-4737-2016, 2016.
Zeng, G., Wood, S. W., Morgenstern, O., Jones, N. B., Robinson, J., and Smale, D.: Trends and variations in CO, C2H6, and HCN in the Southern Hemisphere point to the declining anthropogenic emissions of CO and C2H6, Atmos. Chem. Phys., 12, 7543–7555, https://doi.org/10.5194/acp-12-7543-2012, 2012.
Zeng, G., Williams, J. E., Fisher, J. A., Emmons, L. K., Jones, N. B., Morgenstern, O., Robinson, J., Smale, D., Paton-Walsh, C., and Griffith, D. W. T.: Multi-model simulation of CO and HCHO in the Southern Hemisphere: comparison with observations and impact of biogenic emissions, Atmos. Chem. Phys., 15, 7217–7245, https://doi.org/10.5194/acp-15-7217-2015, 2015.
- Abstract
- Introduction
- Site location
- Instrumentation
- Air inlet sampling system
- FTIR
- Flask sample measurements and analysis
- FTIR flask sample comparison
- FTIR baseline measurement time series analysis
- Summary
- Data availability
- An updated retrieval strategy for CO and N2O
- Appendix B: Background spectrum water vapour removal
- Appendix C: A customised scale transfer reference tank suite
- Appendix D: Defining baseline conditions
- Appendix E: Routine maintenance
- Author contributions
- Competing interests
- Special issue statement
- Acknowledgements
- References


