the Creative Commons Attribution 4.0 License.
the Creative Commons Attribution 4.0 License.
 | 09 Dec 2019
On-flight intercomparison of three miniature aerosol absorption sensors using unmanned aerial systems (UASs)
Spiros Bezantakos
Griša Močnik
Christos Keleshis
Fred Brechtel
Iasonas Stavroulas
Gregoris Demetriades
Panayiota Antoniou
Panagiotis Vouterakos
Marios Argyrides
Eleni Liakakou
Luka Drinovec
Eleni Marinou
Vassilis Amiridis
Mihalis Vrekoussis
Nikolaos Mihalopoulos
Jean Sciare
The present study investigates and compares the ground and in-flight performance of three miniaturized aerosol absorption sensors integrated on board small-sized Unmanned Aerial Systems (UASs). These sensors were evaluated during two contrasted field campaigns performed at an urban site, impacted mainly by local traffic and domestic wood burning sources (Athens, Greece), and at a remote regional background site, impacted by long-range transported sources including dust (Cyprus Atmospheric Observatory, Agia Marina Xyliatou, Cyprus).
The miniaturized sensors were first intercompared at the ground-level against two commercially available instruments used as a reference. The measured signal of the miniaturized sensors was converted into the absorption coefficient and equivalent black carbon concentration (eBC). When applicable, signal saturation corrections were applied, following the suggestions of the manufacturers. The aerosol absorption sensors exhibited similar behavior against the reference instruments during the two campaigns, despite the diversity of the aerosol origin, chemical composition, sources, and concentration levels. The deviation from the reference during both campaigns concerning (eBC) mass was less than 8 %, while for the absorption coefficient it was at least 15 %. This indicates that those sensors that report black carbon mass are tuned and corrected to measure eBC more accurately than the absorption coefficient.
The overall potential use of miniature aerosol absorption sensors on board small UASs is also illustrated. UAS-based absorption measurements were used to investigate the vertical distribution of eBC over Athens up to 1 km above sea level during January 2016, exceeding the top of the planetary boundary layer (PBL). Our results reveal a heterogeneous boundary layer concentration of absorbing aerosol within the PBL intensified in the early morning hours due to the concurrent peak traffic emissions at ground-level and the fast development of the boundary layer. After the full development of the PBL, homogenous concentrations are observed from 100 m a.g.l. to the PBL top.
- Article
(14041 KB) - Full-text XML
-
Supplement
(1304 KB) - BibTeX
- EndNote


Atmospheric aerosol particles scatter and absorb solar radiation, thus directly affecting the radiative balance of the atmosphere (Haywood and Boucher, 2000). Their contribution to climate change is still associated with large uncertainties when estimating their radiative forcing (RF) (Bond et al., 2013; IPCC, 2013). A major contributor to these uncertainties is the RF induced by black carbon (BC), which exhibits a relative standard deviation exceeding 40 % among different numerical climate models (Myhre et al., 2013). The BC direct RF has been estimated to be 0.71 Wm−2 with an uncertainty range of 0.08 to 1.27 Wm−2 (Bond et al., 2013), while in a more recent study it ranged from 0.14 to 1.19 Wm−2 (90 % confidence interval) with an average value of 0.53 Wm−2 (Wang et al., 2016). Major factors responsible for the wide range of the BC's RF estimates include the inaccurately predicted BC emission rates, poorly understood interactions of BC with clouds, and the inaccuracy in representing its vertical distribution (Bond et al., 2013). In addition, BC has been identified to reduce the albedo of snow surfaces (Hadley and Kirchstetter, 2012) and to suppress the turbulence of the boundary layer (Wilcox et al., 2016).
An array of techniques and instruments are employed worldwide with the aim of increasing the spatial and temporal resolution of BC observations. The instrumentation employed is based on different operating principles, including offline or near-real-time methods for measuring elemental carbon (EC), such as thermal–optical reflectance and transmittance (cf. Lack et al., 2014 and references therein for more details) as well as online, real-time methods. The latter are mainly based on the aerosol light-absorbing properties of BC (cf. Moosmüller et al., 2009; Petzold et al., 2013; Lack et al., 2014 and references therein for more details).
Most of the aerosol absorption observations available in the literature are conducted at ground level. Consequently, they lack critical information regarding the vertical distribution of aerosol absorption a key parameter for constraining atmospheric models and accurately assessing aerosol radiative forcing effects (Samset et al., 2018). One way to fill this gap is by conducting manned airborne aerial absorption measurements (Seinfeld et al., 2004; Subramanian et al., 2010; Freney et al., 2014; Kassianov et al., 2018; Katich et al., 2018; Sedlacek et al., 2018). However, these are costly and cover a limited period of observations. In the pioneering work of Corrigan et al. (2008), vertical absorption profiles over the Indian Ocean were measured using parts from a standard (rack) size instrument on board a medium-scale (25–150 kg) unmanned aerial system (UAS). Since then, the size and weight of absorption monitors have been reduced, and the use of lightweight miniaturized sensors on board small UASs or tethered balloons provides cost-effective alternatives able to fill the measurement gap and to enhance the vertical and temporal density of aerosol absorption observations. A UAS is defined as small if its gross weight is less than 25 kg (US Federal Aviation Administration, CFR 14, 2015). Vertical aerosol absorption observations using small UASs or tethered balloons have already been conducted in different regions such as the Indian Ocean (Höpner et al., 2016), India (Bisht et al., 2016), the Arctic (Bates et al., 2013; Ferrero et al., 2016), Italy (Ferrero et al., 2011, 2014), Poland (Chilinski et al., 2016), and China (Ran et al., 2016). These measurements can be further used to obtain the vertically resolved heating rate, including contributions from different sources and carbonaceous aerosol fractions (Ferrero et al., 2014, 2018). The employment of UASs in some of the above-mentioned campaigns proves to be a viable option to obtain information on aerosol absorption vertical distribution. Even though small UASs are subject to significant payload restrictions compared to manned aircrafts, they have a distinct advantage over their manned counterparts in terms of relatively low platform and operation cost, capability of performing autonomous flight operations, and ability to fly closer to the ground with greater spatial accuracy and collect spatially dense data (due to low-speed operation) under reduced workload (Villa et al., 2016). In addition, they have the advantage of better controllability in comparison to balloons and zeppelins, since the latter are more delicate under stronger winds (Inoue et al., 2000; Jensen et al., 2007). In terms of instrumentation, ground-based aerosol absorption instruments have been qualified in many intercomparison studies (e.g., Müller et al., 2011). On the contrary, their miniaturized counterparts' behavior is still poorly demonstrated in-flight. The measurement quality delivered by these sensors during flight is challenged by fast changes in pressure, temperature, and humidity, which are difficult to assess from concurrent ground-level measurements.
In this work, we focus on vertical distributions of aerosol absorption, measured with miniature absorption sensors on board small- and medium-sized UASs during two intensive field campaigns at contrasted locations in the eastern Mediterranean: an urban site (Athens, Greece) and a remote regional background site (Cyprus Atmospheric Observatory, CAO, Cyprus). The vertical distribution of aerosols in the eastern Mediterranean is of particular importance because it lies at the crossroads of diverse air masses (Lelieveld et al., 2002) carrying aerosol of different compositions, including mineral dust from Africa and the Middle East, pollution from Europe and the nearby Middle East, and marine aerosol (Erel et al., 2006; Gerasopoulos et al., 2007; Kalivitis et al., 2007). In addition, aerosol absorption measurements, whether ground or aerial based, are rather scarce in the region. The sites were selected to represent two different and contrasting sources of ambient aerosol, with high concentration levels of freshly emitted BC from traffic and/or biomass burning (domestic heating) in Athens and low concentrations of aged regionally transported aerosol, occasionally mixed with moderate levels of dust in Cyprus.
Aerosol vertical profiles were monitored using several types of fixed- and rotary-wing UASs. In addition to the aerial observations, three miniature attenuation monitors were also characterized against ground-based commercial instruments. Secondly, these miniature sensors were compared and characterized in-flight with different UASs and diverse absorbing aerosol concentrations and types.
Table 1Summary of UASs used during the Athens and Cyprus campaigns. A UAS is considered small if its gross weight is smaller than 25 kg and medium if its gross weight ranges between 25 and 50 kg.
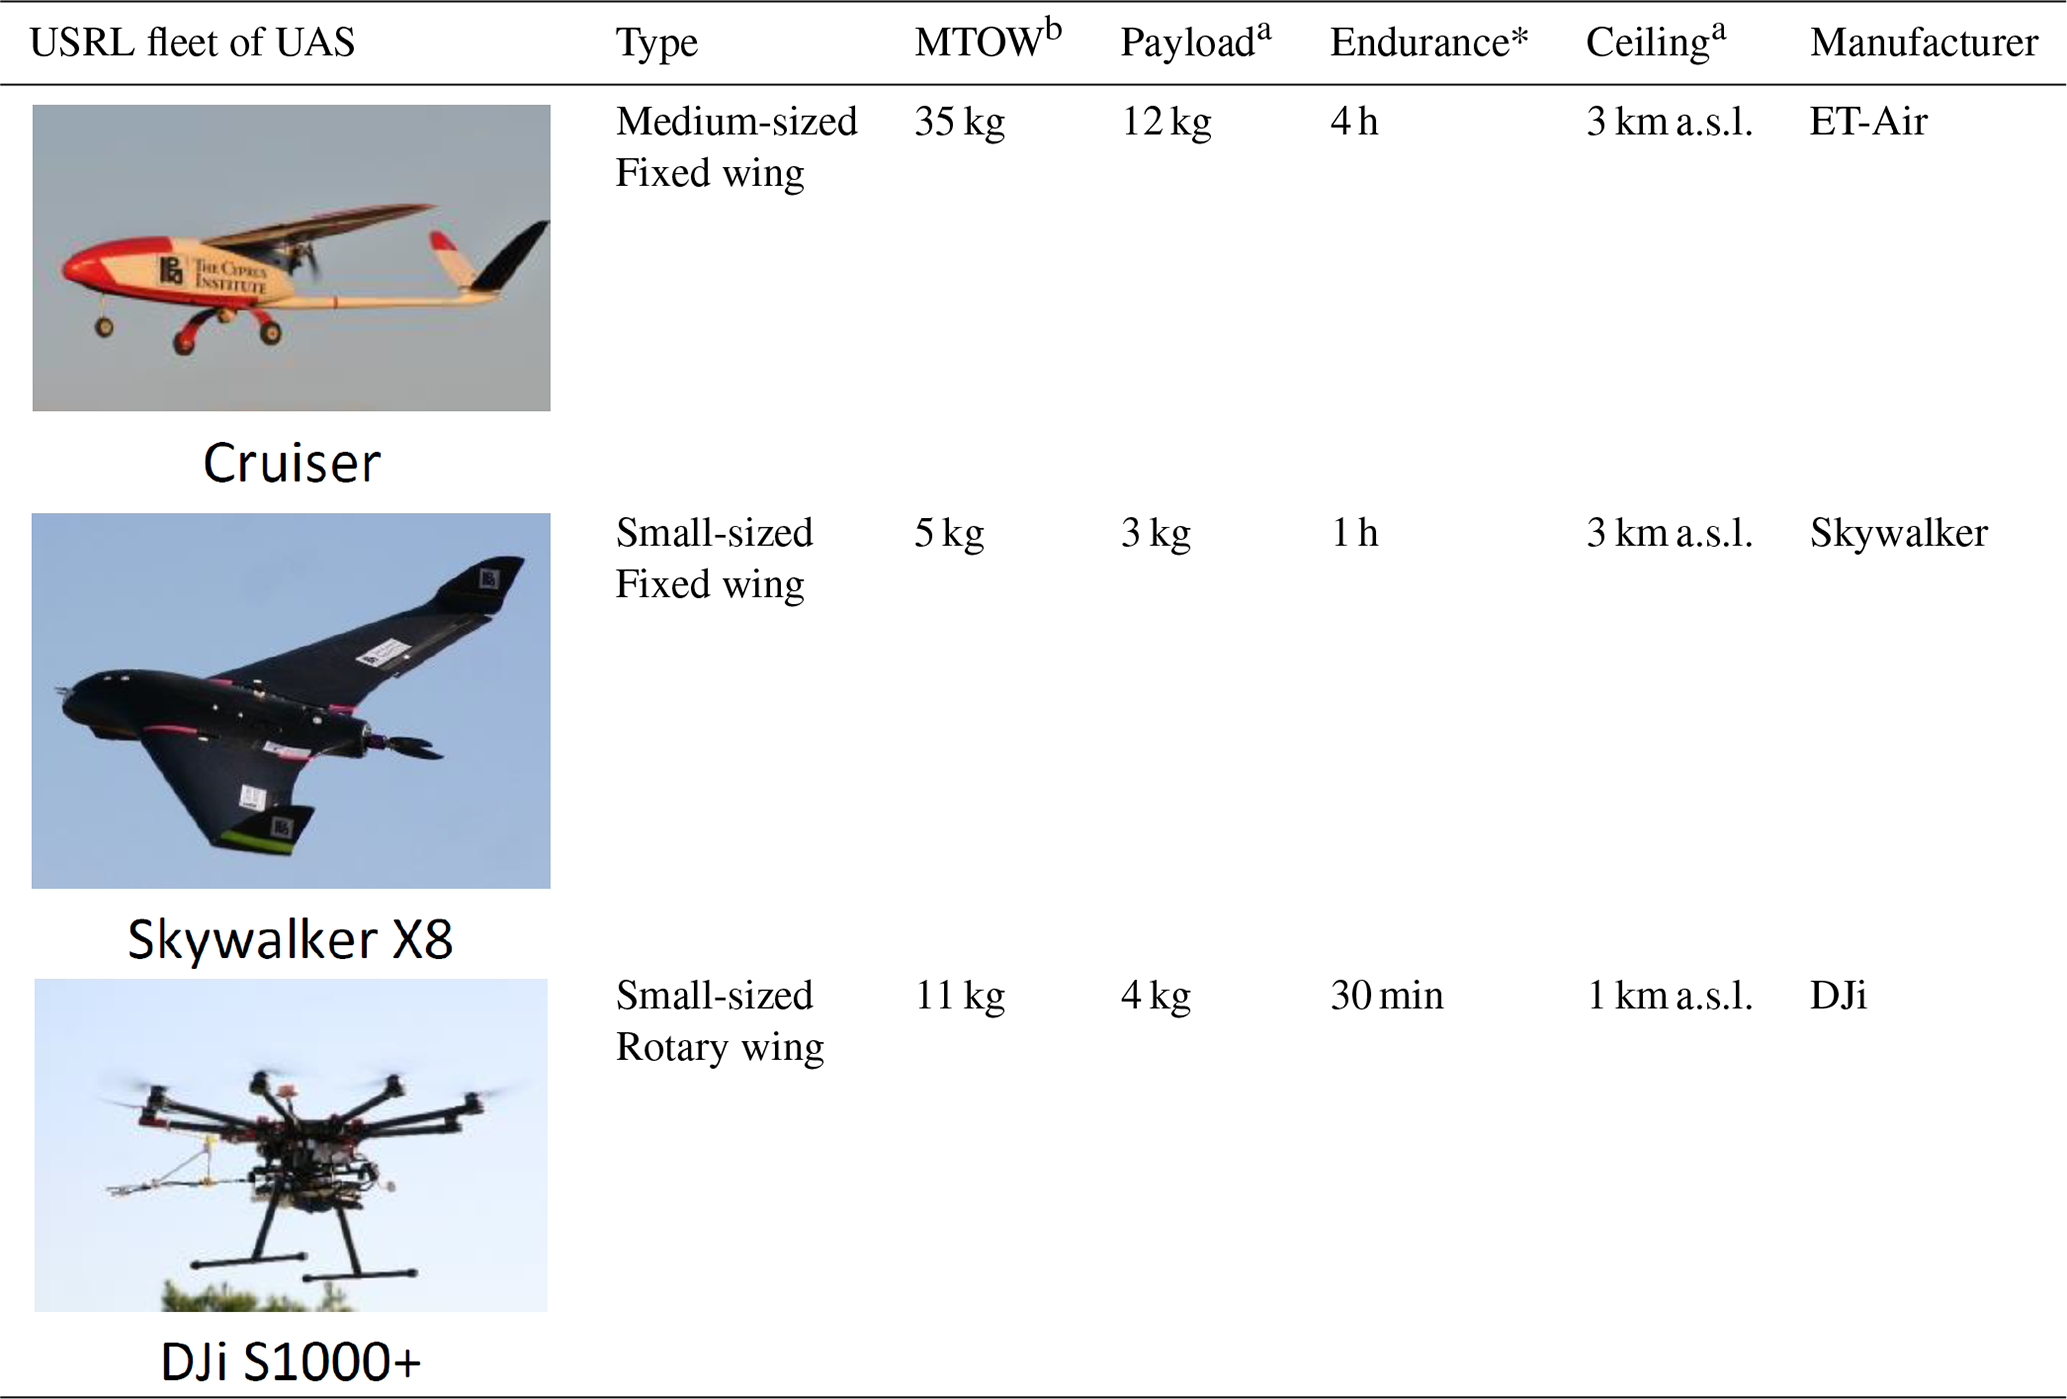
a UAS characteristics as configured specifically for these studies (BACCHUS and ACTRIS campaigns). b Maximum takeoff weight.
2.1 Unmanned aerial system types
Three types of UAS have been used in this study: they differ with respect to the payload, autonomy, wing type, and landing requirements. Their specifications and capabilities, described below, are summarized in Table 1. In addition and as mentioned before, UASs are characterized as small when their gross weight is less than 25 kg and medium if their gross weight ranges between 25 and 150 kg (US Federal Aviation Administration, CFR 14, 2015). Despite having the ability to reach altitudes higher than 2 km above ground level (a.g.l.), the UASs were limited to 1 and 2 km during the Athens and Cyprus campaigns, respectively, due to restrictions posed by the civil aviation authorities.
2.1.1 UAS “Cruiser”
The Cruiser is a medium-sized fixed-wing UAS (Table 1) with a payload capacity up to 12 kg, which also includes the weight of the fuel to power the engine and the battery used for the instrumentation. The Cruiser's payload bay, available inside the UAS, measures 1.3 m ×0.23 m ×0.34 m (). The UAS features a wingspan of 3.8 m. It has been configured with an internal combustion two-stroke engine placed in a push configuration enabling an altitude ceiling of 4 km and maximum takeoff weight of 35 kg. Depending on payload and environmental conditions the Cruiser can reach a flying endurance up to 8 h. During the flight, atmospheric sampling occurs at a velocity of 28±5 m s−1, which is the typical cruising air speed of this type of UAS. Under its current configuration the environmental conditions to ensure safe operation are limited to winds up to 13 m s−1 and temperatures above the dew point in order to prevent icing on the engine's carburetor. The Cruiser is equipped with an autopilot system (Micropilot MP2128G2), which includes all the sensors and telecommunication systems (e.g., GPS, barometric altimeter, accelerometer, air speed sensor, electronic compass, modems, antennas) that allows autonomous flights with real-time monitoring and control from the ground providing that predetermined flight plans are set. At any time, the UAS operator is able to modify the active flight plan in real time. In addition, the system is capable of detecting faults and alter its flight plan accordingly (e.g., automatically return to home upon communication loss). The modular design of the Cruiser facilitates switching instruments between scientific missions provided that the total mass does not exceed the payload limit. To support its multi-instrument capability, a central data acquisition system built around the National Instruments controller, myRIO, with a variety of interface possibilities and a graphical user interface (GUI), has been developed. The graphical programming language Labview (from National Instruments) has been utilized to develop the GUI with capabilities of real-time visualization of the instrumentation data as well as controlling and automation of the onboard instruments. All the instruments and avionics sensitive to vibration have been mounted into the Cruiser fuselage using special anti-vibration dampers in order to insulate them from the high-frequency oscillations produced by the UAS engine. Vibration insulation is essential in order to improve the flying reliability of the UAS as well as to keep the quality of the scientific measurements to its higher standards.
Due to the Cruiser's size, a flat (ideally paved) runway is required for takeoff and landing. During the Cyprus campaign, the Cruiser was taking off and landing on Cyprus Institute's private runway (see Fig. 1).
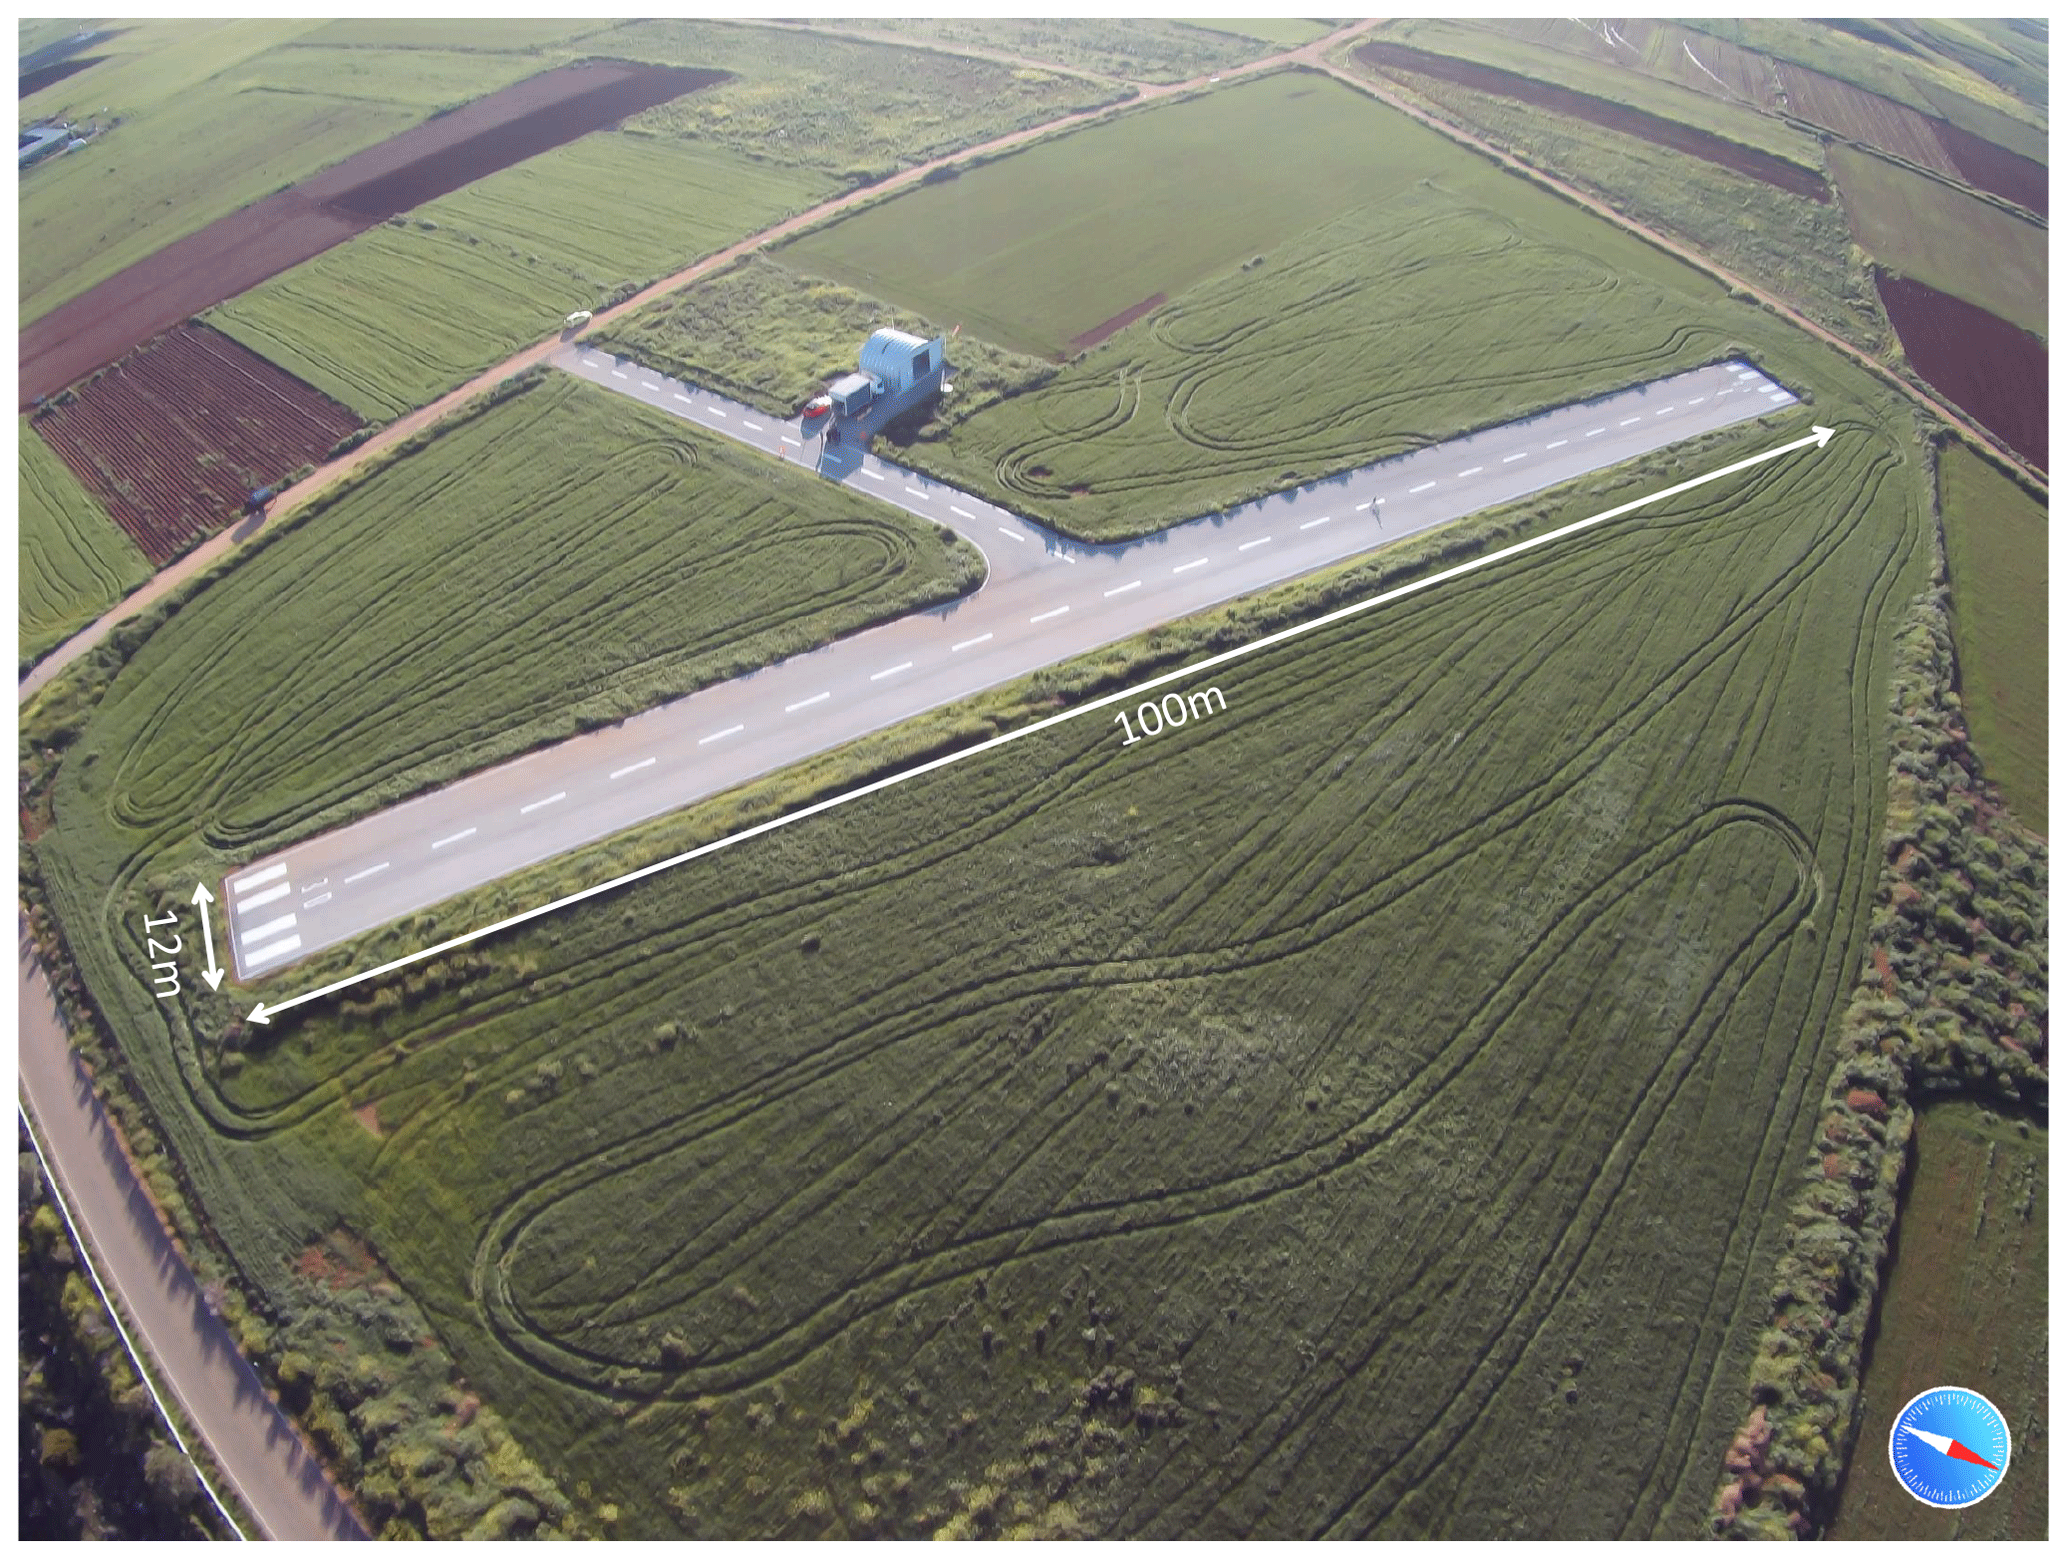
Figure 1Aerial view of the Orounda runway in Cyprus.
2.1.2 UAS “Skywalker X8”
The Skywalker X8 is a small delta-wing type UAS with an electric motor providing propulsion. Made from foam, it is a much smaller and lower-cost UAS compared to the Cruiser. Its wingspan is 2.10 m and its maximum takeoff weight is about 5.5 kg. It can fly for approximately 1 h up to 3 km altitude with a payload of ca. 3 kg, which includes the battery (14.8V Lithium Polymer, 9Ah) that powers the motor. This UAS is equipped with the same avionics as the Cruiser, maintaining all of its advanced automation characteristics. The Skywalker X8 can takeoff using a bungee launcher catapult system and can land on its belly on any flat surface, thus minimizing the requirements for a specialized aerodrome.
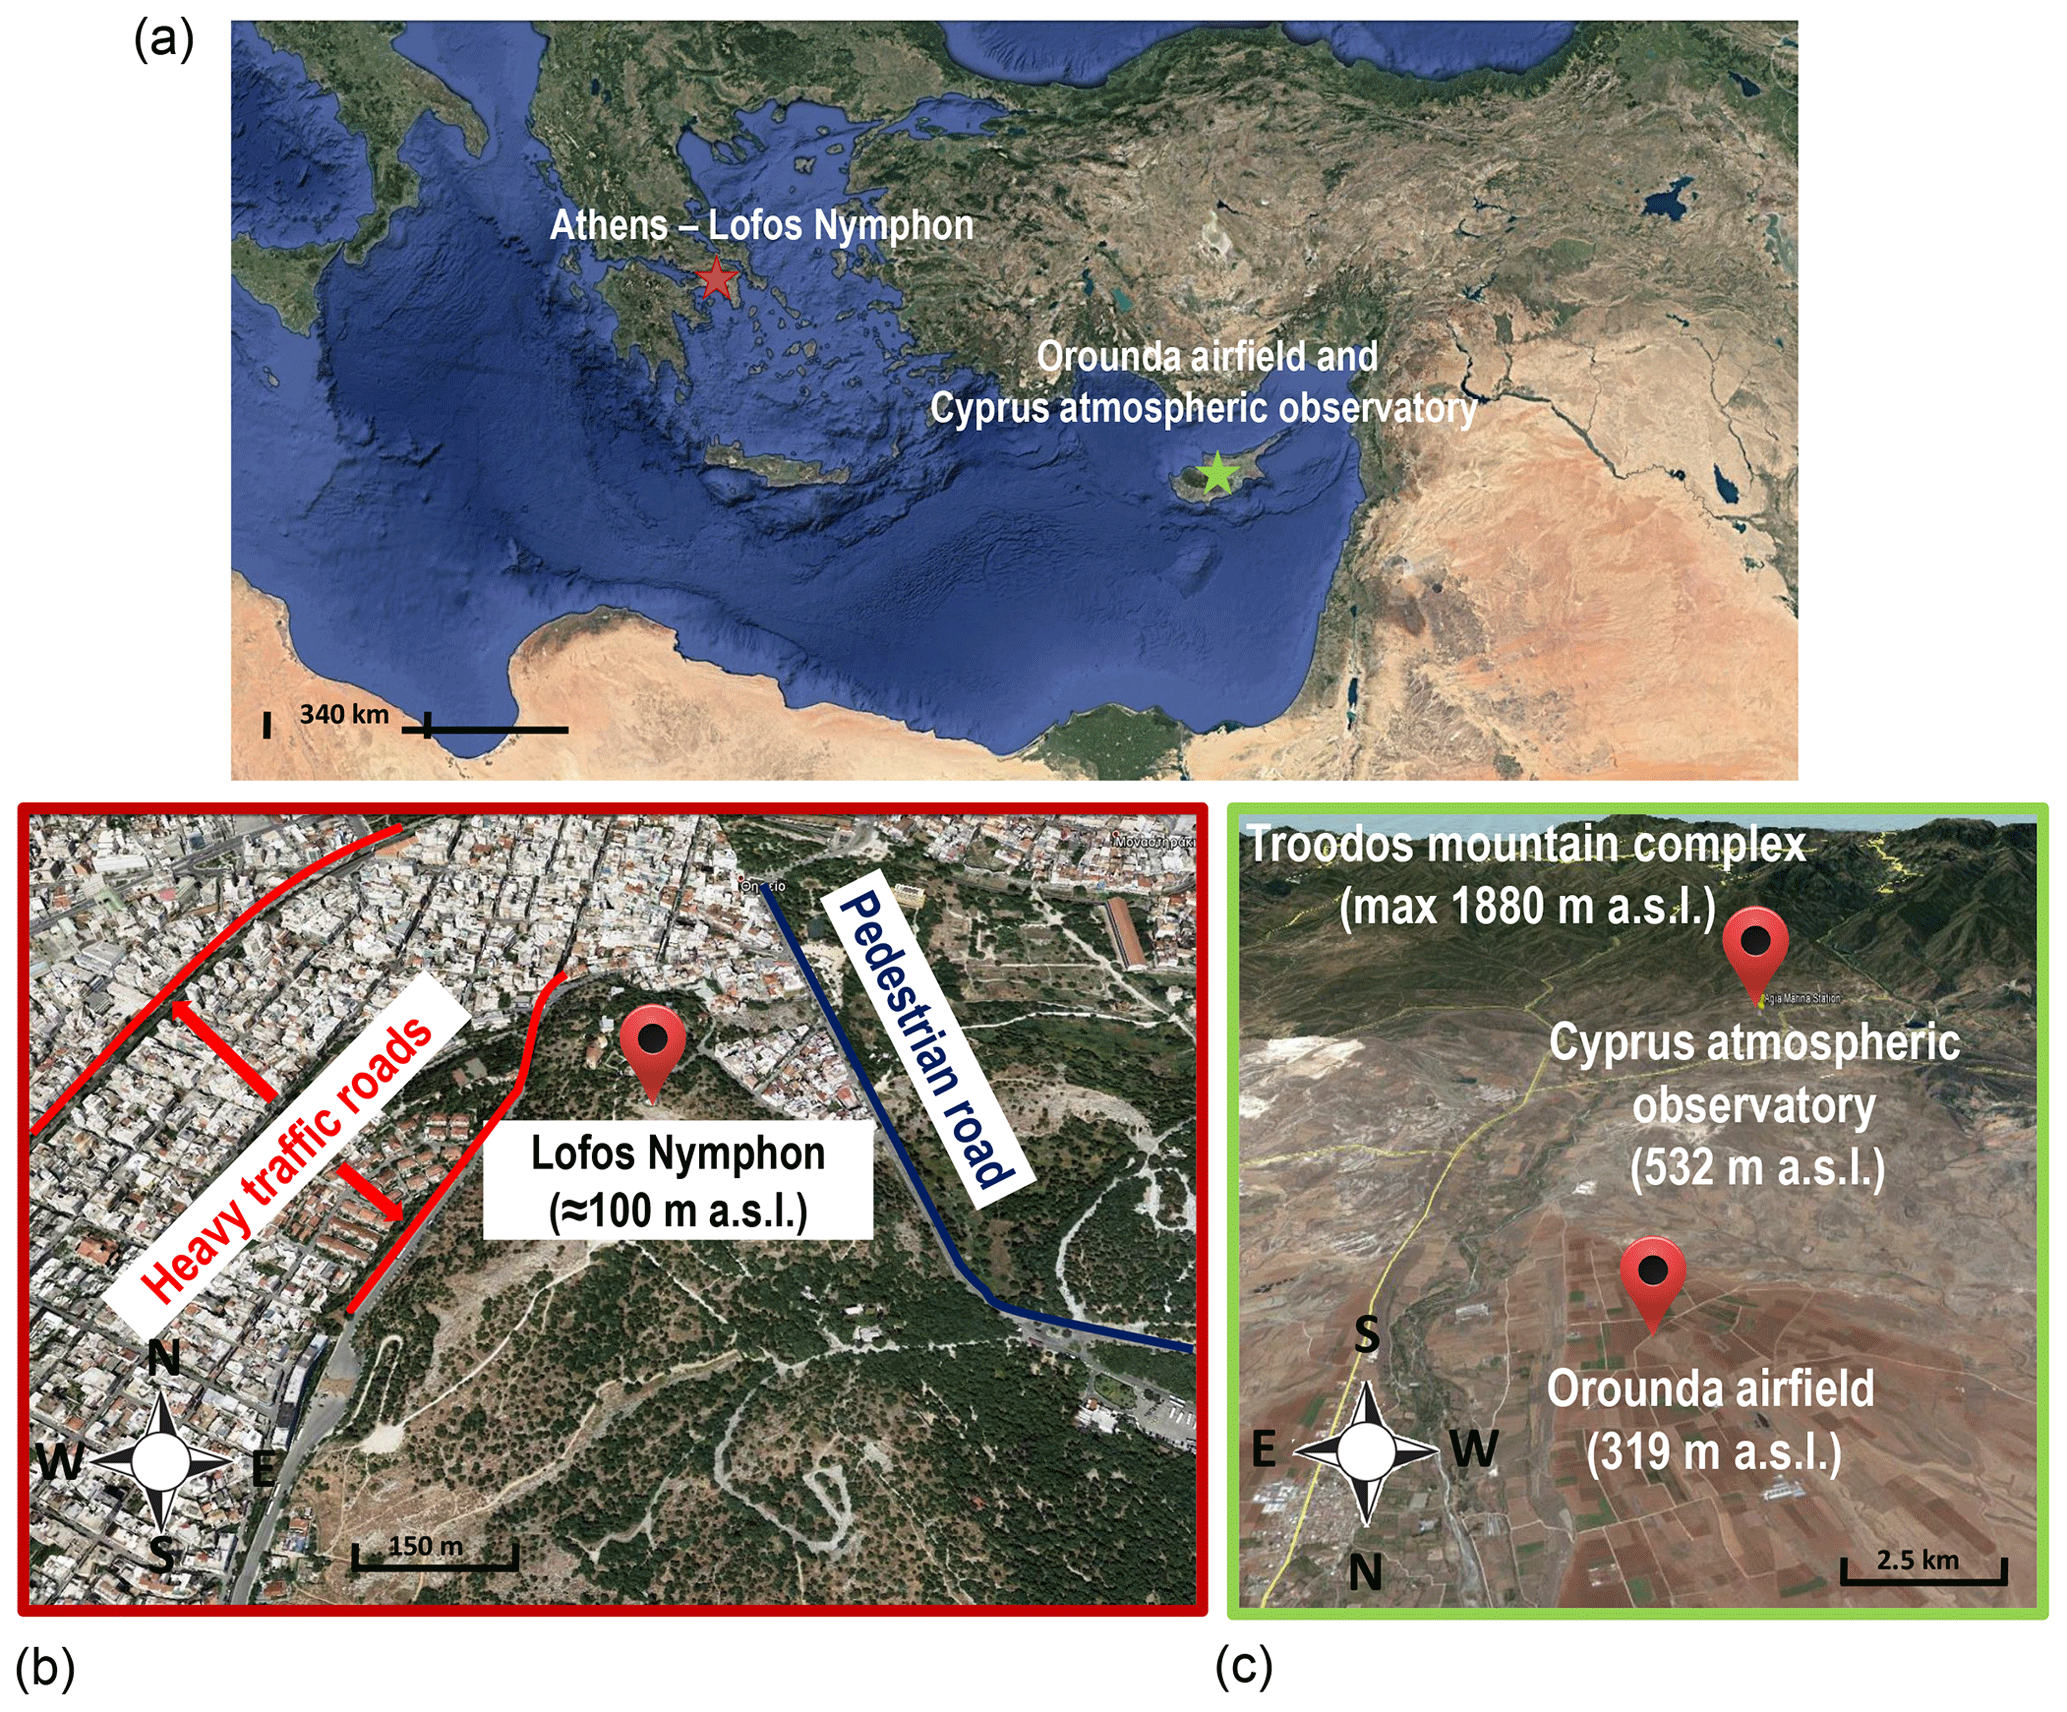
Figure 2(a) Location of the two sampling sites in the eastern Mediterranean. During the Athens campaign, sampling was conducted at Lofos Nymphon (b) surrounded by busy traffic roads (red line) and a touristic area (blue line) free of motor vehicles. During the Cyprus campaign (c), measurements using a UAS were conducted at the Orounda airfield and ground-based monitoring at the Cyprus atmospheric observatory (close to Agia Marina Xyliatou) at the foothills of the Troodos mountains. The elevation difference between these sites is noted. All images are courtesy of © Google Maps.
2.1.3 UAS “Multicopter S1000+”
A modified version of the commercially available octocopter DJi S1000+ was used during the Athens campaign to overcome strong constraints related to a limited ground area for takeoff and landing and flying in the limited air space. This platform has been optimized to reach an altitude up to 1 km above sea level (a.s.l.) for a maximum takeoff weight of 11 kg and a payload of 4 kg, including the motor battery (22 V Lithium Polymer, 22 Ah). In order to ensure that sampling was not influenced by the turbulence created by the octocopter's blades, the sampling inlet was extended by 1 m out of the propeller downdraft. This distance ensured representative sampling while ascending. However, during descent this length was not sufficient to avoid the created vortex when a columnar path was followed. During the Athens campaign, the landing site was near the edge of a cliff and inside an archeological area where pedestrians could freely access (Fig. 2), prohibiting deviation from a columnar flight path. As a result, the quality of the descent flights was compromised at the expense of safety and thus only ascending flights are used in this work.
2.2 Aerosol absorption instrumentation
2.2.1 Principle of operation
The most widely used instruments for the determination of the aerosol absorption coefficient are filter photometers. They sample ambient air through a filter, where the sample is collected. The filter is illuminated and the light transmitted through the filter is measured. Transmission of the sample-laden filter is normalized to the transmission of the sample-free filter (reference signal) and the attenuation is calculated based on Eq. (1).
where Iref(λ) and Isample(λ) are the reference and sample light intensities at the detectors under the filter, respectively, and ATN(λ) the attenuation at wavelength λ. The attenuation rate dATN(λ)/dt (calculated from consecutive measurements) determines the attenuation coefficient (batn(λ)) based on Eq. (2).
where A is the sample spot area, Q the airflow rate, and dt the time period for which the attenuation change is considered. It typically equals 1s for all the miniaturized instruments examined in this study. The instrument specific batn(λ) can be converted to absorption coefficient babs(λ), when accounting for the multiple scattering effects caused by the filter and/or by the sampled particles, together with the filter loading effects that the latter are causing. Due to a lack of a reference method for providing the aerosol absorption coefficient and because every manufacturer is using different filter materials, several empirical corrections have been proposed in the literature (e.g., Weingartner et al., 2003; Virkkula et al., 2005; Collaud Coen et al., 2010; Ogren, 2010; Drinovec et al., 2015). For instance, many studies reporting absorption measurements calculate babs(λ) based on Eq. (3) (Weingarter at al., 2003):
where C is the optical enhancement factor due to multiple scattering within the filter medium and R(ATN(λ)) describes nonlinearities caused by the particles loaded on the filter. Other absorption monitor manufacturers use different approaches for deriving babs(λ), which can be found in Sect. 2.2.2 and 2.2.3 for the instruments used in this study.
Table 2Summary of standardized properties of each attenuation monitor. The term λ refers to the wavelength used in nm. NA – not available.
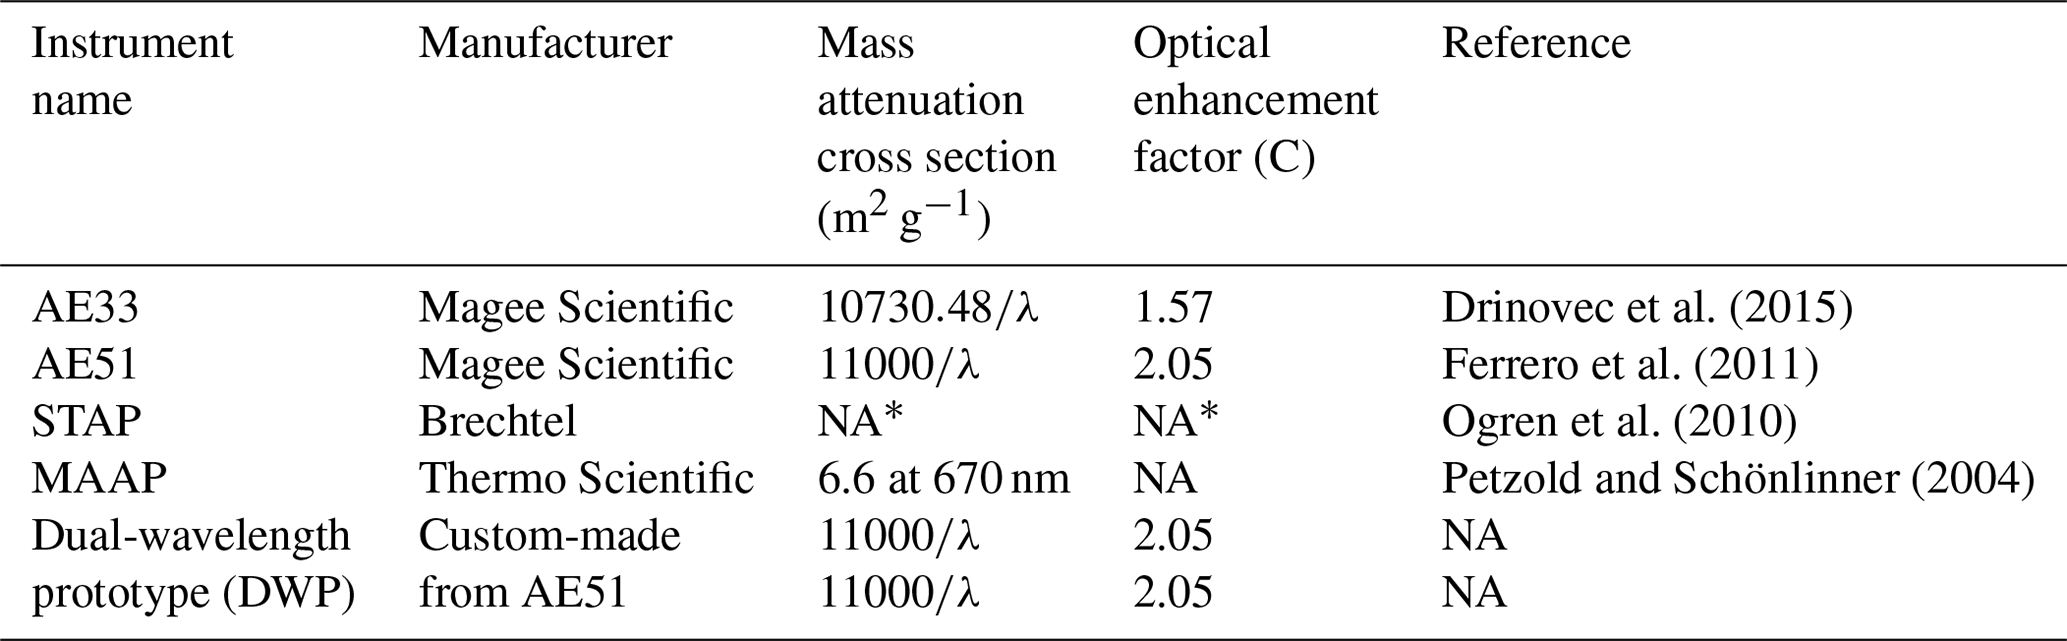
* Equation (7) is used instead.
The equivalent black carbon (eBC) mass concentration (expressed in µg m−3) can be calculated based on 880 nm wavelength batn(λ) (Ramachandran and Rajesh, 2007), using either Eq. (4) or (5),
where σatn(λ) is the mass attenuation cross section and MAC is the mass absorption cross section. Table 2 summarizes C and σatn(λ) factors used for each instrument in this study. Based on these two parameters MAC can also be calculated by combining Eqs. (3), (4), and (5). In this work, the term eBC was chosen instead of BC (Petzold et al., 2013) to stress that BC mass concentration is calculated from optical measurements.
Factor C is considered to be constant during each campaign as it is relevant to the filter tape only, while R is unity for an unloaded filter and reduces when particles are deposited onto the filter (Weingarter at al., 2003). The filter strip of the miniaturized instruments evaluated in this study is changed manually before every flight to keep the attenuation during a single flight below a threshold value of ATN < 0.1 to 0.2, above which loading correction is required (Weingartner et al., 2003; Ferrero et al., 2011).
2.2.2 Ground-based (reference) instruments (AE33, MAAP)
To overcome the filter loading effect discussed previously, Drinovec et al. (2015) developed the “dual spot” aethalometer (Magee Scientific, model AE33), which uses two sample spots where particles are deposited with different flow rates and one “blank” spot as reference. The principle idea behind this approach is that any artifact induced by the accumulation of the particles onto the filter will have the same characteristics (i.e., both sample spots are probing the same particles), but the magnitude of saturation on each spot will differ due to the different amount of the sample on each respective spot. By combining the results from both sample spots, the measurements are extrapolated to zero loading and the compensated and corrected eBC mass and light absorption can be obtained without using any assumptions on the physicochemical properties of the measured particles.
Another approach for reducing the measuring biases in particle absorption coefficient induced by the accumulation of particles collected on the filter sample spot is employed by the Multiangle Absorption Photometer (MAAP) instrument (Thermo Fisher Scientific), which applies corrections on the measured absorption coefficient based on the sample-laden particles' scattering at different angles (Petzold and Schönlinner, 2004).
In this study, these two commercially available absorption monitors (Magee Scientific – Model AE33; Thermo Scientific Fisher – multi-angle absorption photometer, model 5012) were used as a ground-based reference for UAS-based absorption measurements. Nominally MAAP measurements, which have been shown to agree well against other methods (Sheridan et al., 2005), were used after being corrected based on Eq. (6) (Müller et al., 2011).
where babs(637) is the absorption coefficient at 637 nm (expressed in Mm−1), the specific mass absorption coefficient of black carbon proposed by the MAAP manufacturer is equal to 6.6 m2 g−1 (Petzold and Schönlinner, 2004), and eBC is the equivalent mass concentration of black carbon reported by the instrument (in µg m−3). Equation (6) assumes that the MAAP operates at a nominal wavelength of 637 nm, as measured by Müller et al. (2011), and not at 670 nm, as proposed by the manufacturer.
The absorption coefficient at wavelengths other than 637 nm was calculated based on the Ångström law (Eq. 7).
where τ(λ) and τ(λ0) are the calculated and reference absorption parameters, respectively, and α is the absorption Ångström exponent (AAE). The reported eBC measurements of AE33 were used to calculate batn(λ) and babs(λ) based on Eqs. (3) and (4) and using values of mass attenuation cross section and optical enhancement factor reported in the literature (Table 2). In this work, the absorption coefficient calculated by the AE33 will be scaled to match measurements from MAAP. For the MAAP instrument, the reference absorption (λ0) is at 637 nm, as suggested by Eq. (6). The Ångström exponent was calculated by linear regression of the natural logarithm of the seven wavelength absorption coefficients measured by AE33 (370, 470, 520, 590, 660, 880, and 950 nm) and used for extrapolating into shorter and longer wavelengths of the absorption coefficients measured by the MAAP. Loading correction was not applied to the AE33 measurements as it incorporates a loading compensation measurement scheme (Drinovec et al., 2015).
The AE33 was always operated at a 1 min time resolution; the MAAP operated at a 30 min time resolution during the Athens campaign and at a higher (2 min) time resolution during the Cyprus campaign.
Table 3Characteristics of the miniature absorption instruments.
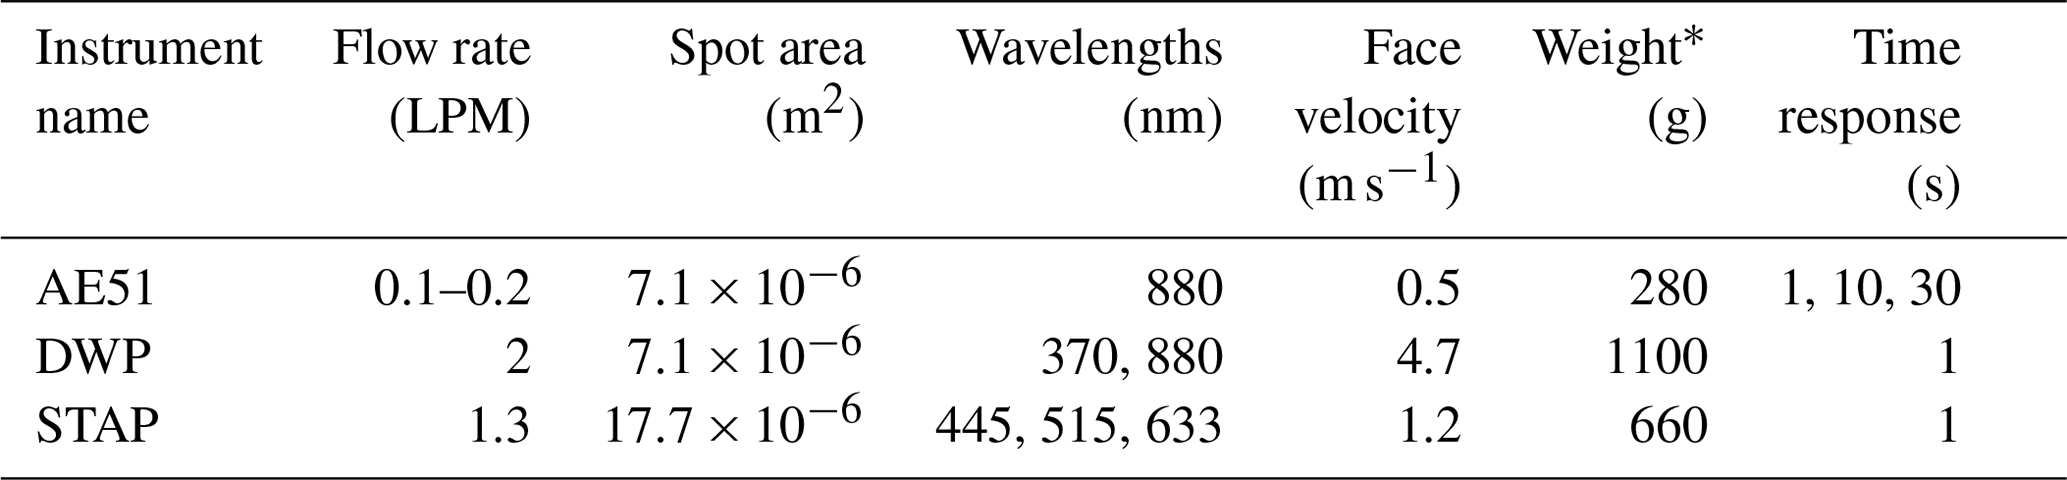
* Refers to the weight of the instrument alone. Dryer and sampling inlet used are not accounted for.
2.2.3 Miniature absorption monitors (AE51, DWP, STAP)
Three miniaturized instruments having optimal specifications to fly on board UASs were evaluated. They consist of (1) a single-wavelength commercially available absorption monitor (Aethlabs, Model AE51), (2) a dual-wavelength prototype (DWP) monitor based on the AE51 concept, and (3) a single-channel tricolor absorption photometer (STAP; Brechtel Inc – Model 9406). These three instruments will be referred to as AE51, DWP, and STAP, respectively, in the following sections. Table 3 summarizes the characteristics of each monitor.
The AE51 is the lightest instrument (280 g), which is a major asset for small UAS observations. On the other hand, due to a relatively low air sampling flow rate (0.1–0.2 L min−1 set by the user), it may lack sensitivity for low concentrations of absorbing aerosols, which can be an issue when investigating the low amounts of aerosols usually met aloft. The two other instruments (DWP and STAP) have higher flow rates (2 and 1.3 L min−1, respectively), which may improve sensitivity for low concentrations. These two instruments also have the potential to derive additional information regarding absorbing material (other than black carbon) using the aethalometer model reported by Sandradewi et al. (2008). On the other hand, they are significantly heavier (660 g and 1.1 kg for STAP and DWP, respectively), which may represent a major constraint on small UAS operations. The DWP has been constructed as a modification of the AE51, by placing an additional light source emitting at 370 nm. Additionally, the sampling flow rate has been increased to 2 L min−1, by replacing the original AE51 pump with an external pump whose flow rate is controlled by a critical orifice. The external pump resulted in additional weight to DWP. In order to assess the possible impact of changes in relative humidity on the attenuation measurements, a second DWP monitor was installed in series behind the one which has been evaluated here. The hypothesis here is that both DWP should be similarly affected by artifacts induced by water absorption and desorption onto the filter strips. An underlying assumption is that both monitors were operating under the same temperature. Under normal (dry) conditions, the second DWP should always report zero concentrations.
The STAP, formerly named ABS (see Bates et al., 2013) has been manufactured following the design of the Particle Soot Absorption Photometer (PSAP; Bond et al., 1999), except that the detection electronics have been completely redesigned to significantly improve signal-to-noise and provide a detection limit of ∼0.2 Mm−1. Light from three LED sources with wavelengths centered at 445, 515, and 633 nm (Table 3) is alternatively transmitted through glass windows with 50 Hz frequency. The diffused light, which is transmitted through two filter-holding spots that typically carry glass fiber filters, is continuously monitored by two photodetectors. One filter spot is only loaded with the sample aerosol while the other remains sample-free, acting as a reference. The highest measurement rate achieved is 1 Hz. The glass fiber filters minimize light from being transmitted in the forward direction (forward scattering), thus reducing the bias due to scattering by the collected aerosol, while they allow the sampled particles to be embedded within the filter, integrating them in the optically diffusive environment. A laminar flow element is used to measure the sample volumetric flow rate in real time and an onboard software automatically controls the small integrated vacuum pump to maintain a constant sample volume flow independent of the unmanned aerial vehicle altitude. The sample flow is dried to eliminate artifacts due to water uptake by the filters.
Calculated absorption from the three miniature instruments was derived directly from the sample and reference signals, using Eqs. (1), (2), and (3) without taking into account the computed eBC or batn(λ) reported by the instruments. For AE51 and DWP, the difference between the calculated and reported absorption values was 0.01 % or less. The batn(λ) reported by STAP was initially processed with a 60 s moving average which was deemed too long. To address that issue, a custom-made moving average was applied to the raw (1 Hz time resolution) babs(λ) signal in order to reduce the signal-to-noise ratio (more details in Sect. 4). Furthermore, this custom moving average allowed a more accurate determination of babs(370) and babs(880) based on Eq. (7) for STAP. The STAP manufacturer suggests conversion from batn(λ) to babs(λ) based on Eq. (8) (Ogren et al., 2010), which also accounts for loading artifacts. This conversion has been applied explicitly on STAP measurements instead of Eq. (3) (which has been applied to other miniature absorption monitors).
where I(t) is the attenuation at a given time (t) and Iwf the measured attenuation of a clean and new filter under particle-free air.
Sampling was conducted at two contrasting locations in the eastern Mediterranean basin: an urban site (Athens, Greece) for a weeklong intensive period starting from 14 January 2016 and a background location in Cyprus for a monthlong intensive campaign in April 2016.
3.1 The Athens campaign
In the framework of the European project ACTRIS 2 (Aerosols, Clouds, and Trace Gases Research Infrastructure), three miniaturized absorption instruments were tested and intercompared for a period of 1 week (14–21 January 2016), on board a multicopter over Athens, a city highly impacted by strong UV-absorbing domestic heating biomass burning aerosols during winter (Florou et al., 2017; Fourtziou et al., 2017). Flights were conducted at Lofos Nymphon (37∘58′19.68′′ N, 23∘43′5.32′′ E) situated at the historical center of Athens, a metropolitan area of more than 4 000 000 inhabitants. Lofos Nymphon is a rock plateau inside a small forested area (Fig. 2), at a 50 m elevation from its surroundings. Traffic roads, marked with red lines in Fig. 2, are located west of the site, the closest of which is 150 m away from the measurement site. In order to comply with air space restrictions made by the Hellenic civil aviation authorities at Lofos Nymphon, the multicopter, described in detail in Sect. 2.1.3, was selected for its capacity to takeoff and land vertically.
A total of 26 flights were performed during periods without precipitation or strong winds. Each flight lasted for 15min and reached as high as 1 km a.s.l. in altitude, a limit set by the Hellenic civil aviation authorities.
During this campaign, the flight plan has been elaborated as the following: two early morning flights were performed at an interval of ca. 1 h starting at sunrise (05:00 UTC) to investigate the stratification of the atmosphere (boundary layer, low free troposphere). Two late afternoon flights ending approximately at sunset (16:00 UTC) were performed to investigate the vertical mixing of urban emissions in the atmospheric column. On 19 January 2016, intensive (hourly) flights were performed to investigate the impact of the diurnal development of the boundary layer on the vertical distribution of absorbing aerosols. These flights are further discussed in Sect. 7.
Due to payload restrictions (2 kg maximum for scientific instrumentation and another 2 kg payload for the batteries, dryer, and inlet), not all the miniature monitors could fly simultaneously on board the multicopter. The monitors that could not fly were operated at the colocated National Observatory monitoring station at Lofos Nymphon, together with two commercially available instruments (AE33; MAAP). In addition, the absorption monitor on board the multicopter was set to measure at ground level for 2–3 min before and after each flight for a direct comparison against ground-based instruments.
3.2 The Cyprus campaign
In the framework of the European project BACCHUS (Impact of Biogenic versus Anthropogenic emissions on Clouds and Climate; towards a Holistic UnderStanding) a 1-month campaign (30 March–28 April 2016) was performed at the Cyprus Atmospheric Observatory (CAO, 35∘2′17.97′′ N, 33∘3′28.50′′ E), a remote regional background site at the Agia Marina Xyliatou in Cyprus.
Vertical profiles of aerosol absorption were performed above a dedicated UAS airfield (35∘5′41.93′′ N, 33∘4′54.26′′ E) located approximately 7 km north of the CAO (Fig. 2). The airfield, shown in Fig. 1, is associated with a 500 m radius (in the x–y plane) UAS airspace and an additional 500 m radius buffer zone, yielding a total of 1 km radius flight zone granted by the Cypriot civil aviation authorities and extending up to a height of approximately 2.4 km a.g.l. (2.7 km a.s.l.).
In this work, only the absorption measurements will be examined corresponding to a total of 17 flights performed with the Skywalker X8 and 6 flights with the Cruiser. The UAS flight strategy was designed to characterize the boundary layer and free troposphere with respect to aerosol absorption, number size distribution, and ice nuclei (IN) concentrations (see Schrod et al., 2017). The typical UAS flight period usually spanned from sunrise (05:00 UTC) to 09:00 UTC. Two types of fixed-wing UASs were used during this campaign: two Skywalker UASs (Model X8) and one Cruiser UAS (see Sect. 2.1). Skywalker X8 flights typically lasted 30 min, while each Cruiser flight lasted between 1 and 1.5 h. Vertical profiles were performed almost on a daily basis provided meteorological conditions were favorable and engaged a team of eight persons (two pilots, two ground control station operators, two electronic and mechanical engineers, and two scientific staff for the operation of the miniaturized instruments).
Ground-based absorption measurements were conducted in parallel at CAO using two commercially available instruments (AE33 and MAAP; see Sect. 2.2.2). CAO is located 6.74 km south and at a 200 m elevation from the airfield (Fig. 2). Because of no significant local contamination sources in the surrounding area (Kleanthous et al., 2014; Pikridas et al., 2018), it has been assumed that the atmospheric composition at CAO and the UAS airfield were similar, allowing a direct comparison between the ground and airborne measurements. During this campaign, regional dust transport originating from Africa was identified on two occasions: 9 and 20 April 2016 (Schrod et al., 2017).
During both campaigns lidar measurements at 532 nm from the EARLINET PollyXT-NOA system, described by Engelmann et al. (2016), were used to detect the planetary boundary layer (PBL) depth. During the Athens campaign, measurements were colocated with the in situ measurements described in Sect. 2.2.2. During the Cyprus campaign, the PollyXT measurements were located 21 km east of the ground-based measurements. Nevertheless, spatiotemporal homogeneity has been observed between the two sites for that specific period (Mamali et al., 2018; Marinou et al., 2019). The PollyXT lidar quick looks from both campaigns can be found online (http://polly.tropos.de, last access: 1 October 2019).
The three miniature absorption monitors were set to sample at a rate of 1 Hz. However, all measurements were subjected to non-negligible instrumental noise (defined as one single standard deviation of the absorption coefficient) making the data exploitation for short time intervals challenging. The use of a standard averaging method (average, rolling average, least-squares fit) would require setting a fixed time step during which all measurements will be averaged regardless of the signal-to-noise ratio. This will reduce noise but may compromise the need for high time (spatial) resolution required for UAS-based vertical profile measurements. Instead, Hagler et al. (2011) proposed a method where the averaging step is not defined by the time but is based on the measured attenuation. In that method, named optimized noise-reduction averaging (ONA), dATN(λ)∕dt should only be positive or zero (but not negative, an assumption which is valid in our case without any fresh volatile sample fraction). As a result, for a predefined configuration (sample volume, sample spot area), the same averaging attenuation step (ΔATN) will require more data points to be averaged during periods with low atmospheric concentrations (i.e., lower time resolution) compared to periods with high atmospheric concentrations. Therefore, using ONA, the averaging time step is dynamically set to be inversely proportional to the sampled concentration (see also Eq. 2), resulting in a fixed signal-to-noise ratio. Since the method is based on attenuation changes, it can only be applied to individual spots, where the sample is accumulated, in a continuous monitor or an individual filter in semicontinuous monitors such as the miniature absorption monitors investigated in this work.
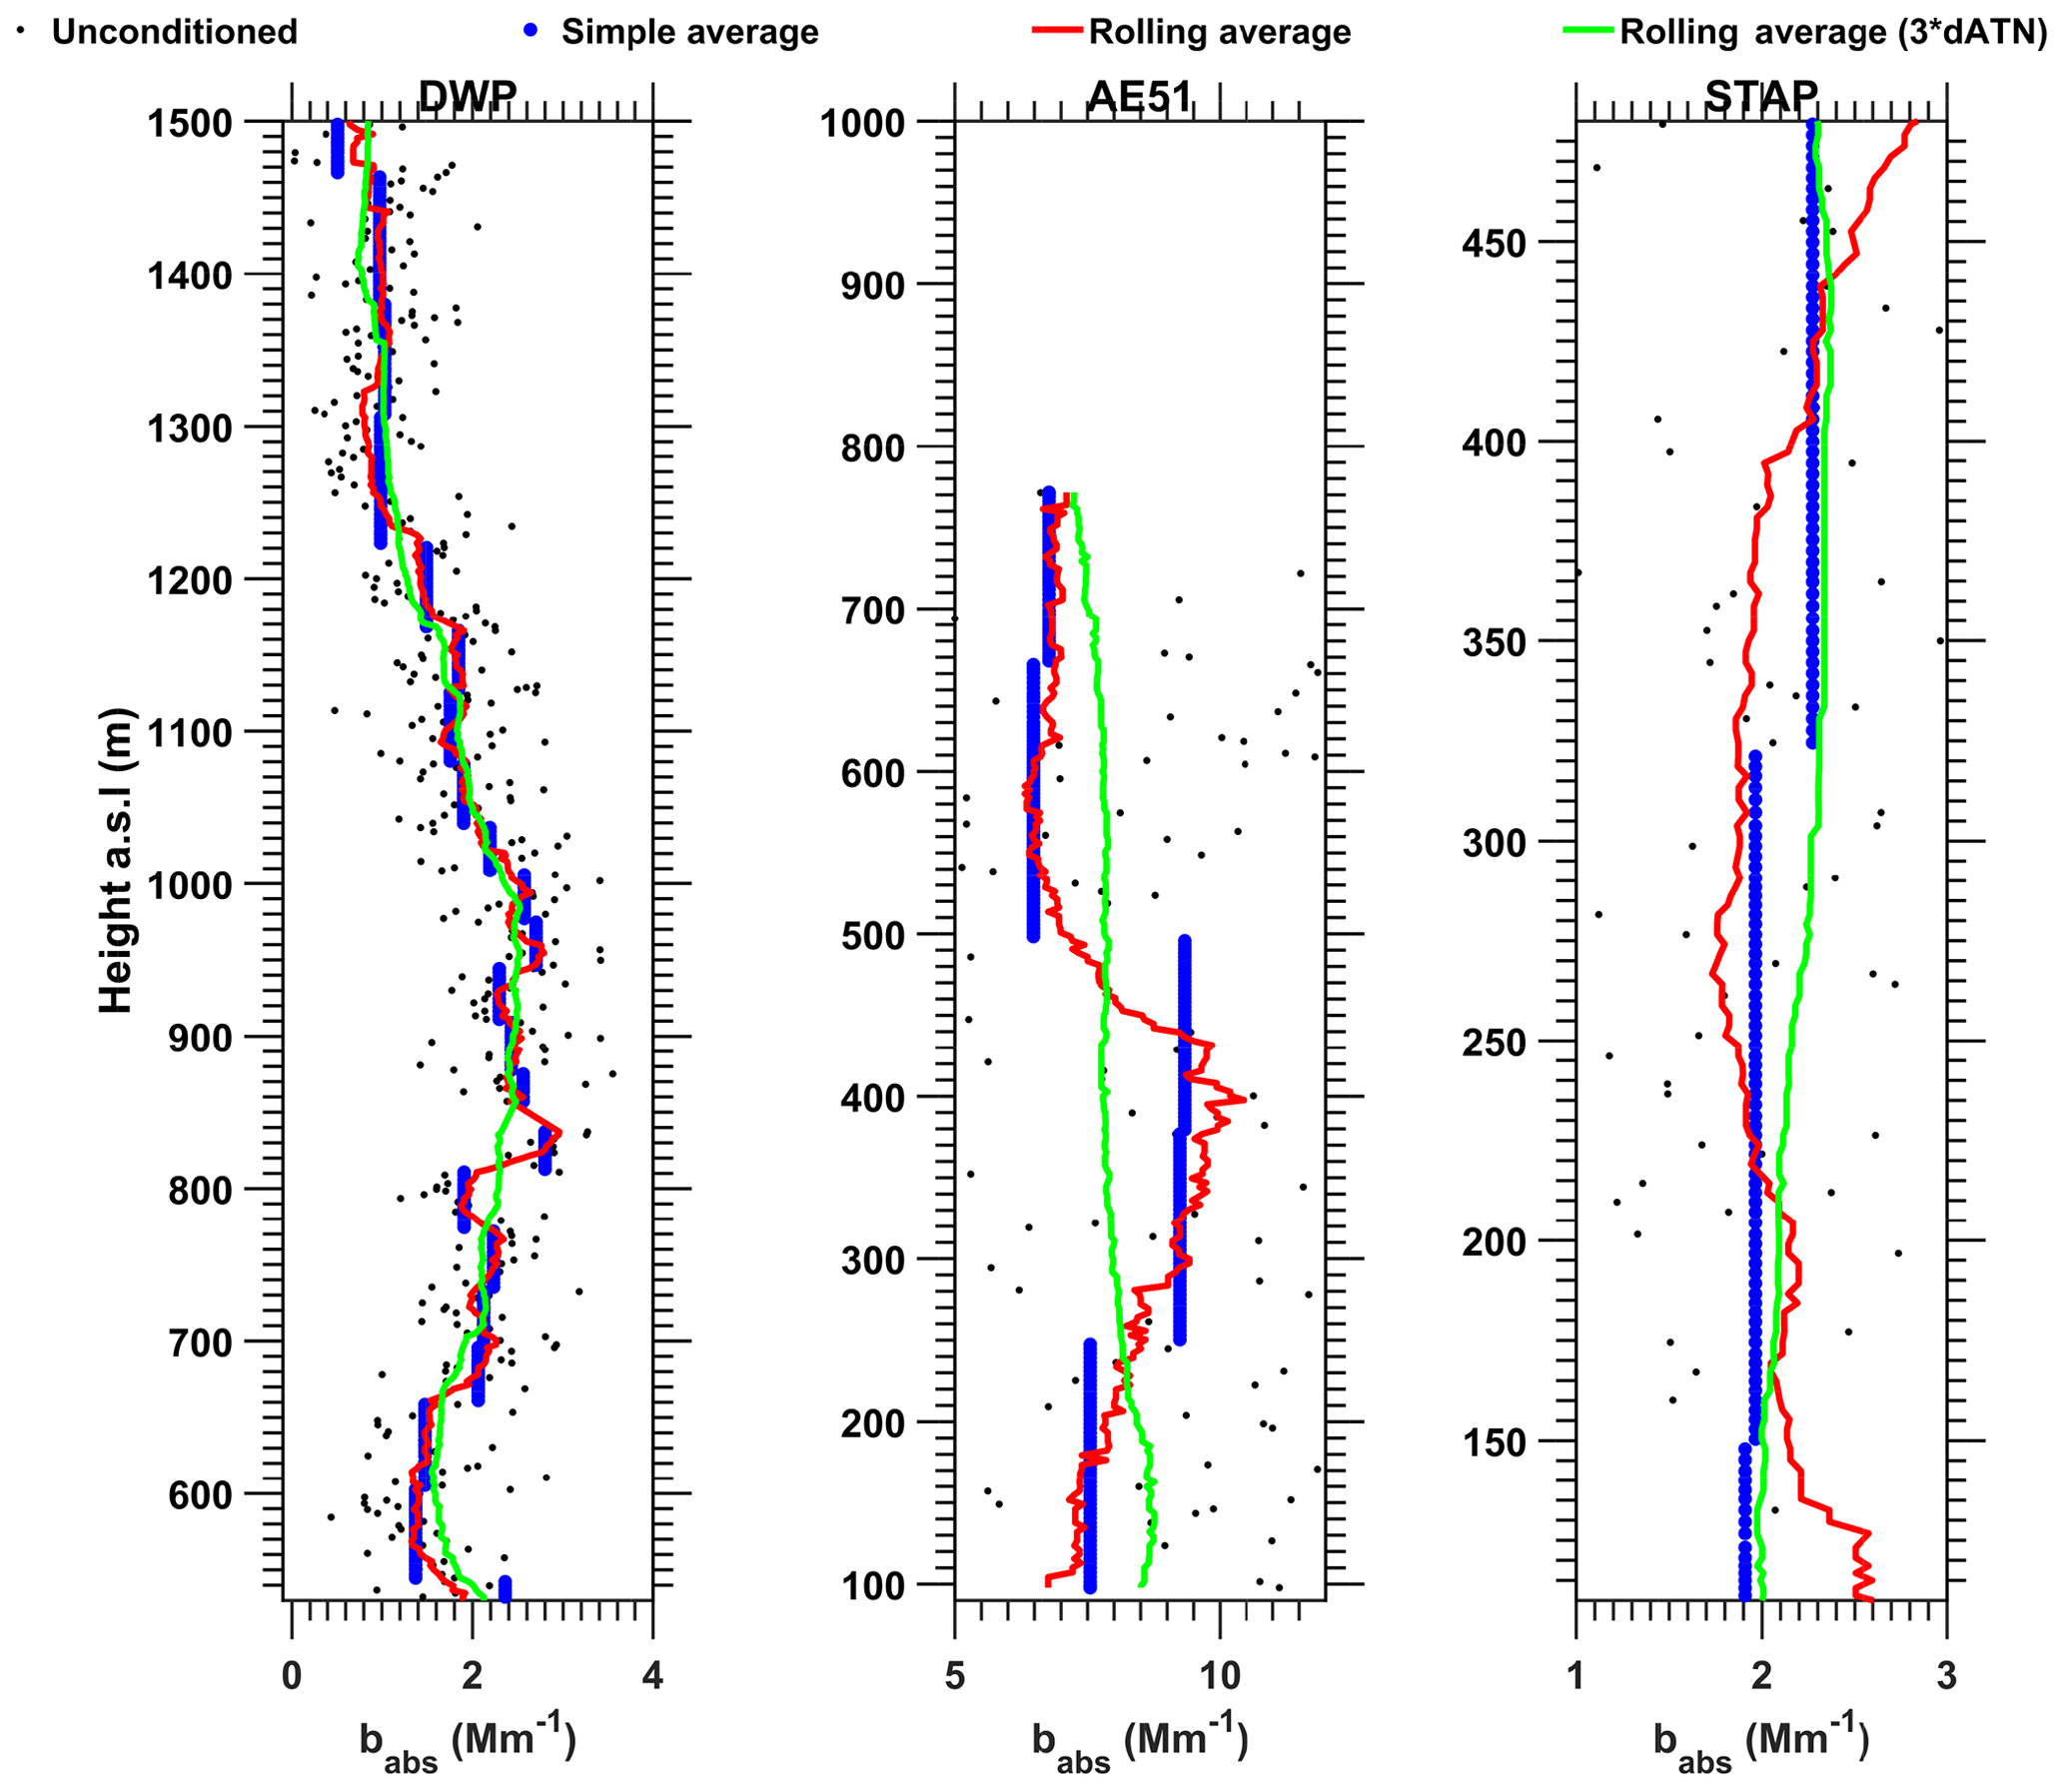
Figure 3Examples of the use of the improved ONA algorithm for the three attenuation monitors examined in this study. Raw data (black dots) are shown against the traditional ONA algorithm (Hagler et al., 2011; blue), the improved ONA using a rolling average and the ΔATN proposed in Sect. 4 (red), and the improved ONA using the rolling average but with increased ΔATN by a factor of 3 (over-smoothed green). The proposed ΔATN used are 0.01, 0.03, and 0.03 for AE51, DWP, and STAP, respectively.
The algorithm proposed by Hagler et al. (2011) results in an integrated-like (fragmented) data structure that lowers the vertical resolution of our UAS-based absorption measurements significantly (blue dots in Fig. 3). To cope with this issue, an improvement of the ONA algorithm is proposed here. A moving average is implemented instead of the one applied in the ONA algorithm, resulting in a more continuous-like data structure and improved vertical resolution (red dots in Fig. 3). If more than one wavelength is monitored, then the improved ONA algorithm can be applied to each of the wavelengths but based on the same attenuation, in order to produce comparable averaging results. The same strategy can be applied to external datasets for comparison purposes, provided they are produced or conditioned to have the exact same time resolution.
The flow diagram of the proposed improved ONA algorithm is presented in Supplement Fig S1. A link to the actual code is also provided, via a file-sharing portal, in the Supplement. The user supplies attenuation and instrument response (e.g., eBC mass, babs, or an external measurement) as time series along with the desired attenuation step (ΔATN). The calculated time interval includes attenuation values in the range [ATN, ATN] centered at the selected data point. If the attenuation change of a data point is greater by 0.5×ΔATN with respect to its neighbors, then this data point will not be smoothed. The time interval is limited to correspond to only one sample spot. The same averaging times can be then applied to the remaining monitored wavelengths, if any. Discrepancies could arise when abrupt concentration gradients are sampled, e.g., monitoring the vertical profile of a polluted boundary layer followed by clean air masses. In this case, the rate of attenuation change will decrease, since the air mass contains less absorbing aerosol. If the concentration gradient between the two layers is large enough, the algorithm may lead to a fictitious shift of the boundary layer height because more data points from the clean air mass than the polluted boundary layer will be accounted for in the average. The discrepancy is solved if weights inversely proportional to the number of data points are used for the average before (ATN) and after (ATN) the sample point to be examined. The improved ONA algorithm incorporates filters that cope with this problem. Erroneous results may also arise from outliers in the time series, especially if small ΔATN is applied or if the time series is over smoothed. An example of over smoothing is shown in Fig. 3 (green line). For all the reasons discussed above, it is advised to examine the result using different ΔATN and against the raw input.
High ΔATN values will reduce noise but reduce the time (vertical) resolution. A ΔATN equal to 0.01, 0.03, and 0.03 is suggested for AE51, DWP, and STAP, respectively, and these values take into account the air face velocity set for each instrument. Vertical profile case studies are therefore discussed later in Sect. 7 with the above-proposed attenuation steps. Note that Hagler et al. (2011) suggests a higher ΔATN, equal to 0.05, for all monitors regardless of individual face velocity.
Despite the fact that all the available methods have the scope for reporting the mass concentration of BC, discrepancies between the different techniques or even instruments that are based on the same operating principles have been reported (eg., Watson et al., 2005; Slowik et al., 2007; Müller et al., 2011). These discrepancies are not only attributed to the different measurement techniques and instruments used but also to the large variability of the physicochemical properties of atmospheric or laboratory-generated carbonaceous particles. For instance, the optical properties of carbonaceous particles depend on their size and morphology (Bond and Bergstrom, 2006; García Fernández et al., 2015), on their mixing state and/or coating thickness with other atmospheric relevant species, including sulfate, water, organic, or dust (Lack and Cappa, 2010; Shiraiwa et al., 2010; Lack et al., 2014; Liu et al., 2015; Zhang et al., 2015, 2018) As a result, aerosol absorption measurements need to be associated with a comprehensive understanding of the methods and uncertainties associated with each instrument and how they have been operating and operated in the field. Condensation or volatilization of water on the filter spot of the miniature sensors can greatly affect absorption measurements (Hale and Querry, 1972; Düsing et al., 2019). In order to minimize this artifact, a custom-built (lightweight) silica-gel dryer was installed at the inlet of each miniature sensor and regenerated before each flight. Each sensor operated with its own respective inlet and dryer during both campaigns and even when two sensors were airborne simultaneously in one UAS. However, to reduce weight, no size-selective inlet was employed. Ground-based sensors were similarly configured, at least when UAS flights were ongoing.
In the following sections, the level of agreement, at the 95 % confidence interval (CI) between standard (rack) size absorption monitors and miniature absorption sensors will be evaluated using an adaptation of the standard Student's t test (Welch, 1947) that accounts for samples with unequal variances and unequal sample sizes. Because the test is valid only for normal distributions the datasets to be compared are transformed (e.g., Box Cox transformation) and tested by an F test (Box, 1953) to satisfy this assumption.
5.1 Aerosol absorption derived by AE33 and MAAP
During the Athens campaign AE33 and MAAP showed excellent correlation (R2=0.98, N=381) with respect to the eBC mass concentration trend at a 30 min time resolution (Fig. 4). However, AE33 reported higher eBC by 20±11 % compared to MAAP, and higher absorption coefficient at 370, 637, and 880 nm of more than a factor of 2. Each of these differences is statistically significant at the 95 % CI. During the Cyprus campaign, both monitors also showed a very good correlation (R2=0.89, N=1434) at a 30 min time resolution. However, similar to the Athens campaign, AE33 showed eBC mass concentration higher by 13±5 % compared to MAAP, and higher absorption coefficient at 370, 637, and 880 nm by almost a factor of 2, which was also significant at 95 % CI. It is noted that for both campaigns the absorption coefficient has been derived from eBC for both instruments. The large difference observed concerning the absorption coefficient is due to the different generic MAC values applied to each instrument. As an example, the MAC value employed by MAAP is equal to 6.6 m2 g−1 at 637 nm (Table 4), while the MAC(637) calculated for AE33 is equal to 10.7 m2 g−1. For both campaigns, the comparison of eBC and the absorption coefficient at 370 and 880 nm is shown in Fig. 4 and for the absorption coefficient at 637 nm at Fig. S2.
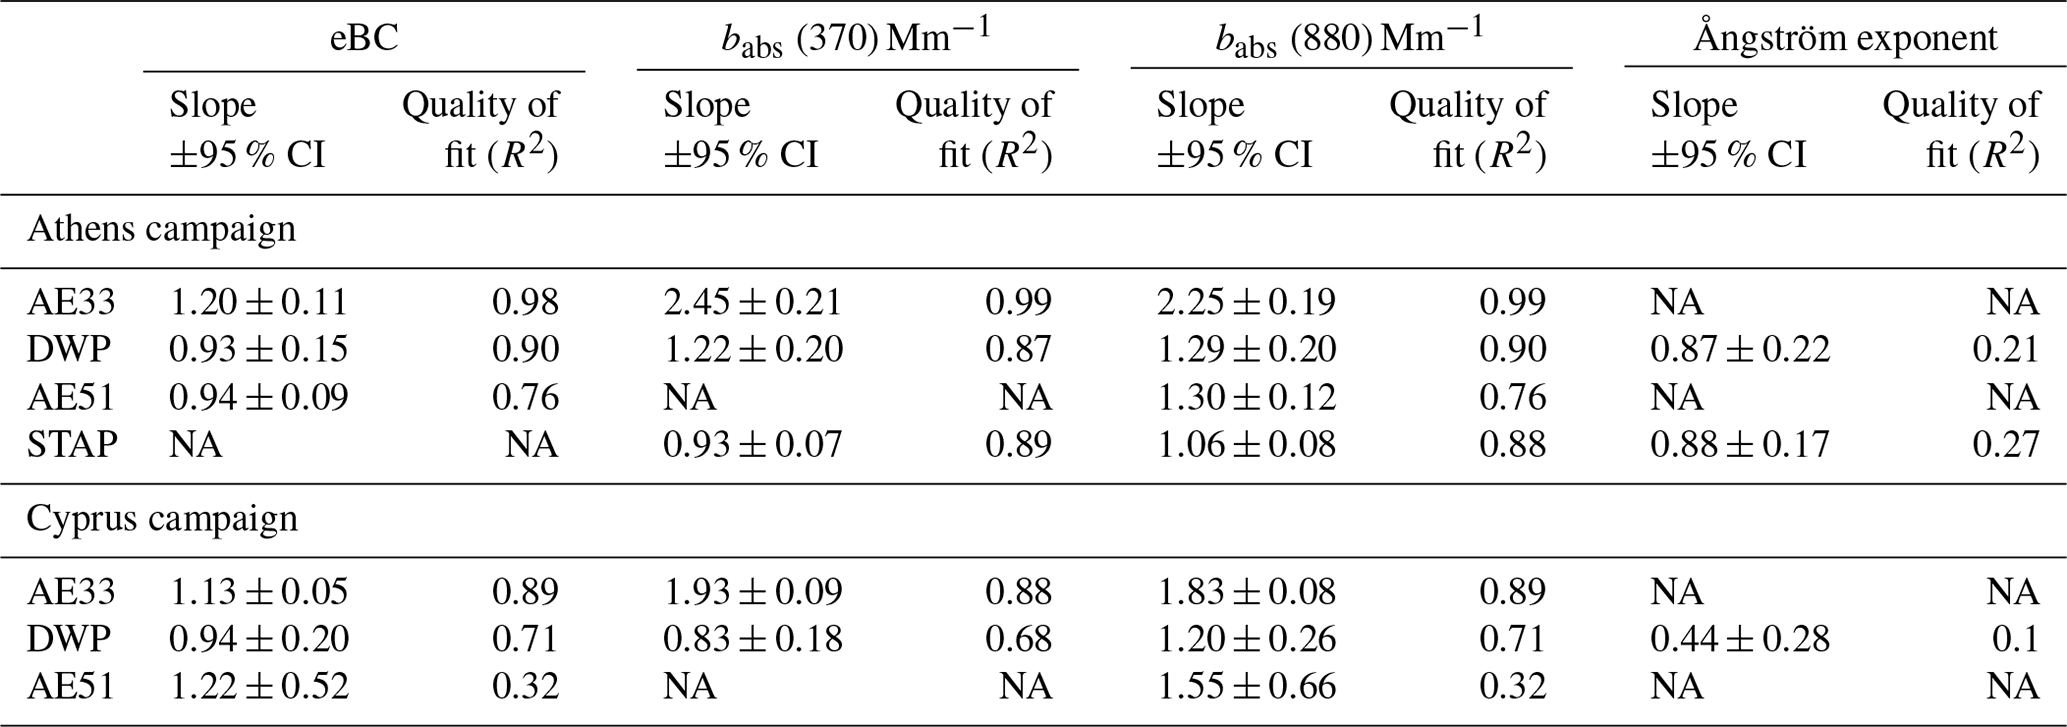
Table 4Results from the comparison of the miniature sensors with ground-based commercial instruments (AE33 and MAAP) shown in Figs. 5 and 6. NA – not available.
Drinovec et al. (2015) suggested that AE33 could overestimate eBC up to approximately 7 % when compared to MAAP. Müller et al. (2011) calculated the absorption coefficient at 637 nm of single spot aethalometers measuring ambient air and showed that it can be up to 60±20 % overestimated when compared to MAAP. Finally, MAAP has been reported to underestimate eBC in polluted environments (Hyvärinen et al., 2013) when the measured eBC concentration exceeds 3 µg m−3. Table 4 summarizes the results from both campaigns (illustrated in Fig. 4). This comparison suggests that AE33 and MAAP exhibit a better match with respect to eBC mass rather than with the absorption coefficient.
In the comparison presented above, MAAP was chosen as the reference instrument because it has been shown to exhibit good agreement against ambient absorption methods (Sheridan et al., 2005) that do not require correction schemes (e.g., photoacoustic spectrometers) and because its unit-to-unit variability was reported to be small (approximately 5 %; Müller et al., 2011). However, MAAP monitors absorption at a single wavelength and samples at lower temporal resolution than the one desired for this study (30 min in the Athens campaign and 2 min in the Cyprus campaign).
In the following sections, we investigate how measurements from miniature attenuation monitors relate to the commercial ones discussed in this section. AE33 is always utilized as a reference because of its high temporal resolution (1 min). For this purpose, AE33 results are first scaled to match those of MAAP, to approximate, at least on average, the suggested “reference” values taking advantage of the excellent trend agreement between these two instruments. The eBC by the AE33 was consequently decreased by 20 % and 13 %. The difference in the scaling factor between the two campaigns is attributed to instrument variability since two different pairs (of AE33 and MAAP) were employed in each campaign and to the different aerosol sampled, fresh vs aged during the Athens and Cyprus campaigns, respectively. Consequently, babs(370) was decreased by a factor of 2.4 and 1.93, and babs(880) was decreased by a factor of 2.2 and 1.83 during the Athens and Cyprus campaigns, respectively.
The loading correction term in Eq. (3) was neglected in our study, assuming a value equal to unity when attenuation was low. It is noted that currently most loading correction schemes are applied to continuous monitors that change sample spots automatically. Attenuation of AE51 provided by the instrument never exceeded 0.01 during the Athens campaign due to the combination of low sampling flow rate and limited sampling times (approximately 15 min) of each flight. During the Cyprus campaign, it reached up to 0.02 because sampling time was higher (1–1.5 h) despite the lower measured eBC concentrations. Because of its higher sampling flow rate, the attenuation of DWP at 880 nm exceeded 0.15 five times in each of the two campaigns. In order to examine whether measurements by DWP exceeding attenuation of 0.1 were significantly affected by the filter loading effect, a comparison with respect to babs(880) was conducted against both AE51 and AE33. The comparison results, shown in the Supplement (Fig. S3), support the assumption of a loading correction (R) equal to unity was valid during both campaigns (as already discussed by Weingartner et al., 2003).
As discussed in Sect. 2.2.3, the DWP configuration consisted of two monitors sampling in series, in order to assess the possible impact of changes in relative humidity on the attenuation measurements. Under dry conditions, the second DWP should always report zero concentrations; this was the case during the Athens campaign with the exception of one flight performed on the 15 January 2016 when the silica gel dryer was removed. During this flight, the second DWP provided attenuation measurements deviating from zero, as high as 30 M m−1 at 880 nm, suggesting that the first DWP measurements may also have been affected by sampling bias during this particular flight (Fig. S4). Recently, Düsing et al. (2019) evaluated the discrepancy due to RH gradients of STAP to be 10.08 Mm−1 s−1 for every 1 % change in RH.
Since most of the commercially available sensors provide BC readings (instead of absorption like STAP), we have decided to extend our absorption intercomparison to eBC. Despite BC being the most absorbing material in ambient air, other components, such as brown carbon and dust, could also contribute to absorption especially at shorter wavelengths (Andreae and Gelencsér, 2006). In addition to eBC, aerosol absorption coefficients at 370 and 880 nm were also selected because two of the three miniaturized sensors measured at least at one of those wavelengths (see Table 3). Extrapolation based on the Ångström law (Eq. 7) was applied for STAP that did not measure at these two specific wavelengths using the 445 and the 633 nm channels as a base to convert to 370 and 880 nm, respectively.
7.1 Overview of the temporal and diurnal variability of ground-based eBC during the Athens and Cyprus campaigns
During the Athens campaign, the average eBC concentration determined by AE33 was 1.5±2.1 µg m−3, ranging from 0.3 to 15 µg m−3. The presence of BC from biomass burning (BCbb), was identified and quantified throughout the campaign (Fig. S5), using the Sandradewi et al. (2008) model, but never exceeded 20 % of the total eBC during daytime (05:00–15:00 UTC). During the nighttime, BCbb concentration was always elevated, reaching 40 %–60 % of the total eBC that typically remained below 2 µg m−3. On two occasions (14 January 16:00 UTC–15 January 05:00 UTC and 21 January 15:00 UTC–22 January 00:00 UTC) eBC exceeded 5 µg m−3 for several hours dominated by BCbb. On average, BCbb was identified from 16:00 UTC till 04:00 UTC of the following day and was more prominent during the periods featuring a low boundary layer and the need for heating due to low temperatures. Similar behavior attributed to biomass burning aerosol has been reported previously in Athens (Florou et al., 2017; Fourtziou et al., 2017) and other major Greek cities (Petrakakis et al., 2013; Pikridas et al., 2013). BC related to fossil fuel also exhibited a distinct diurnal pattern that included two maxima (Fig. S5). The first was observed at approximately 06:00 UTC and was attributed to the rush hour traffic period and the second in the late afternoon and evening (after 16:00 UTC) simultaneously with the period when biomass-burning-related BC was observed. Increased biomass burning, especially during nighttime for domestic heating purposes, due to the economic crisis in Greece, has been reported for another major Greek city (Saffari et al., 2013).
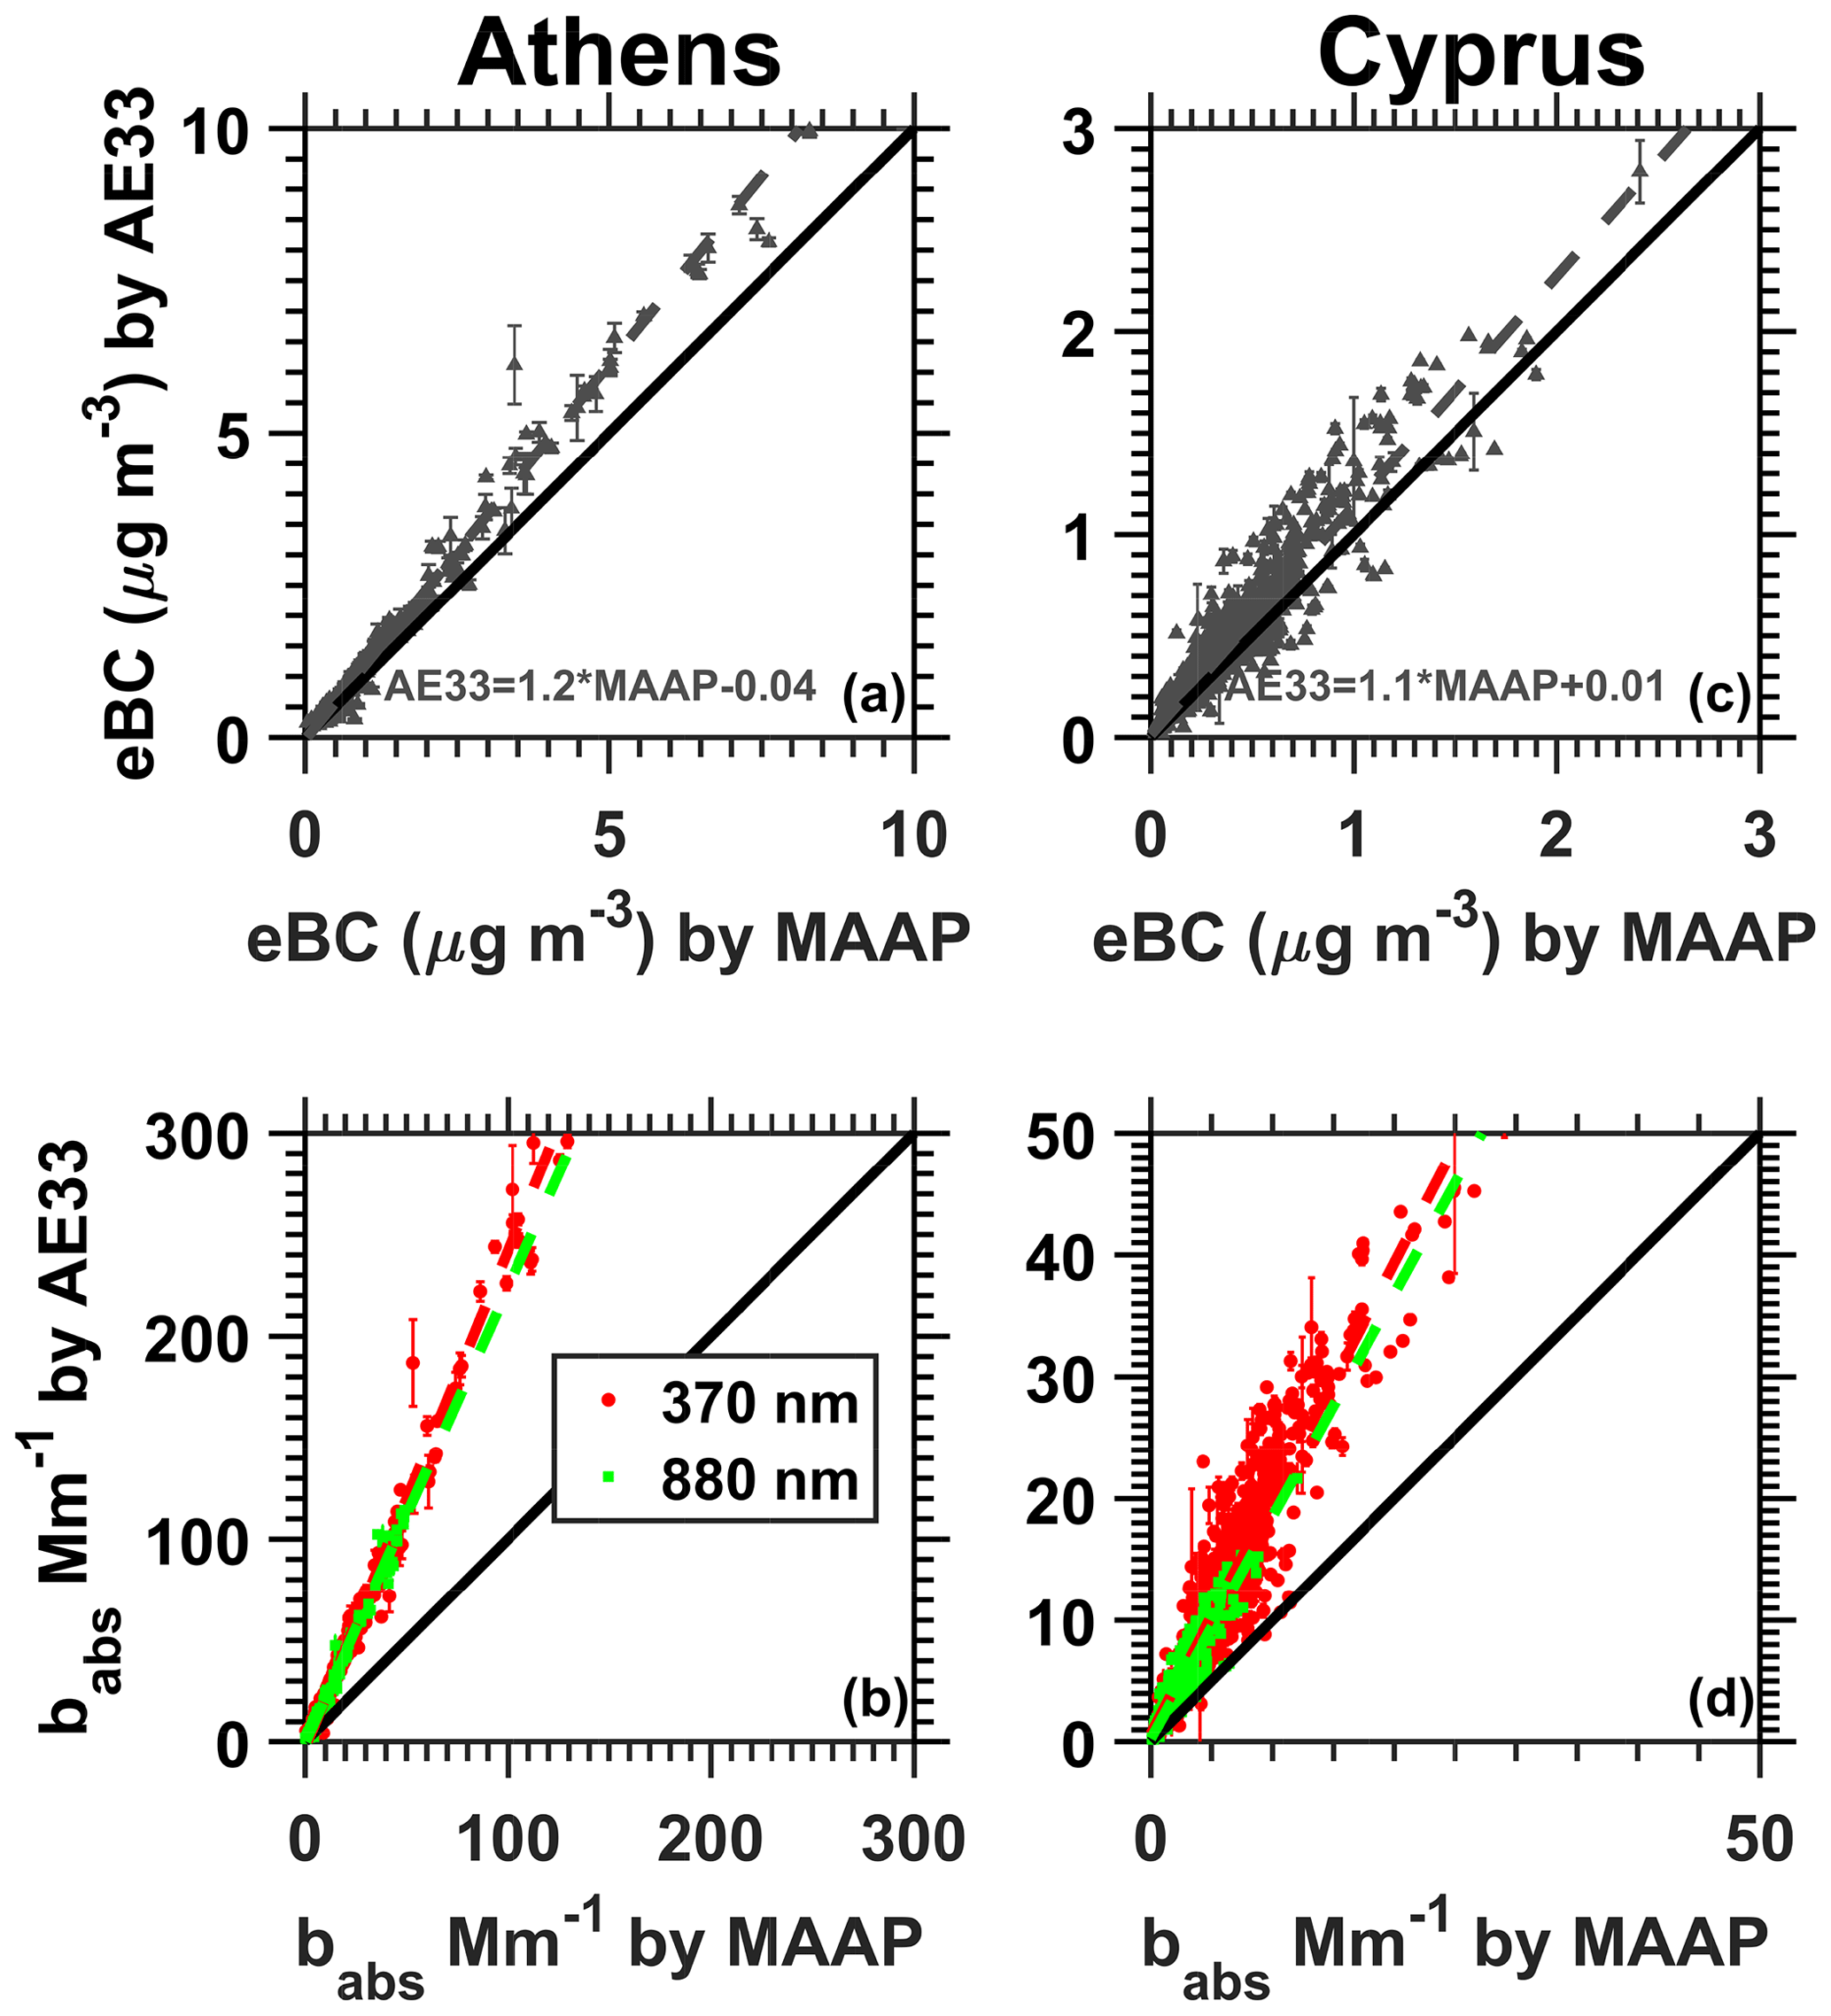
Figure 4Comparison of AE33 against MAAP for eBC (a, c) and babs (b, d) at 370 nm (red dots) and 880 nm (green dots) during the Athens (a, b) and Cyprus (c, d) campaigns, respectively. Error bars correspond to one standard error from the mean. Not visible error bars suggest that the error estimate is smaller than the area covered by the symbol. The 1:1 and regression lines are shown by a solid black and a dashed line colored according to the instrument, respectively. Results are shown in Table 4.
During the Cyprus campaign, eBC measured by AE33 did not exceed 2 µg m−3 and most of the time it was found below 0.8 µg m−3. The highest hourly concentration (1.9 µg m−3) was observed on the 10 April 2016 (Fig. S6) when the site was influenced by air masses from North Africa, and the lowest (< 0.1 µg m−3) on the 12 and 14 April 2016. During the Cyprus campaign, dust transport from the Saharan desert was identified on three occasions (7–10, 15–17, and 21–27 April 2016) based on combined information from (i) elevated coarse-mode particulate matter concentrations measured by a tapered element oscillating microbalance (Thermo model 1400a), (ii) aerosol spectral properties of the entire atmospheric column measured by sun photometry, (iii) back-trajectory analysis, and (iv) satellite pictures (MODIS aerosol optical depth product). The diurnal pattern of eBC during the Cyprus campaign was relatively flat, as expected in a remote background site, and characterized by an almost invariable concentration approximately at 0.4 µg m−3 (campaign average equal to 0.39±0.24 µg m−3).
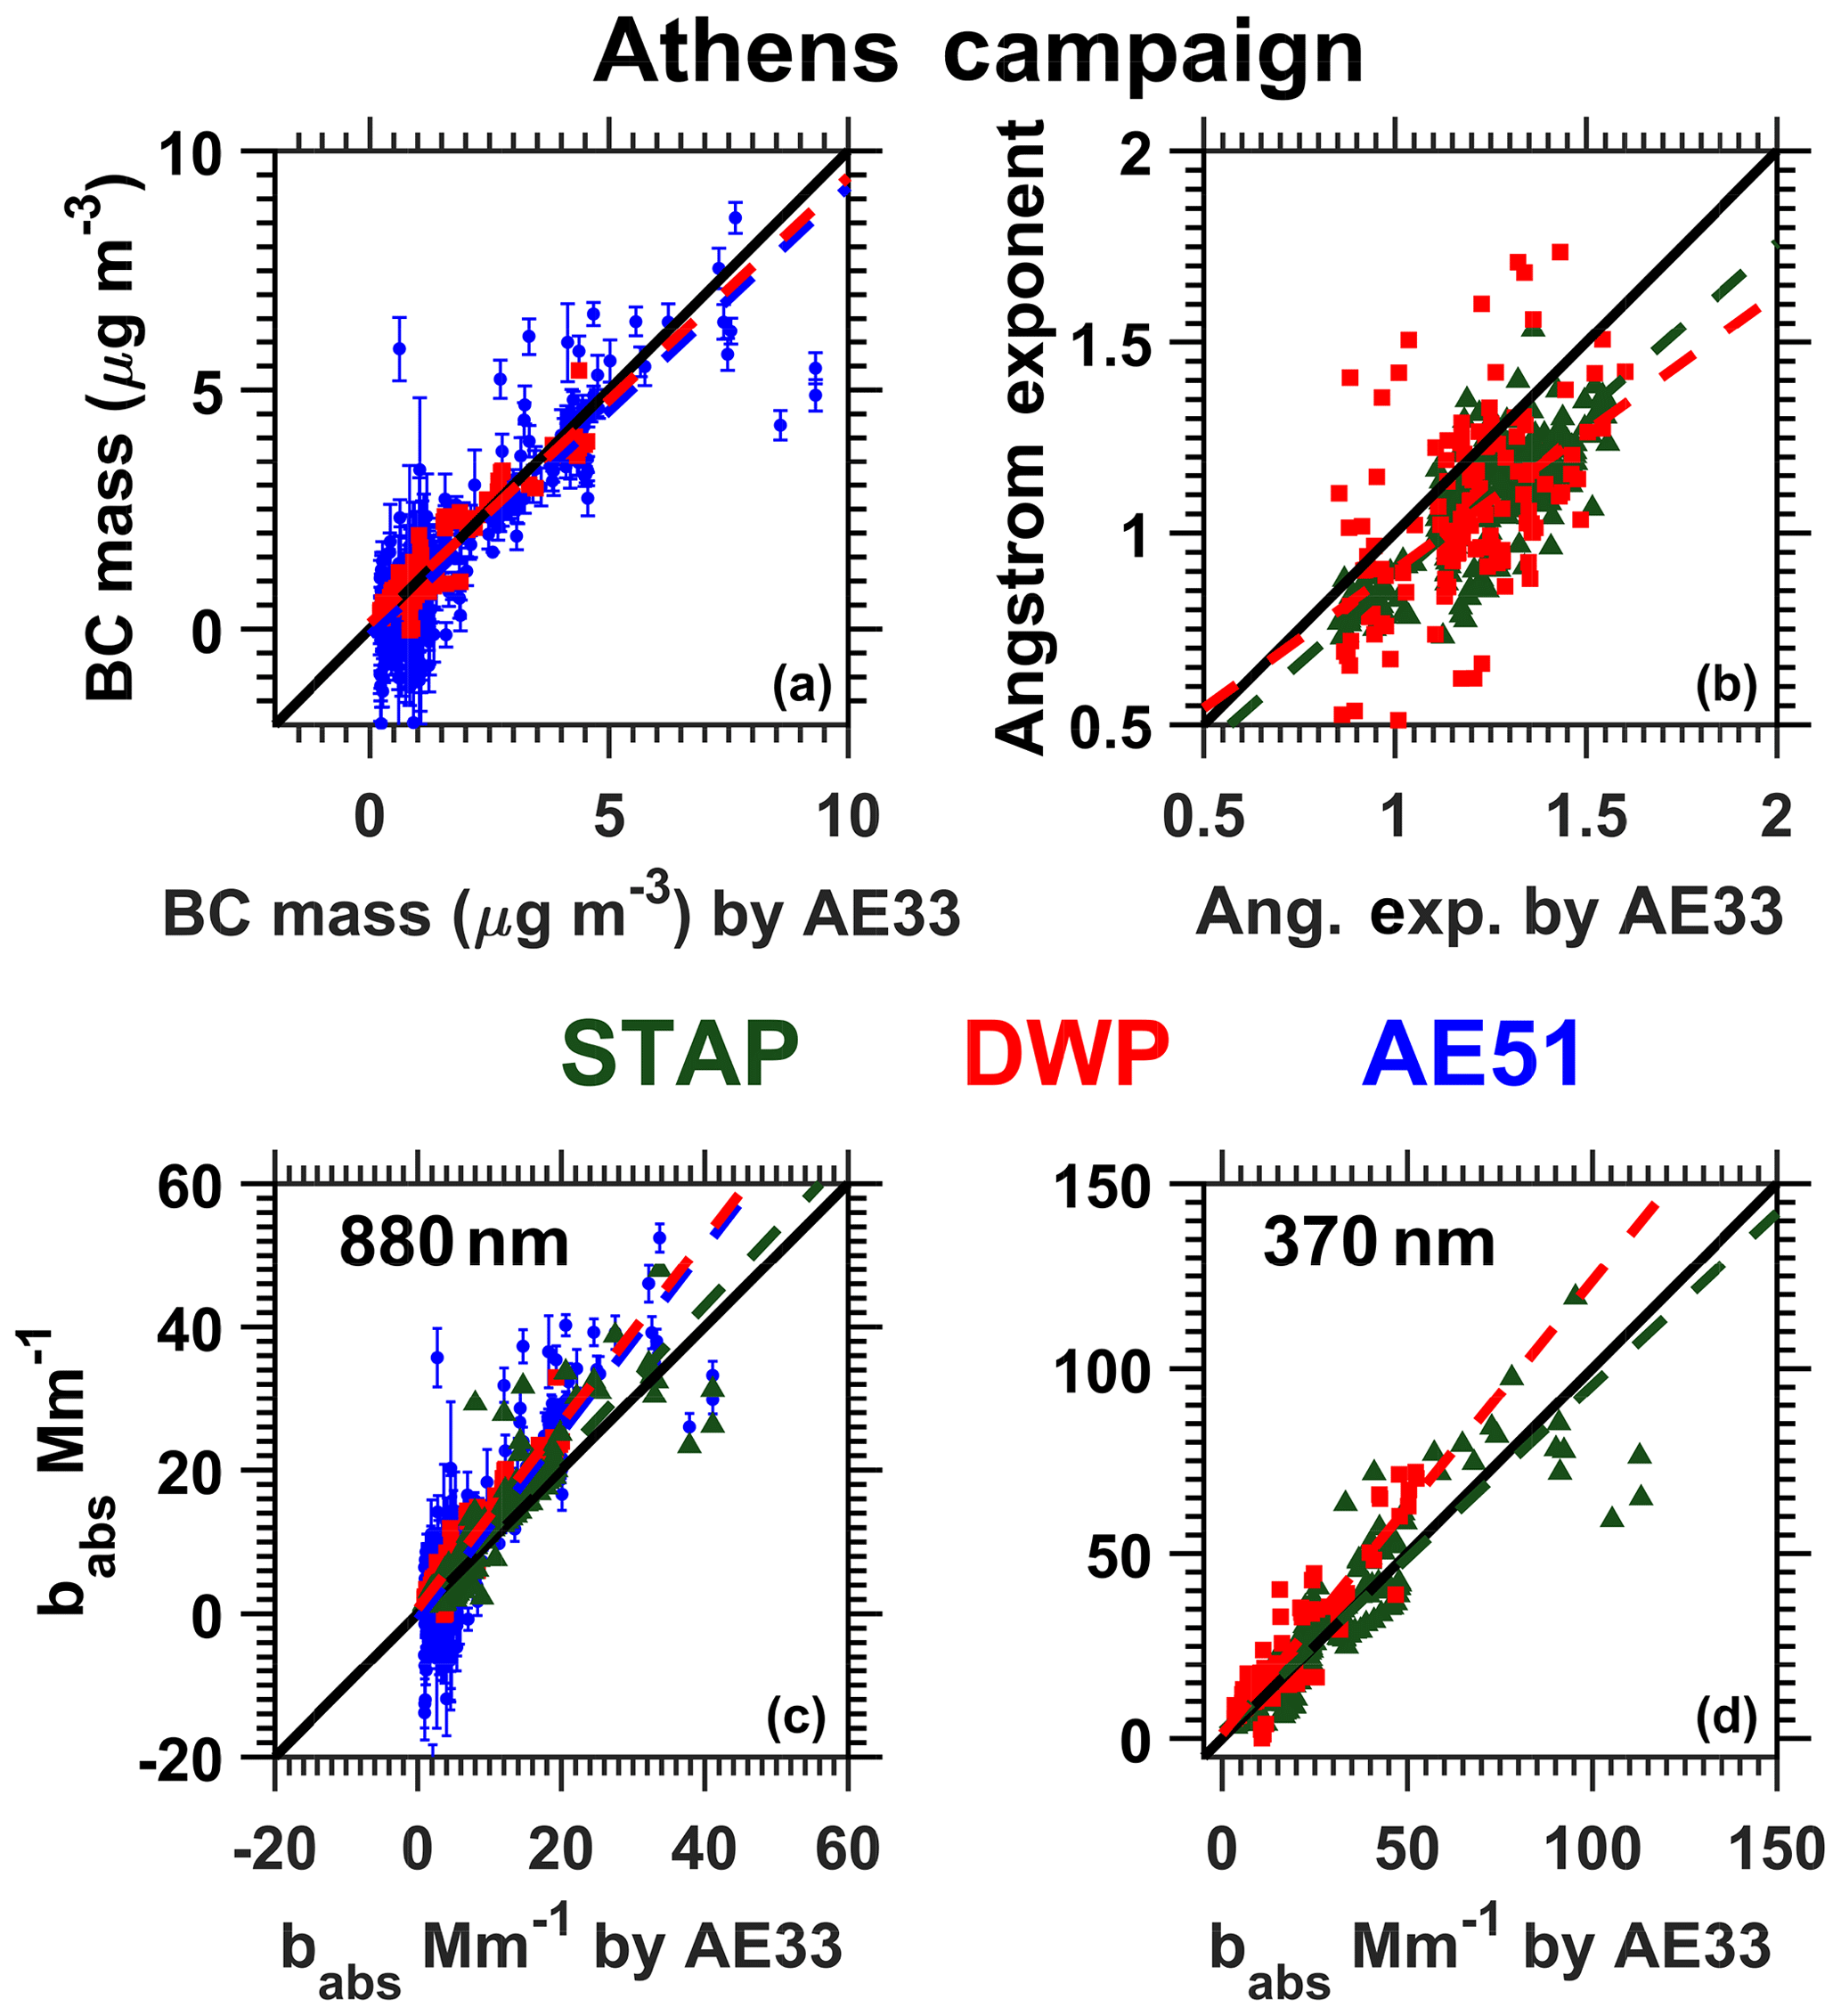
Figure 5Comparison of miniature monitors (STAP: green triangles; DWP: red squares; AE51: blue circles) while on the ground against the corrected AE33 during the Athens campaign with respect to eBC mass (a), absorption Ångström exponent (b), and the absorption coefficient at 880 nm (c) and 370 nm (d). Error bars correspond to one standard error from the mean with respect to AE51. The standard error concerning DWP and STAP with respect babs and eBC is smaller than the symbol in the graph for the vast majority of the cases and is not presented for clarity. The 1:1 and regression lines are shown by a solid black and a dashed line colored according to the instrument, respectively. Results are shown in Table 4.
7.2 Ground-based intercomparison of aerosol absorption
During the Athens campaign, each miniature sensor not performing vertical profiling was operating at ground level in parallel with AE33 and MAAP, allowing a direct comparison. Additionally, the miniature sensors on board the multicopter were measuring at ground level (2–3 min) before takeoff and after landing. It is noted that the same setup (sampling lines, diffusion dryer) was utilized whether the miniature samples were mounted in the UAS platform or not. Based on the combination of these datasets resampled to 1 min (the time resolution of AE33), DWP exhibited good correlation, with respect to eBC against AE33 (R2=0.90, slope =0.93, N=417) shown in Fig. 5a, while the AE51 produced slightly poorer correlation (R2=0.76, slope =0.94, N=125) (see Table 4). One possible explanation is the lower signal-to-noise ratio of AE51. Both monitors measured eBC concentrations lower by 6 %–7 % compared to the reference measurements. This difference is not statistically significant, at the 95 % CI, for either DWP or AE51. STAP does not report eBC mass concentration and was excluded from this comparison for that purpose.
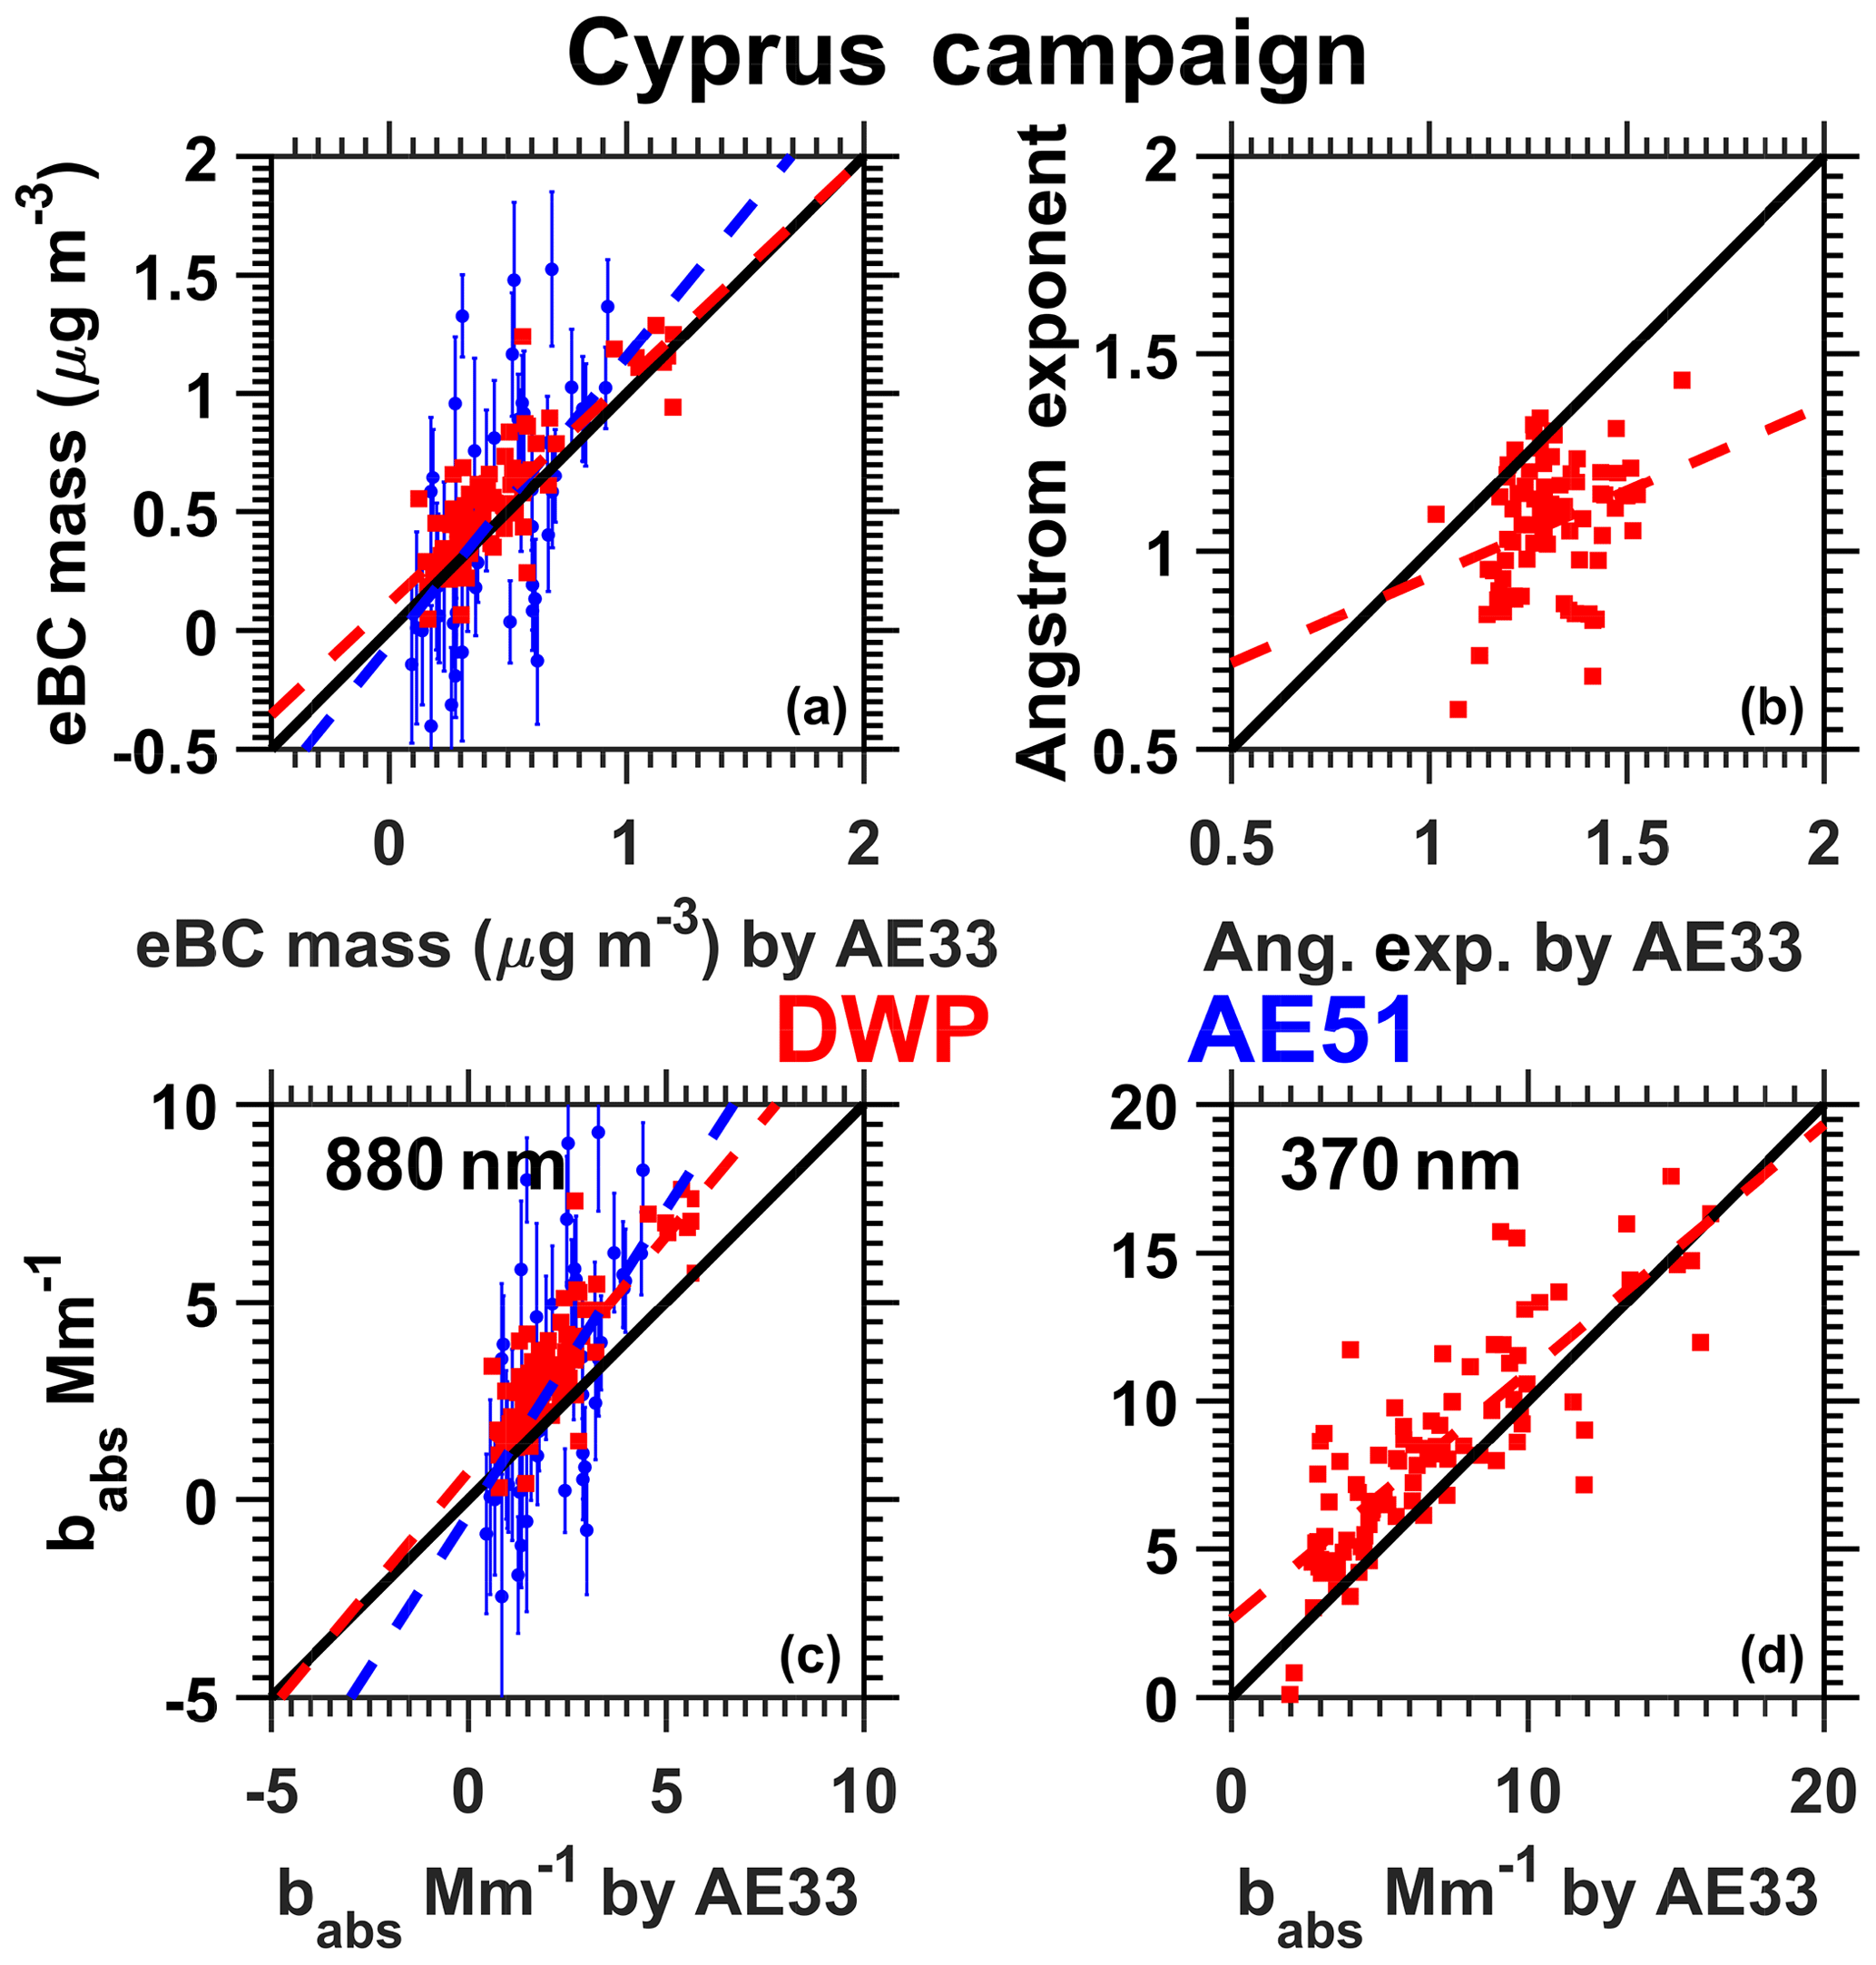
Figure 6Comparison of miniature attenuation monitors (DWP: red squares; AE51: blue circles) while airborne against the corrected AE33 during the Cyprus campaign with respect to eBC mass (a), absorption Ångström exponent (b), and the absorption coefficient at 880 nm (c) and 370 nm (d). Miniature monitors sampled airborne. Error bars correspond to one standard error from the mean with respect to AE51. The standard error concerning DWP and STAP with respect babs and eBC is smaller than the symbol in the graph for the vast majority of the cases and is not presented for clarity. The 1:1 and regression lines are shown by a solid black and a dashed line colored according to the instrument, respectively. Results are shown in Table 4.
With respect to babs(λ) at 370 and 880 nm, both STAP and DWP showed good correlation (at 370 nm : R2=0.89 and 0.87 and N=519 and 417 for STAP and DWP, respectively; at 880 nm: R2=0.88 and 0.9 and N=519 and 417 for STAP and DWP, respectively) against AE33, while the correlation with AE51 was slightly poorer (R2=0.76, N=125) at 880 nm (Fig. 5c).
However, DWP overestimated babs(880) by 29±20 % (significant at 95 % CI) compared to the corresponding reference measurements, even though the eBC mass, calculated from the same wavelength, was underestimated by 7 %. Similar to DWP, AE51 overestimated babs(880) by 30±12 % even though eBC mass was underestimated by 6 %. This difference was statistically significant at 95 % CI but only marginally (p value equal to 0.049). Both DWP and AE51 share the same σatn and C values (Table 4). For both instruments, a generic MAC(880) value equal to 6.1 m2 g−1 is applied to convert eBC to babs, instead of 7.8 m2 g−1 used by AE33 at the same wavelength. However, both miniature sensors underestimate with respect to eBC but at the same time overestimate with respect to the absorption coefficient, mainly due to the higher correction factor applied to the AE33 measurements concerning the latter (approximately a factor of 2) compared to the former (≈20 %) to match those of MAAP as discussed in Sect. 5.1.
STAP was found to overestimate babs(880) by 6±8.5 % and underestimate babs(370) by 7±7 %. Both differences were not significant at 95 % CI. During a laboratory comparison Müller et al. (2011) reported that a continuous single spot aethalometer (Magee Model AE31) overestimated babs compared to MAAP by 37 %–60 % at 660 nm. The same study also reported underestimation of the absorption coefficient at 650 and 585 nm against MAAP compared to the PSAP (the rack-mounted equivalent of STAP) by 1 %–14 %. These laboratory comparison results are similar to those reported in this study (AE51 overestimates and STAP underestimates the absorption coefficient by a similar extent against the reference).
The miniature sensors intercompared during the Athens campaign exhibit better agreement with respect to the parameter they report. Concerning AE51 and DWP, this parameter was eBC concentration, which was within 10 %, rather than the absorption coefficient, suggesting that the absorption coefficient should be preferentially calculated based on a single set of wavelength-dependent MAC values (Eq. 5) instead if these are known or can be calculated. On the other hand, STAP that does not report eBC, but babs exhibited good agreement, within 10 %, against the reference on that property. On average the calculated AAE of DWP and STAP is underestimated by 13 % and 12 %, respectively, against that of AE33.
During the Cyprus campaign, aerosol absorption was also monitored at the ground by an AE33 and a MAAP located at CAO, approximately 7 km away and at 200 m higher elevation above the UAS airfield. Only DWP and AE51 were used on UASs during this campaign. Assuming homogeneity between the two sites, a direct comparison was conducted between ground and UAS measurements.
The comparison results, shown in Fig. 6, indicate that the correlation between the ground measurements and UAS (AE51 and DWP) measurements led to less satisfactory results compared to the Athens campaign (see also Table 4). The correlation between AE33 and DWP was still acceptable (R2=0.71; N=91) with respect to eBC and the absorption coefficient at 370 and 880 nm at 1 min time resolution. But the correlation between AE33 and AE51 was found to be poor (R2=0.32, N=48) with respect to both eBC and babs(880).
The atmospheric concentration of absorbing material (eBC measurements) was found to be on average 4 times lower in Cyprus (mean of 0.39±0.24 µg m−3) compared to Athens (mean of 1.5±2.1 µg m−3). Additionally, the range of atmospheric concentrations was also reduced by a factor of 6 in Cyprus (maximum hourly averaged eBC was 1.9 µg m−3) compared to Athens (maximum hourly averaged eBC was 12.2 µg m−3), leading to less favorable conditions for direct instrument-by-instrument comparisons due to the smaller range of comparison data. These conditions had a direct impact on the uncertainty related to the measurement agreement between the AE33 and the miniature monitors. During the Cyprus campaign, the uncertainty was always greater than the respective uncertainty of the Athens campaign. As an example during the Cyprus campaign, DWP underestimated eBC by 6±20 % and overestimated babs(880) by 20±26 % (both significant at 95 % CI), while during the Athens one the respective numbers were 7±15 % and 29±20 % (Table 4). The effect was greater concerning AE51, which overestimated eBC by 22±52 % and babs(880) by 55±66 %, while during the Athens campaign the respective numbers were 6±9 % and 30±12 % (Table 4). Due to the large uncertainty exhibited by AE51, the null hypothesis that the population mean of the reference instrument (AE33) and of AE51 are different was not met. Hence, the reported differences are not significant at the 95 % CI. It is unclear whether the absorbing properties of the sampled aerosol (fresh at Athens and aged in Cyprus) had any effect on this comparison.
7.3 On-flight intercomparison of aerosol absorption
During flights, vibrations, as well as strong gradients of pressure, temperature, and RH may affect the performance of the miniature sensors. In order not to surpass the maximum takeoff weight of the multicopter used during the Athens campaign, STAP and DWP did not fly simultaneously. However, the lower weight of AE51 enabled on-flight cross-comparison with DWP and STAP, respectively, during eight flights of the Athens campaign. The correlation of AE51 airborne with both DWP and STAP was very good (R2=0.65, N=493 and R2=0.87, N=1875, respectively) provided that the sampled air was dried (Fig. 7) and the dataset post-processed with a noise-reducing algorithm as suggested in Sect. 4. Error bars shown in Fig. 7 correspond to one standard error for 1 s time resolution. In the case that the algorithm did not average a sampling point with its neighbors, then, by default, the standard deviation and standard error were zero, indicated by a lack of an error estimate in Fig. 7. Note that if no smoothing is applied, the correlation deteriorates sharply (R2=0.01) for either DWP or STAP. The ΔATN used for this comparison were 0.01, 0.03, and 0.03 for AE51, DWP, and STAP, respectively, as suggested in Sect. 4. STAP is shown to underestimate babs by 12 % (significant at 95 % CI) compared to AE51 (Fig. 7), consistent with the comparison against AE33 discussed in Sect. 6.2. The very good correlation (comparison slope =0.87) between the two when airborne also suggests that on average, no significant bias during the flights was present. The difference between AE51 and DWP was 8 %, which was not significant at 95 % CI.
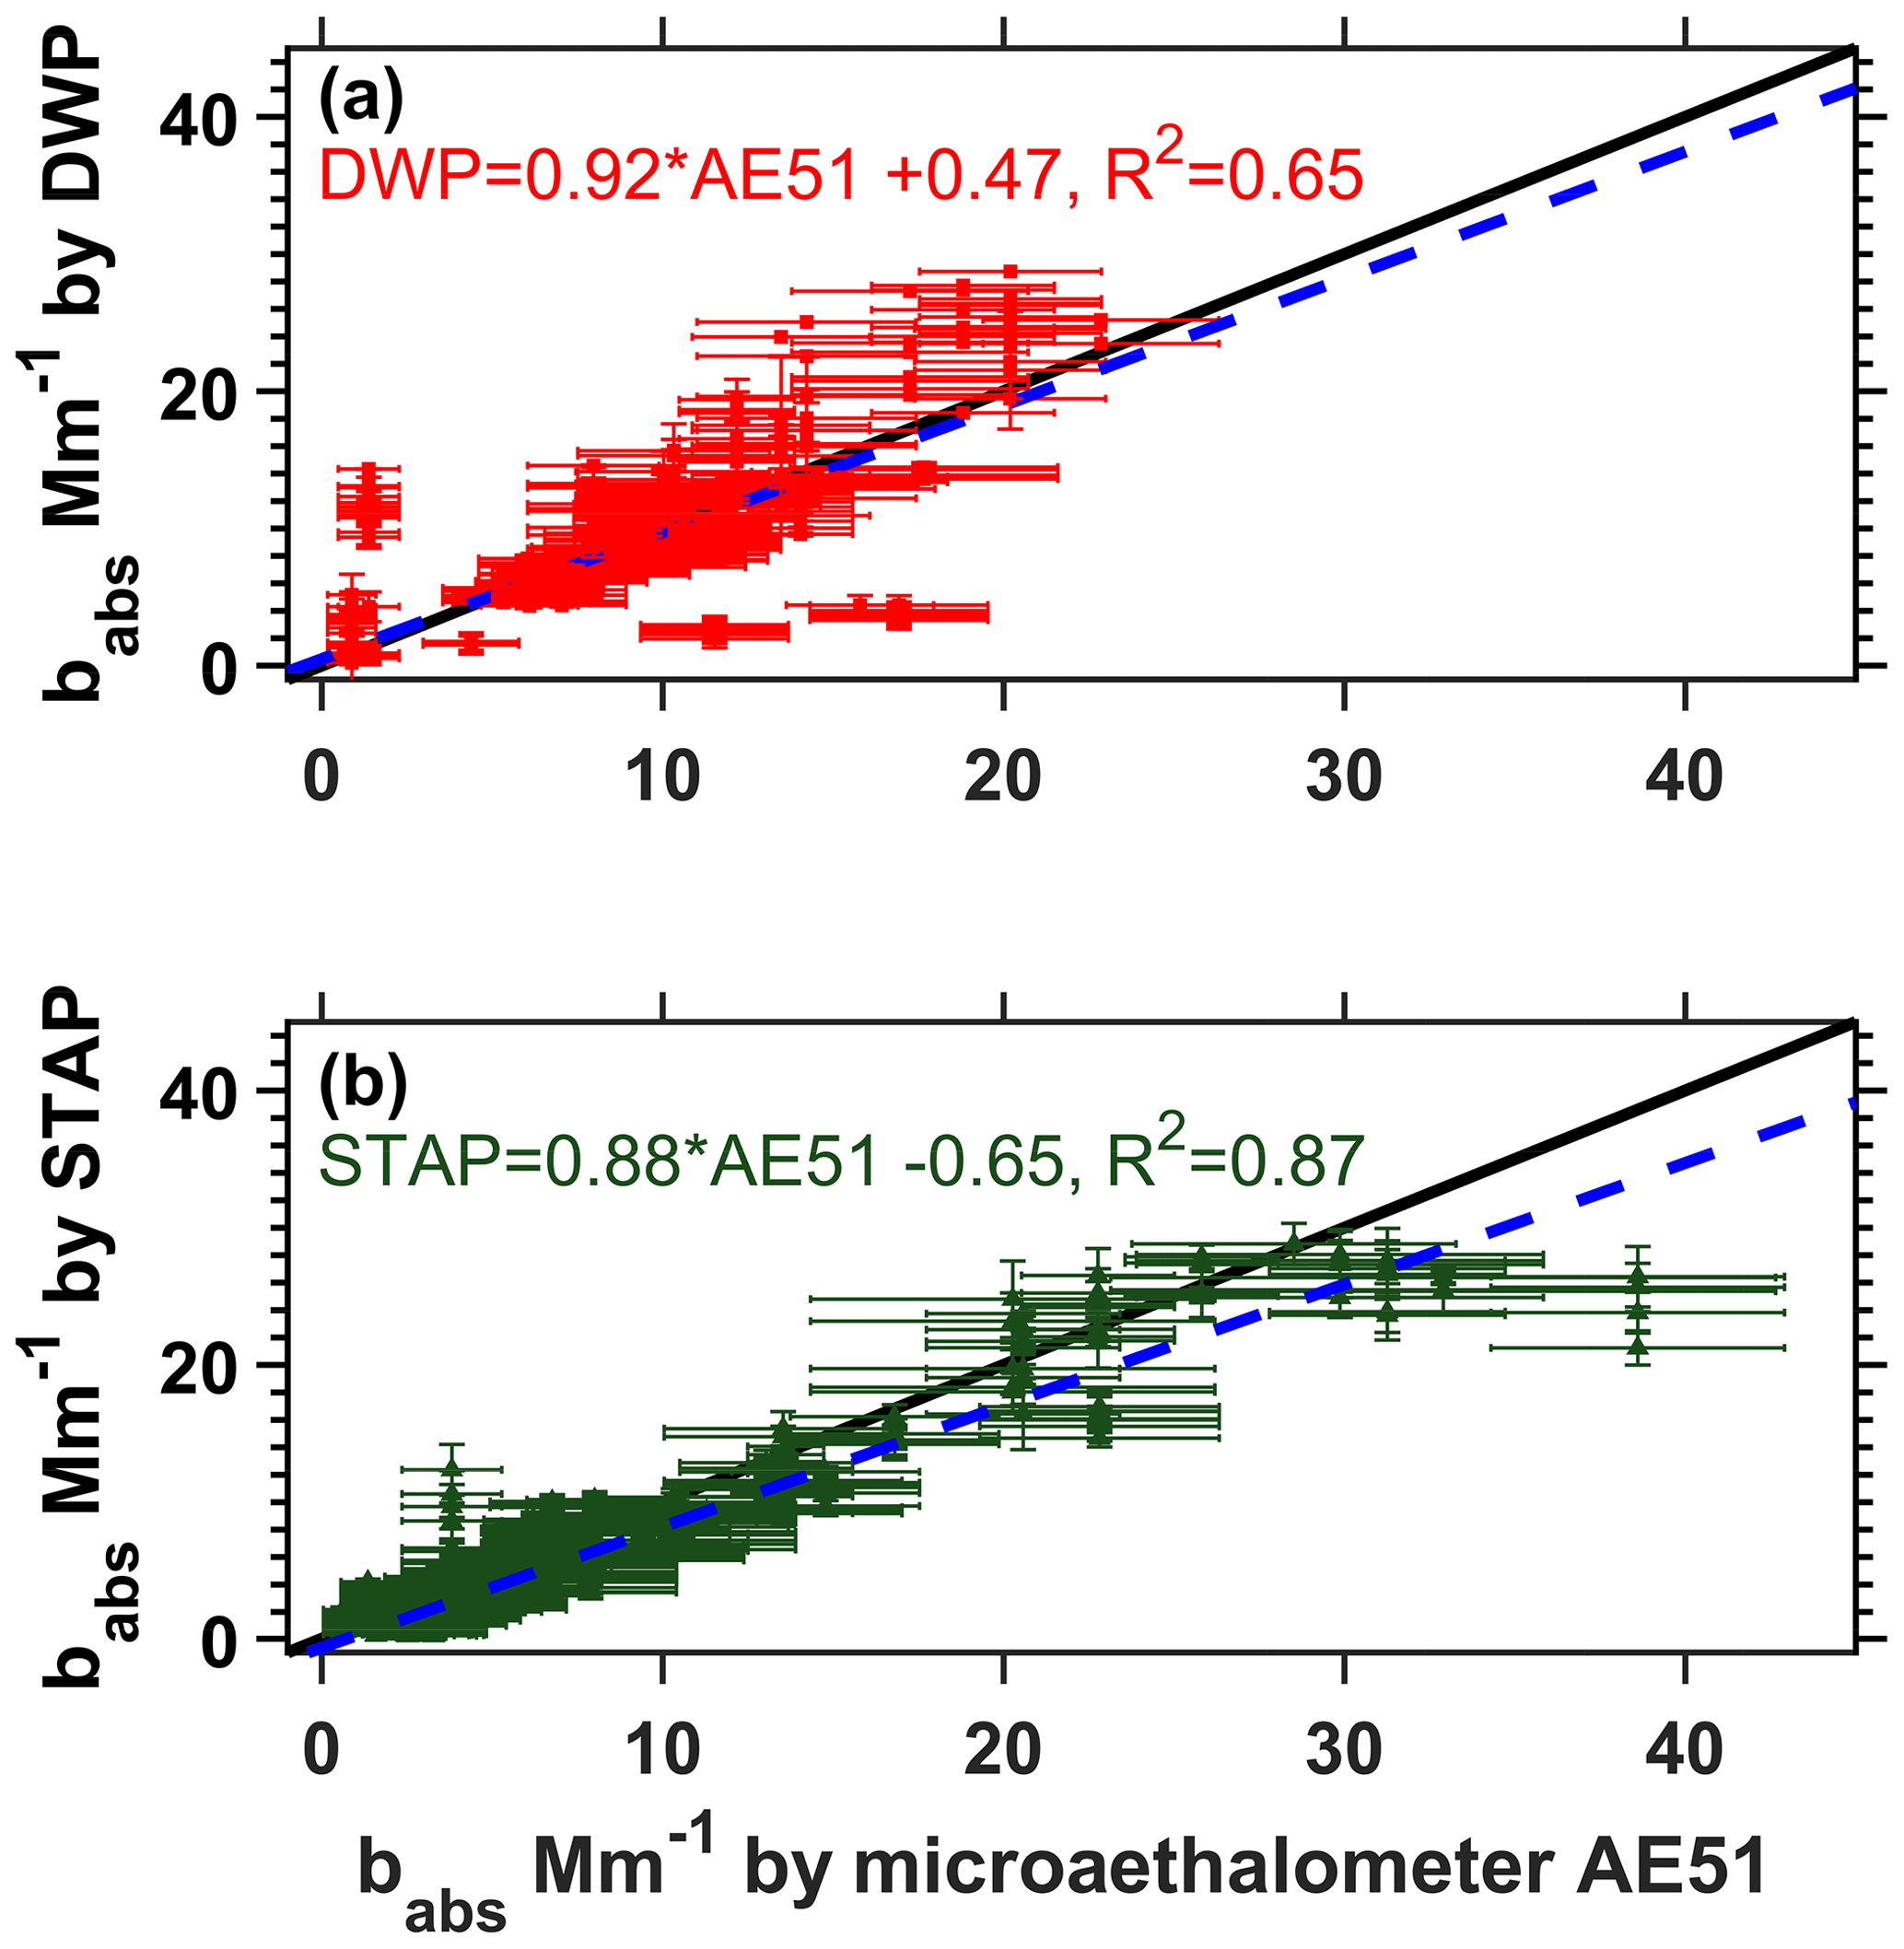
Figure 7Comparison of AE51 against STAP (green triangles) and DWP (red squares) during eight flights of the Athens campaign. The reported agreement in the correlation suggests that no significant bias affected the monitors. The correlation deteriorates (R2=0.01) if data are not processed with the noise reduction algorithm (Sect. 4). Error bars correspond to one standard error from the mean. Not visible error bars suggest that the smoothing algorithm did not average to that sampling point with its neighbors, resulting in a standard deviation and standard error equal to zero. The 1:1 and regression lines are shown by a solid black and a dashed blue line, respectively.
As part of the Athens campaign, intensive vertical absorption profiles were performed with the objective to assess the influence of the diurnal development of the planetary boundary layer (PBL) on the vertical dispersion of ground-based black carbon emissions. UAS-based measurements were conducted for that purpose on the 19 January at sunrise (05:38 UTC) and were continued on an hourly basis till the PBL depth exceeded the maximum height allowed to operate (1 km a.s.l.), approximately at 10:00 UTC. Two additional flights were conducted later on that day; 1 h before and during sunset (15:38 UTC). The reconstructed vertical distribution of eBC based on the six ascending vertical profiles from 05:30 till 09:45 (UTC) is shown in Fig. 8, complemented by ground measurements during the same day by AE33. The actual vertical profiles for the entire day (N=8) are also shown in Fig. 9. We present a very detailed study of vertical dispersion of ground-based black carbon emissions dynamically assessed above a major city. Our results suggest a nonhomogeneous boundary layer that evolved at a rate of 132 m h−1 during 19 January 2016 starting from an elevation of 265 m a.s.l. before sunrise. Starting at 05:00 UTC eBC increased by a factor of 8 at 07:00 UTC. The emission's pattern and the Ångström exponent, calculated based on AE33 measurements, which was equal to 1.1 when concentrations maximized, suggest that this increase in eBC was due to local traffic emissions (see also Fig. 8). After 10:00 UTC eBC remained relatively stable at 1.5 µg m−3 (≈5 Mm−1 at 880 nm).
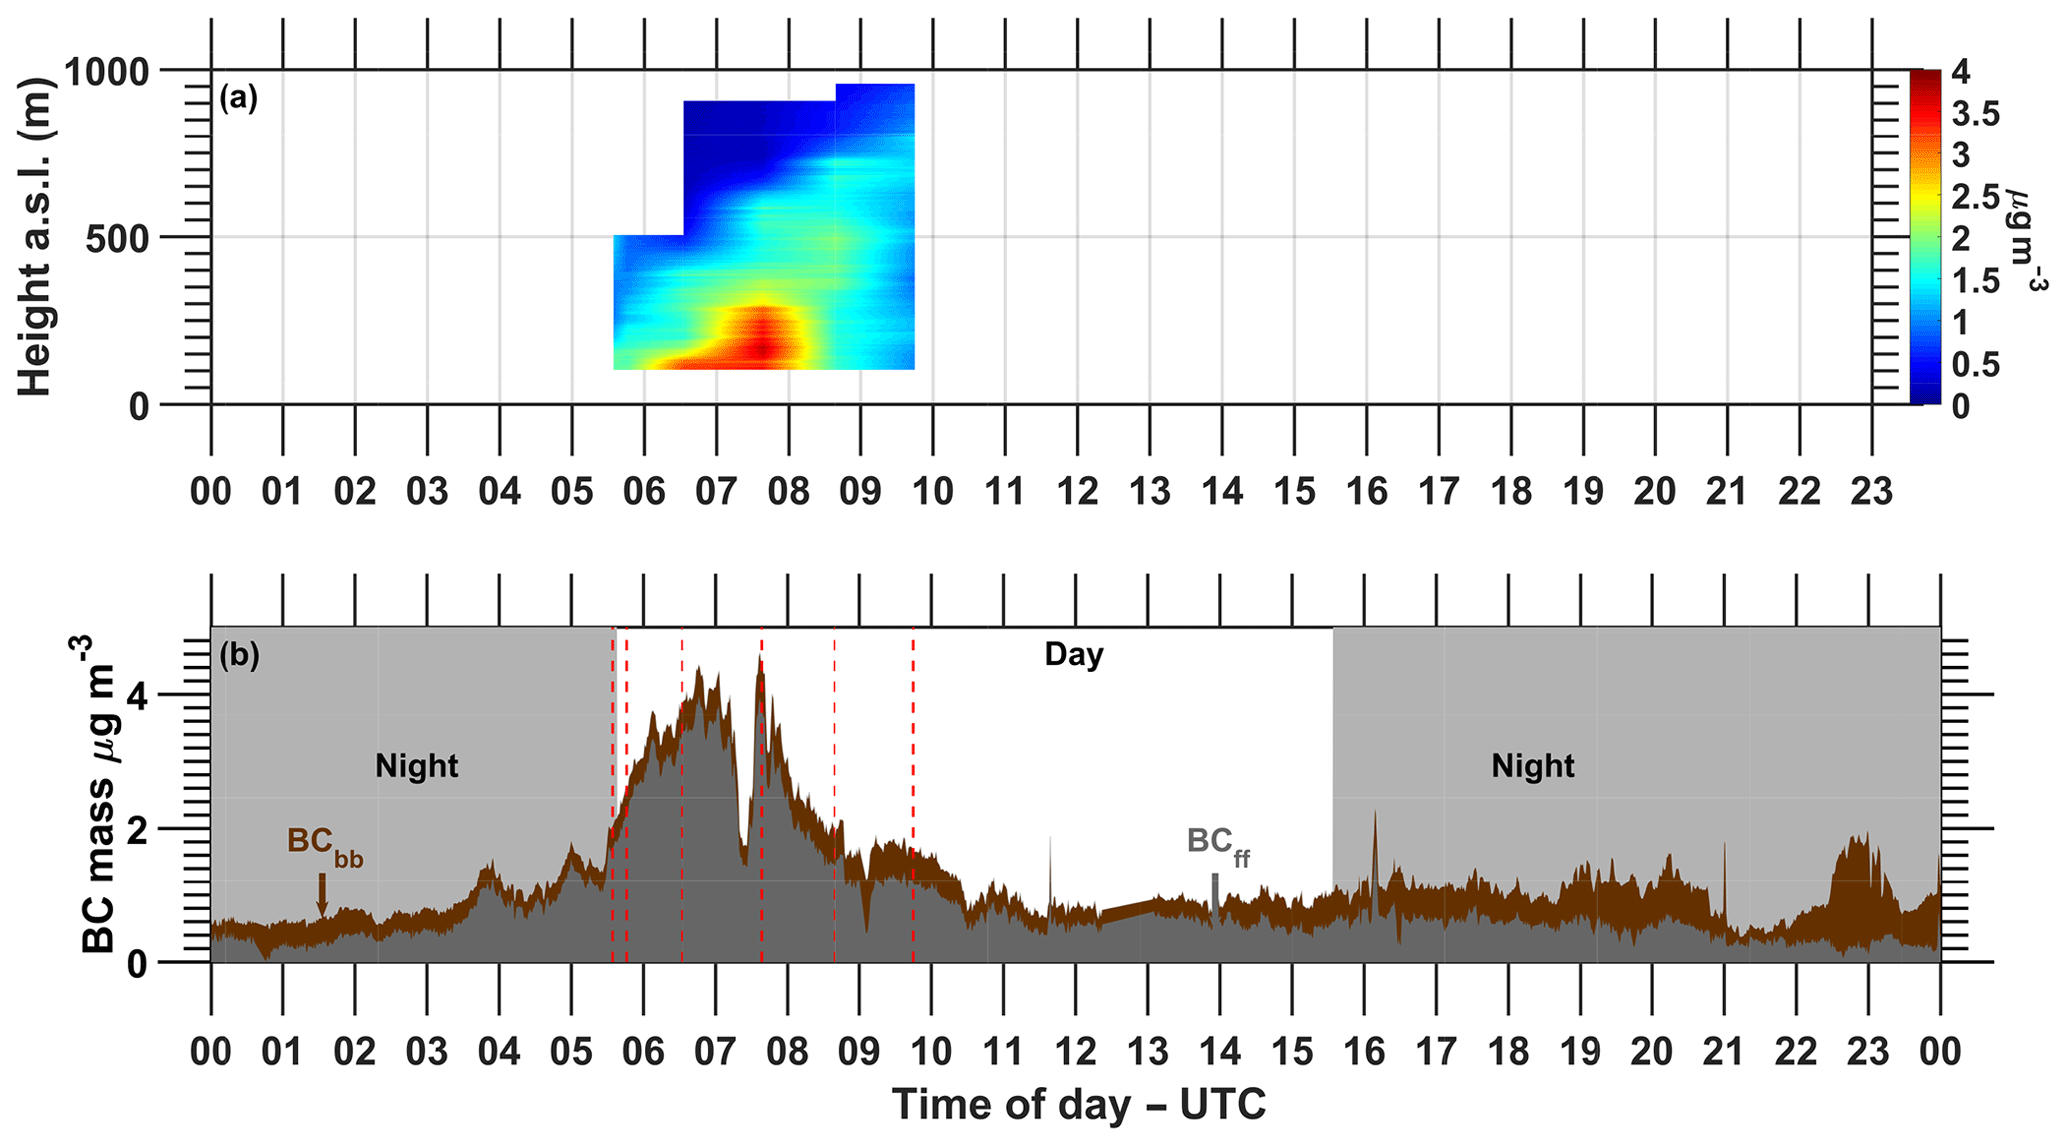
Figure 8Reconstruction of eBC mass vertical distribution (a) based on six flights between 05:30 and 09:30 (UTC), 19 January 2016 (Athens campaign). The lidar-determined vertical distributions are shown in Fig. 9. The corresponding ground measurements are also shown in (b). The concentration of BC from fossil fuel (ff) and biomass burning (bb) are shown with grey and brown color, respectively. Dashed red lines indicate the start of each of the six flights the reconstructed eBC profiles were based upon.
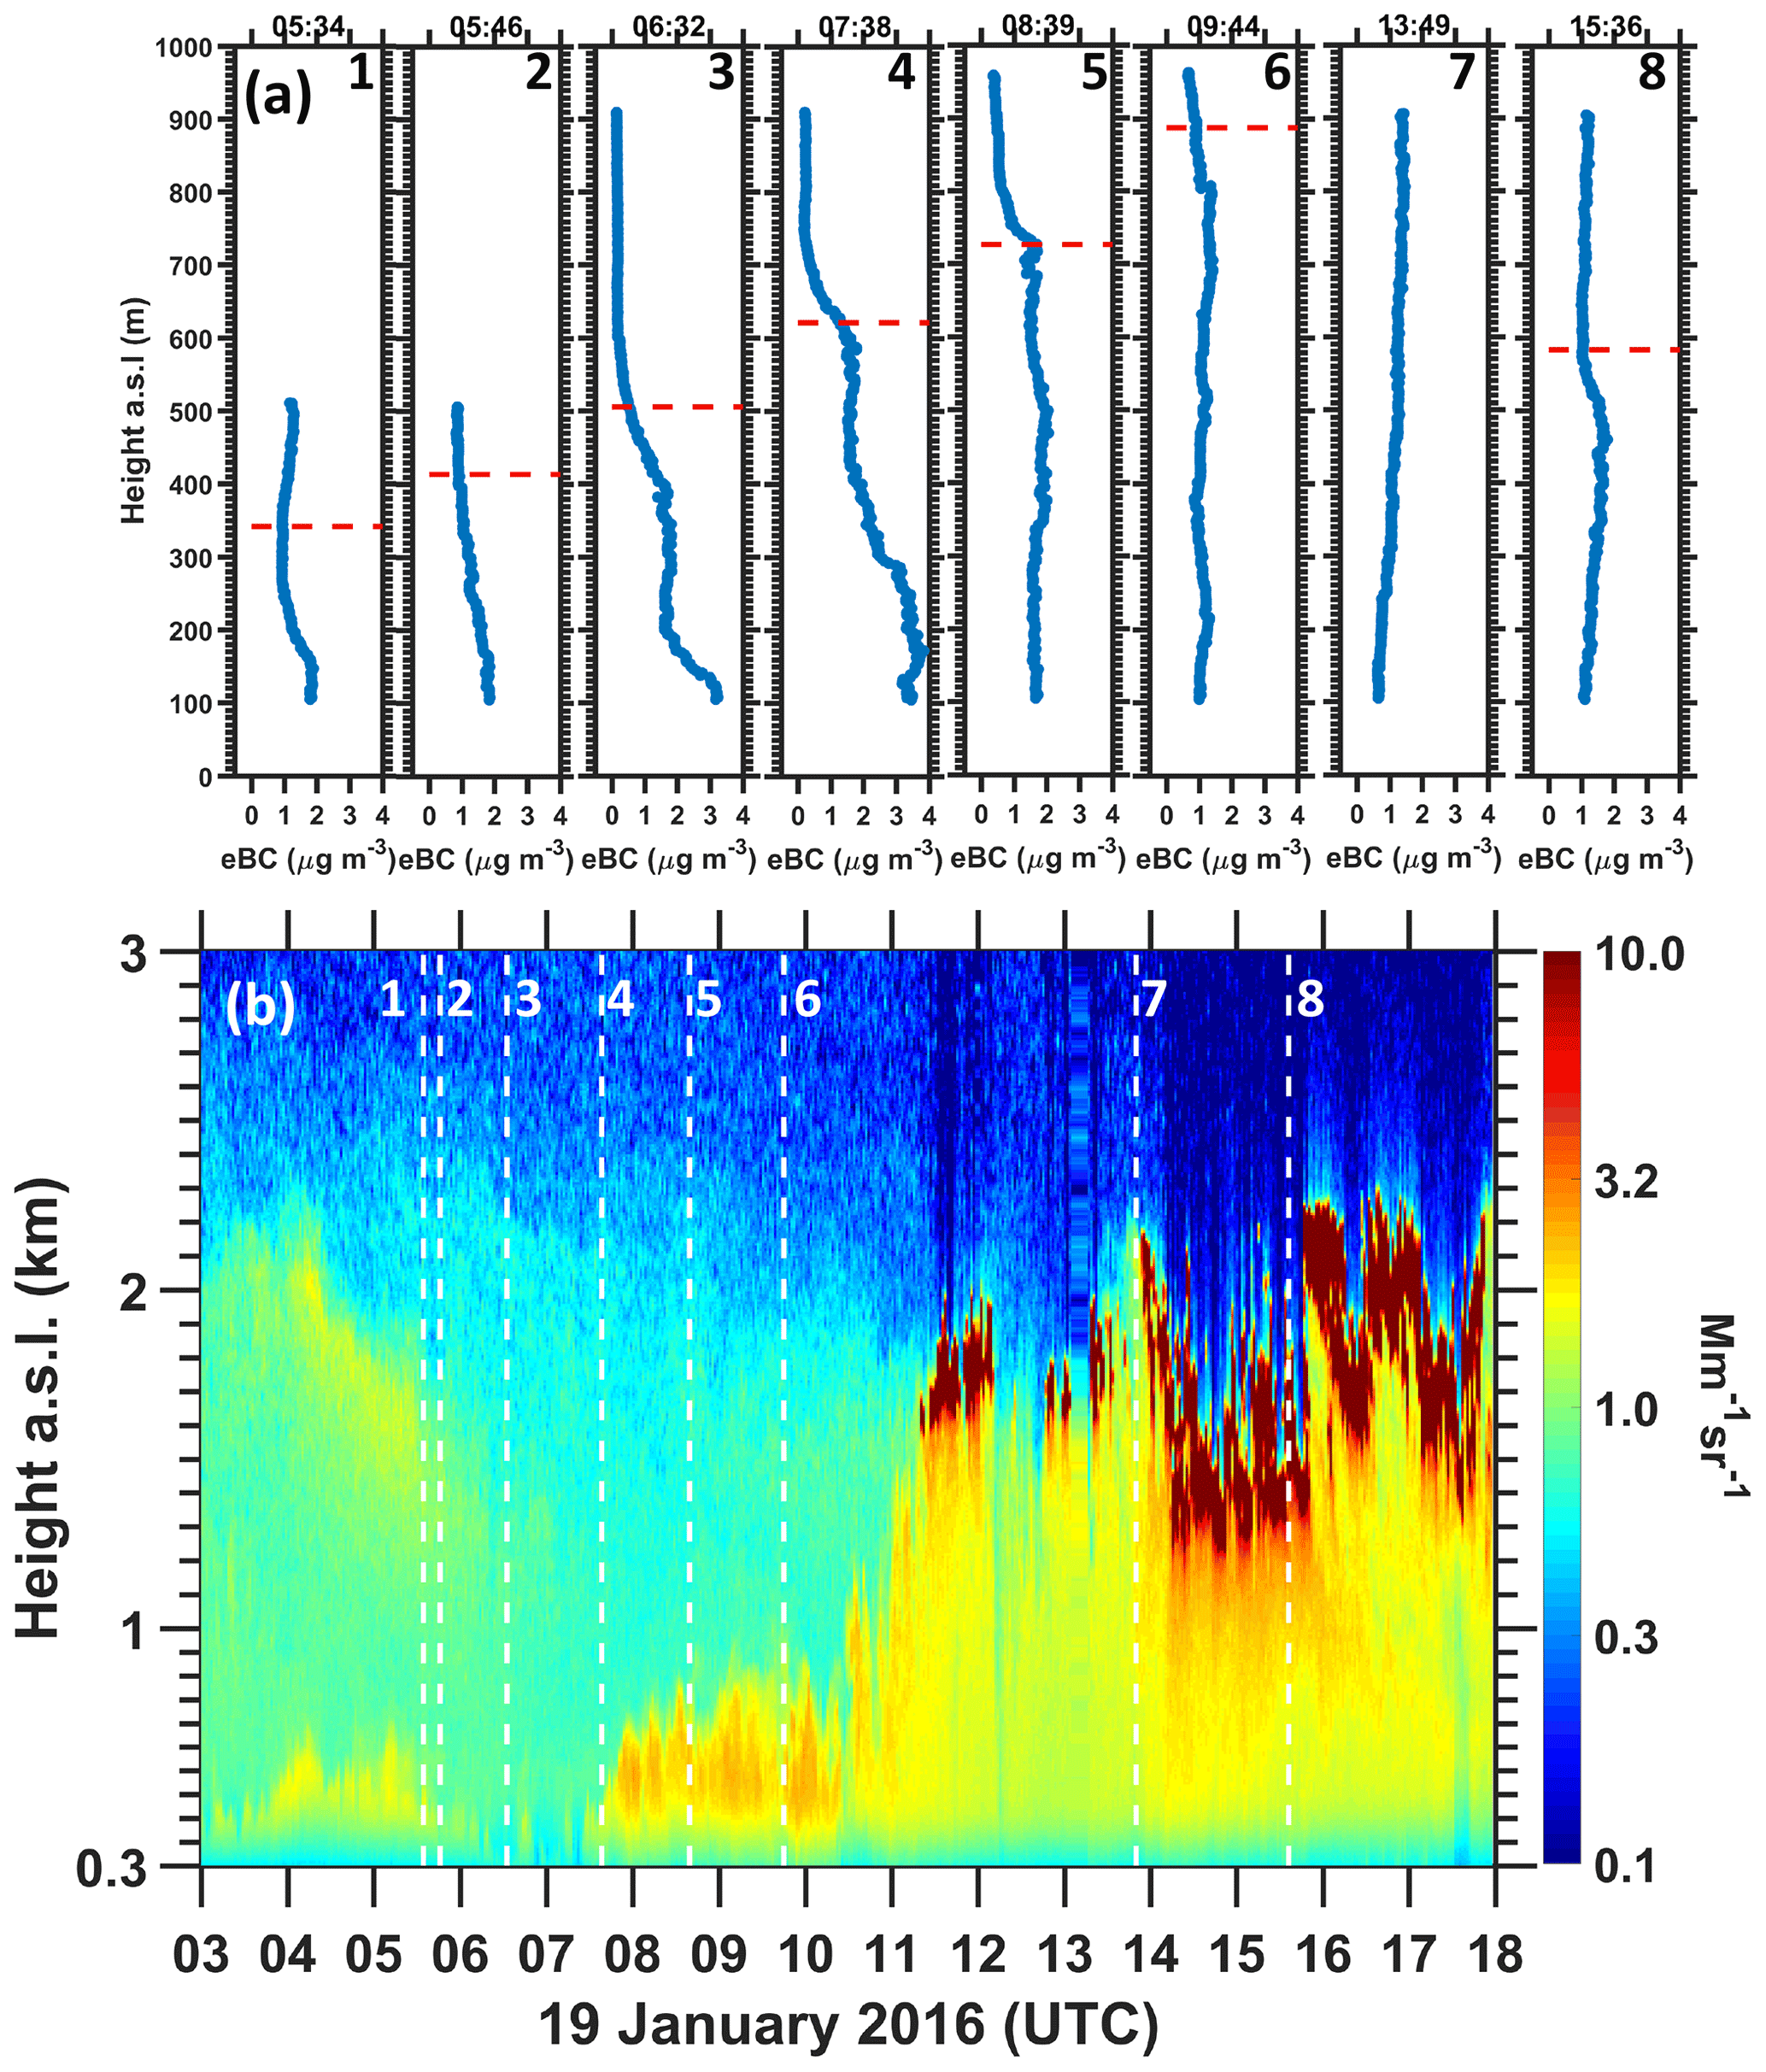
Figure 9Vertical profiles (blue lines) of the eBC mass (a), measured during 19 January 2016 (Athens campaign), accompanied by the mixing height (dashed red line) of the lower layer derived by Polly-XT measurements. During the 13:49 UTC flight, mixing height was higher than the maximum altitude of flight and it is not shown. The corresponding time–height display of the 1064 nm attenuated backscatter measured with Polly-XT is also shown (b). Dashed white lines correspond to the start of each of the eight flights performed during that day.
Above the PBL, which was determined by Polly-XT measurements (Baars et al., 2008; dashed red lines in Fig. 9), the measured concentration of eBC was always lower than the respective one measured within by at least 20 %. The highest eBC concentrations above the PBL were observed during sunrise and sunset (first and last diurnal profile in Fig. 9) equal to 1.9 and 2.0 µg m−3, respectively, which we interpret as the residual layer of the previous day in the morning and the newly formed residual layer after sunset. The lowest eBC concentration in this layer, equal to 0.3 µg m−3, was observed at 06:30 UTC but steadily increased to 0.4, 0.9, and 1.7 µg m−3during 07:38, 08:39, and 09:44 UTC, respectively. Due to flight restrictions, free tropospheric measurements could not be monitored after 10:00 UTC. PBL was also identified by vertical profiles of potential temperature, which are in good agreement with those derived by Polly-XT.
Before sunrise, our results suggest the presence of a stable boundary layer in contact with the ground that has been radiatively cooled; on top of the boundary layer, there is a residual layer. As the sun rises, the stable boundary layer's depth increases and simultaneously the residual layer is mixed with the free troposphere. On the 19 January 2016, mixing took place between 05:45 and 06:30 UTC. The concentration of eBC in the residual layer drops to near zero because the trapped pollutants are now diluted in the free troposphere.
However, the concentration of eBC above the boundary layer exhibited an increasing trend suggesting either convection of pollutants from the PBL or advection of regionally transported PM involving absorbing material that did not intrude the PBL. During the period when absorbing material was directly emitted from the ground and the boundary layer height increased (from 05:30–08:30 UTC), eBC dispersion inside the PBL was not homogeneous but was gradually decreasing with increasing altitude. The effect is more evident when emissions from the ground exhibited an increasing trend (approximately from 06:30 to 07:40 UTC). Once ground emissions reached their minimum and the PBL stabilized, the concentration inside the PBL became homogeneous (from 10:00 UTC till sunset). During sunset, stratification of a new stable boundary layer was observed and on top of it a new residual layer was forming.
The vertical absorption distribution was reconstructed based on the absorption profiles shown in Fig. 8 on 19 January 2016 between 05:34 and 09:36 (UTC) and also shown in Fig. 9 against calculated attenuated backscatter at 1064 nm measured by a PollyXT.
Two field campaigns were conducted in Athens (Greece) and in CAO (Cyprus) in order to (i) study the vertical distribution of aerosol absorption and (ii) to evaluate the performance of three miniature absorption sensors in contrasted atmospheric environments against ground-based reference instruments (MAAP and AE33). Measurements were conducted on the ground and air using three different models of UASs. Our results suggest that the absorption monitors used in this work agree better at the parameter they report, which is eBC in most cases, rather than the absorption coefficient. This discrepancy is directly related to the generic MAC values suggested by the manufacturer of each instrument. In case the absorption coefficient is not directly reported, it should be preferentially calculated based on a single set of wavelength-dependent MAC values specific to each site if these are known or can be calculated, instead of the generic value provided by the manufacturer.
The influence of humidity on attenuation measurements was investigated during the Athens campaign by placing two DWP in series, with the second measuring filtered air from the exhaust of the first. Sample drying minimized the influence of water adsorption/desorption on attenuation measurements.
During January 2016, the miniature sensors sampled urban aerosols at the center of Athens, Greece. On the ground, STAP and DWP followed the observed variations in the absorption well (R2≈0.90) against an AE33, while AE51's performance (R2=0.76) was poorer due to low sampling flow rate. STAP was found to overestimate absorption coefficient at 880 nm by 10 %, while AE51 and DWP overestimate it by 40 % and 30 %, respectively. However, with respect to eBC mass, the agreement was closer (within 7 %). An in-flight intercomparison between the lightweight AE51 and either the STAP or DWP was achieved during the Athens campaign. No correlation between the AE51 and STAP or DWP could be achieved for unconditioned high time resolution (1 Hz) measurements. An improvement of the smoothing algorithm suggested by Hagler et al. (2011) was applied here leading to improved correlations (R2 > 0.70) between miniature sensors (AE51, DWP, and STAP). Based on four UAS flights, DWP and AE51 correlated very well (comparison slope equal to 0.92) with respect to the absorption coefficient at 880 nm (babs(880)), while STAP was found to underestimate babs(880) by 12 %, which was consistent with the intercomparison performed at ground level against the AE33.
The Cyprus campaign took place at the Cyprus Atmospheric Observatory, a remote location 7 km away from the UAS runway, and two of the miniature sensors (DWP and AE51) were evaluated in-flight against ground-based reference instruments, taking advantage of the elevation difference between the two sites. In comparison with the Athens campaign, the correlation of both sensors (against reference instruments) deteriorated because of low atmospheric aerosol concentrations (4 times lower) and reduced atmospheric variability (6 times lower). While DWP showed relatively good correlation (R2=0.71, N=91 data points) and the same level of agreement as during the Athens campaign (6 % overestimate), the poor performance of AE51 (R2=0.32, N=91) was attributed to a lack of sensitivity of this sensor operating at a flow rate ca. 10 times lower compared to DWP.
The overall potential use of a miniature aerosol absorption sensor on board small UASs was illustrated with results of the campaign performed in Athens. During this campaign, the diurnal variability of the vertical distribution (0–1 km a.g.l.) of equivalent black carbon was investigated. It was found that eBC concentrations are not homogeneous in the boundary layer when it develops (PBL depth increases) and simultaneously absorbing material is emitted at ground level by traffic. Vertical homogeneity of eBC is reached in the afternoon when the boundary layer height is stabilized and emissions at the ground are reduced.
All data related to this publication are available upon request from the corresponding authors.
| Abbreviation | Description |
| AAE | Absorption Ångström exponent |
| ACTRIS | Aerosols, Clouds, and Trace Gases Research Infrastructure |
| a.s.l. | Above sea level |
| ATN | Attenuation |
| batn | Light attenuation coefficient |
| BACCHUS | Impact of Biogenic versus Anthropogenic emissions on Clouds and Climate; |
| towards a Holistic UnderStanding | |
| babs | Light absorption coefficient |
| BC | Black carbon |
| BCbb | BC related to biomass burning |
| C | Optical enhancement factor |
| CAO | Cyprus atmospheric observatory |
| CI | Confidence interval |
| DWP | Dual-wavelength prototype |
| EARLINET | European Aerosol Research Lidar Network |
| eBC | Equivalent black carbon |
| EC | Elemental carbon |
| GUI | Graphical user interface |
| MAAP | Multiangle Absorption Photometer |
| MAC | Mass absorption cross section |
| MTOW | Maximum takeoff weight |
| ONA | Optimized noise-reduction averaging |
| PBL | Planetary boundary layer |
| PSAP | Particle soot absorption photometer |
| R | Filter loading parameter |
| STAP | Single-channel tricolor absorption photometer |
| UASs | Unmanned aerial systems |
| α | Ångström exponent |
| λ | Wavelength |
| σatn | Mass attenuation cross section |
The supplement related to this article is available online at: https://doi.org/10.5194/amt-12-6425-2019-supplement.
The authors MV, NM, and JS were responsible for the conceptualization of the measurement studies, which were implemented by MP, IS, and SB along with the aerial research team that consists of GD, PA, PV, MA, and CK. EL and IS were responsible for the ground-based measurements during the Athens campaign. Data curation and investigation was performed by MP, except for the remote-sensing measurements that were performed by EM and VA. The first version of this work was written by MP and SB to undergo extensive editing by MV, NM, JS, LD, and GM. The smoothing algorithm concept and implementation were done by MP. LD and FB provided essential insights on the instrumentation used.
Luka Drinovec and Griša Močnik were, at the time of the measurement campaigns, employed by the manufacturer of most instruments used in the study. Fred Brechtel represents the manufacturer of STAP.
Mihalis Vrekoussis acknowledges support from the DFG-Research Center/Cluster of Excellence “The Ocean in the Earth System-MARUM”.
The two field campaigns (Athens, Cyprus) are a contribution to the ACTRIS2 project that has received funding from the European Union’s Horizon 2020 research and innovation program (grant no. 654109). Financial support was also acquired by the EU FP7 project BACCHUS (grant no. 603445). MP acknowledges the financial support of the CURE-3AB project, which is co-financed by the European Regional Development Fund and the Republic of Cyprus through the Research and Innovation Foundation (grant no. 0108). EM acknowledges the financial support of the Deutscher Akademischer Austauschdienst (grant no. 57370121). VA acknowledges the financial support of the European Research Council (grant no. 725698, D-TECT).
This paper was edited by Pierre Herckes and reviewed by two anonymous referees.
Andreae, M. O. and Gelencsér, A.: Black carbon or brown carbon? The nature of light-absorbing carbonaceous aerosols, Atmos. Chem. Phys., 6, 3131–3148, https://doi.org/10.5194/acp-6-3131-2006, 2006.
Baars, H., Ansmann, A., Engelmann, R., and Althausen, D.: Continuous monitoring of the boundary-layer top with lidar, Atmos. Chem. Phys., 8, 7281–7296, https://doi.org/10.5194/acp-8-7281-2008, 2008.
Bates, T. S., Quinn, P. K., Johnson, J. E., Corless, A., Brechtel, F. J., Stalin, S. E., Meinig, C., and Burkhart, J. F.: Measurements of atmospheric aerosol vertical distributions above Svalbard, Norway, using unmanned aerial systems (UAS), Atmos. Meas. Tech., 6, 2115–2120, https://doi.org/10.5194/amt-6-2115-2013, 2013.
Bisht, D. S., Tiwari, S., Dumka, U. C., Srivastava, A. K., Safai, P. D., Ghude, S. D., Chate, D. M., Rao, P. S. P., Ali, K., Prabhakaran, T., Panickar, A. S., Soni, V. K., Attri, S. D., Tunved, P., Chakrabarty, R. K., and Hopke, P. K.: Tethered balloon-born and ground-based measurements of black carbon and particulate profiles within the lower troposphere during the foggy period in Delhi, India, Sci. Total Environ., 573, 894–905, https://doi.org/10.1016/j.scitotenv.2016.08.185, 2016.
Bond, T. C. and Bergstrom, R. W.: Light absorption by carbonaceous particles: An investigative review, Aerosol Sci. Technol., 40, 27–67, https://doi.org/10.1080/02786820500421521, 2006.
Bond, T. C., Anderson, T. L., and Campbell, D.: Calibration and Intercomparison of Filter-Based Measurements of Visible Light Absorption by Aerosols, Aerosol Sci. Technol., 30, 582–600, https://doi.org/10.1080/027868299304435, 1999.
Bond, T. C., Doherty, S. J., Fahey, D. W., Forster, P. M., Berntsen, T., Deangelo, B. J., Flanner, M. G., Ghan, S., Kärcher, B., Koch, D., Kinne, S., Kondo, Y., Quinn, P. K., Sarofim, M. C., Schultz, M. G., Schulz, M., Venkataraman, C., Zhang, H., Zhang, S., Bellouin, N., Guttikunda, S. K., Hopke, P. K., Jacobson, M. Z., Kaiser, J. W., Klimont, Z., Lohmann, U., Schwarz, J. P., Shindell, D., Storelvmo, T., Warren, S. G., and Zender, C. S.: Bounding the role of black carbon in the climate system: A scientific assessment, J. Geophys. Res.-Atmos., 118, 5380–5552, https://doi.org/10.1002/jgrd.50171, 2013.
Box, G. E. P.: Non- normality and tests on variances, Biometrika, 40, 318–335, https://doi.org/10.1093/biomet/40.3-4.318, 1953.
Chilinski, M. T., Markowicz, K. M., and Markowicz, J.: Observation of vertical variability of black carbon concentration in lower troposphere on campaigns in Poland, Atmos. Environ., 137, 155–170, https://doi.org/10.1016/j.atmosenv.2016.04.020, 2016.
Collaud Coen, M., Weingartner, E., Apituley, A., Ceburnis, D., Fierz-Schmidhauser, R., Flentje, H., Henzing, J. S., Jennings, S. G., Moerman, M., Petzold, A., Schmid, O., and Baltensperger, U.: Minimizing light absorption measurement artifacts of the Aethalometer: evaluation of five correction algorithms, Atmos. Meas. Tech., 3, 457–474, https://doi.org/10.5194/amt-3-457-2010, 2010.
Corrigan, C. E., Roberts, G. C., Ramana, M. V., Kim, D., and Ramanathan, V.: Capturing vertical profiles of aerosols and black carbon over the Indian Ocean using autonomous unmanned aerial vehicles, Atmos. Chem. Phys., 8, 737–747, https://doi.org/10.5194/acp-8-737-2008, 2008.
Drinovec, L., Močnik, G., Zotter, P., Prévôt, A. S. H., Ruckstuhl, C., Coz, E., Rupakheti, M., Sciare, J., Müller, T., Wiedensohler, A., and Hansen, A. D. A.: The ”dual-spot” Aethalometer: an improved measurement of aerosol black carbon with real-time loading compensation, Atmos. Meas. Tech., 8, 1965–1979, https://doi.org/10.5194/amt-8-1965-2015, 2015.
Düsing, S., Wehner, B., Müller, T., Stöcker, A., and Wiedensohler, A.: The effect of rapid relative humidity changes on fast filter-based aerosol particle light absorption measurements: uncertainties and correction schemes, Atmos. Meas. Tech. Discuss., https://doi.org/10.5194/amt-2019-101, in review, 2019.
Engelmann, R., Kanitz, T., Baars, H., Heese, B., Althausen, D., Skupin, A., Wandinger, U., Komppula, M., Stachlewska, I. S., Amiridis, V., Marinou, E., Mattis, I., Linné, H., and Ansmann, A.: The automated multiwavelength Raman polarization and water-vapor lidar PollyXT: the neXT generation, Atmos. Meas. Tech., 9, 1767–1784, https://doi.org/10.5194/amt-9-1767-2016, 2016.
Erel, Y., Dayan, U., Rabi, R., Rudich, Y., and Stein, M.: Trans boundary transport of pollutants by atmospheric mineral dust, Environ. Sci. Technol., 40, 2996–3005, https://doi.org/10.1021/es051502l, 2006.
Ferrero, L., Mocnik, G., Ferrini, B. S., Perrone, M. G., Sangiorgi, G., and Bolzacchini, E.: Vertical profiles of aerosol absorption coefficient from micro-Aethalometer data and Mie calculation over Milan, Sci. Total Environ., 409, 2824–2837, https://doi.org/10.1016/j.scitotenv.2011.04.022, 2011.
Ferrero, L., Castelli, M., Ferrini, B. S., Moscatelli, M., Perrone, M. G., Sangiorgi, G., D'Angelo, L., Rovelli, G., Moroni, B., Scardazza, F., Močnik, G., Bolzacchini, E., Petitta, M., and Cappelletti, D.: Impact of black carbon aerosol over Italian basin valleys: high-resolution measurements along vertical profiles, radiative forcing and heating rate, Atmos. Chem. Phys., 14, 9641–9664, https://doi.org/10.5194/acp-14-9641-2014, 2014.
Ferrero, L., Cappelletti, D., Busetto, M., Mazzola, M., Lupi, A., Lanconelli, C., Becagli, S., Traversi, R., Caiazzo, L., Giardi, F., Moroni, B., Crocchianti, S., Fierz, M., Močnik, G., Sangiorgi, G., Perrone, M. G., Maturilli, M., Vitale, V., Udisti, R., and Bolzacchini, E.: Vertical profiles of aerosol and black carbon in the Arctic: a seasonal phenomenology along 2 years (2011–2012) of field campaigns, Atmos. Chem. Phys., 16, 12601–12629, https://doi.org/10.5194/acp-16-12601-2016, 2016.
Ferrero, L., Močnik, G., Cogliati, S., Gregorič, A., Colombo, R., and Bolzacchini, E.: Heating Rate of Light Absorbing Aerosols: Time-Resolved Measurements, the Role of Clouds, and Source Identification, Environ. Sci. Technol., 52, 3546–3555, https://doi.org/10.1021/acs.est.7b04320, 2018.
Florou, K., Papanastasiou, D. K., Pikridas, M., Kaltsonoudis, C., Louvaris, E., Gkatzelis, G. I., Patoulias, D., Mihalopoulos, N., and Pandis, S. N.: The contribution of wood burning and other pollution sources to wintertime organic aerosol levels in two Greek cities, Atmos. Chem. Phys., 17, 3145–3163, https://doi.org/10.5194/acp-17-3145-2017, 2017.
Fourtziou, L., Liakakou, E., Stavroulas, I., Theodosi, C., Zarmpas, P., Psiloglou, B., Sciare, J., Maggos, T., Bairachtari, K., Bougiatioti, A., Gerasopoulos, E., Sarda-Estève, R., Bonnaire, N., and Mihalopoulos, N.: Multi-tracer approach to characterize domestic wood burning in Athens (Greece) during wintertime, Atmos. Environ., 148, 89–101, https://doi.org/10.1016/j.atmosenv.2016.10.011, 2017.
Freney, E. J., Sellegri, K., Canonaco, F., Colomb, A., Borbon, A., Michoud, V., Doussin, J.-F., Crumeyrolle, S., Amarouche, N., Pichon, J.-M., Bourianne, T., Gomes, L., Prevot, A. S. H., Beekmann, M., and Schwarzenböeck, A.: Characterizing the impact of urban emissions on regional aerosol particles: airborne measurements during the MEGAPOLI experiment, Atmos. Chem. Phys., 14, 1397–1412, https://doi.org/10.5194/acp-14-1397-2014, 2014.
García Fernández, C., Picaud, S., and Devel, M.: Calculations of the mass absorption cross sections for carbonaceous nanoparticles modeling soot, J. Quant. Spectrosc. Ra., 164, 69–81, https://doi.org/10.1016/j.jqsrt.2015.05.011, 2015.
Gerasopoulos, E., Koulouri, E., Kalivitis, N., Kouvarakis, G., Saarikoski, S., Mäkelä, T., Hillamo, R., and Mihalopoulos, N.: Size-segregated mass distributions of aerosols over Eastern Mediterranean: seasonal variability and comparison with AERONET columnar size-distributions, Atmos. Chem. Phys., 7, 2551–2561, https://doi.org/10.5194/acp-7-2551-2007, 2007.
Hadley, O. L. and Kirchstetter, T. W.: Black-carbon reduction of snow albedo, Nat. Clim. Change, 2, 437–440, https://doi.org/10.1038/nclimate1433, 2012.
Hagler, G. S. W., Yelverton, T. L. B., Vedantham, R., Hansen, A. D. A., and Turner, J. R.: Post-processing method to reduce noise while preserving high time resolution in aethalometer real-time black carbon data, Aerosol Air Qual. Res., 11, 539–546, https://doi.org/10.4209/aaqr.2011.05.0055, 2011.
Hale, G. M. and Querry, M. R.: Optical Constants of Water in the 200-nm to 200-μm Wavelength Region, Appl. Optics, 12, 555–562, https://doi.org/10.1364/ao.12.000555, 1972.
Haywood, J. and Boucher, O.: Estimates of the direct and indirect radiative forcing due to tropospheric aerosols: A review, Rev. Geophys., 38, 513–543, https://doi.org/10.1029/1999RG000078, 2000.
Höpner, F., Bender, F. A.-M., Ekman, A. M. L., Praveen, P. S., Bosch, C., Ogren, J. A., Andersson, A., Gustafsson, Ö., and Ramanathan, V.: Vertical profiles of optical and microphysical particle properties above the northern Indian Ocean during CARDEX 2012, Atmos. Chem. Phys., 16, 1045–1064, https://doi.org/10.5194/acp-16-1045-2016, 2016.
Hyvärinen, A.-P., Vakkari, V., Laakso, L., Hooda, R. K., Sharma, V. P., Panwar, T. S., Beukes, J. P., van Zyl, P. G., Josipovic, M., Garland, R. M., Andreae, M. O., Pöschl, U., and Petzold, A.: Correction for a measurement artifact of the Multi-Angle Absorption Photometer (MAAP) at high black carbon mass concentration levels, Atmos. Meas. Tech., 6, 81–90, https://doi.org/10.5194/amt-6-81-2013, 2013.
Inoue, Y., Morinaga, S., and Tomita, A.: A blimp-based remote sensing system for low-altitude monitoring of plant variables: A preliminary experiment for agricultural and ecological applications, Int. J. Remote Sens., 21, 379–385, https://doi.org/10.1080/014311600210894, 2000.
IPCC: Climate Change 2013: The Physical Science Basis. Cambridge University Press, Cambridge, UK and New York, USA, 2013.
Jensen, T., Apan, A., Young, F., and Zeller, L.: Detecting the attributes of a wheat crop using digital imagery acquired from a low-altitude platform, Comput. Electron. Agr., 59, 66–77, https://doi.org/10.1016/j.compag.2007.05.004, 2007.
Kalivitis, N., Gerasopoulos, E., Vrekoussis, M., Kouvarakis, G., Kubilay, N., Hatzianastassiou, N., Vardavas, I., and Mihalopoulos, N.: Dust transport over the eastern mediterranean derived from total ozone mapping spectrometer, aerosol robotic network, and surface measurements, J. Geophys. Res.-Atmos., 112, 1–9, https://doi.org/10.1029/2006JD007510, 2007.
Kassianov, E., Berg, L., Pekour, M., Barnard, J., Chand, D., Comstock, J., Flynn, C., Sedlacek, A., Shilling, J., Telg, H., Tomlinson, J., Zelenyuk, A., and Fast, J.: A Closure Study of Total Scattering Using Airborne In Situ Measurements from the Winter Phase of TCAP, Atmosphere, 9, 228–246, https://doi.org/10.3390/atmos9060228, 2018.
Katich, J. M., Samset, B. H., Bui, T. P., Dollner, M., Froyd, K. D., Campuzano-Jost, P., Nault, B. A., Schroder, J. C., Weinzierl, B., and Schwarz, J. P.: Strong Contrast in Remote Black Carbon Aerosol Loadings Between the Atlantic and Pacific Basins, J. Geophys. Res.-Atmos., 123, 13386–13395, https://doi.org/10.1029/2018JD029206, 2018.
Kleanthous, S., Vrekoussis, M., Mihalopoulos, N., Kalabokas, P., and Lelieveld, J.: On the temporal and spatial variation of ozone in Cyprus, Sci. Total Environ., 476–477, 677–687, https://doi.org/10.1016/j.scitotenv.2013.12.101, 2014.
Lack, D. A. and Cappa, C. D.: Impact of brown and clear carbon on light absorption enhancement, single scatter albedo and absorption wavelength dependence of black carbon, Atmos. Chem. Phys., 10, 4207–4220, https://doi.org/10.5194/acp-10-4207-2010, 2010.
Lack, D. A., Moosmüller, H., McMeeking, G. R., Chakrabarty, R. K., and Baumgardner, D.: Characterizing elemental, equivalent black, and refractory black carbon aerosol particles: A review of techniques, their limitations and uncertainties, Anal. Bioanal. Chem., 406, 99–122, https://doi.org/10.1007/s00216-013-7402-3, 2014.
Lelieveld, J., Berresheim, H., Borrmann, S., Crutzen, P. J., Dentener, F. J., Fischer, H., Feichter, J., Flatau, P. J., Heland, J., Holzinger, R., Korrmann, R., Lawrence, M. G., Levin, Z., Markowicz, K. M., Mihalopoulos, N., Minikin, A., Ramanathan, V., De Reus, M., Roelofs, G. J., Scheeren, H. A., Sciare, J., Schlager, H., Schultz, M., Siegmund, P., Steil, B., Stephanou, E. G., Stier, P., Traub, M., Warneke, C., Williams, J., and Ziereis, H.: Global air pollution crossroads over the Mediterranean, Science, 298, 794–799, https://doi.org/10.1126/science.1075457, 2002.
Liu, D., Quennehen, B., Darbyshire, E., Allan, J. D., Williams, P. I., Taylor, J. W., Bauguitte, S. J.-B., Flynn, M. J., Lowe, D., Gallagher, M. W., Bower, K. N., Choularton, T. W., and Coe, H.: The importance of Asia as a source of black carbon to the European Arctic during springtime 2013, Atmos. Chem. Phys., 15, 11537–11555, https://doi.org/10.5194/acp-15-11537-2015, 2015.
Mamali, D., Marinou, E., Sciare, J., Pikridas, M., Kokkalis, P., Kottas, M., Binietoglou, I., Tsekeri, A., Keleshis, C., Engelmann, R., Baars, H., Ansmann, A., Amiridis, V., Russchenberg, H., and Biskos, G.: Vertical profiles of aerosol mass concentration derived by unmanned airborne in situ and remote sensing instruments during dust events, Atmos. Meas. Tech., 11, 2897–2910, https://doi.org/10.5194/amt-11-2897-2018, 2018.
Marinou, E., Tesche, M., Nenes, A., Ansmann, A., Schrod, J., Mamali, D., Tsekeri, A., Pikridas, M., Baars, H., Engelmann, R., Voudouri, K.-A., Solomos, S., Sciare, J., Groß, S., Ewald, F., and Amiridis, V.: Retrieval of ice-nucleating particle concentrations from lidar observations and comparison with UAV in situ measurements, Atmos. Chem. Phys., 19, 11315–11342, https://doi.org/10.5194/acp-19-11315-2019, 2019.
Moosmüller, H., Chakrabarty, R. K., and Arnott, W. P.: Aerosol light absorption and its measurement: A review, J. Quant. Spectrosc. Ra, 110, 844–878, https://doi.org/10.1016/j.jqsrt.2009.02.035, 2009.
Müller, T., Henzing, J. S., de Leeuw, G., Wiedensohler, A., Alastuey, A., Angelov, H., Bizjak, M., Collaud Coen, M., Engström, J. E., Gruening, C., Hillamo, R., Hoffer, A., Imre, K., Ivanow, P., Jennings, G., Sun, J. Y., Kalivitis, N., Karlsson, H., Komppula, M., Laj, P., Li, S.-M., Lunder, C., Marinoni, A., Martins dos Santos, S., Moerman, M., Nowak, A., Ogren, J. A., Petzold, A., Pichon, J. M., Rodriquez, S., Sharma, S., Sheridan, P. J., Teinilä, K., Tuch, T., Viana, M., Virkkula, A., Weingartner, E., Wilhelm, R., and Wang, Y. Q.: Characterization and intercomparison of aerosol absorption photometers: result of two intercomparison workshops, Atmos. Meas. Tech., 4, 245–268, https://doi.org/10.5194/amt-4-245-2011, 2011.
Myhre, G., Samset, B. H., Schulz, M., Balkanski, Y., Bauer, S., Berntsen, T. K., Bian, H., Bellouin, N., Chin, M., Diehl, T., Easter, R. C., Feichter, J., Ghan, S. J., Hauglustaine, D., Iversen, T., Kinne, S., Kirkevåg, A., Lamarque, J.-F., Lin, G., Liu, X., Lund, M. T., Luo, G., Ma, X., van Noije, T., Penner, J. E., Rasch, P. J., Ruiz, A., Seland, Ø., Skeie, R. B., Stier, P., Takemura, T., Tsigaridis, K., Wang, P., Wang, Z., Xu, L., Yu, H., Yu, F., Yoon, J.-H., Zhang, K., Zhang, H., and Zhou, C.: Radiative forcing of the direct aerosol effect from AeroCom Phase II simulations, Atmos. Chem. Phys., 13, 1853–1877, https://doi.org/10.5194/acp-13-1853-2013, 2013.
Ogren, J. A.: Comment on “Calibration and Intercomparison of Filter-Based Measurements of Visible Light Absorption by Aerosols,” Aerosol Sci. Technol., 44, 589–591, https://doi.org/10.1080/02786826.2010.482111, 2010.
Petrakakis, M. J., Kelessis, A. G., Tzoumaka, P., and Samara, C.: Levels of Suspended Particulate Matter before and after the Economic Crisis in Thessaloniki, Greece, Proceedings of 17th International Symposium on Environmental Pollution and its Impact on Life in the Mediterranean Region, Istanbul, Turkey, 28 September–1 October, Mediterranean Scientific Association of Environmental Protection (MESAEP), 2013.
Petzold, A. and Schönlinner, M.: Multi-angle absorption photometry – A new method for the measurement of aerosol light absorption and atmospheric black carbon, J. Aerosol Sci., 35, 421–441, https://doi.org/10.1016/j.jaerosci.2003.09.005, 2004.
Petzold, A., Onasch, T., Kebabian, P., and Freedman, A.: Intercomparison of a Cavity Attenuated Phase Shift-based extinction monitor (CAPS PMex) with an integrating nephelometer and a filter-based absorption monitor, Atmos. Meas. Tech., 6, 1141–1151, https://doi.org/10.5194/amt-6-1141-2013, 2013.
Pikridas, M., Tasoglou, A., Florou, K., and Pandis, S. N.: Characterization of the origin of fine particulate matter in a medium size urban area in the Mediterranean, Atmos. Environ., 80, 264–274, https://doi.org/10.1016/j.atmosenv.2013.07.070, 2013.
Pikridas, M., Vrekoussis, M., Sciare, J., Kleanthous, S., Vasiliadou, E., Kizas, C., Savvides, C., and Mihalopoulos, N.: Spatial and temporal (short and long-term) variability of submicron, fine and sub-10 µm particulate matter (PM1, PM2.5, PM10) in Cyprus, Atmos. Environ., 191, 79–93, https://doi.org/10.1016/j.atmosenv.2018.07.048, 2018.
Ramachandran, S. and Rajesh, T. A.: Black carbon aerosol mass concentrations over Ahmedabab, an urban location in western India: Comparison with urban sites in Asia, Europe, Canada, and the United States, J. Geophys. Res.-Atmos., 112, 1–19, https://doi.org/10.1029/2006JD007488, 2007.
Ran, L., Deng, Z., Xu, X., Yan, P., Lin, W., Wang, Y., Tian, P., Wang, P., Pan, W., and Lu, D.: Vertical profiles of black carbon measured by a micro-aethalometer in summer in the North China Plain, Atmos. Chem. Phys., 16, 10441–10454, https://doi.org/10.5194/acp-16-10441-2016, 2016.
Saffari, A., Daher, N., Samara, C., Voutsa, D., Kouras, A., Manoli, E., Karagkiozidou, O., Vlachokostas, C., Moussiopoulos, N., Shafer, M. M., Schauer, J. J., and Sioutas, C.: Increased biomass burning due to the economic crisis in Greece and its adverse impact on wintertime air quality in Thessaloniki, Environ. Sci. Technol., 47, 13313–13320, https://doi.org/10.1021/es403847h, 2013.
Samset, B. H., Stjern, C. W., Andrews, E., Kahn, R. A., Myhre, G., Schulz, M., and Schuster, G. L.: Aerosol Absorption: Progress Towards Global and Regional Constraints, Curr. Clim. Chang. Reports, 4, 65–83, https://doi.org/10.1007/s40641-018-0091-4, 2018.
Sandradewi, J., Prévôt, A. S. H., Szidat, S., Perron, N., Alfarra, M. R., Lanz, V. A., Weingartner, E., and Baltensperger, U. R. S.: Using aerosol light abosrption measurements for the quantitative determination of wood burning and traffic emission contribution to particulate matter, Environ. Sci. Technol., 42, 3316–3323, https://doi.org/10.1021/es702253m, 2008.
Schrod, J., Weber, D., Drücke, J., Keleshis, C., Pikridas, M., Ebert, M., Cvetković, B., Nickovic, S., Marinou, E., Baars, H., Ansmann, A., Vrekoussis, M., Mihalopoulos, N., Sciare, J., Curtius, J., and Bingemer, H. G.: Ice nucleating particles over the Eastern Mediterranean measured by unmanned aircraft systems, Atmos. Chem. Phys., 17, 4817–4835, https://doi.org/10.5194/acp-17-4817-2017, 2017.
Sedlacek III, A. J., Buseck, P. R., Adachi, K., Onasch, T. B., Springston, S. R., and Kleinman, L.: Formation and evolution of tar balls from northwestern US wildfires, Atmos. Chem. Phys., 18, 11289–11301, https://doi.org/10.5194/acp-18-11289-2018, 2018.
Seinfeld, J. H., Carmichael, G. R., Arimoto, R., Conant, W. C., Brechtel, F. J., Bates, T. S., Cahill, T. A., Clarke, A. D., Doherty, S. J., Flatau, P. J., Huebert, B. J., Kim, J., Markowicz, K. M., Quinn, P. K., Russell, L. M., Russell, P. B., Shimizu, A., Shinozuka, Y., Song, C. H., Tang, Y., Uno, I., Vogelmann, A. M., Weber, R. J., Woo, J. H., and Zhang, X. Y.: ACE-ASIA: Regional climatic and atmospheric chemical effects of Asian dust and pollution, B. Am. Meteorol. Soc., 85, 367–380, https://doi.org/10.1175/BAMS-85-3-367, 2004.
Sheridan, P. J., Patrick Arnott, W., Ogren, J. A., Andrews, E., Atkinson, D. B., Covert, D. S., Moosmüller, H., Petzold, A., Schmid, B., Strawa, A. W., Varma, R., and Virkkula, A.: The reno aerosol optics study: An evaluation of aerosol absorption measurement methods, Aerosol Sci. Technol., 39, 1–16, https://doi.org/10.1080/027868290901891, 2005.
Shiraiwa, M., Kondo, Y., Iwamoto, T., and Kita, K.: Amplification of light absorption of black carbon by organic coating, Aerosol Sci. Technol., 44, 46–54, https://doi.org/10.1080/02786820903357686, 2010.
Slowik, J. G., Cross, E. S., Han, J. H., Davidovits, P., Onasch, T. B., Jayne, J. T., Williams, L. R., Canagaratna, M. R., Worsnop, D. R., Chakrabarty, R. K., Moosmüller, H., Arnott, W. P., Schwarz, J. P., Gao, R. S., Fahey, D. W., Kok, G. L., and Petzold, A.: An Inter-Comparison of Instruments Measuring Black Carbon Content of Soot Particles, Aerosol Sci. Technol., 41, 295–314, https://doi.org/10.1080/02786820701197078, 2007.
Subramanian, R., Kok, G. L., Baumgardner, D., Clarke, A., Shinozuka, Y., Campos, T. L., Heizer, C. G., Stephens, B. B., de Foy, B., Voss, P. B., and Zaveri, R. A.: Black carbon over Mexico: the effect of atmospheric transport on mixing state, mass absorption cross-section, and BC/CO ratios, Atmos. Chem. Phys., 10, 219–237, https://doi.org/10.5194/acp-10-219-2010, 2010.
US Department of Transportation, Federal Aviation Administration: CFR-code of federal regulations title 14, Registration and Marking Requirements for Small Unmanned Aircraft Part 48, available at: https://www.faa.gov/news/updates/media/20151213_IFR.pdf (last access: 25 September 2019), 2015.
Villa, T., Gonzalez, F., Miljievic, B., Ristovski, Z. D., and Morawska, L.: An overview of small unmanned aerial vehicles for air quality measurements: Present applications and future prospectives, Sensors (Switzerland), 16, 1072, https://doi.org/10.3390/s16071072, 2016.
Virkkula, A., Ahlquist, N. C., Covert, D. S., Arnott, W. P., Sheridan, P. J., Quinn, P. K., and Coffman, D. J.: Modification, calibration and a field test of an instrument for measuring light absorption by particles, Aerosol Sci. Technol., 39, 68–83, https://doi.org/10.1080/027868290901963, 2005.
Wang, R., Balkanski, Y., Boucher, O., Ciais, P., Schuster, G. L., Chevallier, F., Samset, B. H., Liu, J., Piao, S., Valari, M., and Tao, S.: Estimation of global black carbon direct radiative forcing and its uncertainty constrained by observations, J. Geophys. Res., 121, 5948–5971, https://doi.org/10.1002/2015JD024326, 2016.
Watson, J. G., Chow, J. C., and Chen, L.-W. A.: Summary of Organic and Elemental Carbon/Black Carbon Analysis Methods and Intercomparisons, Aerosol Air Qual. Res., 5, 65–102, 2005.
Weingartner, E., Saathoff, H., Schnaiter, M., Streit, N., Bitnar, B., and Baltensperger, U.: Absorption of light by soot particles: Determination of the absorption coefficient by means of aethalometers, J. Aerosol Sci., 34, 1445–1463, https://doi.org/10.1016/S0021-8502(03)00359-8, 2003.
Welch, B. L.: The generalization of “Student's” problem when several different population variances are involved, Biometrika, 34, 28–35, https://doi.org/10.1093/biomet/34.1-2.28, 1947.
Wilcox, E. M., Thomas, R. M., Praveen, P. S., Pistone, K., Bender, F. A.-M., and Ramanathan, V.: Black carbon solar absorption suppresses turbulence in the atmospheric boundary layer, P. Natl. Acad. Sci. USA, 113, 11794–11799, https://doi.org/10.1073/pnas.1525746113, 2016.
Zhang, H., Zhou, C., Wang, Z., Zhao, S., and Li, J.: The influence of different black carbon and sulfate mixing methods on their optical and radiative properties, J. Quant. Spectrosc. Ra., 161, 105–116, https://doi.org/10.1016/j.jqsrt.2015.04.002, 2015.
Zhang, Y., Favez, O., Canonaco, F., Liu, D., Močnik, G., Amodeo, T., Sciare, J., Prévôt, A. S. H., Gros, V., and Albinet, A.: Evidence of major secondary organic aerosol contribution to lensing effect black carbon absorption enhancement, npj Clim. Atmos. Sci., 1, 47, https://doi.org/10.1038/s41612-018-0056-2, 2018.
- Abstract
- Introduction
- Instrumentation
- Sampling sites
- Data exploitation: improvement of the optimized noise-reduction averaging (ONA) smoothing algorithm
- Quality assurance
- UAS-based absorption measurements
- Comparison of miniature attenuation monitors against reference instruments
- Diurnal vertical profiles of black carbon above Athens: a case study
- Conclusions
- Data availability
- Appendix A: Nomenclature
- Author contributions
- Competing interests
- Acknowledgements
- Financial support
- Review statement
- References
- Supplement