the Creative Commons Attribution 4.0 License.
the Creative Commons Attribution 4.0 License.
Ice crystal number concentration from lidar, cloud radar and radar wind profiler measurements
Patric Seifert
Martin Radenz
Holger Baars
Albert Ansmann
A new method for the retrieval of ice crystal number concentration (ICNC) from combined active remote-sensing measurements of Raman lidar, cloud radar and radar wind profiler is presented. We exploit – for the first time – measurements of terminal fall velocity together with the radar reflectivity factor and/or the lidar-derived particle extinction coefficient in clouds for retrieving the number concentration of pristine ice particles with presumed particle shapes. A lookup table approach for the retrieval of the properties of the particle size distribution from observed parameters is presented. Analysis of methodological uncertainties and error propagation is performed, which shows that a retrieval of ice particle number concentration based on terminal fall velocity is possible within 1 order of magnitude. Comparison between a retrieval of the number concentration based on terminal fall velocity on the one hand and lidar and cloud radar on the other shows agreement within the uncertainties of the retrieval.
- Article
(7099 KB) - Full-text XML
- Companion paper
- BibTeX
- EndNote
Aerosols, clouds and precipitation are major components of Earth's climate system. The complex aerosol–cloud-dynamics interaction currently poses major challenges for the numerical modeling of climate and weather phenomena because the majority of rain formation on Earth happens through the ice phase (Mülmenstädt et al., 2015). The process of heterogeneous ice nucleation in clouds is of particular importance because it constitutes the link between aerosol conditions – including ice-nucleating particle concentration (INPC) – and precipitation formation (Ansmann et al., 2019). An understanding of ice nucleation and growth is necessary for understanding precipitation formation, cloud stability (Korolev et al., 2017), secondary ice formation (Sullivan et al., 2017) and cloud radiative transfer (Sun and Shine, 1994). It is, hence, a key process for the global weather and climate system which must be understood in detail in order to make accurate predictions about cloud and precipitation patterns in state-of-the-art numerical weather forecasts and future climate projections.
To date, ice nucleation has not been able to be observed directly in the atmosphere, but we are gaining the ability to retrieve ice crystal number concentration (ICNC, further designated as N) and the respective ice crystal number flux (F). Both are promising approaches to gain quantitative information about ice nucleation in clouds. Apart from N, (with vt as the terminal fall velocity) is especially well suited to derive the rate of ice production in clouds. An illustration of the use of F in comparison with N is given in Fig. 1. F of falling ice particles yields a direct measure of the rate of ice production in the cloud above. Bühl et al. (2016) estimated ice mass fluxes produced in well-constrained shallow stratiform cloud layers. Based on these measurements, information about the contribution of ice precipitation on the mass balance of the mixed-phase cloud layer was retrieved.
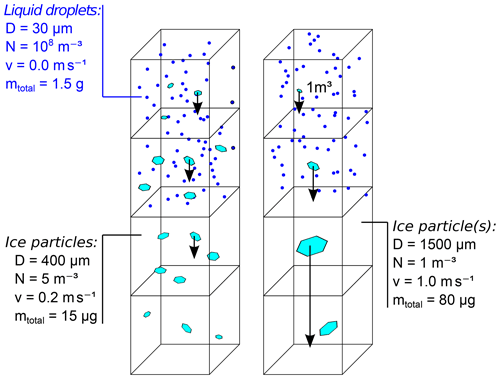
Figure 1Comparison of two clouds with different ice crystal number concentrations N but with the same ice crystal number flux, F=1 m−2 s−1 ( with vt terminal fall velocity), and, hence, also the same rate of ice production. The left column shows higher ice crystal number concentration (N) but less total ice mass, and the right column shows lower N and higher total ice mass.
Aircraft observations have been used frequently for measuring N and F via optical measurement of the particle size distribution (PSD) of ice crystals (Eidhammer et al., 2010; Westbrook and Illingworth, 2013; Voigt et al., 2017). Such observations can indeed deliver a quantitative picture of N and the shape of particles, but since they take place at only one height level, the actual level of ice formation is often not known, thus blurring the resulting long-term statistics. Ground-based remote sensing provides accurate information about the ice nucleation level. However, retrieving N from remote-sensing measurements is extremely challenging. In particular, freshly created pristine ice crystals pose challenges in this context because they vary strongly in shape over different ranges of ice nucleation temperatures, thus sensitively influencing the accuracy of retrievals and model results (Simmel et al., 2015).
Today, all remote-sensing approaches for retrieving N need a priori information about crystal size before it is possible to be able to derive N. Extensive observational variables like lidar-derived optical particle extinction E or radar reflectivity factor Z can then be used to retrieve N. Hence, the task of deriving an estimation of particle size is central to deriving N. Different methods exist for retrieving a proxy for particle size. Mitchell et al. (2018) use a combination of active and passive remote-sensing sensors in order to constrain the properties of the observed cloud particles. Cazenave et al. (2019), Delanoë and Hogan (2010), and Sourdeval et al. (2018) employ a forward-iteration method in order to obtain an estimation of N from combined observations of spaceborne lidar and cloud radar. Employing these techniques, an estimation of N based on assumptions (e.g., on particle shape) is well constrained if both lidar and cloud radar (CR; Görsdorf et al., 2015) observations are available. This method exploits the strong wavelength dependence in the efficiency of the backscatter signal between lidar (geometrical scattering) and radar (Rayleigh/Mie scattering) for ice particles. In optically thick clouds, where only CR measurements are available, the method falls back to parameterizations of particle size, and the retrieval of N is no longer possible. Also multi-frequency radar observations have been introduced for the measurement of particle sizes (Battaglia et al., 2014; Sekelsky et al., 1999; Kneifel et al., 2011). However, such methods do not work for pristine particles (with a diameter smaller than about 1 mm, Battaglia et al., 2014). For these particles, only the terminal fall velocity vt leaves traces about particle size, but actual observations of vt are difficult to obtain. Such observations have been made in laboratories (Fukuta and Takahashi, 1999) and, recently, Bühl et al. (2015) and Radenz et al. (2018) showed that a combination of the CR and radar wind profiler (RWP; Steinhagen et al., 1998; Lehmann and Teschke, 2001) can be used in order to derive vt of ice particles.
In the present work, we make use of these new measurements and present an alternative approach for the retrieval of N that works in the presence of very small pristine ice crystals and in clouds which cannot be penetrated by lidar. vt and spectral width w obtained from combined Doppler spectra observed with the CR and RWP are used to derive the median diameter (Dm) and the shape parameter μ of a gamma-μ distribution. This kind of distribution is mentioned and shortly discussed in Delanoë et al. (2005) as one option for a universally applicable PSD for ice crystal populations. A forward model approach based on a lookup table of numerically derived microphysical and observed parameters is employed in the present work. Combinations of environmental and microphysical input parameters are used to compute a lookup table with a set of observable variables, e.g., vt, E and Z. The observable variables are compared to the actually measured variables in order to come up with an estimation of ice crystal properties, F and N. We concentrate on the description and evaluation of the method and present one case study in which different ways of performing the retrieval are exercised.
The paper is structured as follows. Section 2 describes how the data used in the paper has been acquired. In Sect. 3 the method for deriving information about the PSD from both vt and the combined lidar/radar measurements is described. Section 4 presents example case studies. The conclusion and outlook are given in Sect. 5.
The remote-sensing data used in the context of this work were acquired during the COLRAWI-2 campaign (Combined Observations with Lidar, Radar And Wind profiler) at the Richard Assmann Observatory (RAO) of the Deutscher Wetterdienst in Lindenberg, Germany, between 1 June and 30 September 2015 (Bühl et al., 2015). Figure 2 shows a case study of the combined measurements at Lindenberg. During the project, an ultra-high-frequency (UHF) RWP was used to measure the vertical velocity of air (vair) in combination with measurements of Z, the mean Doppler velocity vD and spectral width w from a vertically pointing 35 GHz CR. The RWP was switching between vertically pointing and horizontal beam swinging every 30 min. This special observation mode of the RWP was necessary to acquire direct measurements of both horizontal and vertical air motions with only one RWP available. A PollyXT Raman lidar (Engelmann et al., 2016) pointing 5∘ off zenith was used for the measurement of the ice particle extinction coefficient (E) which is derived at a wavelength of 1064 nm (Baars et al., 2017). For the sake of completeness also a Stream Line XR Doppler lidar (Päschke et al., 2015) should be mentioned which was also observing vertical Doppler velocity vDL. However, its measurements are left out of the retrieval method because they (a) provide mainly redundant information to the cloud radar and (b) pose additional problems in the interpretation of optical signals due to specular reflection at the planar planes of horizontally oriented ice crystals.
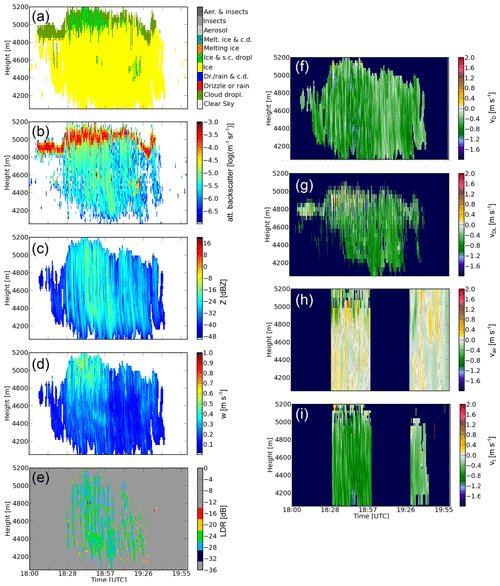
Figure 2(a) Cloudnet target classification, (b) attenuated backscatter from lidar at the 1064 nm wavelength, (c) CR reflectivity Z, (d) CR Doppler spectral width w, (e) CR linear depolarization ratio (LDR), (f) CR Doppler velocity vD, (g) Doppler lidar Doppler velocity vDL, (h) vertical air motions as measured with the RWP vair and (i) reflectivity-weighted terminal fall velocity vt are shown for a mixed-phase cloud layer observed on 11 June 2015 at Lindenberg. vt and vair are only available in 30 min intervals because vertical and horizontal wind measurement modes of the RWP alternate every 30 min.
A Cloudnet (Illingworth et al., 2007) dataset was derived from the lidar/CR/MWR measurements including the attenuation-corrected values of CR reflectivity used in this paper. The combined measurements of CR and RWP were used to derive a dataset of a particle ensemble mean vt with an error margin of about 0.1 m s−1 (Radenz et al., 2018). (It is worth noting here that in the context of this work we use “uncertainty” to describe retrieval and methodological uncertainties and “errors” for measurement errors.) This unique dataset is used here for the first time to test the retrieval method and give examples.
3.1 Measuring terminal fall velocity
The retrieval presented in this paper is based on measurements of radar reflectivity factor Z and terminal fall velocity vt with CR and RWP. Measuring Z and vt of ice particles in clouds is difficult because different factors influence the CR Doppler spectrum of ice particles.
-
Vertical air motions shift the Doppler spectrum in such a way that .
-
Turbulence and beam width effects broaden the Doppler spectrum (Shupe et al., 2008).
The shift induced by vertical air motions can be removed if the magnitude of the vertical air motion vair is known. In Radenz et al. (2018) a method is presented for measuring vt and vair with a combination of CR and RWP. The method of Radenz et al. (2018) combines Doppler spectra observed by both instruments in order to remove the influence of Rayleigh scattering on the otherwise Bragg-scattering-dominated RWP measurements, resulting in an undisturbed measurement of vertical air motions. The velocity scale of the CR Doppler spectrum is shifted by the measured vertical air motion in order to derive vt. In the context of this work, vt is of central importance for the retrieval of particle size. The proxy for particle size is the particle maximum diameter D (see Mitchell, 1996) which describes the diameter of a sphere just encircling the total ice crystal.
Mie scattering effects are neglected in the context of this work because we aim on studying pristine ice particles. Signal attenuation by these ice particles is also negligible. Turbulence and beam width broadening are also introducing artifacts. A strongly broadened CR Doppler spectrum might contain unphysical negative terminal fall velocities even after the correction of mean vertical air motion. Such effects cannot be removed easily, but luckily they only affect the width and not the mean velocity of the spectrum, which is shown in Sect. 3.2.
3.2 General principle of the retrieval method
In the present work, a method for deriving N and F of pristine ice particles from combined lidar, CR and RWP measurements is described. An analytical inversion of the measurement values of lidar, CR and RWP is not possible, so numerical inversion techniques have to be applied. For efficient and simple numerical implementation, a lookup table is used which contains the properties of the PSD and the observable measurement values Z, E, vt and CR spectral width w. In this section, the mathematical foundations and assumptions for creating this lookup table are explained.
The basic measurement values that are used in the retrieval are the first three moments (Z, vt and w), and they are derived from the CR Doppler spectra which are corrected for vertical air motion. If no RWP measurements are available, vt can be replaced by the ratio Z∕E, with E being the particle extinction coefficient measured by lidar. A retrieval is performed by trying to find a particle distribution that leads to the same variables as the measured ones. Figure 3 gives an example of this forward modeling approach. Two PSDs, characterized by different particle shapes of “side planes” and “column-like particles”, respectively, are defined in such a way that the simulated CR Doppler spectrum matches with the one measured. It is visible from this figure that different particle shapes can lead to very similar cloud radar spectra from significantly different PSDs. This is the case because the relationship between mass and terminal fall velocity are different for both particle populations side planes and column-like. For retrieving N and F, the simulation procedure is done first with a large variety of size distributions which are later compared to the measured values. A schematic overview of the retrieval method used here is given in Fig. 4.
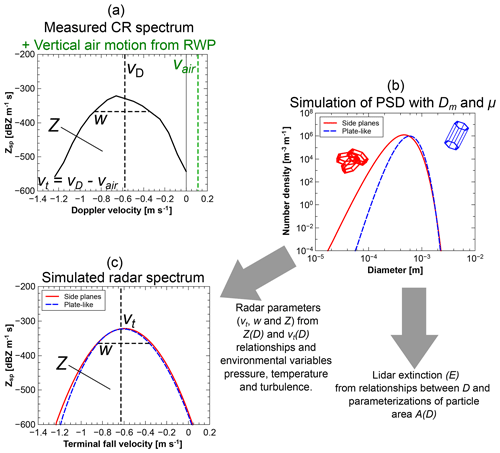
Figure 3Illustration of the general idea of the retrieval. (a) Example CR Doppler spectrum measured at 4500 m height with the CR at Lindenberg on 11 June 2015 at 19:00 UTC (see Fig. 2) with spectral radar reflectivity ( with Doppler spectrum grid length; Δv=0.08 m s−1) for the first three moments, , vt and w. (b) PSDs for two different particle populations. (c) Simulated Zsp from both PSDs with the same moments as the measured variables.
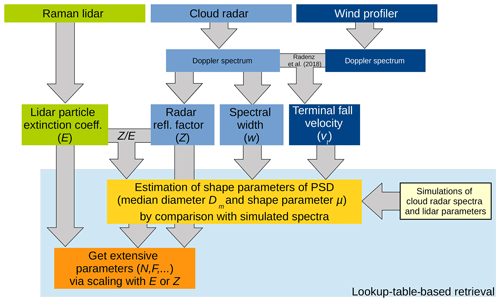
Figure 4Flowchart of the retrieval algorithm, illustrating the synthesis of data from the remote-sensing instruments with the simulated parameters.
Environmental factors affecting the shape of the CR Doppler spectra are taken into account during the computation of the lookup table. The signal strength of the CR is, e.g., affected by attenuation from water vapor and liquid water particles; air motion shifts the CR Doppler spectrum and turbulence broadens it. In the context of this work, water vapor attenuation is corrected with the method of Cloudnet (Illingworth et al., 2007). Particle attenuation is neglected since we concentrate on cloud layers, in which ice, liquid water and water vapor do not contribute significantly to cloud radar attenuation.
The modified gamma distribution from Delanoë et al. (2005) is assumed here, so we set for the PSD
with size parameter Dm (median particle maximum diameter), shape parameter μ (describing the tilt of the distribution) and normalization factor C and the total ice number concentration Ntotal. C is chosen in a way so that m−3. In the context of this work, this normalization is done numerically. In consequence, all following extensive quantities are derived for a particle number concentration of 1 particle m−3, indicated by the subscript “1”.
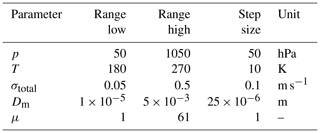
PSDs are simulated for all particle types mentioned in Table A2, and a variety of realistic combinations of the parameters pressure p, temperature T, CR spectral broadening σtotal, size parameter Dm and μ are also represented. The ranges and step sizes for all parameters used in this study are found in Table 1.
The extensive properties N and F and the measurement quantities Z and E are not used as an input parameter in the forward modeling because they all linearly depend on N. For the retrieval, only the shape (Dm and μ) of the distribution is of interest.
A CR Doppler spectrum of Z,
is simulated with K=0.174 (dielectric constant for ice at 35 GHz) for ice particles, and particle mass m(D) is obtained via Eq. (B1) (Hogan et al., 2006). Only pristine particles are considered in the context of this work, and all calculations are done for a CR with 35 GHz operation frequency (8.5 mm wavelength). Since the Mie parameter of these particles is usually smaller than 1, only Rayleigh scattering is considered in this context.
Accordingly, the extensive variables normalized to 1 particle m−3 are a normalized number flux,
a normalized radar reflectivity factor,
and a normalized particle extinction coefficient,
with particle area A(D) obtained from Eq. (B2).
From the two latter equations, the reflectivity-to-extinction ratio is defined.
For means of completeness, the mean terminal fall velocity measured with a Doppler lidar is given as
The latter formula assumes that the backscatter from all crystals is only proportional to their projected area. This requires all crystals to be either randomly oriented or aligned perpendicular to flow direction. Since this would complicate the discussion of the proof-of-concept approach presented here, we stick to cloud radar measurements of vt. However, redundancy in observations of retrieved parameters increases the robustness of the methodology and quality of the analysis' products.
Simulation of microphysical parameters is only done over the ranges in which the particle properties are valid, which are given in Table A1. The normalized number concentration
is computed in order to ensure that the PSD is well represented within the limits of D. The deviation of N1 from 1 indicates how many particles are not considered due to the limited range of D. In the context of this work, we discard all calculations in which N1<0.95, meaning that at maximum 5 % of the particles at the upper and/or lower boundary may be not included.
As mentioned before, a proxy for particle size is the most crucial intensive parameter for the retrieval of N. In the present work we exploit measurements of vt in order to come up with an estimation of the median diameter Dm of the gamma-μ distribution. Hence, in this section and in Appendix B, the relationship between Dm and vt is discussed. Mitchell (1996), Heymsfield and Westbrook (2010), and Khvorostyanov and Curry (2014) present an analytic theory for the calculation of vt of particles on the basis of four fractal parameters, describing mass and area of the particles dependent on their maximum diameter D (minimum enclosing circle for ice crystals, particle diameter for droplets). The resulting formula is
with Av and Bv also being functions of D dependent on the properties of the air surrounding the falling ice crystal. The detailed derivation of the formula is described in Appendix B. Flow tunnel experiments, e.g., by Fukuta and Takahashi (1999), have produced the parameterizations of particle shapes needed for the derivation of Av and Bv. Tables A1 and A2 summarize these parameterizations for deriving mass m(D) and area (A(D)) from the maximum particle diameter (D). The detailed derivation of the latter as well as of v(D), which is used in the following, is given in Appendix B.
A CR Doppler spectrum is computed on the terminal-velocity grid by computing v(D) and inverting numerically to D(v). The resulting spectrum Z(v(D)) is artificially broadened by numerical folding with the normalized Gaussian distribution term
with the standard deviation σtotal, which introduces the combined effects of turbulence and beam width broadening. From this broadened spectrum vt (first moment) and spectral width w (second central moment) are derived.
Such spectra are computed for a variety of input parameters (p, T, σtotal, Dm and μ), and for each combination of input variables, the input and output parameters are collected in three vectors:
-
holding the input properties that were used in the calculations,
-
holding the intensive properties of the distribution and
-
containing the normalized extensive properties of the distribution,
with the subscript L indicating that these vectors are members of the lookup table. This lookup table, containing the three vectors i, p and n, is computed for a set of input variables of p, T, σtotal, D and μ.
3.3 Using terminal fall velocity for deriving maximum particle diameter
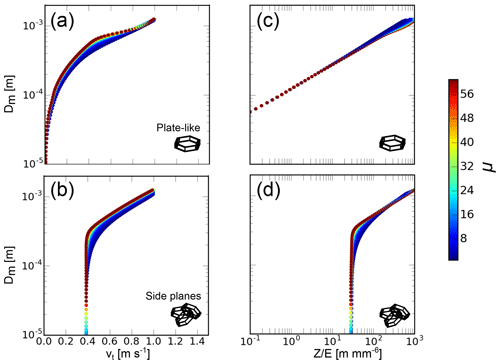
The basis for the retrieval of N is an estimation of Dm. In this section, two relationships – vt(D) and Z∕E(D) – are compared for exemplary particle types and varying properties of the underlying PSD. vt and Z∕E can both be used to derive Dm because both are steady and differentiable with Dm. It can be seen from Fig. 5 that vt and Z∕E show a very similar dependence on Dm, which is not surprising since both are proportional to m and reciprocal to A. For the purpose of deriving the size and shape properties of a PSD, both quantities are interchangeable, and a direct measurement of vt can replace a missing Z∕E. More importantly, both vt and Z∕E only depend weakly on shape parameter μ of the PSD and the resulting width w of the CR Doppler spectrum.
3.4 Retrieving a result from the lookup table
For retrieving N, an estimation of the PSD must be acquired first. This is done by comparison of measured parameters with those stored in the lookup table. An overview about the retrieval process is given in Fig. 6. Depending on which parameter is available, this procedure can be done with all combinations of available intensive parameters (currently vt, w and Z∕E). Examples are given in Sect. 4.
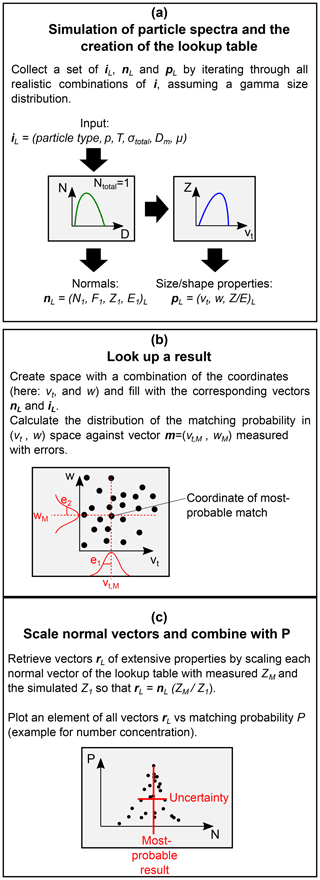
Figure 6Step-by-step description of the retrieval principle. (a) A lookup table with parameters observable with lidar and radar is created with a set of combinations of particle shape, p, T, σtotal, Dm and μ. (b) The matching probability between the measured parameters and the simulated parameters is searched in the lookup table, resulting in estimations of Dm and μ. (c) The PSD created with the retrieved estimations of Dm and μ is scaled with extensive parameters measured with lidar or CR (E or Z, respectively). The full width half maximum of the distribution of matching probabilities is considered the uncertainty of the retrieved results. More explanation is given in the text.
a. Retrieval and uncertainties estimation. A vector with the measured intensive properties m is matched with the entries in the lookup table in order to derive Dm and μ of the particle distribution. The vector m can be composed of any combination of p, T, σtotal, vt, w and Z∕E, but in the context of this work, only vt, w and Z∕E are used as variational parameters for the retrieval. The matching probability of m to its corresponding values in the lookup table is described by
with pL being the simulated properties from the lookup table, i being the index running over the length of pL, m containing the corresponding actual measurement values and vector e being the uncertainties assuming a Gaussian error distribution. P is applied to all lines of the lookup table, and the matching probability for each single entry is found. As a result a distribution of matching probabilities is derived. At the position of the maximum of all values of P, the parameters of the size distribution are retrieved because they represent the best match for the input parameters. The full width half maximum of P for each derived value is used to represent the uncertainty of the retrieval. Upper and lower uncertainty may differ if the distribution of P is not symmetrical around its maximum. A larger uncertainty in one of the measured variables may lead to a broader distribution P for the retrieved variables (see Fig. 6).
b. Scaling. With the shape of the size distribution known, the normalized extensive parameters N1, F1, Z1 and E1 are also known. A vector r holding the results of extensive properties (N, F, Z and/or E) is derived by multiplying all of them with the same scaling factor S, which can be either or . Scaling adds the measurement uncertainty of Z (CR) or E (lidar).
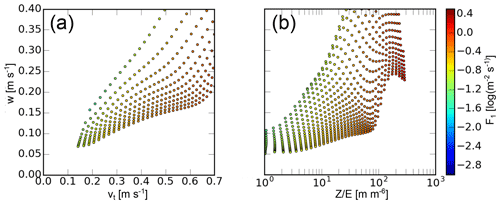
c. Example. As an example, a diagram relating F1 with the intensive properties vt and w is shown in Fig. 7. The distribution of results in (vt,w) space is shown. From this distribution the most probable solution (here F1) is selected for measurements of vt and w. Multiplication of the selected extensive parameter with the corresponding factor Z∕Z1 yields the scaling factor to derive the actual F and N. The method is here applied in a two-dimensional example, but both extensive and intensive parameters can be of an arbitrary number.
3.5 Estimation of cross-sensitivity of uncertainties
For estimating the uncertainties introduced by a measurement value on the retrieved quantities, the retrieval is performed for a fixed set of input parameters, and afterwards each single parameter is varied by 1 standard deviation. The errors are an estimation of the maximum measurement accuracy that can be achieved currently. Table 2 gives a comparison of the errors derived for vt and Z∕E.
Table 2Ratios between the results of the original and the disturbed retrieval. The row labeled mean gives the original input parameters, and the row labeled error is the range that has been used for variation.


The measurement errors of the parameters p, T and σtotal were chosen quite large, and, anyway, they do not introduce significant errors. It can be seen from this table that for a relatively low vt of 0.3 m s−1, an error of 0.1 m s−1 in vt results in a factor of 3.0 uncertainty for Z1 and 0.5 for E1. These results are significantly different for a larger vt of 0.9 m s−1 which produces uncertainties of 0.5 and 0.2 for Z1 and E1, respectively. The relatively large uncertainty of 70 % in Z∕E yields comparable lower uncertainty factors (0.4 for Z1 and 0.2 for E1). The relative errors derived for N and F are nearly identical because they are both derived from the same retrieved PSD. The question of whether the PSD is scaled via E (error of ±40 %) or Z (error of ±2 dB) makes a large difference for the retrieval uncertainties N and F. However, one has to keep in mind that the actual cause for the uncertainties N and F are the uncertainties in the underlying PSD.
In this analysis, only methodological errors and random measurement errors have been assumed. Also the influence of uncertainties in the calculation of fall speeds and choice of particles are left out of the estimation of uncertainties here. The assessment of their influences is actually not straightforward. Heymsfield and Westbrook (2010) found out that the method of Mitchell (1996) performs especially well for pristine ice crystals with observed differences in a terminal fall velocity of 20 % at its maximum. For rimed ice crystals the error tends to increase significantly. Since conditions under which rimed particles occur are left out of this study, this can be ruled out as a major source of error. Also, the introduction of an additional exponent in the calculation of the Best number (as proposed by Heymsfield and Westbrook, 2010) does not change the results significantly. Uncertainties from the choice of particle type are also difficult to quantify. As long as the particles with a similar aspect ratio are chosen, the differences in the retrieved N are around 50 %. As soon as a completely wrong type is chosen, e.g., columns instead of dendrites, the difference can be arbitrary because often only a very exotic solution or just no solution is found.
Figure 2 shows an altocumulus cloud observed during the COLRAWI-2 campaign at Lindenberg on 11 June 2015. The observed cloud top temperature (CTT) is −10 ∘C. The measured CR LDR (linear depolarization ratio) let us conclude that the ice particles present are most probably isometric ice crystals (Myagkov et al., 2016). Accordingly, the particle type “plate-like” is chosen for retrieving the microphysical parameters. Technically it would be possible to set particle type also as a retrieved parameter. However, the only measured parameter directly sensitive to particle shape would be cloud radar LDR, which is difficult to forward model and only rarely measured throughout the cloud case due to limitations in instrumental sensitivity. To avoid ambiguous results, we analyze the particle type manually and set it fixed for the whole cloud case. Otherwise the retrieved results would alternate between different particle types, introducing additional complications into the analysis.
The retrieval is done with three forms of the measurement vector which is used for the retrieval.
In the first mode, Z is the scaling variable and with a fixed error vector . In this mode, only RWP and CR are used. vt is measured with the method of Radenz et al. (2018), and attenuation-corrected CR measurements of Z and w are also used for the retrieval. p and T are acquired from the European Center for Medium-Range Weather Forecast Integrated Forecast (ECMWF IFS) dataset. Figure 8a shows the result of the lookup-table-based retrieval with the measurement vector and Z as the scaling variable. The retrieval shows plausible results for D, μ, N and F with about half an order of magnitude uncertainty, which is relatively constant all over the case. The large uncertainty results from a very broad probability distribution due to a stronger change at low values of vt(Dm) for this particle type (see Fig. 5) at low fall velocities.
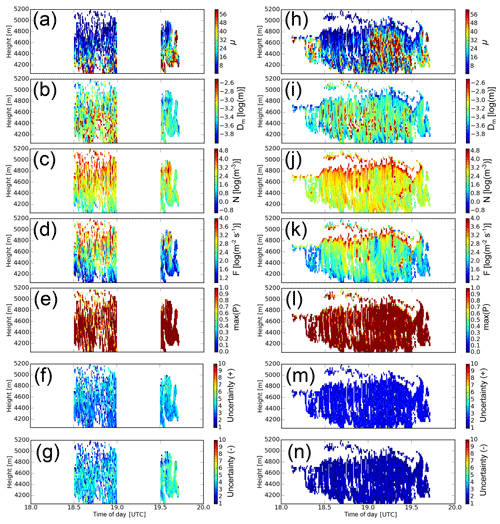
Figure 8Results of the retrieval based on vt and w (left column) and Z∕E and w (right column) for the particle type plate-like. Combined CR/RWP measurements are only available in the second half of each hour. Different retrieved parameters are shown: (a, h) spectral width parameter μ, (b, i) median diameter Dm, (c, j) number concentration N and (d, k) particle number flux F. Maximum probability of P for each retrieval (e, l) is shown together with the upper (f, m) and lower (g, n) uncertainty factors for the retrieved parameters.
In the second mode, all parameters are the same, except that and with relative errors ΔZ=0.2 and ΔE=0.1. Extinction is derived by multiplication of the lidar backscatter β with a lidar ratio of 32 sr−1 which is typical for ice crystals (Haarig et al., 2016), using the Klett–Fernald approach (Seifert et al., 2007). In the latter case, only lidar and cloud radar are used for retrieval. Figure 8b shows the results of this run.
A third mode with is presented in Fig. 9. Again, all other setting and parameters are the same. In this mode, a lot of pixels do not show a solution. Yet, for those where a solution is found, the magnitude of the results derived with this combined measurement vector are essentially the same as with the measurement vectors (vt,w) and . This is plausible because in the first two modes, noise from random variations in Z, E and vt cannot be identified. The combined mode, taking into account all three measurement values, leads to a selection of only those results where the retrievals based on Z∕E and vt fit together.
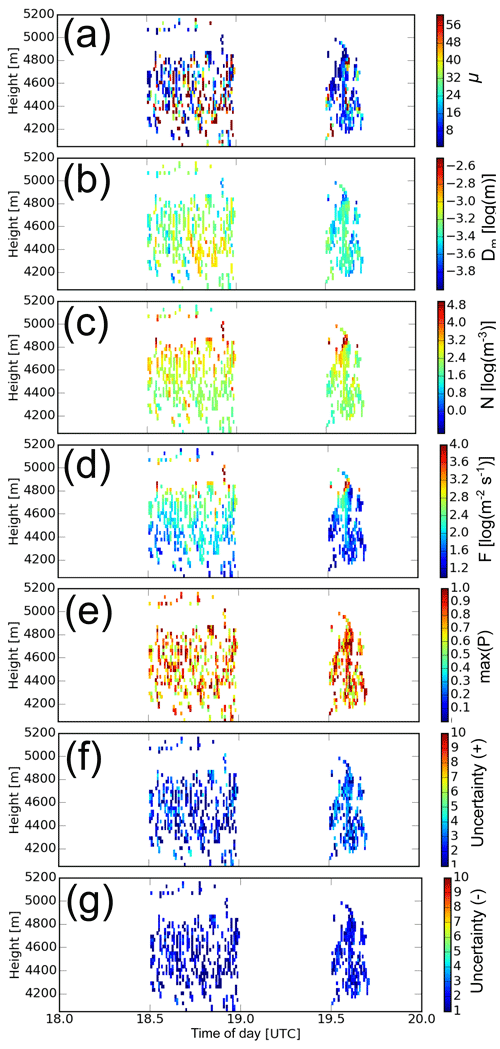
Figure 9The same as Fig. 8 but with the combined approach taking into account Z∕E, vt and w.
In all three modes, uncertainties are derived from the distribution of P just as indicated in Fig. 6. As a means of quality control, values are only taken into account if P>0.9 meaning that the retrieval is within the limits and a realistic solution is found. Representative uncertainties of N and F are listed in Table 3 and a factor of 4 is used for the first mode; about a factor of 2 is used for the second; and below a factor of 2 is used for the third mode. Histograms of the retrieved N and F values for all modes are given in Fig. 10.
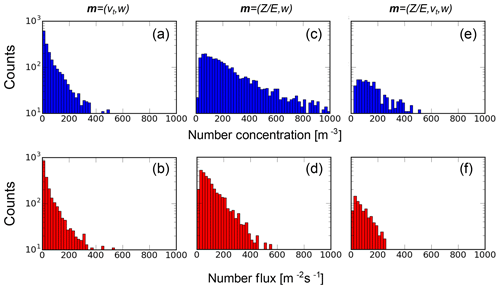
Figure 10The distribution of retrieved results for N and F with the first (a, b), second (c, d) and third retrieval modes (e, f). The corresponding measurement vector m for each retrieval mode is indicated in the top row.
Averaged and median results for N and F for all four combinations of particle types and retrieval methods are also given in Table 3 for the height of 4500 m. At this single height, particle properties can be assumed constant in order to avoid additional stray of the retrieval caused by natural variations. It is obvious that a low number of large outliers influence the average, so the median is better suited for a comparison of the results in this context showing mostly the intrinsic errors of the method. Based on the uncertainties of the individual retrieval results shown in Table 3, the results agree within 1 standard deviation of uncertainty. The histograms of N and F show the best agreement between the second (CR/lidar) and third run mode (CR/lidar/RWP). The first mode (CR/RWP) seems to have a cutoff at N=400 m−3 and seems to tend more toward lower number concentrations. A small bias (δvt≈0.05 m s−1) could lead to such a tendency enforcing larger particles and, hence, smaller number concentrations. A positive bias in cloud radar, in turn, would result in values that are too large in the second run mode.
A method has been demonstrated to retrieve the size and shape parameters of PSDs from a combination of E, Z, w and/or vt. All combinations of the measured parameters have been tested and are found to produce results within the same order of magnitude. Uncertainties of the retrieval based on vt are found to be larger than for the estimation based on Z∕E. The smallest uncertainties are found if all measurement values (E, Z, w and vt) are taken into account; however, this is at the cost of a lower number of retrieved results. The largest retrieval uncertainties occur at smaller vt values for which the change of D with vt is especially strong.
The method has its limitations only in the signal thresholds of the instruments (CR, lidar and/or RWP) and the a priori knowledge about the shape of the observed particles. In the current study, the CR has a signal threshold of about −55 dBZ at a height of 5 km (Görsdorf et al., 2015); the PollyXT lidar can make useful measurements of cloud particle extinction down to about 50 Mm−1 (Bühl et al., 2013). The RWP is able to derive direct measurements of vertical velocity up to 6 km (Radenz et al., 2018). Since the latter limitation is due to Bragg scattering it is essentially independent of the other instruments' signal thresholds. Hence, given a detection of vertical velocity by the RWP, the method presented here can be used to measure N down to about 10–100 particle m−3 (assuming a median diameter of about 800 µm) at a range of 5 km based on the sensitivity of the cloud radar. Such particle concentrations are usually too small to be detected by lidar; hence, the method presented here has an advantage over existing methods combining only lidar and radar.
The paper presents a first step towards the usage of the unique direct measurements of vt of pristine ice particles for the retrieval of their size, shape and number concentration. The forward modeling method used here for derivation of the observable measurement parameters is simple, but any other methods for CR forward modeling (Kollias et al., 2011) may be applicable for the computation of the lookup table. The present work also shows that it might be beneficial to use vt derived from combined CR/RWP measurements in other forward-iterating models like those of Ceccaldi et al. (2013) and Cazenave et al. (2019).
The presented method is essentially applicable to all remote-sensing facilities that provide a lidar particle extinction coefficient and CR (e.g., from the European Aerosols, Clouds and Trace Gases Infrastructure or the US program for Atmospheric Radiation Measurement). Combinations of lidar and radar prove most robust in terms of retrieval uncertainties. However, an error of less than 0.1 m s−1 also allows for keeping methodological uncertainties for a retrieval of N and F in the range between a factor of 0.5 and 3, which brings the method to the edge of applicability. The method is crucial for the investigation of nucleation and the growth of ice particles in optically thick clouds for which no other method can provide accurate estimations of N and F.
The forward model used here is transparent and instructive, but other forward-iteration methods might be used in the future as well. In the context of this work, the lookup table approach is used primarily for an analysis of retrieval uncertainties due to input measurement errors. Typing of the pristine particles on the basis of radar depolarization measurements is crucial for the methodology presented here. It is currently a field of intensive research (Bühl et al., 2016; Myagkov et al., 2016) and is, hence, left out of this work. The same applies to the accurate calibration of the CR which is a necessary prerequisite for the technique presented here (Ewald et al., 2017), but it is also not covered in the present work.
Several issues need a solution for successful application of the method in future.
-
Automatic particle typing must be improved. Recently developed methods employing scanning techniques (Myagkov et al., 2016) are more sophisticated and especially show better performance under low-signal conditions. Those techniques were not yet available during the COLRAWI-2 campaign, but they pose great opportunities for future application in the context of the present work.
-
Uncertainties in CR calibration have not been taken into account here because those errors are essentially unknown. However, great effort is being made to come up with a solution for this problem.
-
Matching between the CR and lidar beam has to be improved in order to avoid artifacts under complex situations.
-
Direct information about local turbulence has to be taken into account to avoid errors in the estimation of the shape parameter μ.
Given the downside of less flexibility, there are distinct advantages to the lookup table approach over classic forward-iteration methods; e.g., all possible results within the uncertainty range of the input variables are found at once. There is no risk that the method gets stuck in a local minimum. A lookup table approach also has the distinct advantage that numerical forward modeling and the actual retrieval are fully separable. Challenges to the approach are the extensive memory needs and the need for more effort in the evaluation of the results. The method is transparent, and it can be implemented easily in a numerically very efficient way. The computation of a case study as shown, e.g., in Fig. 8, takes less than a second on a state-of-the-art desktop computer including the estimation of retrieval uncertainties.
The cloud radar data used in this work are available via the database of the Aerosol, Clouds and Trace Gases Research Infrastructure (ACTRIS) at https://actris.nilu.no (last access: 23 November 2019). Data from the PollyXT lidar and radar wind profiler are available from the authors.
Table A1 gives the parameterizations of m and A for different particle types according to Mitchell (1996). All values are given in the CGS (centimeter–gram–second) notation system. Conversion to the SI system is done with the formula
Table A1Values for α, β, γ and σ as well as their valid ranges (Dmin…Dmax in µm) used in the context of this work.
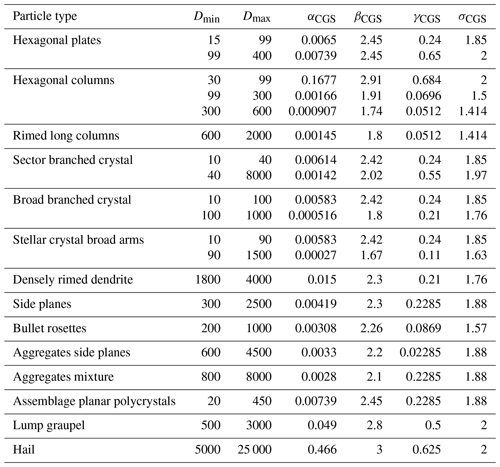
The lookup table used in this paper is computed of all particle types with a single parameterization from Table A1. Additional particle shapes are defined in Table A2 that include a transition to aggregate particle types at the upper limit of D.
This appendix gives a detailed description for the actual calculation of vt of particles with known parameterizations of particle mass m and area A. It is mentioned here for the sake of completeness. We follow here the method described in Khvorostyanov and Curry (2014).
g=9.81 m s2
The density of the air,
with Rair=287.058 J kg−1 K−1 and kinematic viscosity,
with kg m−1 s−1 are used to derive the Best number,
The two constants
with are defined. The different constants that apply for different particle types are defined in Table B1. The Reynolds number,
is derived and two additional functions are defined,
With these results, vt can be expressed as a closed function of D.
JB initiated the COLRAWI measurements, conceived the retrieval method and wrote the paper. PS and MR contributed methods for data evaluation and interpretation. HB evaluated the Raman lidar data. AA supervised the work and supported the preparation of the paper.
The authors declare that they have no conflict of interest.
This article is part of the special issue “BACCHUS – Impact of Biogenic versus Anthropogenic emissions on Clouds and Climate: towards a Holistic UnderStanding (ACP/AMT/GMD inter-journal SI)”. It is not associated with a conference.
We thank Volker Lehmann, Ulrich Görsdorf and Ronny Leinweber of MOL/RAO Lindenberg for their cooperation and for performing the measurements with RWP, CR and DL. The PollyXT used in this study is under the supervision of Ina Mattis (DWD).
This research has been supported by the Deutsche Forschungsgemeinschaft (grant no. 398285025), the European Union's Framework Programme for Research and Innovation, Horizon 2020 (ACTRIS-2 (grant no. 654109)), the former European Commission Seventh Framework Programme FP7/2007–2013 (ACTRIS (grant no. 262254); BACCHUS (grant no. 603445)) and the European Union (Cloudnet (project no. EVK2-2000-00611)).
The publication of this article was funded by the
Open Access Fund of the Leibniz Association.
This paper was edited by Johannes Schneider and reviewed by two anonymous referees.
Ansmann, A., Mamouri, R.-E., Bühl, J., Seifert, P., Engelmann, R., Hofer, J., Nisantzi, A., Atkinson, J. D., Kanji, Z. A., Sierau, B., Vrekoussis, M., and Sciare, J.: Ice-nucleating particle versus ice crystal number concentration in altocumulus and cirrus layers embedded in Saharan dust: a closure study, Atmos. Chem. Phys., 19, 15087–15101, https://doi.org/10.5194/acp-19-15087-2019, 2019. a
Baars, H., Seifert, P., Engelmann, R., and Wandinger, U.: Target categorization of aerosol and clouds by continuous multiwavelength-polarization lidar measurements, Atmos. Meas. Tech., 10, 3175–3201, https://doi.org/10.5194/amt-10-3175-2017, 2017. a
Battaglia, A., Westbrook, C. D., Kneifel, S., Kollias, P., Humpage, N., Löhnert, U., Tyynelä, J., and Petty, G. W.: G band atmospheric radars: new frontiers in cloud physics, Atmos. Meas. Tech., 7, 1527–1546, https://doi.org/10.5194/amt-7-1527-2014, 2014. a, b
Böhm, H. P.: A General Equation for the Terminal Fall Speed of Solid Hydrometeors, J. Atmos. Sci., 46, 2419–2427, https://doi.org/10.1175/1520-0469(1989)046<2419:AGEFTT>2.0.CO;2, 1989. a
Böhm, J. P.: A general hydrodynamic theory for mixed-phase microphysics. Part I: drag and fall speed of hydrometeors, Atmos. Res., 27, 253–274, https://doi.org/10.1016/0169-8095(92)90035-9, 1992. a
Bühl, J., Ansmann, A., Seifert, P., Baars, H., and Engelmann, R.: Towards a quantitative characterization of heterogeneous ice formation with lidar/radar: Comparison of CALIPSO/CloudSat with ground-based observations, Geophys. Res. Lett., 40, 4404–4408, https://doi.org/10.1002/grl.50792, 2013. a
Bühl, J., Leinweber, R., Görsdorf, U., Radenz, M., Ansmann, A., and Lehmann, V.: Combined vertical-velocity observations with Doppler lidar, cloud radar and wind profiler, Atmos. Meas. Tech., 8, 3527–3536, https://doi.org/10.5194/amt-8-3527-2015, 2015. a, b
Bühl, J., Seifert, P., Myagkov, A., and Ansmann, A.: Measuring ice- and liquid-water properties in mixed-phase cloud layers at the Leipzig Cloudnet station, Atmos. Chem. Phys., 16, 10609–10620, https://doi.org/10.5194/acp-16-10609-2016, 2016. a, b
Cazenave, Q., Ceccaldi, M., Delanoë, J., Pelon, J., Groß, S., and Heymsfield, A.: Evolution of DARDAR-CLOUD ice cloud retrievals: new parameters and impacts on the retrieved microphysical properties, Atmos. Meas. Tech., 12, 2819–2835, https://doi.org/10.5194/amt-12-2819-2019, 2019. a, b
Ceccaldi, M., Delanoë, J., Hogan, R. J., Pounder, N. L., Protat, A., and Pelon, J.: From CloudSat-CALIPSO to EarthCare: Evolution of the DARDAR cloud classification and its comparison to airborne radar-lidar observations, J. Geophys. Res.-Atmos., 118, 7962–7981, https://doi.org/10.1002/jgrd.50579, 2013. a
Delanoë, J. and Hogan, R. J.: Combined CloudSat-CALIPSO-MODIS retrievals of the properties of ice clouds, J. Geophys. Res., 115, D00H29, https://doi.org/10.1029/2009JD012346, 2010. a
Delanoë, J., Protat, A., Testud, J., Bouniol, D., Heymsfield, A. J., Bansemer, A., Brown, P. R. A., and Forbes, R. M.: Statistical properties of the normalized ice particle size distribution, J. Geophys. Res., 110, D10201, https://doi.org/10.1029/2004JD005405, 2005. a, b
Eidhammer, T., DeMott, P. J., Prenni, A. J., Petters, M. D., Twohy, C. H., Rogers, D. C., Stith, J., Heymsfield, A., Wang, Z., Pratt, K. A., Prather, K. A., Murphy, S. M., Seinfeld, J. H., Subramanian, R., and Kreidenweis, S. M.: Ice Initiation by Aerosol Particles: Measured and Predicted Ice Nuclei Concentrations versus Measured Ice Crystal Concentrations in an Orographic Wave Cloud, J. Atmos. Sci., 67, 2417–2436, https://doi.org/10.1175/2010JAS3266.1, 2010. a
Engelmann, R., Kanitz, T., Baars, H., Heese, B., Althausen, D., Skupin, A., Wandinger, U., Komppula, M., Stachlewska, I. S., Amiridis, V., Marinou, E., Mattis, I., Linné, H., and Ansmann, A.: The automated multiwavelength Raman polarization and water-vapor lidar PollyXT: the neXT generation, Atmos. Meas. Tech., 9, 1767–1784, https://doi.org/10.5194/amt-9-1767-2016, 2016. a
Ewald, F., Gross, S., Hagen, M., Hirsch, L., and Delanoë, J.: Calibration of a 35-GHz Airborne Cloud Radar: Lessons Learned and Intercomparison with a 94-GHz Airborne Cloud Radar, in: EGU General Assembly Conference Abstracts, EGU General Assembly Conference Abstracts, 19, p. 14871, 2017. a
Fukuta, N. and Takahashi, T.: The Growth of Atmospheric Ice Crystals: A Summary of Findings in Vertical Supercooled Cloud Tunnel Studies, J. Atmos. Sci., 56, 1963–1979, https://doi.org/10.1175/1520-0469(1999)056<1963:TGOAIC>2.0.CO;2, 1999. a, b
Görsdorf, U., Lehmann, V., Bauer-Pfundstein, M., Peters, G., Vavriv, D., Vinogradov, V., and Volkov, V.: A 35-GHz Polarimetric Doppler Radar for Long-Term Observations of Cloud Parameters–Description of System and Data Processing, J. Atmos. Ocean. Tech., 32, 675–690, https://doi.org/10.1175/JTECH-D-14-00066.1, 2015. a, b
Haarig, M., Engelmann, R., Ansmann, A., Veselovskii, I., Whiteman, D. N., and Althausen, D.: 1064 nm rotational Raman lidar for particle extinction and lidar-ratio profiling: cirrus case study, Atmos. Meas. Tech., 9, 4269–4278, https://doi.org/10.5194/amt-9-4269-2016, 2016. a
Heymsfield, A. J. and Westbrook, C. D.: Advances in the estimation of ice particle fall speeds using laboratory and field measurements, J. Atmos. Sci., 67, 2469–2482, 2010. a, b, c
Hogan, R. J., Mittermaier, M. P., and Illingworth, A. J.: The retrieval of ice water content from radar reflectivity factor and temperature and its use in evaluating a mesoscale model, J. Appl. Meteorol. Clim., 45, 301–317, https://doi.org/10.1175/2010JAS3379.1, 2006. a
Illingworth, A. J., Hogan, R. J., O'Connor, E. J., Bouniol, D., Delanoë, J., Pelon, J., Protat, A., Brooks, M. E., Gaussiat, N., Wilson, D. R., Donovan, D. P., Baltink, H. K., van Zadelhoff, G.-J., Eastment, J. D., Goddard, J. W. F., Wrench, C. L., Haeffelin, M., Krasnov, O. A., Russchenberg, H. W. J., Piriou, J.-M., Vinit, F., Seifert, A., Tompkins, A. M., and Willén, U.: Cloudnet, B. Am. Meteorol., Soc., 88, 883–898, https://doi.org/10.1175/BAMS-88-6-883, 2007. a, b
Khvorostyanov, V. I. and Curry, J. A.: Thermodynamics, kinetics, and microphysics of clouds, Cambridge University Press, 2014. a, b
Kneifel, S., Kulie, M., and Bennartz, R.: A triple-frequency approach to retrieve microphysical snowfall parameters, J. Geophys. Res., 116, D11203, https://doi.org/10.1029/2010JD015430, 2011. a
Kollias, P., Rémillard, J., Luke, E., and Szyrmer, W.: Cloud radar Doppler spectra in drizzling stratiform clouds: 1. Forward modeling and remote sensing applications, J. Geophys. Res., 116, D13201, https://doi.org/10.1029/2010JD015237, 2011. a
Korolev, A., McFarquhar, G., Field, P. R., Franklin, C., Lawson, P., Wang, Z., Williams, E., Abel, S. J., Axisa, D., Borrmann, S., Crosier, J., Fugal, J., Krämer, M., Lohmann, U., Schlenczek, O., Schnaiter, M., and Wendisch, M.: Mixed-Phase Clouds: Progress and Challenges, Meteor. Mon., 58, 5.1–5.50, https://doi.org/10.1175/AMSMONOGRAPHS-D-17-0001.1, 2017. a
Lehmann, V. and Teschke, G.: Wavelet based methods for improved wind profiler signal processing, Ann. Geophys., 19, 825–836, https://doi.org/10.5194/angeo-19-825-2001, 2001. a
Mitchell, D. L.: Use of mass- and area-dimensional power laws for determining precipitation particle terminal velocities, J. Atmos. Sci., 53, 1710–1723, https://doi.org/10.1175/1520-0469(1996)053<1710:UOMAAD>2.0.CO;2, 1996. a, b, c, d
Mitchell, D. L., Garnier, A., Pelon, J., and Erfani, E.: CALIPSO (IIR-CALIOP) retrievals of cirrus cloud ice-particle concentrations, Atmos. Chem. Phys., 18, 17325–17354, https://doi.org/10.5194/acp-18-17325-2018, 2018. a
Mülmenstädt, J., Sourdeval, O., Delanoë, J., and Quaas, J.: Frequency of occurrence of rain from liquid-, mixed-, and ice-phase clouds derived from A-Train satellite retrievals, Geophys. Res. Lett., 42, 6502–6509, https://doi.org/10.1002/2015GL064604, 2015. a
Myagkov, A., Seifert, P., Wandinger, U., Bühl, J., and Engelmann, R.: Relationship between temperature and apparent shape of pristine ice crystals derived from polarimetric cloud radar observations during the ACCEPT campaign, Atmos. Meas. Tech., 9, 3739–3754, https://doi.org/10.5194/amt-9-3739-2016, 2016. a, b, c
Päschke, E., Leinweber, R., and Lehmann, V.: An assessment of the performance of a 1.5 µm Doppler lidar for operational vertical wind profiling based on a 1-year trial, Atmos. Meas. Tech., 8, 2251–2266, https://doi.org/10.5194/amt-8-2251-2015, 2015. a
Radenz, M., Bühl, J., Lehmann, V., Görsdorf, U., and Leinweber, R.: Combining cloud radar and radar wind profiler for a value added estimate of vertical air motion and particle terminal velocity within clouds, Atmos. Meas. Tech., 11, 5925–5940, https://doi.org/10.5194/amt-11-5925-2018, 2018. a, b, c, d, e, f
Seifert, P., Ansmann, A., Müller, D., Wandinger, U., Althausen, D., Heymsfield, A. J., Massie, S. T., and Schmitt, C.: Cirrus optical properties observed with lidar, radiosonde, and satellite over the tropical Indian Ocean during the aerosol-polluted northeast and clean maritime southwest monsoon, J. Geophys. Res., 112, D17205, https://doi.org/10.1029/2006JD008352, 2007. a
Sekelsky, S. M., Ecklund, W. L., Firda, J. M., Gage, K. S., and McIntosh, R. E.: Particle Size Estimation in Ice-Phase Clouds Using Multifrequency Radar Reflectivity Measurements at 95, 33, and 2.8 GHz, J. Appl. Meteorol., 38, 5–28, https://doi.org/10.1175/1520-0450(1999)038<0005:PSEIIP>2.0.CO;2, 1999. a
Shupe, M. D., Kollias, P., Poellot, M., and Eloranta, E.: On deriving vertical air motions from cloud radar Doppler spectra, J. Atmos. Ocean. Tech., 25, 547–557, 2008. a
Simmel, M., Bühl, J., Ansmann, A., and Tegen, I.: Ice phase in altocumulus clouds over Leipzig: remote sensing observations and detailed modeling, Atmos. Chem. Phys., 15, 10453–10470, https://doi.org/10.5194/acp-15-10453-2015, 2015. a
Sourdeval, O., Gryspeerdt, E., Krämer, M., Goren, T., Delanoë, J., Afchine, A., Hemmer, F., and Quaas, J.: Ice crystal number concentration estimates from lidar-radar satellite remote sensing – Part 1: Method and evaluation, Atmos. Chem. Phys., 18, 14327–14350, https://doi.org/10.5194/acp-18-14327-2018, 2018. a
Steinhagen, H., Dibbern, J., Engelbart, D., Görsdorf, U., Lehmann, V., Neisser, J., and Neuschaefer, J. W.: Performance of the first European 482 MHz Wind Profiler Radar with RASS under operational conditions, Meteorol. Z., 7, 248–261, https://doi.org/10.1127/metz/7/1998/248, 1998. a
Sullivan, S. C., Hoose, C., and Nenes, A.: Investigating the contribution of secondary ice production to in-cloud ice crystal numbers, J. Geophys. Res.-Atmos., 122, 9391–9412, https://doi.org/10.1002/2017JD026546, 2017. a
Sun, Z. and Shine, K. P.: Studies of the radiative properties of ice and mixed-phase clouds, Q. J. Roy. Meteor. Soc., 120, 111–137, https://doi.org/10.1002/qj.49712051508, 1994. a
Voigt, C., Schumann, U., Minikin, A., Abdelmonem, A., Afchine, A., Borrmann, S., Boettcher, M., Buchholz, B., Bugliaro, L., Costa, A., Curtius, J., Dollner, M., Dörnbrack, A., Dreiling, V., Ebert, V., Ehrlich, A., Fix, A., Forster, L., Frank, F., Fütterer, D., Giez, A., Graf, K., Grooß, J.-U., Groß, S., Heimerl, K., Heinold, B., Häneke, T., Järvinen, E., Jurkat, T., Kaufmann, S., Kenntner, M., Klingebiel, M., Klimach, T., Kohl, R., Krämer, M., Krisna, T. C., Luebke, A., Mayer, B., Mertes, S., Molleker, S., Petzold, A., Pfeilsticker, K., Port, M., Rapp, M., Reutter, P., Rolf, C., Rose, D., Sauer, D., Schäfler, A., Schlage, R., Schnaiter, M., Schneider, J., Spelten, N., Spichtinger, P., Stock, P., Walser, A., Weigel, R., Weinzierl, B., Wendisch, M., Werner, F., Wernli, H., Wirth, M., Zahn, A., Ziereis, H., and Zäger, M.: ML-CIRRUS: The Airborne Experiment on Natural Cirrus and Contrail Cirrus with the High-Altitude Long-Range Research Aircraft HALO, B. Am. Meteorol. Soc., 98, 271–288, https://doi.org/10.1175/BAMS-D-15-00213.1, 2017. a
Westbrook, C. and Illingworth, A.: The formation of ice in a long-lived supercooled layer cloud, Q. J. Roy. Meteor. Soc., 139, 2209–2221, 2013. a
- Abstract
- Introduction
- Data
- Methods
- Results – case study
- Conclusions and discussion
- Data availability
- Appendix A: Mass and area power law relationships
- Appendix B: Calculation of terminal fall velocity
- Author contributions
- Competing interests
- Special issue statement
- Acknowledgements
- Financial support
- Review statement
- References


