the Creative Commons Attribution 4.0 License.
the Creative Commons Attribution 4.0 License.
 | 19 Dec 2019
Evaluating the measurement interference of wet rotating-denuder–ion chromatography in measuring atmospheric HONO in a highly polluted area
Zheng Xu
Yuliang Liu
Xuguang Chi
Aijun Ding
Due to the important contribution of nitrous acid (HONO) to OH radicals in the atmosphere, various technologies have been developed to measure HONO. Among them, wet-denuder–ion-chromatography (WD/IC) is a widely used measurement method. Here, we found interferences with HONO measurements by WD/IC based on a comparison study of concurrent observations of HONO concentrations using a WD/IC instrument (Monitor for AeRosols and Gases in ambient Air, MARGA) and long-path absorption photometer (LOPAP) at the Station for Observing Regional Processes of the Earth System (SORPES) in eastern China. The measurement deviation of the HONO concentration with the MARGA instrument, as a typical instrument for WD/IC, is affected by two factors. One is the change in denuder pH influenced by acidic and alkaline gases in the ambient atmosphere, which can affect the absorption efficiency of HONO by the wet denuder to underestimate the HONO concentration by up to 200 % at the lowest pH. The other is the reaction of NO2 oxidizing SO2 to form HONO in the denuder solution to overestimate the HONO concentration, which can be increased by to 400 % in denuder solutions with the highest pH values due to ambient NH3. These processes are in particularly important in polluted east China, which suffers from high concentrations of SO2, NH3, and NO2. The overestimation induced by the reaction of NO2 and SO2 is expected to be of growing importance with the potentially increased denuder pH due to the decrease in SO2. We further established a method to correct the HONO data measured by a WD/IC instrument such as the MARGA. In case a large amount WD/IC-technique-based instruments are deployed with the main target of monitoring the water-soluble composition of PM2.5, our study can help to obtain a long-term multi-sites database of HONO to assess the role of HONO in atmospheric chemistry and air pollution in east China.
- Article
(3780 KB) - Full-text XML
- BibTeX
- EndNote


Since the first detection of nitrous acid (HONO) in the atmosphere in 1979 (Perner and Platt, 1979), HONO has attracted much attention due to its important contribution to OH radicals, which are the primary oxidants in the atmosphere (Kleffmann, 2007). It has been realized that the photolysis of HONO is the most significant OH source in the morning when other OH sources, such as the photolysis reactions of O3 and formaldehyde, are still weak (Kleffmann, 2007; Platt et al., 1980). In addition, unexpectedly high HONO concentrations have been observed in the daytime and are believed to be a major OH source even during the daytime (Kleffmann et al., 2005; Michoud et al., 2014; Sörgel et al., 2011). Currently, the source of daytime HONO is still a challenging topic under discussion.
Because of the important role of HONO in atmospheric chemistry and the knowledge gap with regard to its sources, various techniques have been developed to detect the HONO concentration in ambient air or in a smog chamber. Generally, online HONO analyzers can be divided into chemical methods and optical methods. The chemical methods include wet-denuder–ion-chromatography (WD/IC) (Acker et al., 2004; Febo et al., 1993), long-path absorption photometer (LOPAP) analysis (Heland et al., 2001), chemical ionization mass spectrometry (CIMS) (Lelièvre et al., 2004), and stripping coil-ion chromatograph (Cheng et al., 2013; Xue et al., 2019). The optical methods include differential optical absorption spectroscopy (DOAS) (Perner and Platt, 1979) and incoherent broadband cavity absorption spectroscopy (IBBCEAS) (Wu et al., 2014).
WD/IC is a widely used measurement method due to its simple design, low price, and high sensitivity (Zhou, 2013). In a WD/IC instrument, HONO is absorbed by the solution, converted into nitrite by the denuder, and then quantified by ion chromatography. The ambient HONO concentration is calculated from the concentration of nitrite and volumes of the sampled air and absorption solution. Using this method, a large number of studies have been performed to study the variation in HONO and its sources in the atmosphere. For example, Trebs et al. (2004) reported the HONO diurnal variation in the Amazon Basin and found relatively high HONO concentrations during the daytime. Using WD/IC, Su et al. (2008a, b) reported the variation characteristics of HONO in the Pearl River Delta and found that the heterogeneous reaction of NO2 on the ground surface is a major HONO source. Nie et al. (2015) evaluated the enhanced HONO formation from the biomass burning plumes observed in June, which is the intense biomass burning season in the Yangtze River Delta (YRD) in China. Makkonen et al. (2014) reported a 1-year HONO variation pattern at the Station for Measuring Ecosystem-Atmosphere Relations (SMEAR) III, a forest station in Finland. Recently, abundant ambient particulate nitrite levels were also measured by WD/IC (VandenBoer et al., 2014).
However, many studies found that the HONO sampling procedures may have introduced unintended artifacts because NO2 and other atmospheric components will generate a series of chemical reactions in the sampling tube to generate HONO (Heland et al., 2001; Kleffmann and Wiesen, 2008). For example, NO2 will heterogeneously react with H2O on the sampling tube wall to produce HONO (Heland et al., 2001; Zhou et al., 2002). This interference may be related to the length of the sampling tube and the relative humidity in the atmosphere (Su et al., 2008a). Recent studies have shown that NO2 reacts with atmospheric aerosols such as black carbon, sand, and hydrocarbons under certain conditions to produce HONO (Gutzwiller et al., 2002; Monge et al., 2010; Nie et al., 2015; Su et al., 2008a). Therefore, in the presence of high concentrations of aerosols, this reaction may lead to an enhancement of measurement interferences for the WD/IC system. In addition, when an alkaline solution, such as sodium carbonate, was used as the wet-denuder absorbing liquid for sampling HONO, artifact nitrous acid will be produced by the reaction between NO2 and SO2. (Jongejan et al., 1997; Spindler et al., 2003). Spindler et al. (2003) quantified the artifact HONO on an alkaline K2CO3 surface with a pH of 9.7 in laboratory experiments. However, their results were only applicable for a concentrated alkaline striping solution (1 mM K2CO3), which limited the application for quantifying the artifact HONO by the other WD/IC instrument with a different denuder solution (Spindler et al., 2003; Su et al., 2008a). As an alternative, Genfa et al. (2003) used H2O2 as the absorption liquid to absorb HONO. Since H2O2 can rapidly oxidize the produced S(IV) to sulfate and interrupt the reaction pathway of NO2 and SO2 to form , this will eliminate the measurement error.
Although many efforts were made on the interferences of WD/IC, an intercomparison between WD/IC and a technology with less interference is still needed in the field observation (Zhou, 2013). Only limited studies have been conducted on field comparisons between WD/IC and other reliable technologies. Moreover, the performance of WD/IC for HONO measurement is quite different under different environmental conditions. For example, Acker et al. (2006) showed a suitable correlation between WD/IC and coil sampling/high-performance liquid chromatographic (HPLC) during a HONO intercomparison campaign in an urban area of Rome (r2=0.81, slope = 0.83). Su et al. (2008b) found that WD/IC, on average, overestimated the HONO concentration by 1.2 times compared to the LOPAP measurement. However, when the same system was used for comparative observations in Beijing, the HONO concentration from the WD/IC measurement was overestimated by approximately 2 times (Lu et al., 2010). This phenomenon also indicates that the performance of WD/IC in the measurement of HONO is environmentally dependent.
To solve the complex atmospheric pollution problem in eastern China, a large number of two-channel WD/IC instruments represented by the Monitor for AeRosols and Gases in ambient Air (MARGA) instruments was widely used to obtain aerosol composition information, as well as acid trace gas levels, including HONO (Stieger et al., 2018). Those databases will greatly improve the understanding of air pollution in China. However, the application of HONO data was limited because of the measurement uncertainty. Therefore, the major purpose of this study is to try to evaluate the measurement uncertainty of WD/IC and increase the reliability of the HONO database obtained by MARGA or similar instruments. For the purpose, a MARGA and more accurate equipment (LOPAP) were used to simultaneously measure the HONO concentration at the Station for Observing Regional Processes of the Earth System (SORPES) in the YRD of east China. We evaluated the performance of the WD/IC instrument in measuring HONO concentrations and analyzed the source of measurement interference based on the atmospheric composition data from SORPES. Based on the understanding of the interference factors, a correction function was given to correct the HONO data measured by MARGA.
2.1 Observation site
The field-intensive campaign was conducted from December 2015 to January 2016 at SORPES in the Xianlin campus of Nanjing University. SORPES is a regional background site located on top of a hill (32∘07′14 N, 118∘57′10 E; 40 m a.s.l.), in an eastern suburb approximately 20 km from downtown Nanjing. The station is an ideal receptor for air masses from the YRD with little influence from local emissions and urban pollution from Nanjing. Detailed information about SORPES can be found in Ding et al. (2016).
2.2 Instrumentation
The fine particulate matter (PM2.5) and trace gas (SO2, O3, NOx, and NOy) levels were measured by a set of Thermo Fisher analyzers (TEI 5030i, 43i, 49i, 42i, and 42iy). The molybdenum oxide converter of the NOx analyzer was replaced by a blue light convertor to avoid NO2 measurement interference (Xu et al., 2013). The water-soluble ions of PM2.5 were determined by MARGA. For details on these instruments, please refer to Ding et al. (2016). The following section will focus on the measurement of HONO.
The WD/IC instrument for the HONO measurement used in our study was a MARGA (Metrohm, Switzerland, MARGA) (Xie et al., 2015). MARGA was located on the top floor of the laboratory building with a sampling inlet of 3 m. The sampling system of the MARGA instrument comprised two parts: a wet rotating denuder for gases and a steam jet aerosol collector (SJAC) for aerosols, which worked at an air flow rate of 1 m3 h−1. The trace gases, including SO2, NH3, HONO, HCl, and HNO3, were absorbed by the H2O2 denuder solution with a concentration of 1 mM. Subsequently, the ambient particles were collected in the SJAC. Hourly samples were collected in syringes and analyzed with a Metrohm cation and anion chromatograph using an internal standard (LiBr). In our experiments, the flow rate of the absorption solution was 25 mL h−1.
As an intercomparison, HONO was also observed by a LOPAP (QUMA, Germany) with a 1–2 cm sample inlet before the sample box. The ambient air was sampled in two similar temperature-controlled stripping coils in series using a mixture reagent of 100 g sulfanilamide and 1 L HCl (37 % volume fraction) in 9 L pure water. In the first stripping coil, almost all of the HONO and a fraction of the interfering substances were absorbed in the solution named R1. In the second stripping coil, the remaining HONO and most of the interfering species were absorbed in the solution named R2. After adding 0.8 g N-naphtylethylenediamine-dihydrochloride reagent in 9 L pure water to both coils, a colored azo dye was formed in the solutions of R1 and R2, which were then separately detected via long-path absorption in special Teflon tubing. The interference-free HONO signal was the difference between the signals in the two channels. The method was believed to be an interference-free method for HONO measurement.
3.1 Performance of MARGA for measuring atmospheric HONO
During the observation period, the HONO concentration measured by LOPAP (HONOlopap) varied from 0.01 to 4.8 ppbv with an average value of 1.1±0.77 ppbv, and the HONO concentration measured by the MARGA instrument (HONOmarga) was 0.01–9.6 ppbv, with an average value of 1.52±1.21 ppbv. The comparison between HONOlopap and HONOmarga values is shown in Fig. 1. The ratio of HONOmarga to HONOlopap varied from 0.25 to 5, but HONOmarga was higher than HONOlopap during most of the observation period (> 70 %). The average diurnal variations in HONOmarga and HONOlopap are shown Fig. 1b; HONOmarga / HONOlopap ratios were higher at night and especially in the morning, which were different from the results of Muller et al. (1999), who found that a remarkable overestimation of HONO by WD/IC usually occurred during the daytime. Meanwhile, the correlation between the HONO concentrations measured by WD/IC and by other techniques varied in different studies. The slope of HONOlopap to HONOmarga? measured by this study was approximately 0.57 (with a correlation coefficient of r2=0.3), which was within the large range of 0.32–0.87 reported by the limited comparison investigations on HONO measurements using a WD/IC instrument and LOPAP at four sampling sites including SORPES (a suburban site in YRD; this work), YUFA (a rural site in southern Beijing), PKU (an urban site in Beijing; Lu et al., 2010), and Easter Bush (a forest site south of Edinburgh; Ramsay et al., 2018). Such large variation in the slopes at the different sampling sites may indicate that the performance of WD/IC in the measurement of HONO is environmentally dependent.
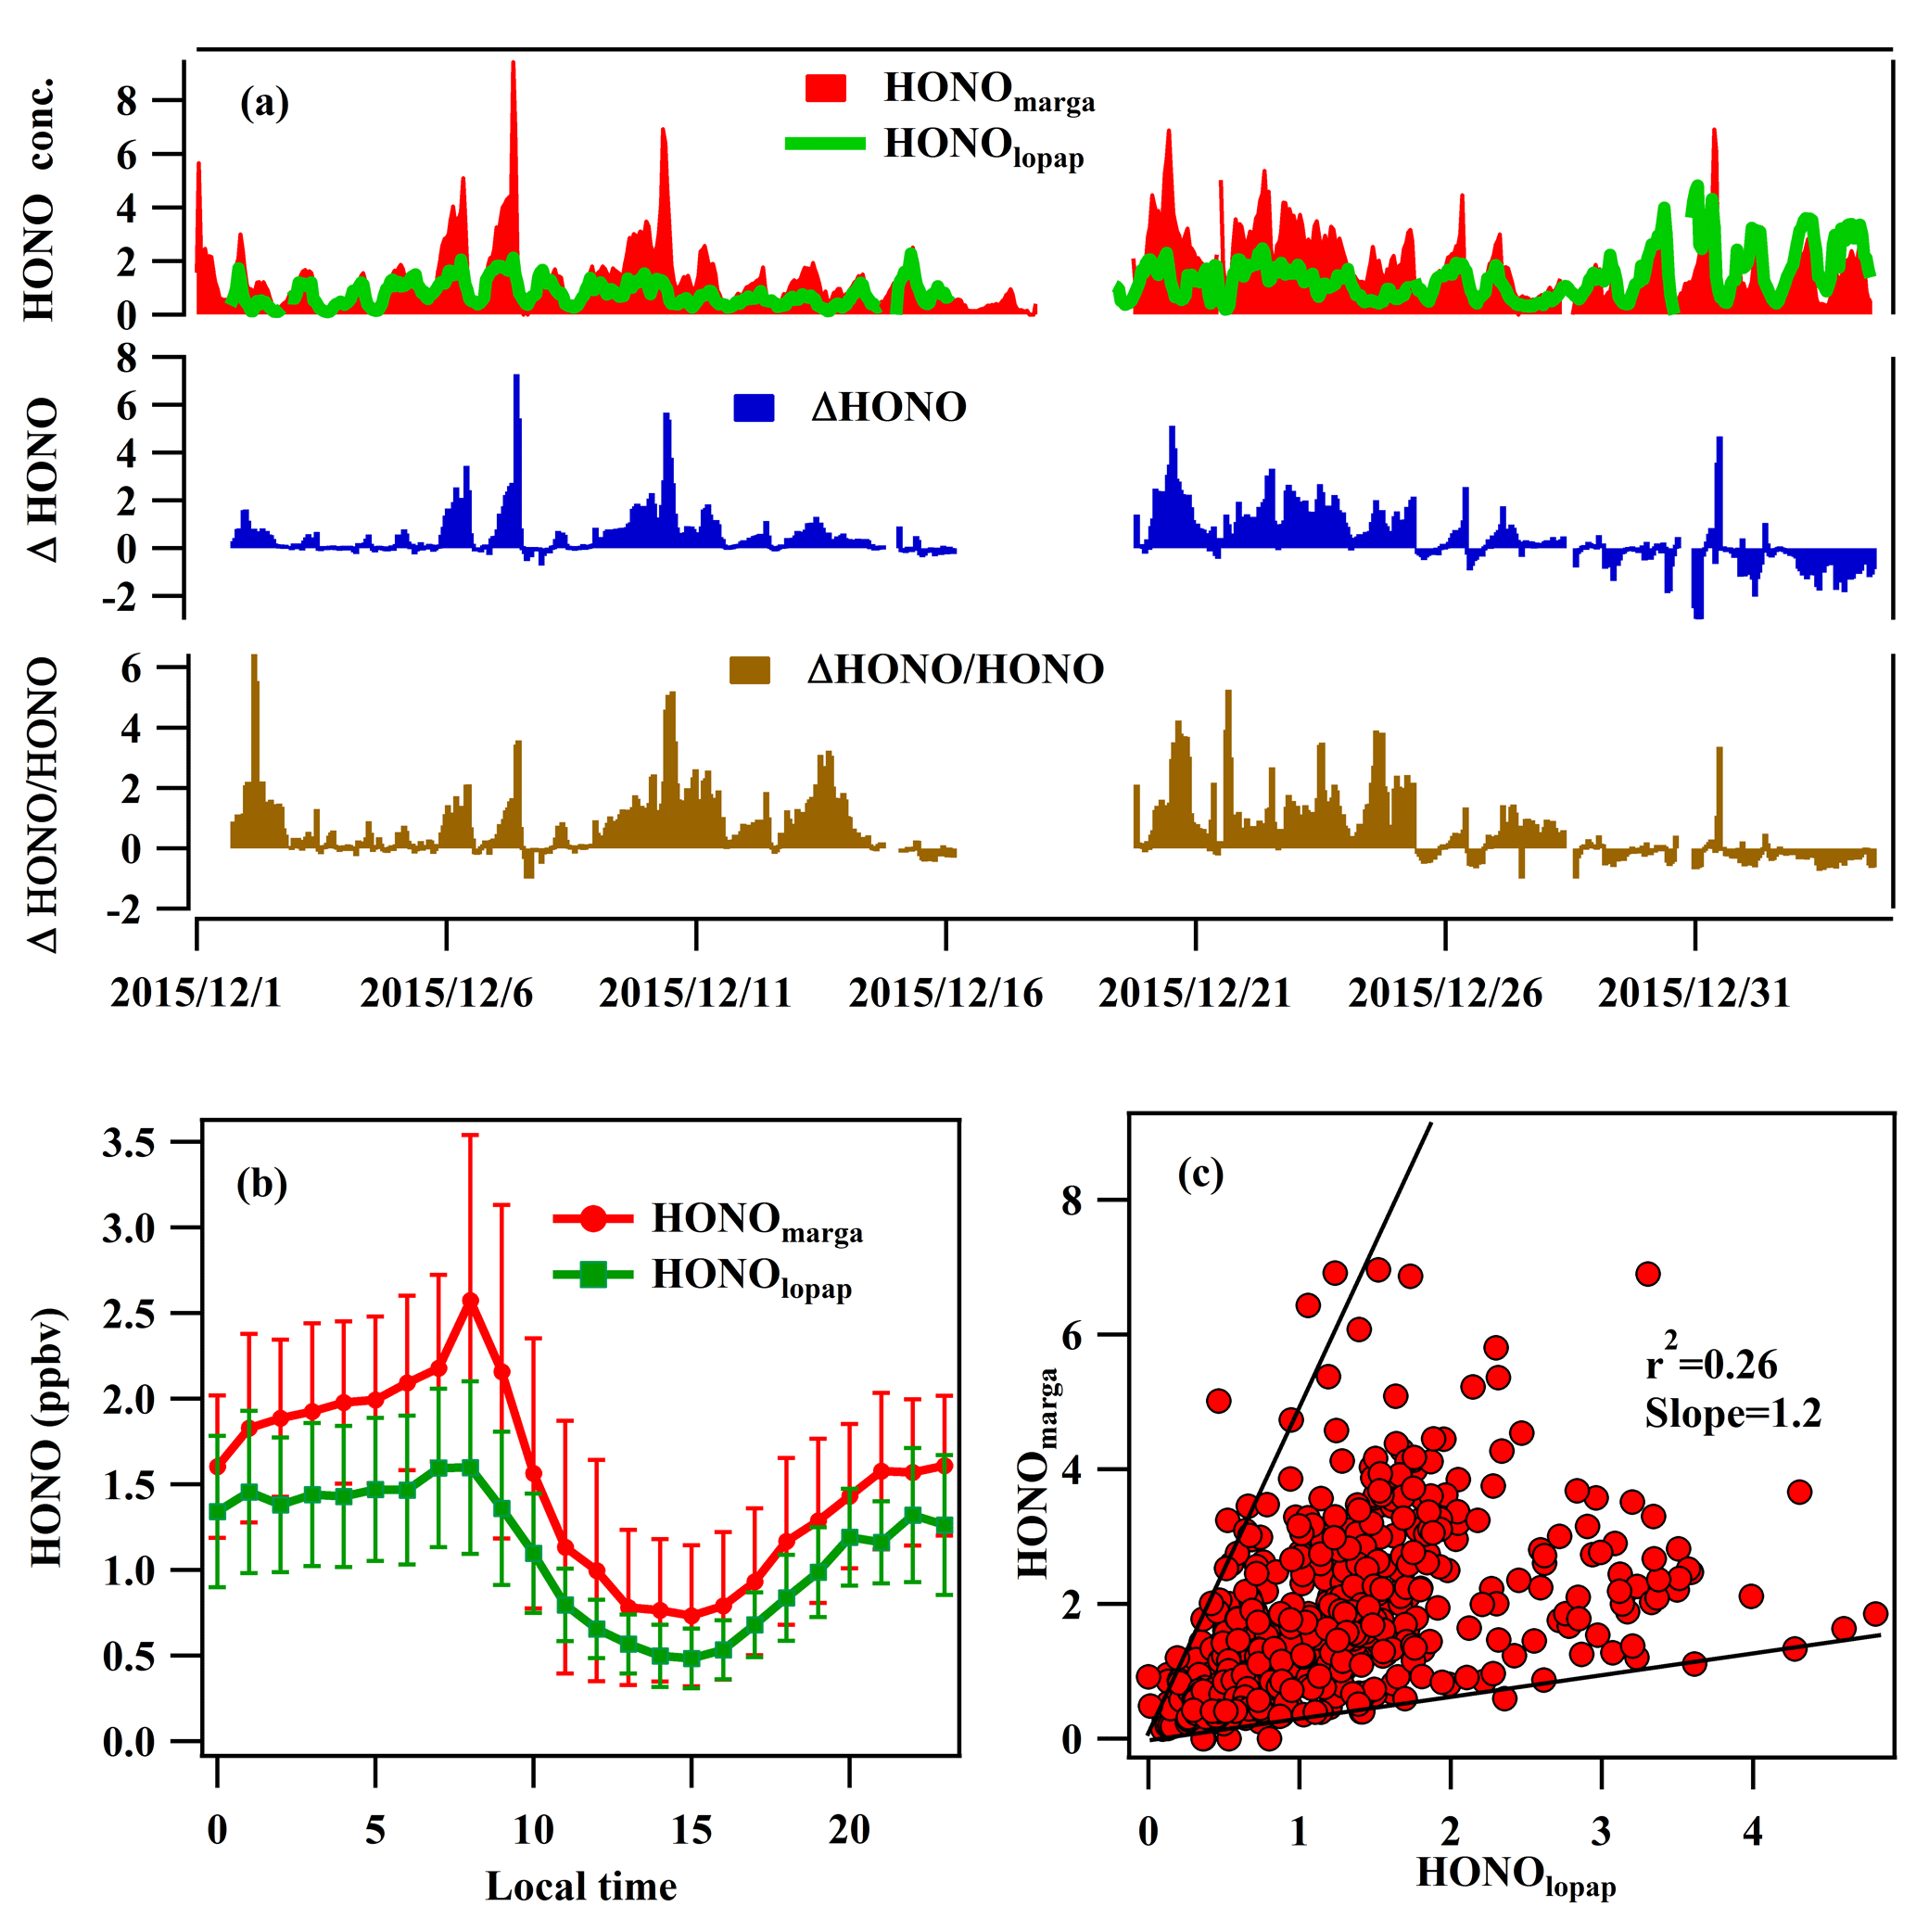
Figure 1The time series of HONO concentrations measured by the LOPAP (HONOlopap) and MARGA instruments (HONOmarga); the deviation of HONOmarga including ΔHONO (HONOmarga−HONOlopap) and ΔHONO/HONO, with regard to the benchmark of HONO (a), the average diurnal variations (b), and their scatterplot during the observation period (c).
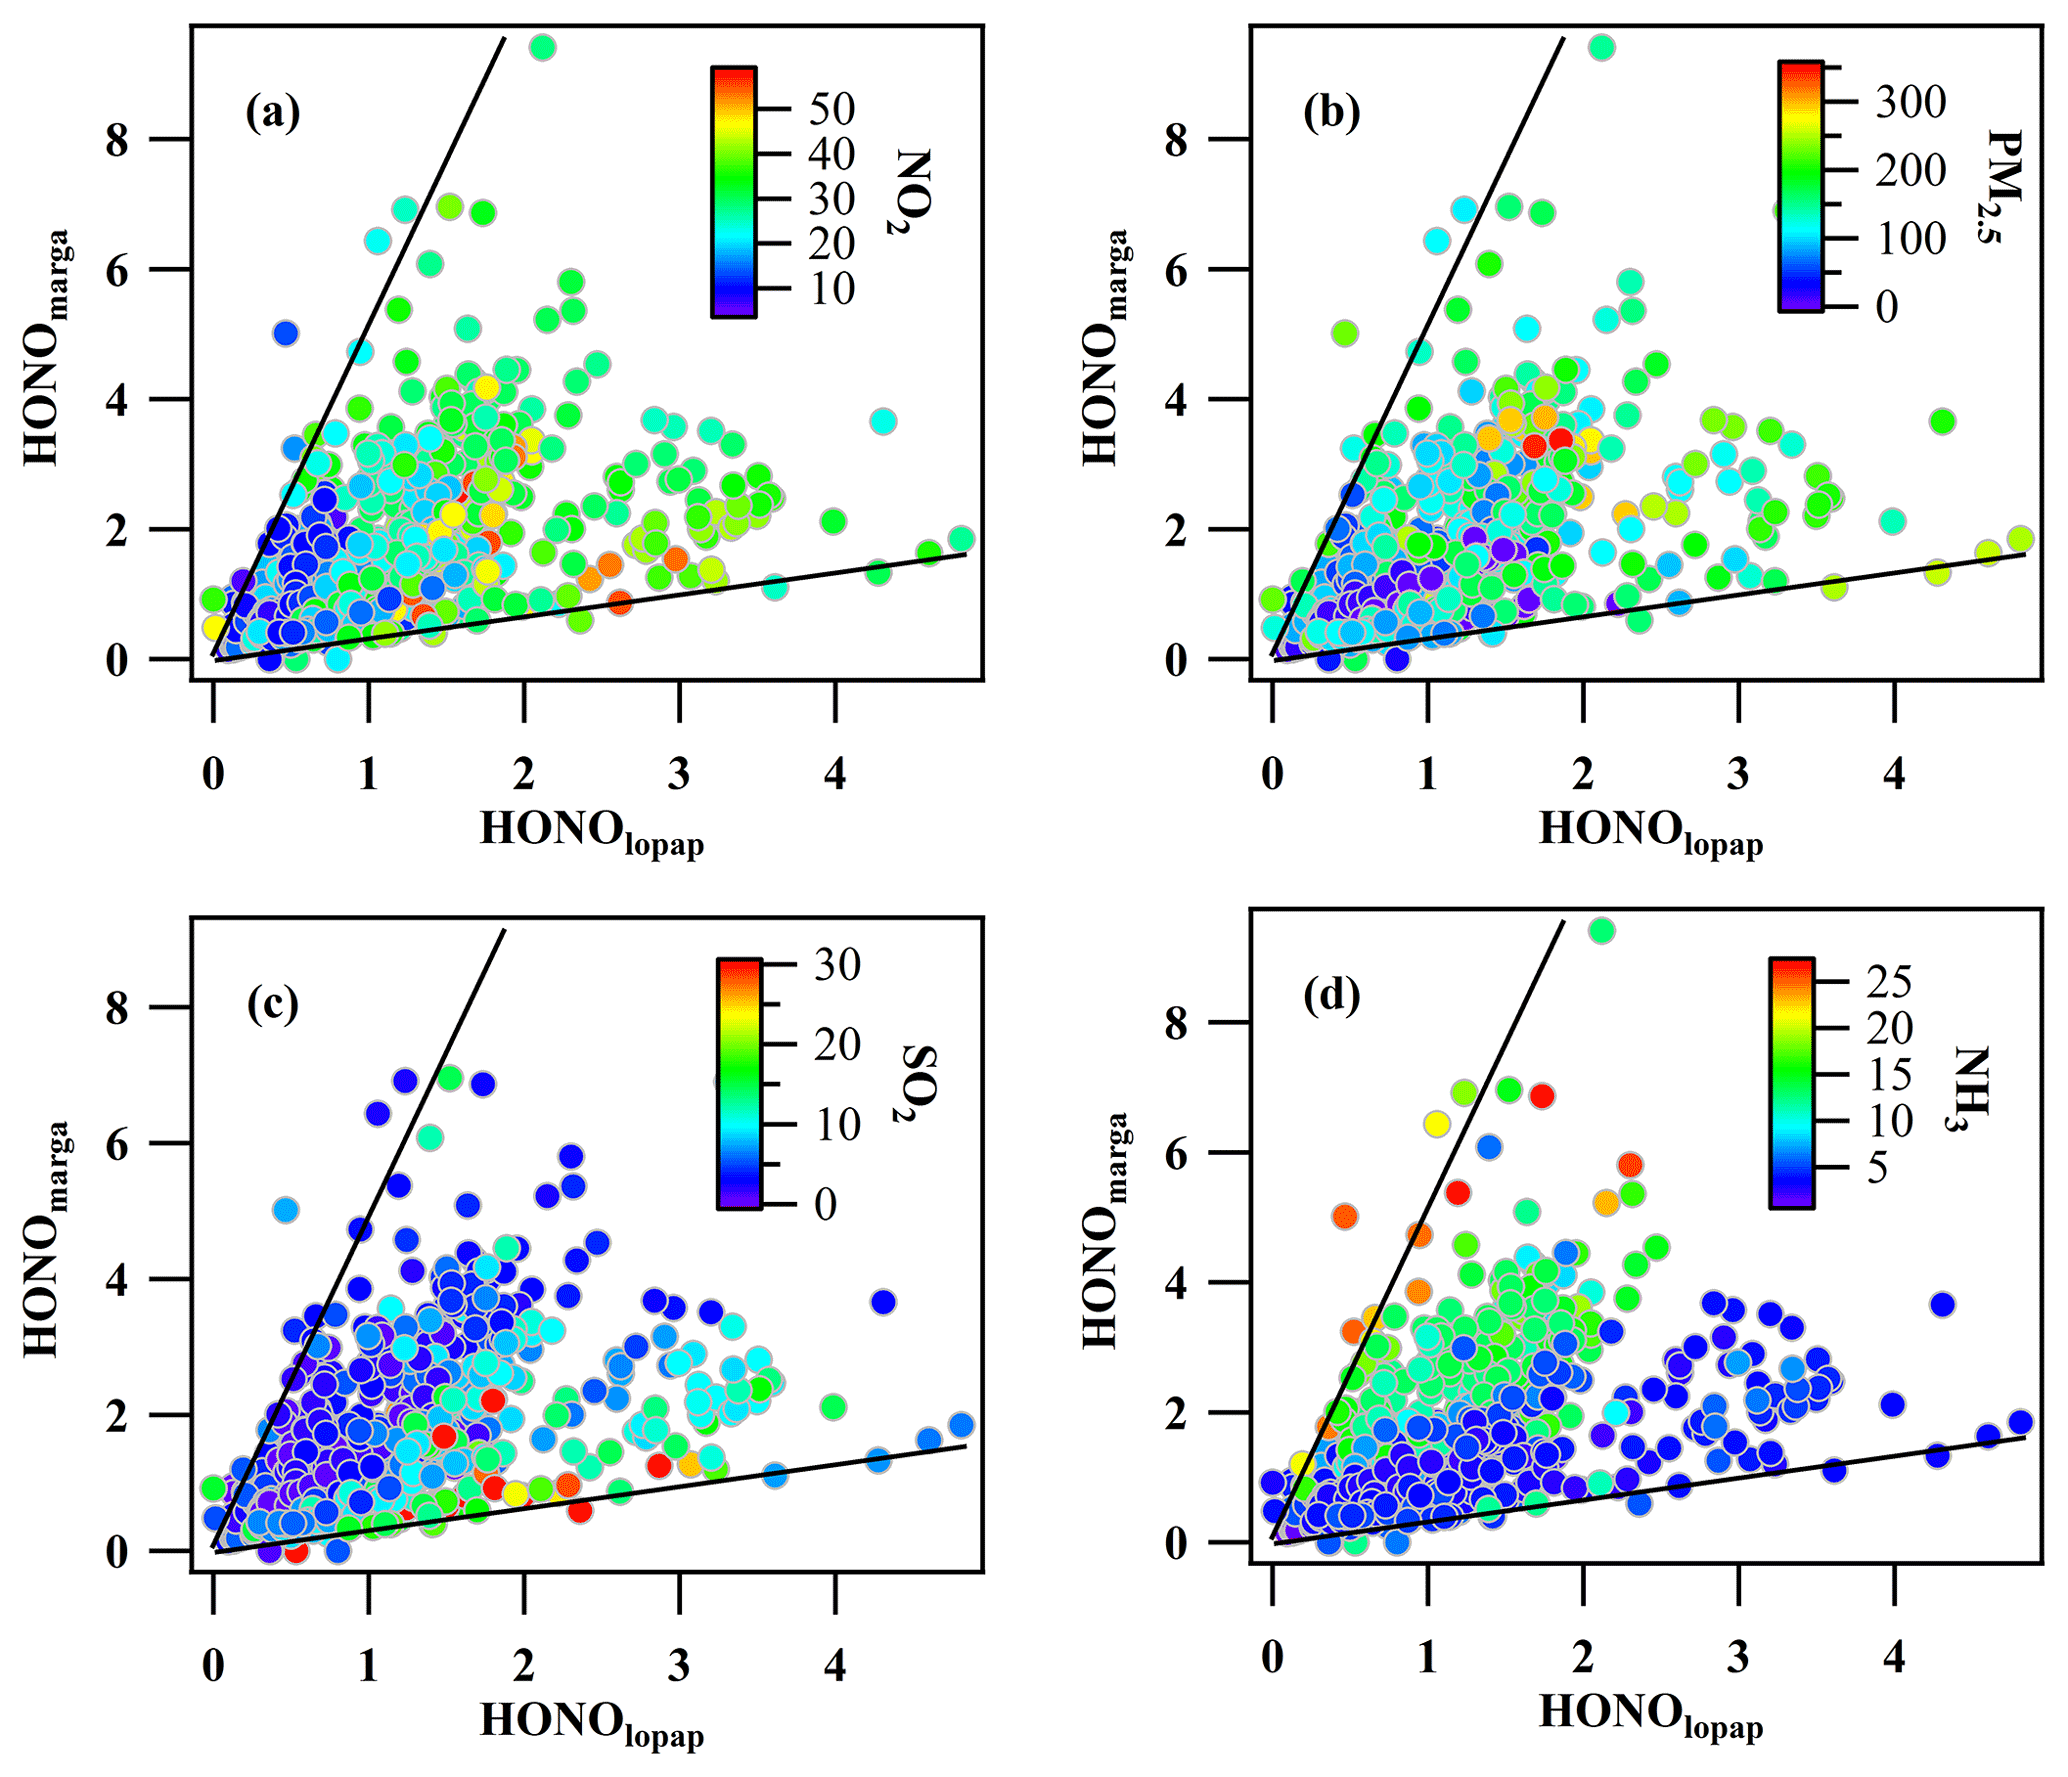
Here, the relationship between the measurement deviations and atmospheric compositions, including aerosols and major trace gases, during the observation was further analyzed, as shown in Fig. 2. As the major precursor of HONO, the heterogeneous reaction of NO2 on the sampling tube or aerosol may introduce the artificial HONO (Kleffmann et al., 2006; Gutzwiller et al., 2002; Liu et al., 2014; Xu et al., 2015). In our study, the results showed that the correlation between the deviations of HONOmarga with regard to NO2 and PM2.5 is weak, thereby indicating that the hydrolysis of NO2 on the tube surface or in PM2.5 is not the major contributor resulting in the measurement deviation of HONO. However, the measurement deviation was notably affected by ambient SO2 (Fig. 2c) and NH3 (Fig. 2d). Compared to HONOlopap, HONOmarga was significantly higher at a high concentration of SO2 and had the opposite trend at a high concentration of ammonia. A reasonable extrapolation was that SO2 and NH3, as the main acid gas and alkaline gas in the atmosphere, were absorbed by the denuder solution in the process of sampling HONO. This process will impact the pH of the denuder solution and further change the absorption efficiency of HONO (Zellweger et al., 1999). In a real atmosphere, ambient SO2 will be rapidly oxidized to sulfuric acid by H2O2 in the denuder solution (Kunen et al., 1983), thereby lowering the pH. Similar to SO2, ammonia in the atmosphere is hydrolyzed to and OH−, which increases the pH of the denuder solution. The variation in the pH of the denuder solution caused by atmospheric composition, specifically the condition of a high SO2 concentration, will ultimately affect the absorption efficiency of HONO by the denuder.
3.2 The influence of the denuder pH on HONO measurement by MARGA
According to previous studies by Zellweger et al. (1999), the absorption efficiency of the denuder for HONO is mainly affected by the pH of the denuder solution, the flow rate of the absorbing liquid, the gas flow rate, and the effective Henry coefficient of HONO, as shown by formulas 1 and 2.
where H is the Henry constant of HONO, Heff is the effective Henry constant, Ka is the dissociation constant, and fa and fg are the flow rates (mL min−1) of the aqueous and gaseous phase, respectively.
The absorption efficiency of the MARGA (ε) instrument for HONO as calculated according to Eqs. (1) and (2) is shown in Fig. 3a. The absorption efficiency was sensitive to the pH of the denuder solution. Therefore, estimating the pH of the denuder solution was the first step and the key issue to evaluate the measurement deviation of HONO by WD/IC.

Figure 3The absorption efficiency of HONO by the denuder at different pH values (a) and denuder absorption solution pH values in 13 denuder solution samples (b). pH_a was calculated by the ions by Curtipot according to the , , , and (PH_a) ions, which were measured by IC. pH_b was calculated by the above ions and the carbonic acid. pH_c was measured value by a pH detector.
Here, we attempted to use the ion concentration of the denuder solution (, , , Cl−, Mg2+, Ca2+, , Na+, and K+) measured by MARGA to inversely derive the pH of the denuder solution. The calculation of the pH was conducted with Curtipot, which is a simple software program that provides a fast pH calculation of any aqueous solution of acids, bases, and salts, including buffers and zwitterionic amino acids, from single components to complex mixtures (http://www.iq.usp.br/gutz/Curtipot_.html, last access: 28 November 2019). As input of the model, , , , and ions, which accounted for more than 98 % of the total ions, were used. To verify the reliability of the calculation, a pH detector (Metrohm, 826 PH) was used to measure the pH of the denuder solution, which was collected in a clean glass bottle when the denuder solution was injected into the IC instrument. In order to adjust the pH of the denuder solution, SO2 with a concentration of 0, 5, 10, 20, 40, 80, and 100 ppbv was injected into the sampling line with the NH3 concentration around 10–15 ppbv. During the test, 13 samples were collected, and the pH results are shown in Fig. 3b. When the pH value was lower than 5.6, the calculated pH (pH_a) was close to the measured value (pH_c), but when the value was higher than 7, pH_a was notably higher than pH_c. These results should be attributed to the buffering effect of carbonic acid in the denuder solution, which was exposed to the atmosphere. When the equilibrium between the CO2 and the carbonic acid in the denuder solution was reached, a carbonic acid buffer solution with a pH of 5.6 formed in the denuder solution with a dissolved CO2 concentration of M (Seinfeld and Pandis, 2016; Stieger et al., 2018). Additionally, when the concentration was higher than the total anion concentration in the denuder solution (, NO3−, , and Cl−), more CO2 would be dissolved in the denuder solution, and the excess dissolved CO2 could be equal to the excess . After including the buffering solution of carbonic acid and excess CO2, the calculated pH values were denoted as pH_b, and pH_b was in good agreement with the actual measurement results (pH_c), which confirmed the ability of Curtipot to calculate the pH of the denuder solution. Therefore, the pH of the denuder solution during the observation period was calculated by the above method.

Figure 4Variation in the ratio of HONOlopap to HONOmarga with the denuder absorption solution pH. The red line is the multiplicative inverse of the HONO absorption efficiency of MARGA.
Under ideal conditions, the pH of the denuder absorption solution in MARGA (1 mM H2O2) was approximately 6.97, and the absorption efficiency of MARGA for HONO should be 98 % or higher under clear conditions. However, during the observation period, the calculated pH of the denuder solution varied from 4 to 7 due to ambient SO2 and NH3 (Fig. 4). Therefore, HONOmarga was underestimated due to the low absorption efficiency caused by the low pH. In other words, the HONOmarga ∕ HONOlopap ratio will increase with decreasing pH. Assuming that the measurement deviation of HONOmarga was only impacted by the collection efficiency, the HONOlopap ∕ HONOmarga ratio should be 1∕ε (or HONOmarga ∕ HONOlopap=ε). However, most of the observed HONOlopap ∕ HONOmarga ratios were lower than 1∕ε (Fig. 4), thus indicating that HONOmarga had still been overestimated even when the deviation of HONO caused by the variation in the denuder pH was corrected.
3.3 The artifact HONO due to NO2 oxidizing SO2
To further analyze the MARGA measurement deviation of HONO, we first eliminated the influence of the denuder absorption efficiency on the measurement deviation according to the correction formula below.
where MARGAint. is the additional HONO produced during the sampling process.
In previous studies, the interference of HONO in the denuder solution mainly came from the NO2 hydrolysis reaction and the reaction between NO2 and SO2 (Febo et al., 1993; Spindler et al., 2003). In the study by Spindler et al. (2003), approximately 0.058 % of NO2 was hydrolyzed to HONO, which indicate that the NO2 hydrolysis reaction contributed little to the artificial HONO in the denuder solution. In this study, a similar ratio (0.060 %) was found at a low PH (< 4.5) when the level of artifact from the reaction between NO2 and SO2 was low (this part is discussed in the section below). However, the oxidation of SO2 with NO2 may have contributed to MARGAint. in the basic or slightly acidic denuder solution (Jongejan et al., 1997; Spindler et al., 2003; Xue et al., 2019). In this study, the correlation between MARGAint. and SO2⋅NO2 is shown in Fig. 5b. Compared to the study by Spindler et al. (2003), where the correlation with SO2⋅NO2 was linear in an alkaline solution, the relationship between MARGAint. and SO2⋅NO2 was dependent on the pH of the denuder solution. The generation rate of HONO by SO2⋅NO2 was low when the pH was < 5 but would significantly increase with pH. This discrepancy with the study of Spindler et al. (2003) should be due to the additional H2O2 in MARGA's denuder solution competitively oxidizing SO2.
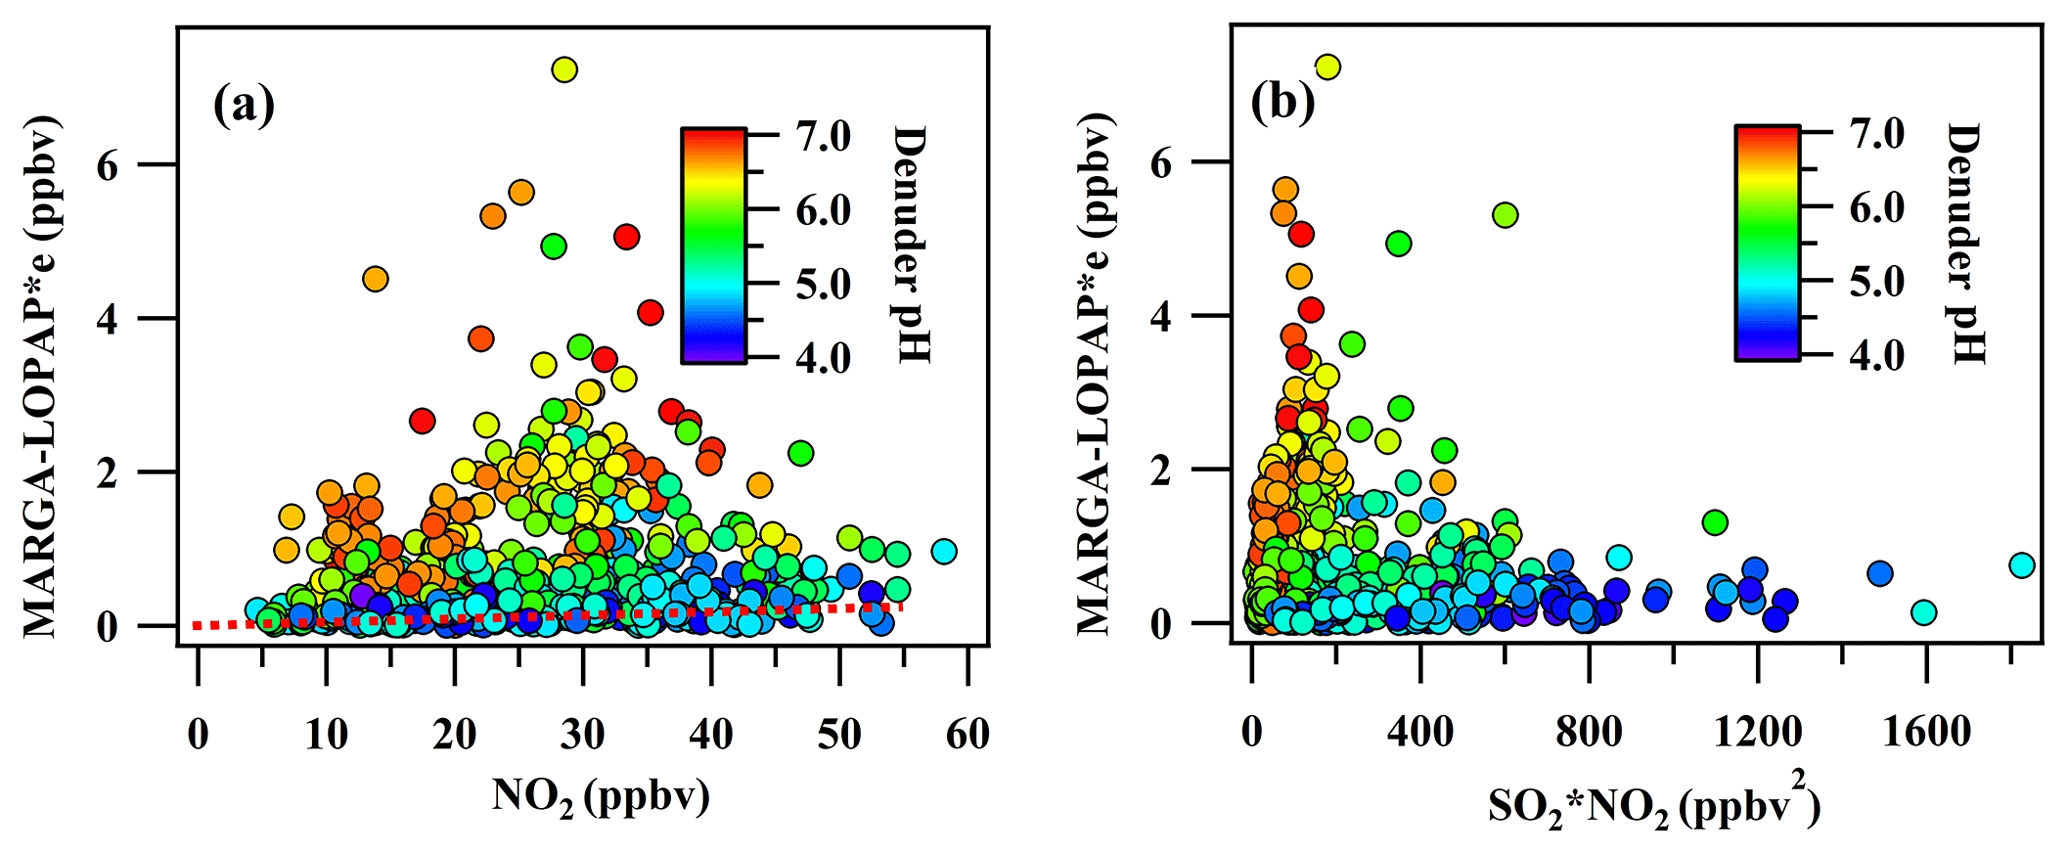
Figure 5The scatterplot between the MARGAint and NO2 (a) and SO2⋅NO2 (b). The plot was colored as a function of the denuder pH.
The competition of SO2 oxidation by H2O2 and NO2 in the atmosphere has been well studied (Hoffmann and Calvert, 1985; Seinfeld and Pandis, 2016). Due to the presence of H2O2 in the denuder solution, a similar competition oxidation process of SO2 will also occur in the denuder solution. First, ambient SO2 undergoes a hydrolysis reaction when it is absorbed by the denuder solution. The reaction is shown in Reaction (R1), and the fraction of the three components (αH2SO3, , and ) is affected by the denuder pH (Fig. 7a). After that, and are simultaneously oxidized by H2O2 and NO2 (Seinfeld and Pandis, 2016; Cheng et al., 2016).
Here, the reaction ratios of SO2 oxidized by H2O2 () and NO2 () in the denuder solution are shown in Fig. 6b. The concentration of H2O2 ([H2O2(aq)]) is 1 mM; the concentration of ambient NO2 ([NO2]) and SO2 ([SO2]) was assumed to be 1 ppbv. Because of the low solubility of NO2, the aqueous NO2 [NO2(aq)] in the denuder solution is balanced with [NO2] in Henry's law.
Compared to the gas and aqueous phase equilibrium of SO2(g) and S(IV)(aq) in the ambient air or cloud, almost all the SO2 was absorbed by the denuder solution of 1 mM H2O2 (Rosman et al., 2001; Rumsey et al., 2014); therefore, the concentration of [S(IV)] (, , H2SO3) in the denuder solution was determined by [SO2], sampling flow, and the flow of denuder liquid. For example, [S(IV)] should be M for an air flow of 16.67 L min−1, a liquid flow of 0.08 mL min−1, and 1 ppb SO2. Thereby, the [(aq)] and [(aq)]was determined by the pH and [S(IV)] at the beginning of the oxidation reaction by H2O2 or NO2.
The result is as shown in Fig. 6. In the case of a lower pH, more would be present in the solution. At this point, the oxidation of SO2 in the solution was mainly due to H2O2. With the increase in pH, the concentration of the solution decreased, while the concentration of the solution increased. The role of NO2 in the oxidation of SO2 gradually increased, and the ratio of rose rapidly and remained at nearly 100 % at a pH of 8, which indicated that almost all SO2 was oxidized by NO2 at this point.

Figure 6The fraction of S(IV) species (, , and αH2SO3) as a function of the pH (a) and the formation rate of aqueous phase oxidation of S(IV) by H2O2 and NO2 as a function of the pH for [SO2] = 1 ppb, [NO2] = 1 ppb, and [H2O2] in the denuder solution = 1. and are the oxidation ratio of S(IV) by H2O2 and NO2, respectively (b).
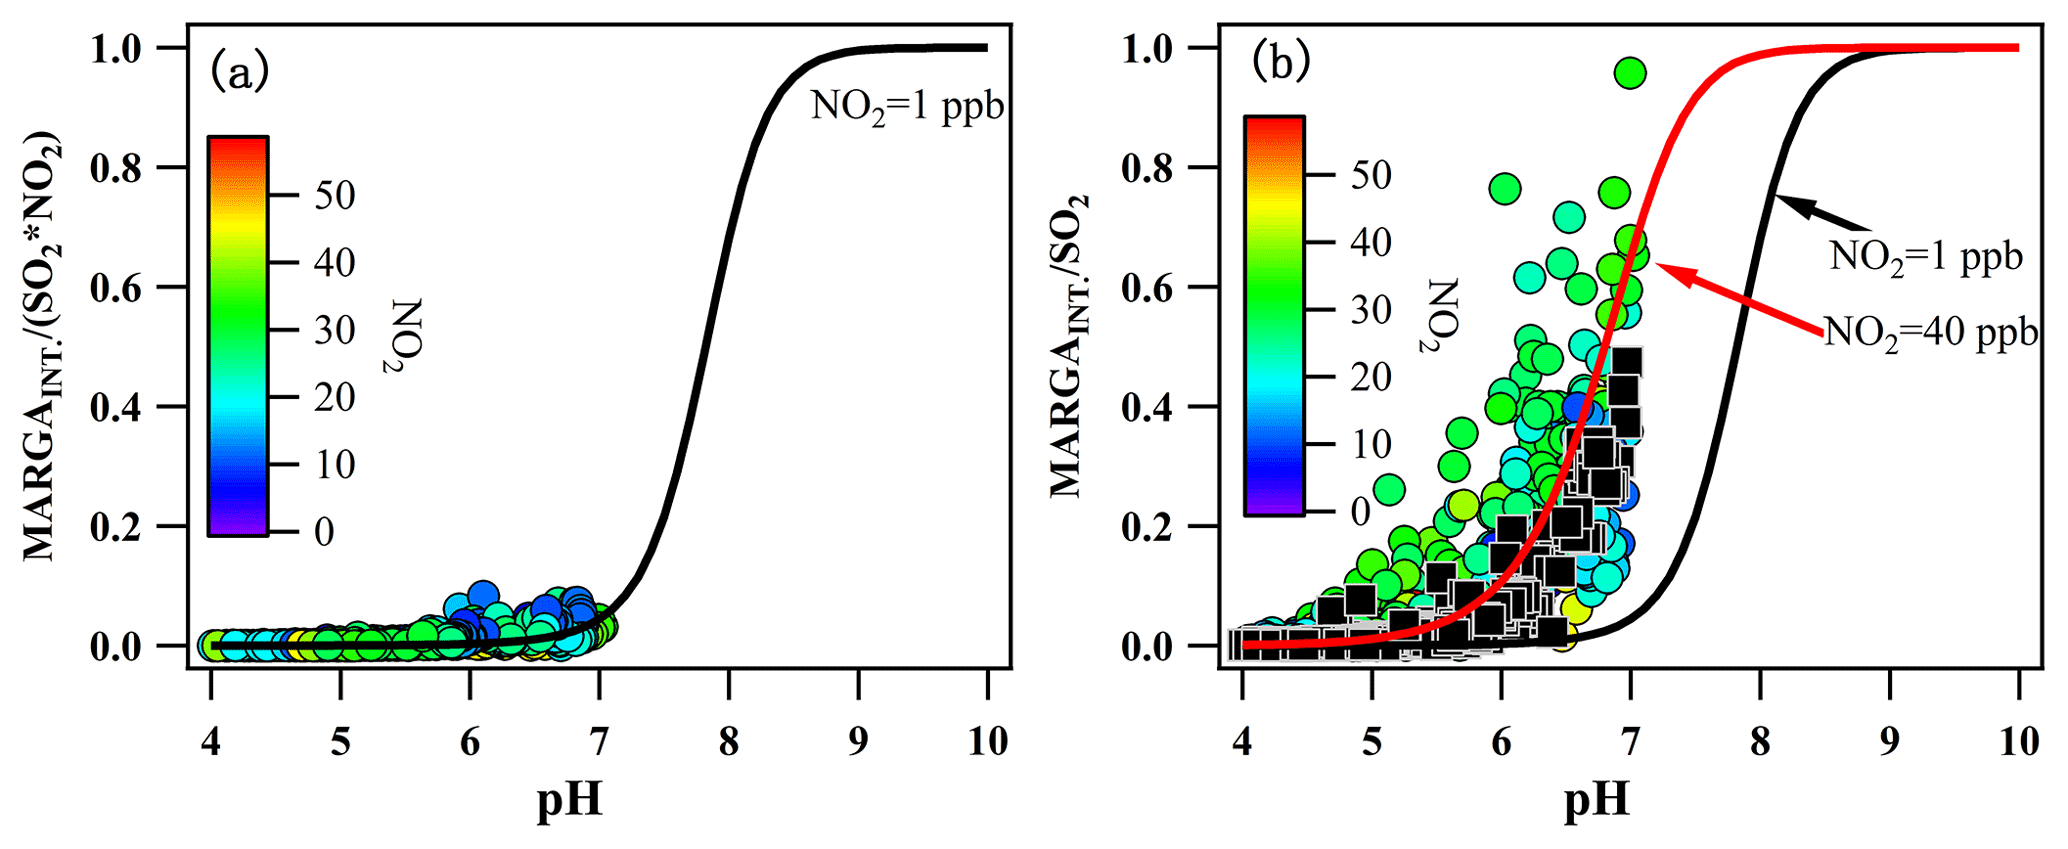
Figure 7(a) Variation in the production rate of the artifact HONO from 1 ppbv SO2 and 1 ppbv NO2 with the denuder pH and (b) the variation in MARGAint. ∕ SO2 with the pH of the denuder solution (circles) and calculated for different pH values according to ambient NO2 (black squares).
Now, the question was whether the observed MARGAint.. could be explained by the reaction between SO2 and NO2. This question could be answered by comparing MARGA and because was formed in the denuder solution only when SO2 was oxidized by NO2. Here, the correlation between the MARGAint. production rate and SO2, NO2, and the denuder pH is also shown in Fig. 7a. MARGA was in good agreement with the theoretically calculated , thereby confirming that the chemical reaction between SO2 and NO2 did lead to the additional HONO production, which then resulted in the MARGA overestimations of the HONO measurements. Additionally, under the condition of 1 ppb NO2 concentration, as well as a range of the denuder pH of 4 to 7, only approximately 10 % of the SO2 was oxidized by NO2, which indicated that MARGAint. was low. However, during our observation, there was up to 50 ppbv NO2. Under these conditions, the oxidation of SO2 by NO2 was greatly elevated. As shown in Fig. 7b, the high NO2 concentrations of the ambient air (circles) were consistent with the values calculated from ambient air NO2 concentrations (black squares), which also confirmed the results.

Figure 8The HONO produced from the reaction between NO2 and SO2 in the presence of 5 ppbv (a) and 20 ppbv NH3 concentrations (b). The black line is the variation in the pH with the SO2 concentration.
In the reaction of SO2 and NO2, pH is the limiting factor. In the low pH of 4–6, the dissolved SO2 in the main denuder solution is presented as , which will be rapidly oxidized by H2O2. In a real atmosphere, NH3 is the major basic species to maintain the high pH of the denuder solution. Therefore, NH3 is the key component influencing MARGAint.. Figure 8 shows the scenario of calculating MARGAint. from the reaction between SO2 and NO2 with ambient NH3 concentrations of 5 and 20 ppbv. As shown in the figure, in the case of the 5 ppbv NH3 concentration, the denuder pH would rapidly decrease with increasing SO2 concentration. At this point, the formation process of MARGAint. from SO2 and NO2 was limited. However, for a high NH3 concentration, the pH of the denuder solution would slowly decrease due to the neutralization of NH3 by sulfuric acid. A concentration of 1.2 ppb of artifact HONO could be produced with an NO2 concentration of 40 ppbv and an SO2 concentration of 4 ppbv. MARGAint. would be greatly improved at a high concentration of NH3.
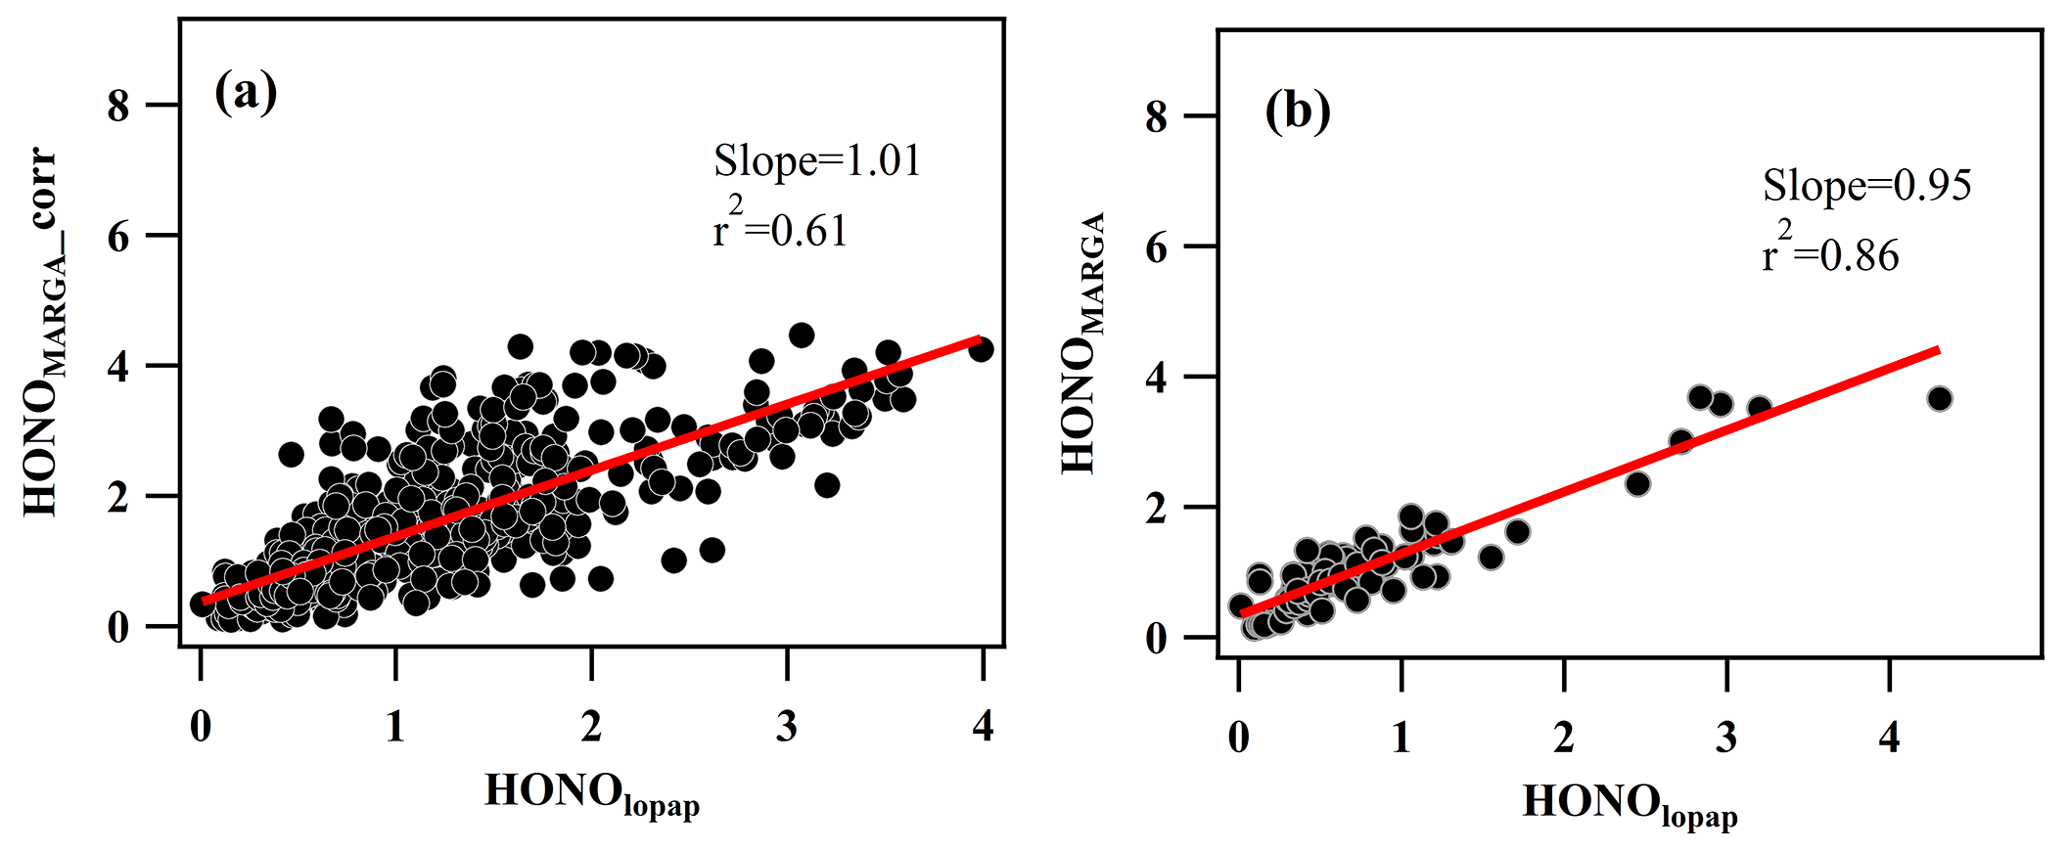
Figure 9The correlation between HONOmarga_corr and HONOlopap (a) and the correlation between HONOmarga and HONOlopap under the conditions of ppbv2 (median value) and NH3 < 5 ppbv (median value) (b).
In east China, NH3 concentration is generally high and kept increasing by 30 % from 2008 to 2016 in North China Plain (NCP) (Liu et al., 2018). Especially in summer, NH3 concentration can be up to 30 ppb (Meng et al., 2018). In contrast, the SO2 concentration is gradually decreasing due to the emission reduction from 2008 to 2016 (around 60 %), with a concentration lower than 5 ppb frequently observed. In such a case, the pH of the denuder solution in the WD/IC instrument will be further enhanced, which will in turn further aggravate the deviation of the HONO measurement.
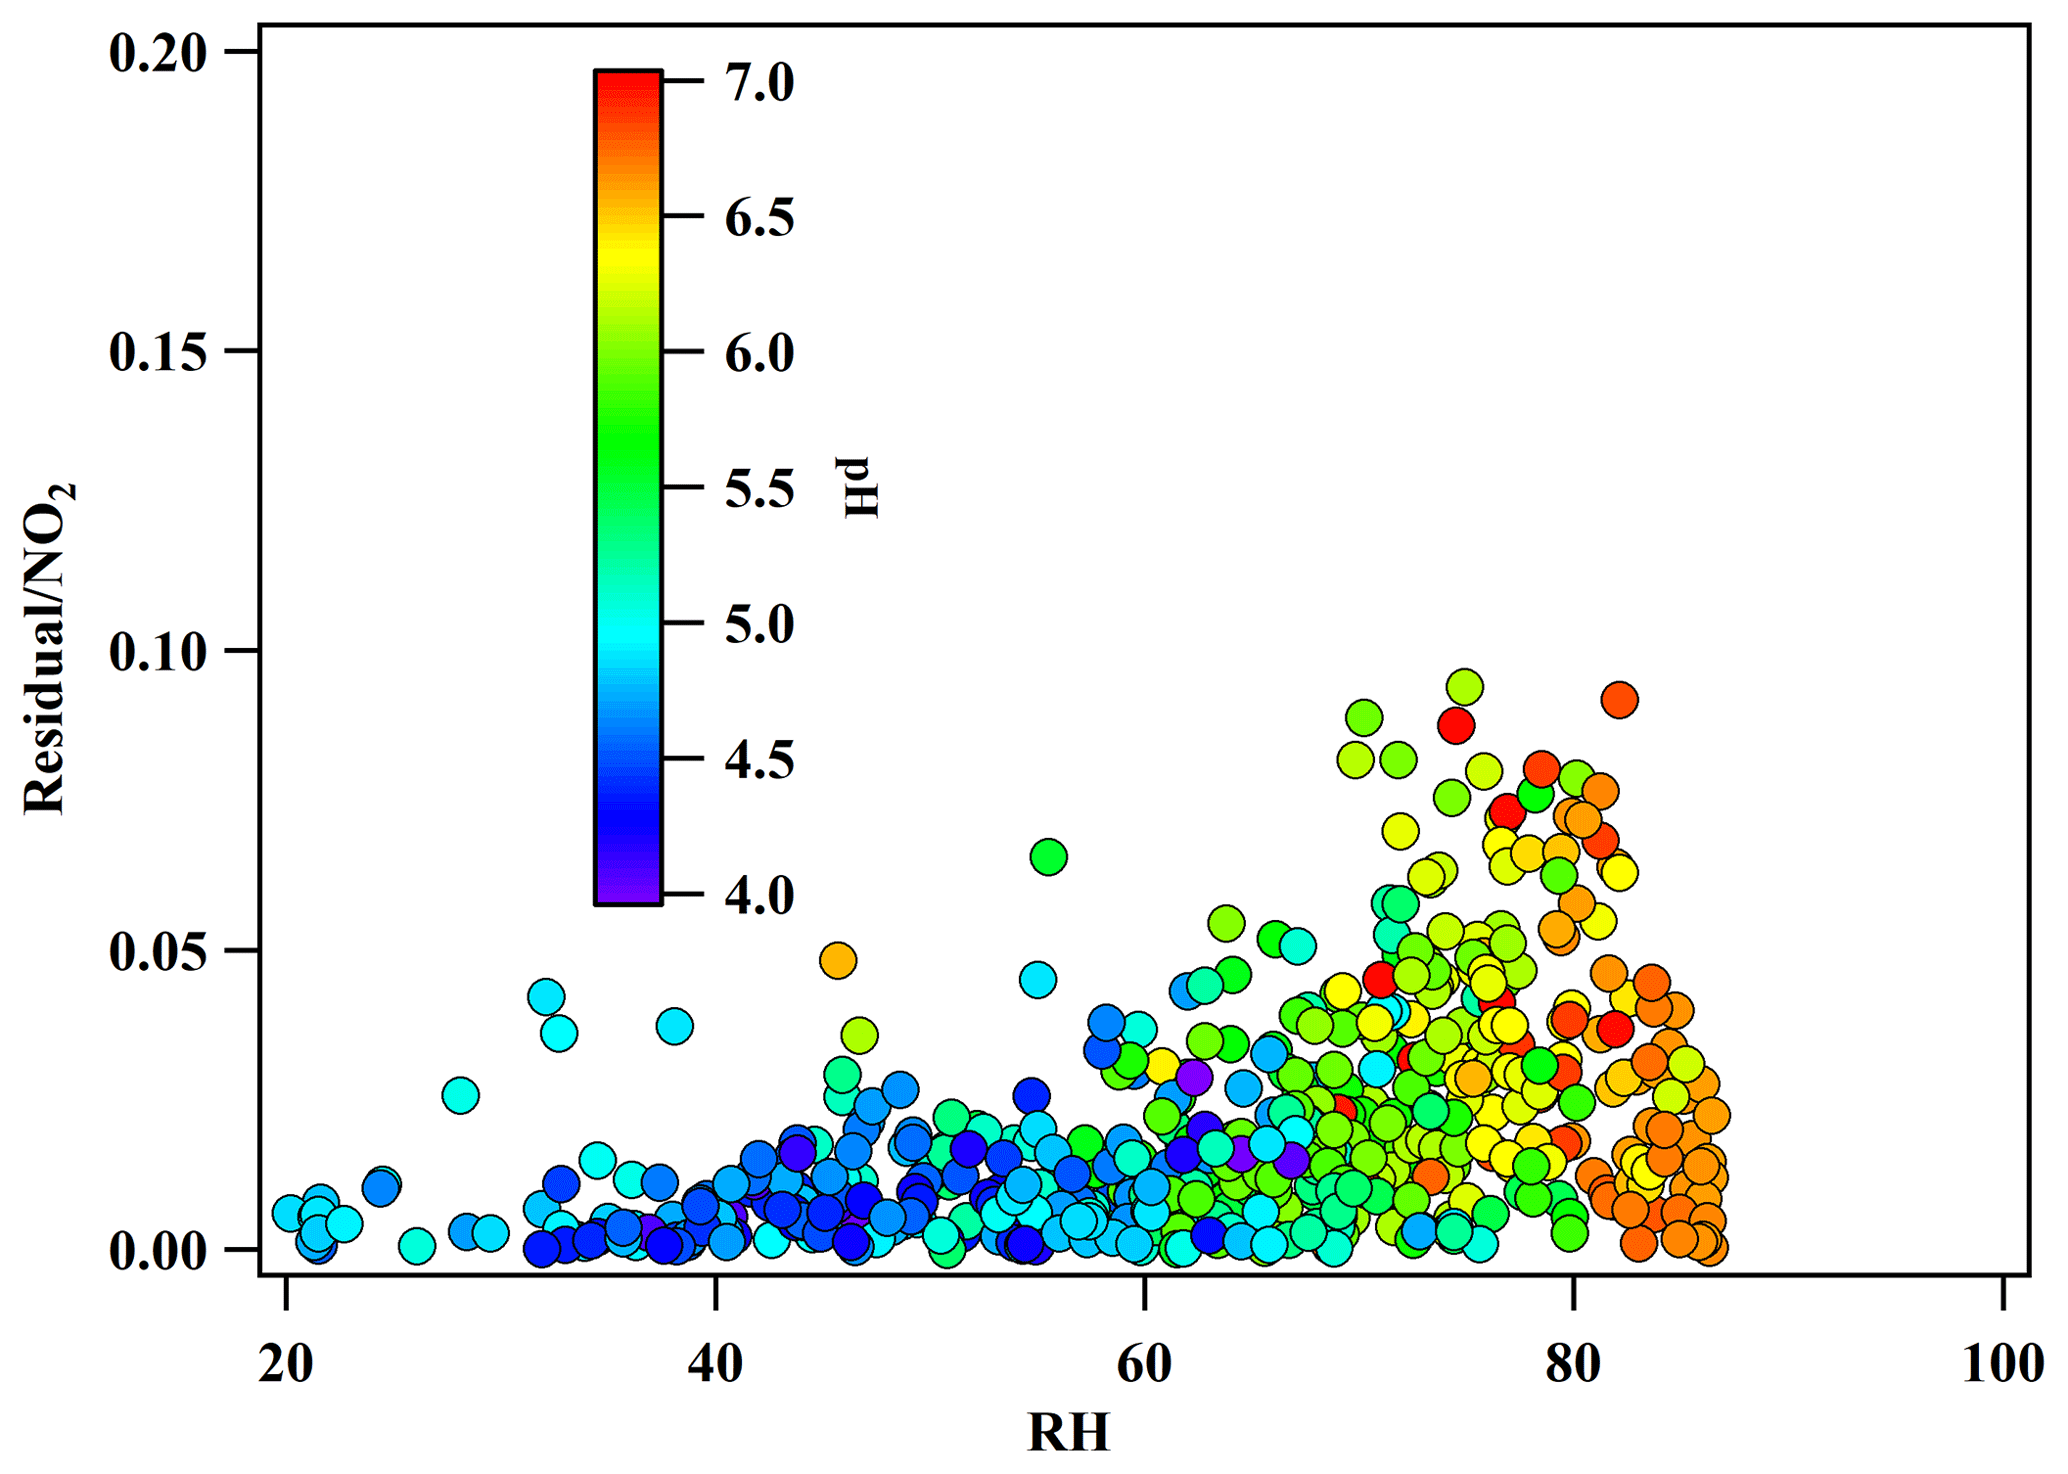
Figure 10The correlation of residual/NO2 with RH. The residual is the difference of MARGAint. and the calculated interference from the reaction of SO2 and NO2.
3.4 The correction for the HONO measurement interference
According to the above results, the deviation of MARGA for the HONO measurement could be caused by two factors: one is the low sampling efficiency of the denuder solution at low pH, and the other is the external that is produced by the reaction between SO2 and NO2 at high pH. In this study, we attempted to correct the measurement deviation of HONO accordingly. The correction formula is as follows:
The calculation results are shown in Fig. 9a. After correction, there was a significant improvement in the measured HONO by MARGA, and the r2 value between HONOmarga and HONOlopap increased from 0.28 to 0.61, specifically in the high concentration range of HONO. However, when the concentration of HONO was low, the degree of improvement was limited. To find the reason for the uncertainty correction, the residual analysis was made. The residual was the difference between MARGAint. and calculated interference from . The dependency of residual/NO2 on RH is similar to that of ambient HONO∕NO2 on RH which was observed in many other studies (Li et al., 2012; Yu et al., 2009) and indicates that the NO2 heterogeneous reaction or the reaction of SO2 and NO2 in the sampling tube may be other factors impacting the HONO interference (Su et al., 2008a).
Moreover, the uncertainty of correcting HONOmarga may be attributed to two other reasons. One is the uncertainty of the pH of the denuder solution. The pH of the denuder solution was calculated according to the ions formed from the absorbed gas in the denuder solution with a residence time of 1 h, whereas the oxidation of SO2 occurred in real time when the pH of the denuder solution also varied. Additionally, the low concentration ions ( M) in the denuder solution will induce uncertainties in calculating the pH. Another reason is the uptake coefficient of the denuder solution. NO2(g) is weakly soluble in pure water with a Henry's law constant (H) of ∼0.01 M atm−1, which was used in this study. However, previous studies have shown that the anions in the liquid greatly enhance the NO2(g) uptake by 2 or 3 orders of magnitude (Li et al., 2018). This process may influence the calculation of the dissolved NO2 content and its hydrolysis. The accuracy of the uptake coefficient was difficult to determine, which might be one of the reasons for the underestimation of MARGAint. for the reaction between SO2 and NO2 at a high concentration of NO2 (Fig. 7b).
In addition to the correction, an alternative way to use HONOmarga is to select suitable conditions in which the measurement interference is limited. In ambient air, SO2 and NH3 are the key pollutants resulting in HONO measurement deviation. According to our observations, under the clear conditions of SO2⋅NO2 lower than 150 ppbv2 (median value) and an NH3 content lower than 5 ppbv (median value), MARGA showed a much better performance for measuring the HONO concentration. The latter was also the possible reason for the suitable performance of WD/IC in measuring HONO concentrations in previous studies (Acker et al., 2004; Ramsay et al., 2018).
We conducted a field campaign at SORPES in December 2015 to evaluate the performance of MARGA for measuring ambient HONO concentrations with the benchmark of LOPAP. Compared with HONOlopap, a notable deviation in HONOmarga was observed between −2 and 6 ppb, and the ratio of HONOmarga/HONOlopap ranged from 0.4 to 4. When the SO2 concentration in the atmosphere was high, a negative deviation occurred, and when the NH3 concentration was high, a positive deviation occurred.
Through further analysis of the pH of the denuder solution and the oxidation of SO2 in the denuder solution, the deviation of the measurement of HONO by MARGA is mainly due to two things. One is that an acidic–alkaline gas component in the atmosphere enters the denuder solution of the instrument, thereby causing the denuder pH to change, affecting the absorption efficiency of MARGA for HONO. Another reason is that NO2 oxidizes the SO2 absorbed in the denuder solution, and the reaction is generally improved with a higher pH of the denuder solution in the presence of high concentrations of NH3 and NO2. The additional formation of HONO led to the MARGA measurement error of HONO.
Based on the understanding of the interference factors, we established a method to correct the HONO data measured by MARGA. Compared with LOPAP, the HONO measurement results were improved after the correction, but the improvement was limited at a low concentration of HONO. Moreover, under the clear conditions of low concentrations of SO2, NO2, and NH3, MARGA will have a better performance for the measurement of HONO.
Measurement data at the SORPES station, including HONO data and relevant trace gases and aerosol data as well as meteorological data, are available upon request from the corresponding author before the SORPES database is open to the public.
AD and WN designed the study and contributed to the editing of the paper. ZX contributed to the measurements, data analysis, and the draft of this paper, and YL contributed to the data analysis. PS and XC contributed to observations at SORPES and data analysis.
The authors declare that they have no conflict of interest.
We thank Yuning Xie, Lei Wang, Caijun Zhu, and Wenjun Wu at the School of Atmospheric Sciences at Nanjing University for their contributions to the maintenance of the measurements.
The research was supported by the following funders: National Key R&D Program of China (grant nos. 2016YFC0200500 and 2016YFC0202000), National Science Foundation of China (grant nos. 41605098, 91644218, 41675145 and 41875175), and Jiangsu Provincial Science Fund (grant no. BK20160620).
This paper was edited by Mingjin Tang and reviewed by two anonymous referees.
Acker, K., Spindler, G., and Brüggemann, E.: Nitrous and nitric acid measurements during the INTERCOMP2000 campaign in Melpitz, Atmos. Environ., 38, 6497–6505, https://doi.org/10.1016/j.atmosenv.2004.08.030, 2004.
Acker, K., Febo, A., Trick, S., Perrino, C., Bruno, P., Wiesen, P., Möller, D., Wieprecht, W., Auel, R., Giusto, M., Geyer, A., Platt, U., and Allegrini, I.: Nitrous acid in the urban area of Rome, Atmos. Environ., 40, 3123–3133, https://doi.org/10.1016/j.atmosenv.2006.01.028, 2006.
Cheng, P., Cheng, Y. F., Lu, K. D., Su, H., Yang, Q., Zou, Y. K., Zhao, Y. R., Dong, H. B., Zeng, L. M., and Zhang, Y.: An online monitoring system for atmospheric nitrous acid (HONO) based on stripping coil and ion chromatography, J. Environ. Sci., 25, 895–907, 2013.
Cheng, Y., Zheng, G., Wei, C., Mu, Q., Zheng, B., Wang, Z., Gao, M., Zhang, Q., He, K., Carmichael, G., Pöschl, U., and Su, H.: Reactive nitrogen chemistry in aerosol water as a source of sulfate during haze events in China, Sci. Adv., 12, e1601530, https://doi.org/10.1126/sciadv.1601530, 2016.
Ding, A., Nie, W., Huang, X., Chi, X., Sun, J., Kerminen, V.-M., Xu, Z., Guo, W., Petäjä, T., Yang, X., Kulmala, M., Fu, C.: Long-term observation of air pollution-weather/climate interactions at the SORPES station: a review and outlook, Front. Environ. Sci. Eng., 10, 15, https://doi.org/10.1007/s11783-016-0877-3, 2016.
Febo, A., Perrino, C., and Cortiello, M.: A denuder technique for the measurement of nitrous acid in urban atmospheres, Atmos. Environ. A Gen. Top., 27, 1721–1728, https://doi.org/10.1016/0960-1686(93)90235-Q, 1993.
Genfa, Z., Slanina, S., Brad Boring, C., Jongejan, P. A. C., and Dasgupta, P. K.: Continuous wet denuder measurements of atmospheric nitric and nitrous acids during the 1999 Atlanta Supersite, Atmos. Environ., 37, 1351–1364, https://doi.org/10.1016/S1352-2310(02)01011-7, 2003.
Gutzwiller, L., Arens, F., Baltensperger, U., Gäggeler, H. W., and Ammann, M.: Significance of Semivolatile Diesel Exhaust Organics for Secondary HONO Formation, Environ. Sci. Technol., 36, 677–682, https://doi.org/10.1021/es015673b, 2002.
Heland, J., Kleffmann, J., Kurtenbach, R., and Wiesen, P.: A New Instrument To Measure Gaseous Nitrous Acid (HONO) in the Atmosphere, Environ. Sci. Technol., 35, 3207–3212, https://doi.org/10.1021/es000303t, 2001.
Hoffmann, M. R. and Calvert, J. G.: Chemical Transformation Modules for Eulerian Acid Deposition Models, Vol. 2, The Aqueous-Phase Chemistry, EPA/600/3-85/017, US Environmental Protection Agency, Research Triangle Park, NC, 1985.
Jongejan, P. A. C., Bai, Y., Veltkamp, A. C., Wye, G. P., and Slaninaa, J.: An Automated Field Instrument for The Determination of Acidic Gases in Air, Int. J. Environ. Anal. Chem., 66, 241–251, https://doi.org/10.1080/03067319708028367, 1997.
Kleffmann, J.: Daytime sources of nitrous acid (HONO) in the atmospheric boundary layer, Chem. Phys. Chem., 8, 1137–1144, https://doi.org/10.1002/cphc.200700016, 2007.
Kleffmann, J. and Wiesen, P.: Technical Note: Quantification of interferences of wet chemical HONO LOPAP measurements under simulated polar conditions, Atmos. Chem. Phys., 8, 6813–6822, https://doi.org/10.5194/acp-8-6813-2008, 2008.
Kleffmann, J., Gavriloaiei, T., Hofzumahaus, A., Holland, F., Koppmann, R., Rupp, L., Schlosser, E., Siese, M., and Wahner, A.: Daytime formation of nitrous acid: A major source of OH radicals in a forest, Geophys. Res. Lett., 32, L05818, https://doi.org/10.1029/2005GL022524, 2005.
Kleffmann, J., Lörzer, J., Wiesen, P., Kern, C., Trick, S., Volkamer, R., Rodenas, M., and Wirtz, K.: Intercomparison of the DOAS and LOPAP techniques for the detection of nitrous acid (HONO), Atmos. Environ., 40, 3640–3652, https://doi.org/10.1016/j.atmosenv.2006.03.027, 2006.
Kunen, S. M., Lazrus, A. L., Kok, G. L., and Heikes, B. G.: Aqueous oxidation of SO2 by hydrogen peroxide, J. Geopyhys. Res.-Oceans, 88, 3671–3674, https://doi.org/10.1029/JC088iC06p03671, 1983.
Lelièvre, S., Bedjanian, Y., Laverdet, G., and Le Bras, G. : Heterogeneous Reaction of NO2 with Hydrocarbon Flame Soot, J. Phys. Chem. A, 108, 10807–10817, https://doi.org/10.1021/jp0469970, 2004.
Li, L., Hoffmann, M. R., and Colussi, A. J.: Role of Nitrogen Dioxide in the Production of Sulfate during Chinese Haze-Aerosol Episodes, Environ. Sci. Technol., 52, 2686–2693, https://doi.org/10.1021/acs.est.7b05222, 2018.
Li, X., Brauers, T., Häseler, R., Bohn, B., Fuchs, H., Hofzumahaus, A., Holland, F., Lou, S., Lu, K. D., Rohrer, F., Hu, M., Zeng, L. M., Zhang, Y. H., Garland, R. M., Su, H., Nowak, A., Wiedensohler, A., Takegawa, N., Shao, M., and Wahner, A.: Exploring the atmospheric chemistry of nitrous acid (HONO) at a rural site in Southern China, Atmos. Chem. Phys., 12, 1497–1513, https://doi.org/10.5194/acp-12-1497-2012, 2012.
Liu, M., Huang, X., Song, Y., Xu, T., Wang, S., Wu, Z., Hu, M., Zhang, L., Zhang, Q., Pan, Y., Liu, X., and Zhu, T.: Rapid SO2 emission reductions significantly increase tropospheric ammonia concentrations over the North China Plain, Atmos. Chem. Phys., 18, 17933–17943, https://doi.org/10.5194/acp-18-17933-2018, 2018.
Liu, Z., Wang, Y., Costabile, F., Amoroso, A., Zhao, C., Huey, L. G., Stickel, R., Liao, J., and Zhu, T.: Evidence of Aerosols as a Media for Rapid Daytime HONO Production over China, Environ. Sci. Technol., 48, 14386–14391, https://doi.org/10.1021/es504163z, 2014.
Lu, K., Zhang, Y., Su, H., Brauers, T., Chou, C. C., Hofzumahaus, A., Liu, S. C., Kita, K., Kondo, Y., Shao, M., Wahner, A., Wang, J., Wang, X., and Zhu, T.: Oxidant (O3 + NO2) production processes and formation regimes in Beijing, J. Geophys. Res.-Atmos., 115, D07303, https://doi.org/10.1029/2009JD012714, 2010.
Makkonen, U., Virkkula, A., Hellén, H., Hemmilä, M., Sund, J., Äijälä, M., Ehn, M., Junninen, H.,Keronen, P., and Petäjä, T.: Semi-continuous gas and inorganic aerosol measurements at a boreal forest site: seasonal and diurnal cycles of HONO and HNO3, Boreal Environ. Res., 19, 311–328, 2014.
Meng, Z., Xu, X., Lin, W., Ge, B., Xie, Y., Song, B., Jia, S., Zhang, R., Peng, W., Wang, Y., Cheng, H., Yang, W., and Zhao, H.: Role of ambient ammonia in particulate ammonium formation at a rural site in the North China Plain, Atmos. Chem. Phys., 18, 167–184, https://doi.org/10.5194/acp-18-167-2018, 2018.
Michoud, V., Colomb, A., Borbon, A., Miet, K., Beekmann, M., Camredon, M., Aumont, B., Perrier, S., Zapf, P., Siour, G., Ait-Helal, W., Afif, C., Kukui, A., Furger, M., Dupont, J. C., Haeffelin, M., and Doussin, J. F.: Study of the unknown HONO daytime source at a European suburban site during the MEGAPOLI summer and winter field campaigns, Atmos. Chem. Phys., 14, 2805–2822, https://doi.org/10.5194/acp-14-2805-2014, 2014.
Monge, M. E., D'Anna, B., Mazri, L., Giroir-Fendler, A., Ammann, M., Donaldson, D. J., and George, C.: Light changes the atmospheric reactivity of soot, P. Natl. Acad. Sci. USA, 107, 6605–6609, https://doi.org/10.1073/pnas.0908341107, 2010.
Muller, T., Dubois, R., Spindler, G., Bruggemann, E., Ackermann, R., Geyer, A., and Platt, U.: Measurements of nitrous acid by DOAS and diffusion denuders: a comparison, T. Ecol. Environ., 28, 345–349, 1999.
Nie, W., Ding, A. J., Xie, Y. N., Xu, Z., Mao, H., Kerminen, V.-M., Zheng, L. F., Qi, X. M., Huang, X., Yang, X.-Q., Sun, J. N., Herrmann, E., Petäjä, T., Kulmala, M., and Fu, C. B.: Influence of biomass burning plumes on HONO chemistry in eastern China, Atmos. Chem. Phys., 15, 1147–1159, https://doi.org/10.5194/acp-15-1147-2015, 2015.
Perner, D. and Platt, U.: Detection of nitrous acid in the atmosphere by differential optical absorption, Geophys. Res. Lett., 6, 917–920, https://doi.org/10.1029/GL006i012p00917, 1979.
Platt, U., Perner, D., Harris, G., Winer, A., and Pitts, J.: Observations of nitrous acid in an urban atmosphere by differential optical absorption, Nature, 285, 312–314, https://doi.org/10.1038/285312a0, 1980.
Ramsay, R., Di Marco, C. F., Heal, M. R., Twigg, M. M., Cowan, N., Jones, M. R., Leeson, S. R., Bloss, W. J., Kramer, L. J., Crilley, L., Sörgel, M., Andreae, M., and Nemitz, E.: Surface–atmosphere exchange of inorganic water-soluble gases and associated ions in bulk aerosol above agricultural grassland pre- and postfertilisation, Atmos. Chem. Phys., 18, 16953–16978, https://doi.org/10.5194/acp-18-16953-2018, 2018.
Rosman, K., Shimmo, M., Karlsson, A., Hansson, H.-C., Keronen, P., Allen, A., and Hoenninger, G.: Laboratory and field investigations of a new and simple design for the parallel plate denuder, Atmos. Environ., 35, 5301–5310, https://doi.org/10.1016/S1352-2310(01)00308-9, 2001.
Rumsey, I. C., Cowen, K. A., Walker, J. T., Kelly, T. J., Hanft, E. A., Mishoe, K., Rogers, C., Proost, R., Beachley, G. M., Lear, G., Frelink, T., and Otjes, R. P.: An assessment of the performance of the Monitor for AeRosols and GAses in ambient air (MARGA): a semi-continuous method for soluble compounds, Atmos. Chem. Phys., 14, 5639–5658, https://doi.org/10.5194/acp-14-5639-2014, 2014.
Seinfeld, J. H. and Pandis, S. N.: Atmospheric chemistry and physics: from air pollution to climate change, John Wiley & Sons, New York, 2016.
Sörgel, M., Regelin, E., Bozem, H., Diesch, J.-M., Drewnick, F., Fischer, H., Harder, H., Held, A., Hosaynali-Beygi, Z., Martinez, M., and Zetzsch, C.: Quantification of the unknown HONO daytime source and its relation to NO2, Atmos. Chem. Phys., 11, 10433–10447, https://doi.org/10.5194/acp-11-10433-2011, 2011.
Spindler, G., Hesper, J., Brüggemann, E., Dubois, R., Müller, T., and Herrmann, H.: Wet annular denuder measurements of nitrous acid: laboratory study of the artefact reaction of NO2 with S(IV) in aqueous solution and comparison with field measurements, Atmos. Environ., 37, 2643–2662, https://doi.org/10.1016/S1352-2310(03)00209-7, 2003.
Stieger, B., Spindler, G., Fahlbusch, B., Müller, K., Grüner, A., Poulain, L., Thöni, L., Seitler, E., Wallasch, M., and Herrmann, H.: Measurements of PM10 ions and trace gases with the online system MARGA at the research station Melpitz in Germany – A five-year study, J. Atmos. Chem., 75, 33–70, https://doi.org/10.1007/s10874-017-9361-0, 2018.
Su, H., Cheng, Y. F., Cheng, P., Zhang, Y. H., Dong, S., Zeng, L. M., Wang, X., Slanina, J., Shao, M., and Wiedensohler, A.: Observation of nighttime nitrous acid (HONO) formation at a non-urban site during PRIDE-PRD2004 in China, Atmos. Environ., 42, 6219–6232, https://doi.org/10.1016/j.atmosenv.2008.04.006, 2008a.
Su, H., Cheng, Y. F., Shao, M., Gao, D. F., Yu, Z. Y., Zeng, L. M., Slanina, J., Zhang, Y. H., and Wiedensohler, A.: Nitrous acid (HONO) and its daytime sources at a rural site during the 2004 PRIDE- PRD experiment in China, J. Geophys. Res., 113, D14312, https://doi.org/10.1029/2007JD009060, 2008b.
Trebs, I., Meixner, F. X., Slanina, J., Otjes, R., Jongejan, P., and Andreae, M. O.: Real-time measurements of ammonia, acidic trace gases and water-soluble inorganic aerosol species at a rural site in the Amazon Basin, Atmos. Chem. Phys., 4, 967–987, https://doi.org/10.5194/acp-4-967-2004, 2004.
VandenBoer, T. C., Markovic, M. Z., Sanders, J. E., Ren, X., Pusede, S. E., Browne, E. C., Cohen, R. C., Zhang, L., Thomas, J., Brune, W. H., and Murphy, J. G.: Evidence for a nitrous acid (HONO) reservoir at the ground surface in Bakersfield, CA, during CalNex 2010, J. Geophys. Res.-Atmos., 119, 9093–9106, https://doi.org/10.1002/2013JD020971, 2014.
Wu, T., Zha, Q., Chen, W., Xu, Z., Wang, T., and He, X.: Development and deployment of a cavity enhanced UV-LED spectrometer for measurements of atmospheric HONO and NO2 in Hong Kong, Atmos. Environ., 95, 544–551, https://doi.org/10.1016/j.atmosenv.2014.07.016, 2014.
Xie, Y., Ding, A., Nie, W., Mao, H., Qi, X., Huang, X., Xu, Z., Kerminen, V.-M., Petäjä, T., Chi, X., Virkkula, A., Boy, M., Xue, L., Guo, J., Sun, J., Yang, X., Kulmala, M., and Fu, C.: Enhanced sulfate formation by nitrogen dioxide: Implications from in situ observations at the SORPES station, J. Geophys. Res.-Atmos., 120, 12679–12694, https://doi.org/10.1002/2015JD023607, 2015.
Xu, Z., Wang, T., Xue, L. K., Louie, P. K. K., Luk, C. W. Y., Gao, J., Wang, S. L., Chai, F. H., and Wang, W. X. : Evaluating the uncertainties of thermal catalytic conversion in measuring atmospheric nitrogen dioxide at four differently polluted sites in China, Atmos. Environ., 76, 221–226, https://doi.org/10.1016/j.atmosenv.2012.09.043, 2013.
Xu, Z., Wang, T., Wu, J., Xue, L., Chan, J., Zha, Q., Zhou, S., Louie, P. K. K., and Luk, C. W. Y.: Nitrous acid (HONO) in a polluted subtropical atmosphere: Seasonal variability, direct vehicle emissions and heterogeneous production at ground surface, Atmos. Environ., 106, 100–109, https://doi.org/10.1016/j.atmosenv.2015.01.061, 2015.
Xue, C., Ye, C., Ma, Z., Liu, P., Zhang, Y., Zhang, C., Tang, K., Zhang, W., Zhao, X., Wang, Y., Song, M., Liu, J., Duan, J., Qin, M., Tong, S., Ge, M., and Mu, Y.: Development of stripping coil-ion chromatograph method and intercomparison with CEAS and LOPAP to measure atmospheric HONO, Sci. Total Environ., 646, 187–195, https://doi.org/10.1016/j.scitotenv.2018.07.244, 2019.
Yu, Y., Galle, B., Panday, A., Hodson, E., Prinn, R., and Wang, S.: Observations of high rates of NO2-HONO conversion in the nocturnal atmospheric boundary layer in Kathmandu, Nepal, Atmos. Chem. Phys., 9, 6401–6415, https://doi.org/10.5194/acp-9-6401-2009, 2009.
Zellweger, C., Ammann, M., Hofer, P., and Baltensperger, U.: NOy speciation with a combined wet effluent diffusion denuder – aerosol collector coupled to ion chromatography, Atmos. Environ., 33, 1131–1140, https://doi.org/10.1016/S1352-2310(98)00295-7, 1999.
Zhou, X.: An Overview of Measurement Techniques for Atmospheric Nitrous Acid, in: Disposal of Dangerous Chemicals in Urban Areas and Mega Cities, Springer, Dordrecht, 29–44, 2013.
Zhou, X., He, Y., Huang, G., Thornberry, T. D., Carroll, M. A., and Bertman, S. B.: Photochemical production of nitrous acid on glass sample manifold surface, Geophys. Res. Lett., 29, 21–24, https://doi.org/10.1029/2002GL015080, 2002.