the Creative Commons Attribution 4.0 License.
the Creative Commons Attribution 4.0 License.
 | 01 Feb 2019
Identification of gas-phase pyrolysis products in a prescribed fire: first detections using infrared spectroscopy for naphthalene, methyl nitrite, allene, acrolein and acetaldehyde
Nicole K. Scharko
Ashley M. Oeck
Russell G. Tonkyn
Stephen P. Baker
Emily N. Lincoln
Joey Chong
Bonni M. Corcoran
Gloria M. Burke
David R. Weise
Tanya L. Myers
Catherine A. Banach
David W. T. Griffith
Timothy J. Johnson
Volatile organic compounds (VOCs) are emitted from many sources, including wildland fire. VOCs have received heightened emphasis due to such gases' influential role in the atmosphere, as well as possible health effects. We have used extractive infrared (IR) spectroscopy on recent prescribed burns in longleaf pine stands and herein report the first detection of five compounds using this technique. The newly reported IR detections include naphthalene, methyl nitrite, allene, acrolein and acetaldehyde. We discuss the approaches used for detection, particularly the software methods needed to fit the analyte and multiple (interfering) spectral components within the selected spectral micro-window(s). We also discuss the method's detection limits and related parameters such as spectral resolution.
- Article
(2489 KB) - Full-text XML
- BibTeX
- EndNote


Wildland fire releases significant quantities of trace gases into the environment (Akagi et al., 2011; Andreae and Merlet, 2001; Crutzen et al., 1979; Yokelson et al., 2013; Andreae, 1991), and such gases can profoundly influence atmospheric chemistry (Crutzen and Andreae, 1990). In some parts of the world, wildfires are becoming more prevalent as well as increasing in impact (Turetsky et al., 2011; Miller et al., 2009). Additionally, prescribed burning is used as a preventive tool to reduce hazardous fuel buildups in an effort to reduce or eliminate the risk of such wildfires (Fernandes and Botelho, 2003). Understanding the products associated with the burning of biomass has received considerable attention since the emissions can markedly impact the atmosphere. Fourier-transform infrared (FTIR) spectroscopy is one technique that has been extensively used to identify and quantify gases emitted from burns, generally used in either an open-path configuration (Burling et al., 2010; Akagi et al., 2014; Selimovic et al., 2018; Stockwell et al., 2014) or as an extractive method (Burling et al., 2011; Akagi et al., 2013, 2014). Extractive systems typically use a long-path gas cell coupled to an FTIR instrument so as to increase the sensitivity. Such approaches have been quite successful; an increasing number of species continue to be identified and quantified due to the availability of reference gas-phase spectral libraries such as the Pacific Northwest National Laboratory (PNNL) spectral library (Sharpe et al., 2004) or the HITRAN database (Gordon et al., 2017). Such libraries contain absorption cross sections that make it possible to obtain quantitative results (i.e., mixing ratios) without the need for calibration gases. To the best of our knowledge, the actual list of biomass burning chemical species measured by FTIR has remained limited to ca. 36 compounds (Table 1); one goal of our research was to expand the list of chemical species to which infrared methods could be applied. All of the compounds detailed in this study have in fact been previously detected using other analytical methods (Akagi et al., 2013; Gilman et al., 2015; Karl et al., 2007; Koss et al., 2018; Yokelson et al., 2009) such as proton-transfer-reaction time-of-flight mass spectrometry (PTR-ToF) (Koss et al., 2018) or gas chromatography–mass spectrometry (GC-MS) (Gilman et al., 2015), but have not as yet been identified using FTIR in burning investigations. We wished to determine if such species' signatures are also found sequestered in the IR spectra associated with wildland fire and are thus amenable to IR detection. A second goal of the present study, whose biomass burning results are mostly detailed in a separate paper, was to better understand pyrolysis. Pyrolysis is the chemical transformation of material by heat in an oxygen-free or low-oxygen environment. Wildland fire consists of multiple processes: thermal decomposition (pyrolysis) of solid wildland fuels into gases, tars and char is followed by combustion (oxidation) of pyrolysis products resulting in flame gases and particulate matter in the smoke. The visible flame is sustained by fuel gases that are produced by pyrolysis (Ward and Hardy, 1991). These two processes (pyrolysis and combustion) are complementary given that heat released from the oxidation reactions facilitates further pyrolytic reactions allowing the fire to advance. Description and measurement (by any means) of the discrete pyrolysis products adjacent to the flames of a wildland fire have seldom been performed. Nonintrusive measurement of the pyrolysis gases in the near-flame environment is desirable from both scientific and safety perspectives.
The major gas-phase compounds emitted from wildland fires are H2O, CO2, CO and CH4 (Ward and Hardy, 1991), all of which are easily identified and quantified via FTIR spectroscopy. Lightweight hydrocarbons, oxygenated hydrocarbons, nitrogen and sulfur species are all minor products generated during burns (Yokelson et al., 1996; Lobert et al., 1991; Talbot et al., 1988). A host of more complex gases that can condense to form tar are also produced by pyrolysis of wildland fuels (Amini et al., 2019; Safdari et al., 2018). In a gas-phase IR spectrum of such species, however, peaks associated with the minor products are often obfuscated by more prominent features, such as those from CO2 or H2O, and can only be recognized in the residual of a multicomponent simulated fit once larger features have been removed. Using data from a recent field campaign to measure pyrolysis products carried out in a pine forest at Fort Jackson, South Carolina, we have analyzed some of the IR spectra in more detail to search for the signatures of compounds not found in Table 1. As a partial guide of species for which to investigate, we searched for those species detected in previous thermogravimetric FTIR (TG-FTIR) studies (Bassilakis et al., 2001; Taghizadeh et al., 2015). TG-FTIR experiments, however, are typically small scale and carried out in controlled environments (in contrast to ambient conditions of prescribed burns or large-scale laboratory burns) and thus represent burns with different oxidative capacities and combustion efficiencies (Fang et al., 2006; Yokelson et al., 1996; Akagi et al., 2014). In this study, we have chosen to examine field fire spectra for species that can be detected and quantified via IR spectroscopy both to add to the list of compounds and also to improve the characterization (and ultimately the detection limits) of the other species listed in Table 1. That is to say, fire IR spectra are very complex and contain many overlapping peaks; the success of spectral analysis depends on both the selected spectral region and the proper analysis of all compounds included in the fit to that domain. The chemometric results become more reliable as signatures of all relevant species are included in the fit.
Table 1Compounds previously detected in biomass burning studies using FTIR methods (Akagi et al., 2013, 2014; Alves et al., 2010; Burling et al., 2010, 2011; Goode et al., 1999, 2000; Karl et al., 2007; Christian et al., 2003, 2004; Selimovic et al., 2018; Stockwell et al., 2014; Yokelson et al., 1996, 1997, 2009; Hatch et al., 2017; Gilman et al., 2015).

a Used in the fit, but not analyzed. b Secondary components detected downwind.
2.1 Site description and sampling device
In early May 2018, seven prescribed fires were conducted in pine forests at U.S. Army Garrison Fort Jackson, adjacent to Columbia, South Carolina, at sites not far from previous smoke emission studies (Akagi et al., 2013; Weise et al., 2015). The forest overstory was primarily longleaf pine (Pinus palustris Mill.) and slash pine (Pinus elliottii Engelm.), while sparkleberry (Vaccinium arboreum Marshall) dominated the understory vegetation. During each burn, pyrolyzed gases emitted at the base of the flames before ignition were collected using an extractive probe and stored in 3 L SUMMA canisters. This approach was performed to selectively collect pyrolysis gases prior to the onset of combustion. Details regarding the site description and sampling apparatus will be provided in a separate paper.
2.2 FTIR spectrometer
Gases were analyzed in the laboratory (on the same day or the day following the fire) using an 8 m multipass (White) cell (Bruker Optics, A136/2-L) mounted in the sample compartment of a Bruker Tensor 37 FTIR. A total of 10 canisters were returned from the field to the laboratory and in turn connected to the gas cell via stainless steel tubing. The tubing and gas cell were both heated to 70 ∘C to prevent analyte adhesion to the inner surfaces. The White cell (White, 1942) was equipped with a pressure gauge and temperature probe, both of which were located on the gas outlet port; the thermocouple wire temperature probe extended into the White cell volume in order to more accurately measure the gas temperature. Prior to the start of the series of experiments, it was necessary to calibrate the path length of the variable path gas cell. Measurements conducted at room temperature of pure isopropyl alcohol (IPA, Sigma-Aldrich, 99.5 %) at 10 different pressures were collected and a Beer–Lambert law plot was created to determine the length. The IR region from 3515 to 3290 cm−1 was integrated (Fig. 1a) using OPUS v5.5 software, and the corresponding areas were plotted as a function of the IPA pressure (converted to parts per million at 101.3 kPa) multiplied by the PNNL reference (Sharpe et al., 2004) integration area for a 1 ppm meter IPA burden (Fig. 1b). The y intercept was set to zero. The slope is equal to the path length, which was determined to be 8.10±0.1 m (standard error of the regression).
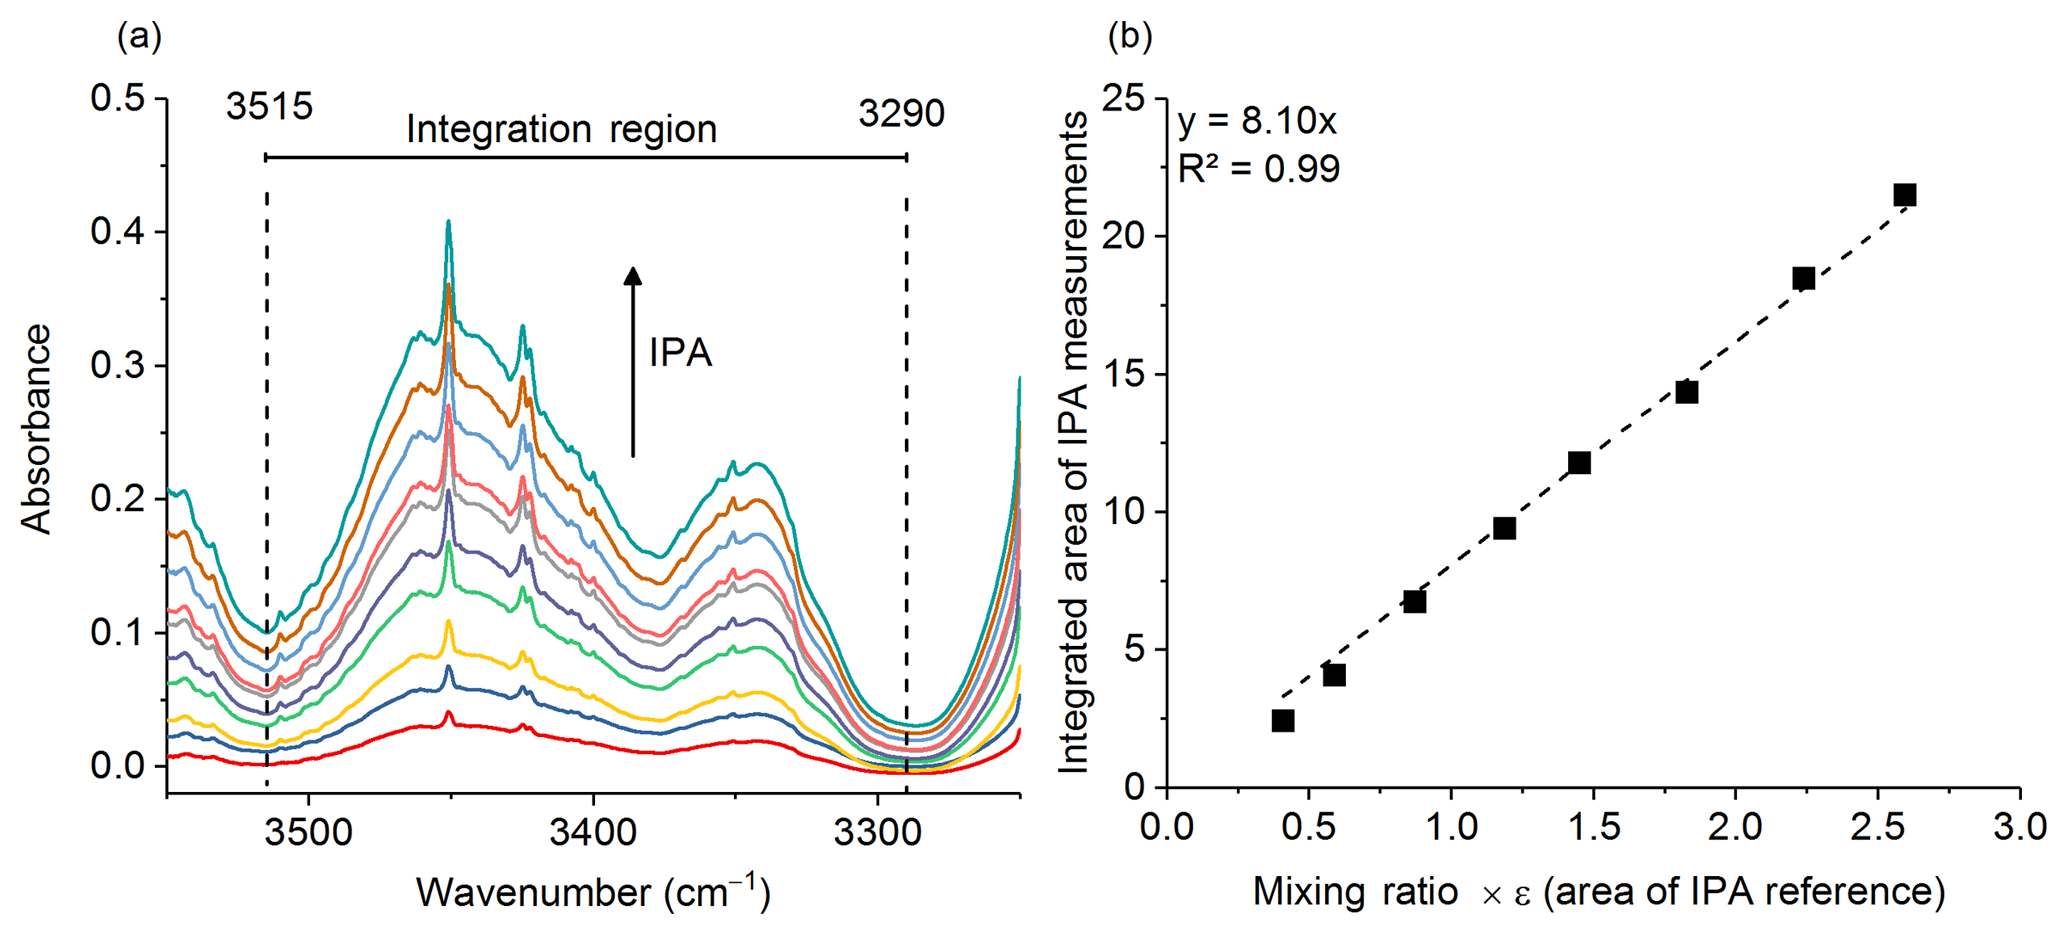
Figure 1(a) Multiple burden spectra of dry IPA for 10 measurements at varying pressures. The dashed lines represent the integration limits used for spectral integration. (b) Calibration plot with regression line for IPA measurements. The slope of the regression is the path length in meters.
The White cell contained analyte smoke for the sample spectrum measurement but was filled with ultra-high-purity nitrogen gas for the background spectrum measurement (Johnson et al., 2013). The FTIR interferometer, detector and sample compartments were purged with dry air from a dry-air generator. Inspection of a single-beam background spectrum showed no evidence of CO or CH4 contaminants and only negligible amounts of H2O and CO2. The Tensor 37 was equipped with a glow bar source, a KBr beam splitter and a broadband liquid nitrogen cooled mercury cadmium telluride (MCT) detector, providing spectral coverage from 7500 to 500 cm−1. The spectral resolution was 0.6 cm−1, and a 2 mm Jacquinot aperture was used. The acquisition mode was set to double-sided and forward–backward. For the Fourier transform, data were apodized with a Blackman–Harris three-term function using a zero-fill factor of 4 and phase corrected via the Mertz method (Mertz, 1967).
2.3 Quantitative spectral analysis
The program used for quantitative spectral analysis was MALT5 (Griffith, 2016), and it uses both broadband reference spectra from PNNL (Sharpe et al., 2004; Johnson et al., 2009, 2006; Lindenmaier et al., 2017; Profeta et al., 2011) and calculated absorption line intensities from HITRAN (Gordon et al., 2017) (in units of cm−1 (molec cm−2)−1) to iteratively fit a simulated spectrum to the measured spectrum by optimizing the fit so as to minimize the mean-squared residual, i.e., the difference between the measured and simulated spectra. Parameters such as path length, resolution, apodization, temperature, pressure, spectral domain and target compounds or overlapping compounds are all used as inputs to the spectral fit. The MALT analysis technique has previously been used in both open-path and extractive FTIR systems with active sources (Burling et al., 2010, 2011; Akagi et al., 2013, 2014). The program has also been used for ground-based solar FTIR measurements (Griffith et al., 2003).
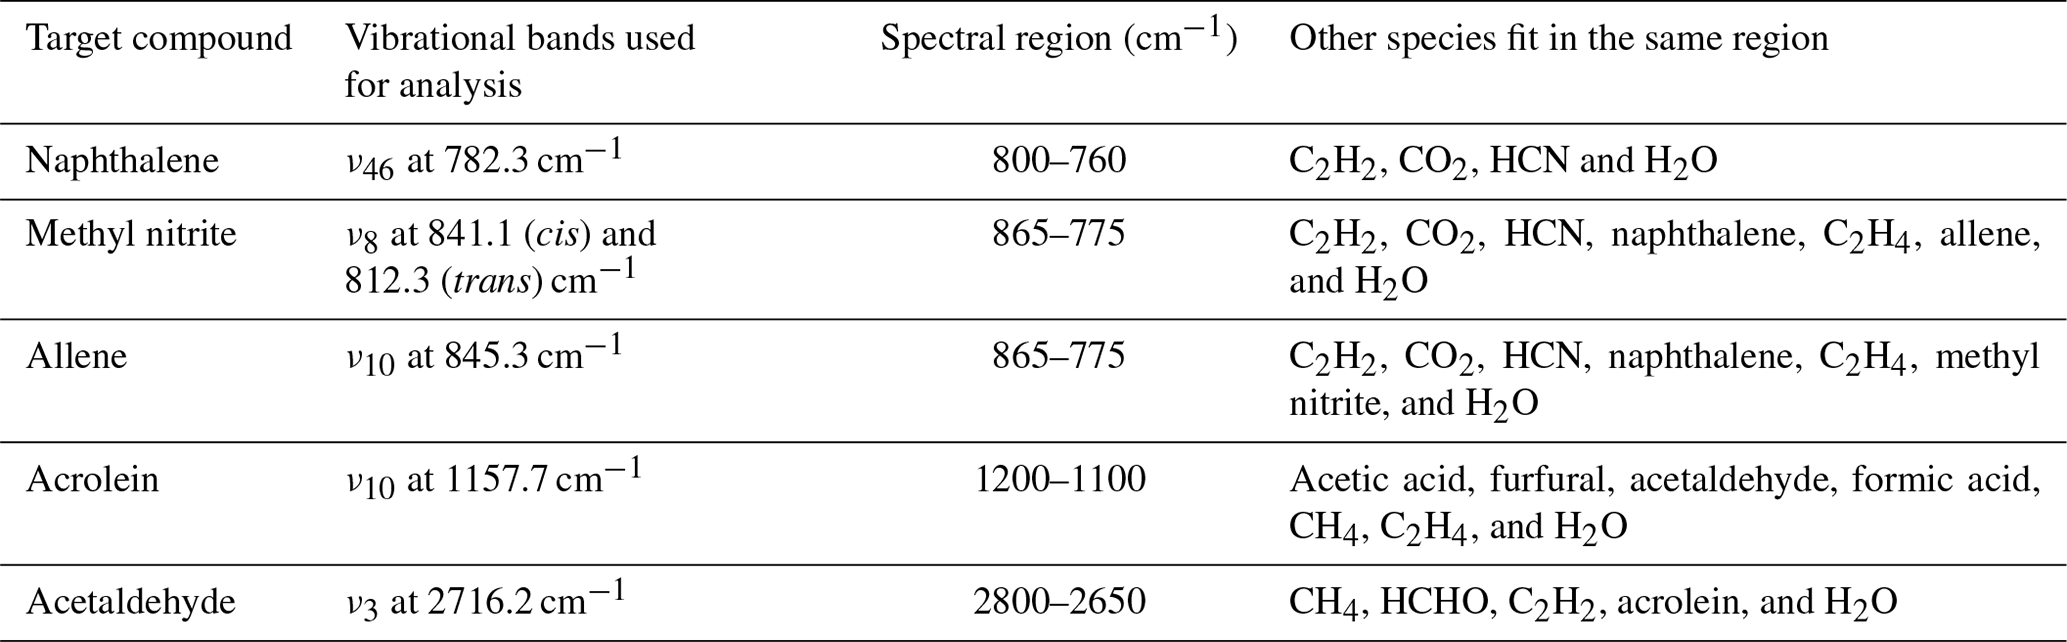
During the course of this study, MALT5 was used to identify multiple gas-phase species emitted during the burns and quantify the gas mixing ratios via IR spectroscopy, five of them for the first time. Part of the confirmation strategy is to process the experimental spectra both with and without the target compound present in the fit and then to visually inspect the corresponding residuals. Table 2 summarizes the IR-active vibrational mode used for each species in the spectral fit (typically the species' strongest band in the longwave infrared window) along with the spectral domain and a list of species with overlapping bands in that domain.
Table 2Gas-phase species identified via FTIR, vibrational assignments (Chakraborty et al., 2016; Ghosh and Günthard, 1981; Es-Sebbar et al., 2014; Lord and Venkateswarlu, 1952; Hamada et al., 1985; Hollenstein and Günthard, 1971), and spectral domains used for spectral fit and quantitation.
The PNNL database provides reference spectra measured at 5, 25 and 50 ∘C, all of which have been normalized to a number density of 296 K (∼23 ∘C) and 1 atm. While not perfectly optimal, the PNNL 50 ∘C reference spectra were used for evaluation to best match the band shapes of the 70 ∘C experimental data. The fit of the 50 ∘C PNNL reference data to the 70 ∘C experimental spectra is obviously less than ideal. To correctly fit to the experimental spectra, reference data at 70 ∘C are needed, but short of this knowledge of the temperature, partition function and individual line assignments are needed, and this changes for each line or set of lines for each molecule used in the fit. While MALT5 correctly accounts for gas temperature in all cases and for intensities of the HITRAN line-by-line data, it cannot do so for the PNNL reference data. At higher temperatures, there can be increases in population and intensity of the high-J lines with decreases for the lines originating with low J values. The effect is more pronounced for smaller, more rigid molecules (e.g., allene, acetaldehyde) than for the bands associated with larger, less rigid molecules of low symmetry. Preliminary estimates for the quality of fit estimate errors in the 2 % to 5 % range, though the value depends strongly on the species and which waveband is used for the fit.
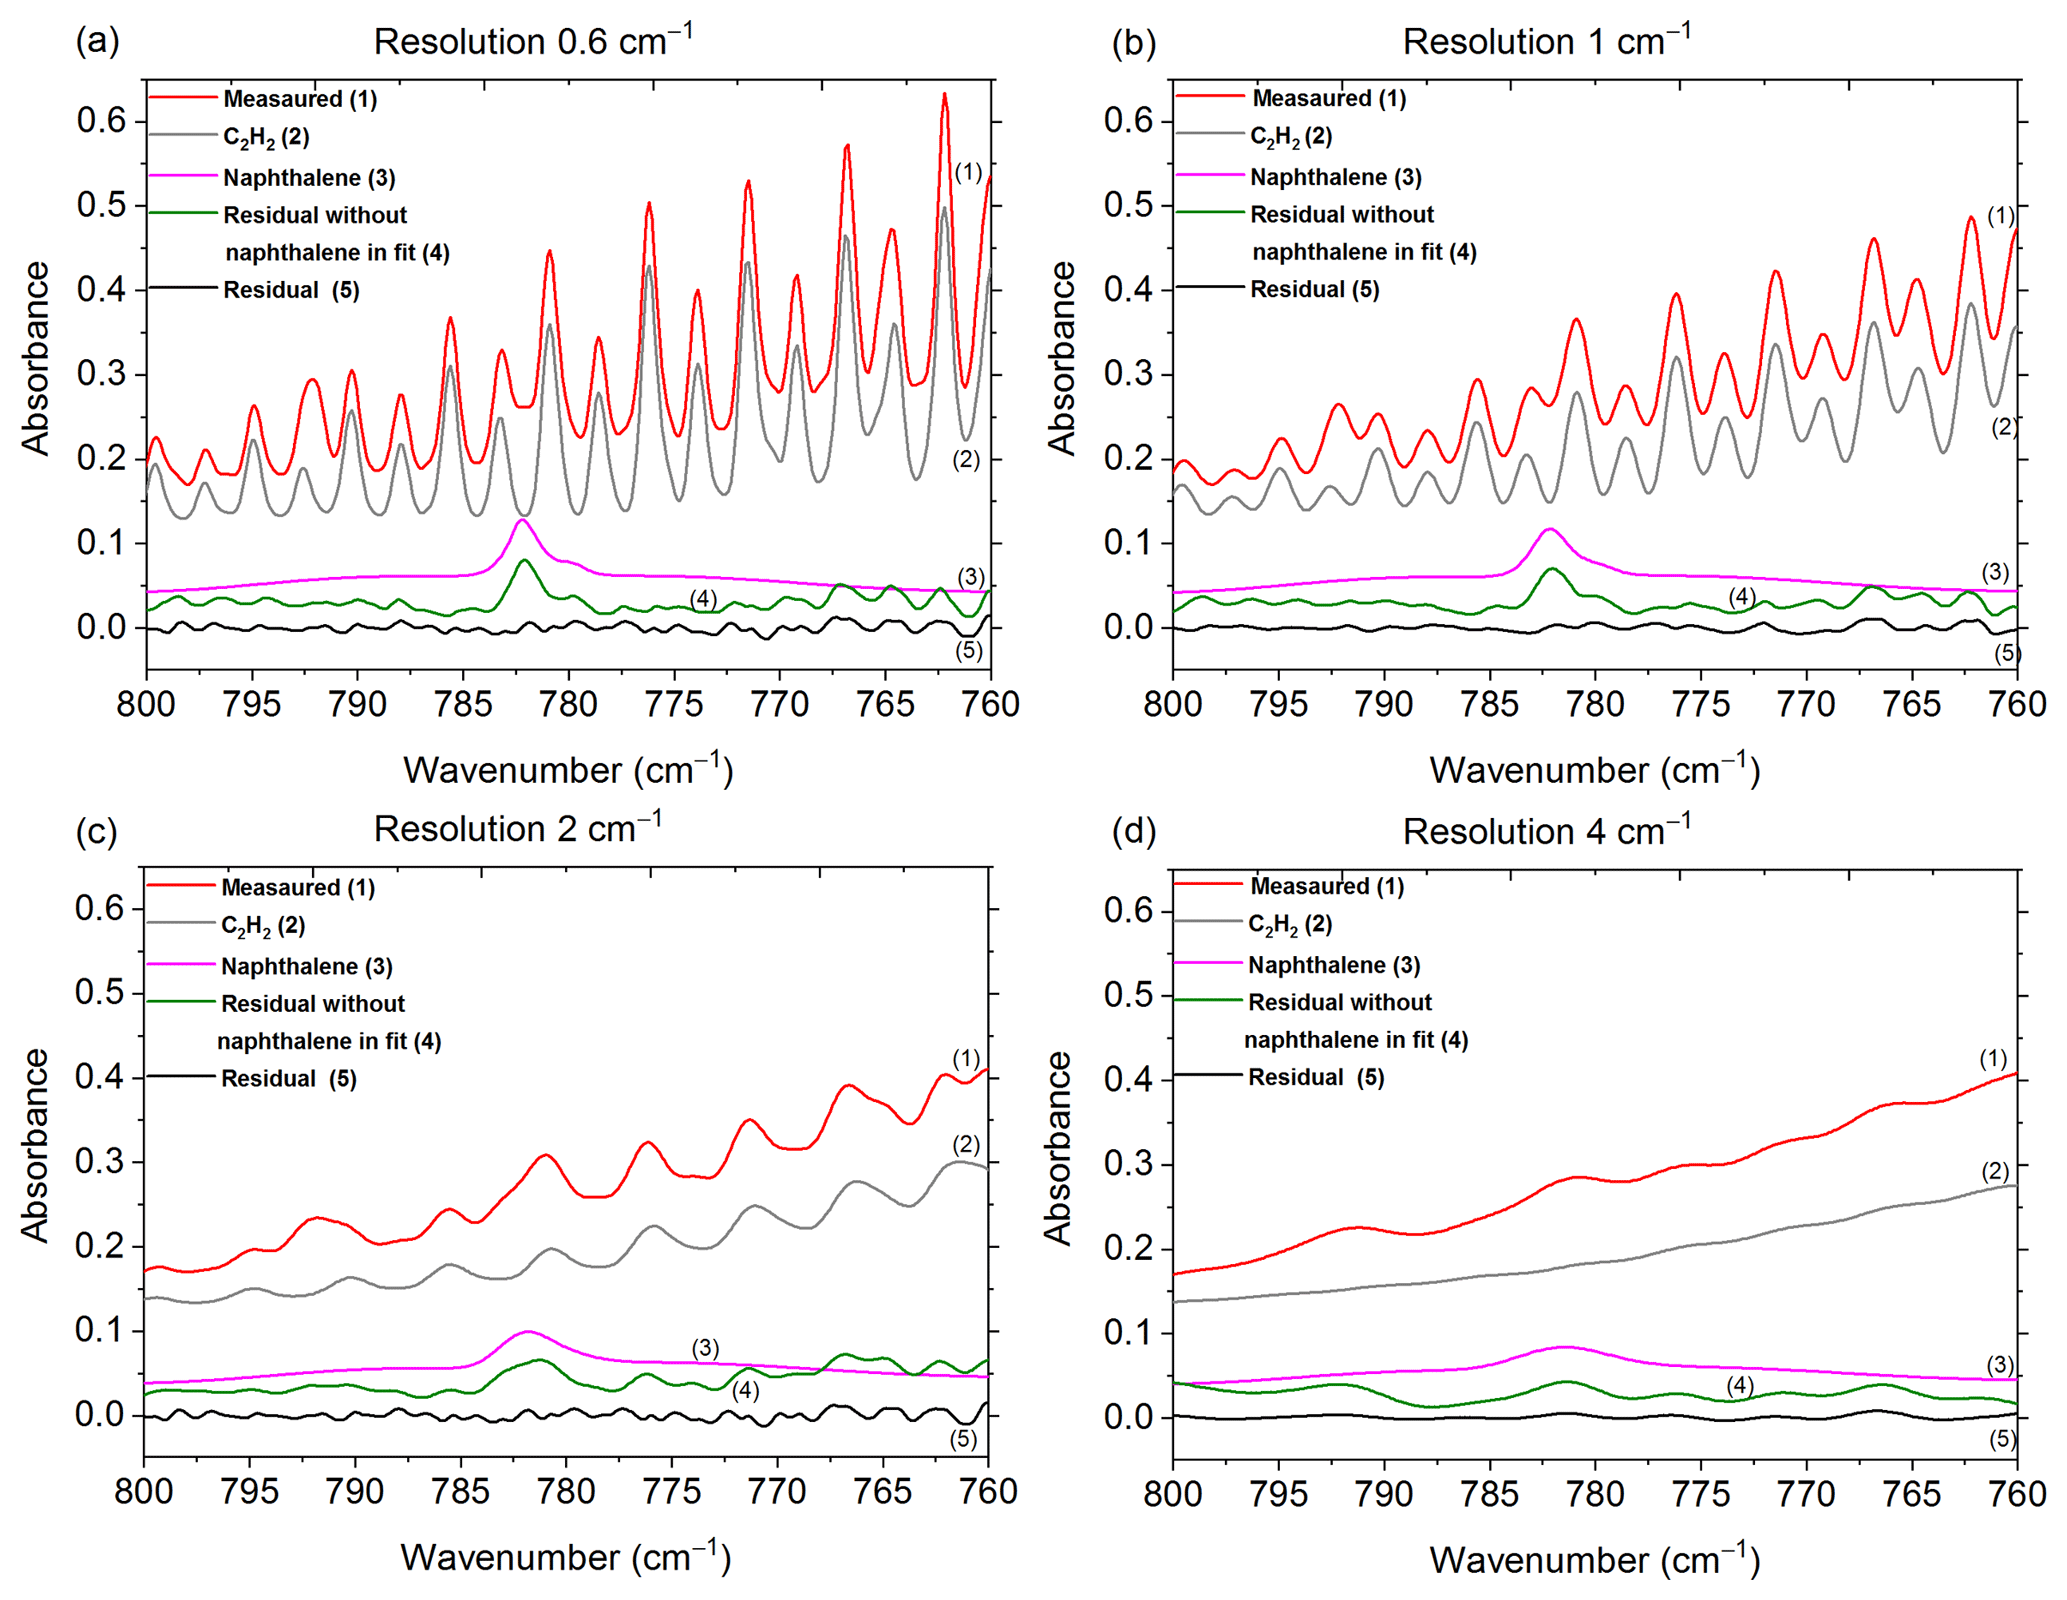
Figure 2Measured and scaled reference spectra for C2H2 and naphthalene, and corresponding residuals with and without naphthalene included in the fit for the (a) original spectrum collected at 0.6 cm−1 and the de-resolved spectra at (b) 1 cm−1, (c) 2 cm−1 and (d) 4 cm−1. The reference spectra for CO2, HCN and H2O are not shown (HCN was not included in the fit when the resolution was 4 cm−1; for resolutions 1, 2 and 4 cm−1, H2O was not included in the fit when naphthalene was removed from the fit). Spectra are offset for clarity.
2.4 Spectral resolution
As mentioned in Sect. 2.2, the spectral resolution was set to 0.6 cm−1, which is the highest resolution obtainable with this instrument. There are many benefits, but also a few disadvantages to using higher resolution (Herget and Brasher, 1979). Most importantly, higher resolution allows one to resolve the narrow bands of key analytes as well as interferents and discriminate the analyte signals from lines or bands of interferents. For example, the 782 cm−1 Q branch of naphthalene was distinguished from the adjacent absorption lines of C2H2 (naphthalene's IR bands and results are discussed in greater depth in Sect. 3.1). If a lower resolution were used, the deconvolution of naphthalene from C2H2 would have been compromised, perhaps unfeasible. To demonstrate, one of the experimental measurements collected at a resolution of 0.6 cm−1 was de-resolved to 1, 2 and 4 cm−1 using a Gaussian profile as seen in Fig. 2. Those spectra were processed by MALT5 to check for the presence of naphthalene. Figure 2 displays the measured spectra and the scaled reference spectra for C2H2 and naphthalene and the corresponding residuals with and without naphthalene included in the fit for the (a) original spectrum collected at 0.6 cm−1 and the de-resolved spectra at (b) 1 cm−1, (c) 2 cm−1 and (d) 4 cm−1. With the reference spectra for the original 0.6 cm−1 measurement and the 1 cm−1 de-resolved spectrum (Fig. 2a and b), the absorption lines for C2H2 and naphthalene overlap, but the 782 cm−1 feature from naphthalene is still slightly visible in the original spectra. The naphthalene peak appears clearly in the residuals when it is not included in the fitting process, but is removed from the residual when naphthalene is included in the fit (discussed further below). As the resolution is further reduced (Fig. 2c and d), however, the features broaden, and the distinction of the naphthalene peak from C2H2 and other minor components (i.e., CO2, HCN, H2O; spectra not shown) is compromised. The specificity among compounds is lost and confidence in the identification and quantification of the target species, particularly for the weaker absorbers, diminishes as the resolution decreases. The well-known benefits of using a lower resolution are that spectra can be acquired more quickly at an improved signal-to-noise ratio. For the present measurements, 0.6 cm−1 was deemed an appropriate resolution.
2.5 Signal-to-residual detection limits
In IR spectroscopy, detection limits often represent the minimum amount of analyte that may be detected and are often reported as 2 to 3 times the noise level (Griffith and Jamie, 2006). The detection limit values presented in this paper are not minimal signal-to-noise limits in the sense of a minimal spectral signal against a background of purely stochastic noise sources. In such cases, the noise sources are typically of comparable or higher frequencies than the signal (Johnson et al., 1991). Rather, the current limits represent average detection limits for a spectral residual derived from a convoluted spectrum arising from a gas mixture of differing and fluctuating chemical composition. The residuals are due to a least-squares fit of (fluctuations in) many complex features arising from numerous chemicals. That is to say, the residual is not due to just random instrumental noise but due to spectral features that can arise in the spectra, e.g., imperfectly subtracted features from strong absorbers or unidentified absorbers. For that reason, we report signal-to-residual rather than signal-to-noise detection limits. The detection limits for each compound in this study were thus derived using a value of 3 times the root-mean-square (RMS) value of the residual calculated over the corresponding frequency range (e.g., 800–760 cm−1 was used for naphthalene). The peak-to-peak noise is more sensitive to fluctuations in the fit with levels typically 4 to 5× the RMS noise (Griffith and Jamie, 2006). For the present data, however, the peak-to-peak values ranged from 5 to 10× the RMS noise, thus suggesting the peak-to-peak values tend to overstate the tractable noise level, i.e., understate the detection limit. The reported detection limits are thus presumably higher than what would be estimated with an FTIR in clean air conditions (i.e., only the analyte and dry air). Based on experience, the limits are typically far higher than what can be obtained with IR laser sensors where the intrinsically narrow laser line widths allow for the probing of individual rotational–vibrational lines without drawing in overlapping spectral lines to a congested spectral fit (Taubman et al., 2004; Phillips et al., 2014; Wagner et al., 2011). While typically far more sensitive, such laser measurements can only analyze for one or a few species at a time, as opposed to the 30+ species seen by the broadband FTIR measurements.
When modeling the burning process (Byram, 1959), complete combustion of 1 kg of dry wood produces 1.82 kg of CO2 and 0.32 kg of H2O for a total mass of products of 2.14 kg. Incomplete combustion will yield additional products and less CO2 and H2O while combustion of wet fuels (Byram, 1959) increases the amount of H2O released. For infrared analysis of such smoke, much of the challenge arises due not only to the large mole fractions of H2O and CO2, but also to the fact that both H2O vapor and CO2 have strong features in the mid-IR that can clutter the spectrum, rendering certain spectral regions unusable. For burning and other atmospheric studies, ideal compounds for detection via IR spectroscopy will thus have strong absorption coefficients that do not overlap with the fundamental bands of H2O or CO2, i.e., are in a spectral window or microwindow (Griffith, 1996; Esler et al., 2000; Smith et al., 2011) free of strong interferences. Here, we consider five such compounds emitted during these prescribed burns, but which had heretofore not been reported as being detected by FTIR. Table 3 presents the range of measured mixing ratios for the target compounds along with averaged detection limits for 10 measurements collected during the prescribed burns. Individual compounds are discussed in turn regarding their formation mechanism(s) as well as their detectable IR features and spectral confirmation for this study. Lastly, the results are briefly compared with literature values using emission ratios (mixing ratios of analyte to excess CO).
Table 3Calculated mixing ratios for 10 canister FTIR measurements along with average estimated residual detection limits for the target compounds derived using 3 times the root mean square of the residual in very congested spectra. Error bars represent standard error of the mean.
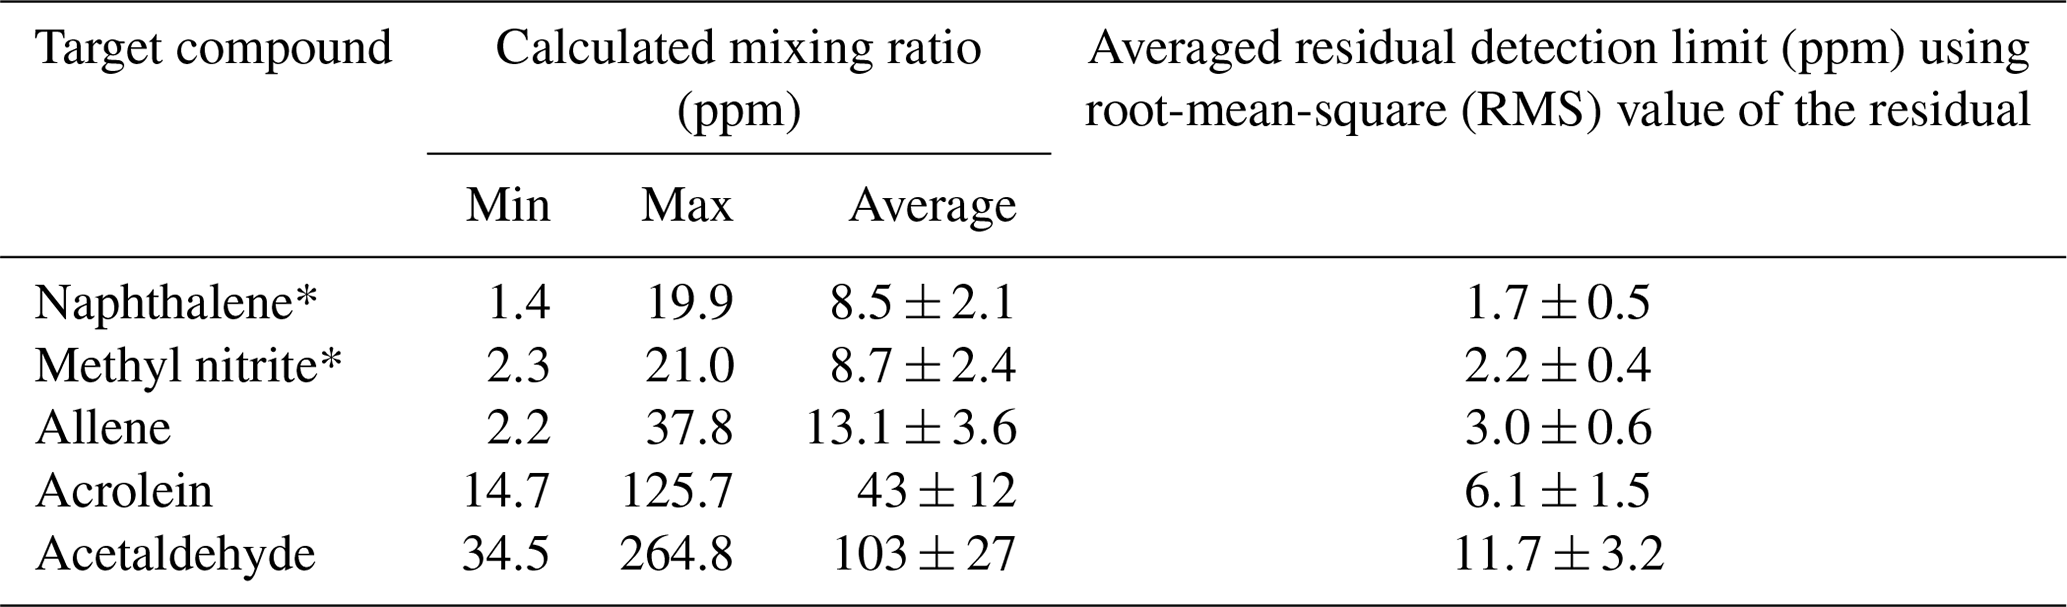
* One measurement was below the detection limit.
3.1 Naphthalene
Naphthalene (C10H8) is a polycyclic aromatic hydrocarbon (PAH) that is emitted from certain industrial processes as well as from the combustion of gasoline and oil (Jia and Batterman, 2010). It is a condensable hydrocarbon also generated by biomass pyrolysis (Liu et al., 2017). There are a number of pyrolysis formation routes (Williams and Williams, 1999; Liu et al., 2017; Lu and Mulholland, 2004; Fairburn et al., 1990; Richter and Howard, 2000). One proposed mechanism is the generation of single-ring aromatic compounds such as benzene, toluene and styrene via a Diels–Alder reaction of alkenes; the single-ring aromatic compound then combines with alkenes to form double-ring PAHs, such as naphthalene (Fairburn et al., 1990). Naphthalene may even undergo subsequent reactions to form still larger polyaromatics (Fairburn et al., 1990; Richter and Howard, 2000). Naphthalene has been detected (via GC-MS) in tars that were condensed from gas-phase pyrolysis products of both live and dead southeastern fuels, such as live oak (Quercus virginiana) and swamp bay (Persea palustris) (Safdari et al., 2018). It has also been detected (Koss et al., 2018; Hosseini et al., 2014; Aurell et al., 2017) in the gas phase in laboratory burning experiments. The detection of gas-phase naphthalene from wildland fire emissions is thus not surprising, but this is the first report of its identification via IR spectroscopy. The best spectral feature for identification and quantification is the ν46 IR mode near 782.3 cm−1, which corresponds to the H–C–C out-of-plane bend (Chakraborty et al., 2016). There are other bands at 3067.7 and 3058.0 cm−1 previously assigned to ν29 and ν17, respectively (Chakraborty et al., 2016). Both of these modes have smaller absorption coefficients compared to ν46, however, and are located in the C–H stretching region, which is common to nearly all hydrocarbons and thus provides less specificity.
Figure 3 shows a prescribed burn spectrum in the region from 800 to 760 cm−1. The primary spectral signatures in this plot are those of R-branch rotational–vibrational lines associated with the ν5 fundamental of C2H2 (Kabbadj et al., 1991), but there are also absorptions due to CO2, HCN, H2O (individual spectral contributions not shown) and naphthalene. When all of the spectral components except for naphthalene are included in the fitting process, the residual (green trace, no. 4) displays a prominent feature at 782.3 cm−1, which we ascribe to naphthalene. When naphthalene is included in the fit, the feature in question is not seen as demonstrated by the black trace (no. 5) of Fig. 3. Including naphthalene in the analysis clearly improves the fit, which consequently improves the derived values for the other species as well. This observation is consistent in the spectral analyses for all target compounds discussed below.
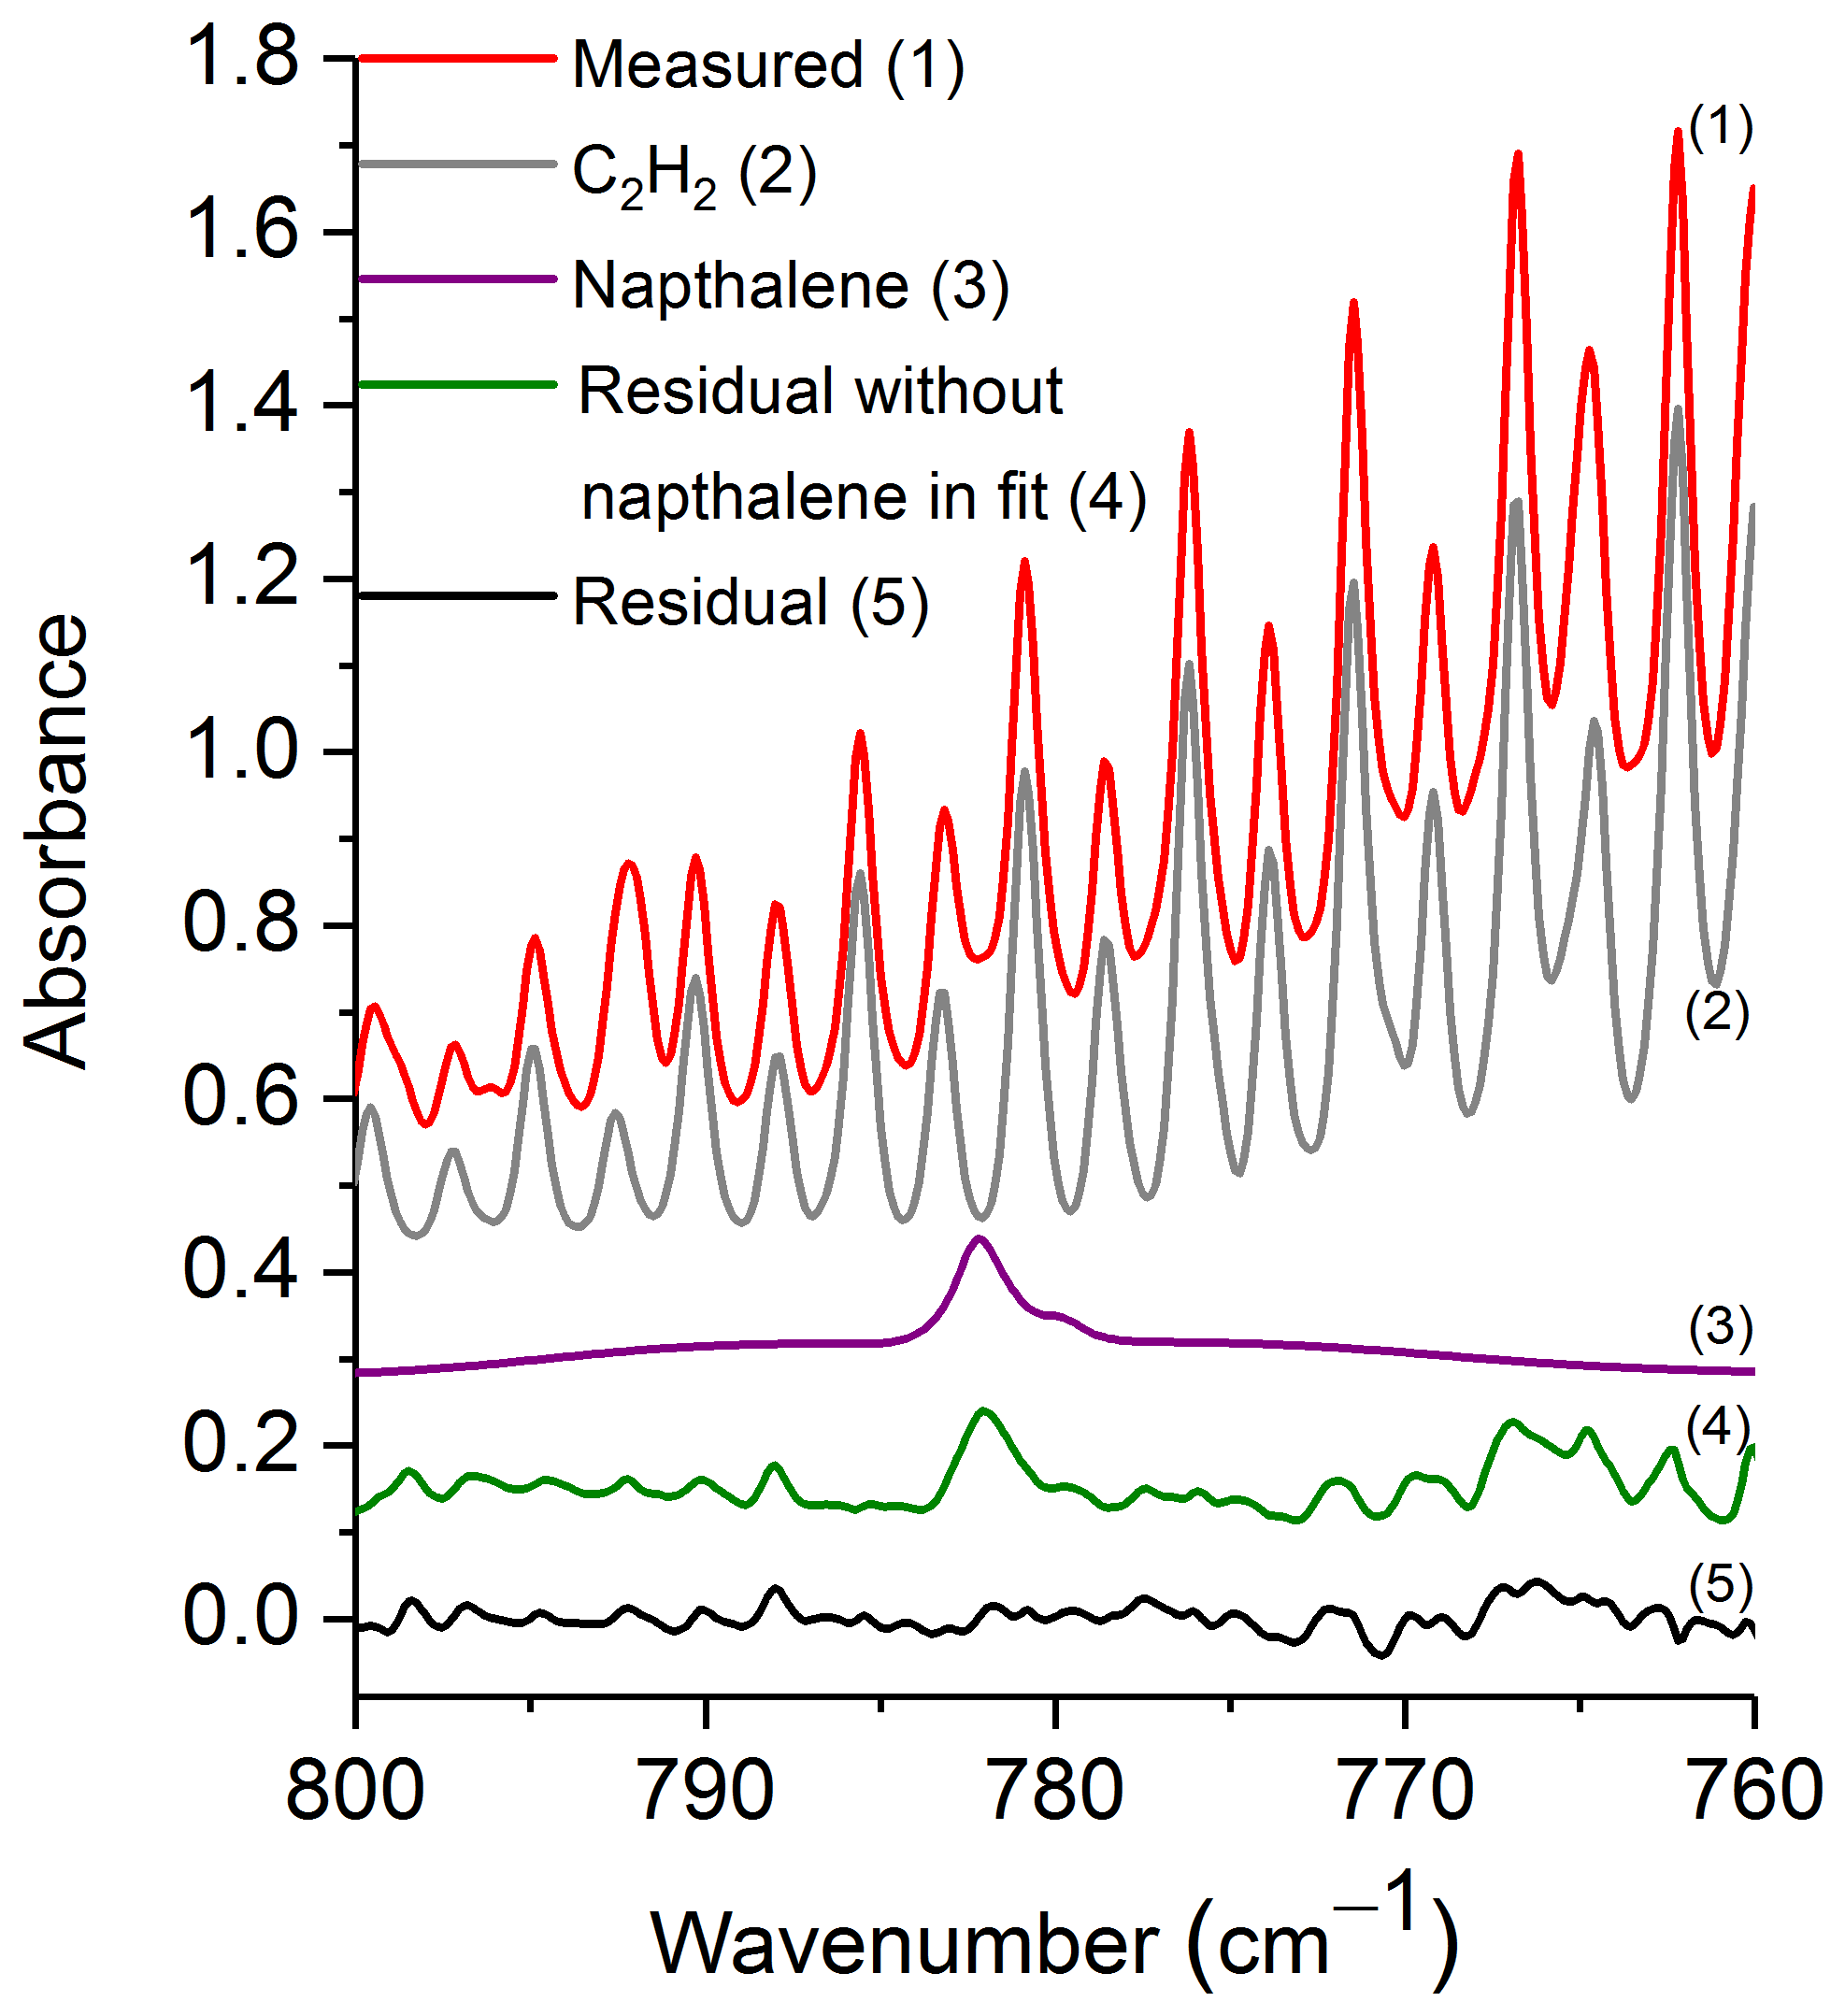
Figure 3Measured spectrum, scaled reference spectra for C2H2 and naphthalene, and residuals with and without naphthalene included in the fit. For clarity, the spectral contributions for CO2, HCN and H2O are not shown. All spectra are at 0.6 cm−1 resolution and have been offset. The calculated mixing ratio of naphthalene in this measured spectrum is 16.4 ppm.
Table 3 displays the range of measured mixing ratios for naphthalene along with averaged detection limits for 9 of the 10 measurements. In the measurements, naphthalene's mixing ratios ranged from 1.4 to 19.9 ppm, and the averaged RMS-derived detection limit was 1.7±0.5 ppm; different detection limits were observed for each spectrum. One of the measurements had a mixing ratio of 2.9 ppm, yet its corresponding RMS-derived detection limit was 3.7 ppm, and is thus below the estimated detection limit.
3.2 Methyl nitrite
A second compound detected for the first time in wildland fire IR spectra was methyl nitrite (CH3ON=O). Methyl nitrite has previously been observed in aged cigarette smoke (Schmeltz and Hoffmann, 1977) and the exhaust of engines fueled by methanol–diesel blends (Jonsson and Bertilsson, 1982). It has also been observed as a minor product for the thermal decomposition of both nitrate esters (Boschan et al., 1955) and isopropyl nitrate at low temperatures and pressures (Griffiths et al., 1975). Methyl nitrite has moreover been detected in wildland fire emissions by GC-MS (Gilman et al., 2015). Other nitrogen-containing organic compounds such as acetonitrile (CH3CN) emitted from burns have been previously correlated to the fuel N content. However, methyl nitrite and another oxygenated nitrogen organic compound, isocyanic acid (HNCO), did not show any significant dependency on fuel N content (Coggon et al., 2016). It has been suggested that methyl nitrite is not only a minor direct product of combustion (Finlayson-Pitts et al., 1992), but in addition is generated in situ by the secondary reaction of methanol (CH3OH) with nitrogen dioxide (NO2).
We also note that methyl nitrite is an oxidizing agent and is used as a rocket propellant. It is thus plausible that the methyl nitrite detected in the present study was not a product of the fire, but emanated from munitions used in training at Fort Jackson. However, while the records of the munitions used at all base sites were not complete, a survey of these records did not indicate the use of methyl nitrite in any munitions at the Fort Jackson plots where the present burn samples were collected.
With regards to the IR spectra, methyl nitrite exists in equilibrium as a mixture of two conformers – cis and trans; at room temperature (25 ∘C) it is estimated as 58 % cis and 42 % trans (Bodenbinder et al., 1994). The PNNL reference spectrum for methyl nitrite was created using a nascent mixture of cis and trans, and the single spectrum contains features from both conformers (Sharpe et al., 2004). We were able to use the same band associated with both conformers, namely the ν8 band, which is at 841.1 cm−1 for the cis conformer and at 812.4 cm−1 for the trans conformer (Ghosh and Günthard, 1981). The ν8 mode is associated with the N–O stretch and is very strong for both conformers (Ghosh and Günthard, 1981). We note that methyl nitrite also has very strong bands at 627.8 cm−1 (cis) for ν9 ONO bending, as well as at 1620.1 cm−1 (cis) and 1677.4 cm−1 (trans) due to the ν3 N=O stretch (Ghosh and Günthard, 1981). These bands, however, are of lesser utility for IR detection: The ν9 peak is masked by CO2 bending mode lines, and the ν3 peak is obfuscated by the H2O bending mode lines.
The spectral region used for evaluation was 865–775 cm−1, which contains the ν8 band for both the cis and trans conformers (Ghosh and Günthard, 1981). Figure 4 shows the experimental spectrum from the prescribed burn along with scaled reference spectra for the two major compounds used in the fit: C2H2 and methyl nitrite. While important, other minor compounds, such as CO2, HCN, naphthalene, C2H4, allene and H2O, were also included in the analysis, but their spectral contributions are not plotted. Additionally, Fig. 4 displays the residuals both when methyl nitrite was included in the fitting process and when it was excluded. Upon inspection of the residual spectrum where it was excluded (green trace, no. 4), it is clear that both the cis and trans features from ν8 are present, and this confirms methyl nitrite in the pyrolysis smoke.
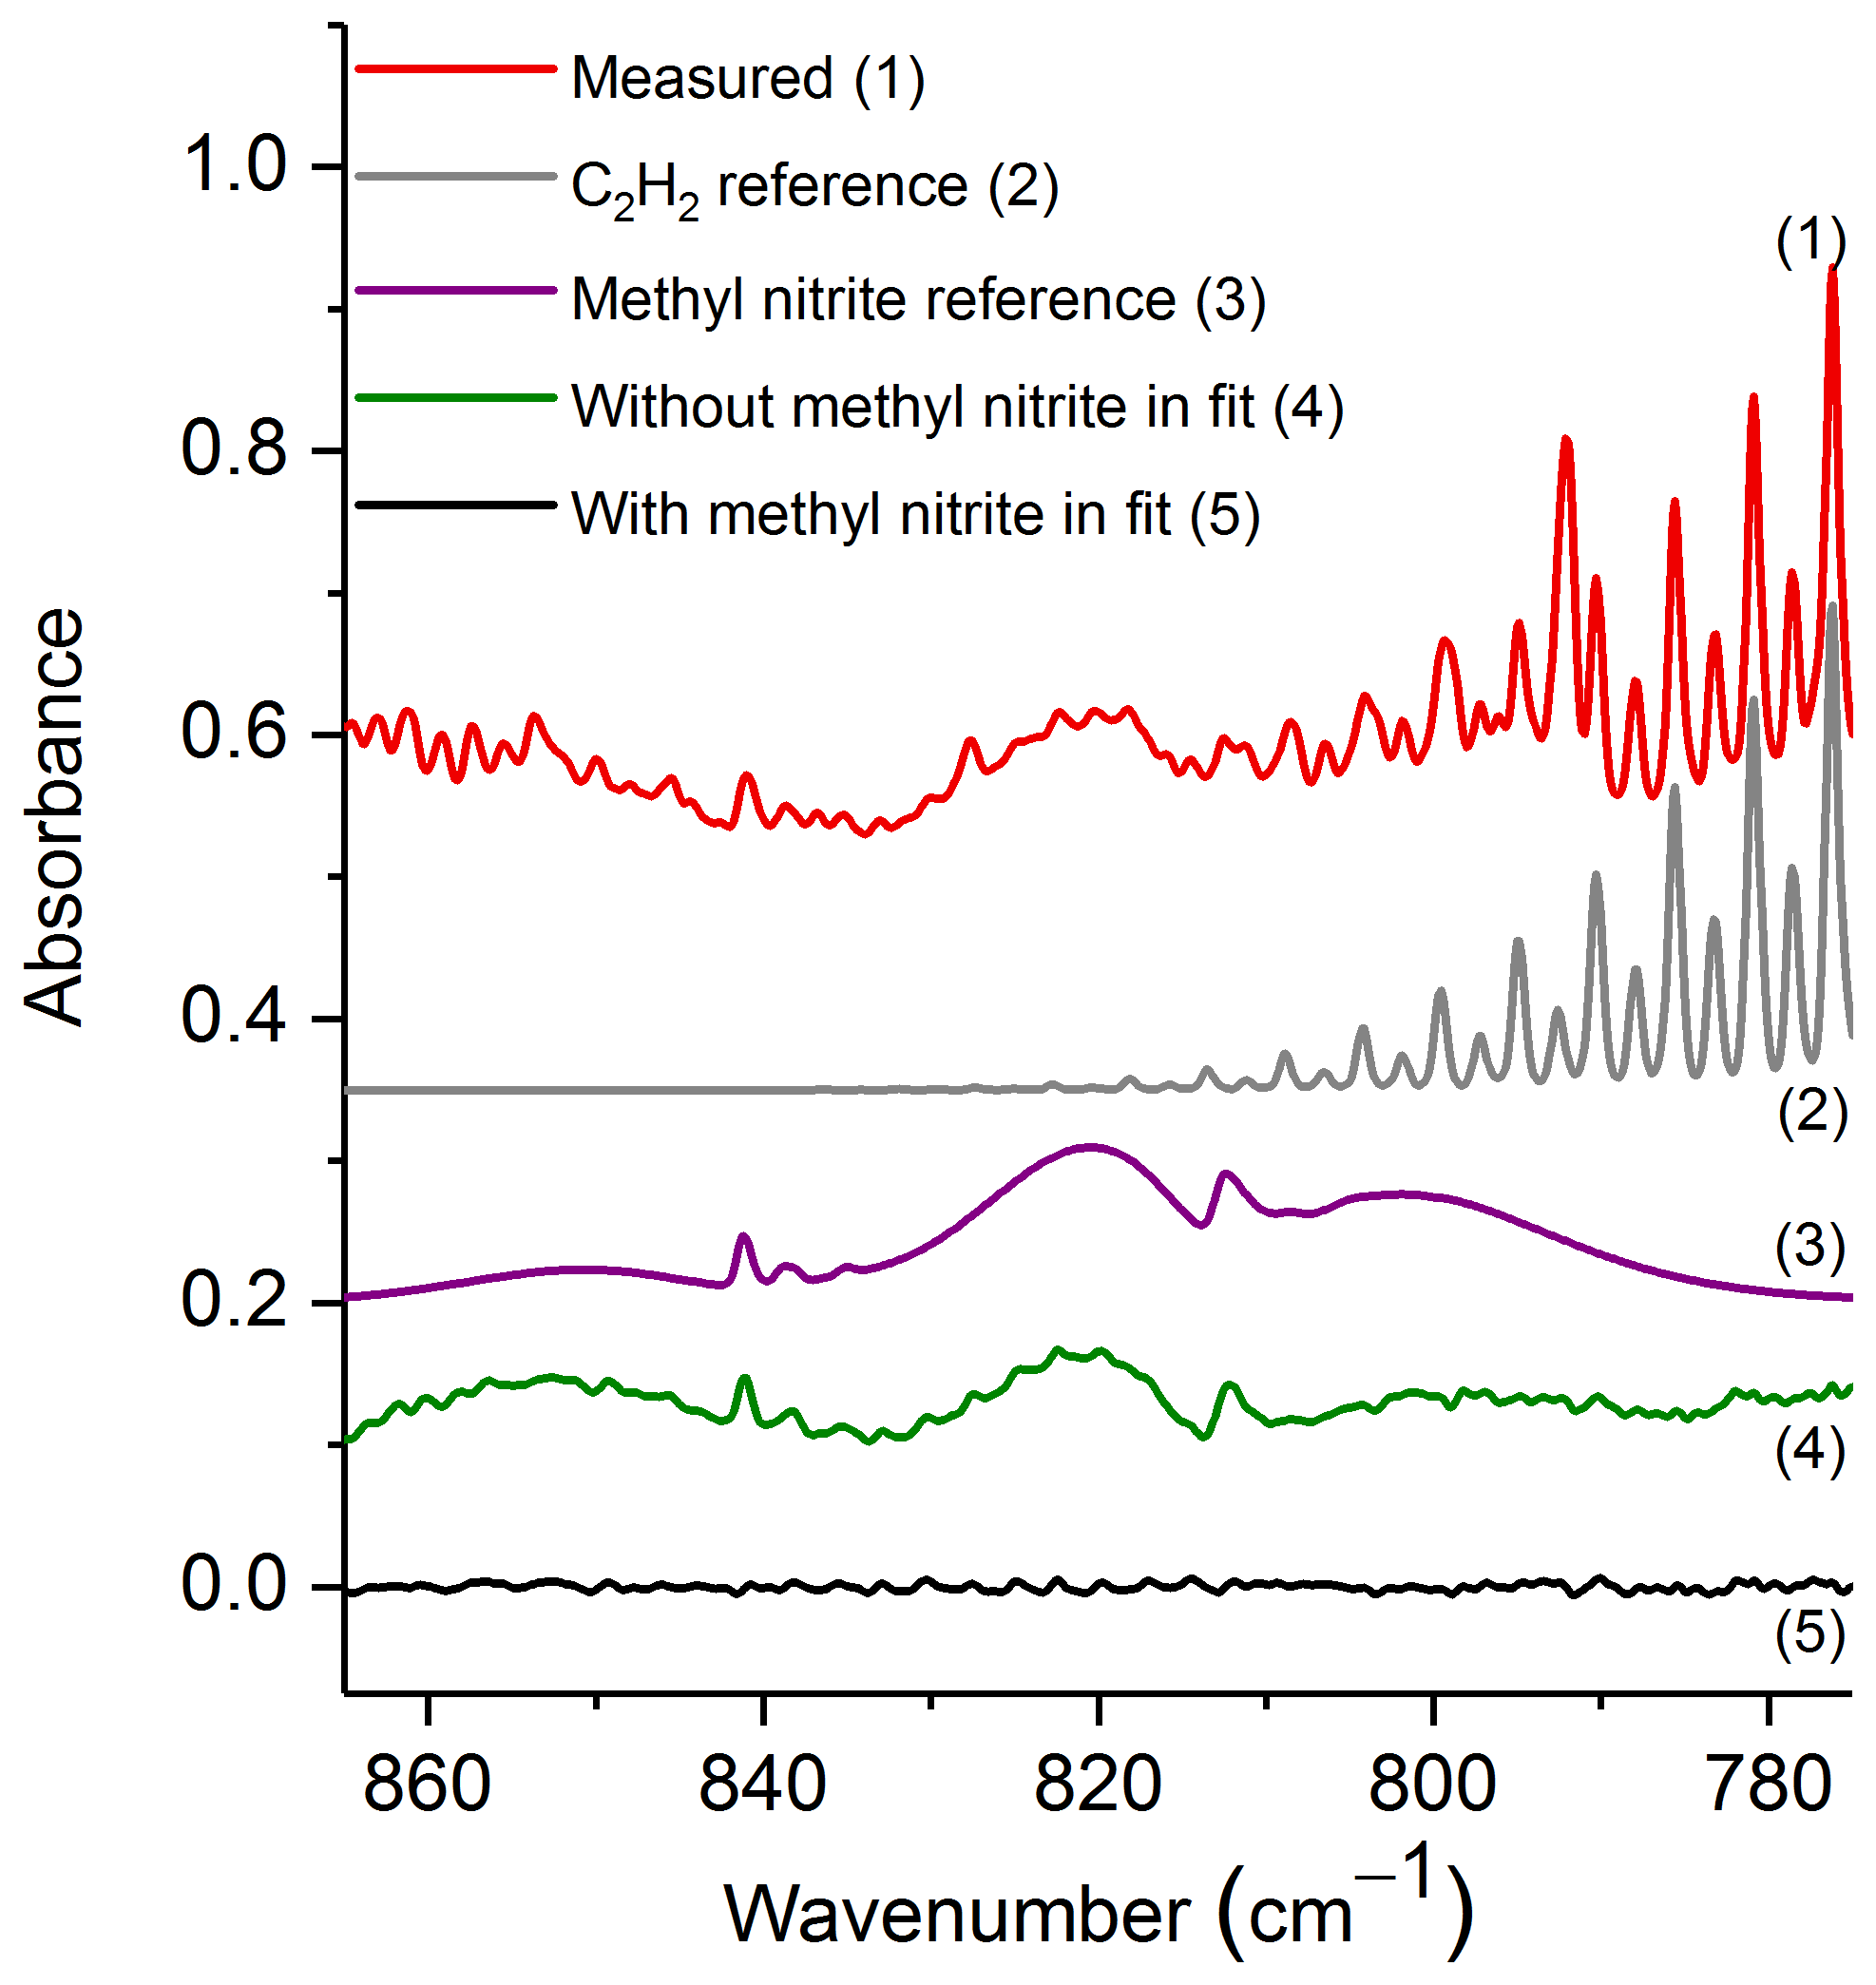
Figure 4Measured experimental spectrum and the individual spectral contributions for the major components (C2H2 and methyl nitrite) and residuals with and without methyl nitrite included in the fit. For clarity, the spectral contributions for CO2, HCN, naphthalene, C2H4, allene and H2O are not shown. All spectra are at 0.6 cm−1 resolution and have been offset for clarity. The calculated mixing ratio of methyl nitrite in this measured spectrum is 21.0 ppm.
The mixing ratio and RMS-derived detection limit for methyl nitrite for the displayed experimental spectrum in Fig. 4 are 21.0 and 1.4 ppm, respectively. The range for mixing ratios and averaged detection limits for methyl nitrite are summarized in Table 3. Methyl nitrite was detected with confidence in 9 of the 10 measurements; only one of the measurements was below the RMS-derived detection limit.
3.3 Allene
Allene (1,2-propadiene, ) is of high symmetry (D2d) and has the two methylene groups with their H–C–H planes at right angles to each other (Lord and Venkateswarlu, 1952). The compound has previously been detected in biomass burning grab samples using GC (Akagi et al., 2013). Allene is a proposed precursor in the burning process that contributes to the formation of both aromatic compounds and soot (Frenklach et al., 1983, 1988). Lifshitz et al. (1975) have observed (at temperatures ranging from 757 to 847 ∘C) that the structural isomerization of allene and propyne (–C≡CH) will take place via a unimolecular reaction faster than the decomposition reaction (Lifshitz et al., 1975). Additionally, these same authors investigated the pyrolysis of allene and propyne and observed that C2H4 was generated from allene while CH4 and C2H2 were mainly formed from propyne (Lifshitz et al., 1976). Unfortunately, the strongest IR band for propyne (near 634 cm−1) is obscured by CO2 bending mode lines. Due to the interferences, we cannot with confidence identify propyne in the measurements; we can, however, detect allene. In the mid-IR, allene has several strong rotational–vibrational lines near 845 cm−1 associated with the sub-bands of the perpendicular band ν10, which is due to CH2 rocking (Lord and Venkateswarlu, 1952). Additionally, allene has a moderately strong band at 1958.6 cm−1 due to the ν6 C–C stretching (Lord and Venkateswarlu, 1952). However, the ν6 band is not useful for detection due to interference from the H2O bending mode lines.
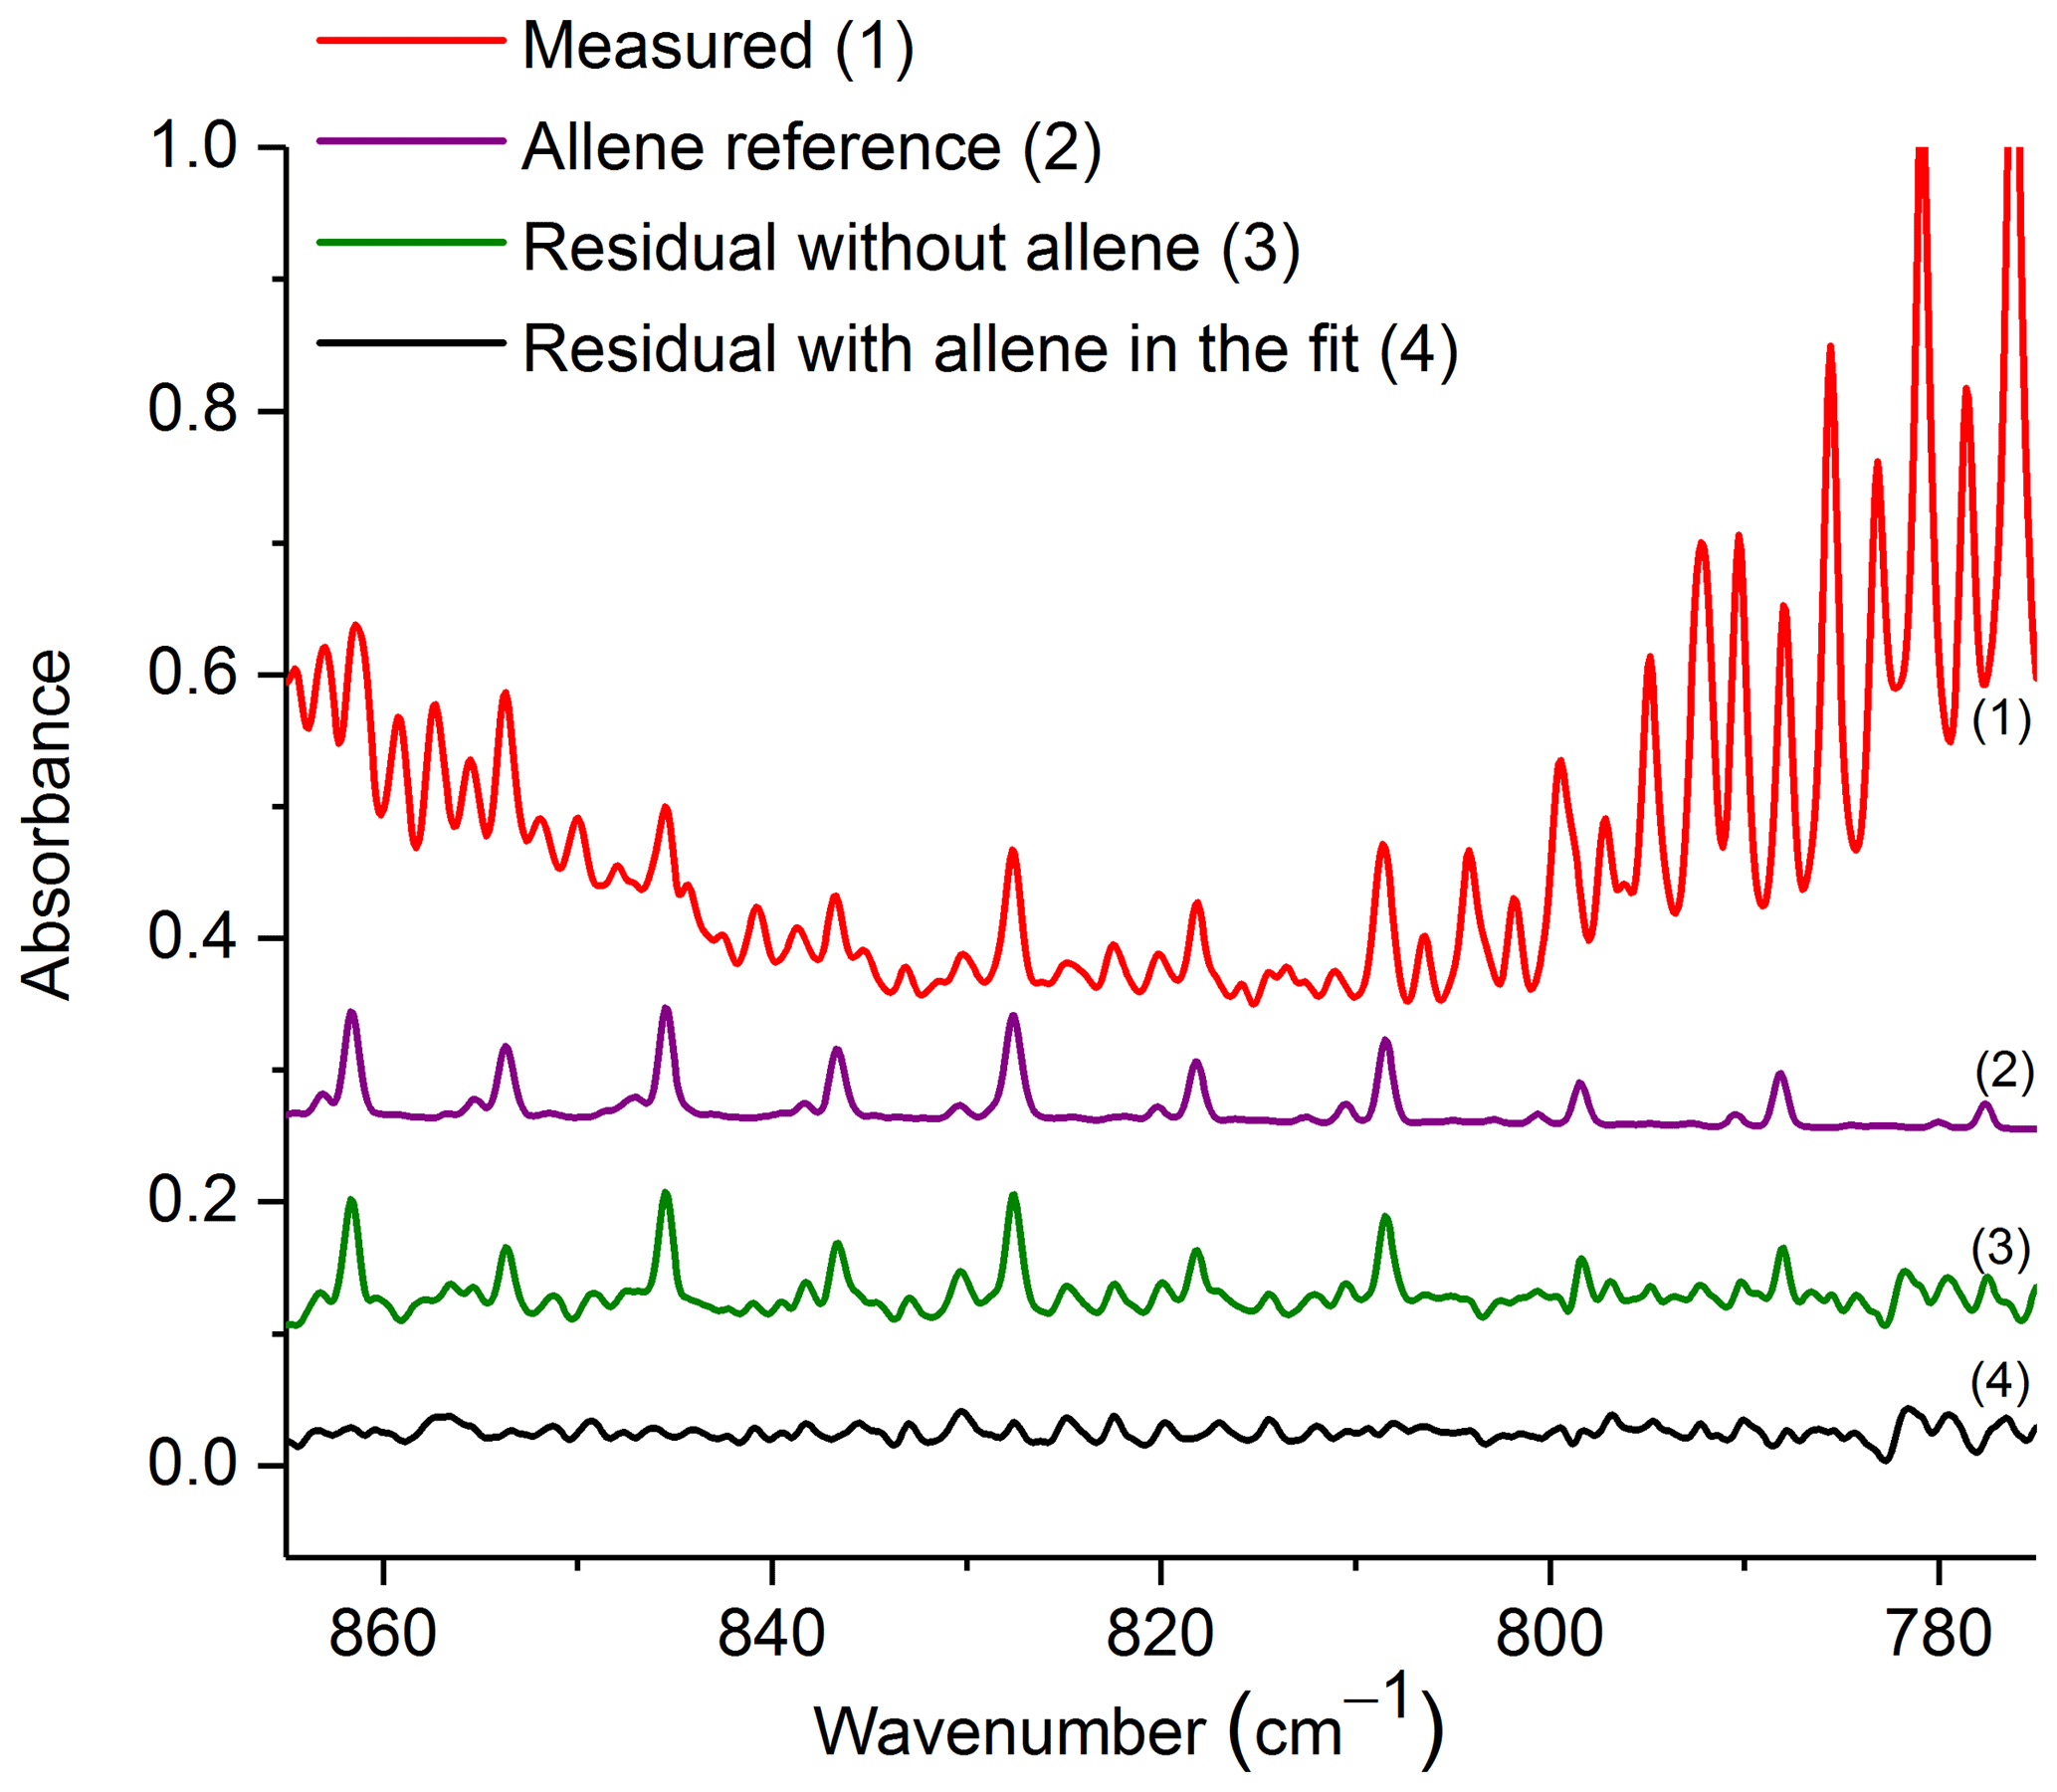
Figure 5Measured absorbance spectrum and residuals with and without allene included in the fit, along with the scaled reference spectrum for allene. For clarity, the spectral contributions for C2H2, CO2, HCN, naphthalene, C2H4, methyl nitrite and H2O are not shown. All spectra are at 0.6 cm−1 resolution and have been offset for clarity. The calculated mixing ratio of allene in this measured spectrum is 37.8 ppm.
Figure 5 shows the measured absorbance spectrum, scaled allene reference spectrum, and the associated residual with and without allene included in the fit. The absorption lines associated with allene are clearly seen in the resulting spectrum when allene is not included in the fit (green trace, no. 3), thus confirming that allene is one of the primary components contributing to the features in this spectral domain. For the experimental spectrum displayed in Fig. 5, the calculated mixing ratio for allene is 37.8 ppm, and the RMS-derived detection limit is 5.4 ppm.
3.4 Acrolein and acetaldehyde
The two aldehydes, acrolein (CH2=CHCHO) and acetaldehyde (CH3CHO), have also been identified for the first time in burning biomass IR spectra. It has been proposed that both acrolein and acetaldehyde are formed from the pyrolysis of cellulose (a major constituent of biomass) via the intermediate glycerol, which is a moiety in the structure of levoglucosan, a known pyrolysis product of cellulose (Stein et al., 1983). Stein et al. (1983) observed that acrolein, acetaldehyde and CO were the initial decomposition products from the pyrolysis of glycerol. Both of these compounds have been detected in previous wildland fire studies via methods such as GC (Akagi et al., 2013) and PTR-ToF (Koss et al., 2018; Brilli et al., 2014), but have not yet been identified via IR methods.
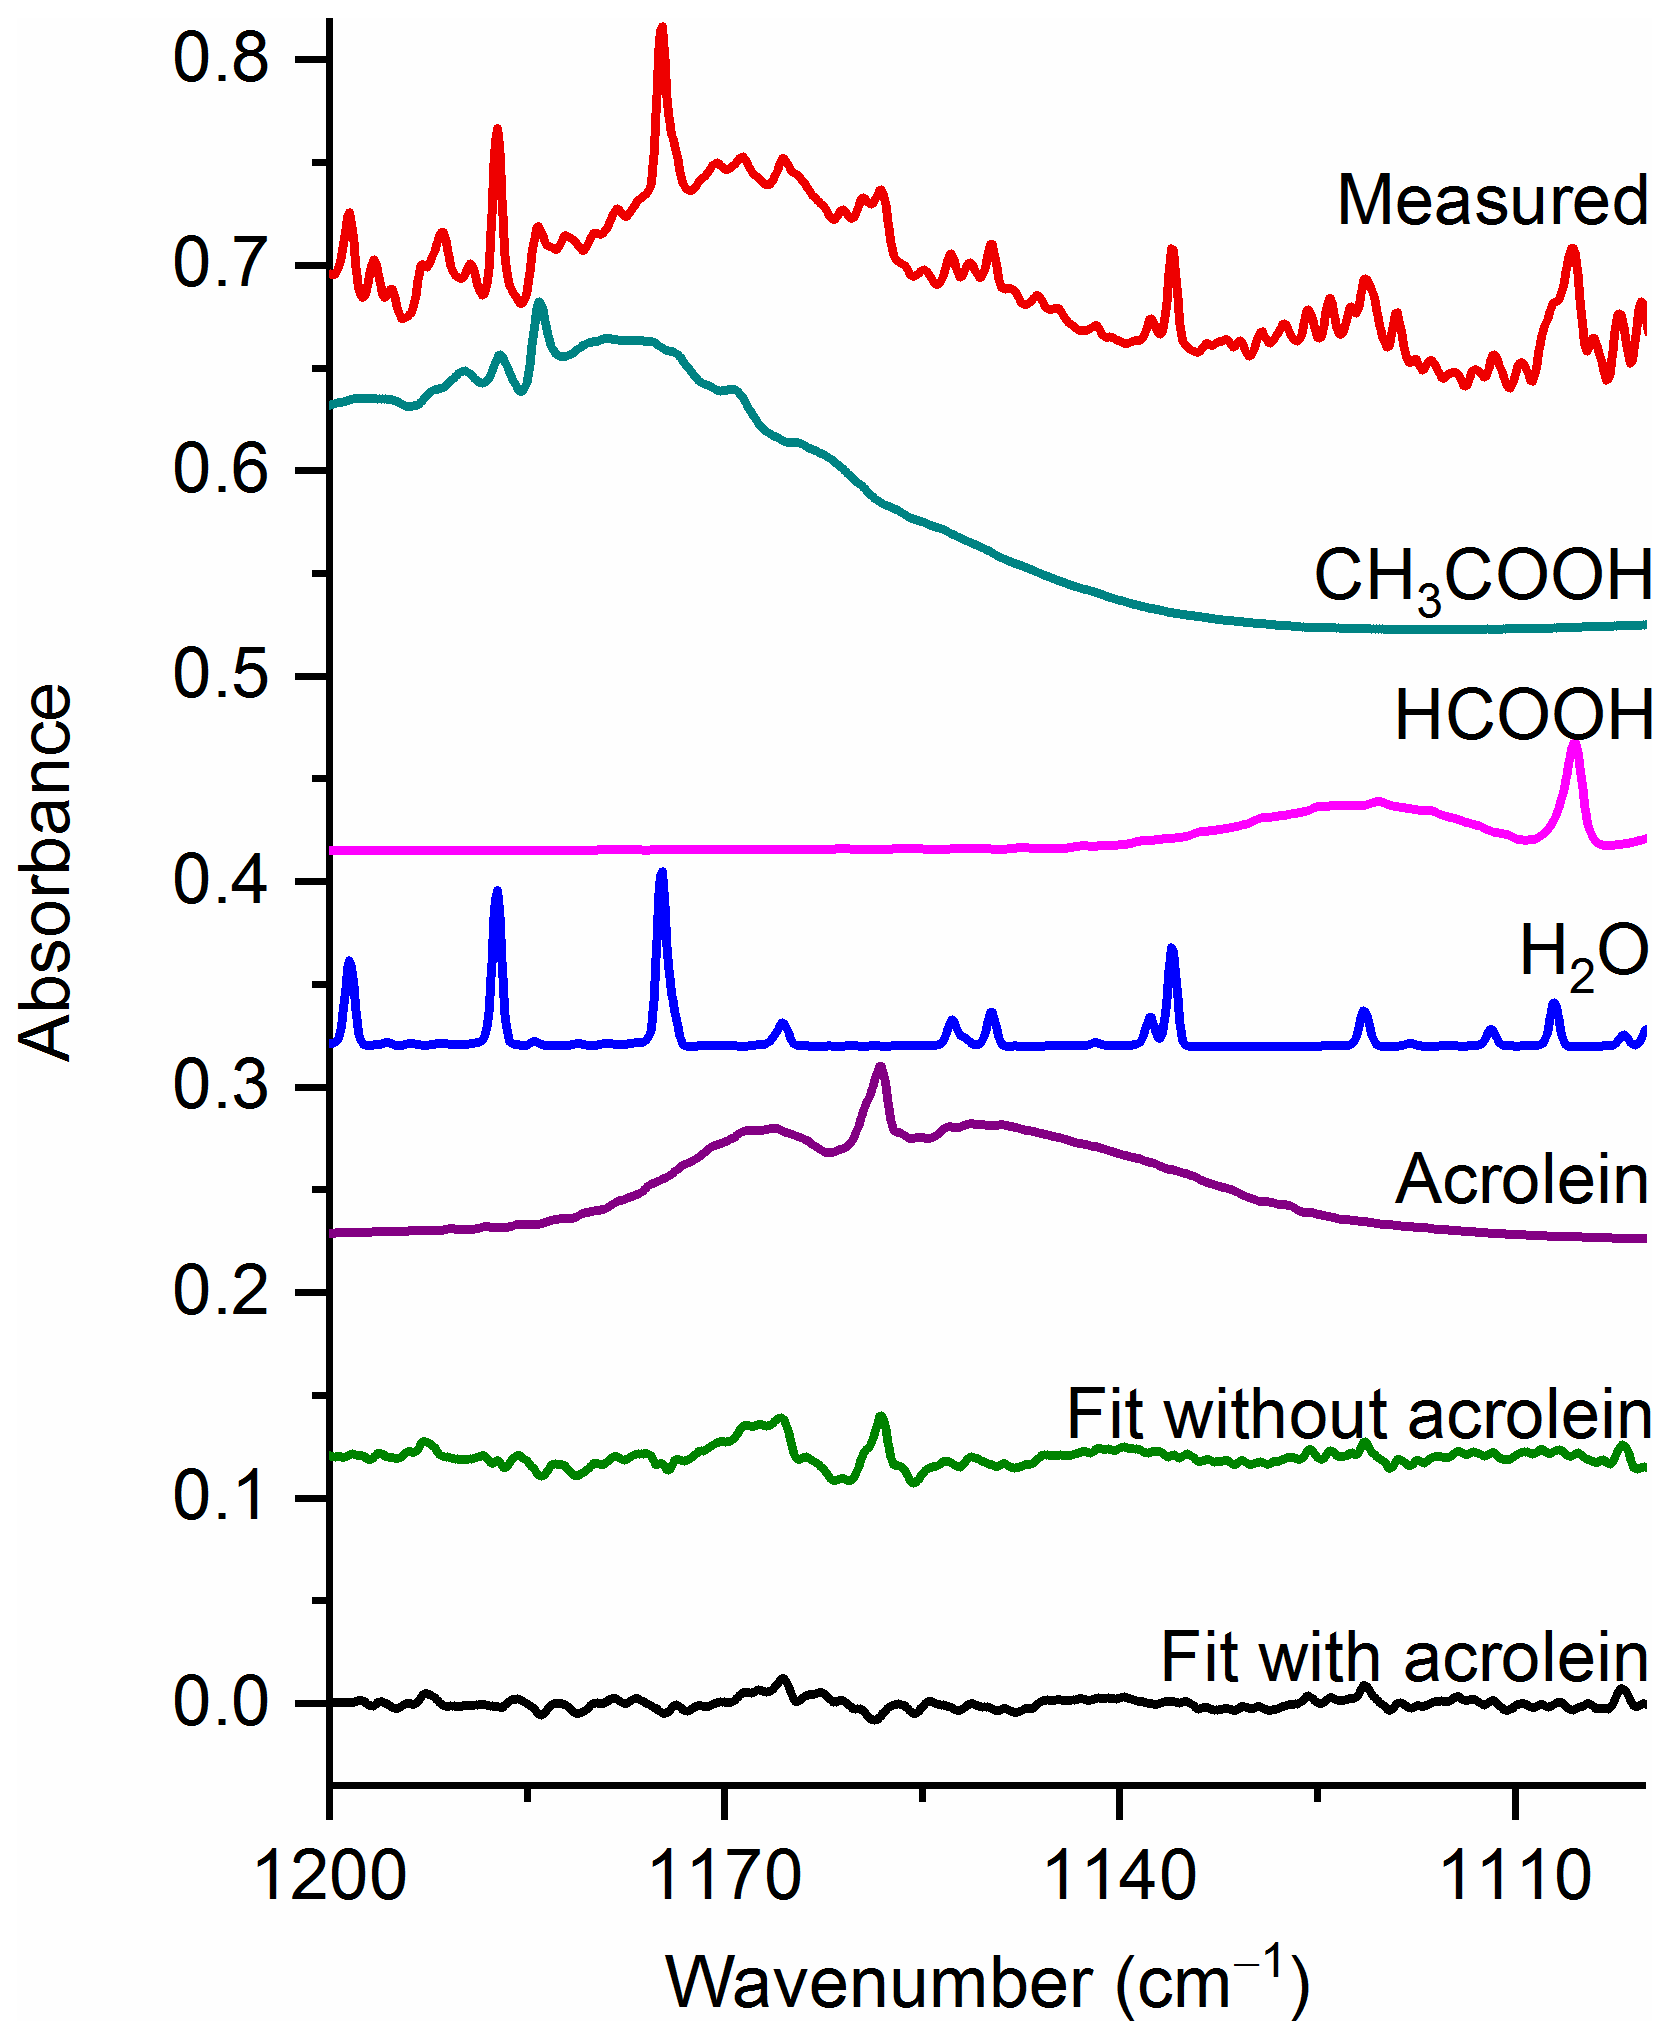
Figure 6Measured spectrum and the individual spectral contributions for the major components and associated residual with and without acrolein included in the fit. For clarity, the spectral contributions for furfural (C4H3OCHO), acetaldehyde, CH4 and C2H4 are not shown. All spectra are at 0.6 cm−1 resolution and have been offset for clarity. The calculated mixing ratio of acrolein in this measured spectrum is 99.9 ppm.
Acrolein, the simplest unsaturated aldehyde, exists in two forms, s-cis and s-trans, with s-trans being the more stable and consequently the more abundant conformer (Wagner et al., 1957). It has been estimated that the fractions of s-cis and s-trans are about 4 % and 96 % at 20 ∘C and 7 % and 93 % at 100 ∘C, respectively (Alves et al., 1971). The largest IR feature for acrolein is the ν5 C=O stretch (Hamada et al., 1985) at 1724.1 cm−1, but this band is heavily overlapped by water lines. There is also the ν16 band (Hamada et al., 1985) at 958.8 cm−1, but this feature overlaps with multiple other strongly absorbing compounds, such as C2H4. We have therefore focused acrolein's analysis using the ν10 band (C–C stretch) (Hamada et al., 1985) at 1157.7 cm−1.
Figure 6 displays a very congested biomass burning spectrum with individual contributions for several species included in the fit (contributions for furfural (C4H3OCHO), acetaldehyde, CH4 and C2H4 are included, but not plotted) as well as the residual with and without acrolein included in the fitting process. When acrolein is not included in the fit, features (both near 1168 and at 1157.7 cm−1) that resemble acrolein are observed in the residual spectrum as seen in the green trace in Fig. 6. When acrolein is included in the fit, the features in question are not observed. For acrolein, no mixing ratios were observed below the RMS-derived detection limits.
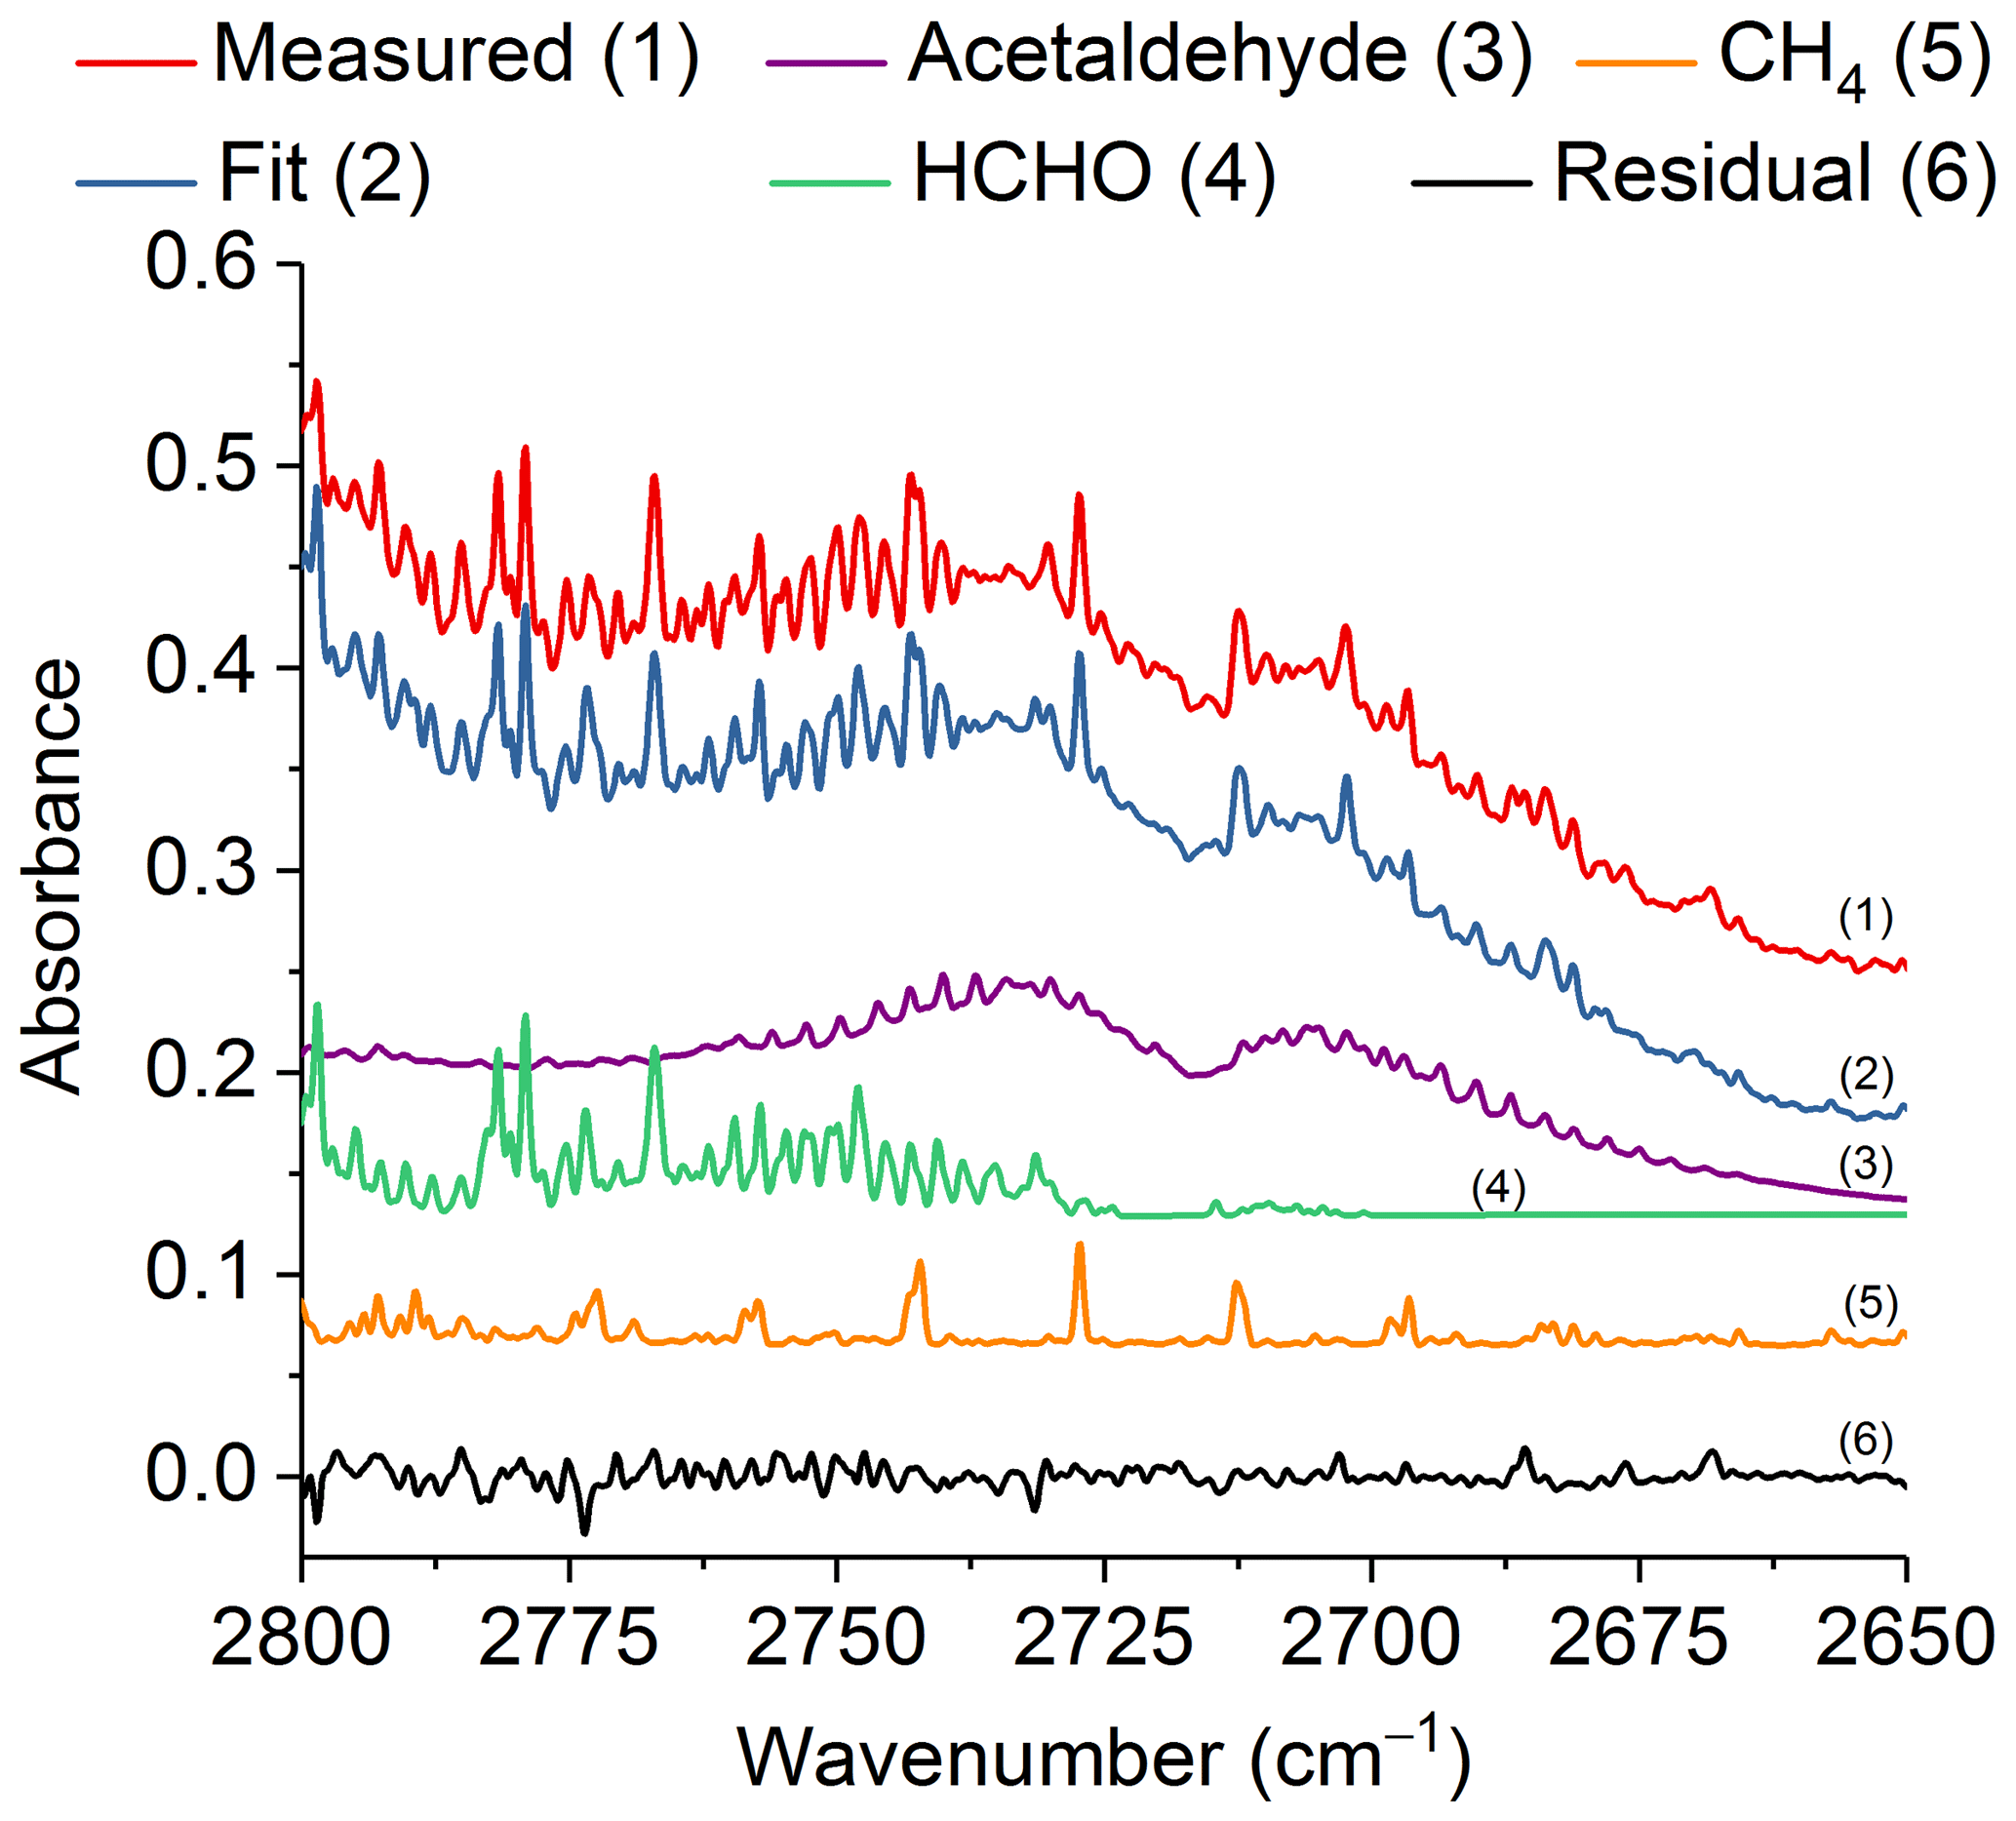
Figure 7Measured and fitted spectra as well as the individual components (for clarity, the spectral contributions for acrolein, C2H2 and H2O are not shown) and associated residual in the spectral region 2800–2650 cm−1. All spectra are at 0.6 cm−1 resolution and have been offset for clarity. The calculated mixing ratio of acetaldehyde in this measured spectrum is 252.8 ppm.
Table 4Emission ratios relative to CO and standard deviations (1σ) for the present study and for four other previously published biomass burning studies.
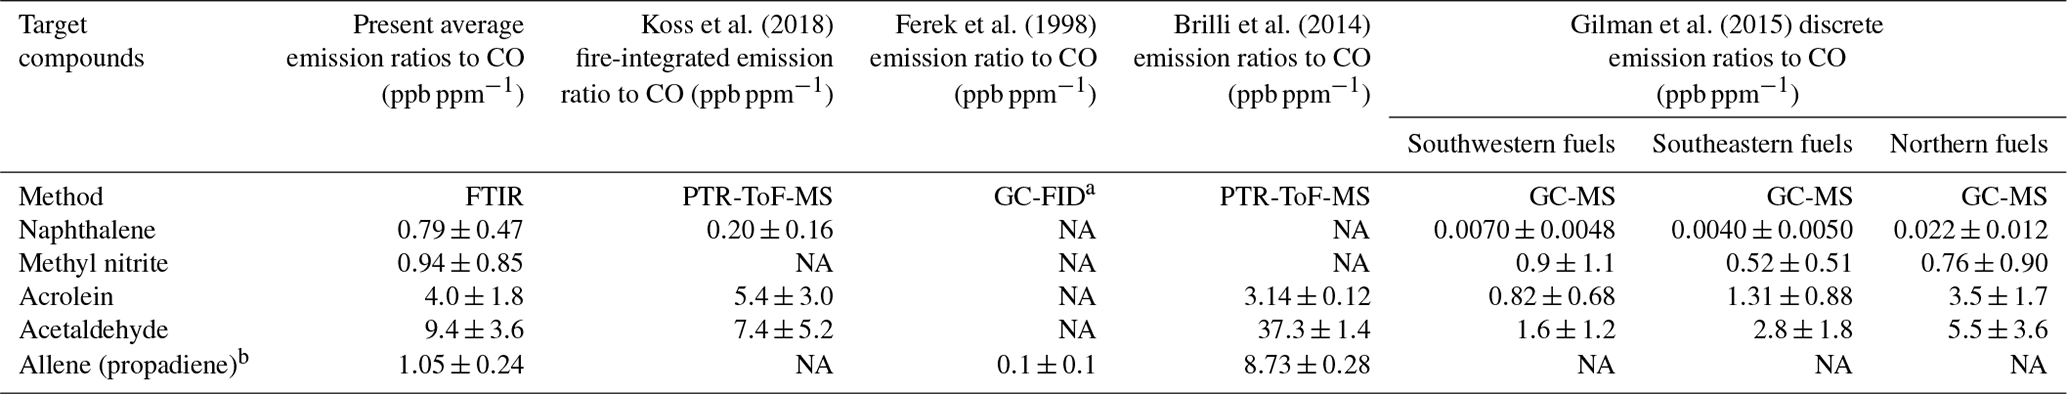
a GC-FID is gas chromatography with flame ionization detector. b Brilli et al. (2014) use both 1-propyne and propadiene to represent C3H4. Gilman et al. (2015) report emission ratios for propyne, but not allene. NA – not available
Similar to acrolein, acetaldehyde has its strongest IR feature due to the C=O stretch (Hollenstein and Günthard, 1971), with ν4 found at 1746.1 cm−1. Again, due to the presence of water lines in the spectrum, this feature is not practical for detection. The aldehyde ν3 C–H stretching band (Hollenstein et al., 1971) at 2716.2 cm−1 was instead used for analysis. Figure 7 shows the measured and fitted spectra as well as spectral contributions from the major individual components used to calculate the fitted spectrum and the corresponding residual. Other minor components, such as acrolein, C2H2 and H2O, were also included in the fit, but their reference spectra are not displayed in Fig. 7. The spectral profile of acetaldehyde with its P and R branches of ν3 is easily discernable even before deconvolution of the measured spectrum. Similar to acrolein, all of the mixing ratios for acetaldehyde were above the RMS-derived detection limit.
3.5 Comparison to other measurements
Preliminary emission ratios (relative to carbon monoxide) for the five new reported compounds are compared to those presented in previous wildland burning investigations. An emission ratio is a standard metric used in fire emission measurements and is defined as the change in the mixing ratio of the target compound relative to the change in mixing ratio of the reference species, generally either carbon monoxide or carbon dioxide (Urbanski et al., 2008). Here, carbon monoxide is used as the reference species since the present study focuses on pyrolysis, and prior fire studies generally provide emission ratios relative to carbon monoxide, which makes it a convenient quantity for comparison. Table 4 displays the average emission ratios and the standard deviations (1σ) for this study as well as emission ratios reported by Koss et al. (2018), Ferek et al. (1998), Brilli et al. (2014) and Gilman et al. (2015). As shown in the table, there is considerable variation among the studies due to multiple factors such as different fuel types, analytical methods, sampling approaches and experimental conditions. For example, the study by Ferek et al. (1998) focused on collection of airborne samples, while Brilli et al. (2014) measured gases under nocturnal conditions using a ground-based system. Inspection of the table shows that the present emission ratio values are not unprecedented and in most cases are within range of previous measurements. Because they have the same molar mass, the mass spectrometric techniques in some cases cannot distinguish allene from propyne. There are of course advantages and disadvantages for the various measurement techniques typically used in biomass burning investigations. For a detailed summary of instrumental methods (including species measured, time resolution and detection limits), the reader is referred to Table 1 found in Koss et al. (2018). The FTIR technique presented in that table is open path (OP-FTIR), which has a lower (better) detection limit (typically on the order of tens of parts per billion) compared to the extractive method used in the present study (low parts per million; see Table 3). It should be acknowledged that the target compounds and spectral analysis methods of this study are also fully applicable to both infrared laser systems and OP-FTIR systems.
Gas-phase compounds with appreciable band intensities and appreciable concentrations can be both identified and quantified using IR spectroscopy. We have used such spectral information for seminal IR detection of five compounds generated during prescribed forest fire burns. Deriving the mixing ratios from the congested spectra obtained from wildland smoke samples is more challenging due to the multiple overlapping spectral features: sophisticated software and analysis are required in carefully selected spectral windows. We have reported the first IR detections of five molecules that had previously not been observed by FTIR in ambient measurements of wildland emissions. Most of the compounds (excluding acetaldehyde) had their primary features become apparent only after the larger spectral features had been fitted and subtracted.
Data are not publicly available because data release has not been authorized by the sponsor of this research.
Author David W. T. Griffith is a member of the editorial board of the journal.
We gratefully acknowledge support from the Department of Defense's Strategic
Environmental Research and Development Program (SERDP), project RC-2640, and
gratefully thank our sponsor for their support. PNNL is operated for the U.S.
Department of Energy by the Battelle Memorial Institute under contract
DE-AC06-76RLO 1830. We thank Valerie Young of Ohio University for loan of the
canisters.
We kindly thank John
Maitland and colleagues at Fort Jackson for conducting the burns and hosting
the scientific mission and Olivia Williams for assistance with the MALT5
calculations. Lastly, we are most grateful to Michael L. Myrick and his
colleagues at the University of South Carolina for allowing us to use their
laboratories and for their helpful assistance during the
campaign.
Edited by: Frank Hase
Reviewed by: two anonymous referees
Akagi, S. K., Yokelson, R. J., Wiedinmyer, C., Alvarado, M. J., Reid, J. S., Karl, T., Crounse, J. D., and Wennberg, P. O.: Emission factors for open and domestic biomass burning for use in atmospheric models, Atmos. Chem. Phys., 11, 4039–4072, https://doi.org/10.5194/acp-11-4039-2011, 2011.
Akagi, S. K., Yokelson, R. J., Burling, I. R., Meinardi, S., Simpson, I., Blake, D. R., McMeeking, G. R., Sullivan, A., Lee, T., Kreidenweis, S., Urbanski, S., Reardon, J., Griffith, D. W. T., Johnson, T. J., and Weise, D. R.: Measurements of reactive trace gases and variable O3 formation rates in some South Carolina biomass burning plumes, Atmos. Chem. Phys., 13, 1141–1165, https://doi.org/10.5194/acp-13-1141-2013, 2013.
Akagi, S. K., Burling, I. R., Mendoza, A., Johnson, T. J., Cameron, M., Griffith, D. W. T., Paton-Walsh, C., Weise, D. R., Reardon, J., and Yokelson, R. J.: Field measurements of trace gases emitted by prescribed fires in southeastern US pine forests using an open-path FTIR system, Atmos. Chem. Phys., 14, 199–215, https://doi.org/10.5194/acp-14-199-2014, 2014.
Alves, A. C. P., Christoffersen, J., and Hollas, J. M.: Near ultra-violet spectra of the s-trans and a second rotamer of acrolein vapour, Mol. Phys., 20, 625–644, 1971.
Alves, C. A., Gonçalves, C., Pio, C. A., Mirante, F., Caseiro, A., Tarelho, L., Freitas, M. C., and Viegas, D. X.: Smoke emissions from biomass burning in a Mediterranean shrubland, Atmos. Environ., 44, 3024–3033, 2010.
Amini, E., Safdari, M.-S., DeYoung, J. T., Weise, D. R., and Fletcher, T. H.: Characterization of pyrolysis products from slow pyrolysis of live and dead vegetation native to the southern United States, Fuel, 235, 1475–1491, https://doi.org/10.1016/j.fuel.2018.08.112, 2019.
Andreae, M. O.: Biomass burning: Its history, use, and distribution and its impact on environmental quality and global climate, in: Global Biomass Burning: Atmospheric, Climatic, and Biospheric Implications, edited by: Levine, J. S., MIT Press, Cambridge, Mass, 3–21, 1991.
Andreae, M. O. and Merlet, P.: Emission of trace gases and aerosols from biomass burning, Global Biogeochem. Cy., 15, 955–966, 2001.
Aurell, J., Gullett, B. K., Tabor, D., and Yonker, N.: Emissions from prescribed burning of timber slash piles in Oregon, Atmos. Environ., 150, 395–406, 2017.
Bassilakis, R., Carangelo, R. M., and Wojtowicz, M. A.: TG-FTIR analysis of biomass pyrolysis, Fuel, 80, 1765–1786, 2001.
Bodenbinder, M., Ulic, S. E., and Willner, H.: A gas-phase and matrix isolation study of the equilibrium CH3ONO (cis) ⇄ CH3ONO (trans) by FTIR spectroscopy, J. Phys. Chem., 98, 6441–6444, 1994.
Boschan, R., Merrow, R. T., and van Dolah, R. W.: The chemistry of nitrate esters, Chem. Rev., 55, 485–510, 1955.
Brilli, F., Gioli, B., Ciccioli, P., Zona, D., Loreto, F., Janssens, I. A., and Ceulemans, R.: Proton transfer reaction time-of-flight mass spectrometric (PTR-TOF-MS) determination of volatile organic compounds (VOCs) emitted from a biomass fire developed under stable nocturnal conditions, Atmos. Environ., 97, 54–67, 2014.
Burling, I. R., Yokelson, R. J., Griffith, D. W. T., Johnson, T. J., Veres, P., Roberts, J. M., Warneke, C., Urbanski, S. P., Reardon, J., Weise, D. R., Hao, W. M., and de Gouw, J.: Laboratory measurements of trace gas emissions from biomass burning of fuel types from the southeastern and southwestern United States, Atmos. Chem. Phys., 10, 11115–11130, https://doi.org/10.5194/acp-10-11115-2010, 2010.
Burling, I. R., Yokelson, R. J., Akagi, S. K., Urbanski, S. P., Wold, C. E., Griffith, D. W. T., Johnson, T. J., Reardon, J., and Weise, D. R.: Airborne and ground-based measurements of the trace gases and particles emitted by prescribed fires in the United States, Atmos. Chem. Phys., 11, 12197–12216, https://doi.org/10.5194/acp-11-12197-2011, 2011.
Byram, G. M.: Combustion of forest fuels, in: Forest fire: control and use, edited by: Davis, K. P., McGraw-Hill, New York, 61–89, 1959.
Chakraborty, S., Banik, S., and Das, P. K.: Anharmonicity in the vibrational spectra of naphthalene and naphthalene-d8: Experiment and theory, J. Phys. Chem. A, 120, 9707–9718, 2016.
Christian, T. J., Kleiss, B., Yokelson, R. J., Holzinger, R., Crutzen, P. J., Hao, W. M., Saharjo, B. H., and Ward, D. E.: Comprehensive laboratory measurements of biomass-burning emissions: 1. Emissions from Indonesian, African, and other fuels, J. Geophys. Res.-Atmos., 108, 4719, https://doi.org/10.1029/2003JD003704, 2003.
Christian, T. J., Kleiss, B., Yokelson, R. J., Holzinger, R., Crutzen, P. J., Hao, W. M., Shirai, T., and Blake, D. R.: Comprehensive laboratory measurements of biomass-burning emissions: 2. First intercomparison of open-path FTIR, PTR-MS, and GC-MS/FID/ECD, J. Geophys. Res.-Atmos., 109, 2004.
Coggon, M. M., Veres, P. R., Yuan, B., Koss, A., Warneke, C., Gilman, J. B., Lerner, B. M., Peischl, J., Aikin, K. C., Stockwell, C. E., Hatch, L. E., Ryerson, T. B., Roberts, J. M., Yokelson, R. J., and de Gouw, J. A.: Emissions of nitrogen-containing organic compounds from the burning of herbaceous and arboraceous biomass: Fuel composition dependence and the variability of commonly used nitrile tracers, Geophys. Res. Lett., 43, 9903–9912, 2016.
Crutzen, P. J. and Andreae, M. O.: Biomass burning in the tropics: Impact on atmospheric chemistry and biogeochemical cycles, Science, 250, 1669–1678, 1990.
Crutzen, P. J., Heidt, L. E., Krasnec, J. P., Pollock, W. H., and Seiler, W.: Biomass burning as a source of atmospheric gases CO, H2, N2O, NO, CH3Cl and COS, Nature, 282, 253–256, https://doi.org/10.1038/282253a0, 1979.
Esler, M. B., Griffith, D. W. T., Wilson, S. R., and Steele, L. P.: Precision trace gas analysis by FT-IR spectroscopy. 1. Simultaneous analysis of CO2, CH4, N2O, and CO in air, Anal. Chem., 72, 206–215, 2000.
Es-Sebbar, E., Jolly, A., Benilan, Y., and Farooq, A.: Quantitative mid-infrared spectra of allene and propyne from room to high temperatures, J. Mol. Spectrosc., 305, 10–16, 2014.
Fairburn, J. A., Behie, L. A., and Svrcek, W. Y.: Ultrapyrolysis of n-hexadecane in a novel micro-reactor, Fuel, 69, 1537–1545, 1990.
Fang, M. X., Shen, D. K., Li, Y. X., Yu, C. J., Luo, Z. Y., and Cen, K. F.: Kinetic study on pyrolysis and combustion of wood under different oxygen concentrations by using TG-FTIR analysis, J. Anal. Appl. Pyrol., 77, 22–27, 2006.
Ferek, R. J., Reid, J. S., Hobbs, P. V., Blake, D. R., and Liousse, C.: Emission factors of hydrocarbons, halocarbons, trace gases and particles from biomass burning in Brazil, J. Geophys. Res.–Atmos., 103, 32107–32118, 1998.
Fernandes, P. M. and Botelho, H. S.: A review of prescribed burning effectiveness in fire hazard reduction, Int. J. Wildland Fire, 12, 117–128, 2003.
Finlayson-Pitts, B. J., Pitts Jr., J. N., and Lloyd, A. C.: Comment on “A study of the stability of methanol-fueled vehicle emissions in Tedlar bags”, Environ. Sci. Technol., 26, 1668–1670, 1992.
Frenklach, M., Taki, S., Durgaprasad, M. B., and Matula, R. A.: Soot formation in shock-tube pyrolysis of acetylene, allene, and 1, 3-butadiene, Combust. Flame, 54, 81–101, 1983.
Frenklach, M., Yuan, T., and Ramachandra, M. K.: Soot formation in binary hydrocarbon mixtures, Energy Fuels, 2, 462–480, 1988.
Ghosh, P. N. and Günthard, H. H.: Cis and trans methyl nitrite: Gas phase ir spectra, band envelope analysis, hot band progressions and assignments, Spectrochim. Acta A-M., 37, 347–363, 1981.
Gilman, J. B., Lerner, B. M., Kuster, W. C., Goldan, P. D., Warneke, C., Veres, P. R., Roberts, J. M., de Gouw, J. A., Burling, I. R., and Yokelson, R. J.: Biomass burning emissions and potential air quality impacts of volatile organic compounds and other trace gases from fuels common in the US, Atmos. Chem. Phys., 15, 13915–13938, https://doi.org/10.5194/acp-15-13915-2015, 2015.
Goode, J. G., Yokelson, R. J., Susott, R. A., and Ward, D. E.: Trace gas emissions from laboratory biomass fires measured by open-path Fourier transform infrared spectroscopy: Fires in grass and surface fuels, J. Geophys. Res.-Atmos., 104, 21237–21245, 1999.
Goode, J. G., Yokelson, R. J., Ward, D. E., Susott, R. A., Babbitt, R. E., Davies, M. A., and Hao, W. M.: Measurements of excess O3, CO2, CO, CH4, C2H4, C2H2, HCN, NO, NH3, HCOOH, CH3COOH, HCHO, and CH3OH in 1997 Alaskan biomass burning plumes by airborne Fourier transform infrared spectroscopy (AFTIR), J. Geophys. Res. Atmos., 105, 22147–22166, 2000.
Gordon, I. E., Rothman, L. S., Hill, C., Kochanov, R. V., Tan, Y., Bernath, P. F., Birk, M., Boudon, V., Campargue, A., Chance, K. V., Drouin, B. J., Flaud, J.-M., Gamache, R. R., Hodges, J. T., Jacquemart, D., Perevalov, V. I., Perrin, A., Shine, K. P., Smith, M.-A. H., Tennyson, J., Toon, G. C., Tran, H., Tyuterev, V. G., Barbe, A., Császár, A. G., Devi, V. M., Furtenbacher, T., Harrison, J. J., Hartmann, J.-M., Jolly, A., Johnson, T. J., Karman, T., Kleiner, I., Kyuberis, A. A., Loos, J., Lyulin, O. M., Massie, S. T., Mikhailenko, S. N., Moazzen-Ahmadi, N., Müller, H. S. P., Naumenko, O. V., Nikitin, A. V., Polyansky, O. L., Rey, M., Rotger, M., Sharpe, S. W., Sung, K., Starikova, D., S.A.Tashkun, S. A., VanderAuwera, J., Wagner, G., Wilzewski, J., Wcisło, P., Yu, S., and Zak, E. J.: The HITRAN2016 molecular spectroscopic database, J. Quant. Spectrosc. Ra., 203, 3–69, 2017.
Griffith, D. W. T.: Synthetic calibration and quantitative analysis of gas-phase FT-IR spectra, Appl. Spectrosc., 50, 59–70, 1996.
Griffith, D. W. T.: MALT5 User guide Version 5.5.9, 2016.
Griffith, D. W. T. and Jamie, I. M.: Fourier Transform Infrared Spectrometry in Atmospheric and Trace Gas Analysis, Encyclopedia of Analytical Chemistry: Applications, Theory and Instrumentation, https://doi.org/10.1002/9780470027318.a0710, 2006.
Griffith, D. W. T., Jones, N. B., McNamara, B., Walsh, C. P., Bell, W., and Bernardo, C.: Intercomparison of NDSC ground-based solar FTIR measurements of atmospheric gases at Lauder, New Zealand, J. Atmos. Ocean. Tech., 20, 1138–1153, 2003.
Griffiths, J. F., Gilligan, M. F., and Gray, P.: Pyrolysis of isopropyl nitrate. I. Decomposition at low temperatures and pressures, Combust. Flame, 24, 11–19, 1975.
Hamada, Y., Nishimura, Y., and Tsuboi, M.: Infrared spectrum of trans-acrolein, Chem. Phys., 100, 365–375, 1985.
Hatch, L. E., Yokelson, R. J., Stockwell, C. E., Veres, P. R., Simpson, I. J., Blake, D. R., Orlando, J. J., and Barsanti, K. C.: Multi-instrument comparison and compilation of non-methane organic gas emissions from biomass burning and implications for smoke-derived secondary organic aerosol precursors, Atmos. Chem. Phys., 17, 1471–1489, https://doi.org/10.5194/acp-17-1471-2017, 2017.
Herget, W. F. and Brasher, J. D.: Remote measurement of gaseous pollutant concentrations using a mobile Fourier transform interferometer system, Appl. Opt., 18, 3404-3420, 1979.
Hollenstein, H. and Günthard, H. H.: Solid state and gas infrared spectra and normal coordinate analysis of 5 isotopic species of acetaldehyde, Spectrochim. Acta A-M., 27, 2027–2060, 1971.
Hosseini, S., Shrivastava, M., Qi, L., Weise, D. R., Cocker, D. R., Miller, J. W., and Jung, H. S.: Effect of low-density polyethylene on smoke emissions from burning of simulated debris piles, J. Air Waste Manage., 64, 690–703, 2014.
Jia, C. and Batterman, S.: A critical review of naphthalene sources and exposures relevant to indoor and outdoor air, Int. J. Env. Res. Pub. He., 7, 2903–2939, 2010.
Johnson, T. J., Wienhold, F. G., Burrows, J. P., and Harris, G. W.: Frequency modulation spectroscopy at 1.3 µm using InGaAsP lasers: a prototype field instrument for atmospheric chemistry research, Appl. Optics, 30, 407–413, 1991.
Johnson, T. J., Masiello, T., and Sharpe, S. W.: The quantitative infrared and NIR spectrum of CH2I2 vapor: vibrational assignments and potential for atmospheric monitoring, Atmos. Chem. Phys., 6, 2581–2591, https://doi.org/10.5194/acp-6-2581-2006, 2006.
Johnson, T. J., Sams, R. L., Burton, S. D., and Blake, T. A.: Absolute integrated intensities of vapor-phase hydrogen peroxide (H2O2) in the mid-infrared at atmospheric pressure, Anal. Bioanal. Chem., 395, 377–386, 2009.
Johnson, T. J., Sams, R. L., Profeta, L. T., Akagi, S. K., Burling, I. R., Yokelson, R. J., and Williams, S. D.: Quantitative IR spectrum and vibrational assignments for glycolaldehyde vapor: glycolaldehyde measurements in biomass burning plumes, J. Phys. Chem. A, 117, 4096–4107, 2013.
Jonsson, A. and Bertilsson, B. M.: Formation of methyl nitrite in engines fueled with gasoline/methanol and methanol/diesel, Environ. Sci. Technol., 16, 106–110, 1982.
Kabbadj, Y., Herman, M., Di Lonardo, G., Fusina, L., and Johns, J. W. C.: The bending energy levels of C2H2, J. Mol. Spectrosc., 150, 535–565, 1991.
Karl, T. G., Christian, T. J., Yokelson, R. J., Artaxo, P., Hao, W. M., and Guenther, A.: The Tropical Forest and Fire Emissions Experiment: method evaluation of volatile organic compound emissions measured by PTR-MS, FTIR, and GC from tropical biomass burning, Atmos. Chem. Phys., 7, 5883–5897, https://doi.org/10.5194/acp-7-5883-2007, 2007.
Koss, A. R., Sekimoto, K., Gilman, J. B., Selimovic, V., Coggon, M. M., Zarzana, K. J., Yuan, B., Lerner, B. M., Brown, S. S., Jimenez, J. L., Krechmer, J., Roberts, J. M., Warneke, C., Yokelson, R. J., and de Gouw, J.: Non-methane organic gas emissions from biomass burning: identification, quantification, and emission factors from PTR-ToF during the FIREX 2016 laboratory experiment, Atmos. Chem. Phys., 18, 3299–3319, https://doi.org/10.5194/acp-18-3299-2018, 2018.
Lifshitz, A., Frenklach, M., and Burcat, A.: Structural isomerization –C=CH, Studies with a single pulse shock tube, J. Phys. Chem., 79, 1148–1152, 1975.
Lifshitz, A., Frenklach, M., and Burcat, A.: Pyrolysis of allene and propyne behind reflected shocks, J. Phys. Chem., 80, 2437–2443, 1976.
Lindenmaier, R., Williams, S. D., Sams, R. L., and Johnson, T. J.: Quantitative infrared absorption spectra and vibrational assignments of crotonaldehyde and methyl vinyl ketone using gas-phase mid-infrared, far-infrared, and liquid raman spectra: s-cis vs s-trans composition confirmed via temperature studies and ab initio methods, J. Phys. Chem. A, 121, 1195–1212, 2017.
Liu, W.-J., Li, W.-W., Jiang, H., and Yu, H.-Q.: Fates of chemical elements in biomass during its pyrolysis, Chem. Rev., 117, 6367–6398, 2017.
Lobert, J. M., Scharffe, D. H., Weimin, H., Kuhlbusch, T. A., Seuwen, R., Warneck, P., and Crutzen, P. J.: Experimental evaluation of biomass burning emissions: Nitrogen and carbon containing compounds, in: Global Biomass Burning: Atmospheric, Climatic, and Biospheric Implications, 1991.
Lord, R. C. and Venkateswarlu, P.: The Rotation-Vibration Spectra of Allene and Allene-d4, J. Chem. Phys., 20, 1237–1247, 1952.
Lu, M. and Mulholland, J. A.: PAH growth from the pyrolysis of CPD, indene and naphthalene mixture, Chemosphere, 55, 605–610, 2004.
Mertz, L.: Auxiliary computation for Fourier spectrometry, Infrared Phys., 7, 17–23, 1967.
Miller, J. D., Safford, H. D., Crimmins, M., and Thode, A. E.: Quantitative evidence for increasing forest fire severity in the Sierra Nevada and southern Cascade Mountains, California and Nevada, USA, Ecosystems, 12, 16–32, 2009.
Phillips, M. C., Taubman, M. S., Bernacki, B. E., Cannon, B. D., Stahl, R. D., Schiffern, J. T., and Myers, T. L.: Real-time trace gas sensing of fluorocarbons using a swept-wavelength external cavity quantum cascade laser, Analyst, 139, 2047–2056, 2014.
Profeta, L. T. M., Sams, R. L., Johnson, T. J., and Williams, S. D.: Quantitative infrared intensity studies of vapor-phase glyoxal, methylglyoxal, and 2, 3-butanedione (diacetyl) with vibrational assignments, J. Phys. Chem. A, 115, 9886–9900, 2011.
Richter, H. and Howard, J. B.: Formation of polycyclic aromatic hydrocarbons and their growth to soot – a review of chemical reaction pathways, Prog. Energ. Combust., 26, 565–608, 2000.
Safdari, M.-S., Rahmati, M., Amini, E., Howarth, J. E., Berryhill, J. P., Dietenberger, M., Weise, D. R., and Fletcher, T. H.: Characterization of pyrolysis products from fast pyrolysis of live and dead vegetation native to the Southern United States, Fuel, 229, 151–166, 2018.
Schmeltz, I. and Hoffmann, D.: Nitrogen-containing compounds in tobacco and tobacco smoke, Chem. Rev., 77, 295–311, 1977.
Selimovic, V., Yokelson, R. J., Warneke, C., Roberts, J. M., de Gouw, J., Reardon, J., and Griffith, D. W. T.: Aerosol optical properties and trace gas emissions by PAX and OP-FTIR for laboratory-simulated western US wildfires during FIREX, Atmos. Chem. Phys., 18, 2929–2948, https://doi.org/10.5194/acp-18-2929-2018, 2018.
Sharpe, S. W., Johnson, T. J., Sams, R. L., Chu, P. M., Rhoderick, G. C., and Johnson, P. A.: Gas-phase databases for quantitative infrared spectroscopy, Appl. Spectrosc., 58, 1452–1461, 2004.
Smith, T. E. L., Wooster, M. J., Tattaris, M., and Griffith, D. W. T.: Absolute accuracy and sensitivity analysis of OP-FTIR retrievals of CO2, CH4 and CO over concentrations representative of “clean air” and “polluted plumes”, Atmos. Meas. Tech., 4, 97–116, https://doi.org/10.5194/amt-4-97-2011, 2011.
Stein, Y. S., Antal Jr., M. J., and Jones Jr., M.: A study of the gas-phase pyrolysis of glycerol, J. Anal. Appl. Pyrol., 4, 283–296, 1983.
Stockwell, C. E., Yokelson, R. J., Kreidenweis, S. M., Robinson, A. L., DeMott, P. J., Sullivan, R. C., Reardon, J., Ryan, K. C., Griffith, D. W. T., and Stevens, L.: Trace gas emissions from combustion of peat, crop residue, domestic biofuels, grasses, and other fuels: configuration and Fourier transform infrared (FTIR) component of the fourth Fire Lab at Missoula Experiment (FLAME-4), Atmos. Chem. Phys., 14, 9727–9754, https://doi.org/10.5194/acp-14-9727-2014, 2014.
Taghizadeh, M. T., Yeganeh, N., and Rezaei, M.: The investigation of thermal decomposition pathway and products of poly (vinyl alcohol) by TG-FTIR, J. Appl. Polym. Sci., 132, https://doi.org/10.1002/app.42117, 2015.
Talbot, R. W., Beecher, K. M., Harriss, R. C., and Cofer, W. R.: Atmospheric geochemistry of formic and acetic acids at a mid-latitude temperate site, J. Geophys. Res. Atmos., 93, 1638–1652, 1988.
Taubman, M. S., Myers, T. L., Cannon, B. D., and Williams, R. M.: Stabilization, injection and control of quantum cascade lasers, and their application to chemical sensing in the infrared, Spectrochim. Acta A, 60, 3457–3468, 2004.
Turetsky, M. R., Kane, E. S., Harden, J. W., Ottmar, R. D., Manies, K. L., Hoy, E., and Kasischke, E. S.: Recent acceleration of biomass burning and carbon losses in Alaskan forests and peatlands, Nat. Geosci., 4, 27–31, https://doi.org/10.1038/NGEO1027, 2011.
Urbanski, S. P., Hao, W. M., and Baker, S.: Chemical composition of wildland fire emissions, Dev. Environm. Sci., 8, 79–107, 2008.
Wagner, N. L., Dubé, W. P., Washenfelder, R. A., Young, C. J., Pollack, I. B., Ryerson, T. B., and Brown, S. S.: Diode laser-based cavity ring-down instrument for NO3, N2O5, NO, NO2 and O3 from aircraft, Atmos. Meas. Tech., 4, 1227–1240, https://doi.org/10.5194/amt-4-1227-2011, 2011.
Wagner, R., Fine, J., Simmons, J. W., and Goldstein, J. H.: Microwave Spectrum, Structure, and Dipole Moment of s-trans Acrolein, J. Chem. Phys., 26, 634–637, 1957.
Ward, D. E. and Hardy, C. C.: Smoke emissions from wildland fires, Environ. Int., 17, 117–134, 1991.
Weise, D. R., Johnson, T. J., and Reardon, J.: Particulate and trace gas emissions from prescribed burns in southeastern US fuel types: Summary of a 5-year project, Fire Safety J., 74, 71–81, 2015.
White, J. U.: Long optical paths of large aperture, Journal of the Optical Society of America, 32, 285–288, 1942.
Williams, P. T. and Williams, E. A.: Fluidised bed pyrolysis of low density polyethylene to produce petrochemical feedstock, J. Anal. Appl. Pyrol., 51, 107–126, 1999.
Yokelson, R. J., Griffith, D. W. T., and Ward, D. E.: Open-path Fourier transform infrared studies of large-scale laboratory biomass fires, J. Geophys. Res.-Atmos., 101, 21067–21080, 1996.
Yokelson, R. J., Susott, R., Ward, D. E., Reardon, J., and Griffith, D. W. T.: Emissions from smoldering combustion of biomass measured by open-path Fourier transform infrared spectroscopy, J. Geophys. Res.-Atmos., 102, 18865–18877, 1997.
Yokelson, R. J., Crounse, J. D., DeCarlo, P. F., Karl, T., Urbanski, S., Atlas, E., Campos, T., Shinozuka, Y., Kapustin, V., Clarke, A. D., Weinheimer, A., Knapp, D. J., Montzka, D. D., Holloway, J., Weibring, P., Flocke, F., Zheng, W., Toohey, D., Wennberg, P. O., Wiedinmyer, C., Mauldin, L., Fried, A., Richter, D., Walega, J., Jimenez, J. L., Adachi, K., Buseck, P. R., Hall, S. R., and Shetter, R.: Emissions from biomass burning in the Yucatan, Atmos. Chem. Phys., 9, 5785–5812, https://doi.org/10.5194/acp-9-5785-2009, 2009.
Yokelson, R. J., Burling, I. R., Gilman, J. B., Warneke, C., Stockwell, C. E., de Gouw, J., Akagi, S. K., Urbanski, S. P., Veres, P., Roberts, J. M., Kuster, W. C., Reardon, J., Griffith, D. W. T., Johnson, T. J., Hosseini, S., Miller, J. W., Cocker III, D. R., Jung, H., and Weise, D. R.: Coupling field and laboratory measurements to estimate the emission factors of identified and unidentified trace gases for prescribed fires, Atmos. Chem. Phys., 13, 89–116, https://doi.org/10.5194/acp-13-89-2013, 2013.