the Creative Commons Attribution 4.0 License.
the Creative Commons Attribution 4.0 License.
Intercomparison between the aerosol optical properties retrieved by different inversion methods from SKYNET sky radiometer observations over Qionghai and Yucheng in China
Zhe Jiang
Minzheng Duan
Wenxing Zhang
Teruyuki Nakajima
Makiko Hashimoto
Bin Chen
Akihiro Yamazaki
This study analyzed the aerosol optical properties derived by SKYRAD.pack versions 5.0 and 4.2 (referred to as V5.0 and V4.2) using the radiometer measurements over Qionghai and Yucheng in China, two new sites of the sky radiometer network (SKYNET). As V5.0 uses an a priori size distribution function (SDF) of a bimodal log-normal function, the volume size distribution retrieved by V5.0 presented bimodal patterns with a 0.1–0.2 µm fine particle mode and a 3.0–6.0 µm coarse particle mode both over Qionghai and Yucheng. The differences in the volume size distributions between the two versions were very large for the coarse mode with a radius of over 5 µm. The single scattering albedos (SSAs) by V5.0 correlated with SSAs by V4.2 with R=0.88, 0.87, 0.90, 0.88, and 0.92 at wavelengths of 400, 500, 670, 870, and 1020 nm over Qionghai, respectively. The correlation coefficients were around 0.95, 0.95, 0.96, 0.94, and 0.91 at the five channels in Yucheng. An error of ±5 % for the solid view angle (SVA) introduced about ±2 % differences in retrieved SSA values both by V4.2 and V5.0. An error of ±50 % for ground surface albedo (Ag) caused about 1 % averaged differences in retrieved SSA values by the two versions. With the atmospheric pressure (PRS) increased by 1 %, 2 %, 3 %, and 4 %, the averaged changes in SSAs did not exceed 0.8 % both by V4.2 and V5.0. The SSA differences at 500 nm between the two versions decreased, while aerosol optical depths (AODs) increased over both sites. The seasonal variability of the aerosol properties over Qionghai and Yucheng was investigated based on SKYRAD.pack V5.0. The seasonal averaged AOD over Qionghai had higher values in spring, winter, and autumn and lower values in summer. The AOD averages were commonly higher in summer and spring than in winter and autumn in Yucheng. The lowest seasonal averaged SSAs were both observed in winter at the two sites. The fraction of the fine aerosol particles was much smaller in summer than in other seasons over Qionghai; the volume fraction of the coarse-mode particle in Yucheng had much larger values compared to the fine-mode particle in all seasons. The validation results provide valuable references for continued improvement of the retrieval algorithms of SKYNET and other aerosol observational networks.
- Article
(8245 KB) - Full-text XML
-
Supplement
(1287 KB) - BibTeX
- EndNote
Aerosols are well known to have significant impacts on climate change and global hydrologic cycle by absorbing and scattering solar radiation (Hensen et al., 1997; Sun et al., 2017) and participating in cloud processes (Ackerman et al., 2000; Ramanathan et al., 2001; Kaufman et al., 2005; Li et al., 2011; Bi et al., 2014; Zhao et al., 2018a). Aerosols also adversely influence human health and visibility (Samet et al., 2000; Pope et al., 2002; Yang et al., 2015; Wang et al., 2017). Aerosol-related environmental problems have drawn a great deal of attention (Cai et al., 2016).
Using a Sun–sky radiometer to measure both direct solar beam and angular sky radiance is the most common method for a reliable and continuous estimation of detailed aerosol properties over megacities around the world. Several aerosol ground-based observational networks have been established to understand the aerosol optical properties, validate the inversion products of satellite remote sensing, and indirectly evaluate their effect on climate (Uchiyama et al., 2005; Takamura and Nakajima, 2004; Nakajima et al., 2007). The sky radiometer network (SKYNET), the focus of this study, is a ground-based research network of using sky radiometers (PREDE Co., Ltd., Tokyo, Japan) with observation sites principally located in Asia and Europe (Che et al., 2014).
The direct solar and angular sky radiance data measured by the sky radiometers are processed to obtain the aerosol optical properties, such as aerosol optical depth (AOD), single scattering albedo (SSA), complex refractive index, and volume size distribution function (SDF) using SKYRAD.pack, which is the official retrieval algorithm of SKYNET (Nakajima et al., 1996) with several different versions. SKYNET currently uses the SKYRAD.pack algorithm version 4.2 (Takamura and Nakajima, 2004). The aerosol retrievals derived from the SKYRAD.pack version 4.2 algorithm have been used to investigate the regional and seasonal characteristics of aerosols for climate and environmental studies and to validate satellite remote sensing results (e.g., Kim et al., 2004; Che et al., 2008, 2018; Campanelli et al., 2010; Estellés et al., 2012a; Wang et al., 2014). Recently, a new SKYRAD.pack version (V5.0) was proposed to improve SSA retrievals (Hashimoto et al., 2012). There are a few applications of SKYRAD V5.0; for example, it has been preliminarily used to retrieve aerosol optical properties over Beijing, China (Che et al., 2014).
This study presents the aerosol optical properties over Qionghai and Yucheng derived from SKYNET sky radiometer measurements by using SKYRAD.pack V5.0 and V4.2 during February 2013 to December 2015. This work is designed to achieve the following objectives: (1) investigate the difference in the aerosol optical properties derived by SKYRAD.pack V5.0 and V4.2 over the two SKYNET sites; and (2) analyze the seasonal variability of aerosol optical properties over the two sites based on SKYRAD.pack V5.0. The results presented in this study provide valuable references for continued improvement of the retrieval algorithms of SKYNET and other aerosol observational networks.
2.1 Instrumentation
The sky radiometer (model POM-02, PREDE Co. Ltd.) was deployed at Qionghai and Yucheng starting in February 2013 and August 2012, respectively. The PREDE-POM02 model was equipped with an indium gallium arsenide (InGaAs) detector to measure the direct solar irradiance and the sky diffuse radiance at 11 wavelengths, namely 315, 340, 380, 400, 500, 675, 870, 940, 1020, 1627, and 2200 nm. The data from five channels at 400, 500, 675, 870, and 1020 nm were used here to retrieve the aerosol optical properties over Qionghai and Yucheng. The full angle field of view is 1.0∘, while the minimum scattering angle of measurement is approximately 3∘. The sky radiance is measured at 24 predefined scattering angles and at regular time intervals. The sky radiometer operates only during daytime and collects data regardless of the sky conditions. Its dynamic range is 107. The typical measurement interval of the sky radiance is 10 min. The improved Langley (IL) plot method is used in this study to determine the temporal and spectral calibration constants for direct intensity (F0) with accuracy of about 1.5 %–2.5 %, depending on the wavelength (Nakajima et al., 1996; Campanelli et al., 2004). The calibration by IL plot method was made daily so that the variation of F0 due to instrumental drift could be quickly spotted and appropriate corrections could be applied exactly from the period in which the deviation occurred (Campanelli et al., 2004). The calibration method for the sky radiance measurements is different from that used for the direct solar irradiance measurements. The solar disk scan method has been routinely used in the SKYNET measurement for the solid view angle (SVA) of the sky radiometer by scanning a circumsolar domain (CSD) of ±1∘ around the Sun with every 0.1∘ interval (Nakajima et al., 1996; Uchiyama et al., 2018).
2.2 Site description
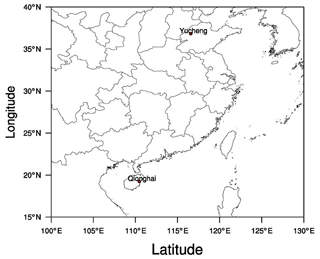
The Qionghai site of SKYNET (19.23∘ N, 110.46∘ E; 24 m a.s.l.), which is located in the eastern part of the island of Hainan, is mainly influenced by East Asian monsoons and typhoons. During summer, the dominant wind is from south to southeast, and the summer monsoon from the South China Sea and western Pacific brings most of the annual rainfall to the island (Zhu et al., 2005), whereas the winter monsoon from Inner Mongolia carries dry winds to the area (Zhu et al., 2005; Peel et al., 2007; Yin et al., 2002). Annual average rainfall in Qionghai is estimated to be about 1653.4 mm. The highest temperature occurs in July with a monthly average of 28.6 ∘C, while the lowest temperature occurs in January with a monthly average of 19.1 ∘C (Yin et al., 2002).
The other measurement site in this study is located in rural Yucheng (36.82∘ N, 116.57∘ E; 22 m a.s.l.), Shandong Province, China, which is almost in the center of the North China Plain. The selected site is in an open field surrounded by farmland. The region belongs to semi-humid and temperate monsoon climate zones, characterized by an annual mean temperature of 21 ∘C and annual precipitation of 610 mm mainly distributed in summer months (Chen et al., 2012). Yucheng and the surrounding areas are famous for their agriculture (e.g., wheat and corn) and grazing land (e.g., donkeys and chickens). In addition, several factories producing inorganic and organic fertilizers are located within a 20 to 30 km radius of the site (Wen et al., 2015), and the application of fertilizers to farmland emits a great deal of NH3 (Zhao et al., 2012). Meanwhile, Yucheng is located downwind of the Beijing–Tianjin–Hebei region; therefore, long-range transport of industrial pollution and biomass burning contributes significantly to the concentrations of pollutants in Yucheng (Lu et al., 2016).
2.3 Inversion method
The aerosol optical properties (i.e., AOD, SSA, complex refractive index, and volume SDF) were derived in this study by using SKYRAD.pack V4.2 and V5.0. Within the SKYRAD.pack code, the inversion schemes were used to derive the single scattering term β(Θ) from the measurements of the normalized sky flux R(Θ) and retrieve the aerosol SDF v(r) (as a function of particle radius, r) from data β(Θ) and AOD τ. The inversion of β(Θ) was performed through a non-linear iterative method. Each step of the loop contained the procedure for retrieving v(r) using a constrained linear or a non-linear iterative method. A particle non-sphericity model is not included in V4.2 nor V5.0.
The retrieved v(r) in each iteration step was used as an input parameter for the radiative transfer model (Nakajima and Tanaka, 1988) to simulate R(Θ), which was compared with the measured R(Θ) to evaluate the root mean square difference ε(R). The maximum number of iterations and the tolerance parameter for the convergence of R were set to 20 % and 0.1 %, respectively.
The retrieval of v(r) from β(Θ) and τ data in SKYRAD.pack V4.2 was conducted using a constrained linear method. The inversion method consisted of a linear matrix formulation, in which the solution stability was controlled by the requirement that it agrees with both the input data and the imposed weighted constraints (Nakajima et al., 1983).
where f is the vector of the β(Θ) and τ data, and x is a state vector containing the values of size distribution vi=v(ri) with ri equidistant on a logarithmic scale (i.e., const). The components of vector ε were the error of each datum, K=K(m(λ)), a matrix of the kernel coefficients calculated for the fixed values of the complex refractive index (m(λ)).
V4.2 used the iterative relaxation method of Nakajima et al. (1983, 1996) to remove the multiple scattering contribution and derived an optimal solution using a statistical regularization method (Turchin and Nozik, 1969) by minimizing the following cost function as proposed by Phillips (1962) and Twomey (1963):
where B is a smoothing matrix used to generate a priori information that forces the solution x to be a smooth function of ln (r); and γ is a Lagrangian multiplier coefficient to minimize the first term of the right-hand side of Eq. (2). The solution of Eq. (1) provided a smooth retrieval of the size distribution v(r) corresponding to the minimum of e2 defined by Eq. (2). In such an approach, the solutions of both v(r) and e2 depended on the assumed value of the complex refractive index m(λ). The complex refractive index m(λ) in each iteration was also evaluated together with v(r), but the retrieved m(λ) can only be chosen from the predefined set of values.
The m(λ) values in SKYRAD.pack V5.0 were directly included in the state vector x. Equation (1) becomes non-linear, and V5.0 solves it using the non-linear maximum likelihood method defined by Rodgers (2000). This method was based on the Bayesian theory:
where p is the probability density function defined as the Gaussian distribution; x and f denote the state and measurement vectors, respectively. Accordingly, x was chosen in the maximum likelihood method, such that the posterior probability p(x|f) becomes the maximum under the condition that a priori information is already given. We obtained the following equation in the tangential space to be solved by a Newtonian method by organizing this non-linear equation, such that max:
where xk is the solution at the kth iteration step; fk=f(xk) is an observation modeled using xk; xa is the a priori value of x; Se is the measurement error covariance matrix; Sa denotes the covariance matrix defined by a priori and state values, ; U is the Jacobian matrix, . The retrieval algorithm used in V5.0 allowed a rigorous retrieval of both the aerosol size distribution and the spectral complex refractive index.
The non-linear inversion has a strong dependence on the estimation of the first-guess solution. V5.0 uses an a priori SDF of a bimodal log-normal function as follows:
where rm1=0.1 µm, rm2=2.0 µm, S1=0.4, S2=0.8, , and , following the reported climate values (Higurashi et al., 2000). For a priori estimates of the refractive index, the real (mr) and imaginary (mi) parts were set to 1.5 and 0.005, respectively.
SKYRAD V5.0 developed a stricter data quality control method of observation data and cloud screening. The standard process of quality control in SKYNET applies a retrieval error between observations and calculated theoretical values by using retrieval values, σobs:
where ( and and ( and ) are measured and retrieved observation vectors for the AOD and relative sky radiance; Ni, Nj, and indicate the number of measured wavelengths, scattering angles, and their total, respectively; . In V4.2, the data are rejected if the value of σobs is larger than 0.2, but the threshold is set to 0.07 in V5.0. There are some other differences between V4.2 and V5.0 on the issue of quality control of observation data (Hashimoto et al., 2012).
The cloud screening method in V4.2 relies heavily on the global flux test and needs global irradiance data, but almost all SKYNET sites do not have solar irradiance observations. Furthermore, cirrus contamination data are difficult to remove as cloud-affected data (Hashimoto et al., 2012).
V5.0 poses a condition regarding the magnitude of the coarse mode of the SDF:
where Cv is a threshold coefficient to be determined for optimum rejection of cirrus contamination; v(r) is vertically integrated aerosol SDF as a function of particle radius, r. Based on data analysis at the Pune and Beijing sites (Hashimoto et al., 2012), Cv is set to 2 in V5.0 to reject most cirrus contamination cases and retain dust cases. It would be useful to re-evaluate the Cv value after more cirrus contamination data and dust event data are collected.
The results retrieved by SKYRAD.pack V4.2 were used to compare with the results retrieved by SKYRAD.pack V5.0. The intercomparisons of the volume size distribution, single scattering albedo, and refractive index between V5.0 and V4.2 were based on 1397 measurements in 355 d over Qionghai and 5830 measurements in 473 d over Yucheng. Considering a relatively low retrieval accuracy of SSA when AOD < 0.2 (Dubovik et al., 2000), only the measurements with AOD ≥0.2 were selected to be effective values in this study. Figure 2 showed the plots of AOD values at each wavelength derived from the solar direct irradiance between the two versions. High correlation was found with a significant coefficient larger than 0.995 at each band in both sites except for 1020 nm over Qionghai. The high consistency between V4.2 and V5.0 indicates that the inversion process in V5.0 did not bring about a large change in the retrieved direct solar radiation (Hashimoto et al., 2012). The slight differences between AODs by V5.0 and V4.2 were mainly caused by the very small differences in calibration constant F0. F0 values in V4.2 and V5.0 are both determined from sky radiance data by the improved Langley method. V5.0 adopts more rigorous data processing and cloud detection methods. The sky radiance measurements involved in F0 calculation in V4.2 are a little different from those in V5.0. In the inversion calculations of both versions, AODs are used as indicative values in the first step of the loop but are updated at each iteration. The AOD data can be given different weights with respect to the normalized diffuse sky flux data, according to their reliability (Nakajima et al., 1996).
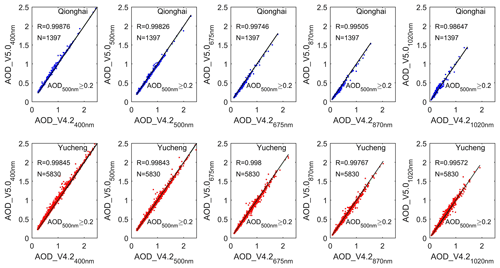
Figure 2Scattergrams of the AOD derived by SKYRAD V4.2 and V5.0 at wavelengths of 400, 500, 670, 870, and 1020 nm over Qionghai and Yucheng during February 2013 to December 2015.
3.1 Intercomparison of aerosol properties derived by SKYRAD V4.2 and V5.0
3.1.1 Intercomparison of the volume size distribution derived by SKYRAD V4.2 and V5.0
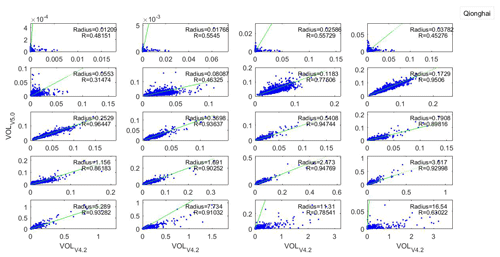
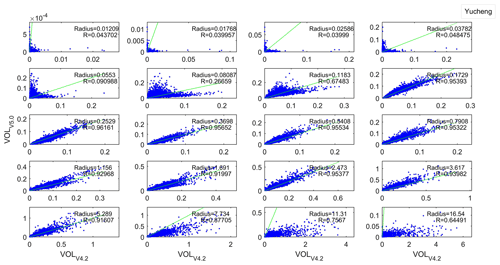
Aerosol size properties were one of the most important pieces of information for both the observation and modeling of radiative forcing (Dusek et al., 2006). The volumes at each bin were averaged monthly during the experiment period for V4.2 and V5.0 over Qionghai and Yucheng (Fig. 3). The SDF by V4.2 usually showed a predominant peak at the coarse mode with a radius over 10 µm. In Qionghai, the SDF by V4.2 showed a slightly tri-model pattern in February. There were tri-model patterns with three peak volumes at radii of 0.026, 0.25, and 16.54 m and 0.25, 1.69, and 11.31 µm in volume SDF by V4.2 in August and September over Yucheng, respectively. As V5.0 uses an a priori SDF of a bimodal log-normal function (Hashimoto et al., 2012), the volume SDF derived by V5.0 generally showed the classic bimodal patterns at both Qionghai and Yucheng. The SDF from V5.0 showed two peaks at radii of 0.17 and 5.29 µm over both sites. Generally, the SDF retrieved by V4.2 was similar to V5.0 at a radius < 5 µm. The large differences in volume SDF at a radius over 5 µm between V4.2 and V5.0 were mainly related to the fact that the smoothness condition in V4.2 given by Eq. (2) allowed the retrieved SDF to be distributed beyond a 10 µm radius, whereas a strong constraint on the SDF for the coarse-mode particles as shown in Eq. (5) was applied in V5.0 (Hashimoto et al., 2012).
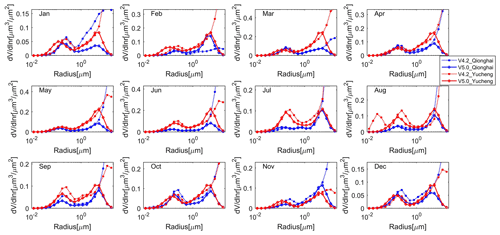
Figure 3Retrieved monthly volume size distribution by SKYRAD V4.2 (dotted lines) and V5.0 (solid lines) for Qionghai (blue lines) and Yucheng (red lines) during February 2013 to December 2015.
As shown in Figs. 4 and 5, the differences in the retrieved size distribution at smaller size (r < 0.05 µm) and larger size (r > 10 µm) were both very large. To avoid unrealistically increasing tails of size distribution due to the very low sensitivity of sky radiometer observations to very small and very large particles, V5.0 introduced the constraint on the volume size distribution described above. As a result, the values of the retrieved size distribution of the smallest size classes (r < 0.05 µm) and the largest size classes (r > 10 µm) by V5.0 were close to zero.
Table 1Averaged volume size distribution in each bin and the differences between the two versions at the Qionghai site during February 2013 to December 2015.
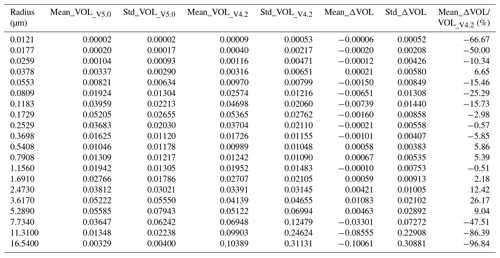
VOL indicates volume spectrum (]); subscripts V5.0 and V4.2 indicate parameters retrieved by SKYRAD V5.0 and V4.2, respectively; ΔVOL was defined as ΔVOL= VOL_V5.0 - VOL_V4.2.
Table 2The same as Table 1 but for Yucheng during February 2013 to December 2015.
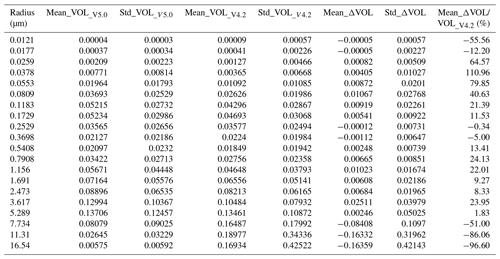
Meanings of all symbols are the same as in Table 1.
As shown in Tables 1 and 2, the percentage difference in the volume size distributions between SKYRAD V5.0 and V4.2 were larger than 50 % at smaller size (r < 0.025 µm at Qionghai, and r < 0.017 µm at Yucheng) and larger size (r > 10 µm at both sites). When the radius is between 0.17 and 5 µm, the size distributions retrieved by V5.0 were in good agreement with those by V4.2.
3.1.2 Intercomparison between single scattering albedo derived by SKYRAD V4.2 and V5.0
As a key variable in assessing the climatic effects of aerosols, the SSA is defined as the ratio of the scattering coefficient and the extinction coefficient. It characterizes the absorption properties of aerosols and serves as an important quantity in evaluating aerosol radiative forcing. The SSA value is mostly dependent on the shape, size distribution, and concentration of aerosol particles.
Table 3Averaged single scattering albedo and refractive index in SKYRAD V5.0 and V4.2, and the absolute and percentage differences between the two versions at the Qionghai site during February 2013 to December 2015.
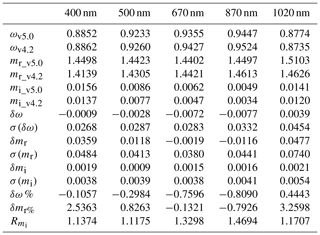
ω, mr, and mi indicate averaged single scattering albedo, the real part of the refractive index, and the imaginary part of the refractive index; subscripts v5.0 and v4.2 indicate parameters retrieved by SKYRAD V5.0 and V4.2, respectively; δ- and δ- % indicate absolute and percentage difference between SKYRAD V5.0 and V4.2, respectively; σ (δ) indicates the standard deviation of absolute differences between SKYRAD V5.0 and V4.2; indicates the ratio of mi_v5.0 to mi_v4.2.
Table 4The same as Table 3 but for Yucheng during February 2013 to December 2015.
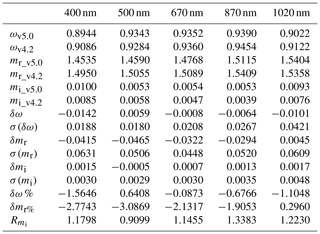
Meanings of all symbols are the same as in Table 3.
Tables 3 and 4 presented average single scattering albedo and refractive index for SKYRAD V5.0 and V4.2 and the differences between the two versions over Qionghai and Yucheng during February 2013 to December 2015, respectively. The differences between SSAs retrieved by SKYRAD V5.0 and V4.2 at 400, 500, 675, 870, and 1020 nm over Qionghai were −0.0009 (−0.1057 %), −0.0028 (−0.2984 %), −0.0072 (−0.7596 %), −0.0077 (−0.809 %), and 0.0039 (0.4443 %), respectively. The standard deviations of absolute differences were 0.0268, 0.0287, 0.0283, 0.0332, and 0.0454, respectively. Over the Yucheng station, the SSAs retrieved from V5.0 were approximately 0.0142 (1.5646 %), 0.0008 (0.0873 %), 0.0064 (0.6766 %), and 0.0101 (1.1048 %), lower than those from V4.2 at 400, 675, 870, and 1020 nm, respectively, but were 0.0059 (0.6408 %) higher than those from V4.2 at 500 nm. The standard deviations of absolute differences at 400, 500, 675, 870, and 1020 nm were 0.0188, 0.018, 0.0208, 0.0267, and 0.0421, respectively.
Figure 6 presented the comparison results between SSAs retrieved by SKYRAD V4.2 and V5.0 at wavelengths of 400, 500, 670, 870, and 1020 nm over Qionghai and Yucheng during February 2013 to December 2015. As shown in Fig. 6, SSAs by V5.0 correlated with those by V4.2 with R=0.88, 0.87, 0.90, 0.88, and 0.92 at wavelengths of 400, 500, 670, 870, and 1020 nm, respectively, over Qionghai. Although the correlation coefficient was highest at 1020 nm in Qionghai, their patterns were more scattered. The SSA values computed from V5.0 had correlation coefficients of 0.95, 0.95, 0.96, 0.94, and 0.91 with those from V4.2 at wavelengths of 400, 500, 670, 870, and 1020 nm over Yucheng. Based on the comparison results over the two sites, in most cases, V5.0 retrieved lower SSA values than V4.2. V5.0 tends to underestimate the SSA due to underestimation of the coarse aerosols larger than 10 µm when the a priori SDF for constraint tends to be close to zero. Hashimoto et al. (2012) found that the lack of a coarse part in the SDF causes overestimation of sky radiance at all observation angles. It is likely that V5.0 decreases the SSA value to dim the sky radiance in the calculation when a tight constraint on the SDF for particles with radius over 10 µm is applied.
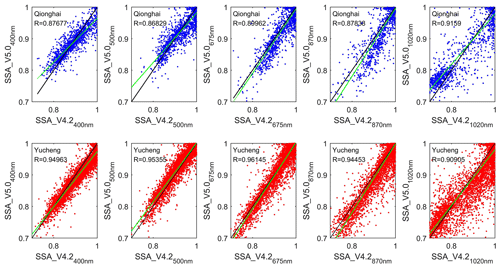
Figure 6Scattergrams of the single scattering albedo retrieved by SKYRAD V4.2 and V5.0 at wavelengths of 400, 500, 670, 870, and 1020 nm over Qionghai and Yucheng during February 2013 to December 2015. Only data with AOD500 nm > 0.2 are shown. The green line indicates the fitted linear regression curve.
3.1.3 Intercomparison of the refractive index derived by SKYRAD V4.2 and V5.0
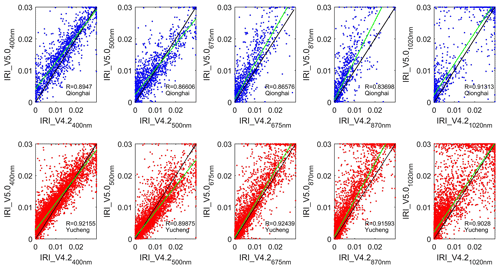
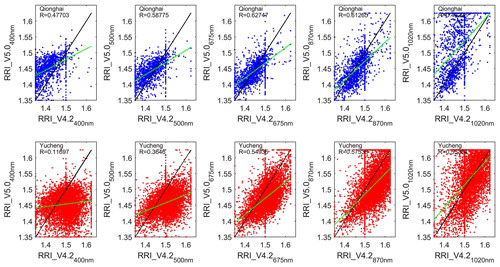
The averaged mi values retrieved from V5.0 at all wavelengths were systemically higher than those from V4.2 over Qionghai (Table 3). The mean values of mi retrieved from V4.2 were approximately 0.0019, 0.0009, 0.0015, 0.0016, and 0.0021 lower than those from V5.0 for the five channels of 400, 500, 675, 870, and 1020 nm, respectively, over Qionghai. The standard deviations of absolute differences were 0.0038, 0.0039, 0.0038, 0.0041, and 0.0054, respectively. The averaged mi retrieved by V5.0 was 0.0015, 0.0007, 0.0013, and 0.0017 higher at 400, 675, 870, and 1020 nm wavelengths, respectively, but 0.0005 lower at 500 nm, than those retrieved by V4.2 in Yucheng. The standard deviations of absolute differences at 400, 500, 675, 870, and 1020 nm were 0.003, 0.0029, 0.003, 0.0035, and 0.0048, respectively. As shown in Fig. 7, the mi values by V5.0 were linearly correlated with those by V4.2 with R=0.8947, 0.8661, 0.8658, 0.8370, and 0.9131 at wavelengths of 400, 500, 675, 870, and 1020 nm in Qionghai. The correlation coefficients between mi by V5.0 and those by V4.2 at the five wavelengths were all higher than 0.89 over Yucheng.
The complex refractive index in V4.2 can only be chosen from the predefined set of values. mr values in V5.0 were directly included in the state vector, including constraints on the complex refractive index. As a priori estimation, mr was usually be set to 1.5. As shown in Fig. 8, mr has almost random differences over the two sites; the difference in mr between the two versions was greater than that in mi (as shown in Tables 3 and 4). The mean mr values from V5.0 were approximately 0.0359 (2.5363 %), 0.0118 (0.8263 %), and 0.0477 (3.2598 %) higher at 400, 500, and 1020 nm, respectively, but 0.0019 (0.1321 %), 0.0116 (0.7926 %) lower at 675 and 870 nm than those from V4.2 over the Qionghai station. The results for mr showed that the retrievals by V5.0 were lower than those by V4.2 at wavelengths of 400, 500, 675, and 870 nm, respectively, but were larger than those by V4.2 at 1020 nm over Yucheng. The averaged percentage differences of the mean mr obtained using the two versions were all within 3.26 % both at Yucheng and Qionghai. The correlation coefficients between mr by V5.0 and those by V4.2 at the five wavelengths were all smaller than 0.63 at the two sites.
3.2 Sensitivity tests
3.2.1 Sensitivity tests for the main causes of error in the SSA and AOD retrievals by V5.0 and V4.2
The accurate retrieval of SSA is more difficult than estimation of AOD and size distribution (Loeb and Su, 2010; McComiskey et al., 2008). The errors associated with Ag (ground surface albedo), SVA, and the amount of aerosols in the atmosphere are possible causes of error in the SSA, and these errors may cause either underestimation or overestimation (Hashimoto et al., 2012). The current SKYRAD package underestimates the SVA by 0.5 % to 1.9 % (Uchiyama et al., 2018). The accuracy of calibration constant (F0) determines the inversion accuracy of the amount of aerosols.
Based on the measurements over the two sites in January, April, July, and October 2014, several sensitivity tests were carried out to test the magnitude of the change in SSA. We assumed an error of ±5 % for calibration constant F0, ±5 % for solid view angle SVA, and ±50 % (±0.05) for ground surface albedo (Ag). We compared the differences in retrieved SSA values at a wavelength of 500 nm between cases with and without the assumed errors, and the relative difference is defined as {[SSA (with assumed error)–SSA (no assumed error)]/[SSA (no assumed error)]}.
As shown in Fig. S1 in the Supplement, when we assumed an error of +5 % for calibration constant F0, the averaged differences in SSAs_V4.2 and SSAs_V5.0 were −2.82 % and −3.42 %, while if the F0 was reduced by 5 %, the averaged differences in SSAs_V4.2 and SSAs_V5.0 were +4.46 % and +3.85 % at the Qionghai site. In Yucheng, an error of +5 % in F0 caused −2.76 % and −3.00 % averaged error in SSAs_V4.2 and SSAs_V5.0, respectively; when we introduced a −5 % error in F0, there was about 2.76 % and 3.08 % averaged difference in retrieved SSAs by V4.2 and V5.0.
The SVA is related to the sky radiance, and errors in the SVA will affect the SSA results. Figure S2 shows that an error of ±5 % for SVA introduced about ±2 % differences in retrieved SSA values over both two sites. The averaged differences in SSAs_V4.2 and SSAs_V5.0 in Qionghai were around 0.6 % and 0.36 % when we assumed errors of ±5 % for SVA. The sensitivity tests were based on 60 measurements in Qionghai and 607 measurements in Yucheng. The averaged differences in SSAs_V4.2 and SSAs_V5.0 over Yucheng were about 0.4 % and 0.2 %. The differences in SSAs_V5.0 were lower than those in SSAs_V4.2 both in Qionghai and Yucheng.
Although the value of Ag depends on wavelength and ground conditions, the Ag values used in data processing in V4.2 and V5.0 were both set to 0.1 for each wavelength. As shown in Fig. S3, when Ag was increased by 0.05 compared to the initial value of 0.1, the SSAs_V4.2 and SSAs_V5.0 in Qionghai were about 0.88 % and 1.14 % smaller than the retrieved SSA results without the assumed Ag errors. However, when the Ag was reduced by 0.05, the SSAs_V4.2 and SSAs_V5.0 in Qionghai were about 0.98 % and 1.16 % larger than those from the results without the assumed Ag errors. Over Yucheng site, an error of +5 % in Ag caused -0.97 % and −0.98 % averaged error in SSAs_V4.2 and SSAs_V5.0, respectively; when we introduced −5 % in Ag, there was about +0.93 % and +0.95 % averaged difference in retrieved SSAs by V4.2 and V5.0.
For the AOD at the wavelength of 0.5 µm, there were no differences when we introduced an error in Ag and SVA, but there were noticeable differences when we introduced a ±5 % error in F0 as shown in Fig. S4. The averaged errors in retrieved AODs_V4.2 and AODs_V5.0 caused by +5 % error in F0 were +4.00 % and +4.83 % in Qionghai, and +3.25 % and +4.13 % in Yucheng. The averaged errors in retrieved AODs_V4.2 and AODs_V5.0 due to −5 % errors in F0 were −4.38 % and −4.73 % in Qionghai, and −3.32 % and −4.20 % in Yucheng. The differences in AODs_V5.0 were larger than those in AODs_V4.2 over the two sites.
We also investigated the differences in SSAs due to the assumed errors in atmospheric pressure (PRS). PRS was considered to be 1.00 (atm) in the experimental group, while it was sequentially changed by 1 % in the control groups. As shown in Fig. S5, the averaged changes in SSA retrieved by V5.0 in the four control groups compared with the experimental group were all smaller than those in SSA retrieved by V4.2 over both sites. In Qionghai, with the PRS increased by 1 %, 2 %, 3 %, and 4 %, the averaged changes in SSAs by V5.0 were 0.18 %, 0.21 %, 0.17 %, and 0.26 %; those by V4.2 were 0.66 %, 0.56 %, 0.58 %, and 0.78 %. The averaged changes in SSAs retrieved by V5.0 over Yucheng were 0.17 %, 0.21 %, 0.23 %, and 0.22 %; those by V4.2 were 0.44 %, 0.46 %, 0.47 %, and 0.50 %. The changes in SSAs_V4.2 were larger than those in SSAs_V5.0 over the two sites.
On the basis of the above sensitivity tests, it is concluded that an error in the calibration constant (F0) causes an error in both retrieved SSA and AOD. However, according to a reported comparison of calibration constants from SKYNET with those from the Aerosol Robotic Network (AERONET), the improved Langley method adopted by SKYNET seems to yield accurate calibration constants (Campanelli et al., 2004; Hashimoto et al., 2012). An error of ±5 % for SVA introduced about ±2 % differences in retrieved SSA values both by V4.2 and V5.0, and the differences in SSAs_V5.0 were lower than those in SSAs_V4.2 over both sites. The sensitivity test results indicate that overestimation or underestimation in the Ag could result in underestimation or overestimation of the SSA, respectively. An error of ±50 % for ground surface albedo Ag caused about 1 % averaged differences in retrieved SSA values both by V4.2 and V5.0. For the AOD at the wavelength of 0.5 µm, there were no differences when we introduced an error in Ag and SVA, but there were noticeable differences when we introduced a ±5 % error in F0. The averaged differences in retrieved SSA values due to ±5 % error in F0 varied from 3 % to 5 %. With the PRS increased by 1 %, 2 %, 3 %, and 4 %, the averaged changes in SSAs did not exceed 0.8 %, and the changes in SSAs_V4.2 were larger than those in SSAs_V5.0 over the two sites.
3.2.2 Sensitivity tests for the parameters linked to the SSA differences between the V5.0 and V4.2
The most different physical process between V4.2 and V5 is a derivation of particle size distribution. When a large amount of coarse particles of the dust-like aerosol type with radius greater than 10 µm existed, the numerical tests performed by Hashimoto et al. (2012) showed that V4.2 could retrieve the SDF relatively better, including the coarse mode, in comparison with V5.0. This is because the smoothness condition given by Eq. (2) allowed the retrieved SDF to be distributed beyond 10 µm radius; on the other hand, V5.0 underestimated the coarse mode of the SDF because of the strong SDF constraint condition given by Eq. (5) with a small model radius rm2=2.0 µm for the coarse-mode SDF (Hashimoto et al., 2012). So we have compared the differences between retrieved SSAs at 500 nm by V5.0 and V4.2 when setting rm2=1.5, 1.8, 2.0 (default), 2.5, and 3.0 in SKYRAD.pack V5.0 based on the measurements in 2014. As shown in Fig. 9, SSAs by V5.0 correlated with SSAs by V4.2 with R=0.860, 0.837, 0.855, 0.809, and 0.826 when rm2=2.0 (default), 1.5, 1.8, 2.5, and 3.0 in V5.0 over Qionghai, respectively. The SSA values computed from V5.0 had correlation coefficients around 0.940, 0.928, 0.928, 0.921, and 0.924 with those from V4.2 when rm2=2.0 (default), 1.5, 1.8, 2.5, and 3.0 in V5.0 in Yucheng. The correlation coefficient between SSA by V5.0 and V4.2 was the highest when setting rm2 to 2.0 (the default value) in V5.0 at the two sites.
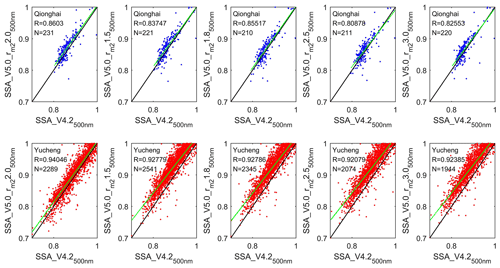
Figure 9Scattergrams of retrieved SSA by SKYRAD V4.2 and V5.0 when rm2=2.0 (default), 1.5, 1.8, 2.5, and 3.0 for Qionghai (a) and Yucheng (b) in 2014. rm2 represents the model radius for the coarse-mode SDF.
We also investigated whether the total amount of aerosols in the atmosphere was linked to the differences in SSA between the two versions. As shown in Fig. 10, the SSA differences at 500 nm between the two versions (defined as SSA_V5.0500 nm – SSA_V4.2500 nm) decreased while the corresponding AODs at wavelengths of 500 nm by V5.0 increased at the two sites. When the AOD was high (in this study, the threshold was set to 0.5 for AOD500 nm), SSA retrieved by V5.0 had a good comparison with that by V4.2. It is well known that the inversion products have a high uncertainty in cases of very low aerosol burdens; the retrieval error in SSA rapidly increases with decreasing AOD, especially in parameters such as the imaginary part of the refractive index (Dubovik et al., 2000).
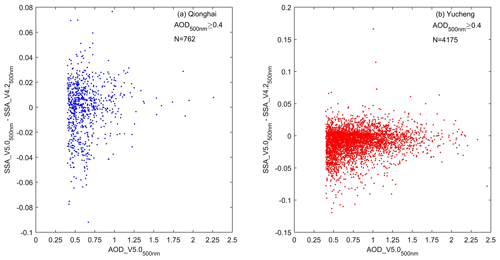
Figure 10Scattergrams of the difference between SSAs at 500 nm retrieved by V5.0 and V4.2 (defined as SSA_V5.0–SSA_V4.2) and the corresponding AODs at 500 nm by V5.0 during February 2013 to December 2015.
Base on the intercomparison results in Sect. 3.1 and the sensitivity tests in Sect. 3.2, we could not reach the conclusion that V5.0 is definitely better than V4.2. We do not yet have other measurements in the two sites to help us prove that V5.0 is better than V4.2. The most different physical process between the two versions is the derivation of particle size distribution. On the one hand, V5.0 tends to be robust in detecting cloud contamination, due to inversion constraint by a priori SDF which filters out coarse particles to simulate cloud-scattered radiation. Some tests by Hashimoto et al. (2012) showed that the SDF setting in V5.0 was useful for detecting ill-conditioned data caused by cirrus contaminations, horizontally and/or temporally inhomogeneous aerosol stratification, and so on (Hashimoto et al., 2012). On the other, because a priori SDF for constraint tends to be zero for radii larger than 10 µm, V5.0 will underestimate the coarse-mode aerosols when a large amount of coarse particles of the dust-like aerosol type with a radius greater than 10 µm exits.
Considering that V5.0 adopts more rigorous data processing and cloud detection methods, and that the SSA and mi had high correlation coefficients between V4.2 and V5.0 with default the coarse-mode radius rm2 value in V5.0 based on the above comparison results, we chose the retrieved results by V5.0 to analyze the seasonal variability of the aerosol optical properties over Qionghai and Yucheng in the following section.
3.3 Seasonal variability of the aerosol optical properties over Qionghai and Yucheng based on SKYRAD.pack V5.0
The analysis of the 500 nm channel was chosen because it was widely quoted in Sun photometric and remote sensing applications and generally representative of visible band wavelengths (Estellés et al., 2012b). Four seasons were considered in this paper, i.e., spring (March–May), summer (June–August), autumn (September–November), and winter (December–February), to investigate the seasonal variations of the aerosol optical properties over Qionghai and Yucheng based on SKYRAD.pack V5.0.
3.3.1 AOD
The AOD is representative of the aerosol loading in the atmospheric column and important for the identification of the aerosol source regions and the aerosol evolution.
The AOD showed a distinct seasonal variation over both Qionghai and Yucheng. Figure 11a showed that the seasonal averaged AOD over Qionghai had higher values in spring, winter, and autumn and lower values in summer. During summer, the dominant wind is from south to southeast (Zhu et al., 2005) and the main emission source was from the South China Sea and western Pacific. In addition, seasonal upwelling off the east coast of the island of Hainan was strongest in summer (Li et al., 2018), which was conducive to pollutant diffusion. Meanwhile, rich precipitation in summer was effective for eliminating aerosols. Because of the reasons above, seasonal averaged value of AOD in summer was the lowest in Qionghai. In contrast, AOD in spring was higher than other seasons. Southerly and northeasterly winds both prevail in spring over Qionghai (Liu et al., 2018), so long-distance transport and emissions from surrounding areas were probably both the main pollutant sources.
The maximum AOD average of 0.99 occurred in summer over Yucheng. Several factories which produced inorganic and organic fertilizers were located around this site. The stronger sunlight in summer accelerated the photochemical reaction and enhanced the formation of fine particulate nitrate (Wen et al., 2015). Also, the humidity in summer over Yucheng was higher than in other seasons (Meng et al., 2007). The high humidity combined with large fractions of hygroscopic chemical components (e.g., sulfate, nitrate, ammonium, and some organic matters) can enhance light extinction (Tao et al., 2017). AOD was higher in spring than in autumn and winter, which is likely related to the long-range transportation of dust from northern/northwestern China and pollutants emitted from enterprises in Hebei (Tan et al., 2012; Tao et al., 2017).
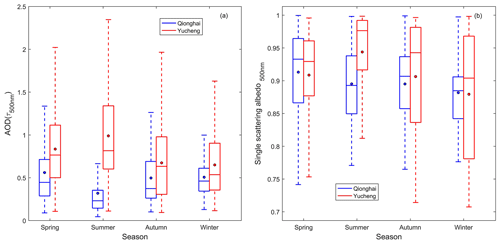
Figure 11Seasonal variations in the AOD (a) and the SSA (b) based on SKYRAD V5.0 over Qionghai and Yucheng for the period from February 2013 to December 2015. The boxes represent the 25th to 75th percentiles of the distributions, while the dots and solid lines within each box represent the means and medians, respectively.
3.3.2 SSA
Figure 11b shows the seasonal averaged SSA at 500 nm for Qionghai and Yucheng during February 2013 to December 2015. In Qionghai, the seasonal averaged SSA values were approximately 0.91, 0.90, 0.90, and 0.89 in spring, summer, autumn, and winter, respectively. The lowest seasonal average SSA was observed in winter, which was probably attributable to the regional transport of the air masses originating from eastern China, where a great amount of coal was used for industrial enterprises and emitted a large amount of organic carbon (OC) and elemental carbon (EC) (Liu et al., 2018). In Yucheng, the seasonal pattern of SSA was consistent with AOD; the lowest seasonal average SSAs were also observed in winter due to carbonaceous aerosols increased by heating activities and biomass burning in cold seasons (Tao et al., 2017). High concentrations of fine particulate nitrate were frequently observed in summer in Yucheng (Wen et al., 2015), likely causing the high SSA in summer.
3.3.3 Volume size distribution
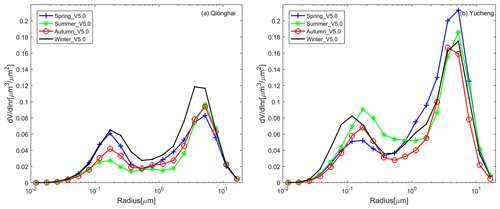
Figure 12a and b show the seasonal averaged volumes of the different aerosol particle size distributions (dv∕dln r) in Qionghai and Yucheng. The aerosol volume size distributions were typical bimodal patterns during each season at the Qionghai and Yucheng sites. Figure 12a and b show that there was a larger contribution of coarse-mode particles to the aerosol volume compared with the fine-mode particles at the two sites. The fine mode showed a peak at a radius of 0.17 µm in all seasons over Qionghai. The coarse mode was characterized by a peak at a radius of 5.29 µm in spring, summer, and autumn and 3.62 µm in winter. As shown in Fig. 12a, the fraction of the fine aerosol particles was much smaller in summer than in other seasons. The summer meteorological conditions, such as high wind speeds, high mixing heights, and fresh air masses originating from or passing through the sea, may contribute to the decrease of anthropogenic pollutant concentrations (Liu et al., 2018) and introduce some sea salt particles of a relatively large size. The seasonal averaged peaks of fine-mode and coarse-mode SDFs were both higher in winter than in other seasons, as shown in Fig. 12a. The stable atmospheric circulation provides a stable atmospheric environment background, which is not conducive to the diffusion of pollutants; moreover, continuous low-level northeast wind facilitates the transport of pollutants from the inland to Hainan in winter (Wu et al., 2011; Liu et al., 2018).
As shown in Fig. 12b, the coarse-mode particles in Yucheng had a relatively large value compared to the volume distribution of the fine-mode particles. The aerosol was not only from winter heating but also from regional transport in winter (Tao et al., 2017; Zhao et al., 2018b). The volume fraction of the coarse aerosol particles relative to the whole was much larger in spring than in other seasons in Yucheng probably because of the presence of dust particles transported from the northwest of China and pollutants emitted from enterprises in Hebei (Tao et al., 2017).
3.3.4 Refractive index
The real part of the refractive index (mr) represents scattering. A higher mr indicates a stronger scattering. The imaginary part of the refractive index (mi) represents absorption and is an important quantity in evaluating the aerosol radiative forcing.
Figure 13a showed the seasonal variation of the real part of the refractive index (mr) at 500 nm over Qionghai and Yucheng. The seasonal averages of mr at 500 nm were 1.45, 1.46, 1.45, and 1.43 in spring, summer, autumn, and winter in Qionghai, respectively. The mr showed a maximum of approximately 1.47 in spring and a minimum of approximately 1.45 in summer in Yucheng. Figure 13b presented the seasonal variation of the imaginary part of the refractive index (mi) at 500 nm over Qionghai and Yucheng. The values of mi were both the highest in winter over the two sites. The aerosol absorption coefficient was mainly determined by EC mass concentration and its coating (Tao et al., 2017), and heating activities and biomass burning induced higher carbonaceous aerosols in winter in Yucheng.
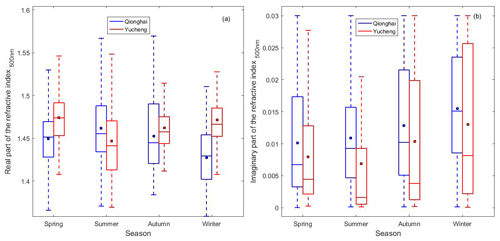
Figure 13Seasonal variations in the real part of the refractive index (a) and the imaginary part of the refractive index (b) based on SKYRAD V5.0 over Qionghai and Yucheng for the period from February 2013 to December 2015. The boxes represent the 25th to 75th percentiles of the distributions, while the dots and solid lines within each box represent the means and medians, respectively.
The aerosol optical properties over the two new SKYNET sites of Qionghai and Yucheng in China were continuously investigated over 2 years using the PREDE-POM02 sky radiometer measurements. As V5.0 used an a priori SDF of a bimodal log-normal function, the volume size distribution retrieved by V5.0 presented an overall bimodal pattern with a 0.10–0.20 µm fine particle mode and a 3.0–6.0 µm coarse particle mode both over Qionghai and Yucheng. The correlation coefficients between SSAs by V5.0 and by V4.2 were around 0.88, 0.87, 0.90, 0.88, and 0.92 at wavelengths of 400, 500, 670, 870, and 1020 nm over Qionghai, respectively. The SSA values computed from V5.0 had relatively high correlation coefficients of 0.95, 0.95, 0.96, 0.94, and 0.91 at wavelengths of 400, 500, 670, 870, and 1020 nm in Yucheng. The correlation coefficients between mi by V5.0 and those by V4.2 at the five wavelengths were all higher than 0.89 over Yucheng.
On the basis of the sensitivity tests, it is concluded that an error in the calibration constant (F0) caused an error in both retrieved SSA and AOD. The averaged differences in retrieved SSA values due to ±5 % error in F0 varied from 3 % to 5 %. An error of ±5 % for SVA introduced about ±2 % differences in retrieved SSA values both by V4.2 and V5.0. Overestimation or underestimation in the Ag resulted in underestimation or overestimation of the SSA. An error of ±50 % for Ag caused about 1 % averaged differences in retrieved SSA values both by V4.2 and V5.0. With the atmospheric pressure PRS increased by 1 %, 2 %, 3 %, and 4 %, the averaged changes in SSAs did not exceed 0.8 %. Sensitivity tests showed that the correlation coefficient between SSAs at 500 nm by V5.0 and V4.2 was higher when setting rm2 to 2.0 µm (the default value) in V5.0 than rm2=1.5, 1.8, 2.5, and 3.0 µm at the two sites. The SSA differences at 500 nm between the two versions decreased with the increase of the corresponding AODs at the two sites.
Based on SKYRAD.pack V5.0, the seasonal variations of the aerosol optical properties over Qionghai and Yucheng were investigated. The seasonal patterns of AOD were quite different between the two stations. The AOD showed high values in spring, autumn, and winter but decreased to minimum in summer over Qionghai, likely related to summer monsoon from the South China Sea and western Pacific that brought most of the annual rainfall to the island, whereas the winter monsoon from Inner Mongolia carried the air masses from mainland China to Qionghai. In Yucheng, the maximum seasonal averaged AOD and SSA both appeared in summer probably due to the hygroscopic effects. The fraction of the fine aerosol particles over Qionghai was much smaller in summer, which is probably related to wet deposition. Specifically, more precipitation in the summer can lead to more efficient removal of aerosol. The volume fraction of the coarse aerosol particles relative to the whole in spring was much larger than in other seasons in Yucheng, probably due to the presence of the dust particles transported from the northwest of China and pollutants emitted from enterprises in Hebei. The location and distribution of major industrial sources, intensity of local minor sources such as winter heating, and prevailing wind directions together caused the different seasonal variations between the two sites discussed above.
The comparison results between the aerosol optical properties retrieved by SKYRAD V5.0 and SKYRAD V4.2 were very different over the two SKYNET sites. The results can provide validation data in China for SKYNET to continue improving data processing and inversion methods. Meanwhile, the results can promote the integration of more Chinese observation stations into the international network.
The sky radiometer data at Qionghai and Yucheng, China, are available on request by contacting the first author of the paper (jiangzhe@mail.iap.ac.cn).
The supplement related to this article is available online at: https://doi.org/10.5194/amt-13-1195-2020-supplement.
ZJ and HC designed the study; MD and WZ performed observation; ZJ analyzed data and wrote the paper, with support from all authors. TN designed the inversion method, and MH improved the inversion method. TN, MH, BC, and AY gave useful comments.
The authors declare that they have no conflict of interest.
This article is part of the special issue “SKYNET – the international network for aerosol, clouds, and solar radiation studies and their applications (AMT/ACP inter-journal SI)”. It is not associated with a conference.
The observation was supported by Qionghai Meteorological Bureau of Hainan Province and Yucheng Shandong Agro-ecosystem National Observation and Research Station (YSA-NORS).
This research has been supported by the National Key Research and Development Program of China (grant no. 2017YFB0503603) and the National Natural Science Foundation of China (grant nos. 41975178, 41825011, 41301381, 41475026, and 41705014).
This paper was edited by Stelios Kazadzis and reviewed by two anonymous referees.
Ackerman, A. S., Toon, O. B., Stevens, D. E., Heymsfield, A. J., Ramanathan, V., and Welton, E. J.: Reduction of tropical cloudiness by soot, Science, 288, 1042–1047, https://doi.org/10.1126/science.288.5468.1042, 2000.
Bi, J. R., Shi, J. S., Xie, Y. K., and Liu Y. Z.: Dust Aerosol Characteristics and Shortwave Radiative Impact at a Gobi Desert of Northwest China during the Spring of 2012, J. Meteor. Soc. Jpn., 92A, 33–56, https://doi.org/10.2151/jmsj.2014-A03, 2014.
Cai, J. X., Guan, Z. Y., and Ma, F. H.: Possible combined influences of absorbing aerosols and anomalous atmospheric circulation on summertime diurnal temperature range variation over the middle and lower reaches of the Yangtze River, J. Meteor. Res., 30, 927–943, https://doi.org/10.1007/s13351-016-6006-1, 2016.
Campanelli, M., Nakajima, T., and Olivieri, B.: Determination of the solar calibration constant for a sun-sky radiometer: Proposal of an in-situ procedure, Appl. Optics, 43, 651–659, https://doi.org/10.1364/AO.43.000651, 2004.
Campanelli, M., Lupi, A., Nakajima, T., Malvestuto, V., Tomasi, C., and Estelles, V.: Summertime columnar content of atmospheric water vapor from ground-based Sun-sky radiometer measurements through a new in situ procedure, J. Geophys. Res., 115, D19304, https://doi.org/10.1029/2009JD013211, 2010.
Che, H., Shi, G., Uchiyama, A., Yamazaki, A., Chen, H., Goloub, P., and Zhang, X.: Intercomparison between aerosol optical properties by a PREDE skyradiometer and CIMEL sunphotometer over Beijing, China, Atmos. Chem. Phys., 8, 3199–3214, https://doi.org/10.5194/acp-8-3199-2008, 2008.
Che, H., Qi, B., Zhao, H., Xia, X., Eck, T. F., Goloub, P., Dubovik, O., Estelles, V., Cuevas-Agulló, E., Blarel, L., Wu, Y., Zhu, J., Du, R., Wang, Y., Wang, H., Gui, K., Yu, J., Zheng, Y., Sun, T., Chen, Q., Shi, G., and Zhang, X.: Aerosol optical properties and direct radiative forcing based on measurements from the China Aerosol Remote Sensing Network (CARSNET) in eastern China, Atmos. Chem. Phys., 18, 405–425, https://doi.org/10.5194/acp-18-405-2018, 2018.
Che, H. Z., Xia, X. A., Zhu, J., Wang, H., Wang, Y. Q., Sun, J.Y., Zhang, X. C., Zhang, X. Y., and Shi, G. Y.: Aerosol optical properties under the condition of heavy haze over anurban site of Beijing, China, Environ. Sci. Pollut. R., 22, 1043–1053, https://doi.org/10.1007/s11356-014-3415-5, 2014.
Chen, Z., Lu, C., and Fan, L.: Farmland changes and the driving forces in Yucheng, North China Plain, J. Geogr. Sci., 22, 563–573, 2012.
Dubovik, O., Smirnov, A., Holben, B., King, M. D., Kaufman, Y. J., Eck, T. F., and Slutsker, I.: Accuracy assessment of aerosol optical properties retrieval from Aerosol Robotic Network (AERONET) Sun and sky radiance measurements, J. Geophys. Res., 105, 9791–9806, 2000.
Dusek, U., Frank, G. P., Hildebrandt, L., Curtius, J., Schneider, J., Walter, S., Chand, D., Drewnick, F., Hings, S., Jung, D., Borrmann, S., and Andreae, M. O.: Size matters more than chemistry for cloud-nucleating ability of aerosol particles, Science, 312, 1375–1378, https://doi.org/10.1126/science.1125261, 2006.
Estellés, V., Campanelli, M., Utrillas, M. P., Expósito, F., and Martínez-Lozano, J. A.: Comparison of AERONET and SKYRAD4.2 inversion products retrieved from a Cimel CE318 sunphotometer, Atmos. Meas. Tech., 5, 569–579, https://doi.org/10.5194/amt-5-569-2012, 2012a.
Estellés, V., Smyth, T. J., and Campanelli, M.: Columnar aerosol properties in a Northeastern Atlantic site (Plymouth,United Kingdom) by means of ground based skyradiometer data during years 2000–2008, Atmos. Environ., 61, 180–188, https://doi.org/10.1016/j.atmosenv.2012.07.024, 2012b.
Hashimoto, M., Nakajima, T., Dubovik, O., Campanelli, M., Che, H., Khatri, P., Takamura, T., and Pandithurai, G.: Development of a new data-processing method for SKYNET sky radiometer observations, Atmos. Meas. Tech., 5, 2723–2737, https://doi.org/10.5194/amt-5-2723-2012, 2012.
Hensen, J., Sato, M., and Ruedy, R.: Radiative forcing and climate response, J. Geophys. Res., 102, 6831–6864, https://doi.org/10.1029/96JD03436, 1997.
Higurashi, A., Nakajima, T., Holben, B., Smirnov, A., Frouin, R., and Chatenet, B.: A study of global aerosol optical climatology with two channel AVHRR remote sensing, J. Climate, 13, 2011–2027, 2000.
Kaufman, Y. J., Koren, I., Remer, L. A., Rosenfeld, D., and Rudich, Y.: The effect of smoke, dust, and pollution aerosol on shallow cloud development over the Atlantic Ocean, P. Natl. Acad. Sci. USA, 102, 11207–11212, https://doi.org/10.1073/pnas.0505191102, 2005.
Kim, D. H., Sohn, B. J., Nakajima, T., Takamura, T., Takemura, T., Choi, B. C., and Yoon, S. C.: Aerosol optical properties over east Asia determined from ground-based sky radiation measurements, J. Geophys. Res., 109, D02209, https://doi.org/10.1029/2003JD003387, 2004.
Li, J., Hu, Y., Huang, J., Stamnes, K., Yi, Y., and Stamnes, S.: A new method for retrieval of the extinction coefficient of water clouds by using the tail of the CALIOP signal, Atmos. Chem. Phys., 11, 2903–2916, https://doi.org/10.5194/acp-11-2903-2011, 2011.
Li, M., Xie, L., Zong, X., Zhang, S., Zhou, L., and Li, J.: The cruise observation of turbulent mixing in the upwelling region east of Hainan Island in the summer of 2012, Acta Oceanol. Sin., 37, 1–12, 2018.
Liu, B., Zhang, J., Wang, L., Liang, D., Cheng, Y., Wu, J., Bi, X., Feng, Y., Zhang, Y., and Yang, H.: Characteristics and sources of the fine carbonaceous aerosols in Haikou, China, Atmos. Res., 199, 103–112, 2018.
Loeb, N. G. and Su, W.: Direct Aerosol radiative forcing uncertainty based on a radiative perturbation analysis, J. Climate, 23, 5288–5293, 2010.
Lu, W., Yang, L., Chen, J., Wang, X., Li, H., Zhu, Y., Wen, L., Xu, C., Zhang, J., Zhu, T., and Wang, W.: Identification of concentrations and sources of PM 2.5-bound PAHs in North China during haze episodes in 2013. Air Quality, Atmosphere & Health, 9, 823–833, 2016.
McComiskey A., Schwartz, S. E., Schmid, B., Guan, H., Lewis, E. R., Ricchiazzi, P., and Ogren, J. A.: Direct Aerosol Forcing: Calculation from Observables and Sensitivities to Inputs, J. Geophys. Res., 113, D09202, https://doi.org/10.1029/2007JD009170, 2008.
Meng, C. L. and Xu, Z. X.: Relation between ENSO and Precipitation in Shandong, Yellow River, 1, 2007 (in Chinese).
Nakajima, T. and Tanaka, M.: Algorithms for radiative intensity calculations in moderately thick atmospheres using a truncation approximation, J. Quant. Spectrosc. Ra., 40, 51–69, https://doi.org/10.1016/0022-4073(88)90031-3, 1988.
Nakajima, T., Tanaka, M., and Yamauchi, T.: Retrieval of the optical properties of aerosols from the aureole and extinction data, Appl. Optics, 22, 2951–2959, https://doi.org/10.1364/AO.22.002951, 1983.
Nakajima, T., Tonna, G., Rao, R., Kaufman, Y., and Holben, B.: Use of sky brightness measurements from ground for remote sensing of particulate polydispersions, Appl. Optics, 35, 2672–2686, https://doi.org/10.1364/AO.35.002672, 1996.
Nakajima, T., Yoon, S. C., Ramanathan, V., Shi, G. Y., Takemura, T., Higurashi, A., Takamura, T., Aoki, K., Sohn, B. J., Kim, S. W., Tsuruta, H., Sugimoto, N., Shimizu, A., Tanimoto, H., Sawa, Y., Lin, N. H., Lee, C. T., Goto, D., and Schutgens, N.: Overview of the Atmospheric Brown Cloud East Asian Regional Experiment 2005 and a study of the aerosol direct radiative forcing in east Asia, J. Geophys. Res., 112, D24S91, https://doi.org/10.1029/2007JD009009, 2007.
Peel, M. C., Finlayson, B. L., and McMahon, T. A.: Updated world map of the Köppen-Geiger climate classification, Hydrol. Earth Syst. Sci., 11, 1633–1644, https://doi.org/10.5194/hess-11-1633-2007, 2007.
Phillips, B. L.: A technique for numerical solution of certain integral equation of first kind, J. Assoc. Comput. Mach., 9, 84–97, 1962.
Pope III, C. A., Burnett, R. T., Thun, M. J., Calle, E. E., Krewski, D., Ito, K., and Thurston, G. D.: Lung cancer, cardiopulmonary mortality, and long-term exposure to fine particulate air pollution, J. Am. Med. Assoc, 287, 1132–1141, https://doi.org/10.1001/jama.287.9.1132, 2002.
Ramanathan, V., Crutzen, P. J., Kiehl, J. T., and Rosenfeld, D.: Aerosols, climate, and the hydrological cycle, Science, 294, 2119–2124, 2001.
Rodgers, C. D.: Inverse Method for Atmospheric Sounding, World Sci., Singapore, 240, 2000.
Samet, J. M., Zeger, S. L., Dominici, F., Coursac, I., Dockery, D. W., Schwartz, J., and Zanobetti, A.: The national morbidity, mortality, and air pollution study. Part II: morbidity and mortality from air pollution in the United States, Health Effects Institute, Cambridge MA, Research Report 94, 2000.
Sun, K., Liu, H. N., Wang, X. Y., Peng, Z., and Xiong, Z.: The aerosol radiative effect on a severe haze episode in the Yangtze River Delta., J. Meteor. Res., 31, 865–873, https://doi.org/10.1007/s13351-017-7007-4, 2017.
Takamura, T. and Nakajima, T.: Overview of SKYNET and its activities, Opt. Pura Apl., 37, 3303–3308, 2004.
Tan, S. C., Shi, G. Y., and Wang, H.: Long-range transport of spring dust storms in Inner Mongolia and impact on the China seas, Atmos. Environ., 46, 299–308, 2012.
Tao, J., Zhang, L., Cao, J., and Zhang, R.: A review of current knowledge concerning PM2.5 chemical composition, aerosol optical properties and their relationships across China, Atmos. Chem. Phys., 17, 9485–9518, https://doi.org/10.5194/acp-17-9485-2017, 2017.
Twomey, S.: On the numerical solution of Fredholm integral equations of the first kind by the inversion of the linear system produced by quadrature, J. Assoc. Comput. Mach., 10, 97–101, 1963.
Turchin, V. F. and Nozik, V. Z.: Statistical regularization of the solution of incorrectly posed problems, Izv. Atmos. Ocean. Phy.+, 5, 14–18, 1969.
Uchiyama, A., Yamazaki, A., Togawa, H., and Asano, J.: Characteristics of Aeolian dust observed by sky-radiometer in the Intensive Observation Period 1 (IOP1), J. Meteor. Soc. Jpn., 83A, 291–305, https://doi.org/10.2151/jmsj.83A.291, 2005.
Uchiyama, A., Matsunaga, T., and Yamazaki, A.: The instrument constant of sky radiometers (POM-02) – Part 2: Solid view angle, Atmos. Meas. Tech., 11, 5389–5402, https://doi.org/10.5194/amt-11-5389-2018, 2018.
Wang, S. X., Zhao, B., Cai, S. Y., Klimont, Z., Nielsen, C. P., Morikawa, T., Woo, J. H., Kim, Y., Fu, X., Xu, J. Y., Hao, J. M., and He, K. B.: Emission trends and mitigation options for air pollutants in East Asia, Atmos. Chem. Phys., 14, 6571–6603, https://doi.org/10.5194/acp-14-6571-2014, 2014.
Wang, Z. W., Yang, S. Q., Zeng, Q. L., and Wang, Y. Q.: Retrieval of aerosol optical depth for Chongqing using the HJ-1 satellite data, J. Meteor. Res., 31, 586–596, https://doi.org/10.1007/s13351-017-6102-x, 2017.
Wang, Z. Z., Liu, D., Wang, Z., Wang, Y. J., and Khatri, P.: Seasonal characteristics of aerosol optical properties at the SKYNET Hefei site (31.90∘ N, 117.17∘ E) from 2007 to 2013, J. Geophys. Res., 119, 6128–6139, https://doi.org/10.1002/2014JD021500, 2014.
Wen, L., Chen, J. M., Yang, L. X., Wang, X. F., Xu, C. H., Sui, X., Yao, L., Zhu, Y. H., Zhang, J. M., Zhu, T., and Wang, W. X.: Enhanced formation of fine particulate nitrate at a rural site on the North China Plain in summer: The important roles of ammonia and ozone, Atmos. Environ., 101, 294–302, 2015.
Wu, D., Wu, C., Li, F., and Chen, H.: Air pollution episode in southern China due to the long range transport of coarse particle aerosol, China Environ. Sci., 31, 540–545, 2011 (in Chinese).
Yang, Y. R., Liu, X. G., Qu, Y., An, J. L., Jiang, R., Zhang, Y. H., Sun, Y. L., Wu, Z. J., Zhang, F., Xu, W. Q., and Ma, Q. X.: Characteristics and formation mechanism of continuous hazes in China: a case study during the autumn of 2014 in the North China Plain, Atmos. Chem. Phys., 15, 8165–8178, https://doi.org/10.5194/acp-15-8165-2015, 2015.
Yin, Y., Zhu, D., Tang, W. W., and Martini, I. P.: The application of GPR to barrier-lagoon sedimentation study in Boao of Hainan Island, J. Geogr. Sci., 12, 313–320, 2002.
Zhao, B., Wang, P., Ma, J. Z., Zhu, S., Pozzer, A., and Li, W.: A high-resolution emission inventory of primary pollutants for the Huabei region, China, Atmos. Chem. Phys., 12, 481–501, https://doi.org/10.5194/acp-12-481-2012, 2012.
Zhao, B., Liou, K.-N., Gu, Y., Jiang, J. H., Li, Q., Fu, R., Huang, L., Liu, X., Shi, X., Su, H., and He, C.: Impact of aerosols on ice crystal size, Atmos. Chem. Phys., 18, 1065–1078, https://doi.org/10.5194/acp-18-1065-2018, 2018a.
Zhao, B., Jiang, J. H., Diner, D. J., Su, H., Gu, Y., Liou, K.-N., Jiang, Z., Huang, L., Takano, Y., Fan, X., and Omar, A. H.: Intra-annual variations of regional aerosol optical depth, vertical distribution, and particle types from multiple satellite and ground-based observational datasets, Atmos. Chem. Phys., 18, 11247–11260, https://doi.org/10.5194/acp-18-11247-2018, 2018b.
Zhu, D., Yin, Y., and Martini, I. P.: Geomorphology of the Boao coastal system and potential effects of human activities – Hainan Island, South China, J. Geogr. Sci., 15, 187–198, 2005.


